Immigrants from Korea 3 or more Vehicles in Household
COMPARE
Immigrants from Korea
Select to Compare
3 or more Vehicles in Household
Immigrants from Korea 3 or more Vehicles in Household
20.5%
3+ VEHICLES AVAILABLE
93.7/ 100
METRIC RATING
123rd/ 347
METRIC RANK
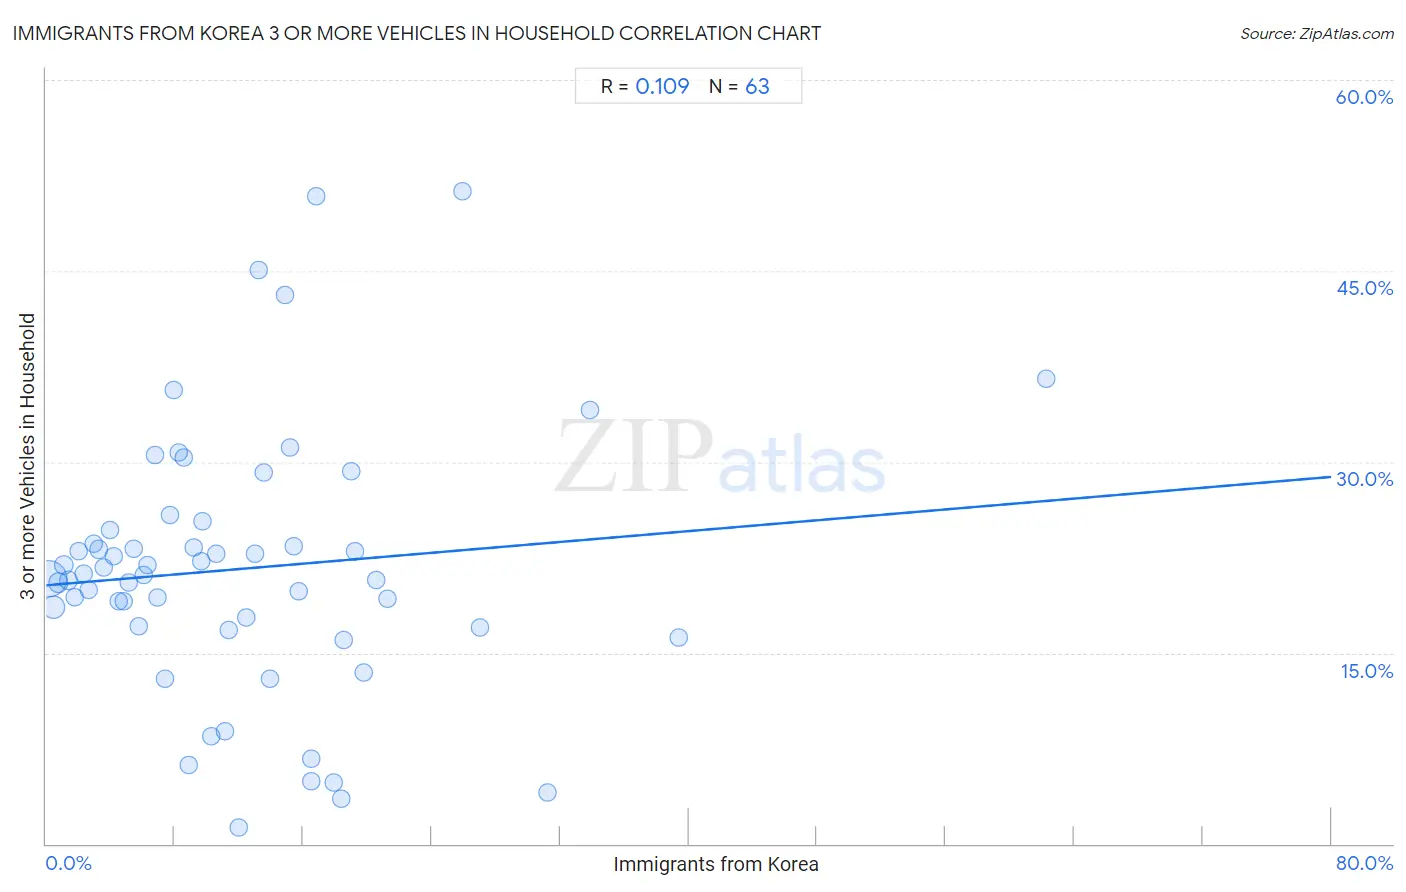
Immigrants from Korea 3 or more Vehicles in Household Correlation Chart
The statistical analysis conducted on geographies consisting of 415,786,030 people shows a poor positive correlation between the proportion of Immigrants from Korea and percentage of households with 3 or more vehicles available in the United States with a correlation coefficient (R) of 0.109 and weighted average of 20.5%. On average, for every 1% (one percent) increase in Immigrants from Korea within a typical geography, there is an increase of 0.11% in percentage of households with 3 or more vehicles available.
It is essential to understand that the correlation between the percentage of Immigrants from Korea and percentage of households with 3 or more vehicles available does not imply a direct cause-and-effect relationship. It remains uncertain whether the presence of Immigrants from Korea influences an upward or downward trend in the level of percentage of households with 3 or more vehicles available within an area, or if Immigrants from Korea simply ended up residing in those areas with higher or lower levels of percentage of households with 3 or more vehicles available due to other factors.
Demographics Similar to Immigrants from Korea by 3 or more Vehicles in Household
In terms of 3 or more vehicles in household, the demographic groups most similar to Immigrants from Korea are German Russian (20.5%, a difference of 0.010%), Immigrants from Thailand (20.5%, a difference of 0.050%), Maltese (20.5%, a difference of 0.060%), Central American (20.5%, a difference of 0.17%), and Immigrants from Netherlands (20.4%, a difference of 0.20%).
| Demographics | Rating | Rank | 3 or more Vehicles in Household |
| Italians | 94.9 /100 | #116 | Exceptional 20.6% |
| Croatians | 94.9 /100 | #117 | Exceptional 20.6% |
| Costa Ricans | 94.6 /100 | #118 | Exceptional 20.6% |
| Immigrants from Latin America | 94.5 /100 | #119 | Exceptional 20.5% |
| Maltese | 93.9 /100 | #120 | Exceptional 20.5% |
| Immigrants from Thailand | 93.8 /100 | #121 | Exceptional 20.5% |
| German Russians | 93.7 /100 | #122 | Exceptional 20.5% |
| Immigrants from Korea | 93.7 /100 | #123 | Exceptional 20.5% |
| Central Americans | 93.1 /100 | #124 | Exceptional 20.5% |
| Immigrants from Netherlands | 92.9 /100 | #125 | Exceptional 20.4% |
| Slavs | 92.1 /100 | #126 | Exceptional 20.4% |
| Immigrants from Bolivia | 92.0 /100 | #127 | Exceptional 20.4% |
| New Zealanders | 91.3 /100 | #128 | Exceptional 20.4% |
| Zimbabweans | 88.7 /100 | #129 | Excellent 20.3% |
| Greeks | 88.6 /100 | #130 | Excellent 20.3% |
Immigrants from Korea 3 or more Vehicles in Household Correlation Summary
| Measurement | Immigrants from Korea Data | 3 or more Vehicles in Household Data |
| Minimum | 0.13% | 1.2% |
| Maximum | 62.3% | 51.2% |
| Range | 62.1% | 50.0% |
| Mean | 12.2% | 21.6% |
| Median | 9.7% | 21.1% |
| Interquartile 25% (IQ1) | 4.8% | 17.0% |
| Interquartile 75% (IQ3) | 16.5% | 24.6% |
| Interquartile Range (IQR) | 11.7% | 7.6% |
| Standard Deviation (Sample) | 10.6% | 10.3% |
| Standard Deviation (Population) | 10.5% | 10.3% |
Correlation Details
| Immigrants from Korea Percentile | Sample Size | 3 or more Vehicles in Household |
[ 0.0% - 0.5% ] 0.13% | 262,184,316 | 20.8% |
[ 0.0% - 0.5% ] 0.45% | 78,241,875 | 18.6% |
[ 0.5% - 1.0% ] 0.76% | 29,253,892 | 20.5% |
[ 1.0% - 1.5% ] 1.07% | 15,801,233 | 21.9% |
[ 1.0% - 1.5% ] 1.37% | 7,648,126 | 20.7% |
[ 1.5% - 2.0% ] 1.78% | 7,698,603 | 19.4% |
[ 1.5% - 2.0% ] 1.99% | 3,158,937 | 23.0% |
[ 2.0% - 2.5% ] 2.32% | 1,940,268 | 21.2% |
[ 2.5% - 3.0% ] 2.66% | 1,743,266 | 20.0% |
[ 2.5% - 3.0% ] 2.96% | 1,390,751 | 23.6% |
[ 3.0% - 3.5% ] 3.28% | 953,539 | 23.1% |
[ 3.5% - 4.0% ] 3.61% | 601,335 | 21.7% |
[ 3.5% - 4.0% ] 3.93% | 452,859 | 24.6% |
[ 4.0% - 4.5% ] 4.20% | 482,003 | 22.6% |
[ 4.5% - 5.0% ] 4.51% | 584,702 | 19.0% |
[ 4.5% - 5.0% ] 4.83% | 482,992 | 19.1% |
[ 5.0% - 5.5% ] 5.12% | 204,258 | 20.6% |
[ 5.0% - 5.5% ] 5.45% | 233,308 | 23.2% |
[ 5.5% - 6.0% ] 5.76% | 263,253 | 17.1% |
[ 6.0% - 6.5% ] 6.05% | 183,558 | 21.1% |
[ 6.0% - 6.5% ] 6.33% | 199,118 | 21.9% |
[ 6.5% - 7.0% ] 6.79% | 164,600 | 30.5% |
[ 6.5% - 7.0% ] 6.96% | 87,910 | 19.3% |
[ 7.0% - 7.5% ] 7.37% | 93,669 | 13.0% |
[ 7.5% - 8.0% ] 7.69% | 228,245 | 25.9% |
[ 7.5% - 8.0% ] 7.91% | 170,007 | 35.6% |
[ 8.0% - 8.5% ] 8.21% | 238,163 | 30.7% |
[ 8.5% - 9.0% ] 8.56% | 189,781 | 30.4% |
[ 8.5% - 9.0% ] 8.85% | 148,339 | 6.2% |
[ 9.0% - 9.5% ] 9.16% | 52,559 | 23.3% |
[ 9.5% - 10.0% ] 9.62% | 31,426 | 22.2% |
[ 9.5% - 10.0% ] 9.69% | 98,267 | 25.3% |
[ 10.0% - 10.5% ] 10.25% | 37,735 | 8.4% |
[ 10.5% - 11.0% ] 10.56% | 142 | 22.8% |
[ 11.0% - 11.5% ] 11.09% | 56,628 | 8.8% |
[ 11.0% - 11.5% ] 11.33% | 4,546 | 16.8% |
[ 11.5% - 12.0% ] 11.98% | 9,273 | 1.2% |
[ 12.0% - 12.5% ] 12.47% | 31,252 | 17.7% |
[ 13.0% - 13.5% ] 13.01% | 10,819 | 22.8% |
[ 13.0% - 13.5% ] 13.21% | 280 | 45.1% |
[ 13.5% - 14.0% ] 13.57% | 36,151 | 29.2% |
[ 13.5% - 14.0% ] 13.94% | 49,393 | 13.0% |
[ 14.5% - 15.0% ] 14.90% | 490 | 43.1% |
[ 15.0% - 15.5% ] 15.20% | 52,799 | 31.1% |
[ 15.0% - 15.5% ] 15.40% | 5,336 | 23.4% |
[ 15.5% - 16.0% ] 15.71% | 18,639 | 19.8% |
[ 16.0% - 16.5% ] 16.49% | 40,285 | 4.9% |
[ 16.5% - 17.0% ] 16.53% | 44,943 | 6.7% |
[ 16.5% - 17.0% ] 16.84% | 689 | 50.8% |
[ 17.5% - 18.0% ] 17.93% | 37,754 | 4.8% |
[ 18.0% - 18.5% ] 18.33% | 38,400 | 3.5% |
[ 18.0% - 18.5% ] 18.50% | 18,564 | 16.0% |
[ 18.5% - 19.0% ] 18.97% | 5,900 | 29.2% |
[ 19.0% - 19.5% ] 19.20% | 22,930 | 23.0% |
[ 19.5% - 20.0% ] 19.75% | 1,139 | 13.5% |
[ 20.5% - 21.0% ] 20.56% | 11,314 | 20.7% |
[ 21.0% - 21.5% ] 21.28% | 141 | 19.2% |
[ 25.5% - 26.0% ] 25.89% | 224 | 51.2% |
[ 27.0% - 27.5% ] 27.03% | 111 | 17.0% |
[ 31.0% - 31.5% ] 31.21% | 4,185 | 4.1% |
[ 33.5% - 34.0% ] 33.88% | 242 | 34.0% |
[ 39.0% - 39.5% ] 39.39% | 40,462 | 16.2% |
[ 62.0% - 62.5% ] 62.26% | 106 | 36.5% |