Immigrants from Jamaica 4 or more Vehicles in Household
COMPARE
Immigrants from Jamaica
Select to Compare
4 or more Vehicles in Household
Immigrants from Jamaica 4 or more Vehicles in Household
4.4%
4+ VEHICLES AVAILABLE
0.0/ 100
METRIC RATING
325th/ 347
METRIC RANK
Immigrants from Jamaica 4 or more Vehicles in Household Correlation Chart
The statistical analysis conducted on geographies consisting of 300,147,044 people shows a moderate negative correlation between the proportion of Immigrants from Jamaica and percentage of households with 4 or more vehicles available in the United States with a correlation coefficient (R) of -0.412 and weighted average of 4.4%. On average, for every 1% (one percent) increase in Immigrants from Jamaica within a typical geography, there is a decrease of 0.16% in percentage of households with 4 or more vehicles available.
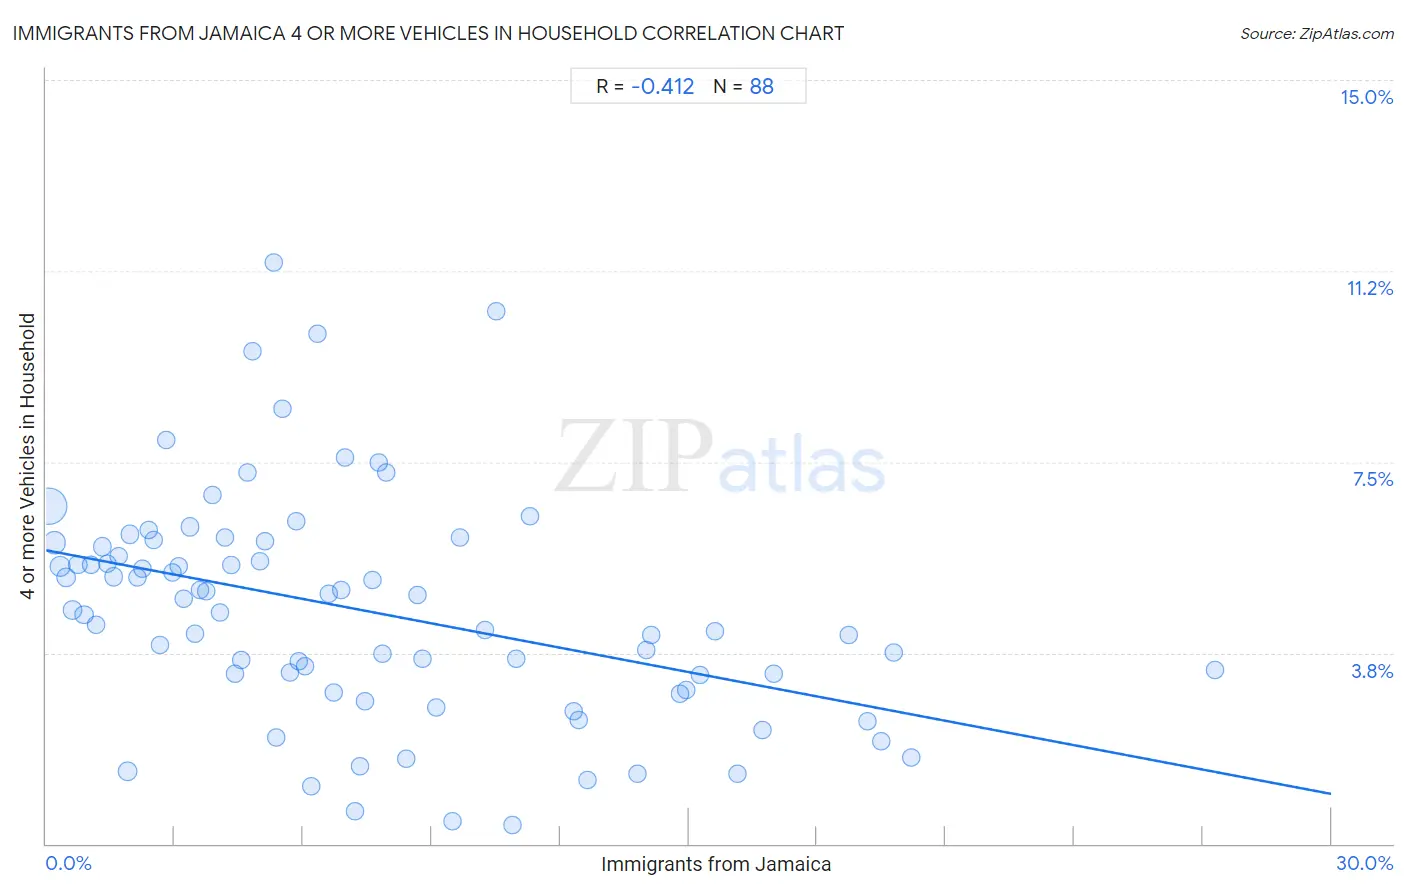
It is essential to understand that the correlation between the percentage of Immigrants from Jamaica and percentage of households with 4 or more vehicles available does not imply a direct cause-and-effect relationship. It remains uncertain whether the presence of Immigrants from Jamaica influences an upward or downward trend in the level of percentage of households with 4 or more vehicles available within an area, or if Immigrants from Jamaica simply ended up residing in those areas with higher or lower levels of percentage of households with 4 or more vehicles available due to other factors.
Demographics Similar to Immigrants from Jamaica by 4 or more Vehicles in Household
In terms of 4 or more vehicles in household, the demographic groups most similar to Immigrants from Jamaica are Soviet Union (4.4%, a difference of 0.32%), Cape Verdean (4.4%, a difference of 0.32%), Immigrants from Caribbean (4.4%, a difference of 0.60%), Immigrants from Yemen (4.5%, a difference of 1.0%), and Ecuadorian (4.5%, a difference of 1.2%).
| Demographics | Rating | Rank | 4 or more Vehicles in Household |
| Jamaicans | 0.0 /100 | #318 | Tragic 4.6% |
| Haitians | 0.0 /100 | #319 | Tragic 4.6% |
| Immigrants from Haiti | 0.0 /100 | #320 | Tragic 4.5% |
| Ecuadorians | 0.0 /100 | #321 | Tragic 4.5% |
| Immigrants from Yemen | 0.0 /100 | #322 | Tragic 4.5% |
| Immigrants from Caribbean | 0.0 /100 | #323 | Tragic 4.4% |
| Soviet Union | 0.0 /100 | #324 | Tragic 4.4% |
| Immigrants from Jamaica | 0.0 /100 | #325 | Tragic 4.4% |
| Cape Verdeans | 0.0 /100 | #326 | Tragic 4.4% |
| Senegalese | 0.0 /100 | #327 | Tragic 4.3% |
| Trinidadians and Tobagonians | 0.0 /100 | #328 | Tragic 4.3% |
| Immigrants from Senegal | 0.0 /100 | #329 | Tragic 4.2% |
| Immigrants from Ecuador | 0.0 /100 | #330 | Tragic 4.2% |
| West Indians | 0.0 /100 | #331 | Tragic 4.2% |
| Immigrants from Dominica | 0.0 /100 | #332 | Tragic 4.2% |
Immigrants from Jamaica 4 or more Vehicles in Household Correlation Summary
| Measurement | Immigrants from Jamaica Data | 4 or more Vehicles in Household Data |
| Minimum | 0.055% | 0.36% |
| Maximum | 27.3% | 11.4% |
| Range | 27.2% | 11.1% |
| Mean | 7.4% | 4.6% |
| Median | 6.0% | 4.6% |
| Interquartile 25% (IQ1) | 3.0% | 3.2% |
| Interquartile 75% (IQ3) | 10.7% | 5.9% |
| Interquartile Range (IQR) | 7.7% | 2.7% |
| Standard Deviation (Sample) | 5.8% | 2.2% |
| Standard Deviation (Population) | 5.7% | 2.2% |
Correlation Details
| Immigrants from Jamaica Percentile | Sample Size | 4 or more Vehicles in Household |
[ 0.0% - 0.5% ] 0.055% | 166,958,102 | 6.6% |
[ 0.0% - 0.5% ] 0.19% | 41,554,536 | 5.9% |
[ 0.0% - 0.5% ] 0.33% | 20,205,720 | 5.5% |
[ 0.0% - 0.5% ] 0.47% | 12,724,483 | 5.2% |
[ 0.5% - 1.0% ] 0.61% | 10,775,433 | 4.6% |
[ 0.5% - 1.0% ] 0.74% | 5,571,808 | 5.5% |
[ 0.5% - 1.0% ] 0.89% | 4,742,469 | 4.5% |
[ 1.0% - 1.5% ] 1.04% | 3,487,217 | 5.5% |
[ 1.0% - 1.5% ] 1.16% | 3,494,128 | 4.3% |
[ 1.0% - 1.5% ] 1.30% | 2,590,295 | 5.8% |
[ 1.0% - 1.5% ] 1.42% | 1,665,990 | 5.5% |
[ 1.5% - 2.0% ] 1.57% | 1,946,164 | 5.2% |
[ 1.5% - 2.0% ] 1.70% | 1,525,856 | 5.6% |
[ 1.5% - 2.0% ] 1.89% | 10,068,254 | 1.4% |
[ 1.5% - 2.0% ] 1.96% | 1,059,817 | 6.1% |
[ 2.0% - 2.5% ] 2.12% | 1,078,925 | 5.2% |
[ 2.0% - 2.5% ] 2.26% | 644,852 | 5.4% |
[ 2.0% - 2.5% ] 2.38% | 421,000 | 6.2% |
[ 2.5% - 3.0% ] 2.52% | 582,315 | 6.0% |
[ 2.5% - 3.0% ] 2.66% | 720,416 | 3.9% |
[ 2.5% - 3.0% ] 2.80% | 254,203 | 7.9% |
[ 2.5% - 3.0% ] 2.96% | 434,109 | 5.3% |
[ 3.0% - 3.5% ] 3.08% | 252,420 | 5.4% |
[ 3.0% - 3.5% ] 3.21% | 376,547 | 4.8% |
[ 3.0% - 3.5% ] 3.35% | 452,350 | 6.2% |
[ 3.0% - 3.5% ] 3.48% | 471,391 | 4.1% |
[ 3.5% - 4.0% ] 3.58% | 300,642 | 5.0% |
[ 3.5% - 4.0% ] 3.74% | 206,681 | 5.0% |
[ 3.5% - 4.0% ] 3.89% | 185,390 | 6.9% |
[ 4.0% - 4.5% ] 4.04% | 271,136 | 4.6% |
[ 4.0% - 4.5% ] 4.18% | 225,890 | 6.0% |
[ 4.0% - 4.5% ] 4.31% | 117,285 | 5.5% |
[ 4.0% - 4.5% ] 4.41% | 233,758 | 3.3% |
[ 4.5% - 5.0% ] 4.55% | 232,772 | 3.6% |
[ 4.5% - 5.0% ] 4.69% | 165,396 | 7.3% |
[ 4.5% - 5.0% ] 4.82% | 49,309 | 9.7% |
[ 4.5% - 5.0% ] 5.00% | 287,362 | 5.6% |
[ 5.0% - 5.5% ] 5.11% | 175,410 | 6.0% |
[ 5.0% - 5.5% ] 5.30% | 40,206 | 11.4% |
[ 5.0% - 5.5% ] 5.37% | 135,748 | 2.1% |
[ 5.5% - 6.0% ] 5.53% | 131,954 | 8.5% |
[ 5.5% - 6.0% ] 5.69% | 287,576 | 3.4% |
[ 5.5% - 6.0% ] 5.83% | 149,955 | 6.3% |
[ 5.5% - 6.0% ] 5.89% | 129,918 | 3.6% |
[ 6.0% - 6.5% ] 6.04% | 47,505 | 3.5% |
[ 6.0% - 6.5% ] 6.20% | 52,257 | 1.1% |
[ 6.0% - 6.5% ] 6.32% | 67,094 | 10.0% |
[ 6.5% - 7.0% ] 6.58% | 122,538 | 4.9% |
[ 6.5% - 7.0% ] 6.70% | 92,706 | 3.0% |
[ 6.5% - 7.0% ] 6.89% | 52,742 | 5.0% |
[ 6.5% - 7.0% ] 6.97% | 43,908 | 7.6% |
[ 7.0% - 7.5% ] 7.21% | 146,869 | 0.63% |
[ 7.0% - 7.5% ] 7.33% | 226,412 | 1.5% |
[ 7.0% - 7.5% ] 7.45% | 146,631 | 2.8% |
[ 7.5% - 8.0% ] 7.60% | 17,178 | 5.2% |
[ 7.5% - 8.0% ] 7.77% | 927 | 7.5% |
[ 7.5% - 8.0% ] 7.86% | 175,260 | 3.7% |
[ 7.5% - 8.0% ] 7.94% | 136,315 | 7.3% |
[ 8.0% - 8.5% ] 8.42% | 73,006 | 1.7% |
[ 8.5% - 9.0% ] 8.67% | 221,580 | 4.9% |
[ 8.5% - 9.0% ] 8.78% | 2,233 | 3.6% |
[ 9.0% - 9.5% ] 9.10% | 22,099 | 2.7% |
[ 9.0% - 9.5% ] 9.48% | 44,047 | 0.45% |
[ 9.5% - 10.0% ] 9.65% | 4,674 | 6.0% |
[ 10.0% - 10.5% ] 10.24% | 13,781 | 4.2% |
[ 10.0% - 10.5% ] 10.50% | 543 | 10.4% |
[ 10.5% - 11.0% ] 10.88% | 79,161 | 0.36% |
[ 10.5% - 11.0% ] 10.97% | 21,460 | 3.6% |
[ 11.0% - 11.5% ] 11.29% | 638 | 6.4% |
[ 12.0% - 12.5% ] 12.32% | 68,182 | 2.6% |
[ 12.0% - 12.5% ] 12.44% | 201 | 2.4% |
[ 12.5% - 13.0% ] 12.63% | 128,695 | 1.2% |
[ 13.5% - 14.0% ] 13.81% | 71,862 | 1.4% |
[ 14.0% - 14.5% ] 14.01% | 32,296 | 3.8% |
[ 14.0% - 14.5% ] 14.12% | 21,329 | 4.1% |
[ 14.5% - 15.0% ] 14.81% | 117,452 | 3.0% |
[ 14.5% - 15.0% ] 14.93% | 40,593 | 3.0% |
[ 15.0% - 15.5% ] 15.27% | 62,232 | 3.3% |
[ 15.5% - 16.0% ] 15.63% | 52,792 | 4.2% |
[ 16.0% - 16.5% ] 16.14% | 72,273 | 1.4% |
[ 16.5% - 17.0% ] 16.72% | 84,905 | 2.2% |
[ 16.5% - 17.0% ] 16.98% | 73,987 | 3.3% |
[ 18.5% - 19.0% ] 18.73% | 35,914 | 4.1% |
[ 19.0% - 19.5% ] 19.17% | 52,000 | 2.4% |
[ 19.0% - 19.5% ] 19.50% | 21,977 | 2.0% |
[ 19.5% - 20.0% ] 19.78% | 10,526 | 3.7% |
[ 20.0% - 20.5% ] 20.19% | 852 | 1.7% |
[ 27.0% - 27.5% ] 27.29% | 2,224 | 3.4% |