Immigrants from India 2 or more Vehicles in Household
COMPARE
Immigrants from India
Select to Compare
2 or more Vehicles in Household
Immigrants from India 2 or more Vehicles in Household
59.3%
2+ VEHICLES AVAILABLE
99.9/ 100
METRIC RATING
48th/ 347
METRIC RANK
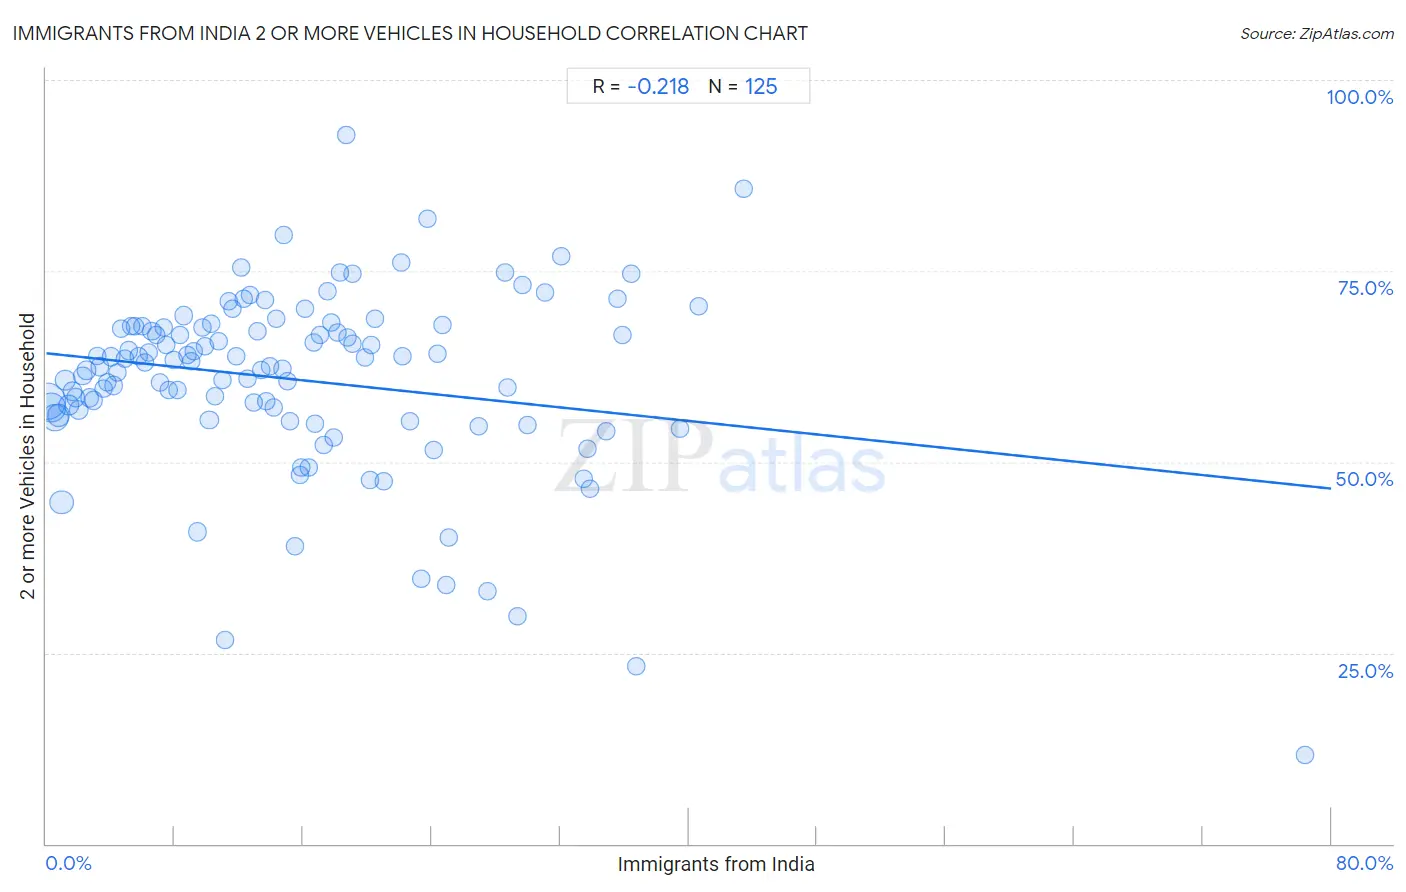
Immigrants from India 2 or more Vehicles in Household Correlation Chart
The statistical analysis conducted on geographies consisting of 433,787,530 people shows a weak negative correlation between the proportion of Immigrants from India and percentage of households with 2 or more vehicles available in the United States with a correlation coefficient (R) of -0.218 and weighted average of 59.3%. On average, for every 1% (one percent) increase in Immigrants from India within a typical geography, there is a decrease of 0.22% in percentage of households with 2 or more vehicles available.
It is essential to understand that the correlation between the percentage of Immigrants from India and percentage of households with 2 or more vehicles available does not imply a direct cause-and-effect relationship. It remains uncertain whether the presence of Immigrants from India influences an upward or downward trend in the level of percentage of households with 2 or more vehicles available within an area, or if Immigrants from India simply ended up residing in those areas with higher or lower levels of percentage of households with 2 or more vehicles available due to other factors.
Demographics Similar to Immigrants from India by 2 or more Vehicles in Household
In terms of 2 or more vehicles in household, the demographic groups most similar to Immigrants from India are Yaqui (59.3%, a difference of 0.020%), Belgian (59.3%, a difference of 0.040%), Choctaw (59.3%, a difference of 0.040%), Spaniard (59.2%, a difference of 0.18%), and Immigrants from Laos (59.2%, a difference of 0.19%).
| Demographics | Rating | Rank | 2 or more Vehicles in Household |
| Northern Europeans | 100.0 /100 | #41 | Exceptional 59.9% |
| Malaysians | 100.0 /100 | #42 | Exceptional 59.8% |
| Czechoslovakians | 100.0 /100 | #43 | Exceptional 59.8% |
| French | 100.0 /100 | #44 | Exceptional 59.8% |
| Immigrants from Taiwan | 100.0 /100 | #45 | Exceptional 59.7% |
| Immigrants from South Eastern Asia | 100.0 /100 | #46 | Exceptional 59.6% |
| Yaqui | 99.9 /100 | #47 | Exceptional 59.3% |
| Immigrants from India | 99.9 /100 | #48 | Exceptional 59.3% |
| Belgians | 99.9 /100 | #49 | Exceptional 59.3% |
| Choctaw | 99.9 /100 | #50 | Exceptional 59.3% |
| Spaniards | 99.9 /100 | #51 | Exceptional 59.2% |
| Immigrants from Laos | 99.9 /100 | #52 | Exceptional 59.2% |
| Celtics | 99.9 /100 | #53 | Exceptional 59.2% |
| Bhutanese | 99.9 /100 | #54 | Exceptional 59.1% |
| Luxembourgers | 99.9 /100 | #55 | Exceptional 59.1% |
Immigrants from India 2 or more Vehicles in Household Correlation Summary
| Measurement | Immigrants from India Data | 2 or more Vehicles in Household Data |
| Minimum | 0.10% | 11.6% |
| Maximum | 78.4% | 92.9% |
| Range | 78.2% | 81.2% |
| Mean | 15.5% | 60.8% |
| Median | 13.6% | 63.0% |
| Interquartile 25% (IQ1) | 6.7% | 55.9% |
| Interquartile 75% (IQ3) | 21.6% | 67.7% |
| Interquartile Range (IQR) | 14.9% | 11.7% |
| Standard Deviation (Sample) | 11.8% | 12.0% |
| Standard Deviation (Population) | 11.8% | 12.0% |
Correlation Details
| Immigrants from India Percentile | Sample Size | 2 or more Vehicles in Household |
[ 0.0% - 0.5% ] 0.10% | 127,779,320 | 57.9% |
[ 0.0% - 0.5% ] 0.32% | 76,505,875 | 57.1% |
[ 0.5% - 1.0% ] 0.54% | 57,705,183 | 55.8% |
[ 0.5% - 1.0% ] 0.75% | 28,894,816 | 56.1% |
[ 0.5% - 1.0% ] 0.96% | 36,959,995 | 44.7% |
[ 1.0% - 1.5% ] 1.18% | 13,762,544 | 60.7% |
[ 1.0% - 1.5% ] 1.42% | 16,390,832 | 57.5% |
[ 1.5% - 2.0% ] 1.62% | 8,356,256 | 59.2% |
[ 1.5% - 2.0% ] 1.84% | 7,234,328 | 58.4% |
[ 2.0% - 2.5% ] 2.04% | 8,644,950 | 56.7% |
[ 2.0% - 2.5% ] 2.26% | 5,119,600 | 61.3% |
[ 2.0% - 2.5% ] 2.49% | 4,604,587 | 61.9% |
[ 2.5% - 3.0% ] 2.72% | 4,005,505 | 58.4% |
[ 2.5% - 3.0% ] 2.93% | 3,219,620 | 58.0% |
[ 3.0% - 3.5% ] 3.16% | 3,426,025 | 63.9% |
[ 3.0% - 3.5% ] 3.36% | 2,012,574 | 62.4% |
[ 3.5% - 4.0% ] 3.58% | 1,718,574 | 59.6% |
[ 3.5% - 4.0% ] 3.78% | 2,397,021 | 60.4% |
[ 4.0% - 4.5% ] 4.01% | 1,262,815 | 63.7% |
[ 4.0% - 4.5% ] 4.22% | 1,655,004 | 60.0% |
[ 4.0% - 4.5% ] 4.43% | 1,045,796 | 61.8% |
[ 4.5% - 5.0% ] 4.67% | 1,201,869 | 67.4% |
[ 4.5% - 5.0% ] 4.88% | 1,085,417 | 63.5% |
[ 5.0% - 5.5% ] 5.12% | 872,640 | 64.6% |
[ 5.0% - 5.5% ] 5.27% | 1,547,032 | 67.8% |
[ 5.5% - 6.0% ] 5.54% | 499,965 | 67.7% |
[ 5.5% - 6.0% ] 5.76% | 506,757 | 63.8% |
[ 5.5% - 6.0% ] 5.96% | 1,025,666 | 67.8% |
[ 6.0% - 6.5% ] 6.17% | 729,902 | 63.0% |
[ 6.0% - 6.5% ] 6.40% | 683,077 | 64.3% |
[ 6.5% - 7.0% ] 6.58% | 562,723 | 67.1% |
[ 6.5% - 7.0% ] 6.82% | 443,785 | 66.6% |
[ 7.0% - 7.5% ] 7.06% | 453,612 | 60.3% |
[ 7.0% - 7.5% ] 7.28% | 396,984 | 67.5% |
[ 7.5% - 8.0% ] 7.50% | 522,539 | 65.3% |
[ 7.5% - 8.0% ] 7.66% | 226,707 | 59.5% |
[ 7.5% - 8.0% ] 7.91% | 600,455 | 63.4% |
[ 8.0% - 8.5% ] 8.15% | 348,568 | 59.4% |
[ 8.0% - 8.5% ] 8.32% | 289,330 | 66.7% |
[ 8.5% - 9.0% ] 8.54% | 325,799 | 69.2% |
[ 8.5% - 9.0% ] 8.82% | 299,483 | 63.9% |
[ 9.0% - 9.5% ] 9.05% | 411,483 | 63.2% |
[ 9.0% - 9.5% ] 9.22% | 256,881 | 64.5% |
[ 9.0% - 9.5% ] 9.39% | 512,426 | 40.8% |
[ 9.5% - 10.0% ] 9.71% | 426,617 | 67.7% |
[ 9.5% - 10.0% ] 9.85% | 315,856 | 65.2% |
[ 10.0% - 10.5% ] 10.15% | 437,971 | 55.4% |
[ 10.0% - 10.5% ] 10.29% | 280,288 | 68.0% |
[ 10.5% - 11.0% ] 10.54% | 331,090 | 58.7% |
[ 10.5% - 11.0% ] 10.76% | 625,017 | 65.8% |
[ 10.5% - 11.0% ] 10.99% | 98,434 | 60.6% |
[ 11.0% - 11.5% ] 11.13% | 104,054 | 26.7% |
[ 11.0% - 11.5% ] 11.40% | 339,283 | 71.0% |
[ 11.5% - 12.0% ] 11.60% | 196,749 | 70.0% |
[ 11.5% - 12.0% ] 11.83% | 190,915 | 63.8% |
[ 12.0% - 12.5% ] 12.11% | 47,175 | 75.4% |
[ 12.0% - 12.5% ] 12.31% | 82,318 | 71.3% |
[ 12.0% - 12.5% ] 12.49% | 168,347 | 60.9% |
[ 12.5% - 13.0% ] 12.67% | 122,114 | 71.8% |
[ 12.5% - 13.0% ] 12.88% | 63,193 | 57.8% |
[ 13.0% - 13.5% ] 13.14% | 66,157 | 67.1% |
[ 13.0% - 13.5% ] 13.39% | 105,737 | 62.0% |
[ 13.5% - 14.0% ] 13.61% | 136,078 | 71.3% |
[ 13.5% - 14.0% ] 13.70% | 131,525 | 58.0% |
[ 13.5% - 14.0% ] 13.94% | 83,315 | 62.4% |
[ 14.0% - 14.5% ] 14.13% | 159,918 | 57.1% |
[ 14.0% - 14.5% ] 14.34% | 88,280 | 68.7% |
[ 14.5% - 15.0% ] 14.73% | 47,719 | 62.2% |
[ 14.5% - 15.0% ] 14.78% | 14,658 | 79.6% |
[ 15.0% - 15.5% ] 15.00% | 204,934 | 60.5% |
[ 15.0% - 15.5% ] 15.21% | 22,030 | 55.2% |
[ 15.5% - 16.0% ] 15.50% | 118,050 | 38.9% |
[ 15.5% - 16.0% ] 15.82% | 84,812 | 48.3% |
[ 15.5% - 16.0% ] 15.89% | 4,960 | 49.3% |
[ 16.0% - 16.5% ] 16.13% | 35,507 | 70.1% |
[ 16.0% - 16.5% ] 16.33% | 93,461 | 49.3% |
[ 16.5% - 17.0% ] 16.65% | 256,521 | 65.7% |
[ 16.5% - 17.0% ] 16.73% | 24,444 | 55.0% |
[ 17.0% - 17.5% ] 17.04% | 158,485 | 66.7% |
[ 17.0% - 17.5% ] 17.31% | 15,571 | 52.2% |
[ 17.5% - 18.0% ] 17.54% | 57 | 72.4% |
[ 17.5% - 18.0% ] 17.71% | 87,003 | 68.3% |
[ 17.5% - 18.0% ] 17.90% | 99,093 | 53.1% |
[ 18.0% - 18.5% ] 18.09% | 140,890 | 66.9% |
[ 18.0% - 18.5% ] 18.31% | 14,345 | 74.8% |
[ 18.5% - 19.0% ] 18.65% | 429 | 92.9% |
[ 18.5% - 19.0% ] 18.72% | 219 | 66.3% |
[ 19.0% - 19.5% ] 19.04% | 124,761 | 65.5% |
[ 19.0% - 19.5% ] 19.10% | 11,603 | 74.6% |
[ 19.5% - 20.0% ] 19.82% | 79,891 | 63.6% |
[ 20.0% - 20.5% ] 20.15% | 2,144 | 47.5% |
[ 20.0% - 20.5% ] 20.26% | 316,805 | 65.2% |
[ 20.0% - 20.5% ] 20.44% | 61,414 | 68.7% |
[ 21.0% - 21.5% ] 21.02% | 55,440 | 47.5% |
[ 22.0% - 22.5% ] 22.12% | 22,796 | 76.2% |
[ 22.0% - 22.5% ] 22.19% | 89,256 | 63.9% |
[ 22.5% - 23.0% ] 22.63% | 38,567 | 55.4% |
[ 23.0% - 23.5% ] 23.35% | 27,571 | 34.7% |
[ 23.5% - 24.0% ] 23.73% | 53,464 | 81.9% |
[ 24.0% - 24.5% ] 24.16% | 21,806 | 51.6% |
[ 24.0% - 24.5% ] 24.39% | 7,972 | 64.2% |
[ 24.5% - 25.0% ] 24.65% | 20,954 | 67.9% |
[ 24.5% - 25.0% ] 24.87% | 599 | 33.9% |
[ 25.0% - 25.5% ] 25.02% | 44,439 | 40.2% |
[ 26.5% - 27.0% ] 26.93% | 18,068 | 54.7% |
[ 27.0% - 27.5% ] 27.46% | 5,018 | 33.1% |
[ 28.5% - 29.0% ] 28.55% | 802 | 74.9% |
[ 28.5% - 29.0% ] 28.69% | 3,879 | 59.8% |
[ 29.0% - 29.5% ] 29.34% | 2,594 | 29.8% |
[ 29.5% - 30.0% ] 29.66% | 5,867 | 73.2% |
[ 29.5% - 30.0% ] 29.99% | 64,161 | 54.8% |
[ 31.0% - 31.5% ] 31.09% | 341 | 72.2% |
[ 32.0% - 32.5% ] 32.07% | 10,514 | 76.9% |
[ 33.0% - 33.5% ] 33.47% | 44,570 | 47.8% |
[ 33.5% - 34.0% ] 33.70% | 22,993 | 51.7% |
[ 33.5% - 34.0% ] 33.85% | 15,585 | 46.5% |
[ 34.5% - 35.0% ] 34.84% | 37,755 | 54.0% |
[ 35.5% - 36.0% ] 35.56% | 1,049 | 71.4% |
[ 35.5% - 36.0% ] 35.84% | 39,565 | 66.6% |
[ 36.0% - 36.5% ] 36.41% | 2,387 | 74.7% |
[ 36.5% - 37.0% ] 36.72% | 1,999 | 23.2% |
[ 39.0% - 39.5% ] 39.42% | 104 | 54.3% |
[ 40.5% - 41.0% ] 40.60% | 2,549 | 70.4% |
[ 43.0% - 43.5% ] 43.40% | 212 | 85.7% |
[ 78.0% - 78.5% ] 78.35% | 97 | 11.6% |