Immigrants from Argentina GED/Equivalency
COMPARE
Immigrants from Argentina
Select to Compare
GED/Equivalency
Immigrants from Argentina GED/Equivalency
86.6%
GED/EQUIVALENCY
86.5/ 100
METRIC RATING
138th/ 347
METRIC RANK
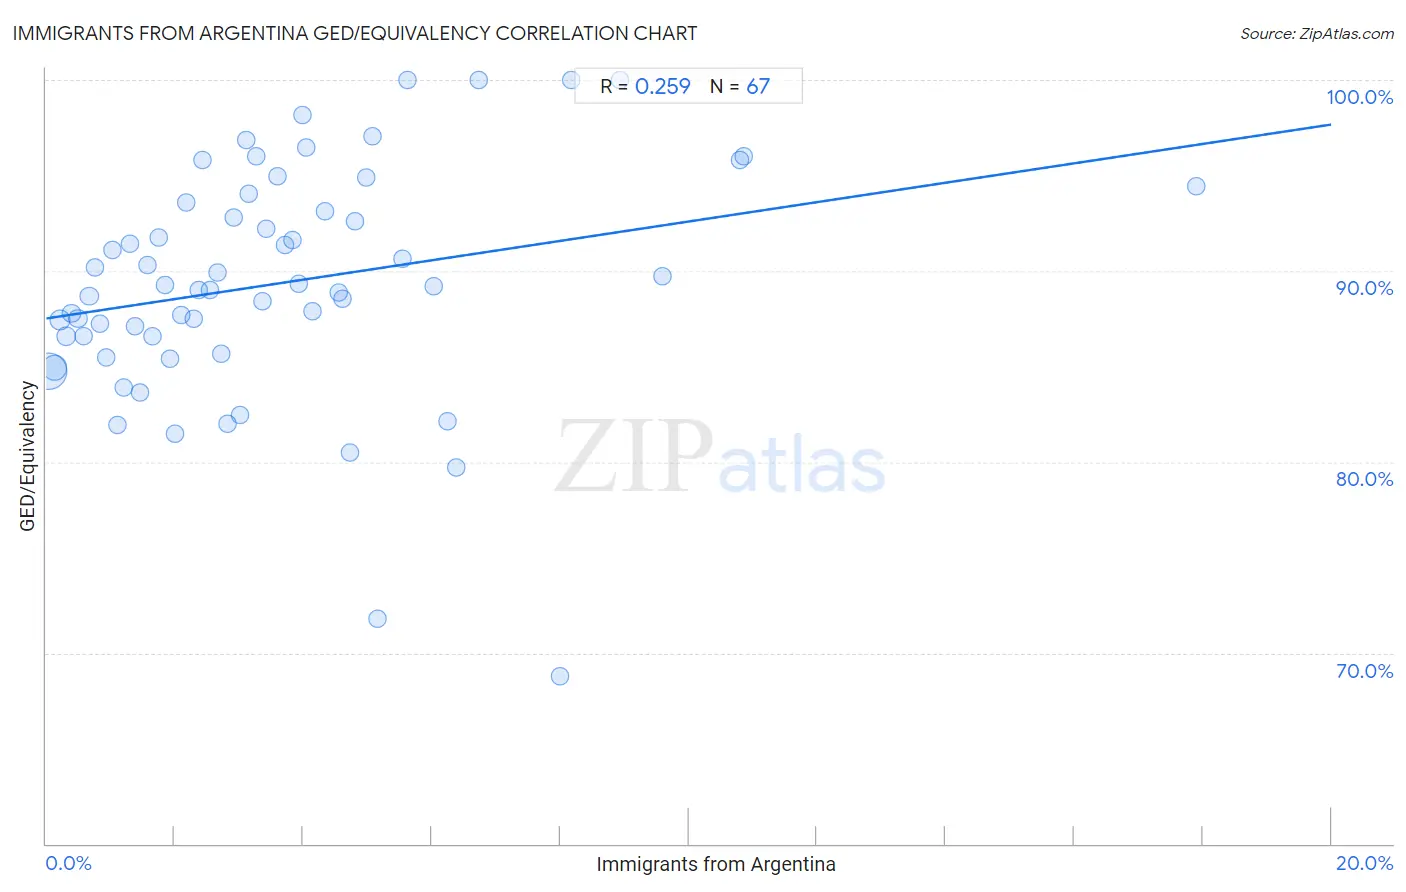
Immigrants from Argentina GED/Equivalency Correlation Chart
The statistical analysis conducted on geographies consisting of 264,434,241 people shows a weak positive correlation between the proportion of Immigrants from Argentina and percentage of population with at least ged/equivalency education in the United States with a correlation coefficient (R) of 0.259 and weighted average of 86.6%. On average, for every 1% (one percent) increase in Immigrants from Argentina within a typical geography, there is an increase of 0.51% in percentage of population with at least ged/equivalency education.
It is essential to understand that the correlation between the percentage of Immigrants from Argentina and percentage of population with at least ged/equivalency education does not imply a direct cause-and-effect relationship. It remains uncertain whether the presence of Immigrants from Argentina influences an upward or downward trend in the level of percentage of population with at least ged/equivalency education within an area, or if Immigrants from Argentina simply ended up residing in those areas with higher or lower levels of percentage of population with at least ged/equivalency education due to other factors.
Demographics Similar to Immigrants from Argentina by GED/Equivalency
In terms of ged/equivalency, the demographic groups most similar to Immigrants from Argentina are Arab (86.6%, a difference of 0.010%), Chilean (86.6%, a difference of 0.020%), Immigrants from Asia (86.6%, a difference of 0.040%), Albanian (86.6%, a difference of 0.050%), and Immigrants from Malaysia (86.5%, a difference of 0.060%).
| Demographics | Rating | Rank | GED/Equivalency |
| Immigrants from Spain | 88.5 /100 | #131 | Excellent 86.7% |
| Immigrants from Brazil | 88.4 /100 | #132 | Excellent 86.6% |
| Tsimshian | 88.3 /100 | #133 | Excellent 86.6% |
| Albanians | 87.7 /100 | #134 | Excellent 86.6% |
| Immigrants from Asia | 87.4 /100 | #135 | Excellent 86.6% |
| Chileans | 86.9 /100 | #136 | Excellent 86.6% |
| Arabs | 86.7 /100 | #137 | Excellent 86.6% |
| Immigrants from Argentina | 86.5 /100 | #138 | Excellent 86.6% |
| Immigrants from Malaysia | 85.0 /100 | #139 | Excellent 86.5% |
| Paraguayans | 84.1 /100 | #140 | Excellent 86.5% |
| Laotians | 83.2 /100 | #141 | Excellent 86.5% |
| Immigrants from Indonesia | 82.4 /100 | #142 | Excellent 86.4% |
| Immigrants from Pakistan | 82.4 /100 | #143 | Excellent 86.4% |
| Bolivians | 82.1 /100 | #144 | Excellent 86.4% |
| Pakistanis | 80.4 /100 | #145 | Excellent 86.4% |
Immigrants from Argentina GED/Equivalency Correlation Summary
| Measurement | Immigrants from Argentina Data | GED/Equivalency Data |
| Minimum | 0.040% | 68.8% |
| Maximum | 17.9% | 100.0% |
| Range | 17.9% | 31.2% |
| Mean | 3.6% | 89.4% |
| Median | 3.0% | 89.2% |
| Interquartile 25% (IQ1) | 1.5% | 86.6% |
| Interquartile 75% (IQ3) | 4.8% | 93.6% |
| Interquartile Range (IQR) | 3.3% | 7.0% |
| Standard Deviation (Sample) | 3.1% | 6.1% |
| Standard Deviation (Population) | 3.1% | 6.0% |
Correlation Details
| Immigrants from Argentina Percentile | Sample Size | GED/Equivalency |
[ 0.0% - 0.5% ] 0.040% | 155,525,377 | 84.8% |
[ 0.0% - 0.5% ] 0.13% | 58,212,111 | 84.9% |
[ 0.0% - 0.5% ] 0.22% | 20,395,728 | 87.4% |
[ 0.0% - 0.5% ] 0.31% | 10,369,880 | 86.6% |
[ 0.0% - 0.5% ] 0.40% | 6,778,451 | 87.8% |
[ 0.0% - 0.5% ] 0.49% | 3,386,062 | 87.5% |
[ 0.5% - 1.0% ] 0.58% | 2,094,363 | 86.6% |
[ 0.5% - 1.0% ] 0.67% | 1,577,342 | 88.7% |
[ 0.5% - 1.0% ] 0.77% | 887,513 | 90.2% |
[ 0.5% - 1.0% ] 0.84% | 681,937 | 87.2% |
[ 0.5% - 1.0% ] 0.94% | 784,100 | 85.4% |
[ 1.0% - 1.5% ] 1.03% | 361,912 | 91.1% |
[ 1.0% - 1.5% ] 1.10% | 784,575 | 81.9% |
[ 1.0% - 1.5% ] 1.21% | 471,222 | 83.9% |
[ 1.0% - 1.5% ] 1.31% | 331,633 | 91.4% |
[ 1.0% - 1.5% ] 1.38% | 58,611 | 87.1% |
[ 1.0% - 1.5% ] 1.46% | 35,321 | 83.6% |
[ 1.5% - 2.0% ] 1.57% | 237,474 | 90.3% |
[ 1.5% - 2.0% ] 1.65% | 312,525 | 86.6% |
[ 1.5% - 2.0% ] 1.75% | 22,688 | 91.7% |
[ 1.5% - 2.0% ] 1.84% | 102,836 | 89.2% |
[ 1.5% - 2.0% ] 1.93% | 80,794 | 85.4% |
[ 1.5% - 2.0% ] 2.00% | 95,762 | 81.4% |
[ 2.0% - 2.5% ] 2.10% | 28,405 | 87.7% |
[ 2.0% - 2.5% ] 2.19% | 61,301 | 93.6% |
[ 2.0% - 2.5% ] 2.29% | 42,408 | 87.5% |
[ 2.0% - 2.5% ] 2.38% | 26,372 | 89.0% |
[ 2.0% - 2.5% ] 2.44% | 9,891 | 95.8% |
[ 2.5% - 3.0% ] 2.56% | 26,814 | 89.0% |
[ 2.5% - 3.0% ] 2.66% | 15,898 | 89.9% |
[ 2.5% - 3.0% ] 2.72% | 54,981 | 85.7% |
[ 2.5% - 3.0% ] 2.82% | 2,414 | 82.0% |
[ 2.5% - 3.0% ] 2.92% | 116,913 | 92.8% |
[ 3.0% - 3.5% ] 3.02% | 44,914 | 82.5% |
[ 3.0% - 3.5% ] 3.11% | 546 | 96.9% |
[ 3.0% - 3.5% ] 3.14% | 46,704 | 94.1% |
[ 3.0% - 3.5% ] 3.27% | 11,753 | 96.0% |
[ 3.0% - 3.5% ] 3.36% | 7,435 | 88.4% |
[ 3.0% - 3.5% ] 3.43% | 42,058 | 92.2% |
[ 3.5% - 4.0% ] 3.61% | 721 | 95.0% |
[ 3.5% - 4.0% ] 3.71% | 36,324 | 91.4% |
[ 3.5% - 4.0% ] 3.83% | 26,436 | 91.6% |
[ 3.5% - 4.0% ] 3.93% | 24,256 | 89.3% |
[ 3.5% - 4.0% ] 3.98% | 5,625 | 98.2% |
[ 4.0% - 4.5% ] 4.04% | 23,734 | 96.5% |
[ 4.0% - 4.5% ] 4.15% | 289 | 87.9% |
[ 4.0% - 4.5% ] 4.33% | 1,777 | 93.1% |
[ 4.5% - 5.0% ] 4.55% | 82,400 | 88.9% |
[ 4.5% - 5.0% ] 4.60% | 16,450 | 88.5% |
[ 4.5% - 5.0% ] 4.74% | 1,288 | 80.5% |
[ 4.5% - 5.0% ] 4.80% | 271 | 92.6% |
[ 4.5% - 5.0% ] 4.97% | 3,098 | 94.9% |
[ 5.0% - 5.5% ] 5.08% | 59 | 97.1% |
[ 5.0% - 5.5% ] 5.15% | 7,800 | 71.8% |
[ 5.5% - 6.0% ] 5.55% | 883 | 90.7% |
[ 5.5% - 6.0% ] 5.63% | 231 | 100.0% |
[ 6.0% - 6.5% ] 6.03% | 35,967 | 89.2% |
[ 6.0% - 6.5% ] 6.24% | 593 | 82.2% |
[ 6.0% - 6.5% ] 6.37% | 1,381 | 79.7% |
[ 6.5% - 7.0% ] 6.73% | 208 | 100.0% |
[ 7.5% - 8.0% ] 7.99% | 5,719 | 68.8% |
[ 8.0% - 8.5% ] 8.17% | 1,041 | 100.0% |
[ 8.5% - 9.0% ] 8.93% | 459 | 100.0% |
[ 9.5% - 10.0% ] 9.59% | 605 | 89.7% |
[ 10.5% - 11.0% ] 10.81% | 14,639 | 95.8% |
[ 10.5% - 11.0% ] 10.86% | 14,572 | 96.0% |
[ 17.5% - 18.0% ] 17.90% | 391 | 94.5% |