Estonian 2 or more Vehicles in Household
COMPARE
Estonian
Select to Compare
2 or more Vehicles in Household
Estonian 2 or more Vehicles in Household
56.6%
2+ VEHICLES AVAILABLE
90.9/ 100
METRIC RATING
126th/ 347
METRIC RANK
Estonian 2 or more Vehicles in Household Correlation Chart
The statistical analysis conducted on geographies consisting of 123,500,786 people shows a mild positive correlation between the proportion of Estonians and percentage of households with 2 or more vehicles available in the United States with a correlation coefficient (R) of 0.315 and weighted average of 56.6%. On average, for every 1% (one percent) increase in Estonians within a typical geography, there is an increase of 2.4% in percentage of households with 2 or more vehicles available.
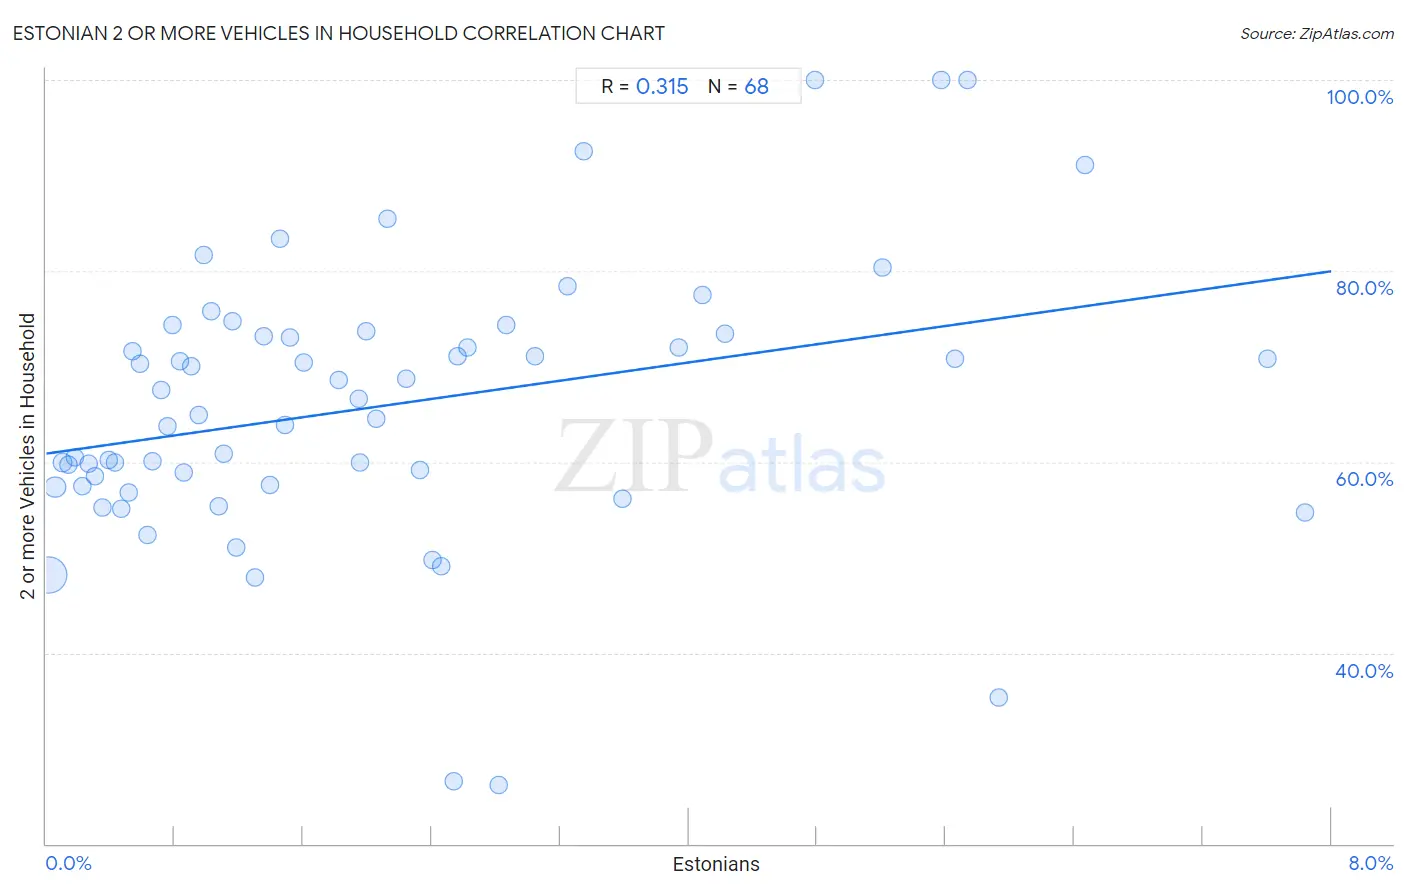
It is essential to understand that the correlation between the percentage of Estonians and percentage of households with 2 or more vehicles available does not imply a direct cause-and-effect relationship. It remains uncertain whether the presence of Estonians influences an upward or downward trend in the level of percentage of households with 2 or more vehicles available within an area, or if Estonians simply ended up residing in those areas with higher or lower levels of percentage of households with 2 or more vehicles available due to other factors.
Demographics Similar to Estonians by 2 or more Vehicles in Household
In terms of 2 or more vehicles in household, the demographic groups most similar to Estonians are Immigrants from Thailand (56.6%, a difference of 0.030%), Immigrants from South Central Asia (56.6%, a difference of 0.050%), Ute (56.6%, a difference of 0.070%), Tsimshian (56.7%, a difference of 0.080%), and New Zealander (56.7%, a difference of 0.10%).
| Demographics | Rating | Rank | 2 or more Vehicles in Household |
| Natives/Alaskans | 95.0 /100 | #119 | Exceptional 57.0% |
| Costa Ricans | 94.7 /100 | #120 | Exceptional 56.9% |
| Sioux | 93.8 /100 | #121 | Exceptional 56.8% |
| Immigrants from South Africa | 92.5 /100 | #122 | Exceptional 56.7% |
| Australians | 91.8 /100 | #123 | Exceptional 56.7% |
| New Zealanders | 91.8 /100 | #124 | Exceptional 56.7% |
| Tsimshian | 91.6 /100 | #125 | Exceptional 56.7% |
| Estonians | 90.9 /100 | #126 | Exceptional 56.6% |
| Immigrants from Thailand | 90.7 /100 | #127 | Exceptional 56.6% |
| Immigrants from South Central Asia | 90.5 /100 | #128 | Exceptional 56.6% |
| Ute | 90.4 /100 | #129 | Exceptional 56.6% |
| Yugoslavians | 90.0 /100 | #130 | Exceptional 56.6% |
| Bulgarians | 89.7 /100 | #131 | Excellent 56.5% |
| Hungarians | 89.1 /100 | #132 | Excellent 56.5% |
| Comanche | 88.4 /100 | #133 | Excellent 56.5% |
Estonian 2 or more Vehicles in Household Correlation Summary
| Measurement | Estonian Data | 2 or more Vehicles in Household Data |
| Minimum | 0.014% | 26.1% |
| Maximum | 7.8% | 100.0% |
| Range | 7.8% | 73.9% |
| Mean | 2.1% | 65.9% |
| Median | 1.5% | 65.7% |
| Interquartile 25% (IQ1) | 0.69% | 57.5% |
| Interquartile 75% (IQ3) | 2.8% | 73.3% |
| Interquartile Range (IQR) | 2.2% | 15.7% |
| Standard Deviation (Sample) | 1.9% | 14.5% |
| Standard Deviation (Population) | 1.9% | 14.4% |
Correlation Details
| Estonian Percentile | Sample Size | 2 or more Vehicles in Household |
[ 0.0% - 0.5% ] 0.014% | 93,128,970 | 48.1% |
[ 0.0% - 0.5% ] 0.057% | 16,406,096 | 57.4% |
[ 0.0% - 0.5% ] 0.099% | 5,986,610 | 59.9% |
[ 0.0% - 0.5% ] 0.14% | 3,138,449 | 59.7% |
[ 0.0% - 0.5% ] 0.18% | 1,327,187 | 60.5% |
[ 0.0% - 0.5% ] 0.22% | 1,026,788 | 57.5% |
[ 0.0% - 0.5% ] 0.26% | 594,166 | 59.8% |
[ 0.0% - 0.5% ] 0.30% | 432,457 | 58.5% |
[ 0.0% - 0.5% ] 0.35% | 151,838 | 55.2% |
[ 0.0% - 0.5% ] 0.39% | 284,971 | 60.1% |
[ 0.0% - 0.5% ] 0.43% | 154,819 | 60.0% |
[ 0.0% - 0.5% ] 0.46% | 167,368 | 55.0% |
[ 0.5% - 1.0% ] 0.51% | 93,892 | 56.8% |
[ 0.5% - 1.0% ] 0.54% | 103,205 | 71.6% |
[ 0.5% - 1.0% ] 0.59% | 53,292 | 70.3% |
[ 0.5% - 1.0% ] 0.63% | 60,767 | 52.4% |
[ 0.5% - 1.0% ] 0.66% | 56,901 | 60.1% |
[ 0.5% - 1.0% ] 0.72% | 16,922 | 67.5% |
[ 0.5% - 1.0% ] 0.76% | 23,575 | 63.8% |
[ 0.5% - 1.0% ] 0.79% | 22,279 | 74.4% |
[ 0.5% - 1.0% ] 0.83% | 5,406 | 70.5% |
[ 0.5% - 1.0% ] 0.86% | 76,168 | 58.8% |
[ 0.5% - 1.0% ] 0.90% | 16,440 | 70.1% |
[ 0.5% - 1.0% ] 0.95% | 16,636 | 64.9% |
[ 0.5% - 1.0% ] 0.98% | 4,913 | 81.6% |
[ 1.0% - 1.5% ] 1.03% | 1,364 | 75.8% |
[ 1.0% - 1.5% ] 1.08% | 837 | 55.4% |
[ 1.0% - 1.5% ] 1.11% | 22,519 | 60.8% |
[ 1.0% - 1.5% ] 1.16% | 8,012 | 74.7% |
[ 1.0% - 1.5% ] 1.18% | 5,067 | 51.0% |
[ 1.0% - 1.5% ] 1.30% | 2,842 | 47.9% |
[ 1.0% - 1.5% ] 1.35% | 10,131 | 73.1% |
[ 1.0% - 1.5% ] 1.40% | 5,730 | 57.6% |
[ 1.0% - 1.5% ] 1.46% | 1,304 | 83.3% |
[ 1.0% - 1.5% ] 1.49% | 4,371 | 63.8% |
[ 1.5% - 2.0% ] 1.51% | 3,500 | 73.0% |
[ 1.5% - 2.0% ] 1.61% | 13,080 | 70.4% |
[ 1.5% - 2.0% ] 1.82% | 8,851 | 68.5% |
[ 1.5% - 2.0% ] 1.94% | 1,493 | 66.6% |
[ 1.5% - 2.0% ] 1.95% | 7,417 | 60.0% |
[ 1.5% - 2.0% ] 1.99% | 8,430 | 73.6% |
[ 2.0% - 2.5% ] 2.05% | 15,599 | 64.5% |
[ 2.0% - 2.5% ] 2.13% | 564 | 85.4% |
[ 2.0% - 2.5% ] 2.24% | 1,294 | 68.7% |
[ 2.0% - 2.5% ] 2.33% | 472 | 59.1% |
[ 2.0% - 2.5% ] 2.40% | 874 | 49.7% |
[ 2.0% - 2.5% ] 2.46% | 1,300 | 49.0% |
[ 2.5% - 3.0% ] 2.54% | 3,822 | 26.6% |
[ 2.5% - 3.0% ] 2.56% | 3,043 | 71.1% |
[ 2.5% - 3.0% ] 2.62% | 1,145 | 72.0% |
[ 2.5% - 3.0% ] 2.82% | 3,441 | 26.1% |
[ 2.5% - 3.0% ] 2.86% | 1,362 | 74.4% |
[ 3.0% - 3.5% ] 3.04% | 1,544 | 71.0% |
[ 3.0% - 3.5% ] 3.25% | 154 | 78.3% |
[ 3.0% - 3.5% ] 3.35% | 418 | 92.5% |
[ 3.5% - 4.0% ] 3.59% | 2,286 | 56.1% |
[ 3.5% - 4.0% ] 3.94% | 1,067 | 72.0% |
[ 4.0% - 4.5% ] 4.08% | 1,567 | 77.5% |
[ 4.0% - 4.5% ] 4.23% | 213 | 73.5% |
[ 4.5% - 5.0% ] 4.79% | 355 | 100.0% |
[ 5.0% - 5.5% ] 5.21% | 595 | 80.3% |
[ 5.5% - 6.0% ] 5.57% | 754 | 100.0% |
[ 5.5% - 6.0% ] 5.66% | 1,838 | 70.8% |
[ 5.5% - 6.0% ] 5.74% | 244 | 100.0% |
[ 5.5% - 6.0% ] 5.93% | 118 | 35.3% |
[ 6.0% - 6.5% ] 6.47% | 1,113 | 91.1% |
[ 7.5% - 8.0% ] 7.60% | 171 | 70.8% |
[ 7.5% - 8.0% ] 7.84% | 370 | 54.7% |