Austrian Male Disability
COMPARE
Austrian
Select to Compare
Male Disability
Austrian Male Disability
11.8%
DISABILITY | MALES
2.5/ 100
METRIC RATING
227th/ 347
METRIC RANK
Austrian Male Disability Correlation Chart
The statistical analysis conducted on geographies consisting of 452,033,599 people shows a moderate positive correlation between the proportion of Austrians and percentage of males with a disability in the United States with a correlation coefficient (R) of 0.406 and weighted average of 11.8%. On average, for every 1% (one percent) increase in Austrians within a typical geography, there is an increase of 0.49% in percentage of males with a disability.
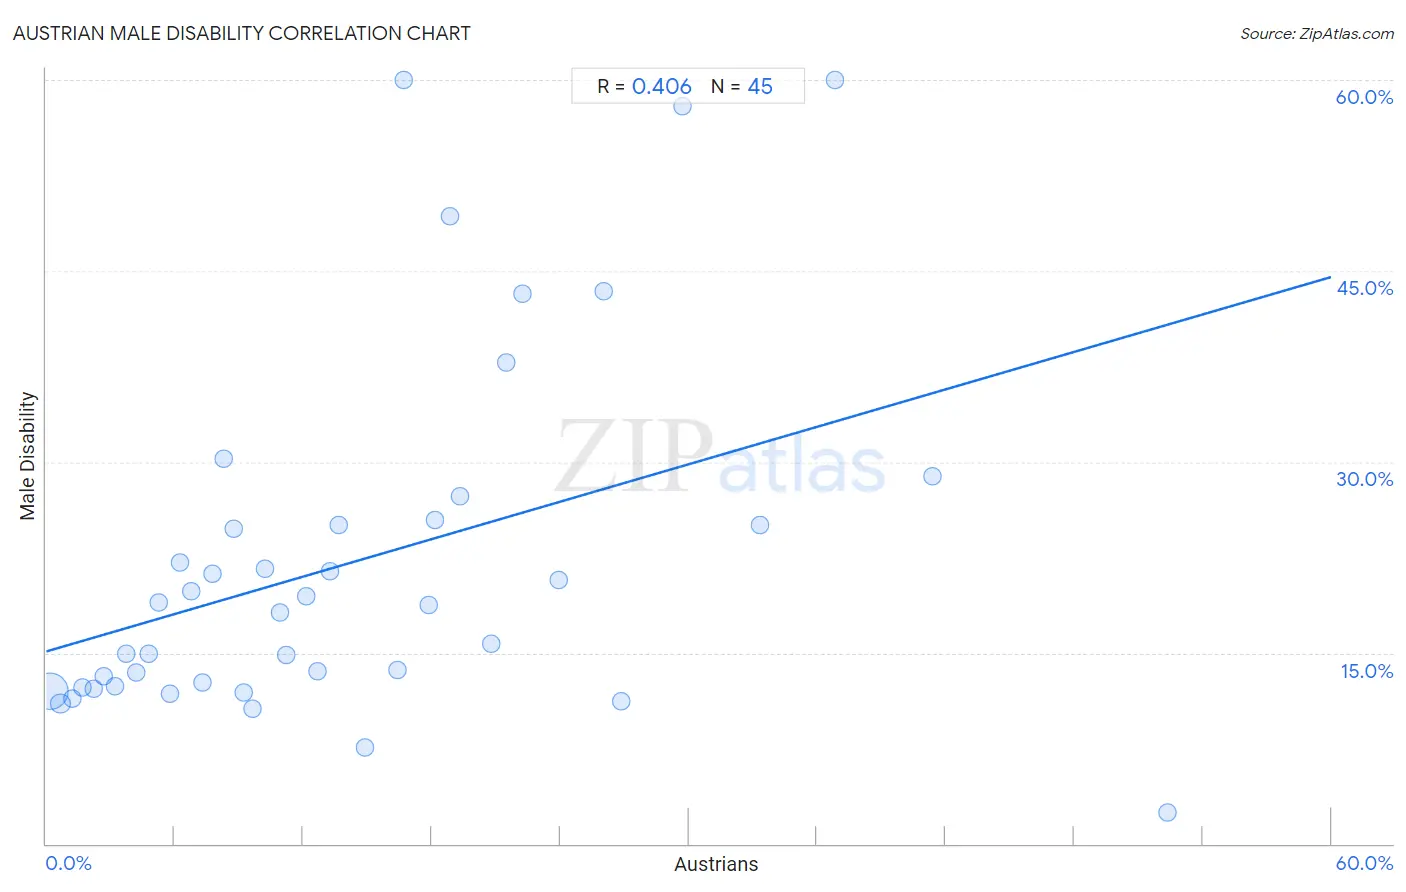
It is essential to understand that the correlation between the percentage of Austrians and percentage of males with a disability does not imply a direct cause-and-effect relationship. It remains uncertain whether the presence of Austrians influences an upward or downward trend in the level of percentage of males with a disability within an area, or if Austrians simply ended up residing in those areas with higher or lower levels of percentage of males with a disability due to other factors.
Demographics Similar to Austrians by Male Disability
In terms of male disability, the demographic groups most similar to Austrians are Hispanic or Latino (11.8%, a difference of 0.080%), Bermudan (11.8%, a difference of 0.11%), Subsaharan African (11.8%, a difference of 0.18%), Croatian (11.8%, a difference of 0.20%), and Liberian (11.8%, a difference of 0.30%).
| Demographics | Rating | Rank | Male Disability |
| Immigrants from Western Europe | 3.8 /100 | #220 | Tragic 11.7% |
| Immigrants from Congo | 3.7 /100 | #221 | Tragic 11.7% |
| Alsatians | 3.3 /100 | #222 | Tragic 11.7% |
| Immigrants from Bahamas | 3.2 /100 | #223 | Tragic 11.7% |
| Japanese | 3.1 /100 | #224 | Tragic 11.7% |
| Liberians | 3.1 /100 | #225 | Tragic 11.8% |
| Sub-Saharan Africans | 2.8 /100 | #226 | Tragic 11.8% |
| Austrians | 2.5 /100 | #227 | Tragic 11.8% |
| Hispanics or Latinos | 2.3 /100 | #228 | Tragic 11.8% |
| Bermudans | 2.3 /100 | #229 | Tragic 11.8% |
| Croatians | 2.1 /100 | #230 | Tragic 11.8% |
| Dominicans | 1.8 /100 | #231 | Tragic 11.8% |
| Malaysians | 1.8 /100 | #232 | Tragic 11.8% |
| Mexicans | 1.7 /100 | #233 | Tragic 11.8% |
| Immigrants from Canada | 1.6 /100 | #234 | Tragic 11.9% |
Austrian Male Disability Correlation Summary
| Measurement | Austrian Data | Male Disability Data |
| Minimum | 0.17% | 2.5% |
| Maximum | 52.3% | 60.0% |
| Range | 52.2% | 57.5% |
| Mean | 14.2% | 22.1% |
| Median | 11.2% | 18.8% |
| Interquartile 25% (IQ1) | 5.5% | 12.3% |
| Interquartile 75% (IQ3) | 20.1% | 25.2% |
| Interquartile Range (IQR) | 14.6% | 12.9% |
| Standard Deviation (Sample) | 11.6% | 13.9% |
| Standard Deviation (Population) | 11.4% | 13.8% |
Correlation Details
| Austrian Percentile | Sample Size | Male Disability |
[ 0.0% - 0.5% ] 0.17% | 406,531,320 | 11.9% |
[ 0.5% - 1.0% ] 0.67% | 36,561,995 | 11.0% |
[ 1.0% - 1.5% ] 1.20% | 6,161,685 | 11.4% |
[ 1.5% - 2.0% ] 1.70% | 1,577,353 | 12.3% |
[ 2.0% - 2.5% ] 2.20% | 471,883 | 12.2% |
[ 2.5% - 3.0% ] 2.70% | 272,388 | 13.1% |
[ 3.0% - 3.5% ] 3.20% | 142,898 | 12.3% |
[ 3.5% - 4.0% ] 3.71% | 107,719 | 14.9% |
[ 4.0% - 4.5% ] 4.18% | 73,997 | 13.4% |
[ 4.5% - 5.0% ] 4.79% | 27,486 | 15.0% |
[ 5.0% - 5.5% ] 5.23% | 18,941 | 18.9% |
[ 5.5% - 6.0% ] 5.77% | 12,235 | 11.8% |
[ 6.0% - 6.5% ] 6.26% | 13,875 | 22.1% |
[ 6.5% - 7.0% ] 6.75% | 7,420 | 19.8% |
[ 7.0% - 7.5% ] 7.28% | 10,681 | 12.7% |
[ 7.5% - 8.0% ] 7.79% | 7,330 | 21.2% |
[ 8.0% - 8.5% ] 8.27% | 1,294 | 30.2% |
[ 8.5% - 9.0% ] 8.78% | 3,418 | 24.8% |
[ 9.0% - 9.5% ] 9.25% | 1,438 | 11.9% |
[ 9.5% - 10.0% ] 9.63% | 4,322 | 10.6% |
[ 10.0% - 10.5% ] 10.20% | 3,842 | 21.6% |
[ 10.5% - 11.0% ] 10.89% | 3,765 | 18.2% |
[ 11.0% - 11.5% ] 11.19% | 1,171 | 14.8% |
[ 12.0% - 12.5% ] 12.15% | 749 | 19.5% |
[ 12.5% - 13.0% ] 12.68% | 5,993 | 13.5% |
[ 13.0% - 13.5% ] 13.28% | 580 | 21.4% |
[ 13.5% - 14.0% ] 13.68% | 117 | 25.0% |
[ 14.5% - 15.0% ] 14.86% | 1,198 | 7.6% |
[ 16.0% - 16.5% ] 16.41% | 2,395 | 13.7% |
[ 16.5% - 17.0% ] 16.67% | 12 | 60.0% |
[ 17.5% - 18.0% ] 17.88% | 179 | 18.8% |
[ 18.0% - 18.5% ] 18.14% | 397 | 25.5% |
[ 18.5% - 19.0% ] 18.83% | 377 | 49.3% |
[ 19.0% - 19.5% ] 19.31% | 378 | 27.3% |
[ 20.5% - 21.0% ] 20.81% | 620 | 15.7% |
[ 21.0% - 21.5% ] 21.50% | 107 | 37.8% |
[ 22.0% - 22.5% ] 22.22% | 72 | 43.2% |
[ 23.5% - 24.0% ] 23.95% | 526 | 20.8% |
[ 26.0% - 26.5% ] 26.04% | 192 | 43.4% |
[ 26.5% - 27.0% ] 26.84% | 652 | 11.2% |
[ 29.5% - 30.0% ] 29.70% | 101 | 57.9% |
[ 33.0% - 33.5% ] 33.33% | 108 | 25.0% |
[ 36.5% - 37.0% ] 36.84% | 19 | 60.0% |
[ 41.0% - 41.5% ] 41.40% | 285 | 28.9% |
[ 52.0% - 52.5% ] 52.33% | 86 | 2.5% |