Prospect, OR Map & Demographics
Prospect Map
Prospect Overview
$21,543
PER CAPITA INCOME
$49,231
AVG FAMILY INCOME
$40,357
AVG HOUSEHOLD INCOME
0.35
INEQUALITY / GINI INDEX
661
TOTAL POPULATION
328
MALE POPULATION
333
FEMALE POPULATION
98.50
MALES / 100 FEMALES
101.52
FEMALES / 100 MALES
53.3
MEDIAN AGE
2.9
AVG FAMILY SIZE
2.6
AVG HOUSEHOLD SIZE
184
LABOR FORCE [ PEOPLE ]
35.4%
PERCENT IN LABOR FORCE
2.2%
UNEMPLOYMENT RATE
Prospect Zip Codes
Prospect Area Codes
Income in Prospect
Income Overview in Prospect
Per Capita Income in Prospect is $21,543, while median incomes of families and households are $49,231 and $40,357 respectively.
| Characteristic | Number | Measure |
| Per Capita Income | 661 | $21,543 |
| Median Family Income | 200 | $49,231 |
| Mean Family Income | 200 | $61,893 |
| Median Household Income | 256 | $40,357 |
| Mean Household Income | 256 | $55,643 |
| Income Deficit | 200 | $0 |
| Wage / Income Gap (%) | 661 | 0.00% |
| Wage / Income Gap ($) | 661 | 100.00¢ per $1 |
| Gini / Inequality Index | 661 | 0.35 |
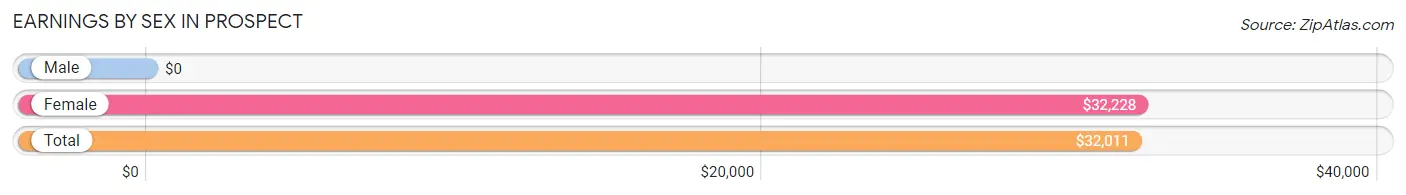
Earnings by Sex in Prospect
| Sex | Number | Average Earnings |
| Male | 96 (51.3%) | $0 |
| Female | 91 (48.7%) | $32,228 |
| Total | 187 (100.0%) | $32,011 |
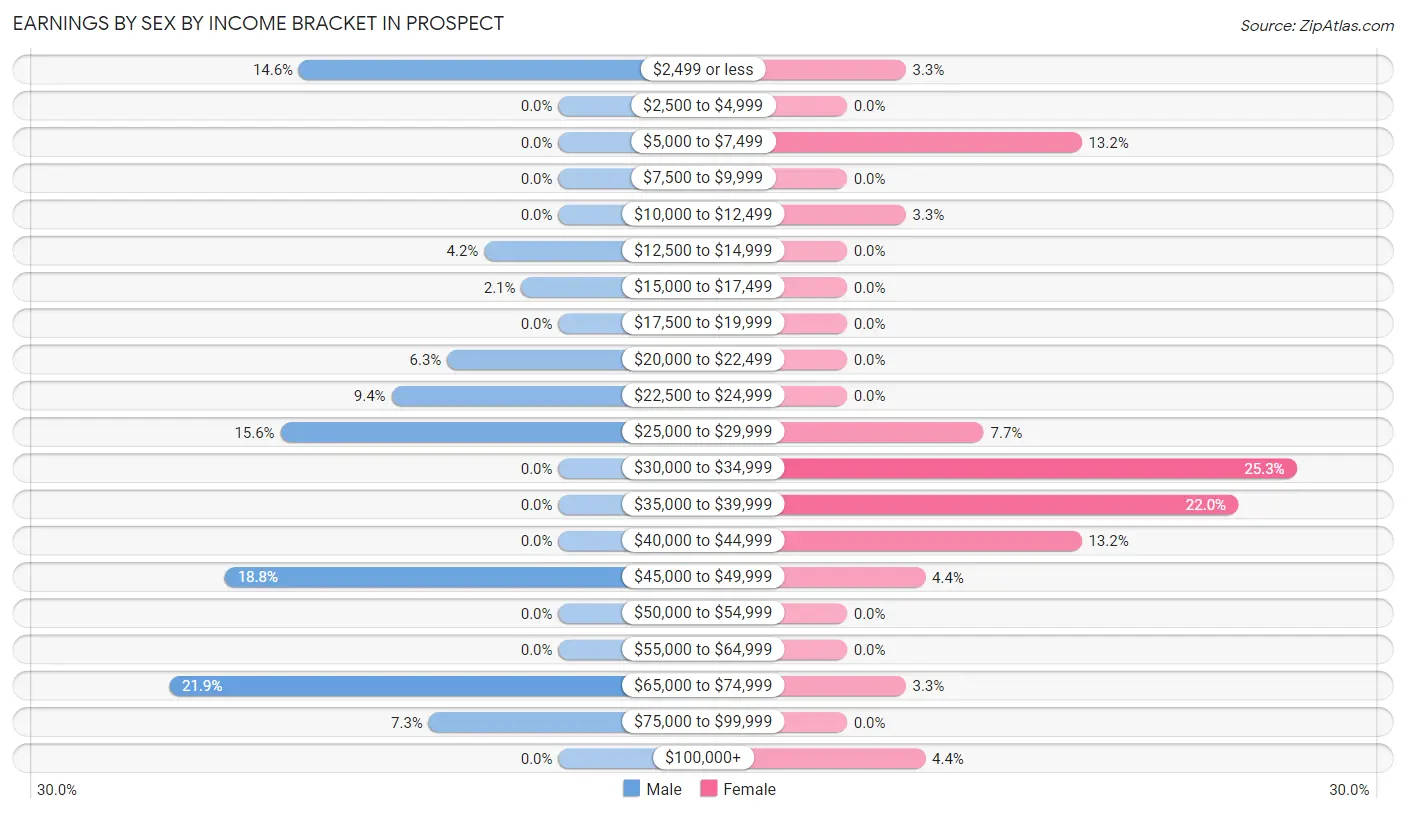
Earnings by Sex by Income Bracket in Prospect
The most common earnings brackets in Prospect are $65,000 to $74,999 for men (21 | 21.9%) and $30,000 to $34,999 for women (23 | 25.3%).
| Income | Male | Female |
| $2,499 or less | 14 (14.6%) | 3 (3.3%) |
| $2,500 to $4,999 | 0 (0.0%) | 0 (0.0%) |
| $5,000 to $7,499 | 0 (0.0%) | 12 (13.2%) |
| $7,500 to $9,999 | 0 (0.0%) | 0 (0.0%) |
| $10,000 to $12,499 | 0 (0.0%) | 3 (3.3%) |
| $12,500 to $14,999 | 4 (4.2%) | 0 (0.0%) |
| $15,000 to $17,499 | 2 (2.1%) | 0 (0.0%) |
| $17,500 to $19,999 | 0 (0.0%) | 0 (0.0%) |
| $20,000 to $22,499 | 6 (6.2%) | 0 (0.0%) |
| $22,500 to $24,999 | 9 (9.4%) | 0 (0.0%) |
| $25,000 to $29,999 | 15 (15.6%) | 7 (7.7%) |
| $30,000 to $34,999 | 0 (0.0%) | 23 (25.3%) |
| $35,000 to $39,999 | 0 (0.0%) | 20 (22.0%) |
| $40,000 to $44,999 | 0 (0.0%) | 12 (13.2%) |
| $45,000 to $49,999 | 18 (18.8%) | 4 (4.4%) |
| $50,000 to $54,999 | 0 (0.0%) | 0 (0.0%) |
| $55,000 to $64,999 | 0 (0.0%) | 0 (0.0%) |
| $65,000 to $74,999 | 21 (21.9%) | 3 (3.3%) |
| $75,000 to $99,999 | 7 (7.3%) | 0 (0.0%) |
| $100,000+ | 0 (0.0%) | 4 (4.4%) |
| Total | 96 (100.0%) | 91 (100.0%) |
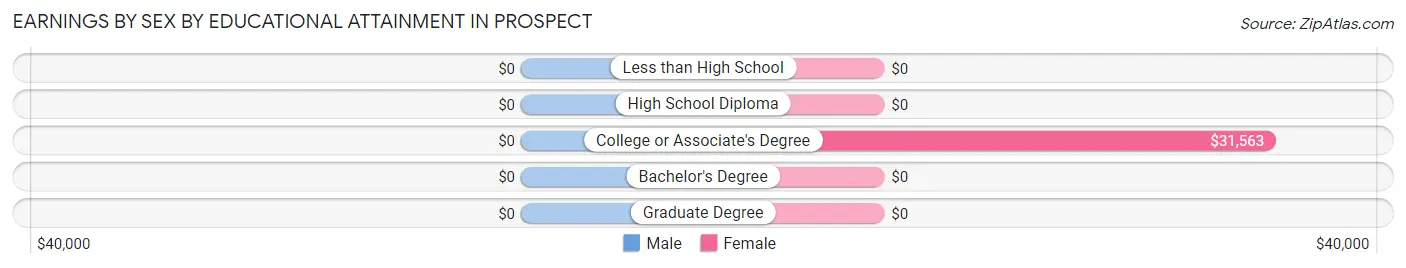
Earnings by Sex by Educational Attainment in Prospect
| Educational Attainment | Male Income | Female Income |
| Less than High School | - | - |
| High School Diploma | - | - |
| College or Associate's Degree | - | - |
| Bachelor's Degree | - | - |
| Graduate Degree | - | - |
| Total | - | - |
Family Income in Prospect
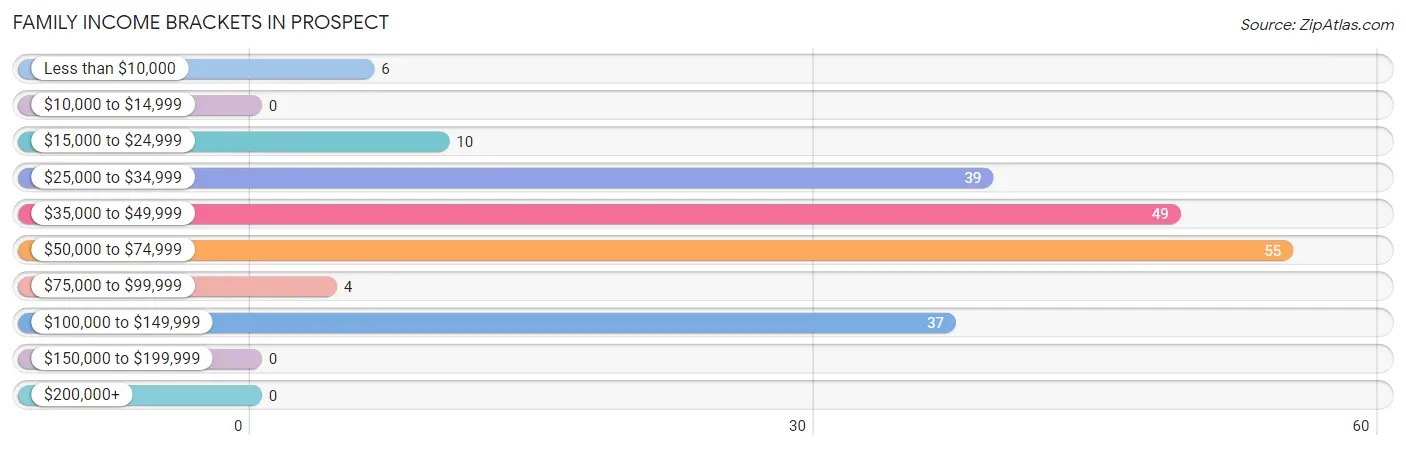
Family Income Brackets in Prospect
According to the Prospect family income data, there are 55 families falling into the $50,000 to $74,999 income range, which is the most common income bracket and makes up 27.5% of all families.
| Income Bracket | # Families | % Families |
| Less than $10,000 | 6 | 3.0% |
| $10,000 to $14,999 | 0 | 0.0% |
| $15,000 to $24,999 | 10 | 5.0% |
| $25,000 to $34,999 | 39 | 19.5% |
| $35,000 to $49,999 | 49 | 24.5% |
| $50,000 to $74,999 | 55 | 27.5% |
| $75,000 to $99,999 | 4 | 2.0% |
| $100,000 to $149,999 | 37 | 18.5% |
| $150,000 to $199,999 | 0 | 0.0% |
| $200,000+ | 0 | 0.0% |
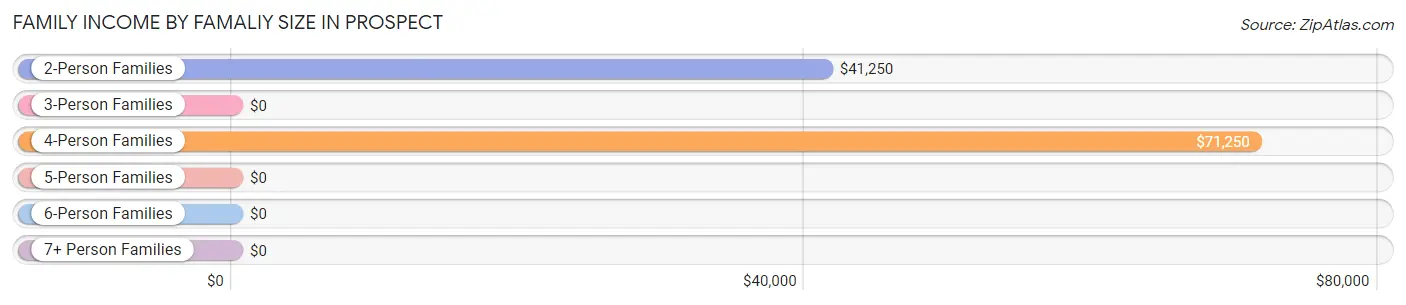
Family Income by Famaliy Size in Prospect
4-person families (28 | 14.0%) account for the highest median family income in Prospect with $71,250 per family, while 2-person families (126 | 63.0%) have the highest median income of $20,625 per family member.
| Income Bracket | # Families | Median Income |
| 2-Person Families | 126 (63.0%) | $41,250 |
| 3-Person Families | 18 (9.0%) | $0 |
| 4-Person Families | 28 (14.0%) | $71,250 |
| 5-Person Families | 23 (11.5%) | $0 |
| 6-Person Families | 5 (2.5%) | $0 |
| 7+ Person Families | 0 (0.0%) | $0 |
| Total | 200 (100.0%) | $49,231 |
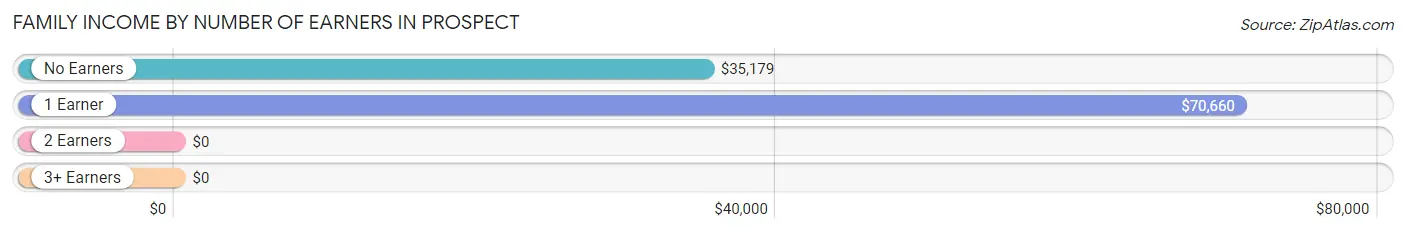
Family Income by Number of Earners in Prospect
| Number of Earners | # Families | Median Income |
| No Earners | 90 (45.0%) | $35,179 |
| 1 Earner | 59 (29.5%) | $70,660 |
| 2 Earners | 51 (25.5%) | $0 |
| 3+ Earners | 0 (0.0%) | $0 |
| Total | 200 (100.0%) | $49,231 |
Household Income in Prospect
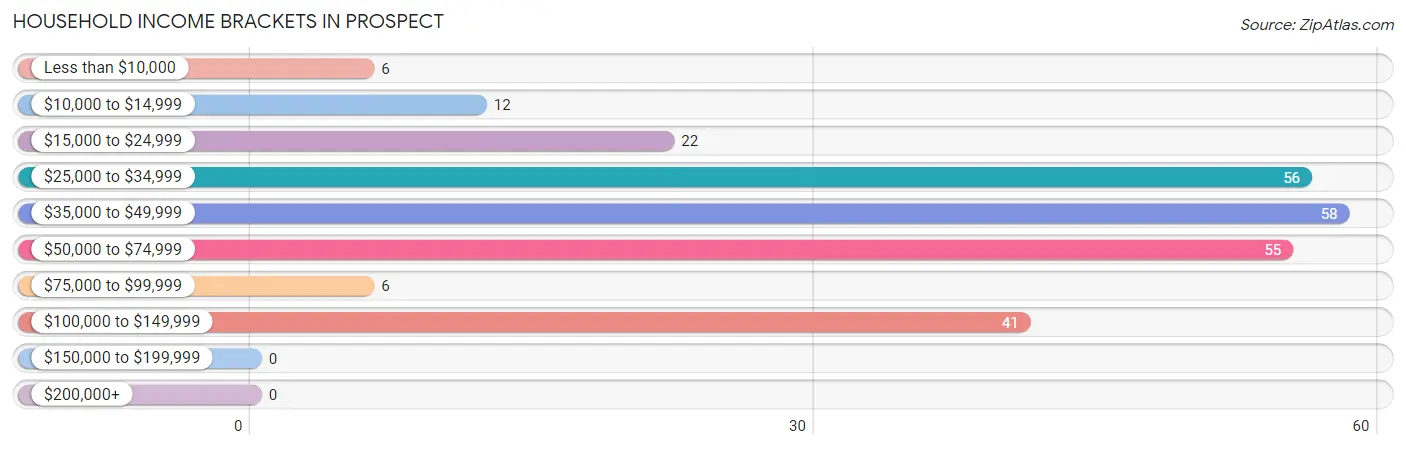
Household Income Brackets in Prospect
With 58 households falling in the category, the $35,000 to $49,999 income range is the most frequent in Prospect, accounting for 22.7% of all households.
| Income Bracket | # Households | % Households |
| Less than $10,000 | 6 | 2.3% |
| $10,000 to $14,999 | 12 | 4.7% |
| $15,000 to $24,999 | 22 | 8.6% |
| $25,000 to $34,999 | 56 | 21.9% |
| $35,000 to $49,999 | 58 | 22.7% |
| $50,000 to $74,999 | 55 | 21.5% |
| $75,000 to $99,999 | 6 | 2.3% |
| $100,000 to $149,999 | 41 | 16.0% |
| $150,000 to $199,999 | 0 | 0.0% |
| $200,000+ | 0 | 0.0% |
Household Income by Householder Age in Prospect
The median household income in Prospect is $40,357, with the highest median household income of $74,688 found in the 45 to 64 years age bracket for the primary householder. A total of 85 households (33.2%) fall into this category.
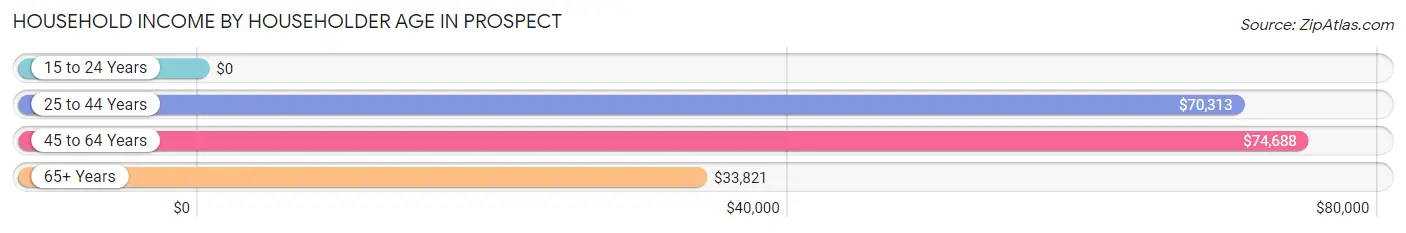
| Income Bracket | # Households | Median Income |
| 15 to 24 Years | 0 (0.0%) | $0 |
| 25 to 44 Years | 42 (16.4%) | $70,313 |
| 45 to 64 Years | 85 (33.2%) | $74,688 |
| 65+ Years | 129 (50.4%) | $33,821 |
| Total | 256 (100.0%) | $40,357 |
Poverty in Prospect
Income Below Poverty by Sex and Age in Prospect
With 11.0% poverty level for males and 13.0% for females among the residents of Prospect, 12 to 14 year old males and 16 and 17 year old females are the most vulnerable to poverty, with 4 males (100.0%) and 10 females (100.0%) in their respective age groups living below the poverty level.
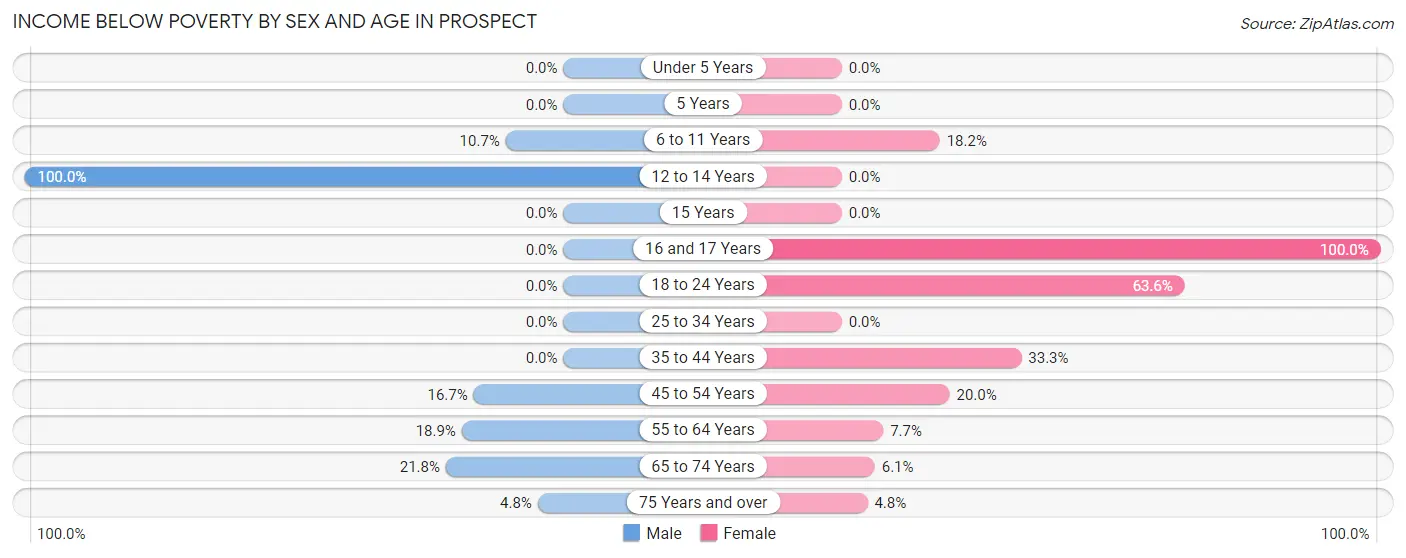
| Age Bracket | Male | Female |
| Under 5 Years | 0 (0.0%) | 0 (0.0%) |
| 5 Years | 0 (0.0%) | 0 (0.0%) |
| 6 to 11 Years | 3 (10.7%) | 8 (18.2%) |
| 12 to 14 Years | 4 (100.0%) | 0 (0.0%) |
| 15 Years | 0 (0.0%) | 0 (0.0%) |
| 16 and 17 Years | 0 (0.0%) | 10 (100.0%) |
| 18 to 24 Years | 0 (0.0%) | 7 (63.6%) |
| 25 to 34 Years | 0 (0.0%) | 0 (0.0%) |
| 35 to 44 Years | 0 (0.0%) | 3 (33.3%) |
| 45 to 54 Years | 4 (16.7%) | 6 (20.0%) |
| 55 to 64 Years | 10 (18.9%) | 3 (7.7%) |
| 65 to 74 Years | 12 (21.8%) | 3 (6.1%) |
| 75 Years and over | 3 (4.8%) | 3 (4.8%) |
| Total | 36 (11.0%) | 43 (13.0%) |
Income Above Poverty by Sex and Age in Prospect
According to the poverty statistics in Prospect, males aged under 5 years and females aged 12 to 14 years are the age groups that are most secure financially, with 100.0% of males and 100.0% of females in these age groups living above the poverty line.
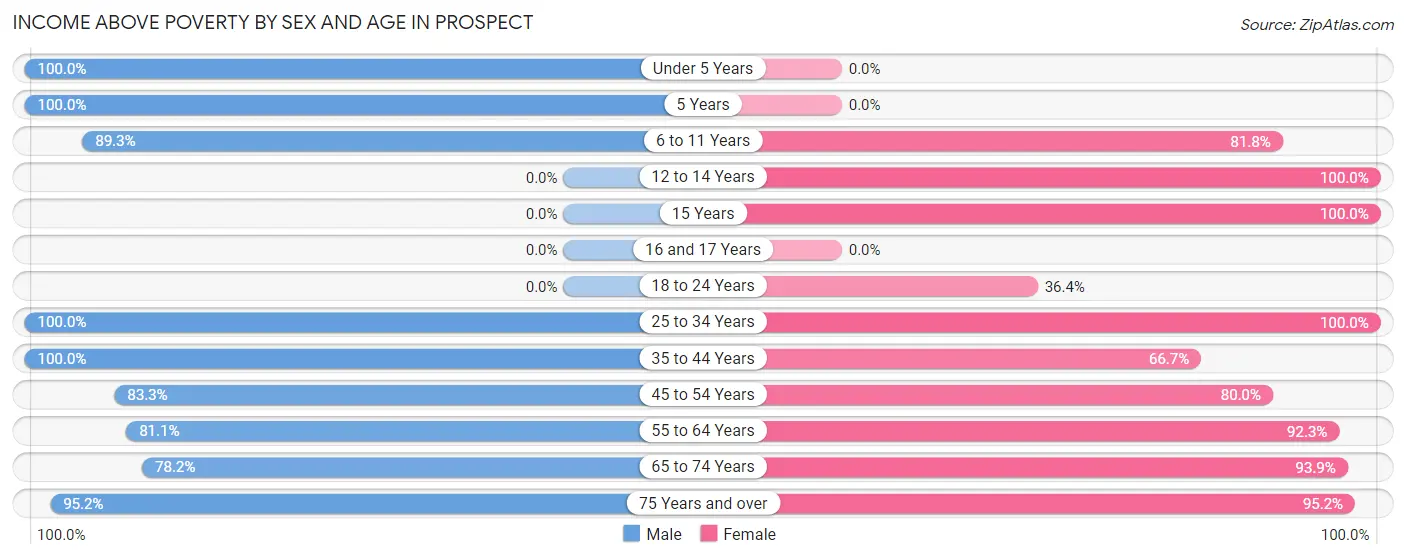
| Age Bracket | Male | Female |
| Under 5 Years | 22 (100.0%) | 0 (0.0%) |
| 5 Years | 22 (100.0%) | 0 (0.0%) |
| 6 to 11 Years | 25 (89.3%) | 36 (81.8%) |
| 12 to 14 Years | 0 (0.0%) | 15 (100.0%) |
| 15 Years | 0 (0.0%) | 3 (100.0%) |
| 16 and 17 Years | 0 (0.0%) | 0 (0.0%) |
| 18 to 24 Years | 0 (0.0%) | 4 (36.4%) |
| 25 to 34 Years | 2 (100.0%) | 57 (100.0%) |
| 35 to 44 Years | 55 (100.0%) | 6 (66.7%) |
| 45 to 54 Years | 20 (83.3%) | 24 (80.0%) |
| 55 to 64 Years | 43 (81.1%) | 36 (92.3%) |
| 65 to 74 Years | 43 (78.2%) | 46 (93.9%) |
| 75 Years and over | 60 (95.2%) | 60 (95.2%) |
| Total | 292 (89.0%) | 287 (87.0%) |
Income Below Poverty Among Married-Couple Families in Prospect
The poverty statistics for married-couple families in Prospect show that 1.9% or 3 of the total 157 families live below the poverty line. Families with 3 or 4 children have the highest poverty rate of 100.0%, comprising of 3 families. On the other hand, families with no children have the lowest poverty rate of 0.0%, which includes 0 families.
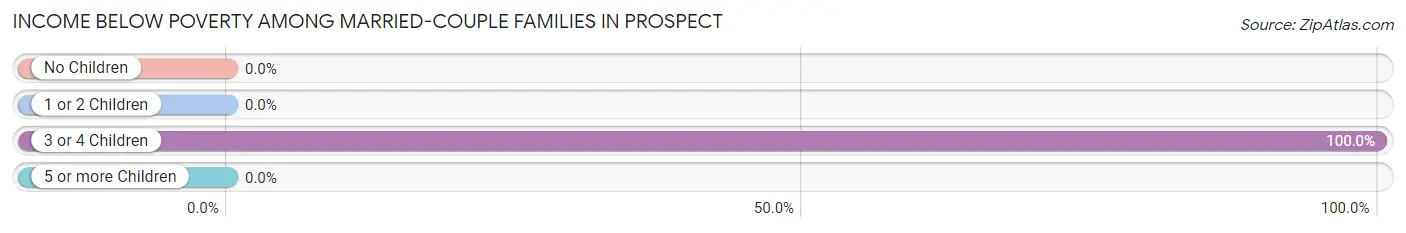
| Children | Above Poverty | Below Poverty |
| No Children | 111 (100.0%) | 0 (0.0%) |
| 1 or 2 Children | 43 (100.0%) | 0 (0.0%) |
| 3 or 4 Children | 0 (0.0%) | 3 (100.0%) |
| 5 or more Children | 0 (0.0%) | 0 (0.0%) |
| Total | 154 (98.1%) | 3 (1.9%) |
Income Below Poverty Among Single-Parent Households in Prospect
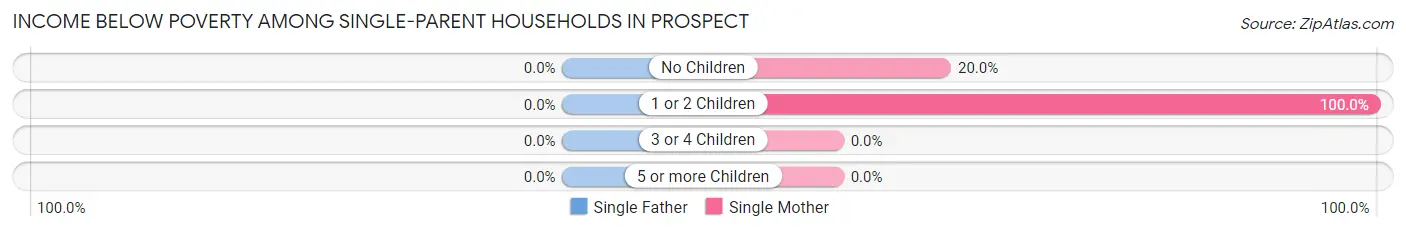
| Children | Single Father | Single Mother |
| No Children | 0 (0.0%) | 3 (20.0%) |
| 1 or 2 Children | 0 (0.0%) | 6 (100.0%) |
| 3 or 4 Children | 0 (0.0%) | 0 (0.0%) |
| 5 or more Children | 0 (0.0%) | 0 (0.0%) |
| Total | 0 (0.0%) | 9 (42.9%) |
Income Below Poverty Among Married-Couple vs Single-Parent Households in Prospect
The poverty data for Prospect shows that 3 of the married-couple family households (1.9%) and 9 of the single-parent households (20.9%) are living below the poverty level. Within the married-couple family households, those with 3 or 4 children have the highest poverty rate, with 3 households (100.0%) falling below the poverty line. Among the single-parent households, those with 1 or 2 children have the highest poverty rate, with 6 household (23.1%) living below poverty.
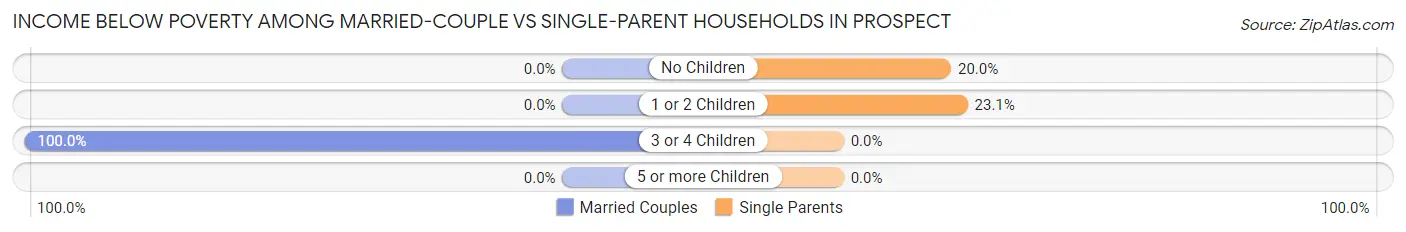
| Children | Married-Couple Families | Single-Parent Households |
| No Children | 0 (0.0%) | 3 (20.0%) |
| 1 or 2 Children | 0 (0.0%) | 6 (23.1%) |
| 3 or 4 Children | 3 (100.0%) | 0 (0.0%) |
| 5 or more Children | 0 (0.0%) | 0 (0.0%) |
| Total | 3 (1.9%) | 9 (20.9%) |
Race in Prospect
The most populous races in Prospect are White / Caucasian (471 | 71.3%), Two or more Races (154 | 23.3%), and Hispanic or Latino (35 | 5.3%).
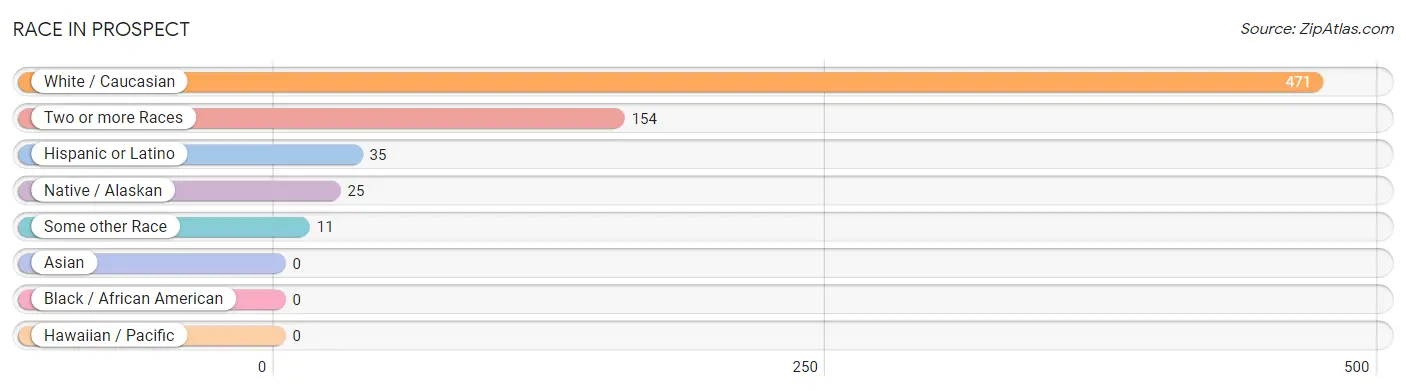
| Race | # Population | % Population |
| Asian | 0 | 0.0% |
| Black / African American | 0 | 0.0% |
| Hawaiian / Pacific | 0 | 0.0% |
| Hispanic or Latino | 35 | 5.3% |
| Native / Alaskan | 25 | 3.8% |
| White / Caucasian | 471 | 71.3% |
| Two or more Races | 154 | 23.3% |
| Some other Race | 11 | 1.7% |
| Total | 661 | 100.0% |
Ancestry in Prospect
The most populous ancestries reported in Prospect are English (162 | 24.5%), German (75 | 11.4%), Irish (42 | 6.4%), Dutch (34 | 5.1%), and Scottish (25 | 3.8%), together accounting for 51.1% of all Prospect residents.
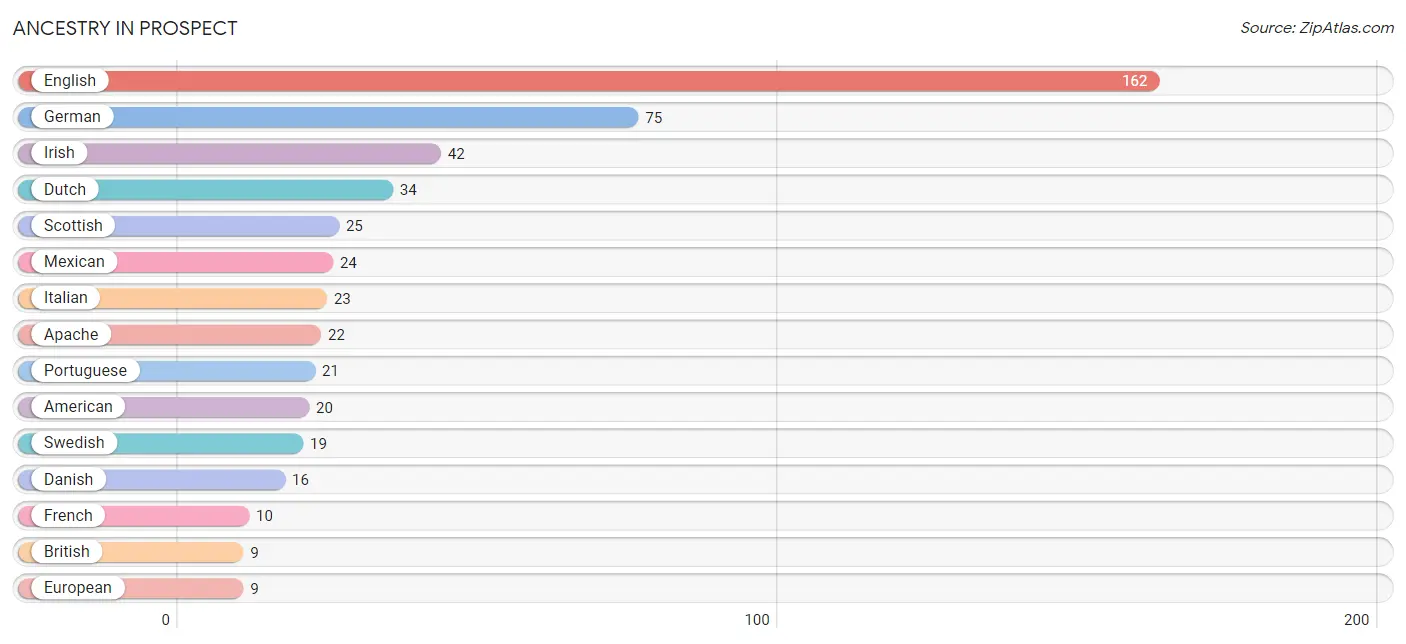
| Ancestry | # Population | % Population |
| American | 20 | 3.0% |
| Apache | 22 | 3.3% |
| British | 9 | 1.4% |
| Danish | 16 | 2.4% |
| Dutch | 34 | 5.1% |
| English | 162 | 24.5% |
| European | 9 | 1.4% |
| Finnish | 4 | 0.6% |
| French | 10 | 1.5% |
| German | 75 | 11.4% |
| Greek | 3 | 0.4% |
| Irish | 42 | 6.4% |
| Italian | 23 | 3.5% |
| Mexican | 24 | 3.6% |
| Norwegian | 6 | 0.9% |
| Portuguese | 21 | 3.2% |
| Scottish | 25 | 3.8% |
| Sioux | 1 | 0.2% |
| Slavic | 8 | 1.2% |
| Swedish | 19 | 2.9% |
| Welsh | 3 | 0.4% | View All 21 Rows |
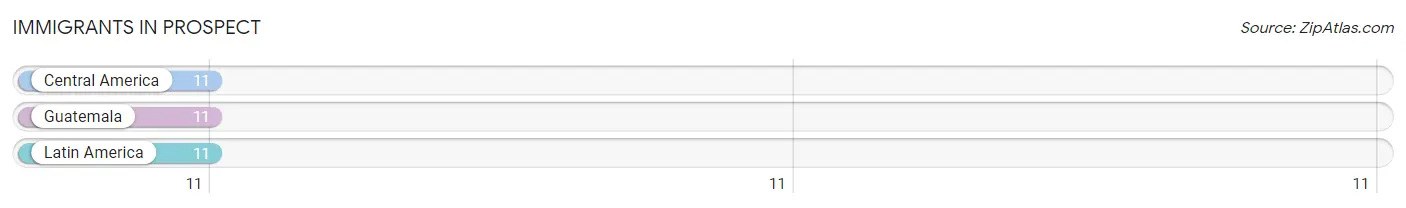
Immigrants in Prospect
The most numerous immigrant groups reported in Prospect came from Central America (11 | 1.7%), Guatemala (11 | 1.7%), and Latin America (11 | 1.7%), together accounting for 5.0% of all Prospect residents.
| Immigration Origin | # Population | % Population |
| Central America | 11 | 1.7% |
| Guatemala | 11 | 1.7% |
| Latin America | 11 | 1.7% | View All 3 Rows |
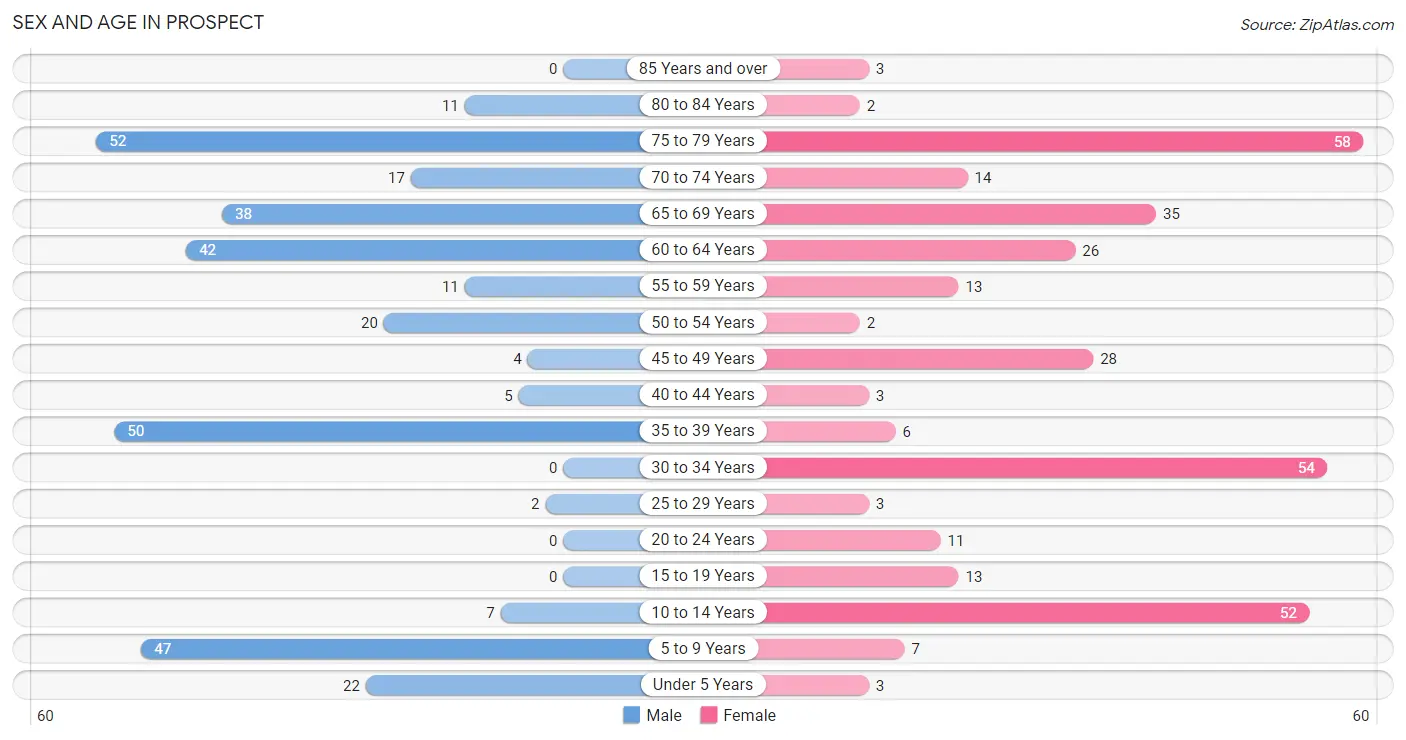
Sex and Age in Prospect
Sex and Age in Prospect
The most populous age groups in Prospect are 75 to 79 Years (52 | 15.9%) for men and 75 to 79 Years (58 | 17.4%) for women.
| Age Bracket | Male | Female |
| Under 5 Years | 22 (6.7%) | 3 (0.9%) |
| 5 to 9 Years | 47 (14.3%) | 7 (2.1%) |
| 10 to 14 Years | 7 (2.1%) | 52 (15.6%) |
| 15 to 19 Years | 0 (0.0%) | 13 (3.9%) |
| 20 to 24 Years | 0 (0.0%) | 11 (3.3%) |
| 25 to 29 Years | 2 (0.6%) | 3 (0.9%) |
| 30 to 34 Years | 0 (0.0%) | 54 (16.2%) |
| 35 to 39 Years | 50 (15.2%) | 6 (1.8%) |
| 40 to 44 Years | 5 (1.5%) | 3 (0.9%) |
| 45 to 49 Years | 4 (1.2%) | 28 (8.4%) |
| 50 to 54 Years | 20 (6.1%) | 2 (0.6%) |
| 55 to 59 Years | 11 (3.4%) | 13 (3.9%) |
| 60 to 64 Years | 42 (12.8%) | 26 (7.8%) |
| 65 to 69 Years | 38 (11.6%) | 35 (10.5%) |
| 70 to 74 Years | 17 (5.2%) | 14 (4.2%) |
| 75 to 79 Years | 52 (15.9%) | 58 (17.4%) |
| 80 to 84 Years | 11 (3.4%) | 2 (0.6%) |
| 85 Years and over | 0 (0.0%) | 3 (0.9%) |
| Total | 328 (100.0%) | 333 (100.0%) |
Families and Households in Prospect
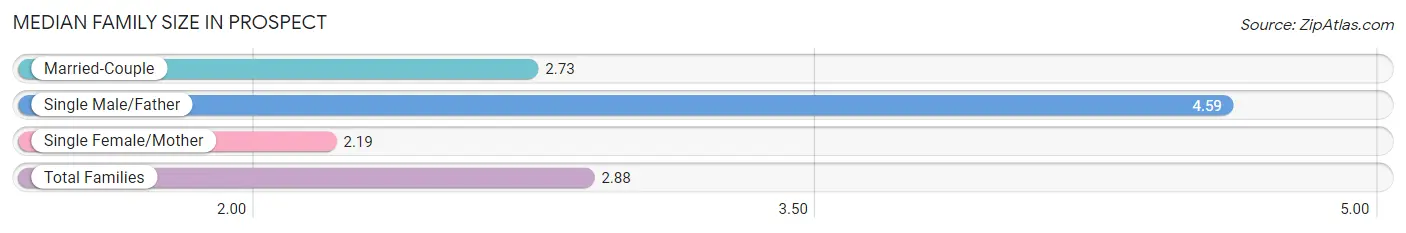
Median Family Size in Prospect
The median family size in Prospect is 2.88 persons per family, with single male/father families (22 | 11.0%) accounting for the largest median family size of 4.59 persons per family. On the other hand, single female/mother families (21 | 10.5%) represent the smallest median family size with 2.19 persons per family.
| Family Type | # Families | Family Size |
| Married-Couple | 157 (78.5%) | 2.73 |
| Single Male/Father | 22 (11.0%) | 4.59 |
| Single Female/Mother | 21 (10.5%) | 2.19 |
| Total Families | 200 (100.0%) | 2.88 |
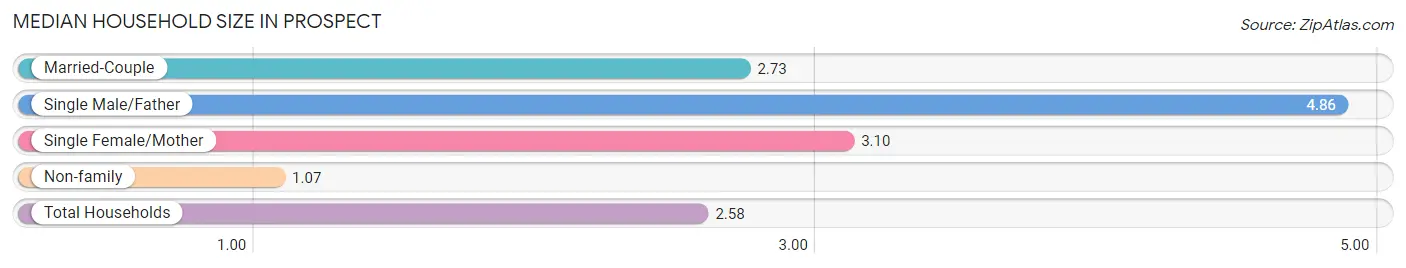
Median Household Size in Prospect
The median household size in Prospect is 2.58 persons per household, with single male/father households (22 | 8.6%) accounting for the largest median household size of 4.86 persons per household. non-family households (56 | 21.9%) represent the smallest median household size with 1.07 persons per household.
| Household Type | # Households | Household Size |
| Married-Couple | 157 (61.3%) | 2.73 |
| Single Male/Father | 22 (8.6%) | 4.86 |
| Single Female/Mother | 21 (8.2%) | 3.10 |
| Non-family | 56 (21.9%) | 1.07 |
| Total Households | 256 (100.0%) | 2.58 |
Household Size by Marriage Status in Prospect
Out of a total of 256 households in Prospect, 200 (78.1%) are family households, while 56 (21.9%) are nonfamily households. The most numerous type of family households are 2-person households, comprising 126, and the most common type of nonfamily households are 1-person households, comprising 52.
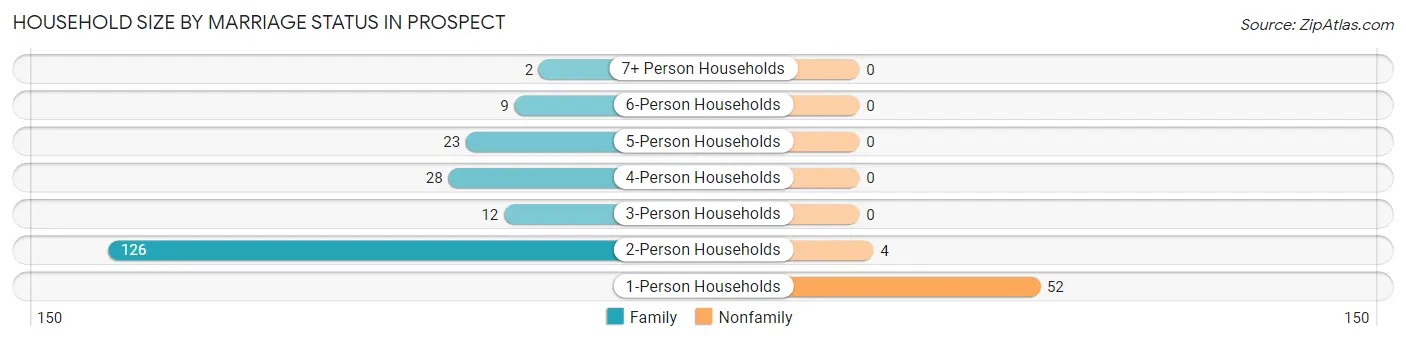
| Household Size | Family Households | Nonfamily Households |
| 1-Person Households | - | 52 (20.3%) |
| 2-Person Households | 126 (49.2%) | 4 (1.6%) |
| 3-Person Households | 12 (4.7%) | 0 (0.0%) |
| 4-Person Households | 28 (10.9%) | 0 (0.0%) |
| 5-Person Households | 23 (9.0%) | 0 (0.0%) |
| 6-Person Households | 9 (3.5%) | 0 (0.0%) |
| 7+ Person Households | 2 (0.8%) | 0 (0.0%) |
| Total | 200 (78.1%) | 56 (21.9%) |
Female Fertility in Prospect
Fertility by Age in Prospect
Average fertility rate in Prospect is 25.0 births per 1,000 women. Women in the age bracket of 20 to 34 years have the highest fertility rate with 44.0 births per 1,000 women. Women in the age bracket of 20 to 34 years acount for 100.0% of all women with births.
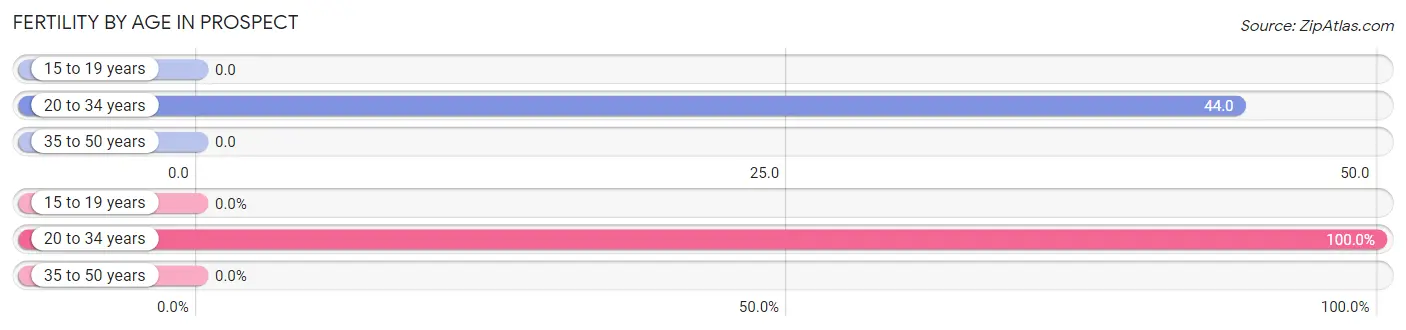
| Age Bracket | Women with Births | Births / 1,000 Women |
| 15 to 19 years | 0 (0.0%) | 0.0 |
| 20 to 34 years | 3 (100.0%) | 44.0 |
| 35 to 50 years | 0 (0.0%) | 0.0 |
| Total | 3 (100.0%) | 25.0 |
Fertility by Age by Marriage Status in Prospect
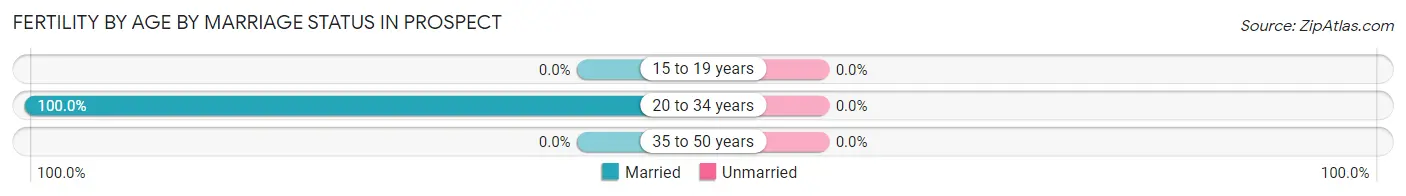
| Age Bracket | Married | Unmarried |
| 15 to 19 years | 0 (0.0%) | 0 (0.0%) |
| 20 to 34 years | 3 (100.0%) | 0 (0.0%) |
| 35 to 50 years | 0 (0.0%) | 0 (0.0%) |
| Total | 3 (100.0%) | 0 (0.0%) |
Fertility by Education in Prospect
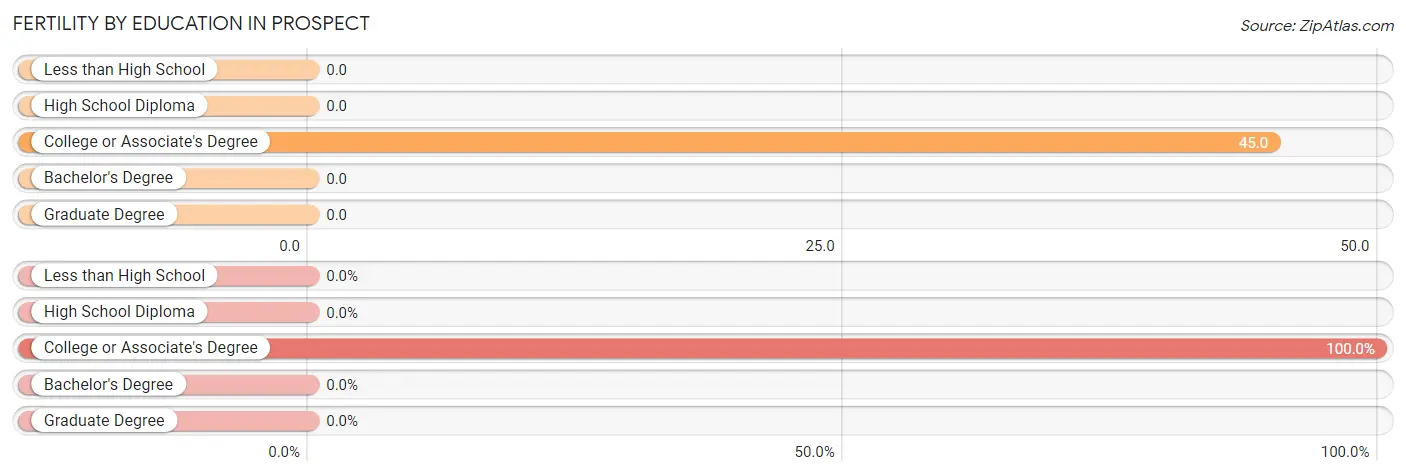
| Educational Attainment | Women with Births | Births / 1,000 Women |
| Less than High School | 0 (0.0%) | 0.0 |
| High School Diploma | 0 (0.0%) | 0.0 |
| College or Associate's Degree | 3 (100.0%) | 45.0 |
| Bachelor's Degree | 0 (0.0%) | 0.0 |
| Graduate Degree | 0 (0.0%) | 0.0 |
| Total | 3 (100.0%) | 25.0 |
Fertility by Education by Marriage Status in Prospect
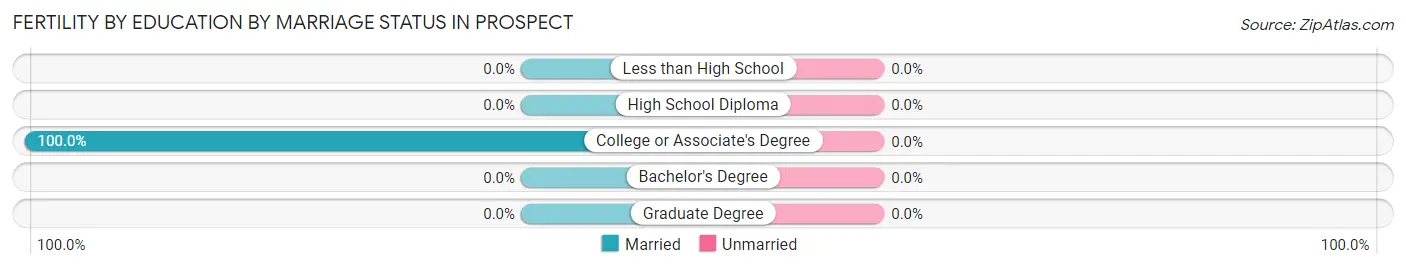
| Educational Attainment | Married | Unmarried |
| Less than High School | 0 (0.0%) | 0 (0.0%) |
| High School Diploma | 0 (0.0%) | 0 (0.0%) |
| College or Associate's Degree | 3 (100.0%) | 0 (0.0%) |
| Bachelor's Degree | 0 (0.0%) | 0 (0.0%) |
| Graduate Degree | 0 (0.0%) | 0 (0.0%) |
| Total | 3 (100.0%) | 0 (0.0%) |
Employment Characteristics in Prospect
Employment by Class of Employer in Prospect
Among the 180 employed individuals in Prospect, private company employees (99 | 55.0%), not-for-profit organizations (45 | 25.0%), and self-employed (not incorporated) (25 | 13.9%) make up the most common classes of employment.
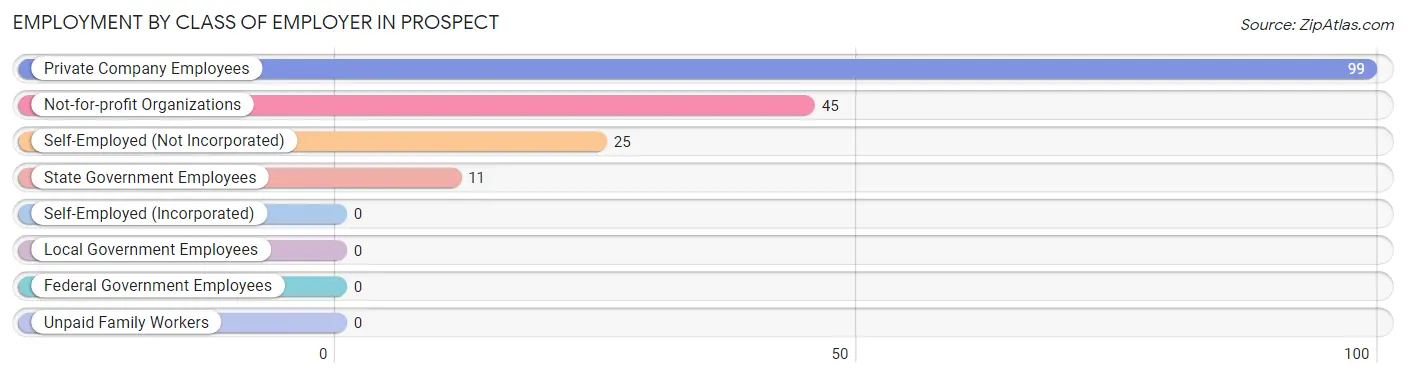
| Employer Class | # Employees | % Employees |
| Private Company Employees | 99 | 55.0% |
| Self-Employed (Incorporated) | 0 | 0.0% |
| Self-Employed (Not Incorporated) | 25 | 13.9% |
| Not-for-profit Organizations | 45 | 25.0% |
| Local Government Employees | 0 | 0.0% |
| State Government Employees | 11 | 6.1% |
| Federal Government Employees | 0 | 0.0% |
| Unpaid Family Workers | 0 | 0.0% |
| Total | 180 | 100.0% |
Employment Status by Age in Prospect
According to the labor force statistics for Prospect, out of the total population over 16 years of age (520), 35.4% or 184 individuals are in the labor force, with 2.2% or 4 of them unemployed. The age group with the highest labor force participation rate is 45 to 54 years, with 96.3% or 52 individuals in the labor force. Within the labor force, the 20 to 24 years age range has the highest percentage of unemployed individuals, with 100.0% or 4 of them being unemployed.
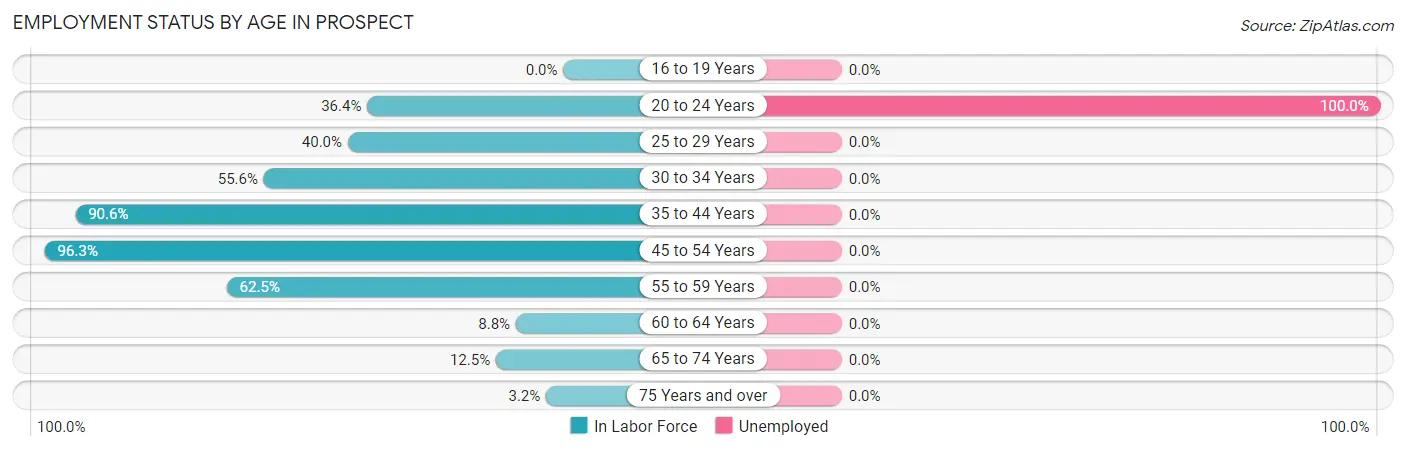
| Age Bracket | In Labor Force | Unemployed |
| 16 to 19 Years | 0 (0.0%) | 0 (0.0%) |
| 20 to 24 Years | 4 (36.4%) | 4 (100.0%) |
| 25 to 29 Years | 2 (40.0%) | 0 (0.0%) |
| 30 to 34 Years | 30 (55.6%) | 0 (0.0%) |
| 35 to 44 Years | 58 (90.6%) | 0 (0.0%) |
| 45 to 54 Years | 52 (96.3%) | 0 (0.0%) |
| 55 to 59 Years | 15 (62.5%) | 0 (0.0%) |
| 60 to 64 Years | 6 (8.8%) | 0 (0.0%) |
| 65 to 74 Years | 13 (12.5%) | 0 (0.0%) |
| 75 Years and over | 4 (3.2%) | 0 (0.0%) |
| Total | 184 (35.4%) | 4 (2.2%) |
Employment Status by Educational Attainment in Prospect
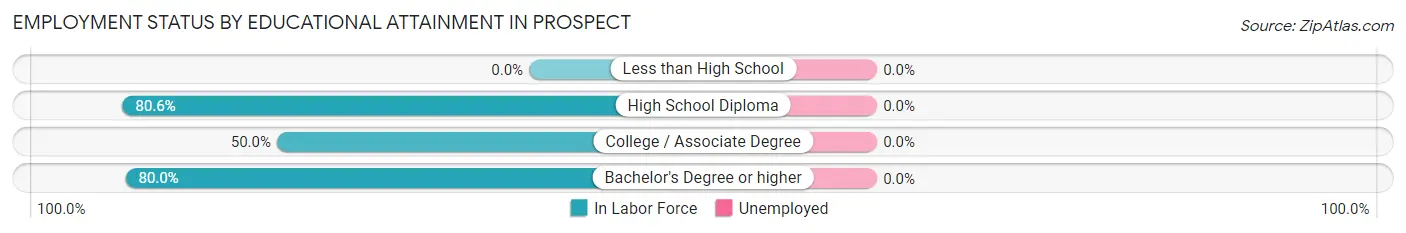
| Educational Attainment | In Labor Force | Unemployed |
| Less than High School | 0 (0.0%) | 0 (0.0%) |
| High School Diploma | 58 (80.6%) | 0 (0.0%) |
| College / Associate Degree | 77 (50.0%) | 0 (0.0%) |
| Bachelor's Degree or higher | 28 (80.0%) | 0 (0.0%) |
| Total | 163 (60.6%) | 0 (0.0%) |
Employment Occupations by Sex in Prospect
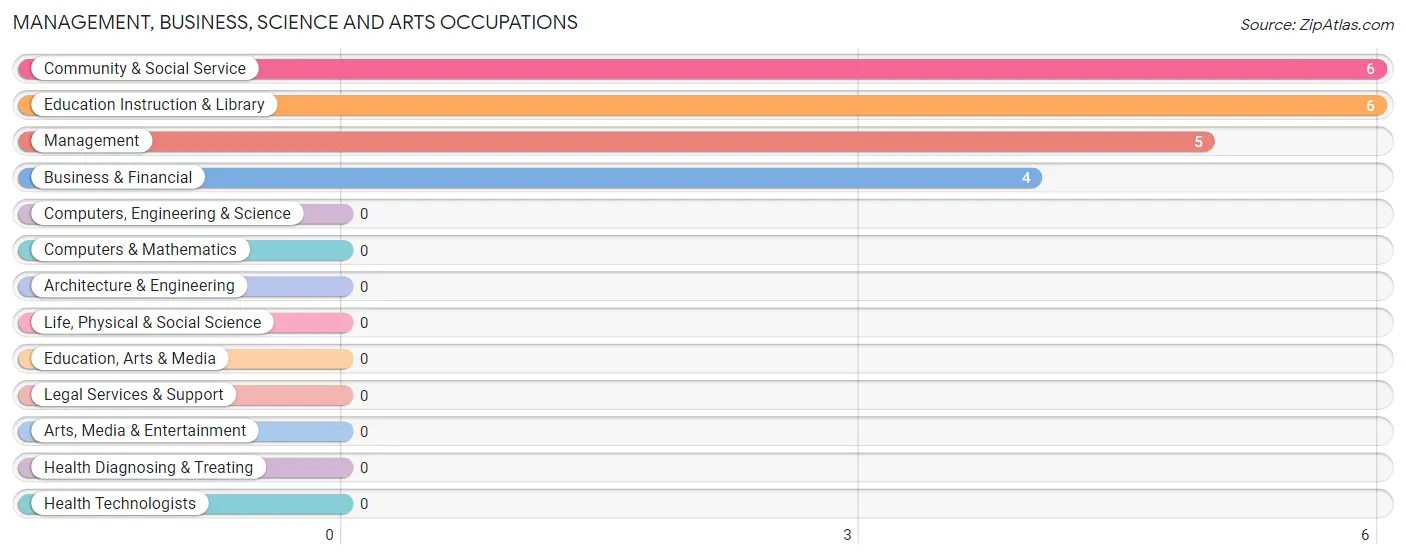
Management, Business, Science and Arts Occupations
The most common Management, Business, Science and Arts occupations in Prospect are Community & Social Service (6 | 3.3%), Education Instruction & Library (6 | 3.3%), Management (5 | 2.8%), and Business & Financial (4 | 2.2%).
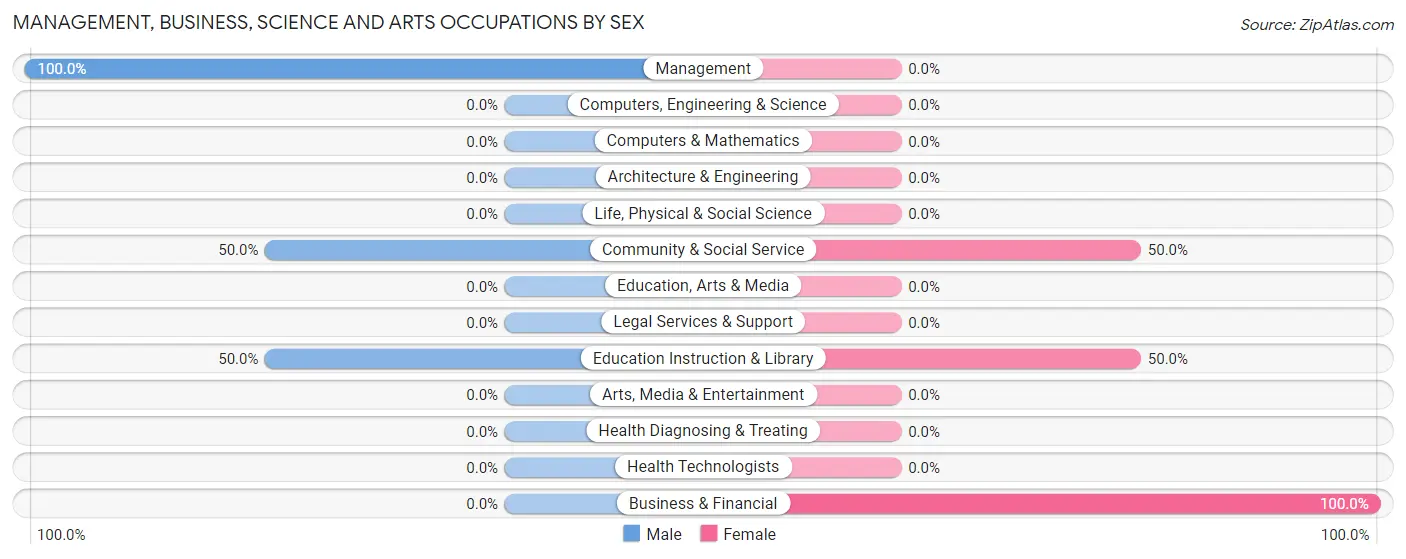
Management, Business, Science and Arts Occupations by Sex
Within the Management, Business, Science and Arts occupations in Prospect, the most male-oriented occupations are Management (100.0%), Community & Social Service (50.0%), and Education Instruction & Library (50.0%), while the most female-oriented occupations are Business & Financial (100.0%), Community & Social Service (50.0%), and Education Instruction & Library (50.0%).
| Occupation | Male | Female |
| Management | 5 (100.0%) | 0 (0.0%) |
| Business & Financial | 0 (0.0%) | 4 (100.0%) |
| Computers, Engineering & Science | 0 (0.0%) | 0 (0.0%) |
| Computers & Mathematics | 0 (0.0%) | 0 (0.0%) |
| Architecture & Engineering | 0 (0.0%) | 0 (0.0%) |
| Life, Physical & Social Science | 0 (0.0%) | 0 (0.0%) |
| Community & Social Service | 3 (50.0%) | 3 (50.0%) |
| Education, Arts & Media | 0 (0.0%) | 0 (0.0%) |
| Legal Services & Support | 0 (0.0%) | 0 (0.0%) |
| Education Instruction & Library | 3 (50.0%) | 3 (50.0%) |
| Arts, Media & Entertainment | 0 (0.0%) | 0 (0.0%) |
| Health Diagnosing & Treating | 0 (0.0%) | 0 (0.0%) |
| Health Technologists | 0 (0.0%) | 0 (0.0%) |
| Total (Category) | 8 (53.3%) | 7 (46.7%) |
| Total (Overall) | 92 (51.1%) | 88 (48.9%) |
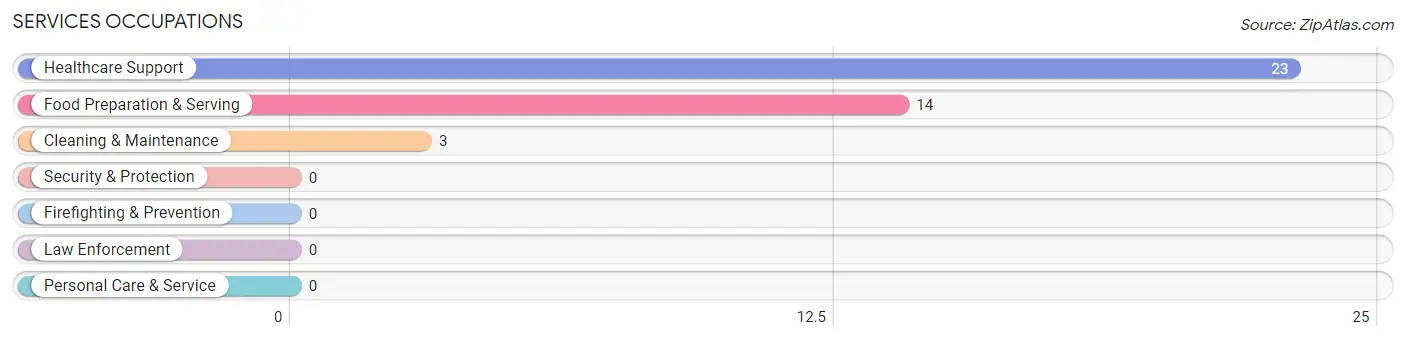
Services Occupations
The most common Services occupations in Prospect are Healthcare Support (23 | 12.8%), Food Preparation & Serving (14 | 7.8%), and Cleaning & Maintenance (3 | 1.7%).
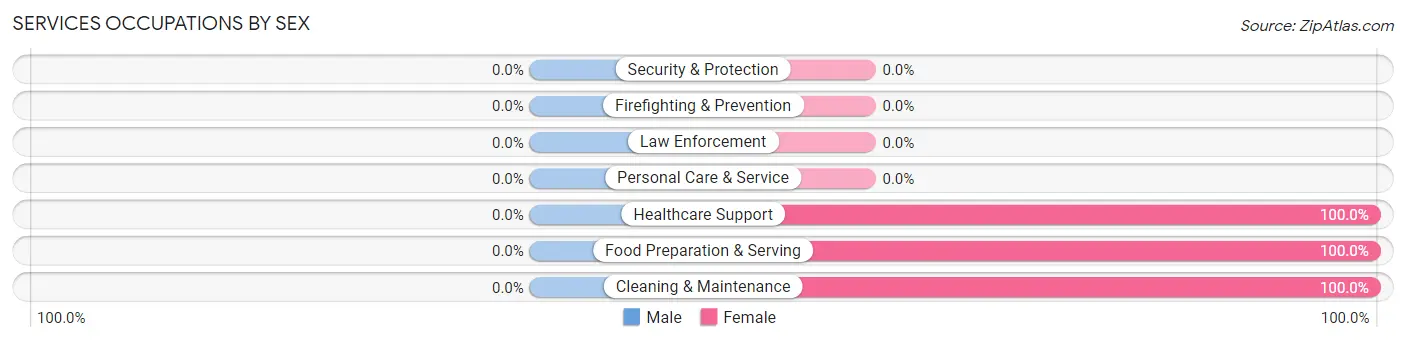
Services Occupations by Sex
| Occupation | Male | Female |
| Healthcare Support | 0 (0.0%) | 23 (100.0%) |
| Security & Protection | 0 (0.0%) | 0 (0.0%) |
| Firefighting & Prevention | 0 (0.0%) | 0 (0.0%) |
| Law Enforcement | 0 (0.0%) | 0 (0.0%) |
| Food Preparation & Serving | 0 (0.0%) | 14 (100.0%) |
| Cleaning & Maintenance | 0 (0.0%) | 3 (100.0%) |
| Personal Care & Service | 0 (0.0%) | 0 (0.0%) |
| Total (Category) | 0 (0.0%) | 40 (100.0%) |
| Total (Overall) | 92 (51.1%) | 88 (48.9%) |
Sales and Office Occupations
The most common Sales and Office occupations in Prospect are Sales & Related (46 | 25.6%), and Office & Administration (6 | 3.3%).
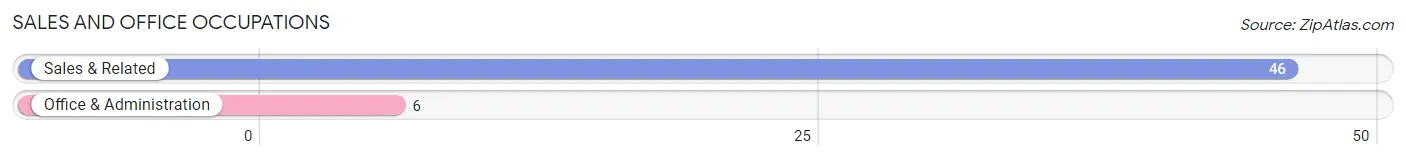
Sales and Office Occupations by Sex
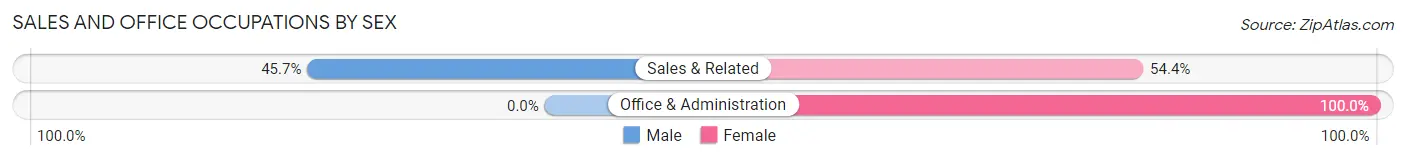
| Occupation | Male | Female |
| Sales & Related | 21 (45.7%) | 25 (54.3%) |
| Office & Administration | 0 (0.0%) | 6 (100.0%) |
| Total (Category) | 21 (40.4%) | 31 (59.6%) |
| Total (Overall) | 92 (51.1%) | 88 (48.9%) |
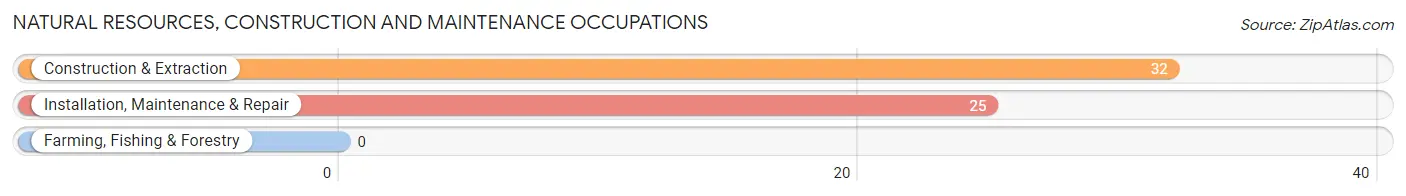
Natural Resources, Construction and Maintenance Occupations
The most common Natural Resources, Construction and Maintenance occupations in Prospect are Construction & Extraction (32 | 17.8%), and Installation, Maintenance & Repair (25 | 13.9%).
Natural Resources, Construction and Maintenance Occupations by Sex
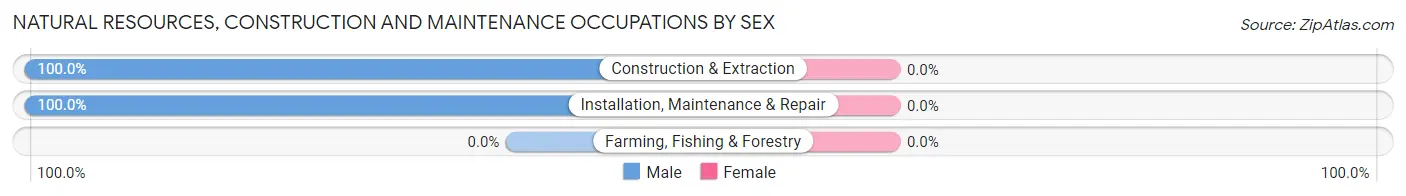
| Occupation | Male | Female |
| Farming, Fishing & Forestry | 0 (0.0%) | 0 (0.0%) |
| Construction & Extraction | 32 (100.0%) | 0 (0.0%) |
| Installation, Maintenance & Repair | 25 (100.0%) | 0 (0.0%) |
| Total (Category) | 57 (100.0%) | 0 (0.0%) |
| Total (Overall) | 92 (51.1%) | 88 (48.9%) |
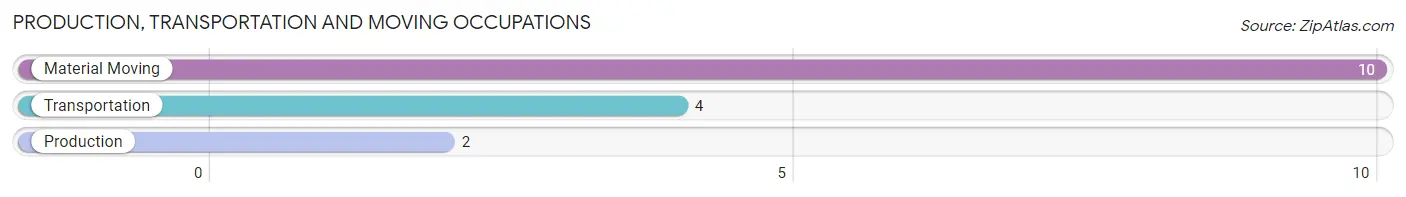
Production, Transportation and Moving Occupations
The most common Production, Transportation and Moving occupations in Prospect are Material Moving (10 | 5.6%), Transportation (4 | 2.2%), and Production (2 | 1.1%).
Production, Transportation and Moving Occupations by Sex
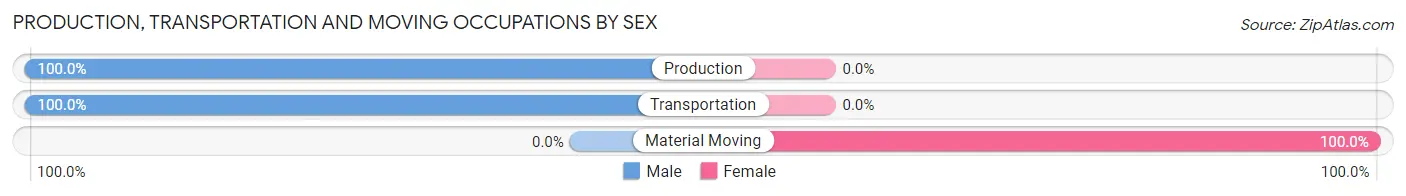
| Occupation | Male | Female |
| Production | 2 (100.0%) | 0 (0.0%) |
| Transportation | 4 (100.0%) | 0 (0.0%) |
| Material Moving | 0 (0.0%) | 10 (100.0%) |
| Total (Category) | 6 (37.5%) | 10 (62.5%) |
| Total (Overall) | 92 (51.1%) | 88 (48.9%) |
Employment Industries by Sex in Prospect
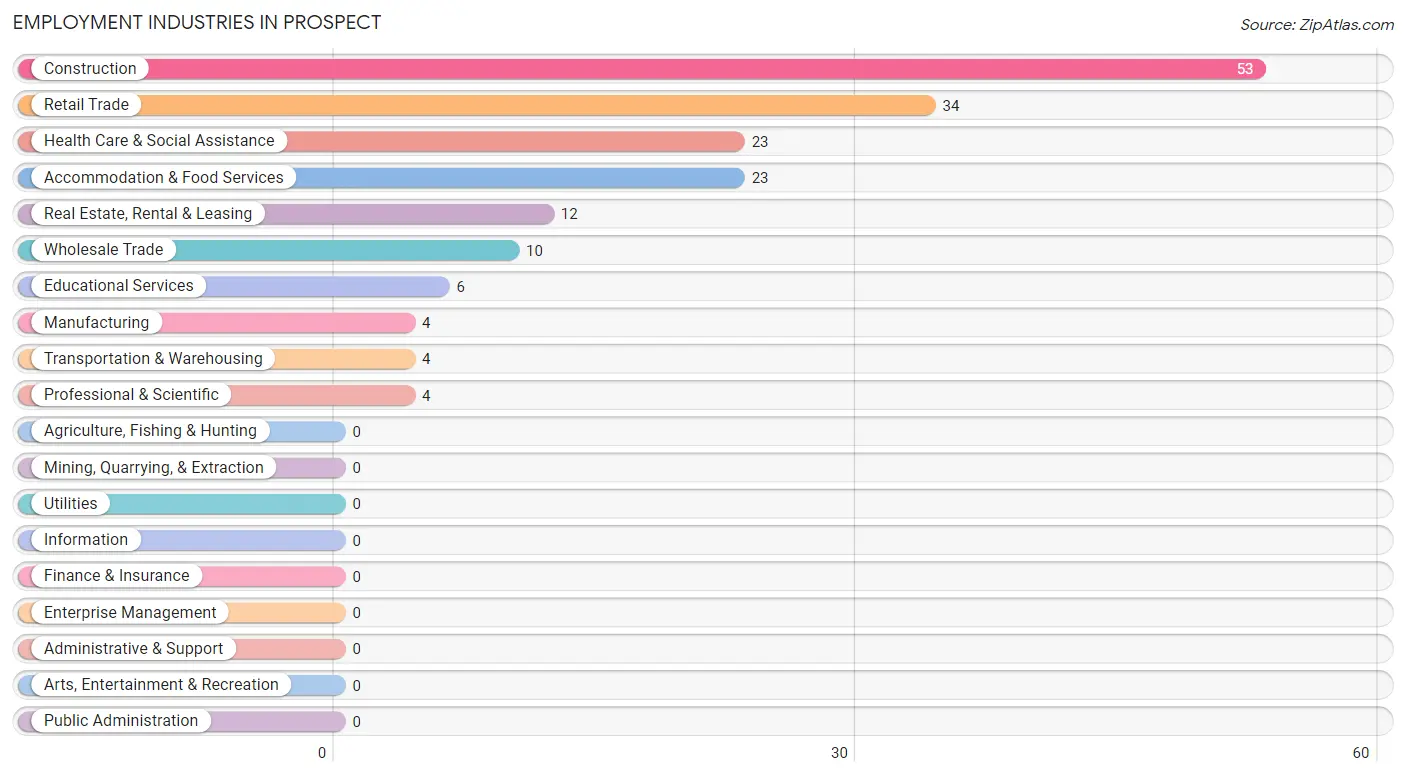
Employment Industries in Prospect
The major employment industries in Prospect include Construction (53 | 29.4%), Retail Trade (34 | 18.9%), Health Care & Social Assistance (23 | 12.8%), Accommodation & Food Services (23 | 12.8%), and Real Estate, Rental & Leasing (12 | 6.7%).
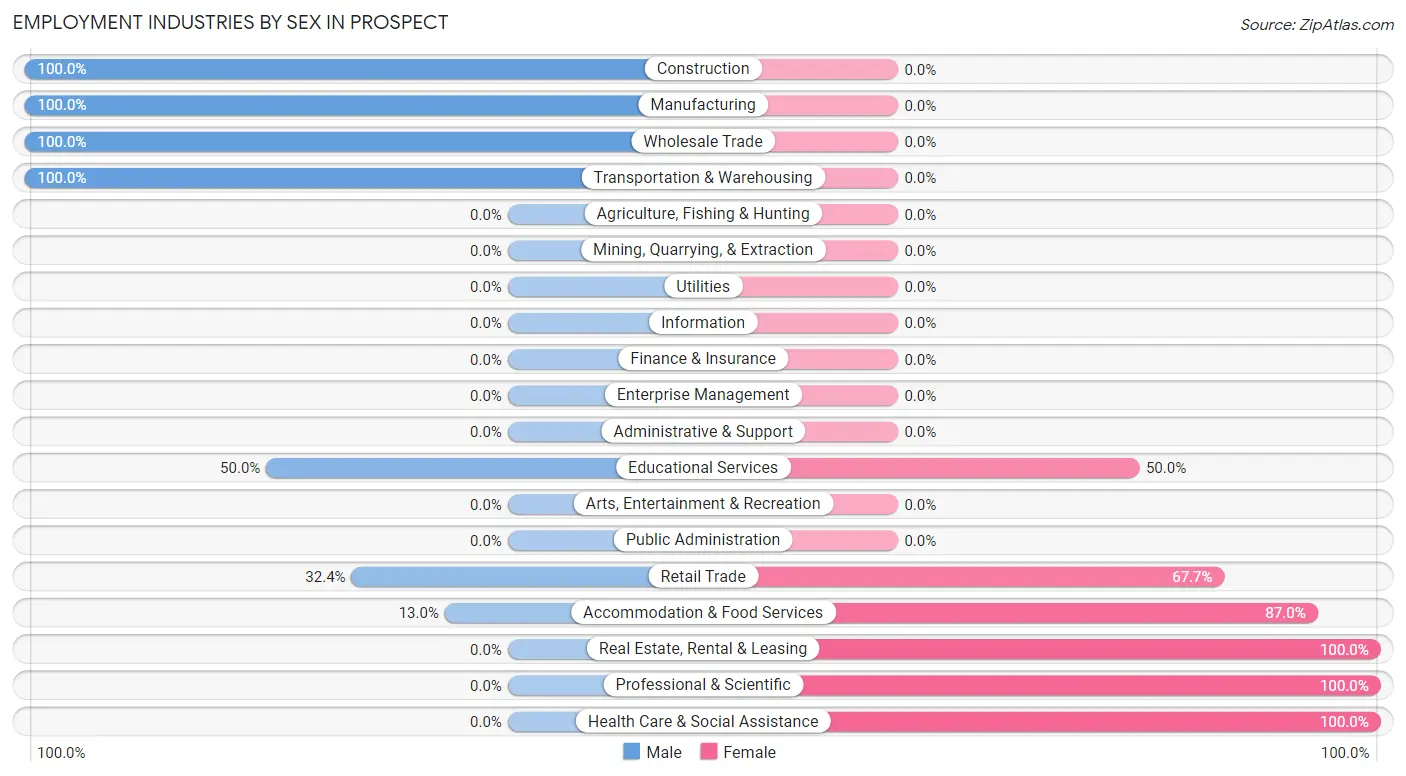
Employment Industries by Sex in Prospect
The Prospect industries that see more men than women are Construction (100.0%), Manufacturing (100.0%), and Wholesale Trade (100.0%), whereas the industries that tend to have a higher number of women are Real Estate, Rental & Leasing (100.0%), Professional & Scientific (100.0%), and Health Care & Social Assistance (100.0%).
| Industry | Male | Female |
| Agriculture, Fishing & Hunting | 0 (0.0%) | 0 (0.0%) |
| Mining, Quarrying, & Extraction | 0 (0.0%) | 0 (0.0%) |
| Construction | 53 (100.0%) | 0 (0.0%) |
| Manufacturing | 4 (100.0%) | 0 (0.0%) |
| Wholesale Trade | 10 (100.0%) | 0 (0.0%) |
| Retail Trade | 11 (32.4%) | 23 (67.6%) |
| Transportation & Warehousing | 4 (100.0%) | 0 (0.0%) |
| Utilities | 0 (0.0%) | 0 (0.0%) |
| Information | 0 (0.0%) | 0 (0.0%) |
| Finance & Insurance | 0 (0.0%) | 0 (0.0%) |
| Real Estate, Rental & Leasing | 0 (0.0%) | 12 (100.0%) |
| Professional & Scientific | 0 (0.0%) | 4 (100.0%) |
| Enterprise Management | 0 (0.0%) | 0 (0.0%) |
| Administrative & Support | 0 (0.0%) | 0 (0.0%) |
| Educational Services | 3 (50.0%) | 3 (50.0%) |
| Health Care & Social Assistance | 0 (0.0%) | 23 (100.0%) |
| Arts, Entertainment & Recreation | 0 (0.0%) | 0 (0.0%) |
| Accommodation & Food Services | 3 (13.0%) | 20 (87.0%) |
| Public Administration | 0 (0.0%) | 0 (0.0%) |
| Total | 92 (51.1%) | 88 (48.9%) |
Education in Prospect
School Enrollment in Prospect
The most common levels of schooling among the 171 students in Prospect are middle school (56 | 32.8%), college / undergraduate (45 | 26.3%), and elementary school (35 | 20.5%).
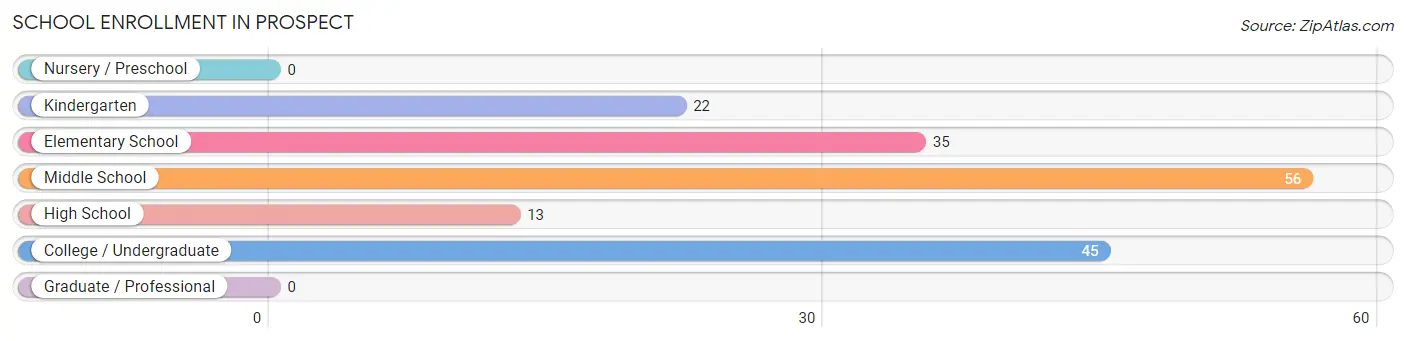
| School Level | # Students | % Students |
| Nursery / Preschool | 0 | 0.0% |
| Kindergarten | 22 | 12.9% |
| Elementary School | 35 | 20.5% |
| Middle School | 56 | 32.8% |
| High School | 13 | 7.6% |
| College / Undergraduate | 45 | 26.3% |
| Graduate / Professional | 0 | 0.0% |
| Total | 171 | 100.0% |
School Enrollment by Age by Funding Source in Prospect
Out of a total of 171 students who are enrolled in schools in Prospect, 6 (3.5%) attend a private institution, while the remaining 165 (96.5%) are enrolled in public schools. The age group of 20 to 24 year olds has the highest likelihood of being enrolled in private schools, with 4 (100.0% in the age bracket) enrolled. Conversely, the age group of 5 to 9 year old has the lowest likelihood of being enrolled in a private school, with 54 (100.0% in the age bracket) attending a public institution.
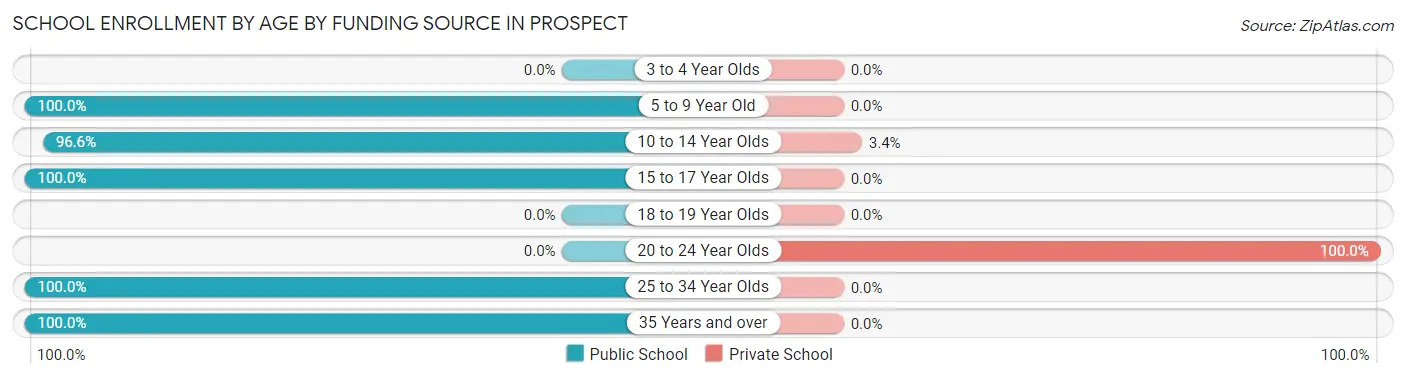
| Age Bracket | Public School | Private School |
| 3 to 4 Year Olds | 0 (0.0%) | 0 (0.0%) |
| 5 to 9 Year Old | 54 (100.0%) | 0 (0.0%) |
| 10 to 14 Year Olds | 57 (96.6%) | 2 (3.4%) |
| 15 to 17 Year Olds | 13 (100.0%) | 0 (0.0%) |
| 18 to 19 Year Olds | 0 (0.0%) | 0 (0.0%) |
| 20 to 24 Year Olds | 0 (0.0%) | 4 (100.0%) |
| 25 to 34 Year Olds | 20 (100.0%) | 0 (0.0%) |
| 35 Years and over | 21 (100.0%) | 0 (0.0%) |
| Total | 165 (96.5%) | 6 (3.5%) |
Educational Attainment by Field of Study in Prospect
Education (46 | 38.7%), social sciences (15 | 12.6%), bio, nature & agricultural (13 | 10.9%), psychology (12 | 10.1%), and visual & performing arts (12 | 10.1%) are the most common fields of study among 119 individuals in Prospect who have obtained a bachelor's degree or higher.
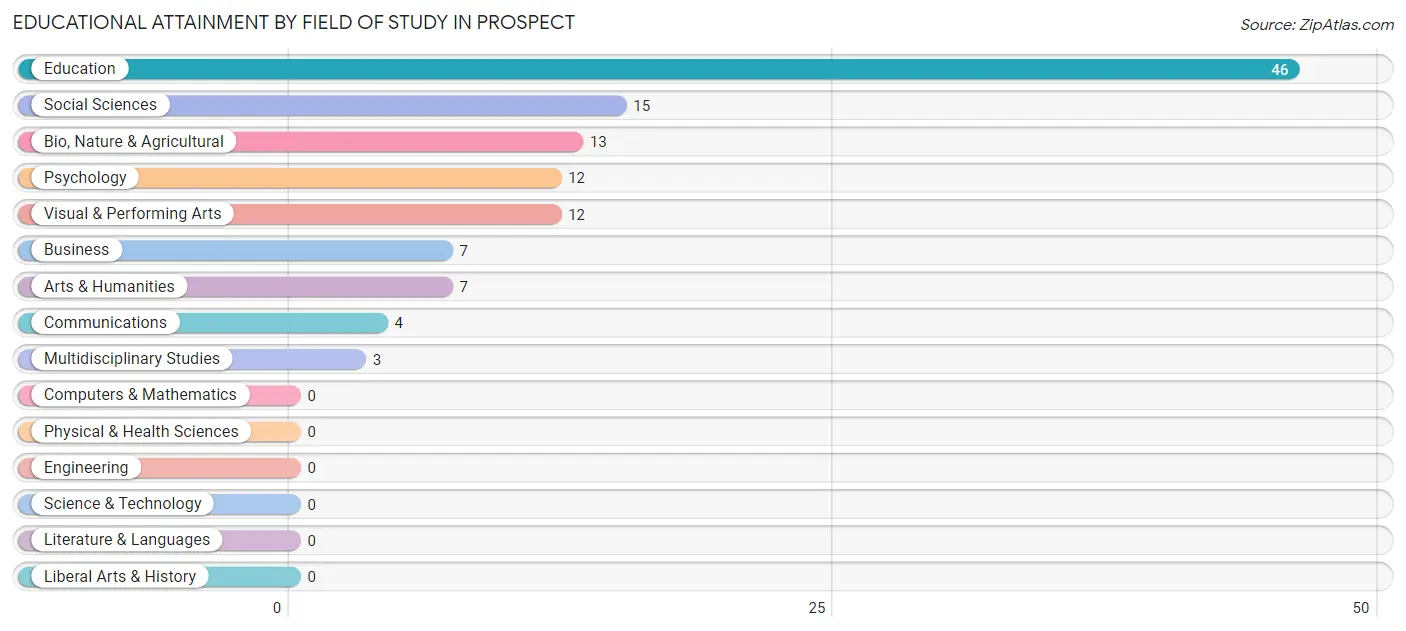
| Field of Study | # Graduates | % Graduates |
| Computers & Mathematics | 0 | 0.0% |
| Bio, Nature & Agricultural | 13 | 10.9% |
| Physical & Health Sciences | 0 | 0.0% |
| Psychology | 12 | 10.1% |
| Social Sciences | 15 | 12.6% |
| Engineering | 0 | 0.0% |
| Multidisciplinary Studies | 3 | 2.5% |
| Science & Technology | 0 | 0.0% |
| Business | 7 | 5.9% |
| Education | 46 | 38.7% |
| Literature & Languages | 0 | 0.0% |
| Liberal Arts & History | 0 | 0.0% |
| Visual & Performing Arts | 12 | 10.1% |
| Communications | 4 | 3.4% |
| Arts & Humanities | 7 | 5.9% |
| Total | 119 | 100.0% |
Transportation & Commute in Prospect
Vehicle Availability by Sex in Prospect
The most prevalent vehicle ownership categories in Prospect are males with 4 vehicles (38, accounting for 41.3%) and females with 4 vehicles (6, making up 43.2%).
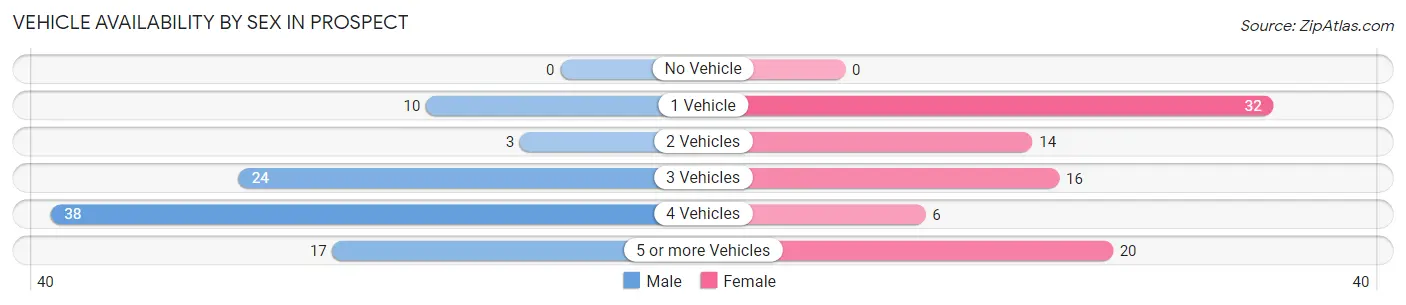
| Vehicles Available | Male | Female |
| No Vehicle | 0 (0.0%) | 0 (0.0%) |
| 1 Vehicle | 10 (10.9%) | 32 (36.4%) |
| 2 Vehicles | 3 (3.3%) | 14 (15.9%) |
| 3 Vehicles | 24 (26.1%) | 16 (18.2%) |
| 4 Vehicles | 38 (41.3%) | 6 (6.8%) |
| 5 or more Vehicles | 17 (18.5%) | 20 (22.7%) |
| Total | 92 (100.0%) | 88 (100.0%) |
Commute Time in Prospect
The most frequently occuring commute durations in Prospect are 60 to 89 minutes (59 commuters, 36.0%), 5 to 9 minutes (34 commuters, 20.7%), and 40 to 44 minutes (23 commuters, 14.0%).
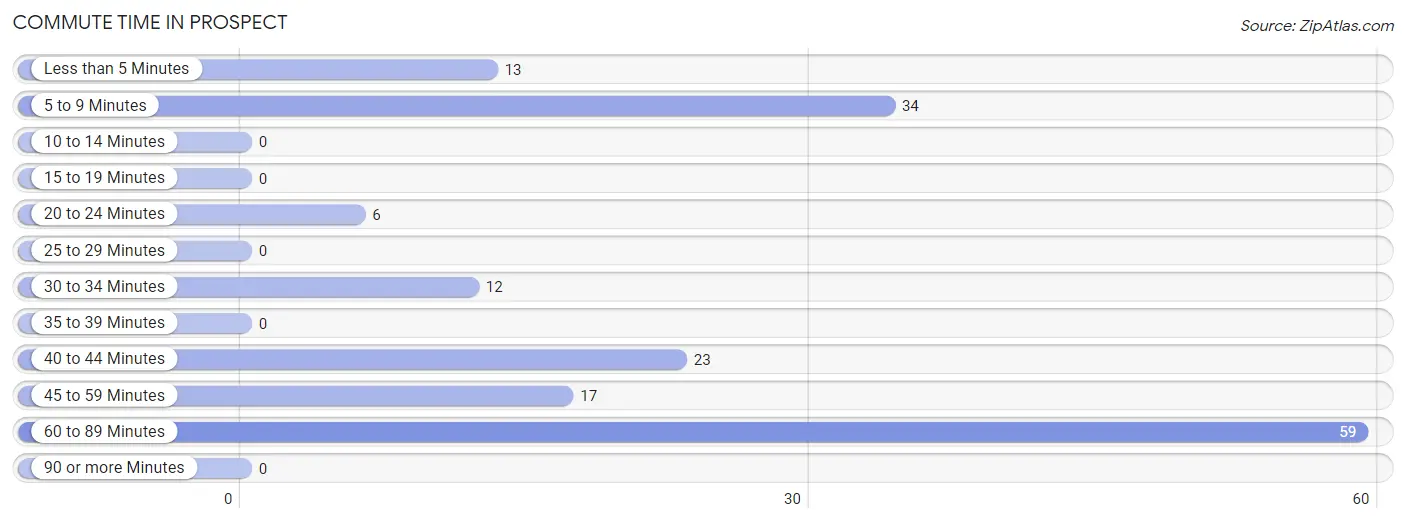
| Commute Time | # Commuters | % Commuters |
| Less than 5 Minutes | 13 | 7.9% |
| 5 to 9 Minutes | 34 | 20.7% |
| 10 to 14 Minutes | 0 | 0.0% |
| 15 to 19 Minutes | 0 | 0.0% |
| 20 to 24 Minutes | 6 | 3.7% |
| 25 to 29 Minutes | 0 | 0.0% |
| 30 to 34 Minutes | 12 | 7.3% |
| 35 to 39 Minutes | 0 | 0.0% |
| 40 to 44 Minutes | 23 | 14.0% |
| 45 to 59 Minutes | 17 | 10.4% |
| 60 to 89 Minutes | 59 | 36.0% |
| 90 or more Minutes | 0 | 0.0% |
Commute Time by Sex in Prospect
The most common commute times in Prospect are 60 to 89 minutes (36 commuters, 45.0%) for males and 60 to 89 minutes (23 commuters, 27.4%) for females.
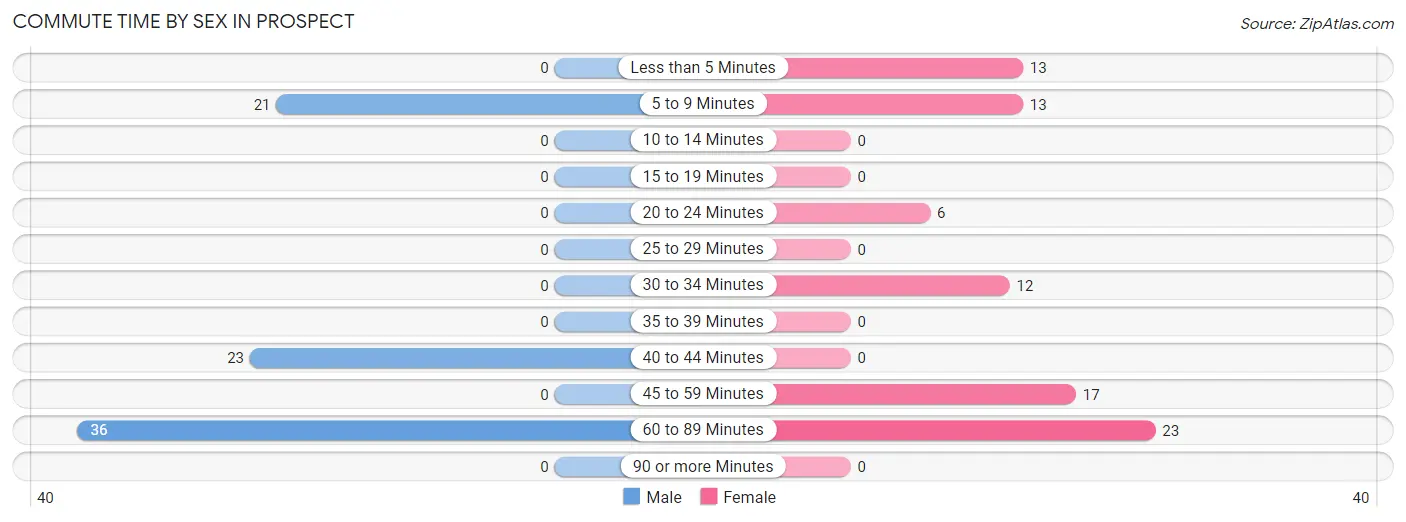
| Commute Time | Male | Female |
| Less than 5 Minutes | 0 (0.0%) | 13 (15.5%) |
| 5 to 9 Minutes | 21 (26.3%) | 13 (15.5%) |
| 10 to 14 Minutes | 0 (0.0%) | 0 (0.0%) |
| 15 to 19 Minutes | 0 (0.0%) | 0 (0.0%) |
| 20 to 24 Minutes | 0 (0.0%) | 6 (7.1%) |
| 25 to 29 Minutes | 0 (0.0%) | 0 (0.0%) |
| 30 to 34 Minutes | 0 (0.0%) | 12 (14.3%) |
| 35 to 39 Minutes | 0 (0.0%) | 0 (0.0%) |
| 40 to 44 Minutes | 23 (28.7%) | 0 (0.0%) |
| 45 to 59 Minutes | 0 (0.0%) | 17 (20.2%) |
| 60 to 89 Minutes | 36 (45.0%) | 23 (27.4%) |
| 90 or more Minutes | 0 (0.0%) | 0 (0.0%) |
Time of Departure to Work by Sex in Prospect
The most frequent times of departure to work in Prospect are 6:00 AM to 6:29 AM (49, 61.3%) for males and 12:00 PM to 3:59 PM (29, 34.5%) for females.
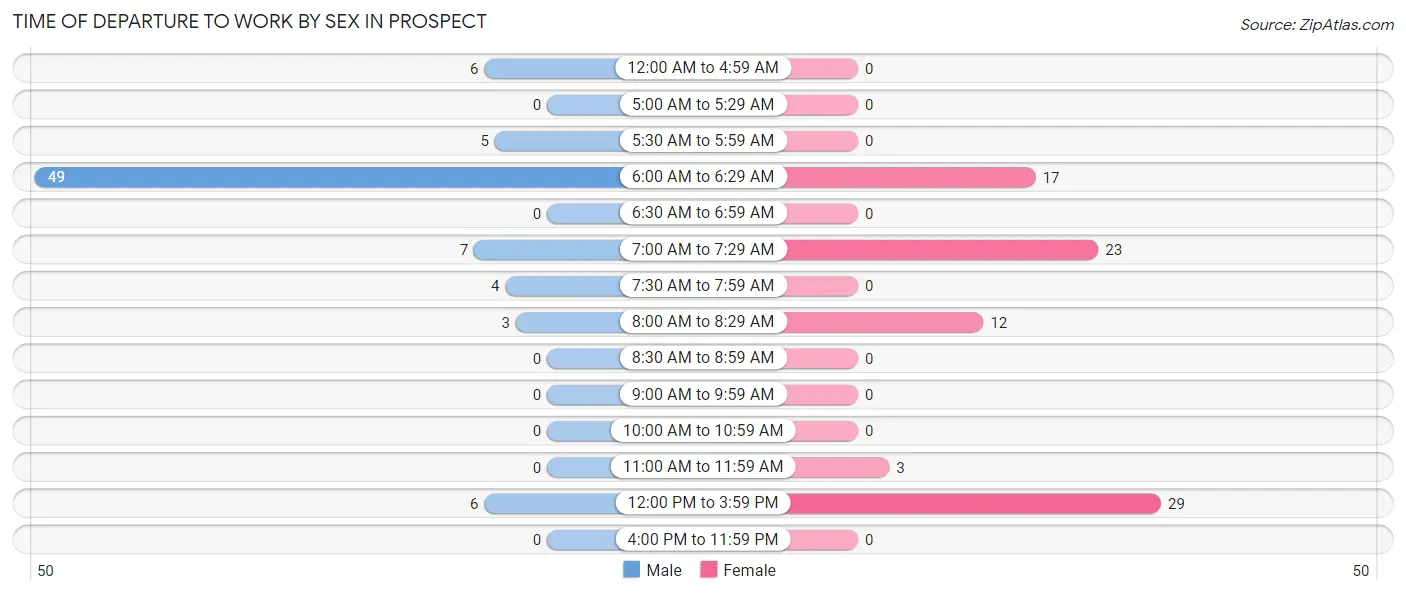
| Time of Departure | Male | Female |
| 12:00 AM to 4:59 AM | 6 (7.5%) | 0 (0.0%) |
| 5:00 AM to 5:29 AM | 0 (0.0%) | 0 (0.0%) |
| 5:30 AM to 5:59 AM | 5 (6.2%) | 0 (0.0%) |
| 6:00 AM to 6:29 AM | 49 (61.3%) | 17 (20.2%) |
| 6:30 AM to 6:59 AM | 0 (0.0%) | 0 (0.0%) |
| 7:00 AM to 7:29 AM | 7 (8.7%) | 23 (27.4%) |
| 7:30 AM to 7:59 AM | 4 (5.0%) | 0 (0.0%) |
| 8:00 AM to 8:29 AM | 3 (3.7%) | 12 (14.3%) |
| 8:30 AM to 8:59 AM | 0 (0.0%) | 0 (0.0%) |
| 9:00 AM to 9:59 AM | 0 (0.0%) | 0 (0.0%) |
| 10:00 AM to 10:59 AM | 0 (0.0%) | 0 (0.0%) |
| 11:00 AM to 11:59 AM | 0 (0.0%) | 3 (3.6%) |
| 12:00 PM to 3:59 PM | 6 (7.5%) | 29 (34.5%) |
| 4:00 PM to 11:59 PM | 0 (0.0%) | 0 (0.0%) |
| Total | 80 (100.0%) | 84 (100.0%) |
Housing Occupancy in Prospect
Occupancy by Ownership in Prospect
Of the total 256 dwellings in Prospect, owner-occupied units account for 206 (80.5%), while renter-occupied units make up 50 (19.5%).
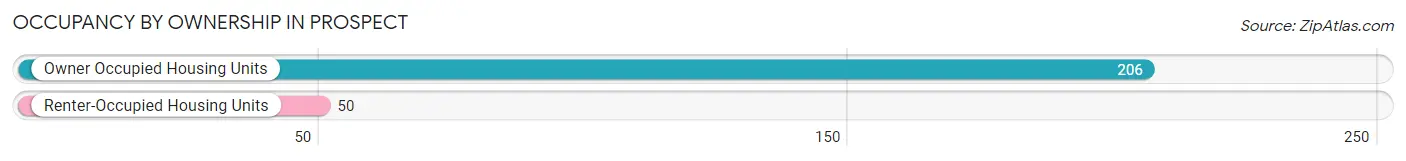
| Occupancy | # Housing Units | % Housing Units |
| Owner Occupied Housing Units | 206 | 80.5% |
| Renter-Occupied Housing Units | 50 | 19.5% |
| Total Occupied Housing Units | 256 | 100.0% |
Occupancy by Household Size in Prospect
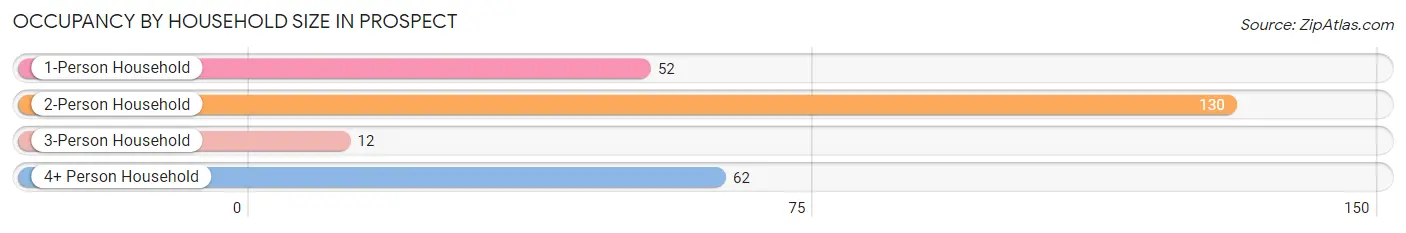
| Household Size | # Housing Units | % Housing Units |
| 1-Person Household | 52 | 20.3% |
| 2-Person Household | 130 | 50.8% |
| 3-Person Household | 12 | 4.7% |
| 4+ Person Household | 62 | 24.2% |
| Total Housing Units | 256 | 100.0% |
Occupancy by Ownership by Household Size in Prospect
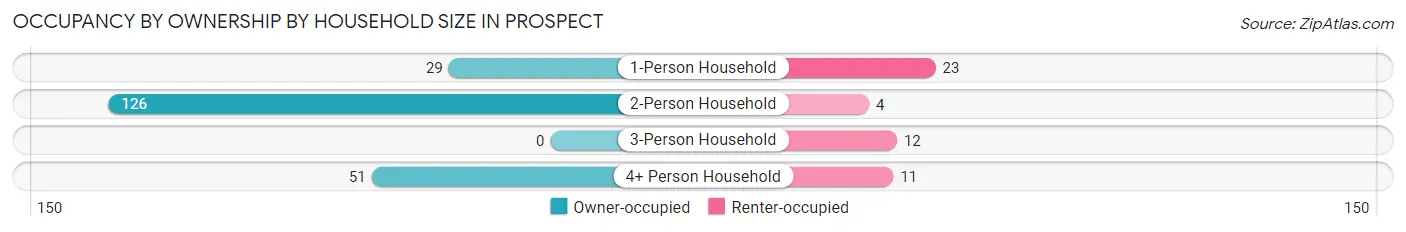
| Household Size | Owner-occupied | Renter-occupied |
| 1-Person Household | 29 (55.8%) | 23 (44.2%) |
| 2-Person Household | 126 (96.9%) | 4 (3.1%) |
| 3-Person Household | 0 (0.0%) | 12 (100.0%) |
| 4+ Person Household | 51 (82.3%) | 11 (17.7%) |
| Total Housing Units | 206 (80.5%) | 50 (19.5%) |
Occupancy by Educational Attainment in Prospect
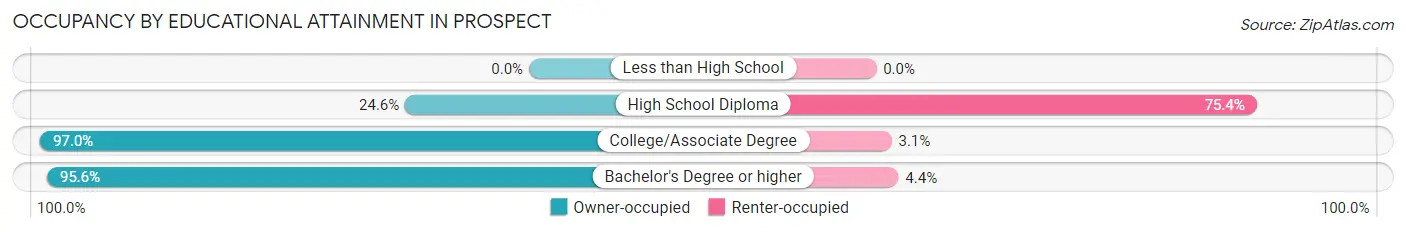
| Household Size | Owner-occupied | Renter-occupied |
| Less than High School | 0 (0.0%) | 0 (0.0%) |
| High School Diploma | 14 (24.6%) | 43 (75.4%) |
| College/Associate Degree | 127 (97.0%) | 4 (3.0%) |
| Bachelor's Degree or higher | 65 (95.6%) | 3 (4.4%) |
Occupancy by Age of Householder in Prospect
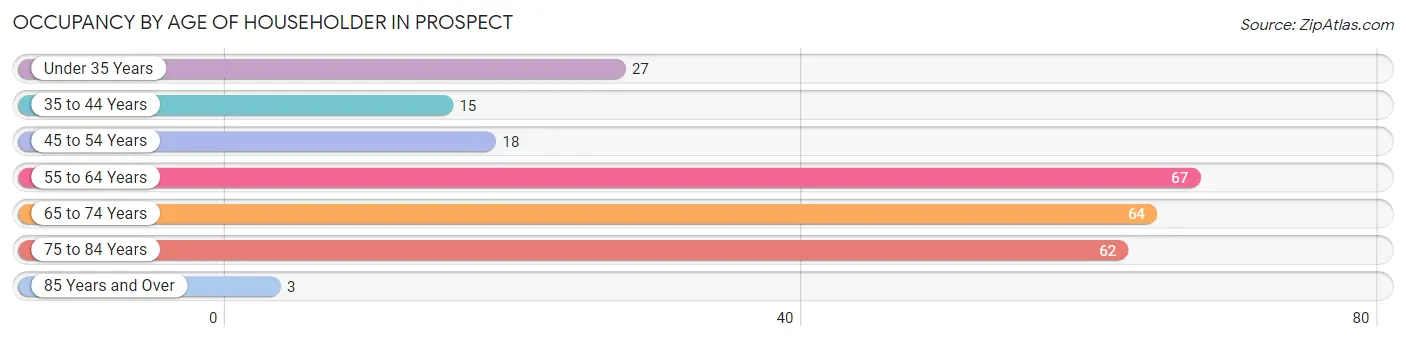
| Age Bracket | # Households | % Households |
| Under 35 Years | 27 | 10.5% |
| 35 to 44 Years | 15 | 5.9% |
| 45 to 54 Years | 18 | 7.0% |
| 55 to 64 Years | 67 | 26.2% |
| 65 to 74 Years | 64 | 25.0% |
| 75 to 84 Years | 62 | 24.2% |
| 85 Years and Over | 3 | 1.2% |
| Total | 256 | 100.0% |
Housing Finances in Prospect
Median Income by Occupancy in Prospect
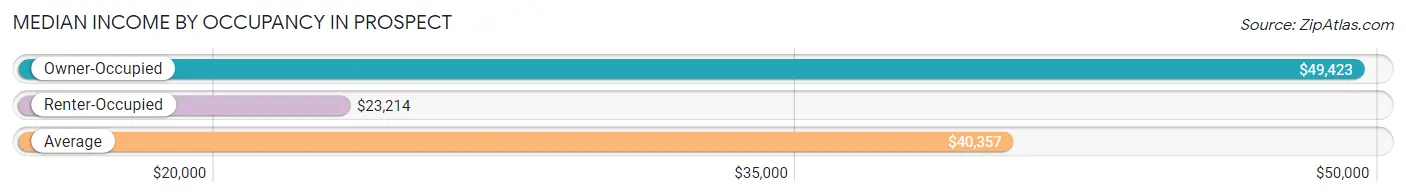
| Occupancy Type | # Households | Median Income |
| Owner-Occupied | 206 (80.5%) | $49,423 |
| Renter-Occupied | 50 (19.5%) | $23,214 |
| Average | 256 (100.0%) | $40,357 |
Occupancy by Householder Income Bracket in Prospect
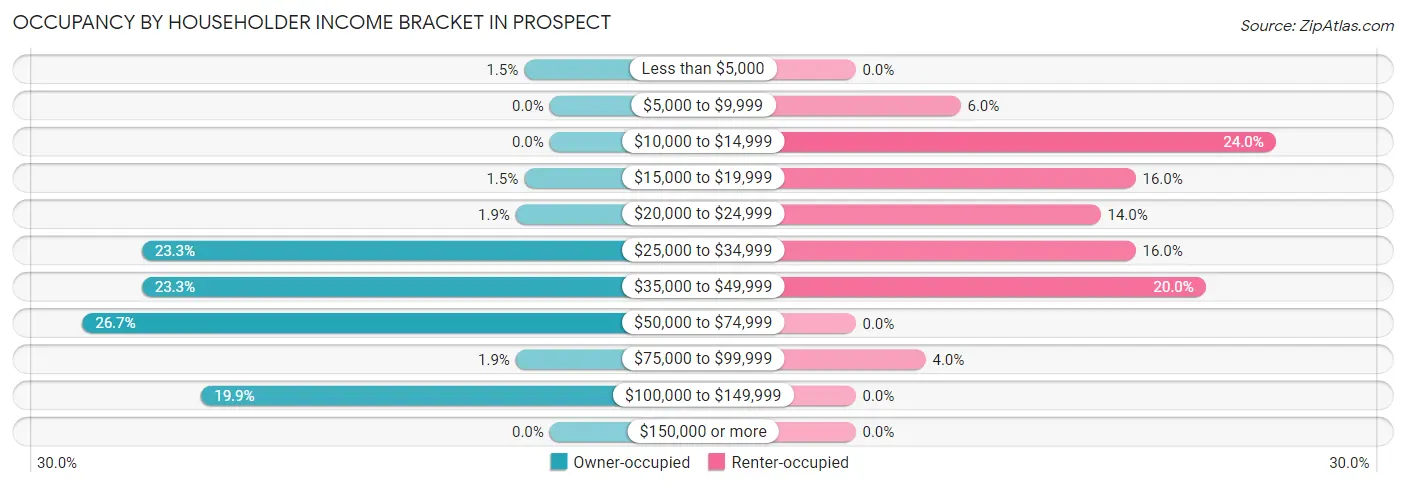
| Income Bracket | Owner-occupied | Renter-occupied |
| Less than $5,000 | 3 (1.5%) | 0 (0.0%) |
| $5,000 to $9,999 | 0 (0.0%) | 3 (6.0%) |
| $10,000 to $14,999 | 0 (0.0%) | 12 (24.0%) |
| $15,000 to $19,999 | 3 (1.5%) | 8 (16.0%) |
| $20,000 to $24,999 | 4 (1.9%) | 7 (14.0%) |
| $25,000 to $34,999 | 48 (23.3%) | 8 (16.0%) |
| $35,000 to $49,999 | 48 (23.3%) | 10 (20.0%) |
| $50,000 to $74,999 | 55 (26.7%) | 0 (0.0%) |
| $75,000 to $99,999 | 4 (1.9%) | 2 (4.0%) |
| $100,000 to $149,999 | 41 (19.9%) | 0 (0.0%) |
| $150,000 or more | 0 (0.0%) | 0 (0.0%) |
| Total | 206 (100.0%) | 50 (100.0%) |
Monthly Housing Cost Tiers in Prospect
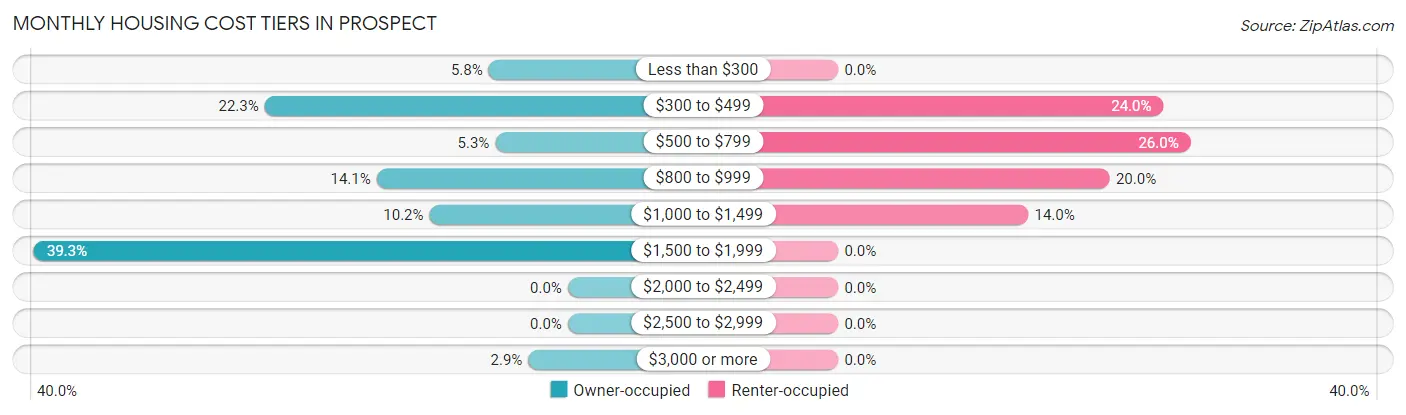
| Monthly Cost | Owner-occupied | Renter-occupied |
| Less than $300 | 12 (5.8%) | 0 (0.0%) |
| $300 to $499 | 46 (22.3%) | 12 (24.0%) |
| $500 to $799 | 11 (5.3%) | 13 (26.0%) |
| $800 to $999 | 29 (14.1%) | 10 (20.0%) |
| $1,000 to $1,499 | 21 (10.2%) | 7 (14.0%) |
| $1,500 to $1,999 | 81 (39.3%) | 0 (0.0%) |
| $2,000 to $2,499 | 0 (0.0%) | 0 (0.0%) |
| $2,500 to $2,999 | 0 (0.0%) | 0 (0.0%) |
| $3,000 or more | 6 (2.9%) | 0 (0.0%) |
| Total | 206 (100.0%) | 50 (100.0%) |
Physical Housing Characteristics in Prospect
Housing Structures in Prospect
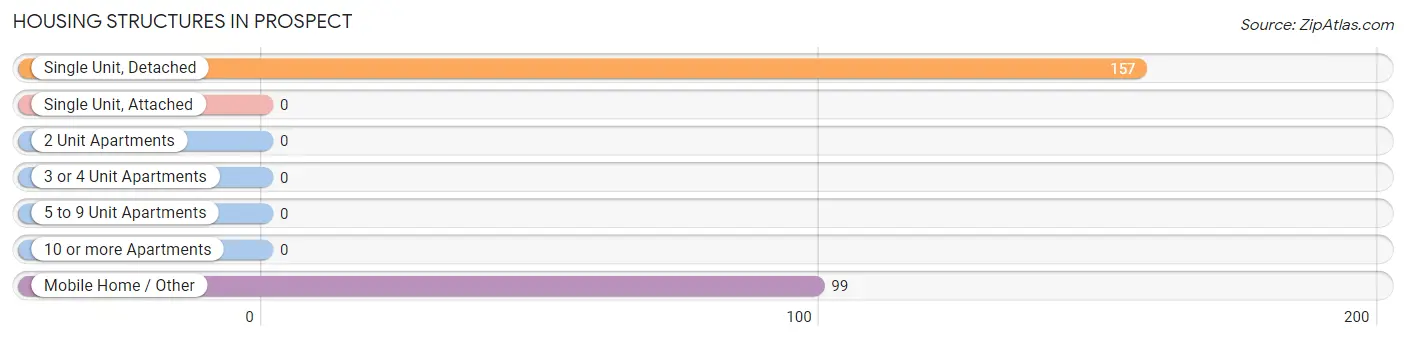
| Structure Type | # Housing Units | % Housing Units |
| Single Unit, Detached | 157 | 61.3% |
| Single Unit, Attached | 0 | 0.0% |
| 2 Unit Apartments | 0 | 0.0% |
| 3 or 4 Unit Apartments | 0 | 0.0% |
| 5 to 9 Unit Apartments | 0 | 0.0% |
| 10 or more Apartments | 0 | 0.0% |
| Mobile Home / Other | 99 | 38.7% |
| Total | 256 | 100.0% |
Housing Structures by Occupancy in Prospect
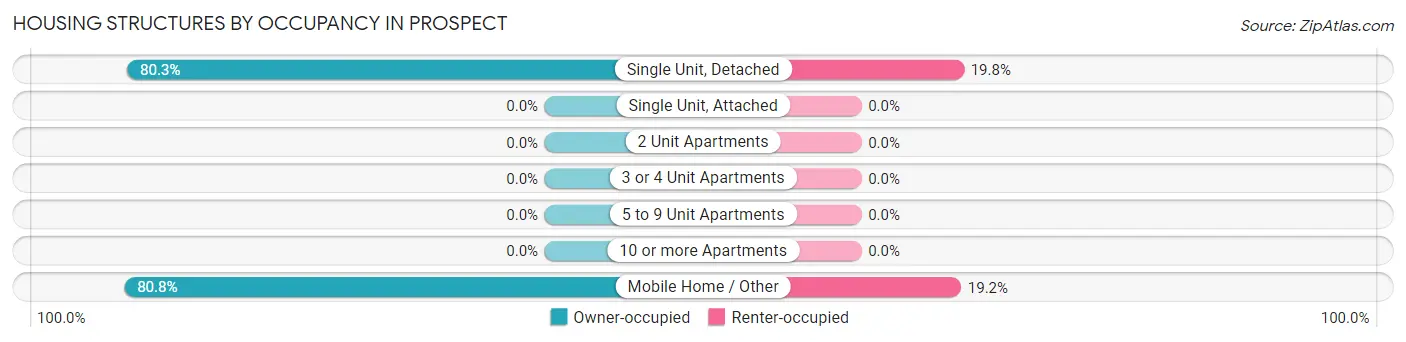
| Structure Type | Owner-occupied | Renter-occupied |
| Single Unit, Detached | 126 (80.2%) | 31 (19.8%) |
| Single Unit, Attached | 0 (0.0%) | 0 (0.0%) |
| 2 Unit Apartments | 0 (0.0%) | 0 (0.0%) |
| 3 or 4 Unit Apartments | 0 (0.0%) | 0 (0.0%) |
| 5 to 9 Unit Apartments | 0 (0.0%) | 0 (0.0%) |
| 10 or more Apartments | 0 (0.0%) | 0 (0.0%) |
| Mobile Home / Other | 80 (80.8%) | 19 (19.2%) |
| Total | 206 (80.5%) | 50 (19.5%) |
Housing Structures by Number of Rooms in Prospect
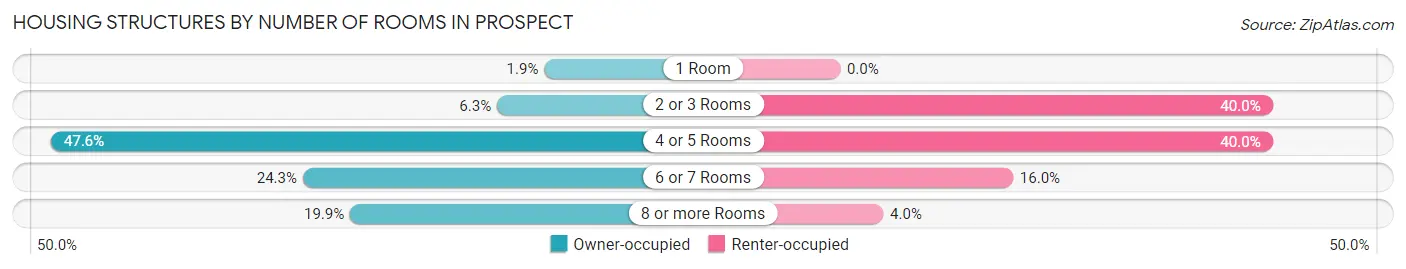
| Number of Rooms | Owner-occupied | Renter-occupied |
| 1 Room | 4 (1.9%) | 0 (0.0%) |
| 2 or 3 Rooms | 13 (6.3%) | 20 (40.0%) |
| 4 or 5 Rooms | 98 (47.6%) | 20 (40.0%) |
| 6 or 7 Rooms | 50 (24.3%) | 8 (16.0%) |
| 8 or more Rooms | 41 (19.9%) | 2 (4.0%) |
| Total | 206 (100.0%) | 50 (100.0%) |
Housing Structure by Heating Type in Prospect
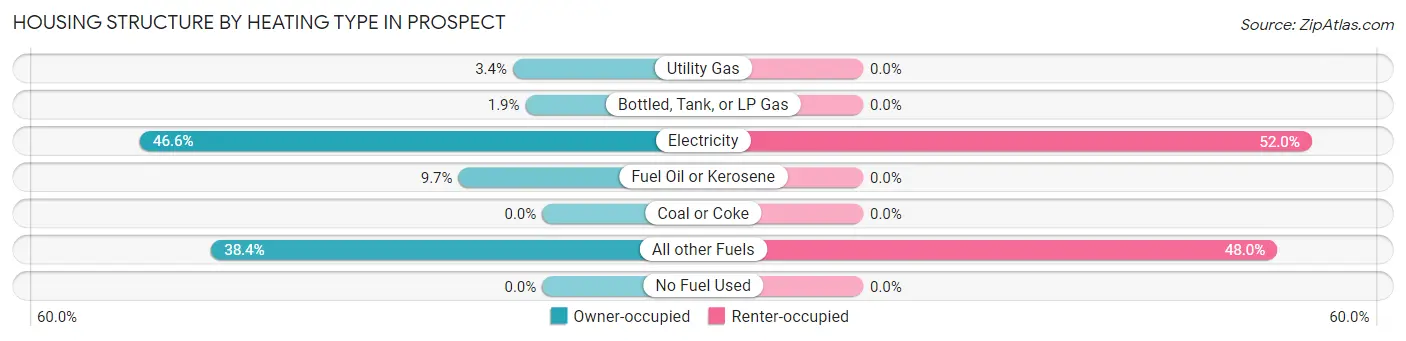
| Heating Type | Owner-occupied | Renter-occupied |
| Utility Gas | 7 (3.4%) | 0 (0.0%) |
| Bottled, Tank, or LP Gas | 4 (1.9%) | 0 (0.0%) |
| Electricity | 96 (46.6%) | 26 (52.0%) |
| Fuel Oil or Kerosene | 20 (9.7%) | 0 (0.0%) |
| Coal or Coke | 0 (0.0%) | 0 (0.0%) |
| All other Fuels | 79 (38.4%) | 24 (48.0%) |
| No Fuel Used | 0 (0.0%) | 0 (0.0%) |
| Total | 206 (100.0%) | 50 (100.0%) |
Household Vehicle Usage in Prospect
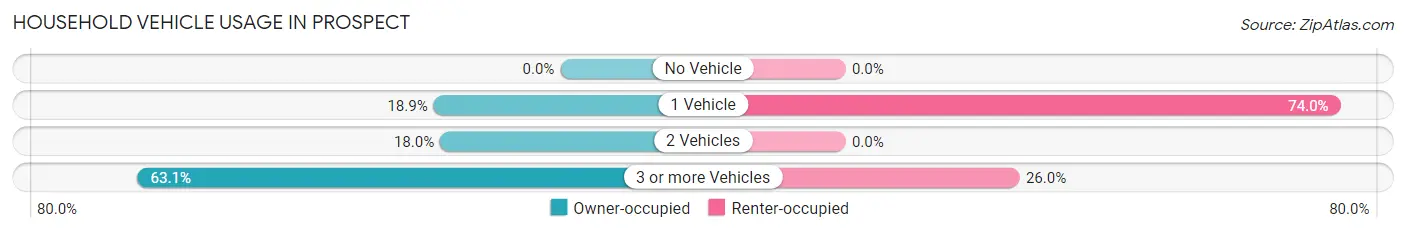
| Vehicles per Household | Owner-occupied | Renter-occupied |
| No Vehicle | 0 (0.0%) | 0 (0.0%) |
| 1 Vehicle | 39 (18.9%) | 37 (74.0%) |
| 2 Vehicles | 37 (18.0%) | 0 (0.0%) |
| 3 or more Vehicles | 130 (63.1%) | 13 (26.0%) |
| Total | 206 (100.0%) | 50 (100.0%) |
Real Estate & Mortgages in Prospect
Real Estate and Mortgage Overview in Prospect
| Characteristic | Without Mortgage | With Mortgage |
| Housing Units | 83 | 123 |
| Median Property Value | - | - |
| Median Household Income | $37,448 | $0 |
| Monthly Housing Costs | $413 | $6 |
| Real Estate Taxes | $944 | $0 |
Property Value by Mortgage Status in Prospect
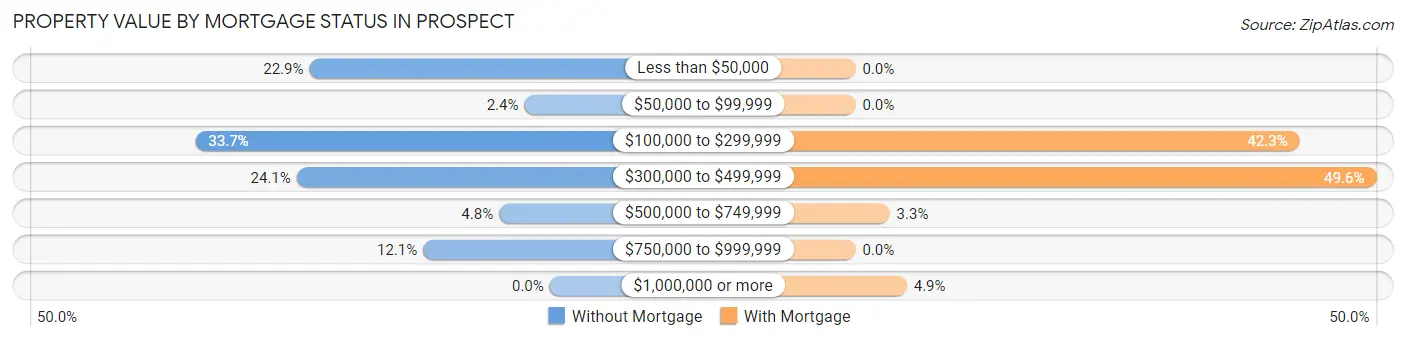
| Property Value | Without Mortgage | With Mortgage |
| Less than $50,000 | 19 (22.9%) | 0 (0.0%) |
| $50,000 to $99,999 | 2 (2.4%) | 0 (0.0%) |
| $100,000 to $299,999 | 28 (33.7%) | 52 (42.3%) |
| $300,000 to $499,999 | 20 (24.1%) | 61 (49.6%) |
| $500,000 to $749,999 | 4 (4.8%) | 4 (3.3%) |
| $750,000 to $999,999 | 10 (12.0%) | 0 (0.0%) |
| $1,000,000 or more | 0 (0.0%) | 6 (4.9%) |
| Total | 83 (100.0%) | 123 (100.0%) |
Household Income by Mortgage Status in Prospect
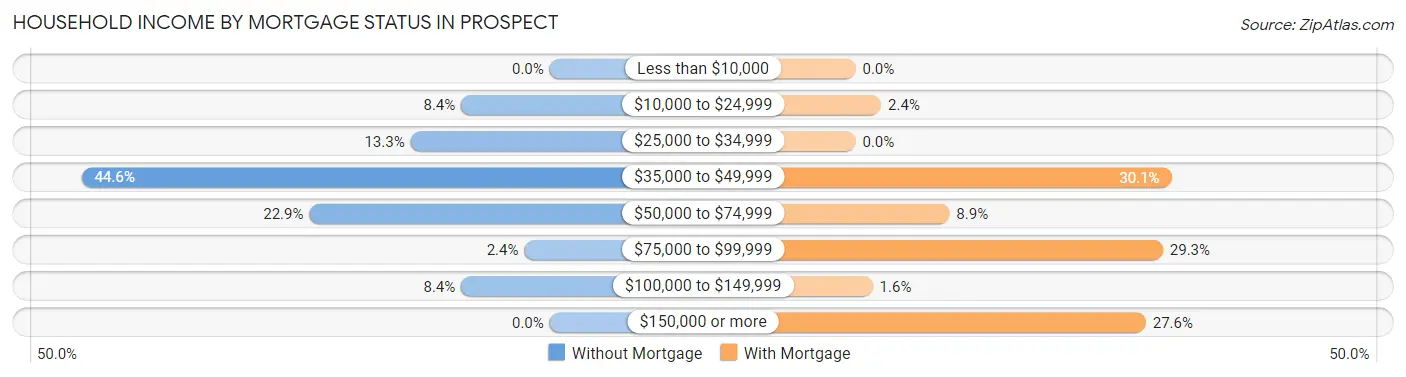
| Household Income | Without Mortgage | With Mortgage |
| Less than $10,000 | 0 (0.0%) | 0 (0.0%) |
| $10,000 to $24,999 | 7 (8.4%) | 3 (2.4%) |
| $25,000 to $34,999 | 11 (13.3%) | 0 (0.0%) |
| $35,000 to $49,999 | 37 (44.6%) | 37 (30.1%) |
| $50,000 to $74,999 | 19 (22.9%) | 11 (8.9%) |
| $75,000 to $99,999 | 2 (2.4%) | 36 (29.3%) |
| $100,000 to $149,999 | 7 (8.4%) | 2 (1.6%) |
| $150,000 or more | 0 (0.0%) | 34 (27.6%) |
| Total | 83 (100.0%) | 123 (100.0%) |
Property Value to Household Income Ratio in Prospect

| Value-to-Income Ratio | Without Mortgage | With Mortgage |
| Less than 2.0x | 21 (25.3%) | 71,094 (57,800.0%) |
| 2.0x to 2.9x | 0 (0.0%) | 0 (0.0%) |
| 3.0x to 3.9x | 0 (0.0%) | 50 (40.6%) |
| 4.0x or more | 62 (74.7%) | 16 (13.0%) |
| Total | 83 (100.0%) | 123 (100.0%) |
Real Estate Taxes by Mortgage Status in Prospect
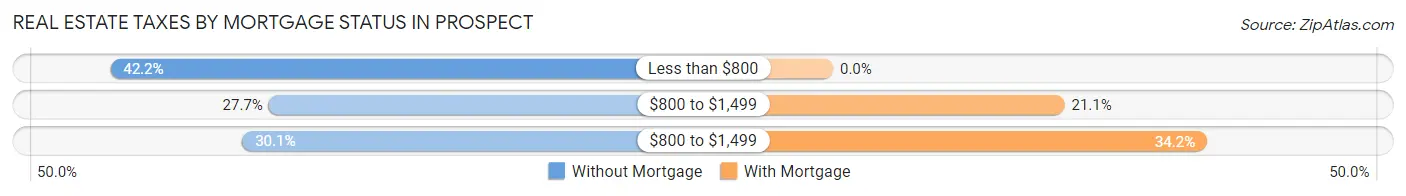
| Property Taxes | Without Mortgage | With Mortgage |
| Less than $800 | 35 (42.2%) | 0 (0.0%) |
| $800 to $1,499 | 23 (27.7%) | 26 (21.1%) |
| $800 to $1,499 | 25 (30.1%) | 42 (34.2%) |
| Total | 83 (100.0%) | 123 (100.0%) |
Health & Disability in Prospect
Health Insurance Coverage by Age in Prospect
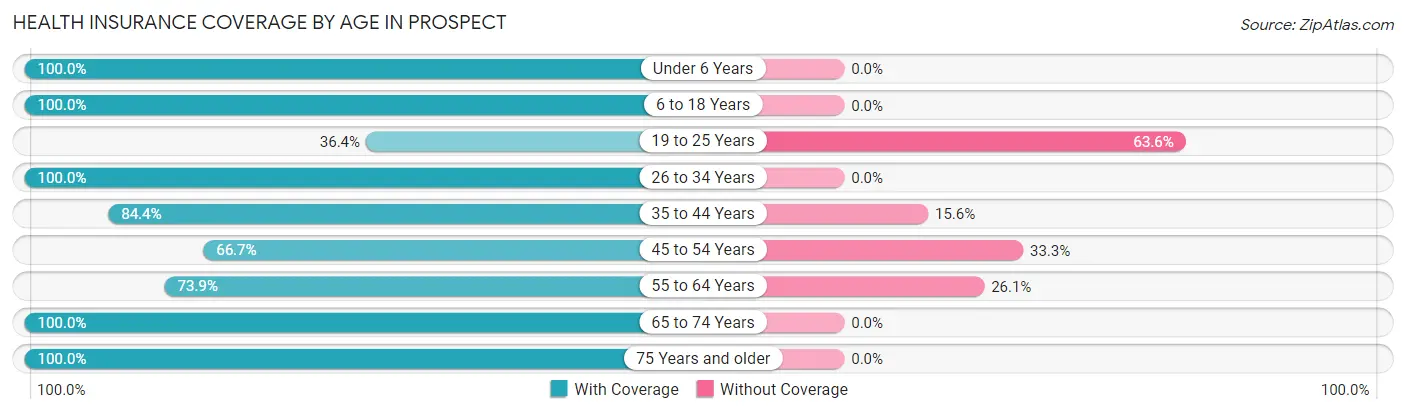
| Age Bracket | With Coverage | Without Coverage |
| Under 6 Years | 47 (100.0%) | 0 (0.0%) |
| 6 to 18 Years | 104 (100.0%) | 0 (0.0%) |
| 19 to 25 Years | 4 (36.4%) | 7 (63.6%) |
| 26 to 34 Years | 59 (100.0%) | 0 (0.0%) |
| 35 to 44 Years | 54 (84.4%) | 10 (15.6%) |
| 45 to 54 Years | 36 (66.7%) | 18 (33.3%) |
| 55 to 64 Years | 68 (73.9%) | 24 (26.1%) |
| 65 to 74 Years | 104 (100.0%) | 0 (0.0%) |
| 75 Years and older | 126 (100.0%) | 0 (0.0%) |
| Total | 602 (91.1%) | 59 (8.9%) |
Health Insurance Coverage by Citizenship Status in Prospect
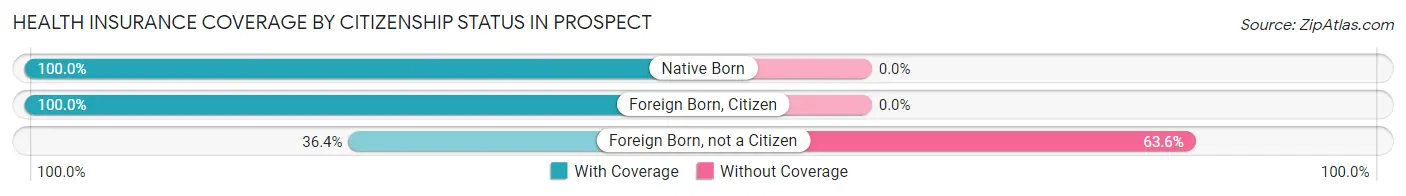
| Citizenship Status | With Coverage | Without Coverage |
| Native Born | 47 (100.0%) | 0 (0.0%) |
| Foreign Born, Citizen | 104 (100.0%) | 0 (0.0%) |
| Foreign Born, not a Citizen | 4 (36.4%) | 7 (63.6%) |
Health Insurance Coverage by Household Income in Prospect
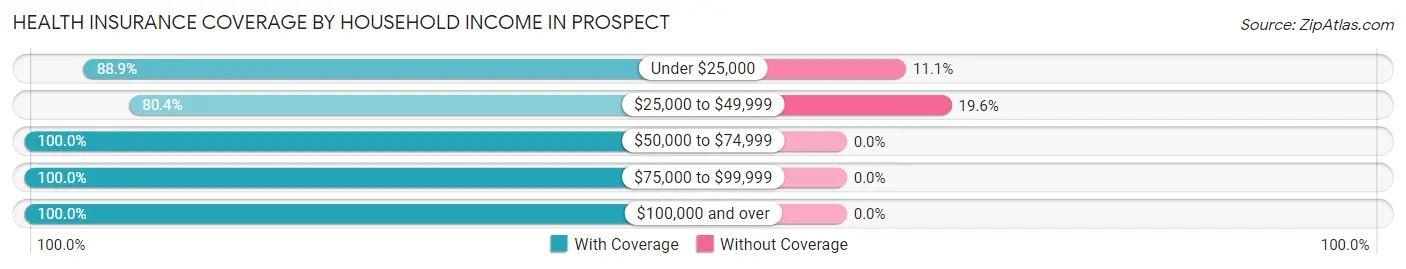
| Household Income | With Coverage | Without Coverage |
| Under $25,000 | 64 (88.9%) | 8 (11.1%) |
| $25,000 to $49,999 | 209 (80.4%) | 51 (19.6%) |
| $50,000 to $74,999 | 164 (100.0%) | 0 (0.0%) |
| $75,000 to $99,999 | 39 (100.0%) | 0 (0.0%) |
| $100,000 and over | 126 (100.0%) | 0 (0.0%) |
Public vs Private Health Insurance Coverage by Age in Prospect
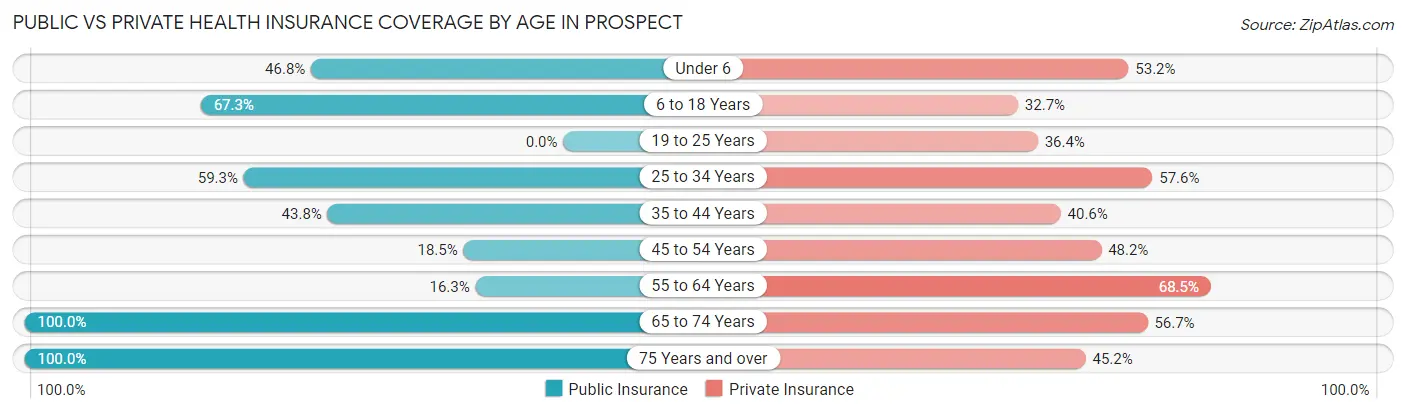
| Age Bracket | Public Insurance | Private Insurance |
| Under 6 | 22 (46.8%) | 25 (53.2%) |
| 6 to 18 Years | 70 (67.3%) | 34 (32.7%) |
| 19 to 25 Years | 0 (0.0%) | 4 (36.4%) |
| 25 to 34 Years | 35 (59.3%) | 34 (57.6%) |
| 35 to 44 Years | 28 (43.8%) | 26 (40.6%) |
| 45 to 54 Years | 10 (18.5%) | 26 (48.1%) |
| 55 to 64 Years | 15 (16.3%) | 63 (68.5%) |
| 65 to 74 Years | 104 (100.0%) | 59 (56.7%) |
| 75 Years and over | 126 (100.0%) | 57 (45.2%) |
| Total | 410 (62.0%) | 328 (49.6%) |
Disability Status by Sex by Age in Prospect
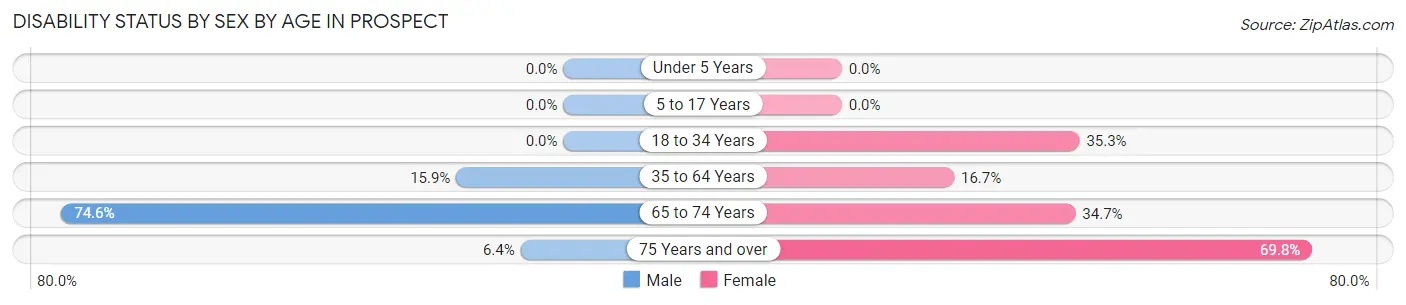
| Age Bracket | Male | Female |
| Under 5 Years | 0 (0.0%) | 0 (0.0%) |
| 5 to 17 Years | 0 (0.0%) | 0 (0.0%) |
| 18 to 34 Years | 0 (0.0%) | 24 (35.3%) |
| 35 to 64 Years | 21 (15.9%) | 13 (16.7%) |
| 65 to 74 Years | 41 (74.6%) | 17 (34.7%) |
| 75 Years and over | 4 (6.4%) | 44 (69.8%) |
Disability Class by Sex by Age in Prospect
Disability Class: Hearing Difficulty
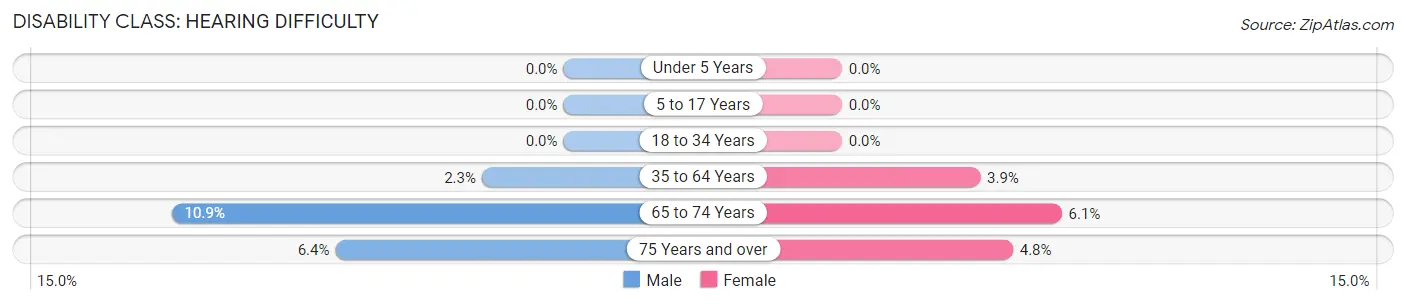
| Age Bracket | Male | Female |
| Under 5 Years | 0 (0.0%) | 0 (0.0%) |
| 5 to 17 Years | 0 (0.0%) | 0 (0.0%) |
| 18 to 34 Years | 0 (0.0%) | 0 (0.0%) |
| 35 to 64 Years | 3 (2.3%) | 3 (3.8%) |
| 65 to 74 Years | 6 (10.9%) | 3 (6.1%) |
| 75 Years and over | 4 (6.4%) | 3 (4.8%) |
Disability Class: Vision Difficulty
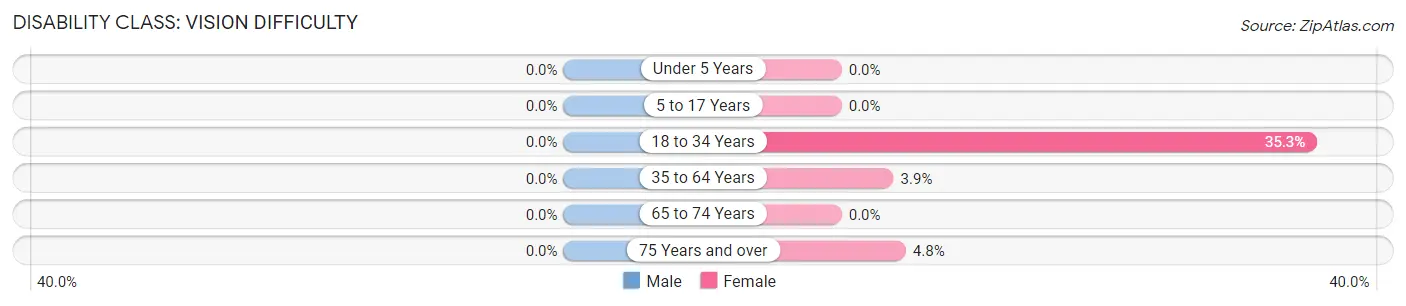
| Age Bracket | Male | Female |
| Under 5 Years | 0 (0.0%) | 0 (0.0%) |
| 5 to 17 Years | 0 (0.0%) | 0 (0.0%) |
| 18 to 34 Years | 0 (0.0%) | 24 (35.3%) |
| 35 to 64 Years | 0 (0.0%) | 3 (3.8%) |
| 65 to 74 Years | 0 (0.0%) | 0 (0.0%) |
| 75 Years and over | 0 (0.0%) | 3 (4.8%) |
Disability Class: Cognitive Difficulty
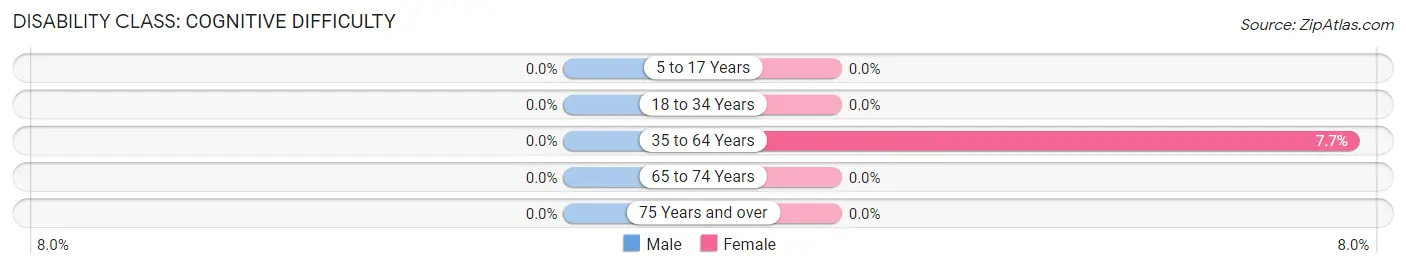
| Age Bracket | Male | Female |
| 5 to 17 Years | 0 (0.0%) | 0 (0.0%) |
| 18 to 34 Years | 0 (0.0%) | 0 (0.0%) |
| 35 to 64 Years | 0 (0.0%) | 6 (7.7%) |
| 65 to 74 Years | 0 (0.0%) | 0 (0.0%) |
| 75 Years and over | 0 (0.0%) | 0 (0.0%) |
Disability Class: Ambulatory Difficulty
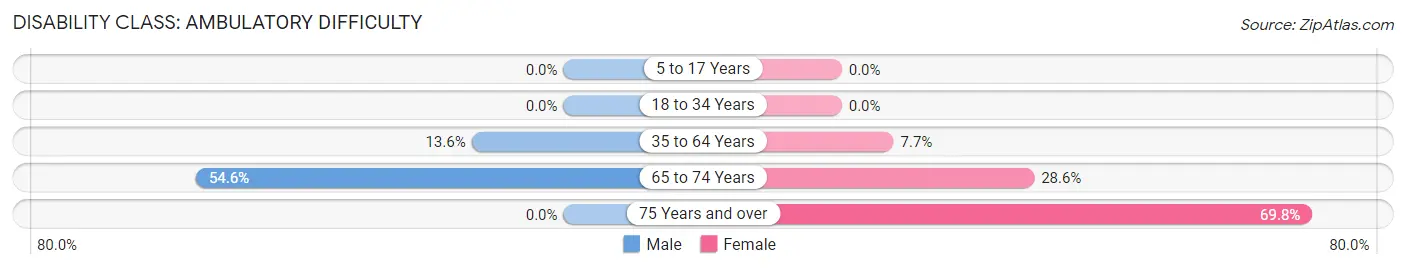
| Age Bracket | Male | Female |
| 5 to 17 Years | 0 (0.0%) | 0 (0.0%) |
| 18 to 34 Years | 0 (0.0%) | 0 (0.0%) |
| 35 to 64 Years | 18 (13.6%) | 6 (7.7%) |
| 65 to 74 Years | 30 (54.5%) | 14 (28.6%) |
| 75 Years and over | 0 (0.0%) | 44 (69.8%) |
Disability Class: Self-Care Difficulty
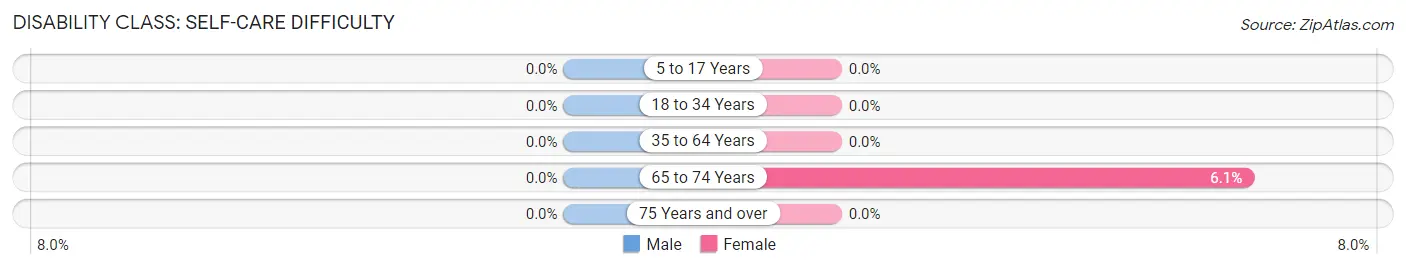
| Age Bracket | Male | Female |
| 5 to 17 Years | 0 (0.0%) | 0 (0.0%) |
| 18 to 34 Years | 0 (0.0%) | 0 (0.0%) |
| 35 to 64 Years | 0 (0.0%) | 0 (0.0%) |
| 65 to 74 Years | 0 (0.0%) | 3 (6.1%) |
| 75 Years and over | 0 (0.0%) | 0 (0.0%) |
Technology Access in Prospect
Computing Device Access in Prospect
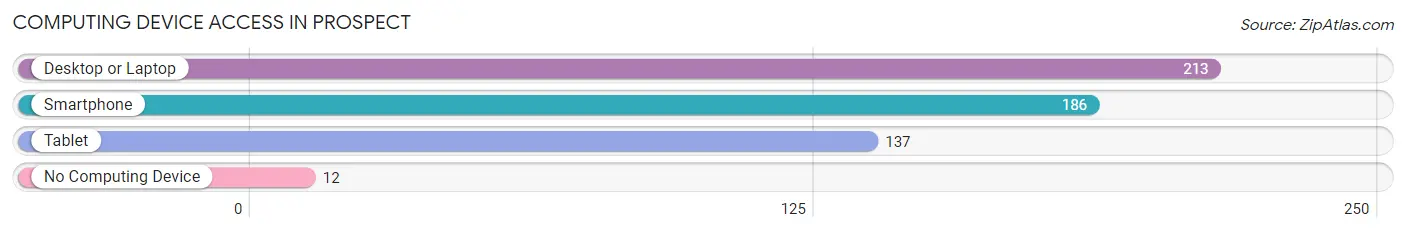
| Device Type | # Households | % Households |
| Desktop or Laptop | 213 | 83.2% |
| Smartphone | 186 | 72.7% |
| Tablet | 137 | 53.5% |
| No Computing Device | 12 | 4.7% |
| Total | 256 | 100.0% |
Internet Access in Prospect
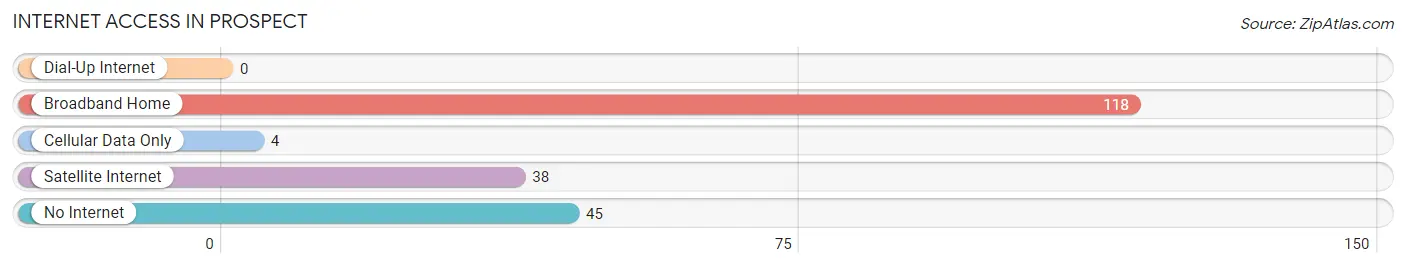
| Internet Type | # Households | % Households |
| Dial-Up Internet | 0 | 0.0% |
| Broadband Home | 118 | 46.1% |
| Cellular Data Only | 4 | 1.6% |
| Satellite Internet | 38 | 14.8% |
| No Internet | 45 | 17.6% |
| Total | 256 | 100.0% |
Prospect Summary
Prospect is a small unincorporated community located in Jackson County, Oregon, United States. It is situated in the foothills of the Cascade Mountains, approximately 20 miles northeast of Medford. The community is located along the Rogue River and is home to a variety of outdoor activities, including fishing, camping, and hiking.
History
The area that is now Prospect was first inhabited by the Takelma Native Americans. The first European settlers arrived in the area in the late 1800s, and the town was officially established in 1887. The town was named after the nearby Prospect Creek, which was named by a prospector who was searching for gold in the area.
In the early 1900s, Prospect was a bustling logging and mining town. The town was home to several sawmills, a blacksmith shop, a general store, and a post office. The town also had a school, a church, and a hotel.
In the 1950s, the logging industry began to decline, and the town’s population began to dwindle. In the 1970s, the town was revitalized by the construction of the Prospect State Park, which brought in tourists and new businesses.
Geography
Prospect is located in the foothills of the Cascade Mountains, approximately 20 miles northeast of Medford. The town is situated along the Rogue River, which is a popular destination for fishing, camping, and rafting. The town is surrounded by lush forests and is home to a variety of wildlife, including deer, elk, and black bears.
The climate in Prospect is mild and temperate, with warm summers and cool winters. The average annual temperature is around 50 degrees Fahrenheit. The average annual precipitation is around 30 inches.
Economy
The economy of Prospect is largely based on tourism. The town is home to Prospect State Park, which is a popular destination for camping, fishing, and hiking. The park also offers a variety of recreational activities, such as horseback riding, mountain biking, and kayaking.
The town is also home to several small businesses, including restaurants, cafes, and shops. The town is also home to a variety of art galleries and antique stores.
Demographics
As of the 2010 census, the population of Prospect was 1,093. The median age of the population was 44.7 years. The median household income was $41,250. The median home value was $179,000. The town is predominantly white, with a small Hispanic population.
Common Questions
What is Per Capita Income in Prospect?
Per Capita income in Prospect is $21,543.
What is the Median Family Income in Prospect?
Median Family Income in Prospect is $49,231.
What is the Median Household income in Prospect?
Median Household Income in Prospect is $40,357.
What is Inequality or Gini Index in Prospect?
Inequality or Gini Index in Prospect is 0.35.
What is the Total Population of Prospect?
Total Population of Prospect is 661.
What is the Total Male Population of Prospect?
Total Male Population of Prospect is 328.
What is the Total Female Population of Prospect?
Total Female Population of Prospect is 333.
What is the Ratio of Males per 100 Females in Prospect?
There are 98.50 Males per 100 Females in Prospect.
What is the Ratio of Females per 100 Males in Prospect?
There are 101.52 Females per 100 Males in Prospect.
What is the Median Population Age in Prospect?
Median Population Age in Prospect is 53.3 Years.
What is the Average Family Size in Prospect
Average Family Size in Prospect is 2.9 People.
What is the Average Household Size in Prospect
Average Household Size in Prospect is 2.6 People.
How Large is the Labor Force in Prospect?
There are 184 People in the Labor Forcein in Prospect.
What is the Percentage of People in the Labor Force in Prospect?
35.4% of People are in the Labor Force in Prospect.
What is the Unemployment Rate in Prospect?
Unemployment Rate in Prospect is 2.2%.