Culver, OR Map & Demographics
Culver Map
Culver Overview
$28,151
PER CAPITA INCOME
$87,929
AVG FAMILY INCOME
$81,534
AVG HOUSEHOLD INCOME
5.2%
WAGE / INCOME GAP [ % ]
94.8¢/ $1
WAGE / INCOME GAP [ $ ]
0.34
INEQUALITY / GINI INDEX
2,173
TOTAL POPULATION
1,048
MALE POPULATION
1,125
FEMALE POPULATION
93.16
MALES / 100 FEMALES
107.35
FEMALES / 100 MALES
30.6
MEDIAN AGE
3.9
AVG FAMILY SIZE
3.1
AVG HOUSEHOLD SIZE
1,303
LABOR FORCE [ PEOPLE ]
74.1%
PERCENT IN LABOR FORCE
1.3%
UNEMPLOYMENT RATE
Culver Zip Codes
Culver Area Codes
Income in Culver
Income Overview in Culver
Per Capita Income in Culver is $28,151, while median incomes of families and households are $87,929 and $81,534 respectively.
| Characteristic | Number | Measure |
| Per Capita Income | 2,173 | $28,151 |
| Median Family Income | 472 | $87,929 |
| Mean Family Income | 472 | $98,189 |
| Median Household Income | 687 | $81,534 |
| Mean Household Income | 687 | $85,784 |
| Income Deficit | 472 | $0 |
| Wage / Income Gap (%) | 2,173 | 5.19% |
| Wage / Income Gap ($) | 2,173 | 94.81¢ per $1 |
| Gini / Inequality Index | 2,173 | 0.34 |
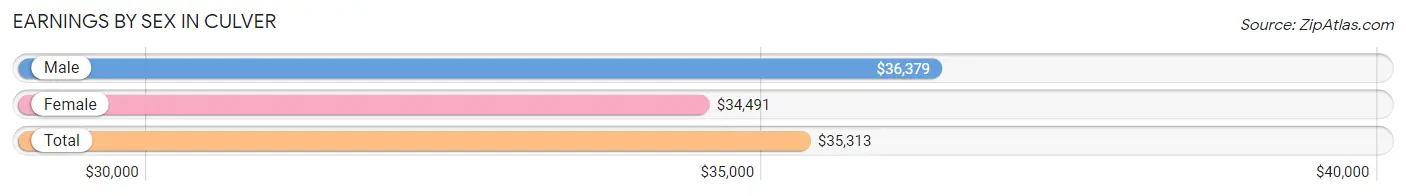
Earnings by Sex in Culver
Average Earnings in Culver are $35,313, $36,379 for men and $34,491 for women, a difference of 5.2%.
| Sex | Number | Average Earnings |
| Male | 782 (55.8%) | $36,379 |
| Female | 620 (44.2%) | $34,491 |
| Total | 1,402 (100.0%) | $35,313 |
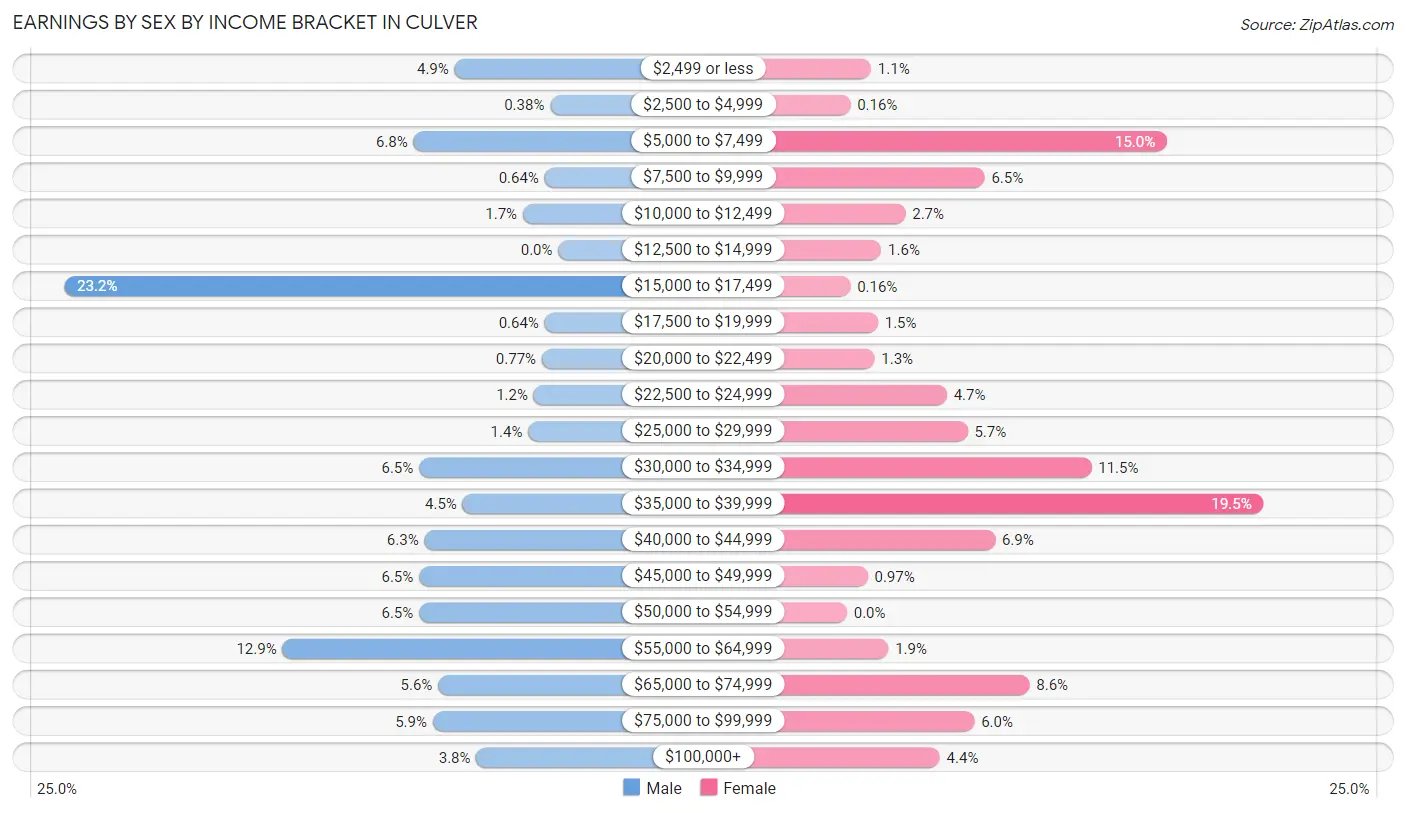
Earnings by Sex by Income Bracket in Culver
The most common earnings brackets in Culver are $15,000 to $17,499 for men (181 | 23.2%) and $35,000 to $39,999 for women (121 | 19.5%).
| Income | Male | Female |
| $2,499 or less | 38 (4.9%) | 7 (1.1%) |
| $2,500 to $4,999 | 3 (0.4%) | 1 (0.2%) |
| $5,000 to $7,499 | 53 (6.8%) | 93 (15.0%) |
| $7,500 to $9,999 | 5 (0.6%) | 40 (6.5%) |
| $10,000 to $12,499 | 13 (1.7%) | 17 (2.7%) |
| $12,500 to $14,999 | 0 (0.0%) | 10 (1.6%) |
| $15,000 to $17,499 | 181 (23.2%) | 1 (0.2%) |
| $17,500 to $19,999 | 5 (0.6%) | 9 (1.5%) |
| $20,000 to $22,499 | 6 (0.8%) | 8 (1.3%) |
| $22,500 to $24,999 | 9 (1.1%) | 29 (4.7%) |
| $25,000 to $29,999 | 11 (1.4%) | 35 (5.7%) |
| $30,000 to $34,999 | 51 (6.5%) | 71 (11.5%) |
| $35,000 to $39,999 | 35 (4.5%) | 121 (19.5%) |
| $40,000 to $44,999 | 49 (6.3%) | 43 (6.9%) |
| $45,000 to $49,999 | 51 (6.5%) | 6 (1.0%) |
| $50,000 to $54,999 | 51 (6.5%) | 0 (0.0%) |
| $55,000 to $64,999 | 101 (12.9%) | 12 (1.9%) |
| $65,000 to $74,999 | 44 (5.6%) | 53 (8.6%) |
| $75,000 to $99,999 | 46 (5.9%) | 37 (6.0%) |
| $100,000+ | 30 (3.8%) | 27 (4.3%) |
| Total | 782 (100.0%) | 620 (100.0%) |
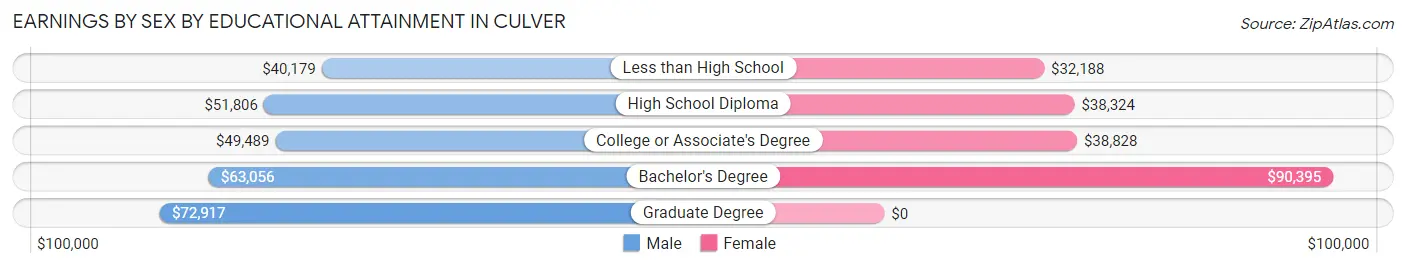
Earnings by Sex by Educational Attainment in Culver
Average earnings in Culver are $49,773 for men and $38,511 for women, a difference of 22.6%. Men with an educational attainment of graduate degree enjoy the highest average annual earnings of $72,917, while those with less than high school education earn the least with $40,179. Women with an educational attainment of bachelor's degree earn the most with the average annual earnings of $90,395, while those with less than high school education have the smallest earnings of $32,188.
| Educational Attainment | Male Income | Female Income |
| Less than High School | $40,179 | $32,188 |
| High School Diploma | $51,806 | $38,324 |
| College or Associate's Degree | $49,489 | $38,828 |
| Bachelor's Degree | $63,056 | $90,395 |
| Graduate Degree | $72,917 | $0 |
| Total | $49,773 | $38,511 |
Family Income in Culver
Family Income Brackets in Culver
According to the Culver family income data, there are 126 families falling into the $75,000 to $99,999 income range, which is the most common income bracket and makes up 26.7% of all families.
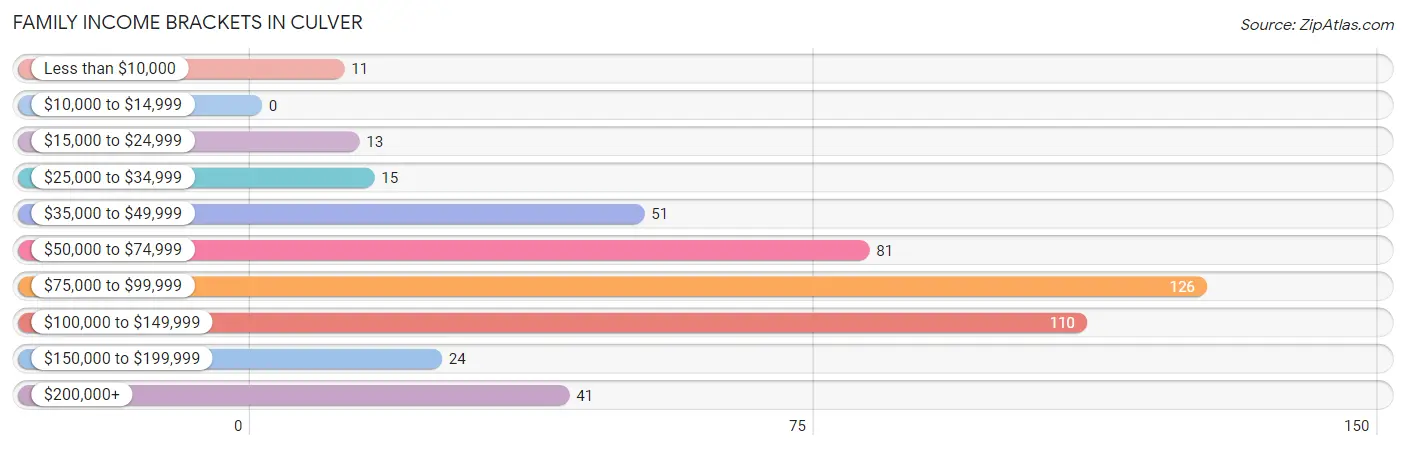
| Income Bracket | # Families | % Families |
| Less than $10,000 | 11 | 2.3% |
| $10,000 to $14,999 | 0 | 0.0% |
| $15,000 to $24,999 | 13 | 2.8% |
| $25,000 to $34,999 | 15 | 3.2% |
| $35,000 to $49,999 | 51 | 10.8% |
| $50,000 to $74,999 | 81 | 17.2% |
| $75,000 to $99,999 | 126 | 26.7% |
| $100,000 to $149,999 | 110 | 23.3% |
| $150,000 to $199,999 | 24 | 5.1% |
| $200,000+ | 41 | 8.7% |
Family Income by Famaliy Size in Culver
3-person families (77 | 16.3%) account for the highest median family income in Culver with $89,464 per family, while 2-person families (149 | 31.6%) have the highest median income of $32,266 per family member.
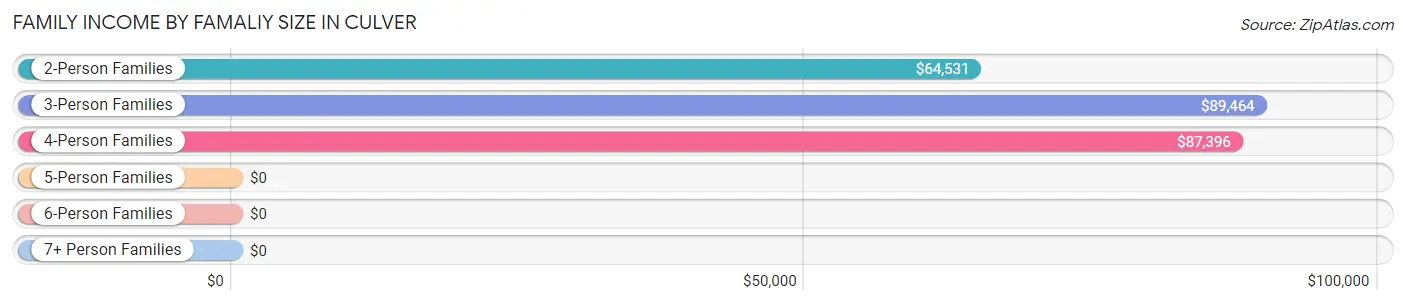
| Income Bracket | # Families | Median Income |
| 2-Person Families | 149 (31.6%) | $64,531 |
| 3-Person Families | 77 (16.3%) | $89,464 |
| 4-Person Families | 132 (28.0%) | $87,396 |
| 5-Person Families | 92 (19.5%) | $0 |
| 6-Person Families | 18 (3.8%) | $0 |
| 7+ Person Families | 4 (0.9%) | $0 |
| Total | 472 (100.0%) | $87,929 |
Family Income by Number of Earners in Culver
The median family income in Culver is $87,929, with families comprising 3+ earners (111) having the highest median family income of $143,281, while families with no earners (22) have the lowest median family income of $38,750, accounting for 23.5% and 4.7% of families, respectively.
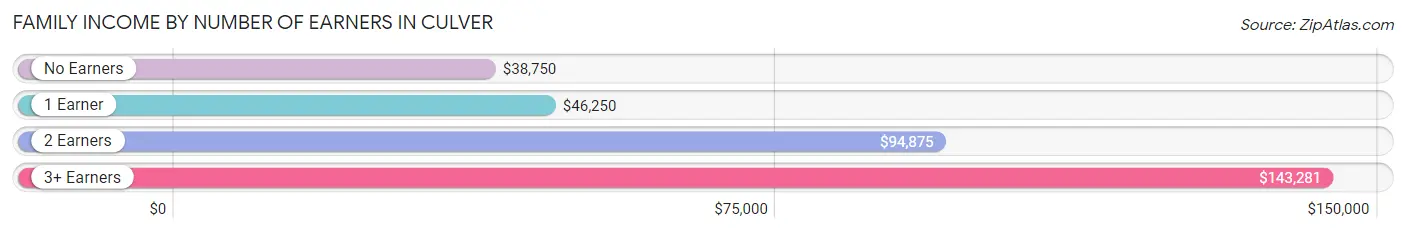
| Number of Earners | # Families | Median Income |
| No Earners | 22 (4.7%) | $38,750 |
| 1 Earner | 120 (25.4%) | $46,250 |
| 2 Earners | 219 (46.4%) | $94,875 |
| 3+ Earners | 111 (23.5%) | $143,281 |
| Total | 472 (100.0%) | $87,929 |
Household Income in Culver
Household Income Brackets in Culver
With 173 households falling in the category, the $75,000 to $99,999 income range is the most frequent in Culver, accounting for 25.2% of all households. In contrast, only 19 households (2.8%) fall into the $10,000 to $14,999 income bracket, making it the least populous group.
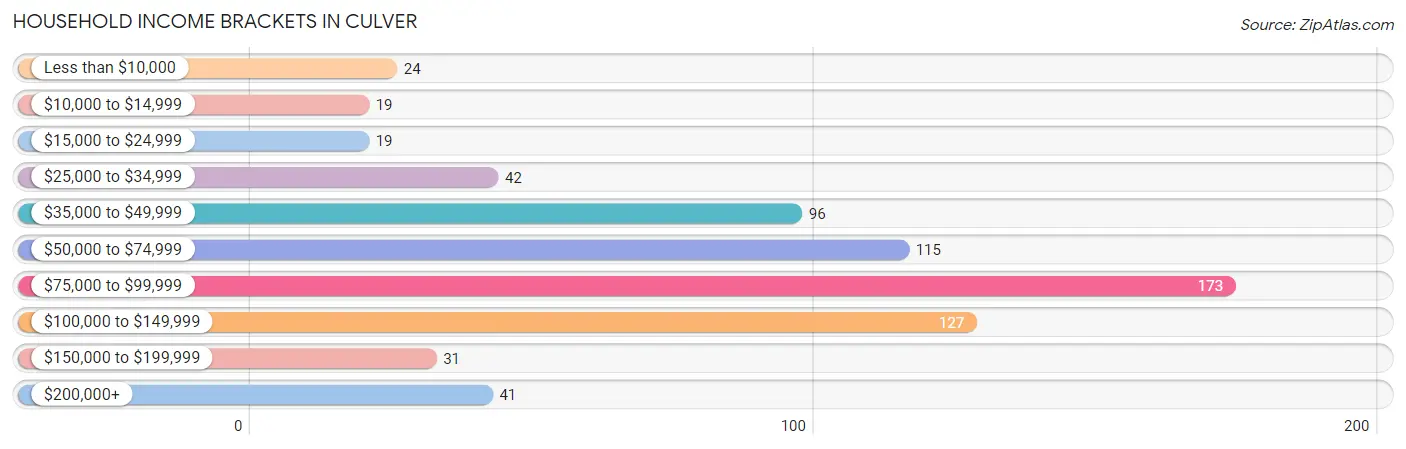
| Income Bracket | # Households | % Households |
| Less than $10,000 | 24 | 3.5% |
| $10,000 to $14,999 | 19 | 2.8% |
| $15,000 to $24,999 | 19 | 2.8% |
| $25,000 to $34,999 | 42 | 6.1% |
| $35,000 to $49,999 | 96 | 14.0% |
| $50,000 to $74,999 | 115 | 16.7% |
| $75,000 to $99,999 | 173 | 25.2% |
| $100,000 to $149,999 | 127 | 18.5% |
| $150,000 to $199,999 | 31 | 4.5% |
| $200,000+ | 41 | 6.0% |
Household Income by Householder Age in Culver
The median household income in Culver is $81,534, with the highest median household income of $86,302 found in the 25 to 44 years age bracket for the primary householder. A total of 209 households (30.4%) fall into this category. Meanwhile, the 15 to 24 years age bracket for the primary householder has the lowest median household income of $0, with 13 households (1.9%) in this group.
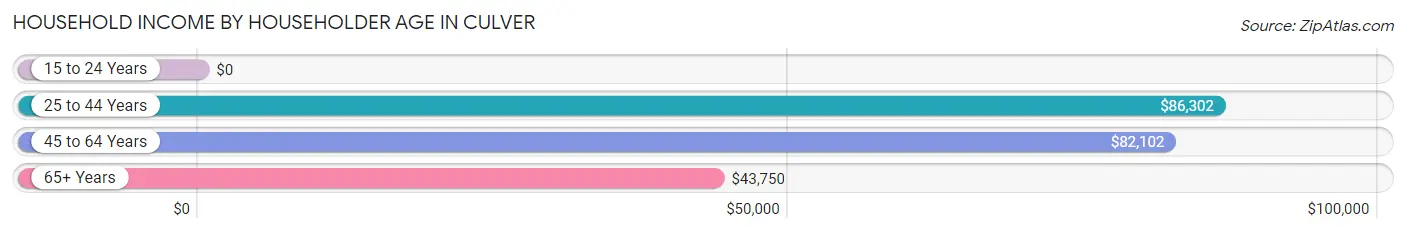
| Income Bracket | # Households | Median Income |
| 15 to 24 Years | 13 (1.9%) | $0 |
| 25 to 44 Years | 209 (30.4%) | $86,302 |
| 45 to 64 Years | 369 (53.7%) | $82,102 |
| 65+ Years | 96 (14.0%) | $43,750 |
| Total | 687 (100.0%) | $81,534 |
Poverty in Culver
Income Below Poverty by Sex and Age in Culver
With 5.5% poverty level for males and 6.0% for females among the residents of Culver, 75 year old and over males and 5 year old females are the most vulnerable to poverty, with 5 males (17.9%) and 4 females (21.0%) in their respective age groups living below the poverty level.
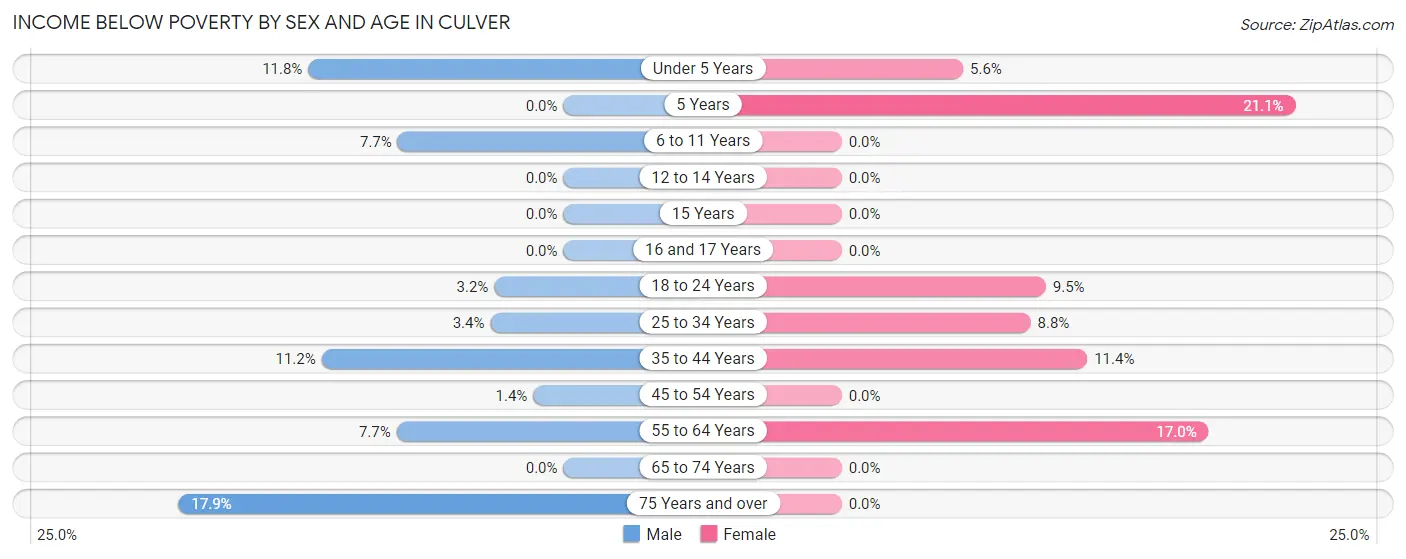
| Age Bracket | Male | Female |
| Under 5 Years | 9 (11.8%) | 4 (5.6%) |
| 5 Years | 0 (0.0%) | 4 (21.0%) |
| 6 to 11 Years | 3 (7.7%) | 0 (0.0%) |
| 12 to 14 Years | 0 (0.0%) | 0 (0.0%) |
| 15 Years | 0 (0.0%) | 0 (0.0%) |
| 16 and 17 Years | 0 (0.0%) | 0 (0.0%) |
| 18 to 24 Years | 8 (3.2%) | 9 (9.5%) |
| 25 to 34 Years | 6 (3.4%) | 17 (8.8%) |
| 35 to 44 Years | 11 (11.2%) | 9 (11.4%) |
| 45 to 54 Years | 2 (1.4%) | 0 (0.0%) |
| 55 to 64 Years | 13 (7.7%) | 24 (17.0%) |
| 65 to 74 Years | 0 (0.0%) | 0 (0.0%) |
| 75 Years and over | 5 (17.9%) | 0 (0.0%) |
| Total | 57 (5.5%) | 67 (6.0%) |
Income Above Poverty by Sex and Age in Culver
According to the poverty statistics in Culver, males aged 5 years and females aged 6 to 11 years are the age groups that are most secure financially, with 100.0% of males and 100.0% of females in these age groups living above the poverty line.
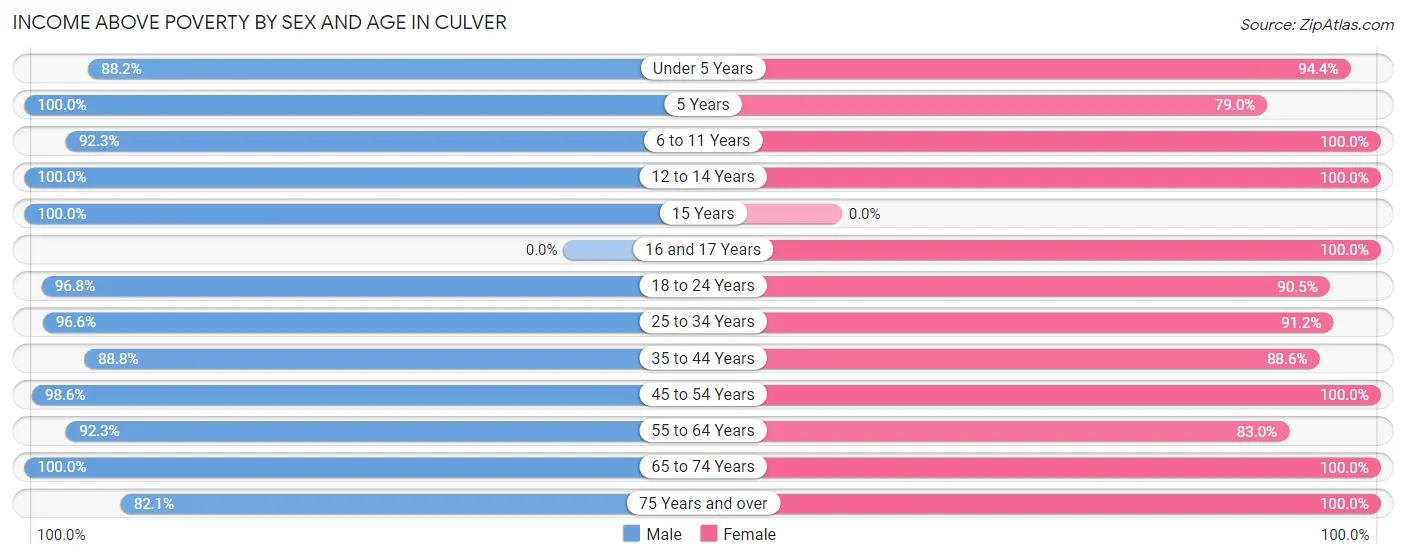
| Age Bracket | Male | Female |
| Under 5 Years | 67 (88.2%) | 67 (94.4%) |
| 5 Years | 6 (100.0%) | 15 (78.9%) |
| 6 to 11 Years | 36 (92.3%) | 104 (100.0%) |
| 12 to 14 Years | 15 (100.0%) | 73 (100.0%) |
| 15 Years | 7 (100.0%) | 0 (0.0%) |
| 16 and 17 Years | 0 (0.0%) | 88 (100.0%) |
| 18 to 24 Years | 241 (96.8%) | 86 (90.5%) |
| 25 to 34 Years | 171 (96.6%) | 177 (91.2%) |
| 35 to 44 Years | 87 (88.8%) | 70 (88.6%) |
| 45 to 54 Years | 141 (98.6%) | 153 (100.0%) |
| 55 to 64 Years | 155 (92.3%) | 117 (83.0%) |
| 65 to 74 Years | 33 (100.0%) | 57 (100.0%) |
| 75 Years and over | 23 (82.1%) | 46 (100.0%) |
| Total | 982 (94.5%) | 1,053 (94.0%) |
Income Below Poverty Among Married-Couple Families in Culver
The poverty statistics for married-couple families in Culver show that 2.1% or 8 of the total 380 families live below the poverty line. Families with 1 or 2 children have the highest poverty rate of 5.8%, comprising of 8 families. On the other hand, families with no children have the lowest poverty rate of 0.0%, which includes 0 families.
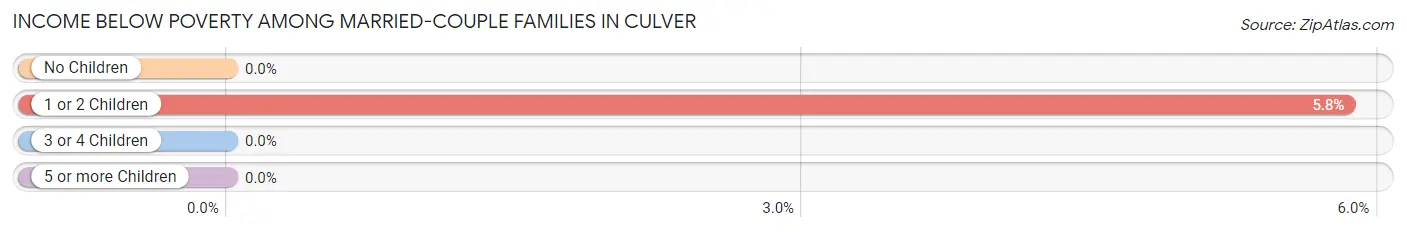
| Children | Above Poverty | Below Poverty |
| No Children | 187 (100.0%) | 0 (0.0%) |
| 1 or 2 Children | 129 (94.2%) | 8 (5.8%) |
| 3 or 4 Children | 56 (100.0%) | 0 (0.0%) |
| 5 or more Children | 0 (0.0%) | 0 (0.0%) |
| Total | 372 (97.9%) | 8 (2.1%) |
Income Below Poverty Among Single-Parent Households in Culver
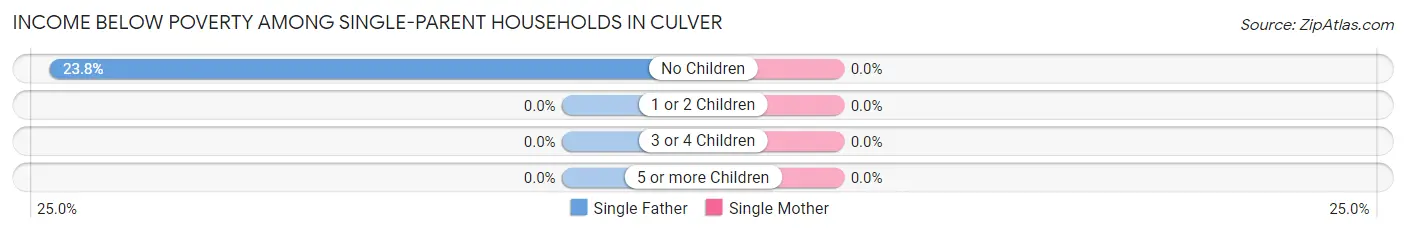
| Children | Single Father | Single Mother |
| No Children | 5 (23.8%) | 0 (0.0%) |
| 1 or 2 Children | 0 (0.0%) | 0 (0.0%) |
| 3 or 4 Children | 0 (0.0%) | 0 (0.0%) |
| 5 or more Children | 0 (0.0%) | 0 (0.0%) |
| Total | 5 (15.1%) | 0 (0.0%) |
Income Below Poverty Among Married-Couple vs Single-Parent Households in Culver
The poverty data for Culver shows that 8 of the married-couple family households (2.1%) and 5 of the single-parent households (5.4%) are living below the poverty level. Within the married-couple family households, those with 1 or 2 children have the highest poverty rate, with 8 households (5.8%) falling below the poverty line. Among the single-parent households, those with no children have the highest poverty rate, with 5 household (9.8%) living below poverty.
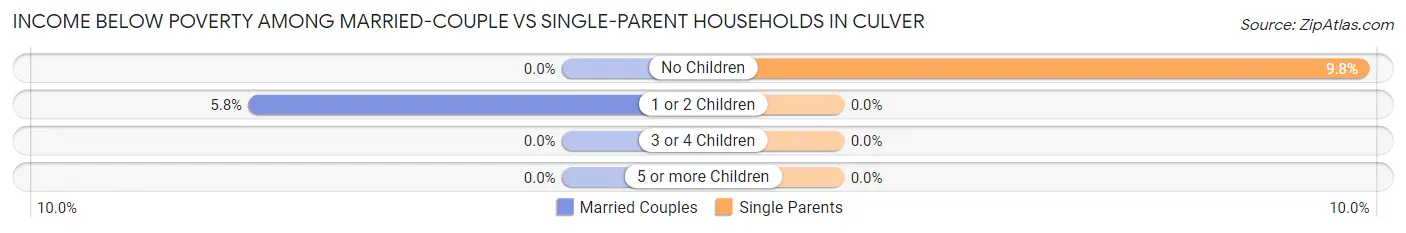
| Children | Married-Couple Families | Single-Parent Households |
| No Children | 0 (0.0%) | 5 (9.8%) |
| 1 or 2 Children | 8 (5.8%) | 0 (0.0%) |
| 3 or 4 Children | 0 (0.0%) | 0 (0.0%) |
| 5 or more Children | 0 (0.0%) | 0 (0.0%) |
| Total | 8 (2.1%) | 5 (5.4%) |
Race in Culver
The most populous races in Culver are White / Caucasian (1,528 | 70.3%), Hispanic or Latino (901 | 41.5%), and Two or more Races (362 | 16.7%).
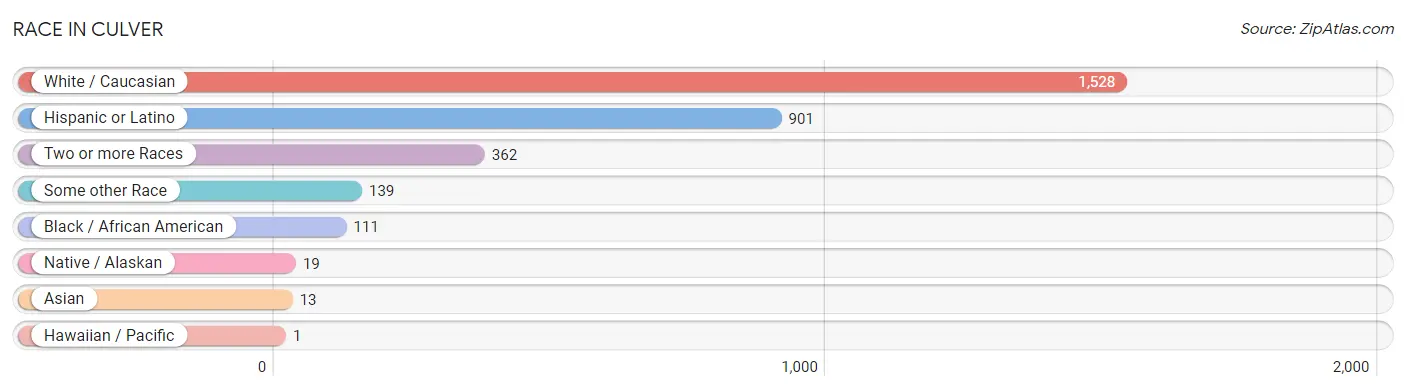
| Race | # Population | % Population |
| Asian | 13 | 0.6% |
| Black / African American | 111 | 5.1% |
| Hawaiian / Pacific | 1 | 0.1% |
| Hispanic or Latino | 901 | 41.5% |
| Native / Alaskan | 19 | 0.9% |
| White / Caucasian | 1,528 | 70.3% |
| Two or more Races | 362 | 16.7% |
| Some other Race | 139 | 6.4% |
| Total | 2,173 | 100.0% |
Ancestry in Culver
The most populous ancestries reported in Culver are Mexican (853 | 39.3%), German (240 | 11.0%), Irish (239 | 11.0%), English (236 | 10.9%), and American (112 | 5.1%), together accounting for 77.3% of all Culver residents.
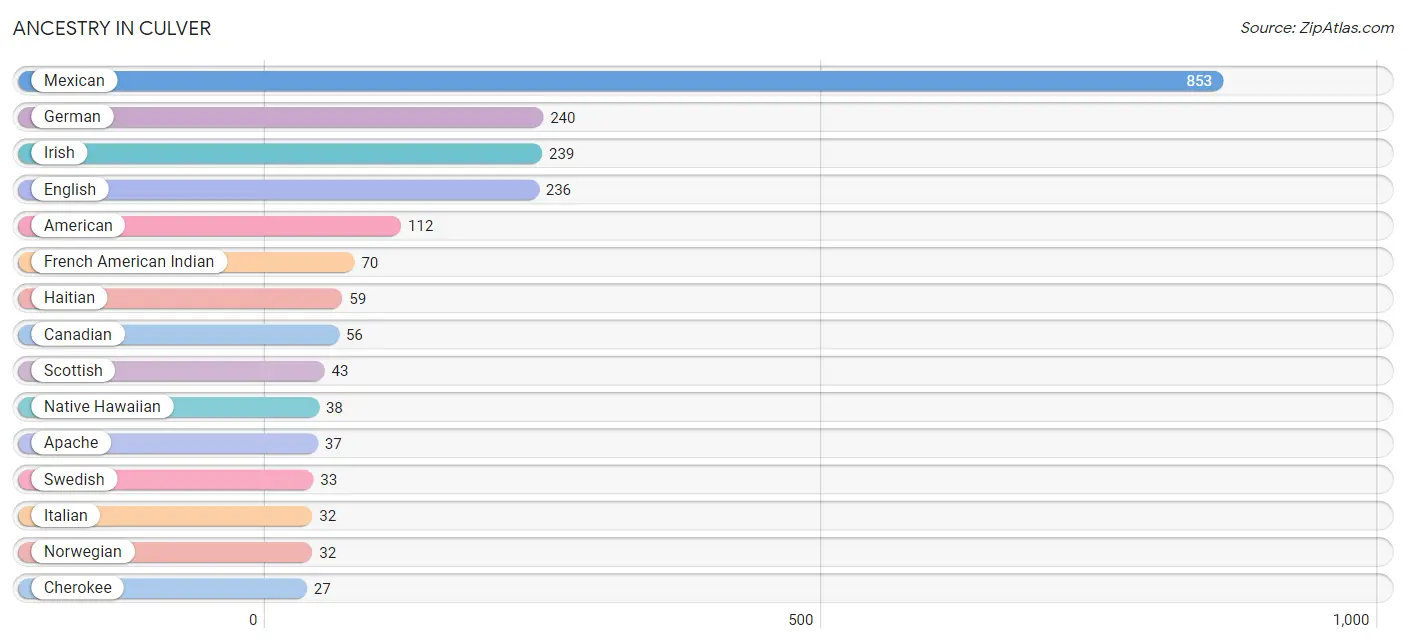
| Ancestry | # Population | % Population |
| American | 112 | 5.1% |
| Apache | 37 | 1.7% |
| Austrian | 5 | 0.2% |
| Belgian | 13 | 0.6% |
| Burmese | 1 | 0.1% |
| Canadian | 56 | 2.6% |
| Cherokee | 27 | 1.2% |
| Cheyenne | 15 | 0.7% |
| Chippewa | 1 | 0.1% |
| Czechoslovakian | 1 | 0.1% |
| Danish | 9 | 0.4% |
| Dutch | 13 | 0.6% |
| Eastern European | 4 | 0.2% |
| English | 236 | 10.9% |
| European | 4 | 0.2% |
| French | 9 | 0.4% |
| French American Indian | 70 | 3.2% |
| French Canadian | 7 | 0.3% |
| German | 240 | 11.0% |
| Haitian | 59 | 2.7% |
| Houma | 5 | 0.2% |
| Hungarian | 9 | 0.4% |
| Irish | 239 | 11.0% |
| Italian | 32 | 1.5% |
| Korean | 23 | 1.1% |
| Mexican | 853 | 39.3% |
| Mexican American Indian | 19 | 0.9% |
| Native Hawaiian | 38 | 1.8% |
| Norwegian | 32 | 1.5% |
| Polish | 4 | 0.2% |
| Portuguese | 12 | 0.5% |
| Puerto Rican | 2 | 0.1% |
| Samoan | 12 | 0.5% |
| Scotch-Irish | 2 | 0.1% |
| Scottish | 43 | 2.0% |
| Spanish American | 5 | 0.2% |
| Swedish | 33 | 1.5% |
| Welsh | 20 | 0.9% | View All 38 Rows |
Immigrants in Culver
The most numerous immigrant groups reported in Culver came from Latin America (355 | 16.3%), Central America (296 | 13.6%), Mexico (277 | 12.8%), Caribbean (59 | 2.7%), and Haiti (59 | 2.7%), together accounting for 48.1% of all Culver residents.
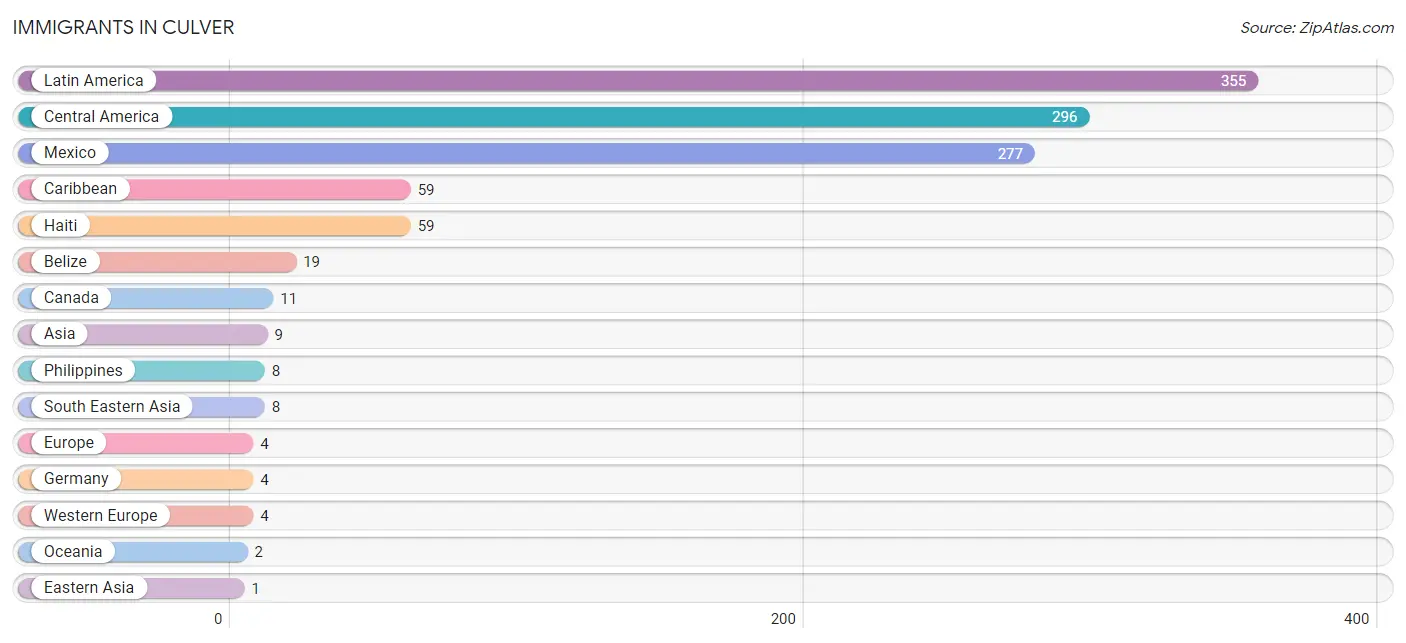
| Immigration Origin | # Population | % Population |
| Asia | 9 | 0.4% |
| Belize | 19 | 0.9% |
| Canada | 11 | 0.5% |
| Caribbean | 59 | 2.7% |
| Central America | 296 | 13.6% |
| Eastern Asia | 1 | 0.1% |
| Europe | 4 | 0.2% |
| Germany | 4 | 0.2% |
| Haiti | 59 | 2.7% |
| Korea | 1 | 0.1% |
| Latin America | 355 | 16.3% |
| Mexico | 277 | 12.8% |
| Oceania | 2 | 0.1% |
| Philippines | 8 | 0.4% |
| South Eastern Asia | 8 | 0.4% |
| Western Europe | 4 | 0.2% | View All 16 Rows |
Sex and Age in Culver
Sex and Age in Culver
The most populous age groups in Culver are 20 to 24 Years (227 | 21.7%) for men and 45 to 49 Years (126 | 11.2%) for women.
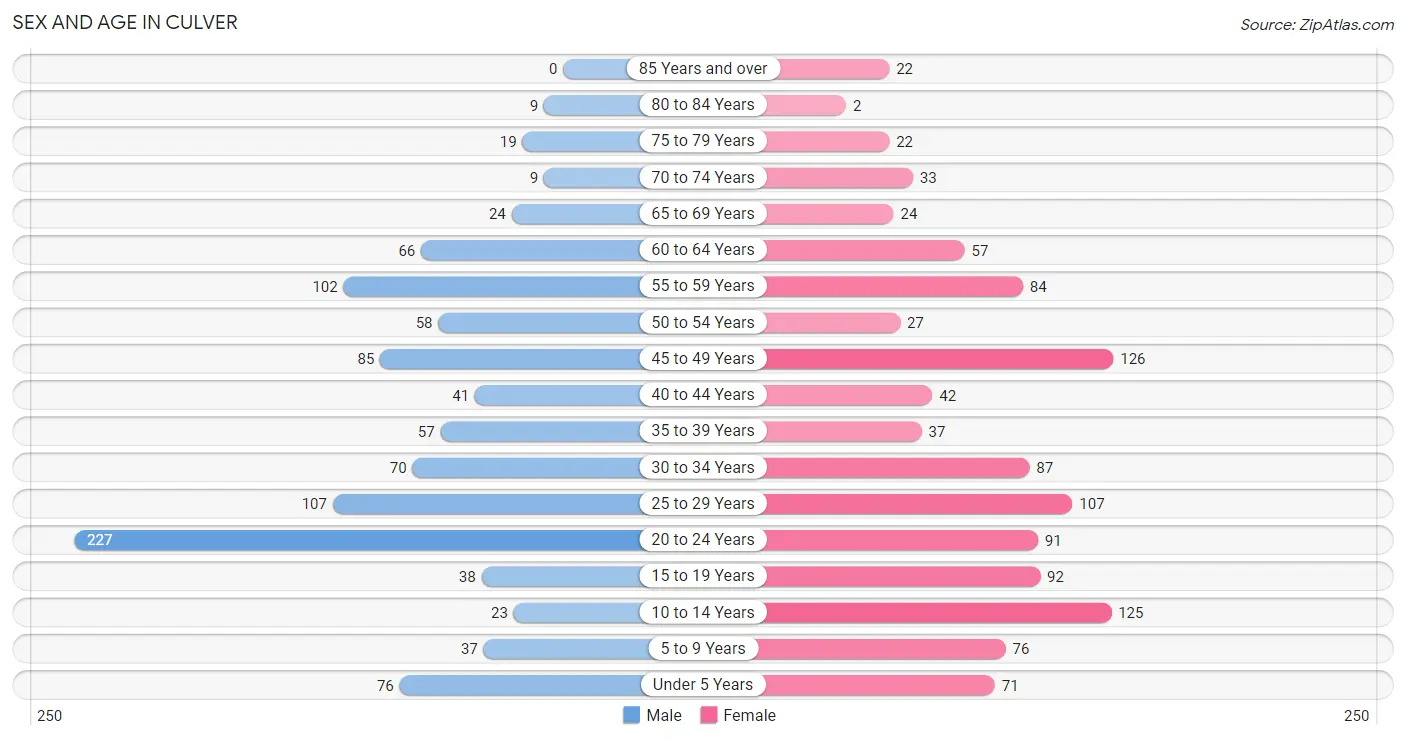
| Age Bracket | Male | Female |
| Under 5 Years | 76 (7.2%) | 71 (6.3%) |
| 5 to 9 Years | 37 (3.5%) | 76 (6.8%) |
| 10 to 14 Years | 23 (2.2%) | 125 (11.1%) |
| 15 to 19 Years | 38 (3.6%) | 92 (8.2%) |
| 20 to 24 Years | 227 (21.7%) | 91 (8.1%) |
| 25 to 29 Years | 107 (10.2%) | 107 (9.5%) |
| 30 to 34 Years | 70 (6.7%) | 87 (7.7%) |
| 35 to 39 Years | 57 (5.4%) | 37 (3.3%) |
| 40 to 44 Years | 41 (3.9%) | 42 (3.7%) |
| 45 to 49 Years | 85 (8.1%) | 126 (11.2%) |
| 50 to 54 Years | 58 (5.5%) | 27 (2.4%) |
| 55 to 59 Years | 102 (9.7%) | 84 (7.5%) |
| 60 to 64 Years | 66 (6.3%) | 57 (5.1%) |
| 65 to 69 Years | 24 (2.3%) | 24 (2.1%) |
| 70 to 74 Years | 9 (0.9%) | 33 (2.9%) |
| 75 to 79 Years | 19 (1.8%) | 22 (2.0%) |
| 80 to 84 Years | 9 (0.9%) | 2 (0.2%) |
| 85 Years and over | 0 (0.0%) | 22 (2.0%) |
| Total | 1,048 (100.0%) | 1,125 (100.0%) |
Families and Households in Culver
Median Family Size in Culver
The median family size in Culver is 3.86 persons per family, with single female/mother families (59 | 12.5%) accounting for the largest median family size of 3.92 persons per family. On the other hand, single male/father families (33 | 7.0%) represent the smallest median family size with 3.48 persons per family.
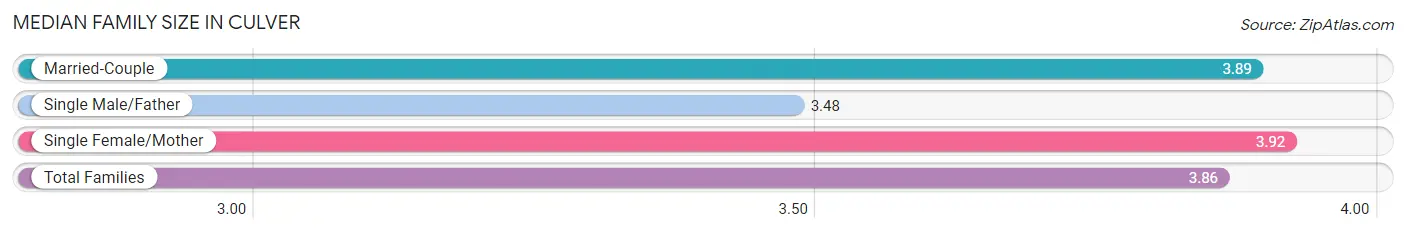
| Family Type | # Families | Family Size |
| Married-Couple | 380 (80.5%) | 3.89 |
| Single Male/Father | 33 (7.0%) | 3.48 |
| Single Female/Mother | 59 (12.5%) | 3.92 |
| Total Families | 472 (100.0%) | 3.86 |
Median Household Size in Culver
The median household size in Culver is 3.15 persons per household, with single male/father households (33 | 4.8%) accounting for the largest median household size of 4.03 persons per household. non-family households (215 | 31.3%) represent the smallest median household size with 1.38 persons per household.
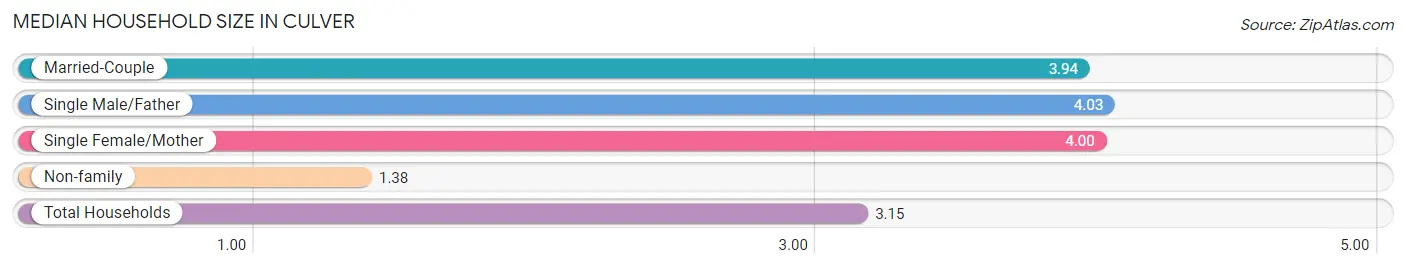
| Household Type | # Households | Household Size |
| Married-Couple | 380 (55.3%) | 3.94 |
| Single Male/Father | 33 (4.8%) | 4.03 |
| Single Female/Mother | 59 (8.6%) | 4.00 |
| Non-family | 215 (31.3%) | 1.38 |
| Total Households | 687 (100.0%) | 3.15 |
Household Size by Marriage Status in Culver
Out of a total of 687 households in Culver, 472 (68.7%) are family households, while 215 (31.3%) are nonfamily households. The most numerous type of family households are 2-person households, comprising 142, and the most common type of nonfamily households are 1-person households, comprising 154.
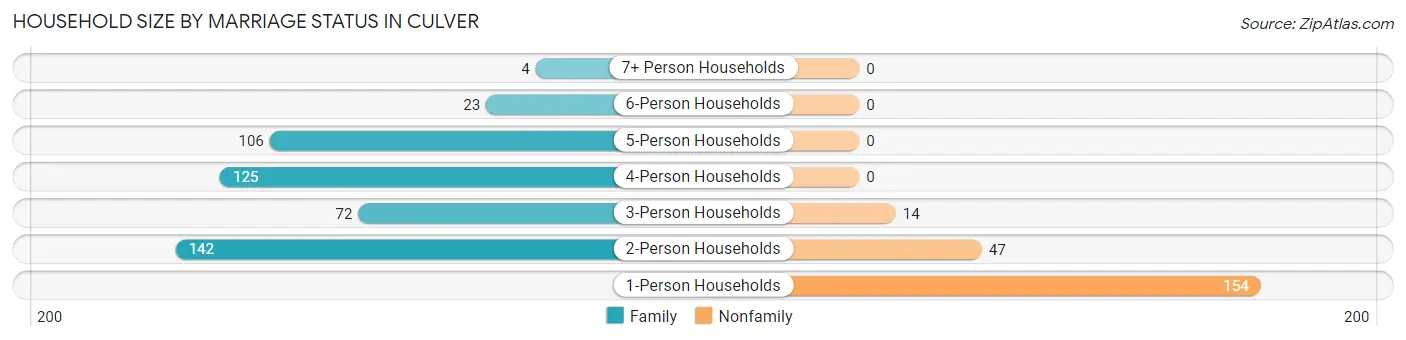
| Household Size | Family Households | Nonfamily Households |
| 1-Person Households | - | 154 (22.4%) |
| 2-Person Households | 142 (20.7%) | 47 (6.8%) |
| 3-Person Households | 72 (10.5%) | 14 (2.0%) |
| 4-Person Households | 125 (18.2%) | 0 (0.0%) |
| 5-Person Households | 106 (15.4%) | 0 (0.0%) |
| 6-Person Households | 23 (3.4%) | 0 (0.0%) |
| 7+ Person Households | 4 (0.6%) | 0 (0.0%) |
| Total | 472 (68.7%) | 215 (31.3%) |
Female Fertility in Culver
Fertility by Age in Culver
Average fertility rate in Culver is 37.0 births per 1,000 women. Women in the age bracket of 20 to 34 years have the highest fertility rate with 67.0 births per 1,000 women. Women in the age bracket of 20 to 34 years acount for 86.4% of all women with births.
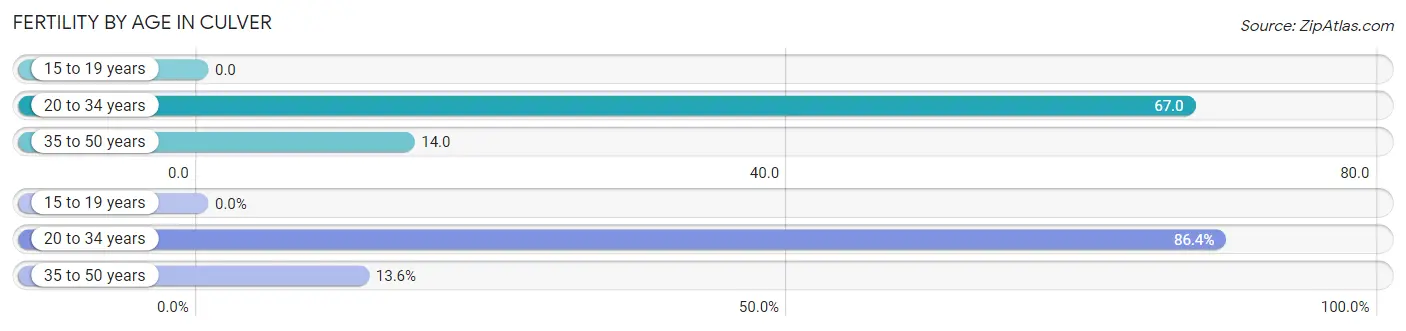
| Age Bracket | Women with Births | Births / 1,000 Women |
| 15 to 19 years | 0 (0.0%) | 0.0 |
| 20 to 34 years | 19 (86.4%) | 67.0 |
| 35 to 50 years | 3 (13.6%) | 14.0 |
| Total | 22 (100.0%) | 37.0 |
Fertility by Age by Marriage Status in Culver
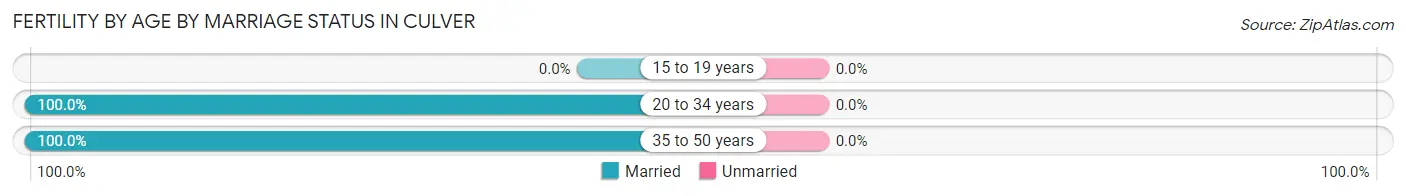
| Age Bracket | Married | Unmarried |
| 15 to 19 years | 0 (0.0%) | 0 (0.0%) |
| 20 to 34 years | 19 (100.0%) | 0 (0.0%) |
| 35 to 50 years | 3 (100.0%) | 0 (0.0%) |
| Total | 22 (100.0%) | 0 (0.0%) |
Fertility by Education in Culver
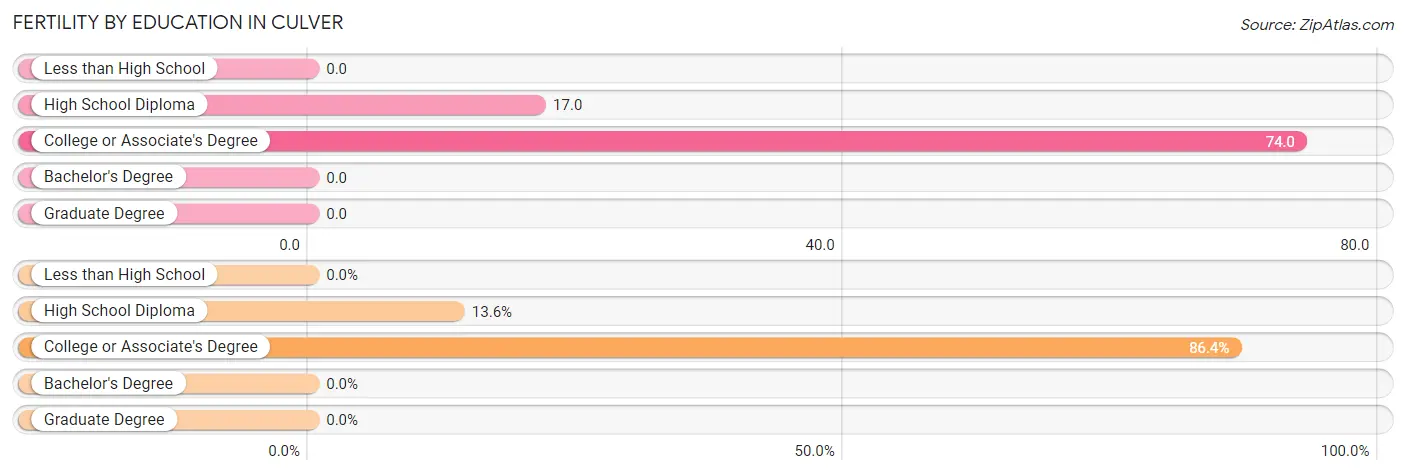
| Educational Attainment | Women with Births | Births / 1,000 Women |
| Less than High School | 0 (0.0%) | 0.0 |
| High School Diploma | 3 (13.6%) | 17.0 |
| College or Associate's Degree | 19 (86.4%) | 74.0 |
| Bachelor's Degree | 0 (0.0%) | 0.0 |
| Graduate Degree | 0 (0.0%) | 0.0 |
| Total | 22 (100.0%) | 37.0 |
Fertility by Education by Marriage Status in Culver
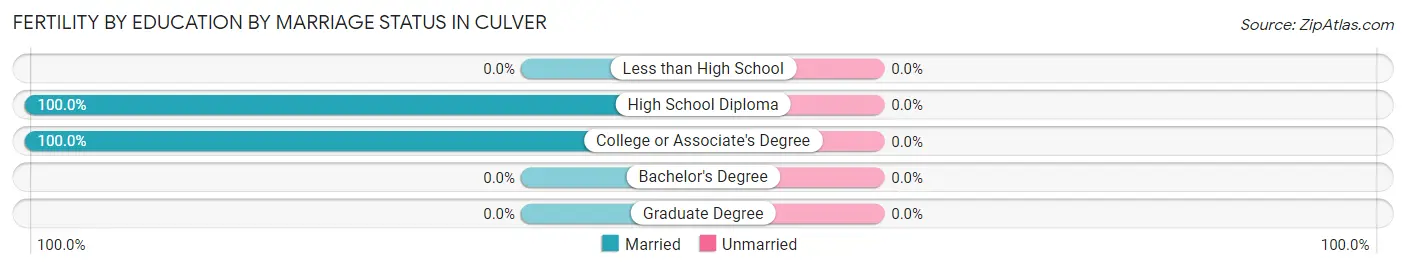
| Educational Attainment | Married | Unmarried |
| Less than High School | 0 (0.0%) | 0 (0.0%) |
| High School Diploma | 3 (100.0%) | 0 (0.0%) |
| College or Associate's Degree | 19 (100.0%) | 0 (0.0%) |
| Bachelor's Degree | 0 (0.0%) | 0 (0.0%) |
| Graduate Degree | 0 (0.0%) | 0 (0.0%) |
| Total | 22 (100.0%) | 0 (0.0%) |
Employment Characteristics in Culver
Employment by Class of Employer in Culver
Among the 1,260 employed individuals in Culver, private company employees (928 | 73.7%), self-employed (not incorporated) (104 | 8.3%), and not-for-profit organizations (78 | 6.2%) make up the most common classes of employment.
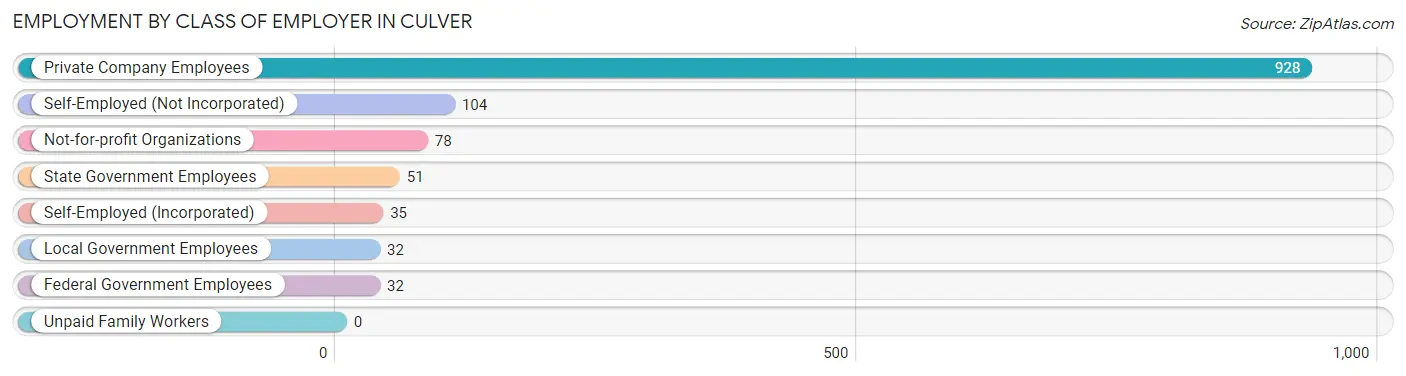
| Employer Class | # Employees | % Employees |
| Private Company Employees | 928 | 73.7% |
| Self-Employed (Incorporated) | 35 | 2.8% |
| Self-Employed (Not Incorporated) | 104 | 8.3% |
| Not-for-profit Organizations | 78 | 6.2% |
| Local Government Employees | 32 | 2.5% |
| State Government Employees | 51 | 4.1% |
| Federal Government Employees | 32 | 2.5% |
| Unpaid Family Workers | 0 | 0.0% |
| Total | 1,260 | 100.0% |
Employment Status by Age in Culver
According to the labor force statistics for Culver, out of the total population over 16 years of age (1,758), 74.1% or 1,303 individuals are in the labor force, with 1.3% or 17 of them unemployed. The age group with the highest labor force participation rate is 45 to 54 years, with 89.5% or 265 individuals in the labor force. Within the labor force, the 60 to 64 years age range has the highest percentage of unemployed individuals, with 10.1% or 10 of them being unemployed.
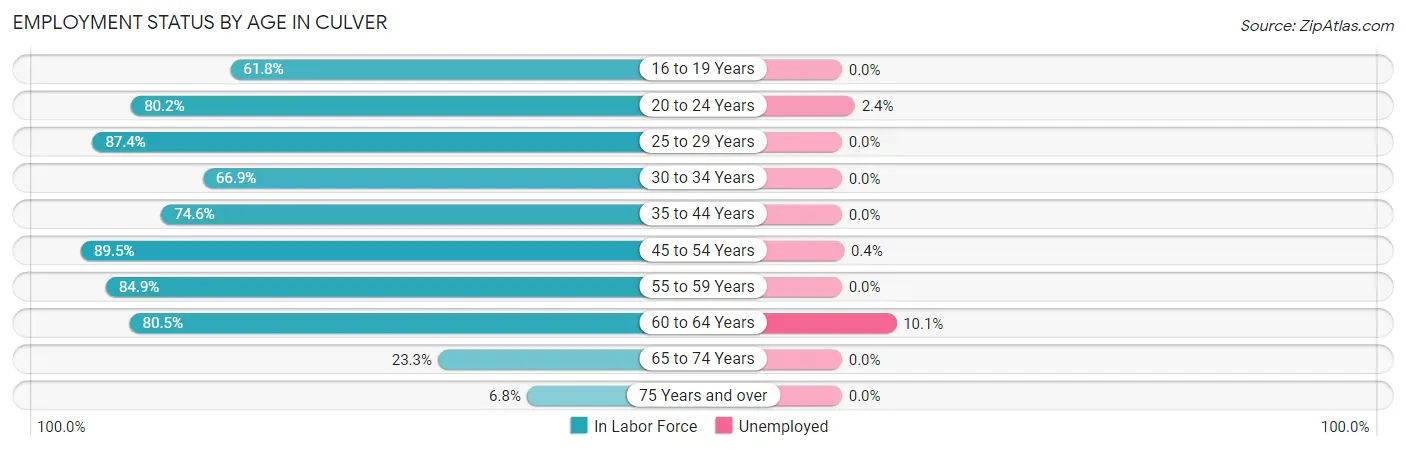
| Age Bracket | In Labor Force | Unemployed |
| 16 to 19 Years | 76 (61.8%) | 0 (0.0%) |
| 20 to 24 Years | 255 (80.2%) | 6 (2.4%) |
| 25 to 29 Years | 187 (87.4%) | 0 (0.0%) |
| 30 to 34 Years | 105 (66.9%) | 0 (0.0%) |
| 35 to 44 Years | 132 (74.6%) | 0 (0.0%) |
| 45 to 54 Years | 265 (89.5%) | 1 (0.4%) |
| 55 to 59 Years | 158 (84.9%) | 0 (0.0%) |
| 60 to 64 Years | 99 (80.5%) | 10 (10.1%) |
| 65 to 74 Years | 21 (23.3%) | 0 (0.0%) |
| 75 Years and over | 5 (6.8%) | 0 (0.0%) |
| Total | 1,303 (74.1%) | 17 (1.3%) |
Employment Status by Educational Attainment in Culver
According to labor force statistics for Culver, 82.0% of individuals (945) out of the total population between 25 and 64 years of age (1,153) are in the labor force, with 1.2% or 11 of them being unemployed. The group with the highest labor force participation rate are those with the educational attainment of high school diploma, with 86.3% or 339 individuals in the labor force. Within the labor force, individuals with high school diploma education have the highest percentage of unemployment, with 2.9% or 10 of them being unemployed.
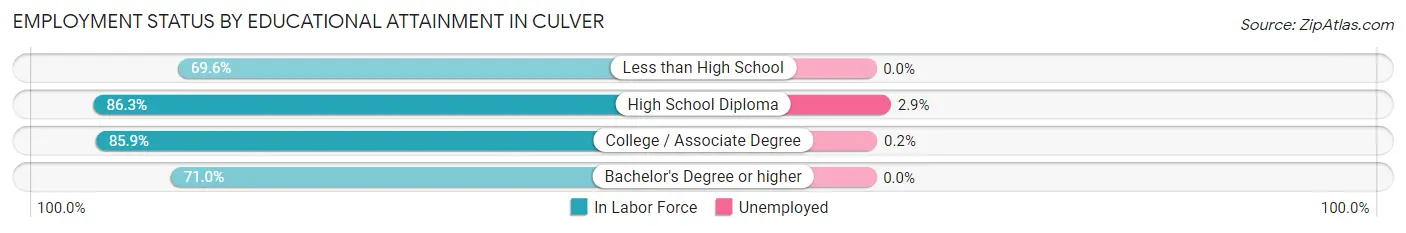
| Educational Attainment | In Labor Force | Unemployed |
| Less than High School | 112 (69.6%) | 0 (0.0%) |
| High School Diploma | 339 (86.3%) | 11 (2.9%) |
| College / Associate Degree | 402 (85.9%) | 1 (0.2%) |
| Bachelor's Degree or higher | 93 (71.0%) | 0 (0.0%) |
| Total | 945 (82.0%) | 14 (1.2%) |
Employment Occupations by Sex in Culver
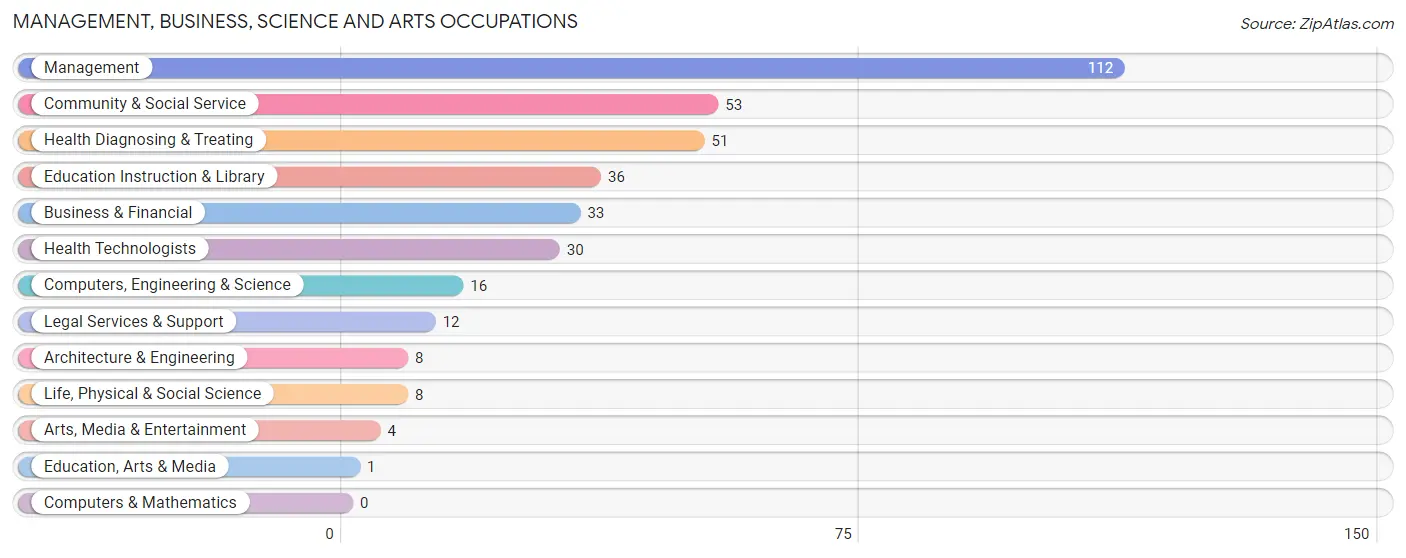
Management, Business, Science and Arts Occupations
The most common Management, Business, Science and Arts occupations in Culver are Management (112 | 8.7%), Community & Social Service (53 | 4.1%), Health Diagnosing & Treating (51 | 4.0%), Education Instruction & Library (36 | 2.8%), and Business & Financial (33 | 2.6%).
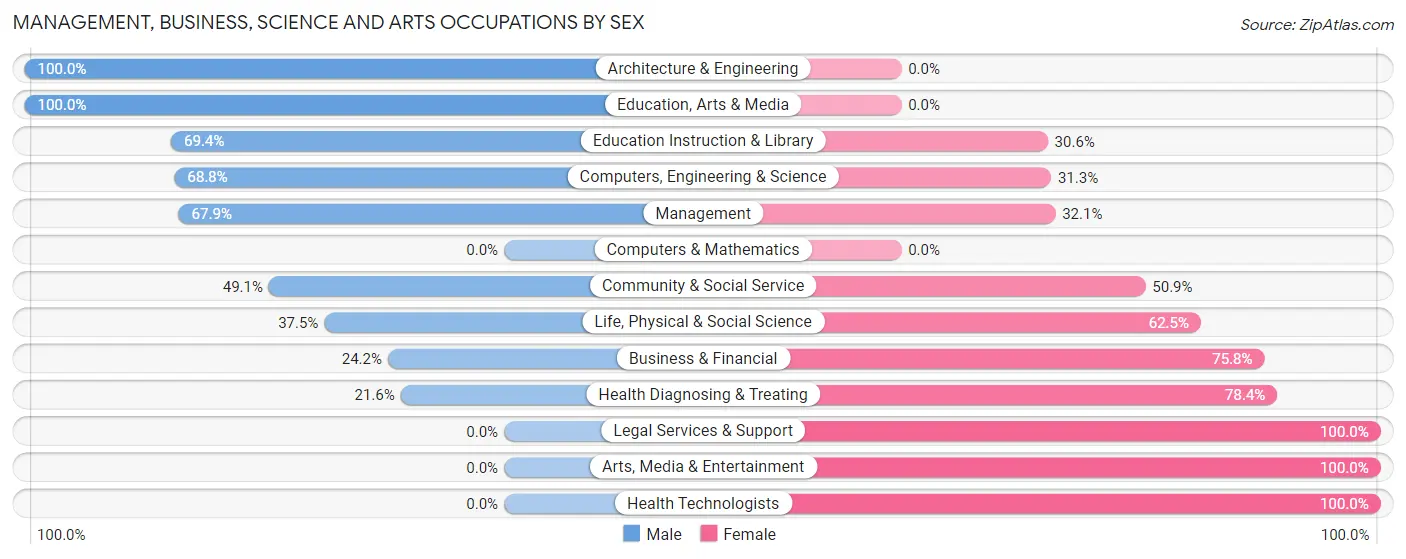
Management, Business, Science and Arts Occupations by Sex
Within the Management, Business, Science and Arts occupations in Culver, the most male-oriented occupations are Architecture & Engineering (100.0%), Education, Arts & Media (100.0%), and Education Instruction & Library (69.4%), while the most female-oriented occupations are Legal Services & Support (100.0%), Arts, Media & Entertainment (100.0%), and Health Technologists (100.0%).
| Occupation | Male | Female |
| Management | 76 (67.9%) | 36 (32.1%) |
| Business & Financial | 8 (24.2%) | 25 (75.8%) |
| Computers, Engineering & Science | 11 (68.8%) | 5 (31.2%) |
| Computers & Mathematics | 0 (0.0%) | 0 (0.0%) |
| Architecture & Engineering | 8 (100.0%) | 0 (0.0%) |
| Life, Physical & Social Science | 3 (37.5%) | 5 (62.5%) |
| Community & Social Service | 26 (49.1%) | 27 (50.9%) |
| Education, Arts & Media | 1 (100.0%) | 0 (0.0%) |
| Legal Services & Support | 0 (0.0%) | 12 (100.0%) |
| Education Instruction & Library | 25 (69.4%) | 11 (30.6%) |
| Arts, Media & Entertainment | 0 (0.0%) | 4 (100.0%) |
| Health Diagnosing & Treating | 11 (21.6%) | 40 (78.4%) |
| Health Technologists | 0 (0.0%) | 30 (100.0%) |
| Total (Category) | 132 (49.8%) | 133 (50.2%) |
| Total (Overall) | 717 (55.7%) | 569 (44.3%) |
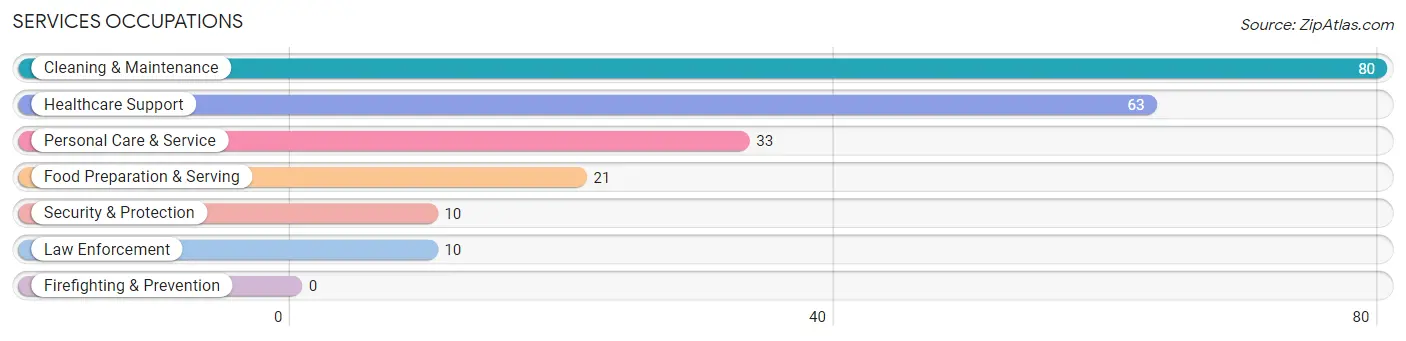
Services Occupations
The most common Services occupations in Culver are Cleaning & Maintenance (80 | 6.2%), Healthcare Support (63 | 4.9%), Personal Care & Service (33 | 2.6%), Food Preparation & Serving (21 | 1.6%), and Security & Protection (10 | 0.8%).
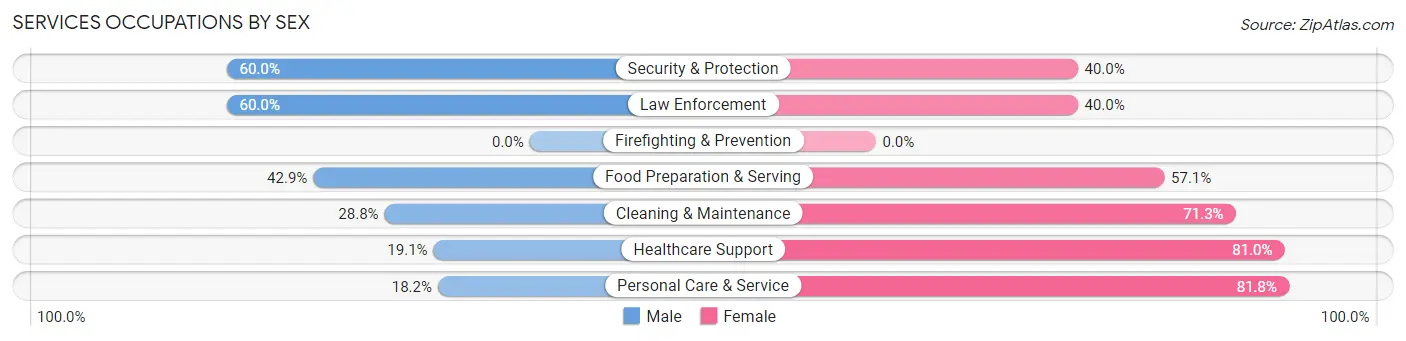
Services Occupations by Sex
Within the Services occupations in Culver, the most male-oriented occupations are Security & Protection (60.0%), Law Enforcement (60.0%), and Food Preparation & Serving (42.9%), while the most female-oriented occupations are Personal Care & Service (81.8%), Healthcare Support (80.9%), and Cleaning & Maintenance (71.3%).
| Occupation | Male | Female |
| Healthcare Support | 12 (19.1%) | 51 (80.9%) |
| Security & Protection | 6 (60.0%) | 4 (40.0%) |
| Firefighting & Prevention | 0 (0.0%) | 0 (0.0%) |
| Law Enforcement | 6 (60.0%) | 4 (40.0%) |
| Food Preparation & Serving | 9 (42.9%) | 12 (57.1%) |
| Cleaning & Maintenance | 23 (28.7%) | 57 (71.3%) |
| Personal Care & Service | 6 (18.2%) | 27 (81.8%) |
| Total (Category) | 56 (27.1%) | 151 (73.0%) |
| Total (Overall) | 717 (55.7%) | 569 (44.3%) |
Sales and Office Occupations
The most common Sales and Office occupations in Culver are Office & Administration (158 | 12.3%), and Sales & Related (59 | 4.6%).
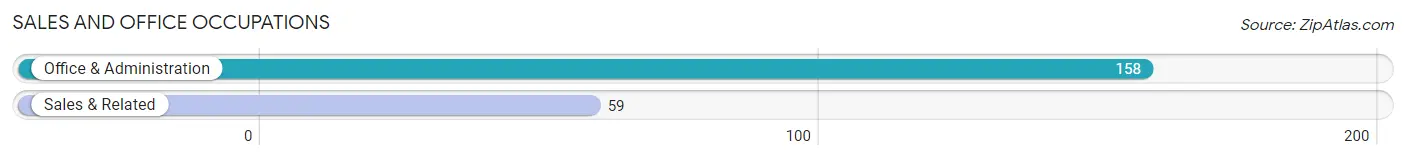
Sales and Office Occupations by Sex
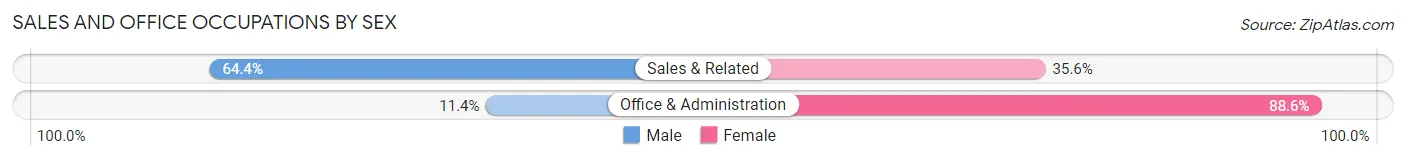
| Occupation | Male | Female |
| Sales & Related | 38 (64.4%) | 21 (35.6%) |
| Office & Administration | 18 (11.4%) | 140 (88.6%) |
| Total (Category) | 56 (25.8%) | 161 (74.2%) |
| Total (Overall) | 717 (55.7%) | 569 (44.3%) |
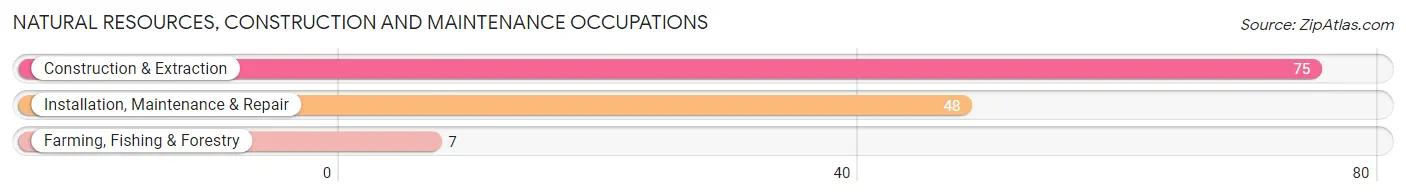
Natural Resources, Construction and Maintenance Occupations
The most common Natural Resources, Construction and Maintenance occupations in Culver are Construction & Extraction (75 | 5.8%), Installation, Maintenance & Repair (48 | 3.7%), and Farming, Fishing & Forestry (7 | 0.5%).
Natural Resources, Construction and Maintenance Occupations by Sex
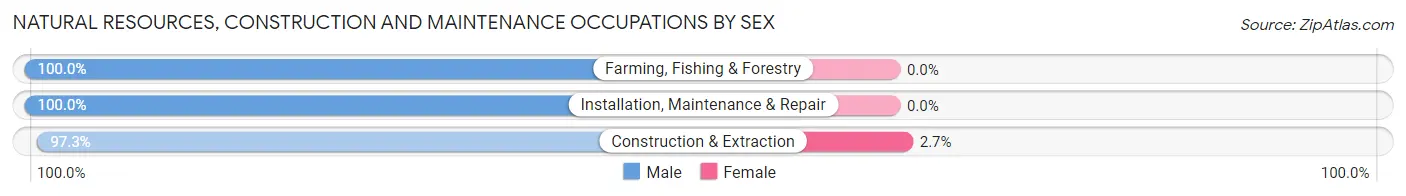
| Occupation | Male | Female |
| Farming, Fishing & Forestry | 7 (100.0%) | 0 (0.0%) |
| Construction & Extraction | 73 (97.3%) | 2 (2.7%) |
| Installation, Maintenance & Repair | 48 (100.0%) | 0 (0.0%) |
| Total (Category) | 128 (98.5%) | 2 (1.5%) |
| Total (Overall) | 717 (55.7%) | 569 (44.3%) |
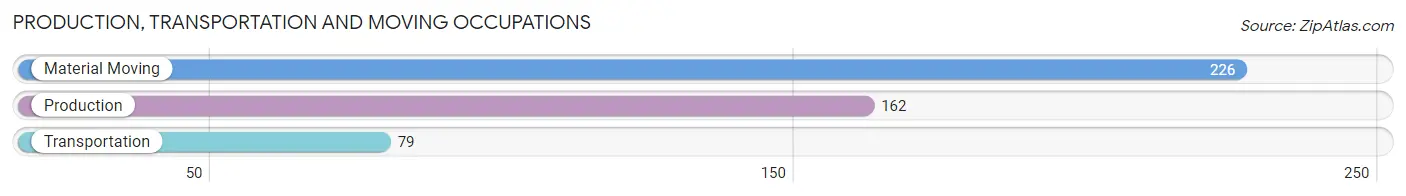
Production, Transportation and Moving Occupations
The most common Production, Transportation and Moving occupations in Culver are Material Moving (226 | 17.6%), Production (162 | 12.6%), and Transportation (79 | 6.1%).
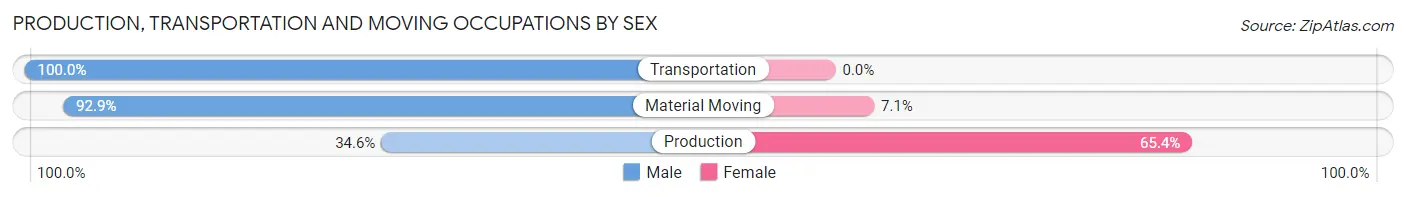
Production, Transportation and Moving Occupations by Sex
| Occupation | Male | Female |
| Production | 56 (34.6%) | 106 (65.4%) |
| Transportation | 79 (100.0%) | 0 (0.0%) |
| Material Moving | 210 (92.9%) | 16 (7.1%) |
| Total (Category) | 345 (73.9%) | 122 (26.1%) |
| Total (Overall) | 717 (55.7%) | 569 (44.3%) |
Employment Industries by Sex in Culver
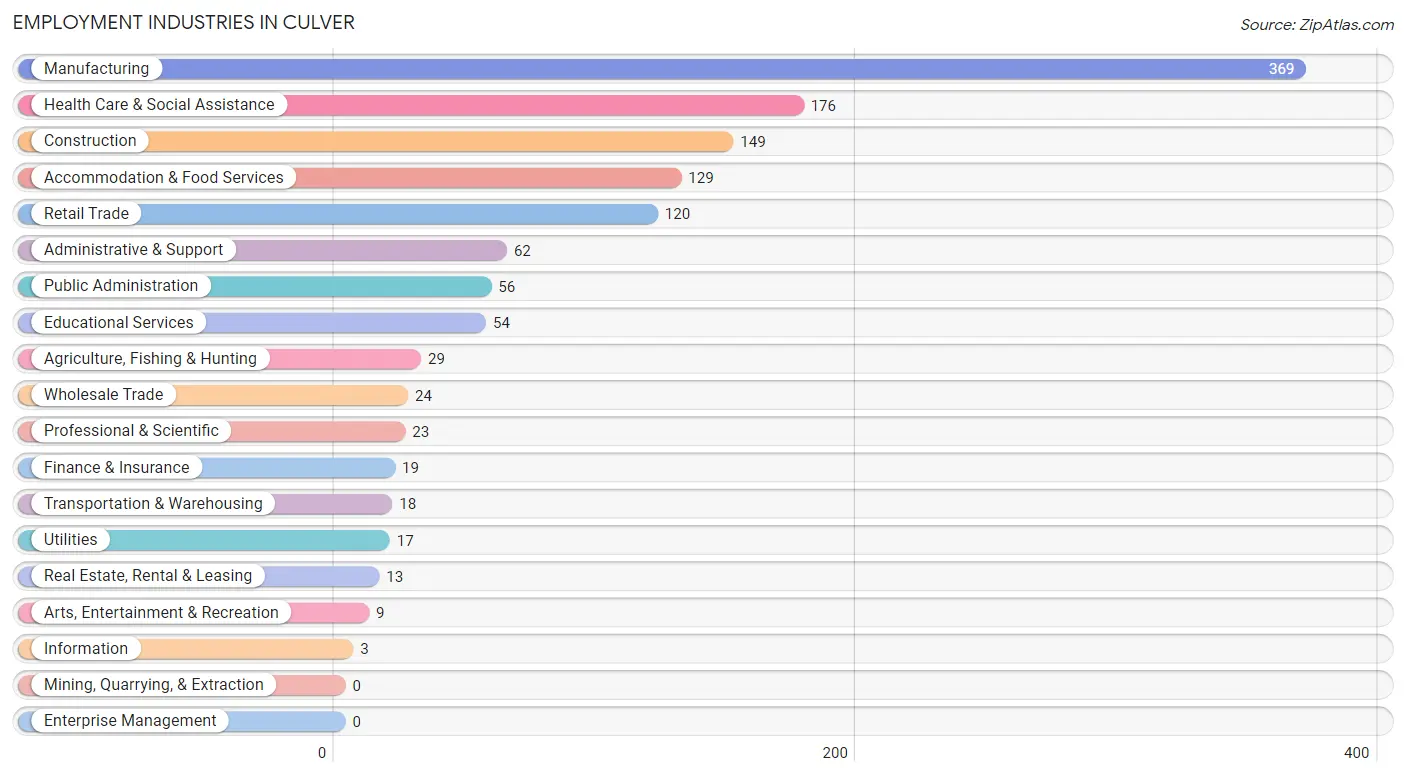
Employment Industries in Culver
The major employment industries in Culver include Manufacturing (369 | 28.7%), Health Care & Social Assistance (176 | 13.7%), Construction (149 | 11.6%), Accommodation & Food Services (129 | 10.0%), and Retail Trade (120 | 9.3%).
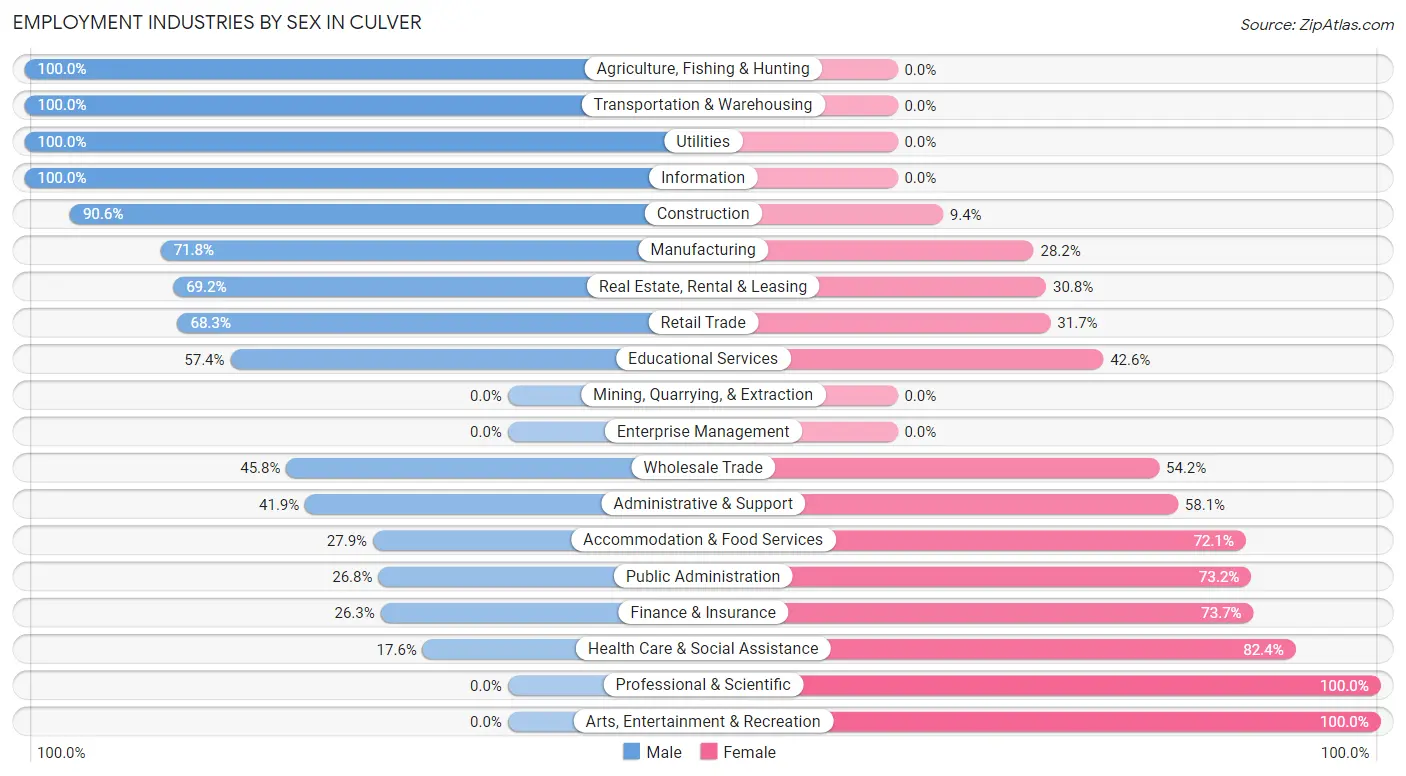
Employment Industries by Sex in Culver
The Culver industries that see more men than women are Agriculture, Fishing & Hunting (100.0%), Transportation & Warehousing (100.0%), and Utilities (100.0%), whereas the industries that tend to have a higher number of women are Professional & Scientific (100.0%), Arts, Entertainment & Recreation (100.0%), and Health Care & Social Assistance (82.4%).
| Industry | Male | Female |
| Agriculture, Fishing & Hunting | 29 (100.0%) | 0 (0.0%) |
| Mining, Quarrying, & Extraction | 0 (0.0%) | 0 (0.0%) |
| Construction | 135 (90.6%) | 14 (9.4%) |
| Manufacturing | 265 (71.8%) | 104 (28.2%) |
| Wholesale Trade | 11 (45.8%) | 13 (54.2%) |
| Retail Trade | 82 (68.3%) | 38 (31.7%) |
| Transportation & Warehousing | 18 (100.0%) | 0 (0.0%) |
| Utilities | 17 (100.0%) | 0 (0.0%) |
| Information | 3 (100.0%) | 0 (0.0%) |
| Finance & Insurance | 5 (26.3%) | 14 (73.7%) |
| Real Estate, Rental & Leasing | 9 (69.2%) | 4 (30.8%) |
| Professional & Scientific | 0 (0.0%) | 23 (100.0%) |
| Enterprise Management | 0 (0.0%) | 0 (0.0%) |
| Administrative & Support | 26 (41.9%) | 36 (58.1%) |
| Educational Services | 31 (57.4%) | 23 (42.6%) |
| Health Care & Social Assistance | 31 (17.6%) | 145 (82.4%) |
| Arts, Entertainment & Recreation | 0 (0.0%) | 9 (100.0%) |
| Accommodation & Food Services | 36 (27.9%) | 93 (72.1%) |
| Public Administration | 15 (26.8%) | 41 (73.2%) |
| Total | 717 (55.7%) | 569 (44.3%) |
Education in Culver
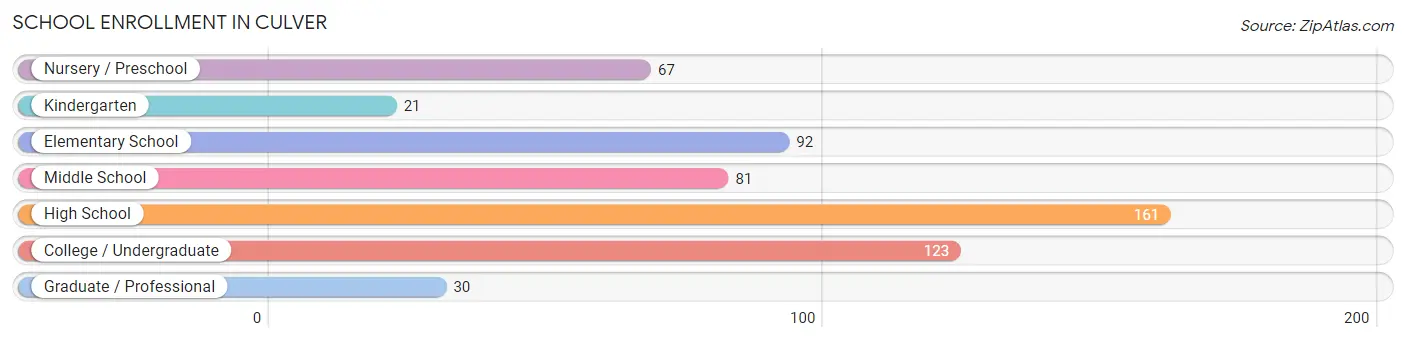
School Enrollment in Culver
The most common levels of schooling among the 575 students in Culver are high school (161 | 28.0%), college / undergraduate (123 | 21.4%), and elementary school (92 | 16.0%).
| School Level | # Students | % Students |
| Nursery / Preschool | 67 | 11.7% |
| Kindergarten | 21 | 3.6% |
| Elementary School | 92 | 16.0% |
| Middle School | 81 | 14.1% |
| High School | 161 | 28.0% |
| College / Undergraduate | 123 | 21.4% |
| Graduate / Professional | 30 | 5.2% |
| Total | 575 | 100.0% |
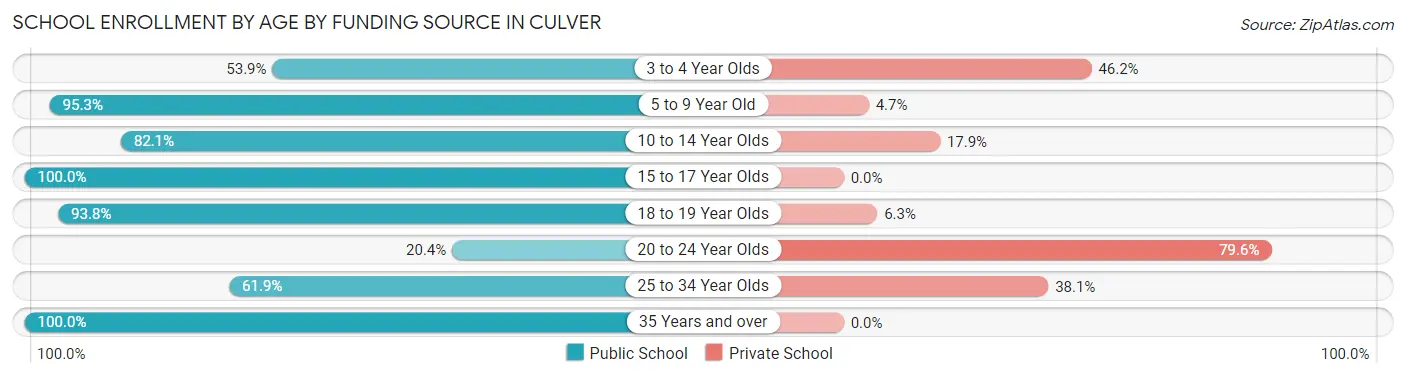
School Enrollment by Age by Funding Source in Culver
Out of a total of 575 students who are enrolled in schools in Culver, 124 (21.6%) attend a private institution, while the remaining 451 (78.4%) are enrolled in public schools. The age group of 20 to 24 year olds has the highest likelihood of being enrolled in private schools, with 43 (79.6% in the age bracket) enrolled. Conversely, the age group of 15 to 17 year olds has the lowest likelihood of being enrolled in a private school, with 95 (100.0% in the age bracket) attending a public institution.
| Age Bracket | Public School | Private School |
| 3 to 4 Year Olds | 28 (53.8%) | 24 (46.2%) |
| 5 to 9 Year Old | 102 (95.3%) | 5 (4.7%) |
| 10 to 14 Year Olds | 119 (82.1%) | 26 (17.9%) |
| 15 to 17 Year Olds | 95 (100.0%) | 0 (0.0%) |
| 18 to 19 Year Olds | 30 (93.8%) | 2 (6.2%) |
| 20 to 24 Year Olds | 11 (20.4%) | 43 (79.6%) |
| 25 to 34 Year Olds | 39 (61.9%) | 24 (38.1%) |
| 35 Years and over | 27 (100.0%) | 0 (0.0%) |
| Total | 451 (78.4%) | 124 (21.6%) |
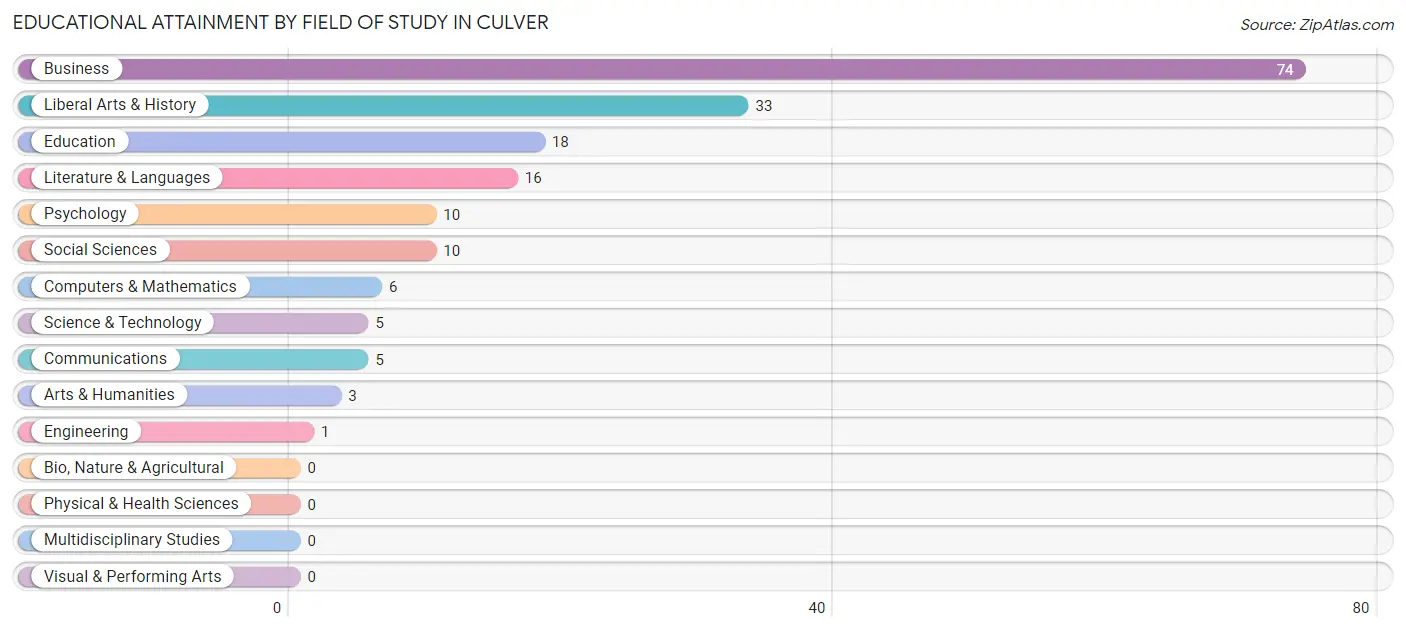
Educational Attainment by Field of Study in Culver
Business (74 | 40.9%), liberal arts & history (33 | 18.2%), education (18 | 9.9%), literature & languages (16 | 8.8%), and psychology (10 | 5.5%) are the most common fields of study among 181 individuals in Culver who have obtained a bachelor's degree or higher.
| Field of Study | # Graduates | % Graduates |
| Computers & Mathematics | 6 | 3.3% |
| Bio, Nature & Agricultural | 0 | 0.0% |
| Physical & Health Sciences | 0 | 0.0% |
| Psychology | 10 | 5.5% |
| Social Sciences | 10 | 5.5% |
| Engineering | 1 | 0.5% |
| Multidisciplinary Studies | 0 | 0.0% |
| Science & Technology | 5 | 2.8% |
| Business | 74 | 40.9% |
| Education | 18 | 9.9% |
| Literature & Languages | 16 | 8.8% |
| Liberal Arts & History | 33 | 18.2% |
| Visual & Performing Arts | 0 | 0.0% |
| Communications | 5 | 2.8% |
| Arts & Humanities | 3 | 1.7% |
| Total | 181 | 100.0% |
Transportation & Commute in Culver
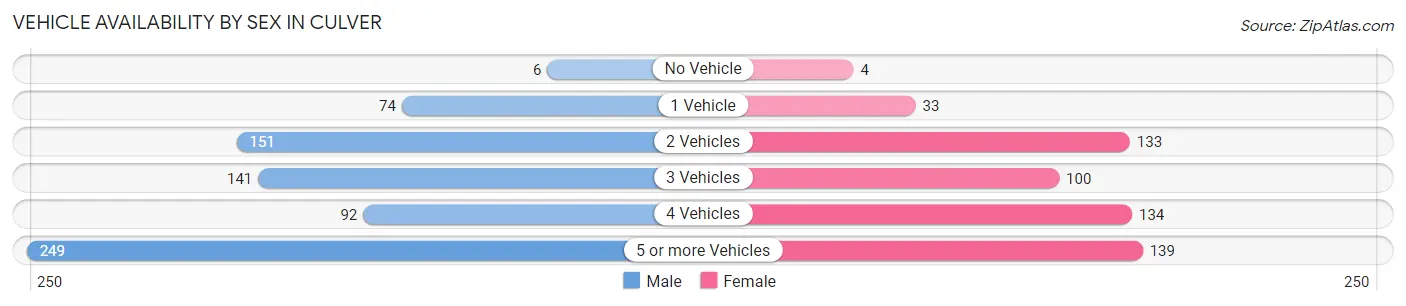
Vehicle Availability by Sex in Culver
The most prevalent vehicle ownership categories in Culver are males with 5 or more vehicles (249, accounting for 34.9%) and females with 5 or more vehicles (139, making up 45.9%).
| Vehicles Available | Male | Female |
| No Vehicle | 6 (0.8%) | 4 (0.7%) |
| 1 Vehicle | 74 (10.4%) | 33 (6.1%) |
| 2 Vehicles | 151 (21.2%) | 133 (24.5%) |
| 3 Vehicles | 141 (19.8%) | 100 (18.4%) |
| 4 Vehicles | 92 (12.9%) | 134 (24.7%) |
| 5 or more Vehicles | 249 (34.9%) | 139 (25.6%) |
| Total | 713 (100.0%) | 543 (100.0%) |
Commute Time in Culver
The most frequently occuring commute durations in Culver are 60 to 89 minutes (286 commuters, 23.6%), 15 to 19 minutes (247 commuters, 20.3%), and 30 to 34 minutes (133 commuters, 11.0%).
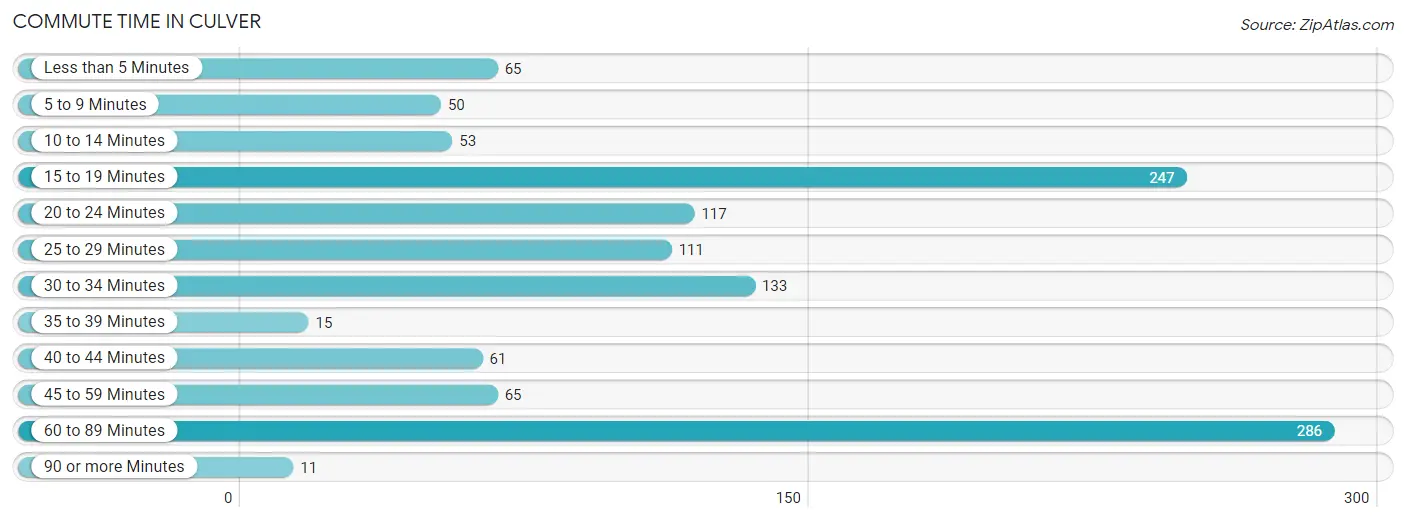
| Commute Time | # Commuters | % Commuters |
| Less than 5 Minutes | 65 | 5.3% |
| 5 to 9 Minutes | 50 | 4.1% |
| 10 to 14 Minutes | 53 | 4.4% |
| 15 to 19 Minutes | 247 | 20.3% |
| 20 to 24 Minutes | 117 | 9.6% |
| 25 to 29 Minutes | 111 | 9.1% |
| 30 to 34 Minutes | 133 | 11.0% |
| 35 to 39 Minutes | 15 | 1.2% |
| 40 to 44 Minutes | 61 | 5.0% |
| 45 to 59 Minutes | 65 | 5.3% |
| 60 to 89 Minutes | 286 | 23.6% |
| 90 or more Minutes | 11 | 0.9% |
Commute Time by Sex in Culver
The most common commute times in Culver are 60 to 89 minutes (229 commuters, 31.9%) for males and 15 to 19 minutes (157 commuters, 31.6%) for females.
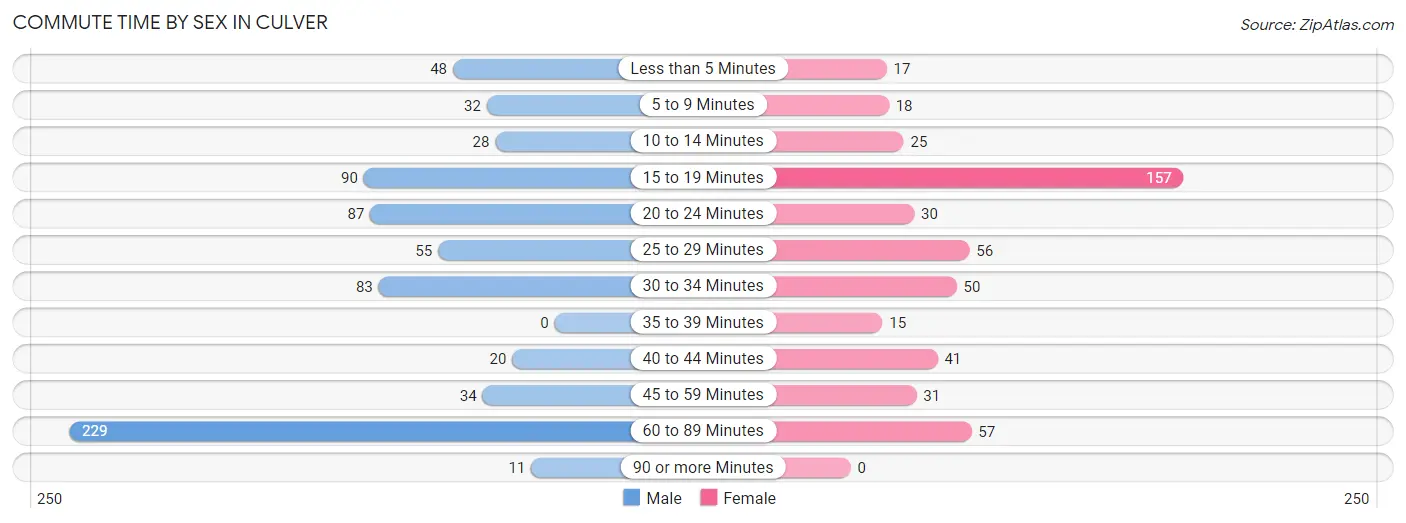
| Commute Time | Male | Female |
| Less than 5 Minutes | 48 (6.7%) | 17 (3.4%) |
| 5 to 9 Minutes | 32 (4.5%) | 18 (3.6%) |
| 10 to 14 Minutes | 28 (3.9%) | 25 (5.0%) |
| 15 to 19 Minutes | 90 (12.6%) | 157 (31.6%) |
| 20 to 24 Minutes | 87 (12.1%) | 30 (6.0%) |
| 25 to 29 Minutes | 55 (7.7%) | 56 (11.3%) |
| 30 to 34 Minutes | 83 (11.6%) | 50 (10.1%) |
| 35 to 39 Minutes | 0 (0.0%) | 15 (3.0%) |
| 40 to 44 Minutes | 20 (2.8%) | 41 (8.3%) |
| 45 to 59 Minutes | 34 (4.7%) | 31 (6.2%) |
| 60 to 89 Minutes | 229 (31.9%) | 57 (11.5%) |
| 90 or more Minutes | 11 (1.5%) | 0 (0.0%) |
Time of Departure to Work by Sex in Culver
The most frequent times of departure to work in Culver are 12:00 AM to 4:59 AM (252, 35.1%) for males and 12:00 AM to 4:59 AM (140, 28.2%) for females.
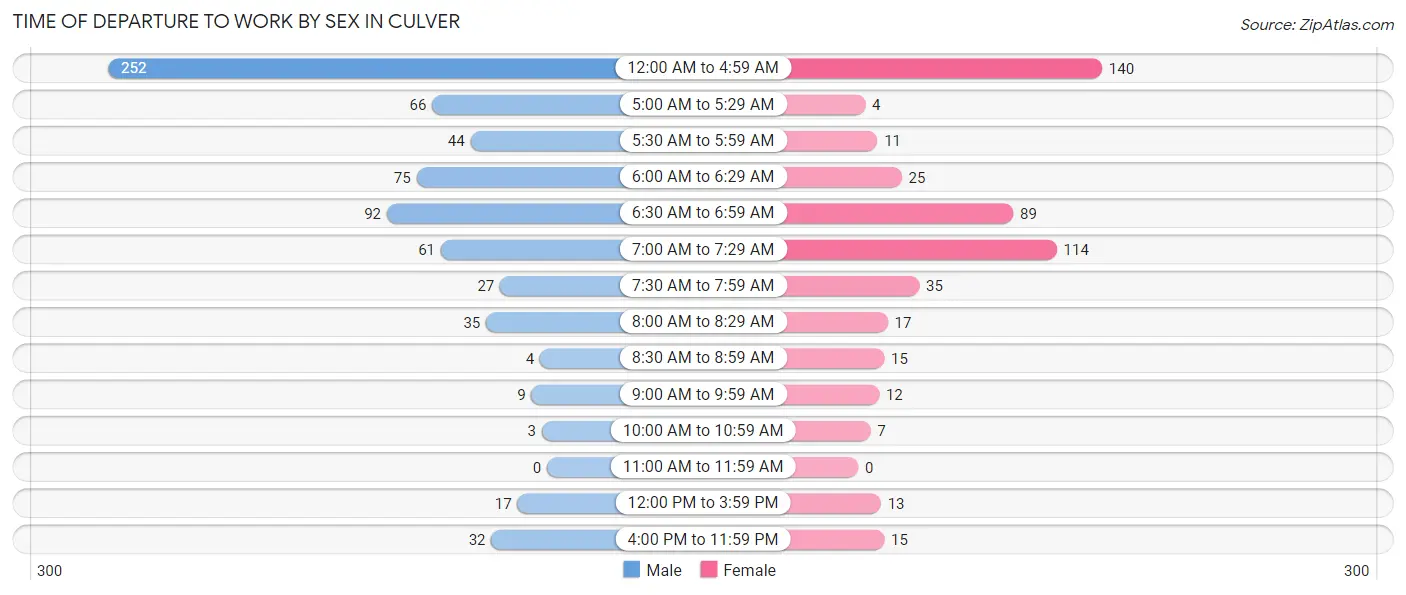
| Time of Departure | Male | Female |
| 12:00 AM to 4:59 AM | 252 (35.1%) | 140 (28.2%) |
| 5:00 AM to 5:29 AM | 66 (9.2%) | 4 (0.8%) |
| 5:30 AM to 5:59 AM | 44 (6.1%) | 11 (2.2%) |
| 6:00 AM to 6:29 AM | 75 (10.5%) | 25 (5.0%) |
| 6:30 AM to 6:59 AM | 92 (12.8%) | 89 (17.9%) |
| 7:00 AM to 7:29 AM | 61 (8.5%) | 114 (22.9%) |
| 7:30 AM to 7:59 AM | 27 (3.8%) | 35 (7.0%) |
| 8:00 AM to 8:29 AM | 35 (4.9%) | 17 (3.4%) |
| 8:30 AM to 8:59 AM | 4 (0.6%) | 15 (3.0%) |
| 9:00 AM to 9:59 AM | 9 (1.3%) | 12 (2.4%) |
| 10:00 AM to 10:59 AM | 3 (0.4%) | 7 (1.4%) |
| 11:00 AM to 11:59 AM | 0 (0.0%) | 0 (0.0%) |
| 12:00 PM to 3:59 PM | 17 (2.4%) | 13 (2.6%) |
| 4:00 PM to 11:59 PM | 32 (4.5%) | 15 (3.0%) |
| Total | 717 (100.0%) | 497 (100.0%) |
Housing Occupancy in Culver
Occupancy by Ownership in Culver
Of the total 687 dwellings in Culver, owner-occupied units account for 504 (73.4%), while renter-occupied units make up 183 (26.6%).
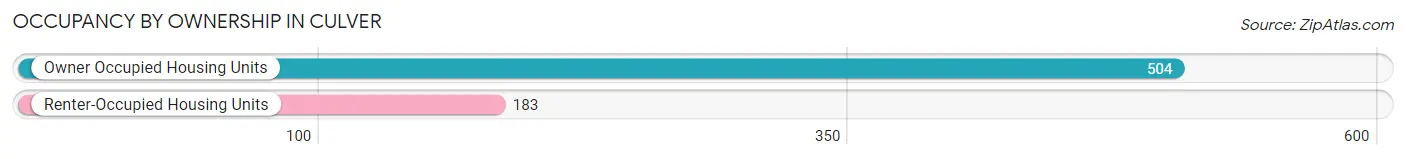
| Occupancy | # Housing Units | % Housing Units |
| Owner Occupied Housing Units | 504 | 73.4% |
| Renter-Occupied Housing Units | 183 | 26.6% |
| Total Occupied Housing Units | 687 | 100.0% |
Occupancy by Household Size in Culver
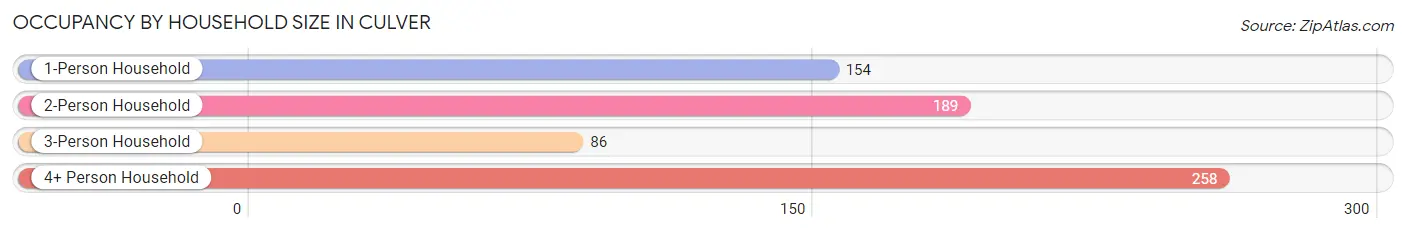
| Household Size | # Housing Units | % Housing Units |
| 1-Person Household | 154 | 22.4% |
| 2-Person Household | 189 | 27.5% |
| 3-Person Household | 86 | 12.5% |
| 4+ Person Household | 258 | 37.6% |
| Total Housing Units | 687 | 100.0% |
Occupancy by Ownership by Household Size in Culver
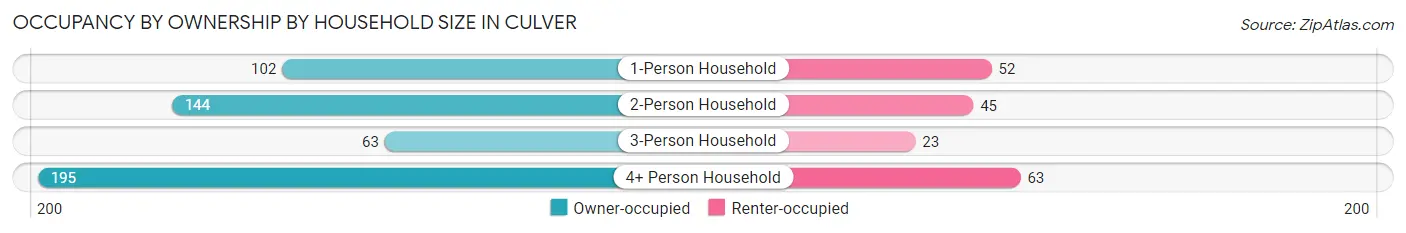
| Household Size | Owner-occupied | Renter-occupied |
| 1-Person Household | 102 (66.2%) | 52 (33.8%) |
| 2-Person Household | 144 (76.2%) | 45 (23.8%) |
| 3-Person Household | 63 (73.3%) | 23 (26.7%) |
| 4+ Person Household | 195 (75.6%) | 63 (24.4%) |
| Total Housing Units | 504 (73.4%) | 183 (26.6%) |
Occupancy by Educational Attainment in Culver
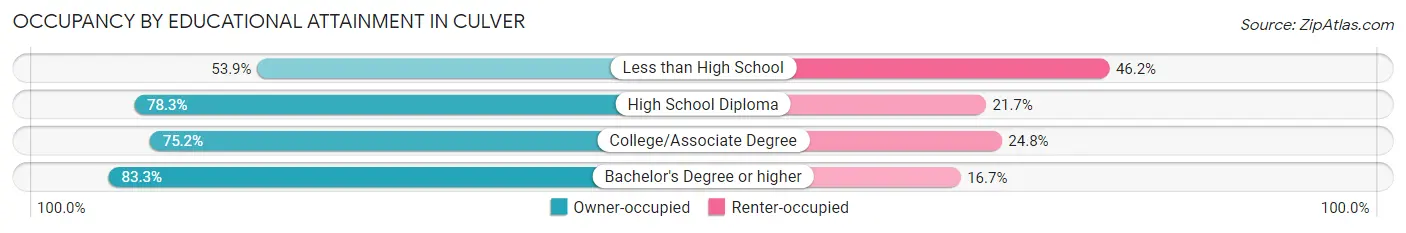
| Household Size | Owner-occupied | Renter-occupied |
| Less than High School | 63 (53.8%) | 54 (46.2%) |
| High School Diploma | 166 (78.3%) | 46 (21.7%) |
| College/Associate Degree | 215 (75.2%) | 71 (24.8%) |
| Bachelor's Degree or higher | 60 (83.3%) | 12 (16.7%) |
Occupancy by Age of Householder in Culver
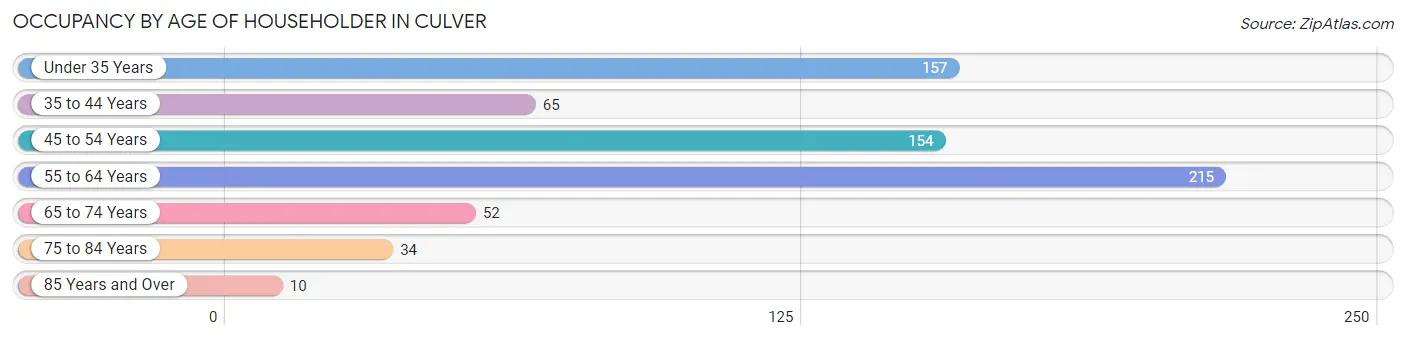
| Age Bracket | # Households | % Households |
| Under 35 Years | 157 | 22.9% |
| 35 to 44 Years | 65 | 9.5% |
| 45 to 54 Years | 154 | 22.4% |
| 55 to 64 Years | 215 | 31.3% |
| 65 to 74 Years | 52 | 7.6% |
| 75 to 84 Years | 34 | 5.0% |
| 85 Years and Over | 10 | 1.5% |
| Total | 687 | 100.0% |
Housing Finances in Culver
Median Income by Occupancy in Culver
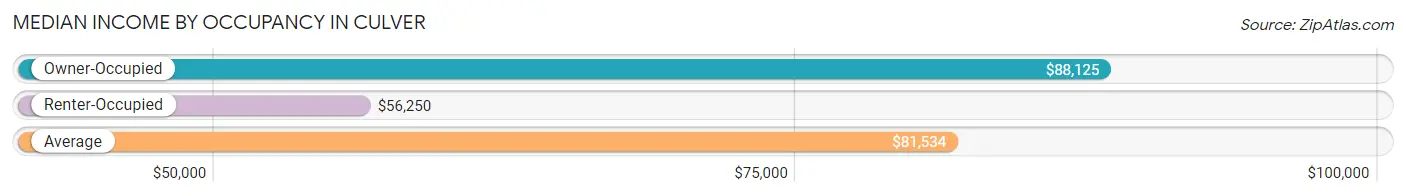
| Occupancy Type | # Households | Median Income |
| Owner-Occupied | 504 (73.4%) | $88,125 |
| Renter-Occupied | 183 (26.6%) | $56,250 |
| Average | 687 (100.0%) | $81,534 |
Occupancy by Householder Income Bracket in Culver
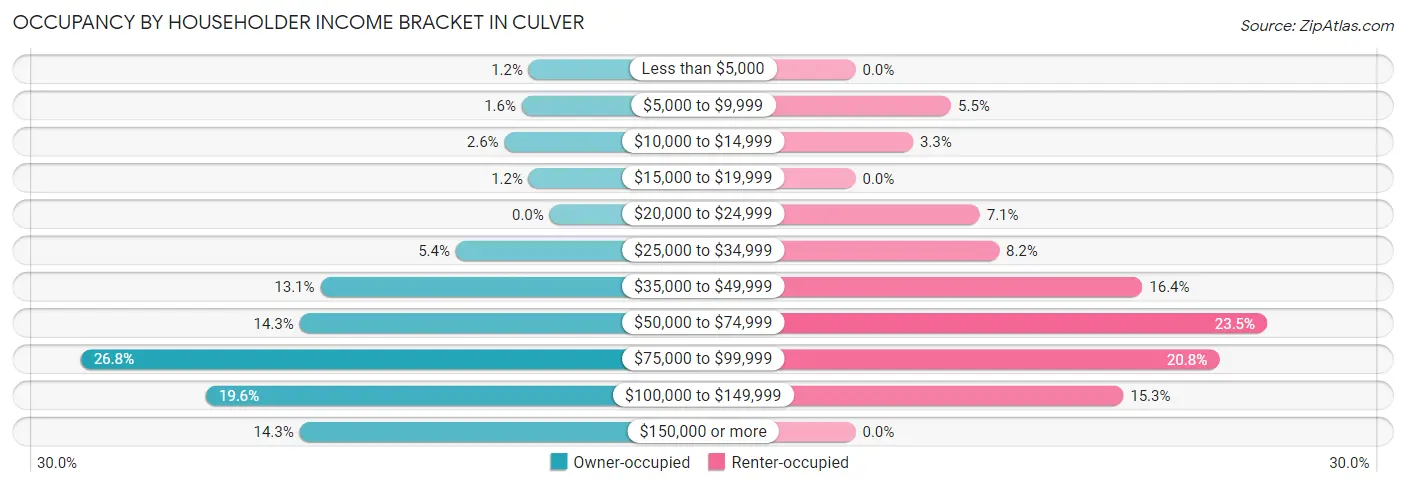
| Income Bracket | Owner-occupied | Renter-occupied |
| Less than $5,000 | 6 (1.2%) | 0 (0.0%) |
| $5,000 to $9,999 | 8 (1.6%) | 10 (5.5%) |
| $10,000 to $14,999 | 13 (2.6%) | 6 (3.3%) |
| $15,000 to $19,999 | 6 (1.2%) | 0 (0.0%) |
| $20,000 to $24,999 | 0 (0.0%) | 13 (7.1%) |
| $25,000 to $34,999 | 27 (5.4%) | 15 (8.2%) |
| $35,000 to $49,999 | 66 (13.1%) | 30 (16.4%) |
| $50,000 to $74,999 | 72 (14.3%) | 43 (23.5%) |
| $75,000 to $99,999 | 135 (26.8%) | 38 (20.8%) |
| $100,000 to $149,999 | 99 (19.6%) | 28 (15.3%) |
| $150,000 or more | 72 (14.3%) | 0 (0.0%) |
| Total | 504 (100.0%) | 183 (100.0%) |
Monthly Housing Cost Tiers in Culver
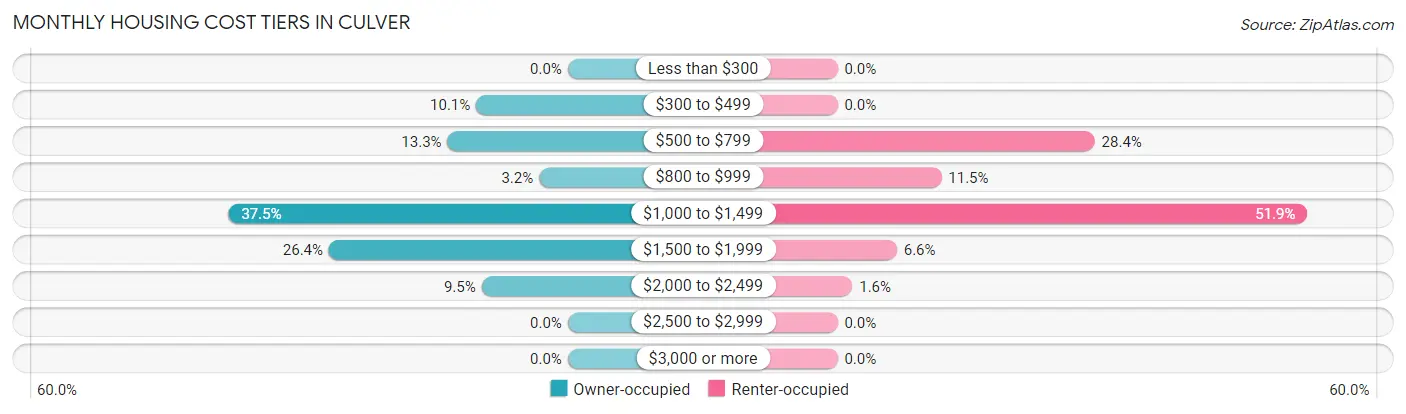
| Monthly Cost | Owner-occupied | Renter-occupied |
| Less than $300 | 0 (0.0%) | 0 (0.0%) |
| $300 to $499 | 51 (10.1%) | 0 (0.0%) |
| $500 to $799 | 67 (13.3%) | 52 (28.4%) |
| $800 to $999 | 16 (3.2%) | 21 (11.5%) |
| $1,000 to $1,499 | 189 (37.5%) | 95 (51.9%) |
| $1,500 to $1,999 | 133 (26.4%) | 12 (6.6%) |
| $2,000 to $2,499 | 48 (9.5%) | 3 (1.6%) |
| $2,500 to $2,999 | 0 (0.0%) | 0 (0.0%) |
| $3,000 or more | 0 (0.0%) | 0 (0.0%) |
| Total | 504 (100.0%) | 183 (100.0%) |
Physical Housing Characteristics in Culver
Housing Structures in Culver
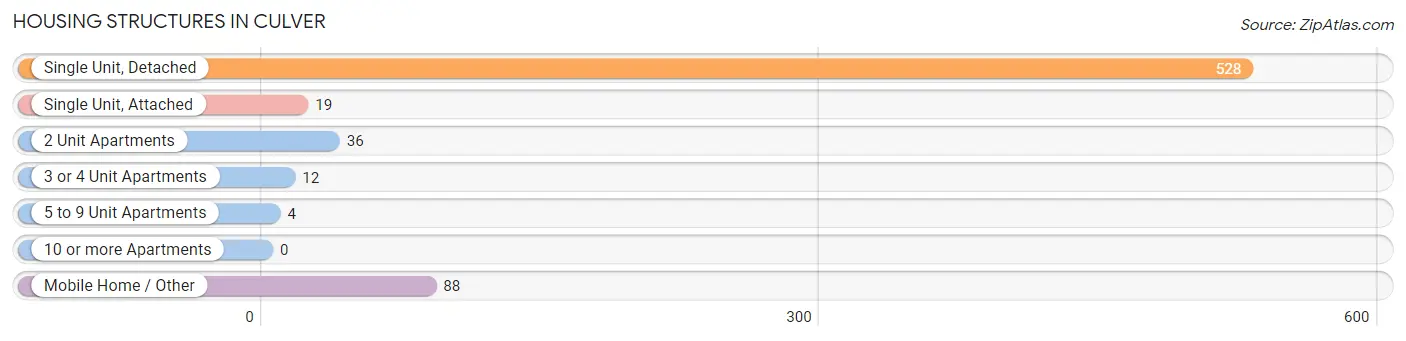
| Structure Type | # Housing Units | % Housing Units |
| Single Unit, Detached | 528 | 76.9% |
| Single Unit, Attached | 19 | 2.8% |
| 2 Unit Apartments | 36 | 5.2% |
| 3 or 4 Unit Apartments | 12 | 1.8% |
| 5 to 9 Unit Apartments | 4 | 0.6% |
| 10 or more Apartments | 0 | 0.0% |
| Mobile Home / Other | 88 | 12.8% |
| Total | 687 | 100.0% |
Housing Structures by Occupancy in Culver
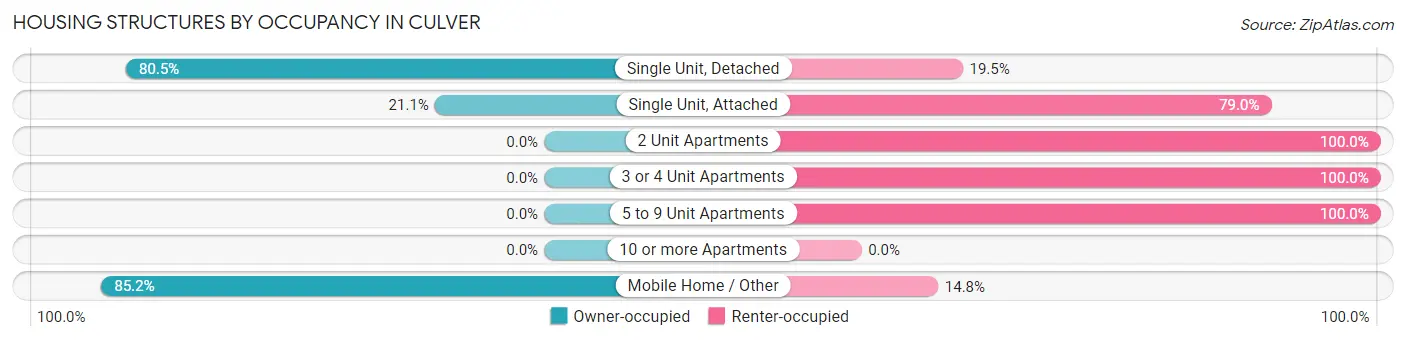
| Structure Type | Owner-occupied | Renter-occupied |
| Single Unit, Detached | 425 (80.5%) | 103 (19.5%) |
| Single Unit, Attached | 4 (21.0%) | 15 (78.9%) |
| 2 Unit Apartments | 0 (0.0%) | 36 (100.0%) |
| 3 or 4 Unit Apartments | 0 (0.0%) | 12 (100.0%) |
| 5 to 9 Unit Apartments | 0 (0.0%) | 4 (100.0%) |
| 10 or more Apartments | 0 (0.0%) | 0 (0.0%) |
| Mobile Home / Other | 75 (85.2%) | 13 (14.8%) |
| Total | 504 (73.4%) | 183 (26.6%) |
Housing Structures by Number of Rooms in Culver
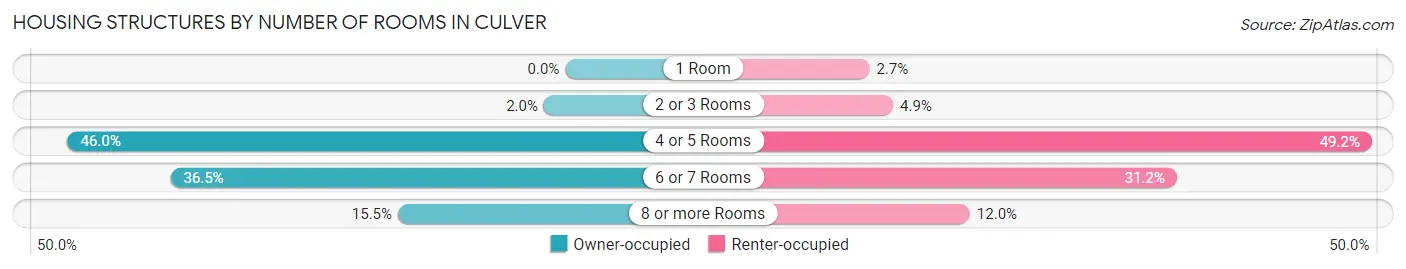
| Number of Rooms | Owner-occupied | Renter-occupied |
| 1 Room | 0 (0.0%) | 5 (2.7%) |
| 2 or 3 Rooms | 10 (2.0%) | 9 (4.9%) |
| 4 or 5 Rooms | 232 (46.0%) | 90 (49.2%) |
| 6 or 7 Rooms | 184 (36.5%) | 57 (31.1%) |
| 8 or more Rooms | 78 (15.5%) | 22 (12.0%) |
| Total | 504 (100.0%) | 183 (100.0%) |
Housing Structure by Heating Type in Culver
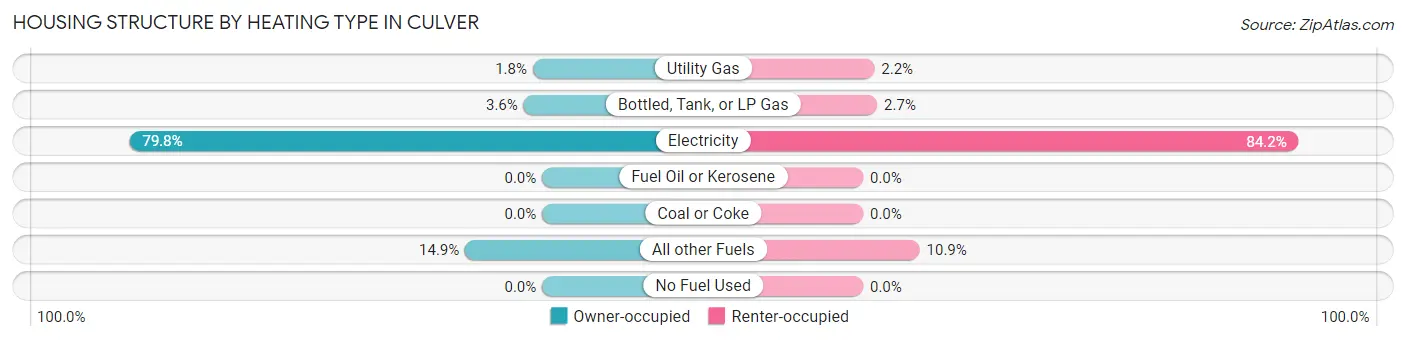
| Heating Type | Owner-occupied | Renter-occupied |
| Utility Gas | 9 (1.8%) | 4 (2.2%) |
| Bottled, Tank, or LP Gas | 18 (3.6%) | 5 (2.7%) |
| Electricity | 402 (79.8%) | 154 (84.2%) |
| Fuel Oil or Kerosene | 0 (0.0%) | 0 (0.0%) |
| Coal or Coke | 0 (0.0%) | 0 (0.0%) |
| All other Fuels | 75 (14.9%) | 20 (10.9%) |
| No Fuel Used | 0 (0.0%) | 0 (0.0%) |
| Total | 504 (100.0%) | 183 (100.0%) |
Household Vehicle Usage in Culver
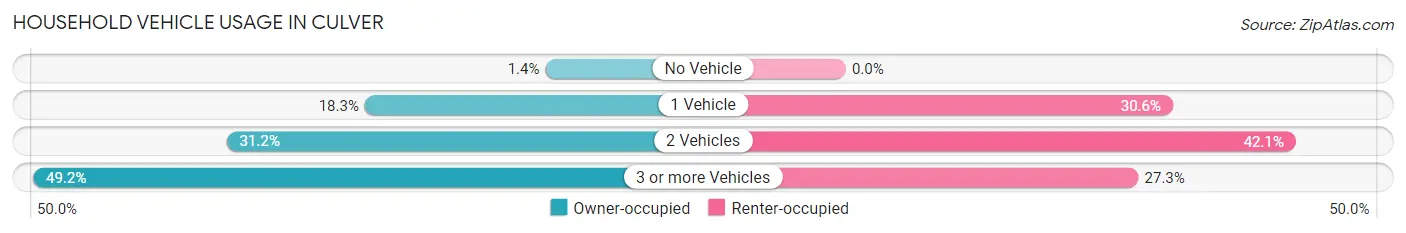
| Vehicles per Household | Owner-occupied | Renter-occupied |
| No Vehicle | 7 (1.4%) | 0 (0.0%) |
| 1 Vehicle | 92 (18.2%) | 56 (30.6%) |
| 2 Vehicles | 157 (31.1%) | 77 (42.1%) |
| 3 or more Vehicles | 248 (49.2%) | 50 (27.3%) |
| Total | 504 (100.0%) | 183 (100.0%) |
Real Estate & Mortgages in Culver
Real Estate and Mortgage Overview in Culver
| Characteristic | Without Mortgage | With Mortgage |
| Housing Units | 114 | 390 |
| Median Property Value | $197,000 | $247,800 |
| Median Household Income | $61,111 | $69 |
| Monthly Housing Costs | $517 | $0 |
| Real Estate Taxes | $1,917 | $9 |
Property Value by Mortgage Status in Culver
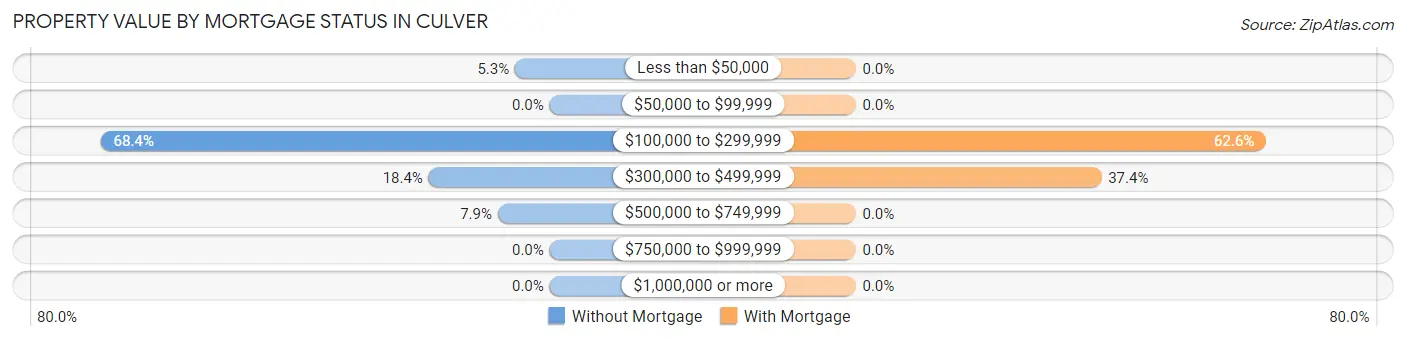
| Property Value | Without Mortgage | With Mortgage |
| Less than $50,000 | 6 (5.3%) | 0 (0.0%) |
| $50,000 to $99,999 | 0 (0.0%) | 0 (0.0%) |
| $100,000 to $299,999 | 78 (68.4%) | 244 (62.6%) |
| $300,000 to $499,999 | 21 (18.4%) | 146 (37.4%) |
| $500,000 to $749,999 | 9 (7.9%) | 0 (0.0%) |
| $750,000 to $999,999 | 0 (0.0%) | 0 (0.0%) |
| $1,000,000 or more | 0 (0.0%) | 0 (0.0%) |
| Total | 114 (100.0%) | 390 (100.0%) |
Household Income by Mortgage Status in Culver
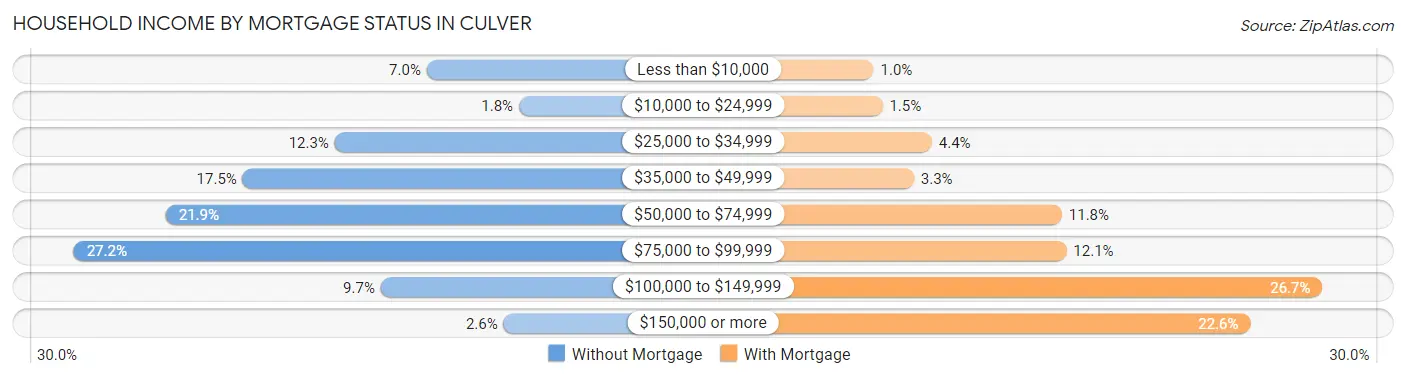
| Household Income | Without Mortgage | With Mortgage |
| Less than $10,000 | 8 (7.0%) | 4 (1.0%) |
| $10,000 to $24,999 | 2 (1.8%) | 6 (1.5%) |
| $25,000 to $34,999 | 14 (12.3%) | 17 (4.4%) |
| $35,000 to $49,999 | 20 (17.5%) | 13 (3.3%) |
| $50,000 to $74,999 | 25 (21.9%) | 46 (11.8%) |
| $75,000 to $99,999 | 31 (27.2%) | 47 (12.0%) |
| $100,000 to $149,999 | 11 (9.7%) | 104 (26.7%) |
| $150,000 or more | 3 (2.6%) | 88 (22.6%) |
| Total | 114 (100.0%) | 390 (100.0%) |
Property Value to Household Income Ratio in Culver
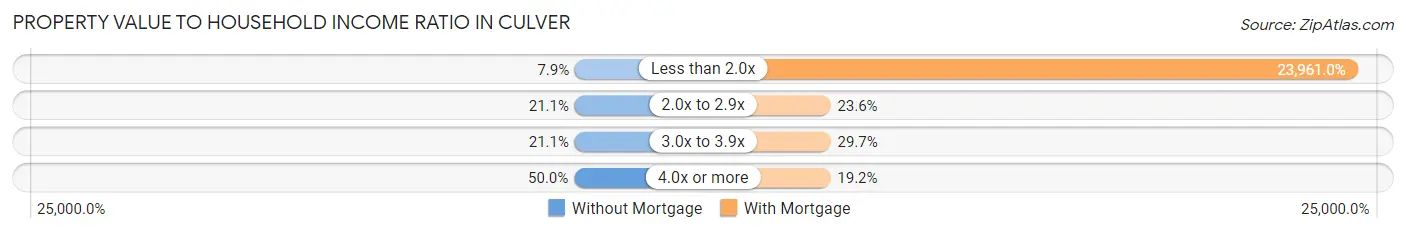
| Value-to-Income Ratio | Without Mortgage | With Mortgage |
| Less than 2.0x | 9 (7.9%) | 93,448 (23,961.0%) |
| 2.0x to 2.9x | 24 (21.0%) | 92 (23.6%) |
| 3.0x to 3.9x | 24 (21.0%) | 116 (29.7%) |
| 4.0x or more | 57 (50.0%) | 75 (19.2%) |
| Total | 114 (100.0%) | 390 (100.0%) |
Real Estate Taxes by Mortgage Status in Culver
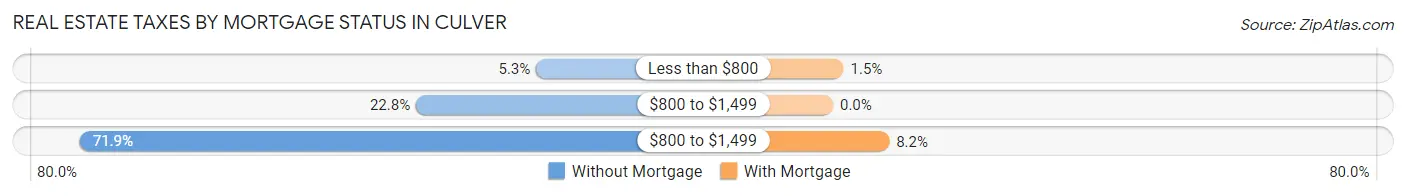
| Property Taxes | Without Mortgage | With Mortgage |
| Less than $800 | 6 (5.3%) | 6 (1.5%) |
| $800 to $1,499 | 26 (22.8%) | 0 (0.0%) |
| $800 to $1,499 | 82 (71.9%) | 32 (8.2%) |
| Total | 114 (100.0%) | 390 (100.0%) |
Health & Disability in Culver
Health Insurance Coverage by Age in Culver
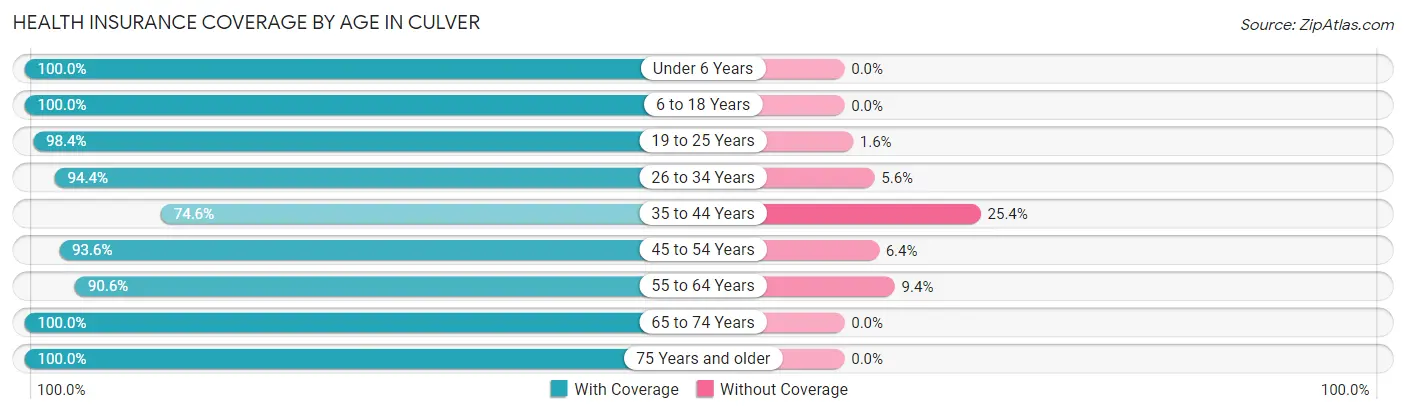
| Age Bracket | With Coverage | Without Coverage |
| Under 6 Years | 172 (100.0%) | 0 (0.0%) |
| 6 to 18 Years | 360 (100.0%) | 0 (0.0%) |
| 19 to 25 Years | 368 (98.4%) | 6 (1.6%) |
| 26 to 34 Years | 303 (94.4%) | 18 (5.6%) |
| 35 to 44 Years | 132 (74.6%) | 45 (25.4%) |
| 45 to 54 Years | 277 (93.6%) | 19 (6.4%) |
| 55 to 64 Years | 280 (90.6%) | 29 (9.4%) |
| 65 to 74 Years | 90 (100.0%) | 0 (0.0%) |
| 75 Years and older | 74 (100.0%) | 0 (0.0%) |
| Total | 2,056 (94.6%) | 117 (5.4%) |
Health Insurance Coverage by Citizenship Status in Culver
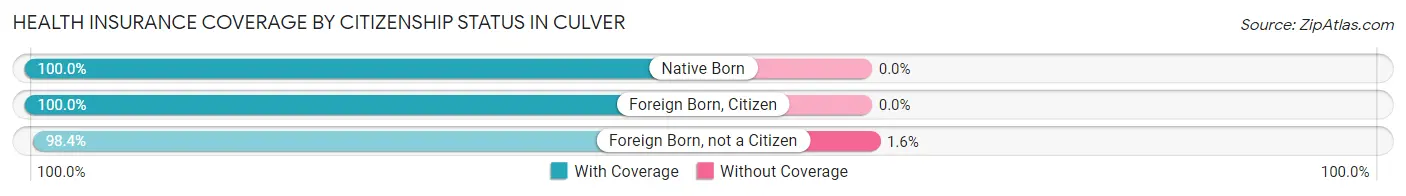
| Citizenship Status | With Coverage | Without Coverage |
| Native Born | 172 (100.0%) | 0 (0.0%) |
| Foreign Born, Citizen | 360 (100.0%) | 0 (0.0%) |
| Foreign Born, not a Citizen | 368 (98.4%) | 6 (1.6%) |
Health Insurance Coverage by Household Income in Culver
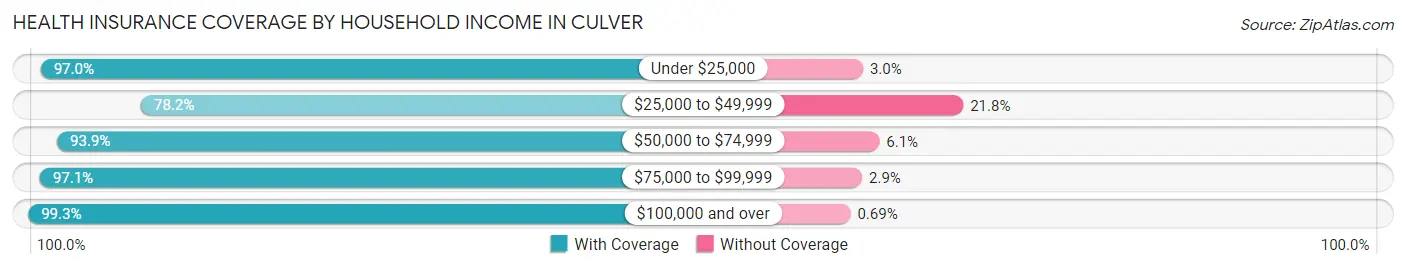
| Household Income | With Coverage | Without Coverage |
| Under $25,000 | 96 (97.0%) | 3 (3.0%) |
| $25,000 to $49,999 | 258 (78.2%) | 72 (21.8%) |
| $50,000 to $74,999 | 323 (93.9%) | 21 (6.1%) |
| $75,000 to $99,999 | 507 (97.1%) | 15 (2.9%) |
| $100,000 and over | 863 (99.3%) | 6 (0.7%) |
Public vs Private Health Insurance Coverage by Age in Culver
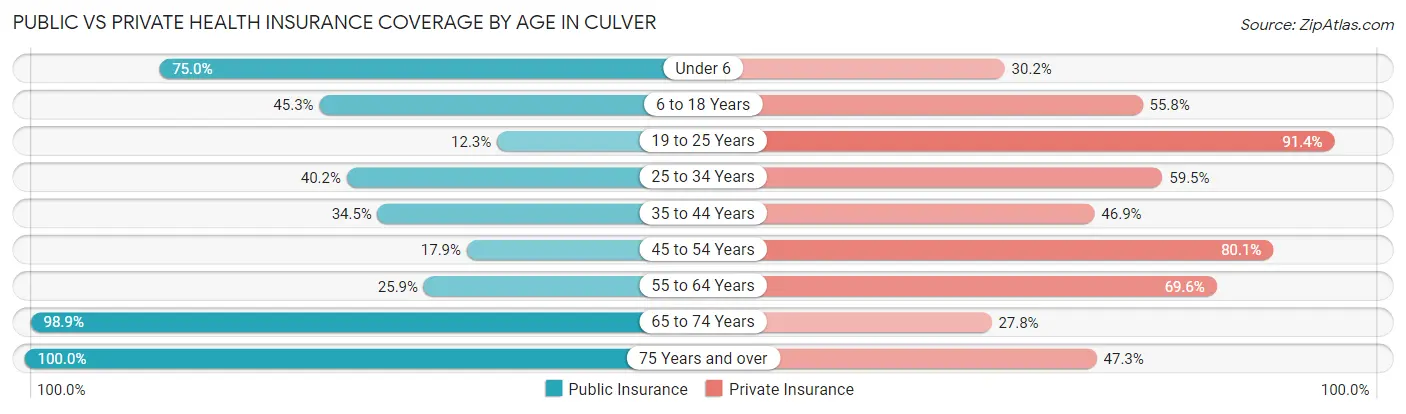
| Age Bracket | Public Insurance | Private Insurance |
| Under 6 | 129 (75.0%) | 52 (30.2%) |
| 6 to 18 Years | 163 (45.3%) | 201 (55.8%) |
| 19 to 25 Years | 46 (12.3%) | 342 (91.4%) |
| 25 to 34 Years | 129 (40.2%) | 191 (59.5%) |
| 35 to 44 Years | 61 (34.5%) | 83 (46.9%) |
| 45 to 54 Years | 53 (17.9%) | 237 (80.1%) |
| 55 to 64 Years | 80 (25.9%) | 215 (69.6%) |
| 65 to 74 Years | 89 (98.9%) | 25 (27.8%) |
| 75 Years and over | 74 (100.0%) | 35 (47.3%) |
| Total | 824 (37.9%) | 1,381 (63.5%) |
Disability Status by Sex by Age in Culver
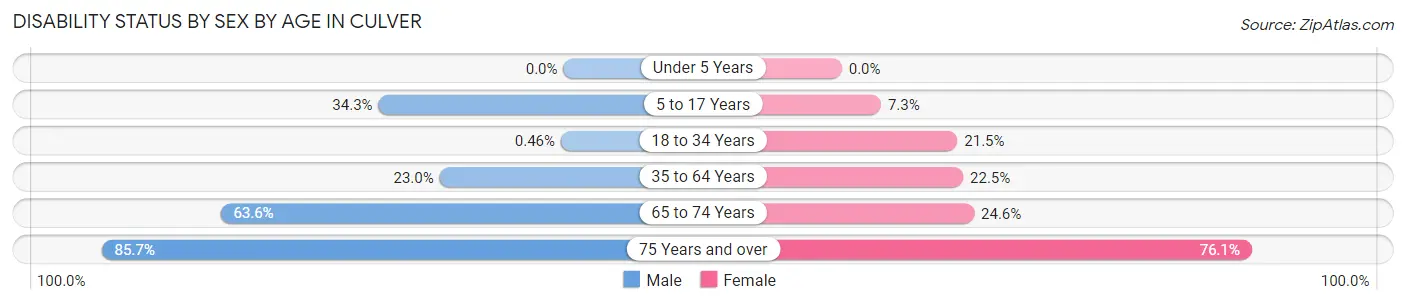
| Age Bracket | Male | Female |
| Under 5 Years | 0 (0.0%) | 0 (0.0%) |
| 5 to 17 Years | 23 (34.3%) | 21 (7.3%) |
| 18 to 34 Years | 2 (0.5%) | 62 (21.4%) |
| 35 to 64 Years | 94 (23.0%) | 84 (22.5%) |
| 65 to 74 Years | 21 (63.6%) | 14 (24.6%) |
| 75 Years and over | 24 (85.7%) | 35 (76.1%) |
Disability Class by Sex by Age in Culver
Disability Class: Hearing Difficulty
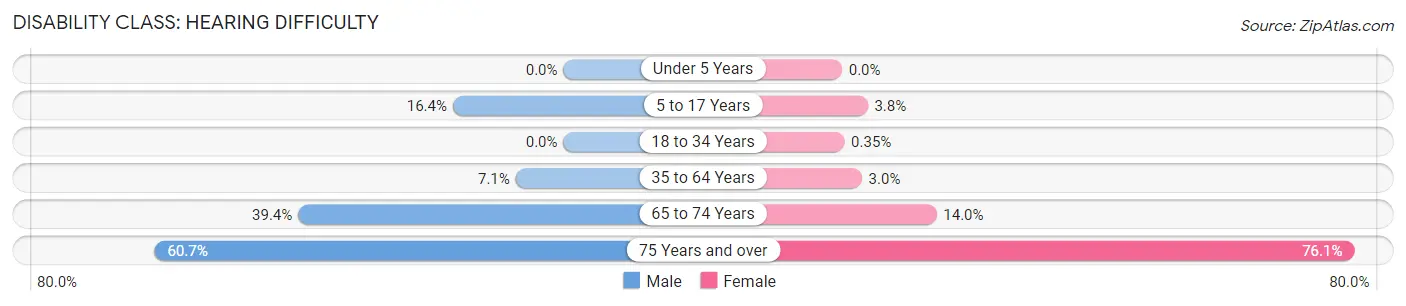
| Age Bracket | Male | Female |
| Under 5 Years | 0 (0.0%) | 0 (0.0%) |
| 5 to 17 Years | 11 (16.4%) | 11 (3.8%) |
| 18 to 34 Years | 0 (0.0%) | 1 (0.4%) |
| 35 to 64 Years | 29 (7.1%) | 11 (2.9%) |
| 65 to 74 Years | 13 (39.4%) | 8 (14.0%) |
| 75 Years and over | 17 (60.7%) | 35 (76.1%) |
Disability Class: Vision Difficulty
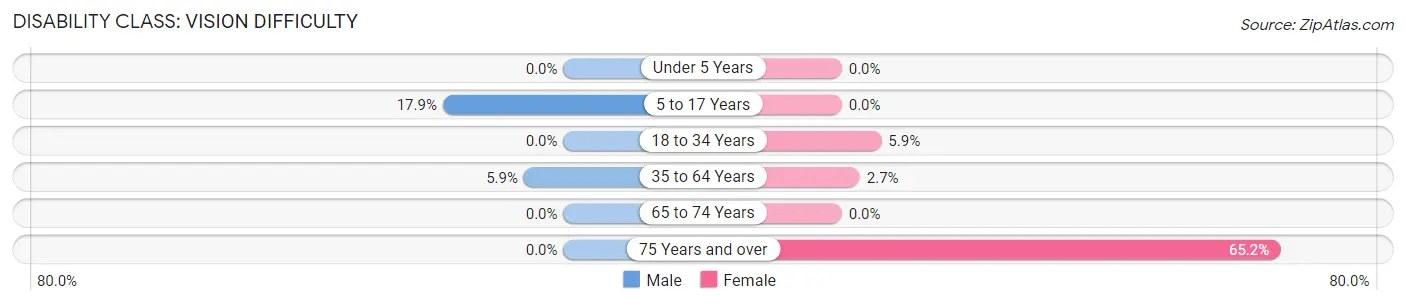
| Age Bracket | Male | Female |
| Under 5 Years | 0 (0.0%) | 0 (0.0%) |
| 5 to 17 Years | 12 (17.9%) | 0 (0.0%) |
| 18 to 34 Years | 0 (0.0%) | 17 (5.9%) |
| 35 to 64 Years | 24 (5.9%) | 10 (2.7%) |
| 65 to 74 Years | 0 (0.0%) | 0 (0.0%) |
| 75 Years and over | 0 (0.0%) | 30 (65.2%) |
Disability Class: Cognitive Difficulty
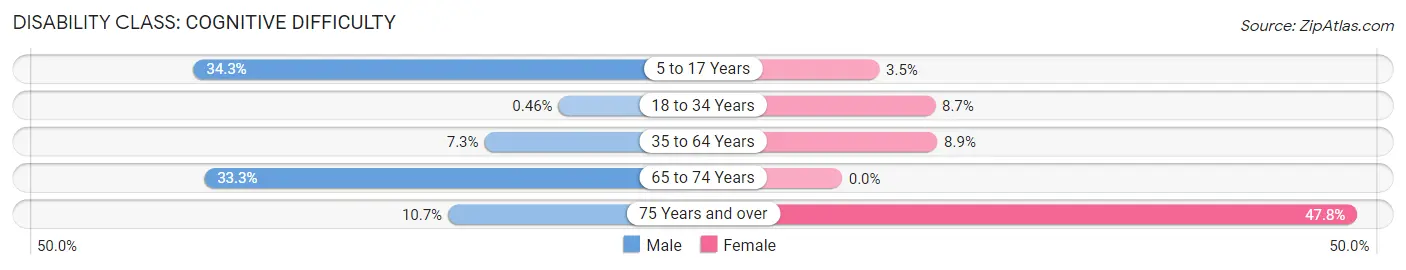
| Age Bracket | Male | Female |
| 5 to 17 Years | 23 (34.3%) | 10 (3.5%) |
| 18 to 34 Years | 2 (0.5%) | 25 (8.6%) |
| 35 to 64 Years | 30 (7.3%) | 33 (8.8%) |
| 65 to 74 Years | 11 (33.3%) | 0 (0.0%) |
| 75 Years and over | 3 (10.7%) | 22 (47.8%) |
Disability Class: Ambulatory Difficulty
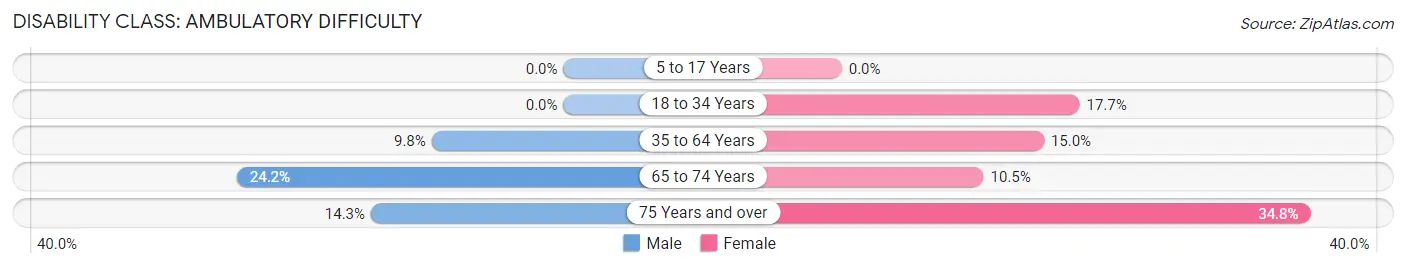
| Age Bracket | Male | Female |
| 5 to 17 Years | 0 (0.0%) | 0 (0.0%) |
| 18 to 34 Years | 0 (0.0%) | 51 (17.6%) |
| 35 to 64 Years | 40 (9.8%) | 56 (15.0%) |
| 65 to 74 Years | 8 (24.2%) | 6 (10.5%) |
| 75 Years and over | 4 (14.3%) | 16 (34.8%) |
Disability Class: Self-Care Difficulty
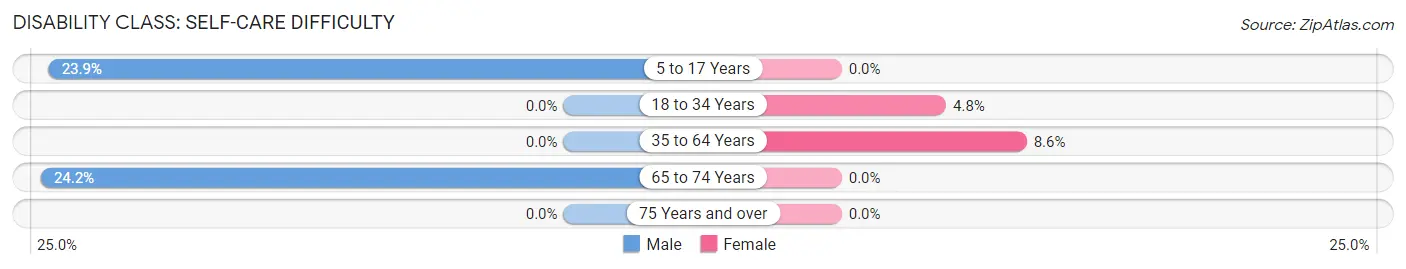
| Age Bracket | Male | Female |
| 5 to 17 Years | 16 (23.9%) | 0 (0.0%) |
| 18 to 34 Years | 0 (0.0%) | 14 (4.8%) |
| 35 to 64 Years | 0 (0.0%) | 32 (8.6%) |
| 65 to 74 Years | 8 (24.2%) | 0 (0.0%) |
| 75 Years and over | 0 (0.0%) | 0 (0.0%) |
Technology Access in Culver
Computing Device Access in Culver
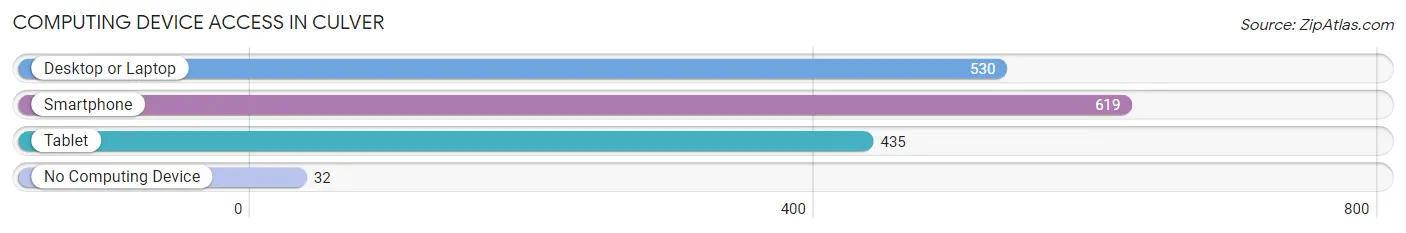
| Device Type | # Households | % Households |
| Desktop or Laptop | 530 | 77.1% |
| Smartphone | 619 | 90.1% |
| Tablet | 435 | 63.3% |
| No Computing Device | 32 | 4.7% |
| Total | 687 | 100.0% |
Internet Access in Culver
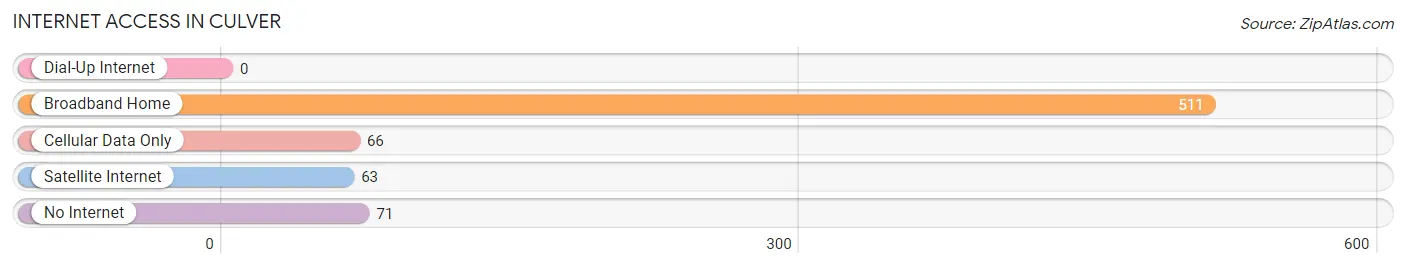
| Internet Type | # Households | % Households |
| Dial-Up Internet | 0 | 0.0% |
| Broadband Home | 511 | 74.4% |
| Cellular Data Only | 66 | 9.6% |
| Satellite Internet | 63 | 9.2% |
| No Internet | 71 | 10.3% |
| Total | 687 | 100.0% |
Culver Summary
Culver is a small city located in Jefferson County, Oregon, United States. It is situated on the eastern edge of the Cascade Range, approximately 20 miles south of Madras and 40 miles north of Bend. The city has a population of 1,541 as of the 2010 census.
History
The area around Culver was first settled in the late 1800s by homesteaders. The town was officially founded in 1906 and named after the Culver family, who were among the first settlers in the area. The town was incorporated in 1911.
In the early 1900s, the town was a hub for the lumber industry, with several sawmills in the area. The lumber industry declined in the mid-1900s, and the town shifted its focus to agriculture. Today, the town is known for its agricultural production, particularly its hay and wheat.
Geography
Culver is located in the high desert region of Central Oregon. The city is situated on the eastern edge of the Cascade Range, approximately 20 miles south of Madras and 40 miles north of Bend. The city is surrounded by rolling hills and open fields, with the Deschutes River running through the city.
The climate in Culver is semi-arid, with hot summers and cold winters. The average annual temperature is around 50°F, with an average high of around 90°F in the summer and an average low of around 20°F in the winter.
Economy
Culver’s economy is largely based on agriculture. The city is known for its hay and wheat production, as well as its cattle and sheep ranching. The city also has a small manufacturing sector, with several small businesses in the area.
The city is home to several small businesses, including a grocery store, a hardware store, a restaurant, and a gas station. The city also has a post office, a library, and a community center.
Demographics
As of the 2010 census, the population of Culver was 1,541. The racial makeup of the city was 94.3% White, 0.7% African American, 0.7% Native American, 0.3% Asian, 0.1% Pacific Islander, 1.2% from other races, and 2.1% from two or more races. Hispanic or Latino of any race were 4.2% of the population.
The median household income in Culver was $37,917, and the median family income was $45,000. The per capita income for the city was $18,945. About 11.3% of families and 14.2% of the population were below the poverty line, including 18.2% of those under age 18 and 8.3% of those age 65 or over.
Culver is a small city with a rich history and a strong agricultural economy. The city is home to a diverse population and offers a variety of amenities and services. The city is a great place to live, work, and raise a family.
Common Questions
What is Per Capita Income in Culver?
Per Capita income in Culver is $28,151.
What is the Median Family Income in Culver?
Median Family Income in Culver is $87,929.
What is the Median Household income in Culver?
Median Household Income in Culver is $81,534.
What is Income or Wage Gap in Culver?
Income or Wage Gap in Culver is 5.2%.
Women in Culver earn 94.8 cents for every dollar earned by a man.
What is Inequality or Gini Index in Culver?
Inequality or Gini Index in Culver is 0.34.
What is the Total Population of Culver?
Total Population of Culver is 2,173.
What is the Total Male Population of Culver?
Total Male Population of Culver is 1,048.
What is the Total Female Population of Culver?
Total Female Population of Culver is 1,125.
What is the Ratio of Males per 100 Females in Culver?
There are 93.16 Males per 100 Females in Culver.
What is the Ratio of Females per 100 Males in Culver?
There are 107.35 Females per 100 Males in Culver.
What is the Median Population Age in Culver?
Median Population Age in Culver is 30.6 Years.
What is the Average Family Size in Culver
Average Family Size in Culver is 3.9 People.
What is the Average Household Size in Culver
Average Household Size in Culver is 3.1 People.
How Large is the Labor Force in Culver?
There are 1,303 People in the Labor Forcein in Culver.
What is the Percentage of People in the Labor Force in Culver?
74.1% of People are in the Labor Force in Culver.
What is the Unemployment Rate in Culver?
Unemployment Rate in Culver is 1.3%.