Vernonia, OR Map & Demographics
Vernonia Map
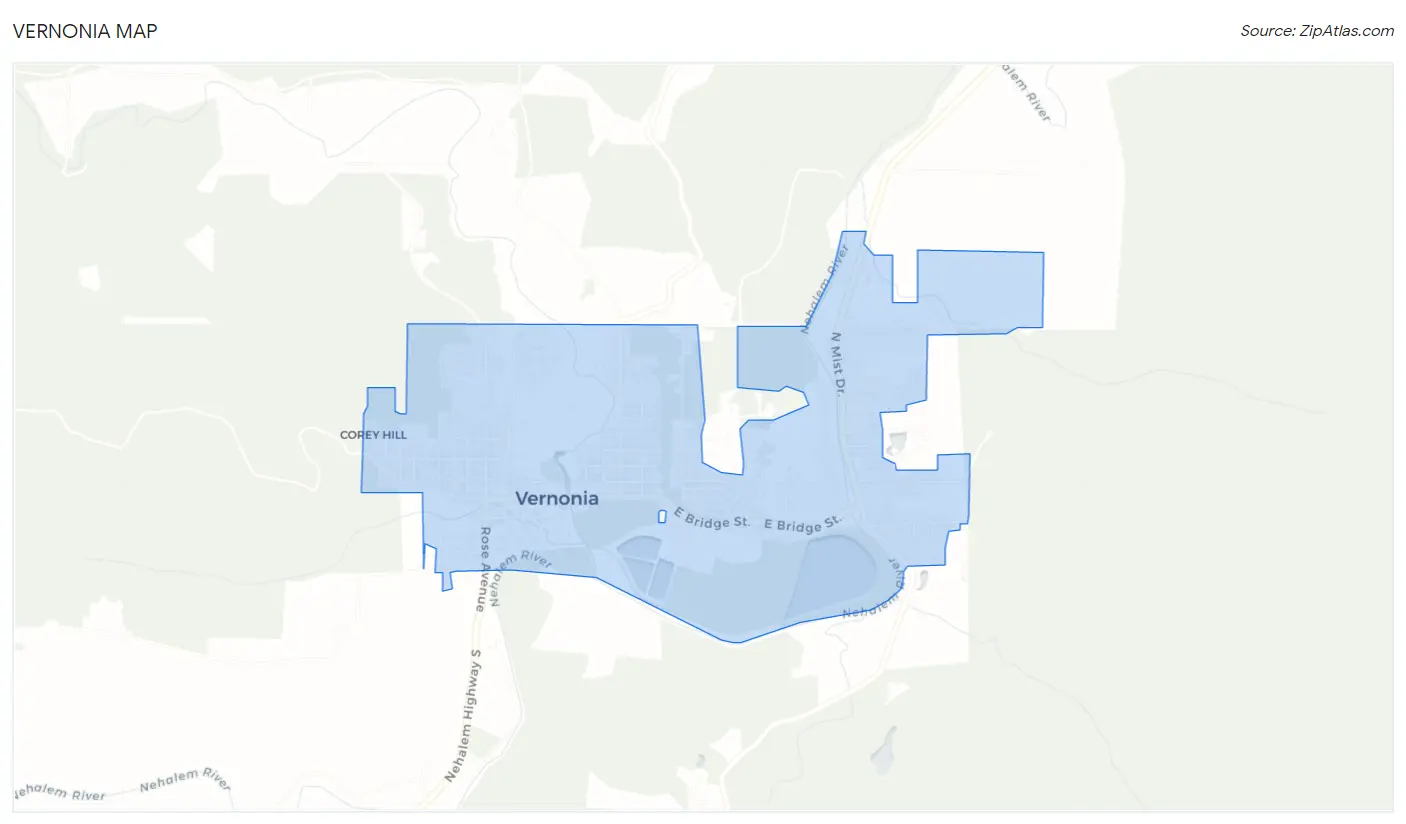
Vernonia Overview
$35,902
PER CAPITA INCOME
$88,750
AVG FAMILY INCOME
$78,315
AVG HOUSEHOLD INCOME
37.2%
WAGE / INCOME GAP [ % ]
62.8¢/ $1
WAGE / INCOME GAP [ $ ]
0.35
INEQUALITY / GINI INDEX
2,285
TOTAL POPULATION
1,176
MALE POPULATION
1,109
FEMALE POPULATION
106.04
MALES / 100 FEMALES
94.30
FEMALES / 100 MALES
39.3
MEDIAN AGE
3.0
AVG FAMILY SIZE
2.5
AVG HOUSEHOLD SIZE
1,292
LABOR FORCE [ PEOPLE ]
70.2%
PERCENT IN LABOR FORCE
7.7%
UNEMPLOYMENT RATE
Vernonia Zip Codes
Income in Vernonia
Income Overview in Vernonia
Per Capita Income in Vernonia is $35,902, while median incomes of families and households are $88,750 and $78,315 respectively.
| Characteristic | Number | Measure |
| Per Capita Income | 2,285 | $35,902 |
| Median Family Income | 639 | $88,750 |
| Mean Family Income | 639 | $96,835 |
| Median Household Income | 895 | $78,315 |
| Mean Household Income | 895 | $86,754 |
| Income Deficit | 639 | $0 |
| Wage / Income Gap (%) | 2,285 | 37.16% |
| Wage / Income Gap ($) | 2,285 | 62.84¢ per $1 |
| Gini / Inequality Index | 2,285 | 0.35 |
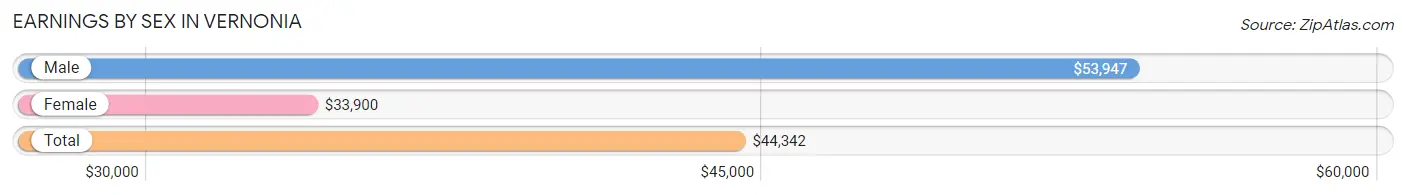
Earnings by Sex in Vernonia
Average Earnings in Vernonia are $44,342, $53,947 for men and $33,900 for women, a difference of 37.2%.
| Sex | Number | Average Earnings |
| Male | 754 (58.7%) | $53,947 |
| Female | 530 (41.3%) | $33,900 |
| Total | 1,284 (100.0%) | $44,342 |
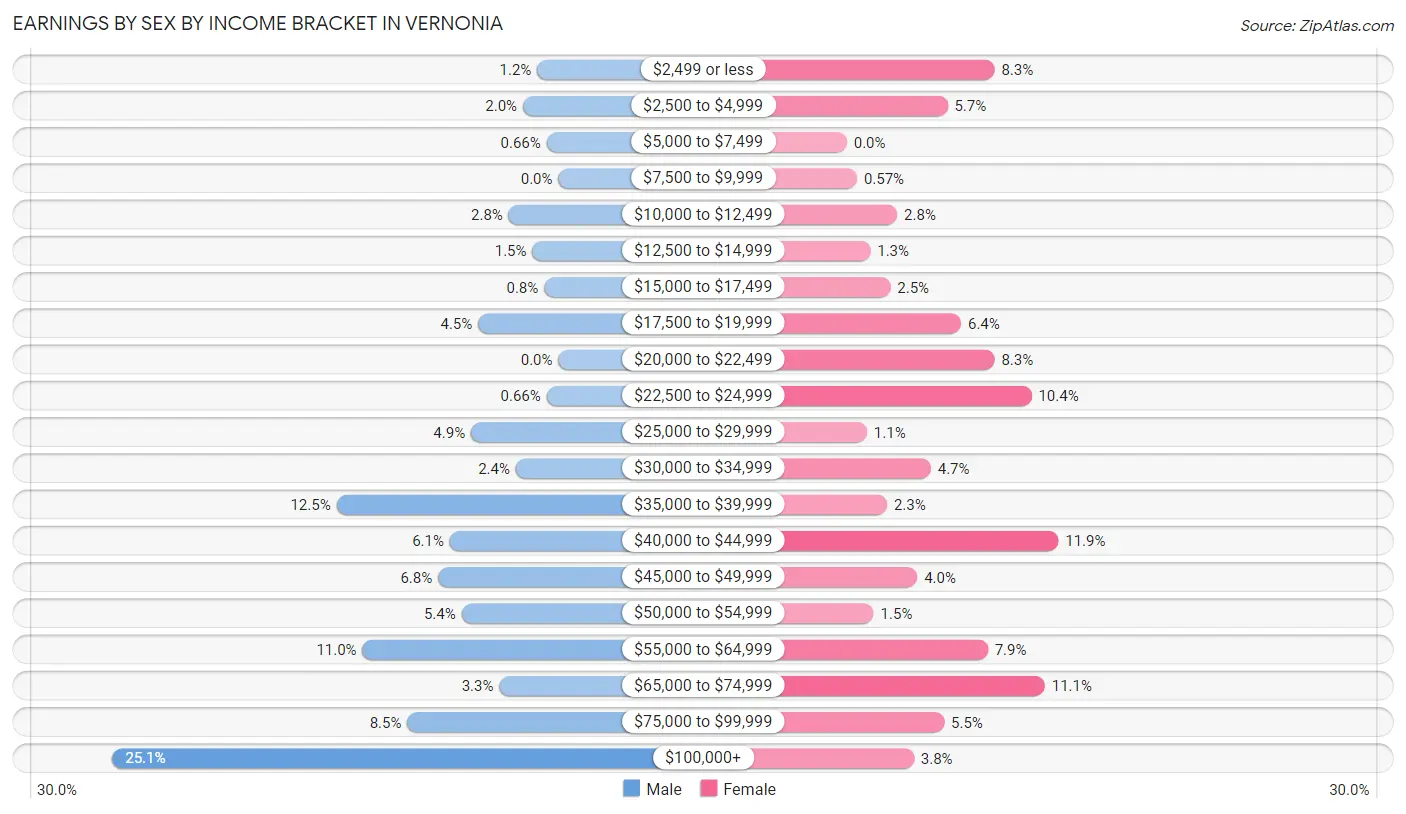
Earnings by Sex by Income Bracket in Vernonia
The most common earnings brackets in Vernonia are $100,000+ for men (189 | 25.1%) and $40,000 to $44,999 for women (63 | 11.9%).
| Income | Male | Female |
| $2,499 or less | 9 (1.2%) | 44 (8.3%) |
| $2,500 to $4,999 | 15 (2.0%) | 30 (5.7%) |
| $5,000 to $7,499 | 5 (0.7%) | 0 (0.0%) |
| $7,500 to $9,999 | 0 (0.0%) | 3 (0.6%) |
| $10,000 to $12,499 | 21 (2.8%) | 15 (2.8%) |
| $12,500 to $14,999 | 11 (1.5%) | 7 (1.3%) |
| $15,000 to $17,499 | 6 (0.8%) | 13 (2.5%) |
| $17,500 to $19,999 | 34 (4.5%) | 34 (6.4%) |
| $20,000 to $22,499 | 0 (0.0%) | 44 (8.3%) |
| $22,500 to $24,999 | 5 (0.7%) | 55 (10.4%) |
| $25,000 to $29,999 | 37 (4.9%) | 6 (1.1%) |
| $30,000 to $34,999 | 18 (2.4%) | 25 (4.7%) |
| $35,000 to $39,999 | 94 (12.5%) | 12 (2.3%) |
| $40,000 to $44,999 | 46 (6.1%) | 63 (11.9%) |
| $45,000 to $49,999 | 51 (6.8%) | 21 (4.0%) |
| $50,000 to $54,999 | 41 (5.4%) | 8 (1.5%) |
| $55,000 to $64,999 | 83 (11.0%) | 42 (7.9%) |
| $65,000 to $74,999 | 25 (3.3%) | 59 (11.1%) |
| $75,000 to $99,999 | 64 (8.5%) | 29 (5.5%) |
| $100,000+ | 189 (25.1%) | 20 (3.8%) |
| Total | 754 (100.0%) | 530 (100.0%) |
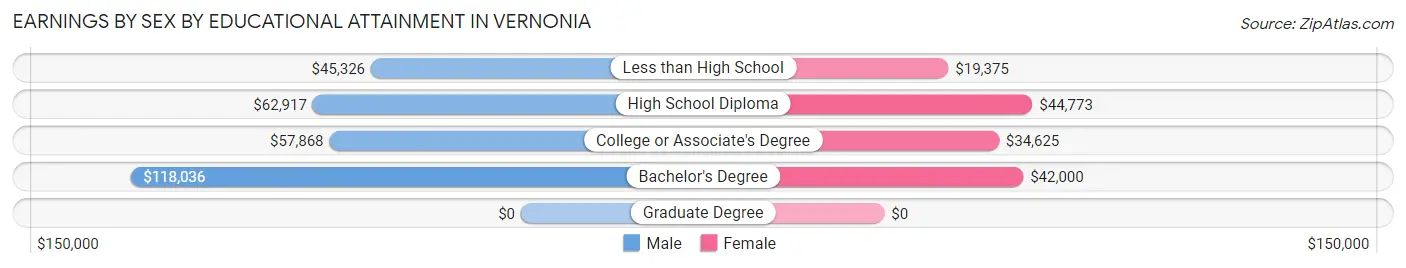
Earnings by Sex by Educational Attainment in Vernonia
Average earnings in Vernonia are $58,777 for men and $40,192 for women, a difference of 31.6%. Men with an educational attainment of bachelor's degree enjoy the highest average annual earnings of $118,036, while those with less than high school education earn the least with $45,326. Women with an educational attainment of high school diploma earn the most with the average annual earnings of $44,773, while those with less than high school education have the smallest earnings of $19,375.
| Educational Attainment | Male Income | Female Income |
| Less than High School | $45,326 | $19,375 |
| High School Diploma | $62,917 | $44,773 |
| College or Associate's Degree | $57,868 | $34,625 |
| Bachelor's Degree | $118,036 | $42,000 |
| Graduate Degree | - | - |
| Total | $58,777 | $40,192 |
Family Income in Vernonia
Family Income Brackets in Vernonia
According to the Vernonia family income data, there are 212 families falling into the $100,000 to $149,999 income range, which is the most common income bracket and makes up 33.2% of all families. Conversely, the $10,000 to $14,999 income bracket is the least frequent group with only 3 families (0.5%) belonging to this category.
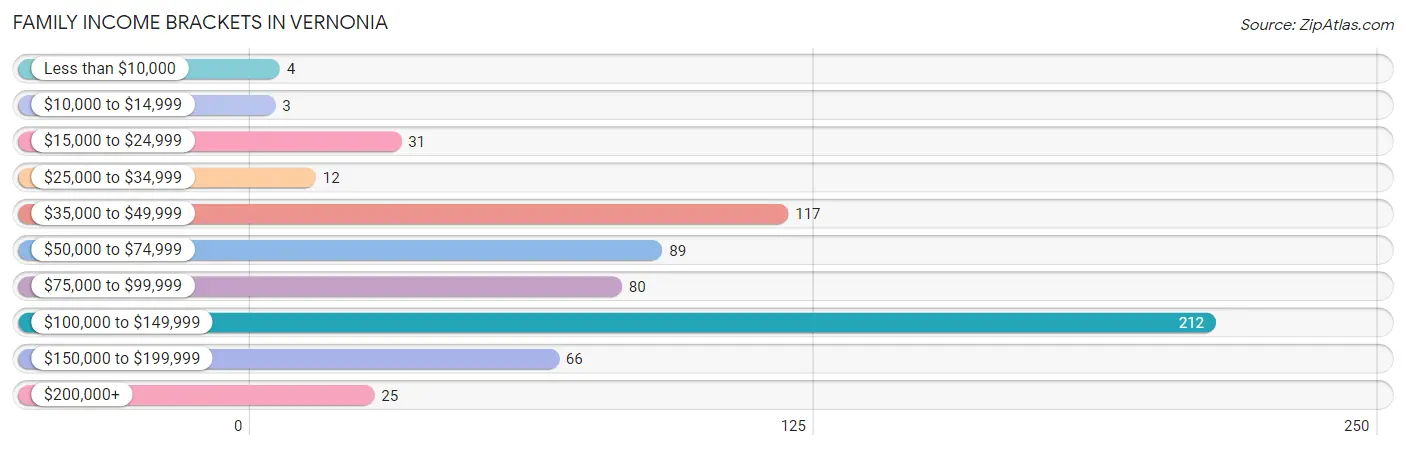
| Income Bracket | # Families | % Families |
| Less than $10,000 | 4 | 0.6% |
| $10,000 to $14,999 | 3 | 0.5% |
| $15,000 to $24,999 | 31 | 4.9% |
| $25,000 to $34,999 | 12 | 1.9% |
| $35,000 to $49,999 | 117 | 18.3% |
| $50,000 to $74,999 | 89 | 13.9% |
| $75,000 to $99,999 | 80 | 12.5% |
| $100,000 to $149,999 | 212 | 33.2% |
| $150,000 to $199,999 | 66 | 10.3% |
| $200,000+ | 25 | 3.9% |
Family Income by Famaliy Size in Vernonia
3-person families (107 | 16.7%) account for the highest median family income in Vernonia with $110,156 per family, while 2-person families (354 | 55.4%) have the highest median income of $39,250 per family member.
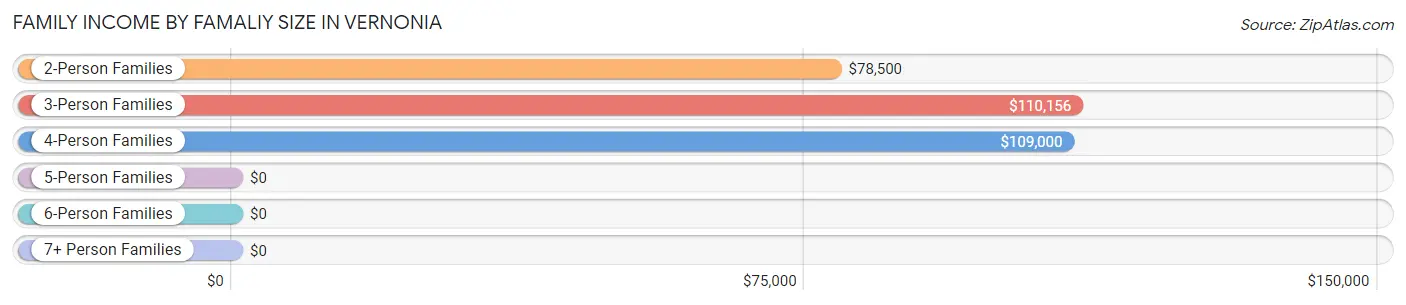
| Income Bracket | # Families | Median Income |
| 2-Person Families | 354 (55.4%) | $78,500 |
| 3-Person Families | 107 (16.7%) | $110,156 |
| 4-Person Families | 134 (21.0%) | $109,000 |
| 5-Person Families | 19 (3.0%) | $0 |
| 6-Person Families | 5 (0.8%) | $0 |
| 7+ Person Families | 20 (3.1%) | $0 |
| Total | 639 (100.0%) | $88,750 |
Family Income by Number of Earners in Vernonia
The median family income in Vernonia is $88,750, with families comprising 3+ earners (35) having the highest median family income of $185,288, while families with no earners (77) have the lowest median family income of $52,583, accounting for 5.5% and 12.0% of families, respectively.
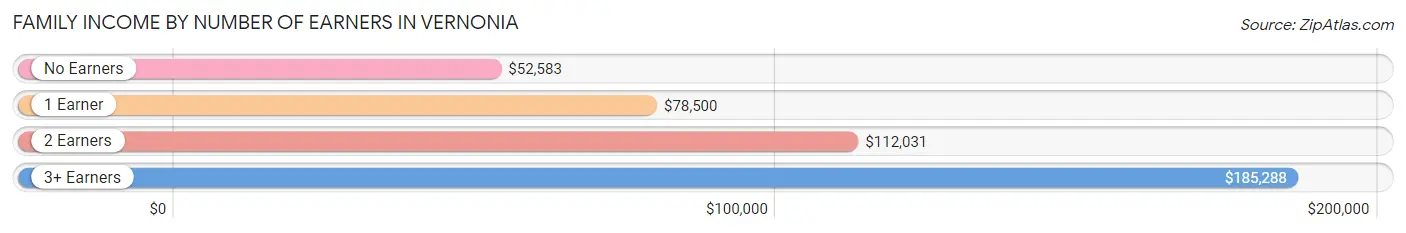
| Number of Earners | # Families | Median Income |
| No Earners | 77 (12.0%) | $52,583 |
| 1 Earner | 188 (29.4%) | $78,500 |
| 2 Earners | 339 (53.0%) | $112,031 |
| 3+ Earners | 35 (5.5%) | $185,288 |
| Total | 639 (100.0%) | $88,750 |
Household Income in Vernonia
Household Income Brackets in Vernonia
With 251 households falling in the category, the $100,000 to $149,999 income range is the most frequent in Vernonia, accounting for 28.0% of all households. In contrast, only 4 households (0.4%) fall into the less than $10,000 income bracket, making it the least populous group.
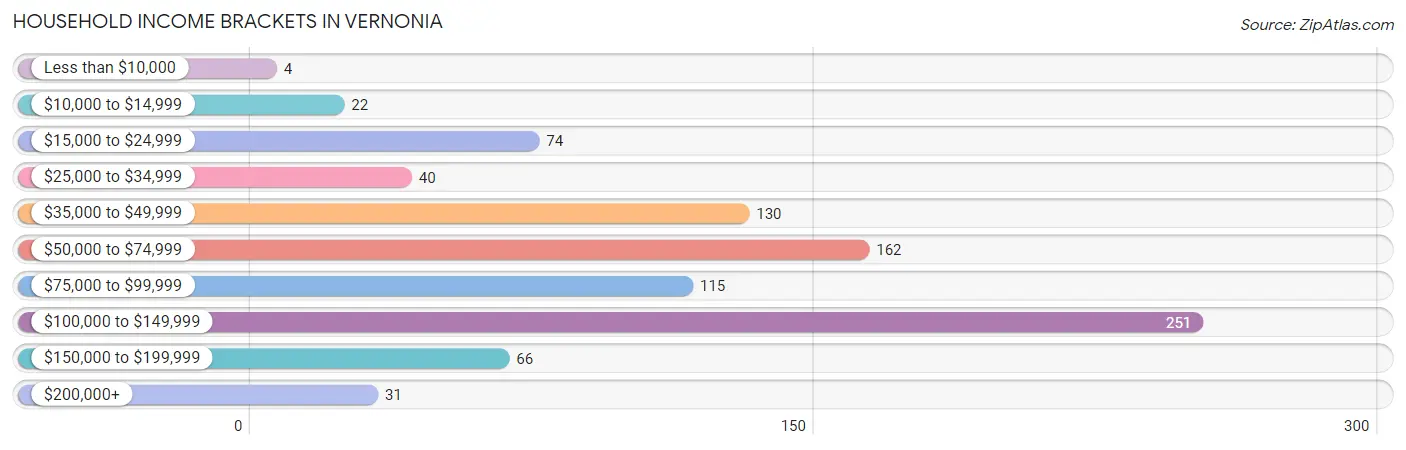
| Income Bracket | # Households | % Households |
| Less than $10,000 | 4 | 0.4% |
| $10,000 to $14,999 | 22 | 2.5% |
| $15,000 to $24,999 | 74 | 8.3% |
| $25,000 to $34,999 | 40 | 4.5% |
| $35,000 to $49,999 | 130 | 14.5% |
| $50,000 to $74,999 | 162 | 18.1% |
| $75,000 to $99,999 | 115 | 12.8% |
| $100,000 to $149,999 | 251 | 28.0% |
| $150,000 to $199,999 | 66 | 7.4% |
| $200,000+ | 31 | 3.5% |
Household Income by Householder Age in Vernonia
The median household income in Vernonia is $78,315, with the highest median household income of $102,292 found in the 25 to 44 years age bracket for the primary householder. A total of 334 households (37.3%) fall into this category. Meanwhile, the 15 to 24 years age bracket for the primary householder has the lowest median household income of $0, with 29 households (3.2%) in this group.
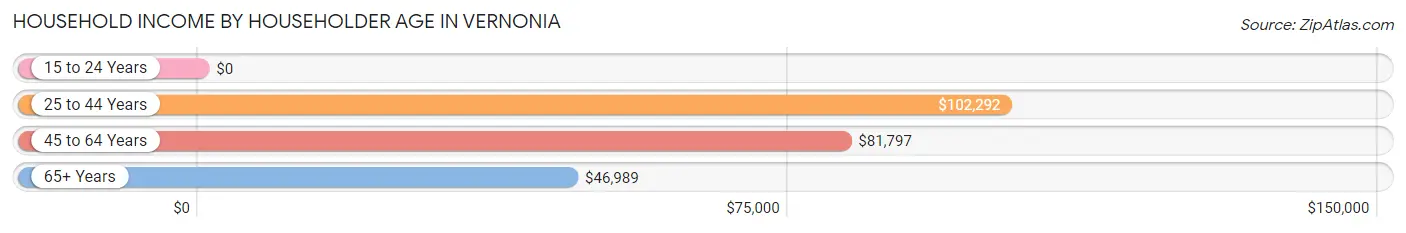
| Income Bracket | # Households | Median Income |
| 15 to 24 Years | 29 (3.2%) | $0 |
| 25 to 44 Years | 334 (37.3%) | $102,292 |
| 45 to 64 Years | 329 (36.8%) | $81,797 |
| 65+ Years | 203 (22.7%) | $46,989 |
| Total | 895 (100.0%) | $78,315 |
Poverty in Vernonia
Income Below Poverty by Sex and Age in Vernonia
With 3.4% poverty level for males and 11.1% for females among the residents of Vernonia, 12 to 14 year old males and 12 to 14 year old females are the most vulnerable to poverty, with 14 males (18.4%) and 13 females (34.2%) in their respective age groups living below the poverty level.
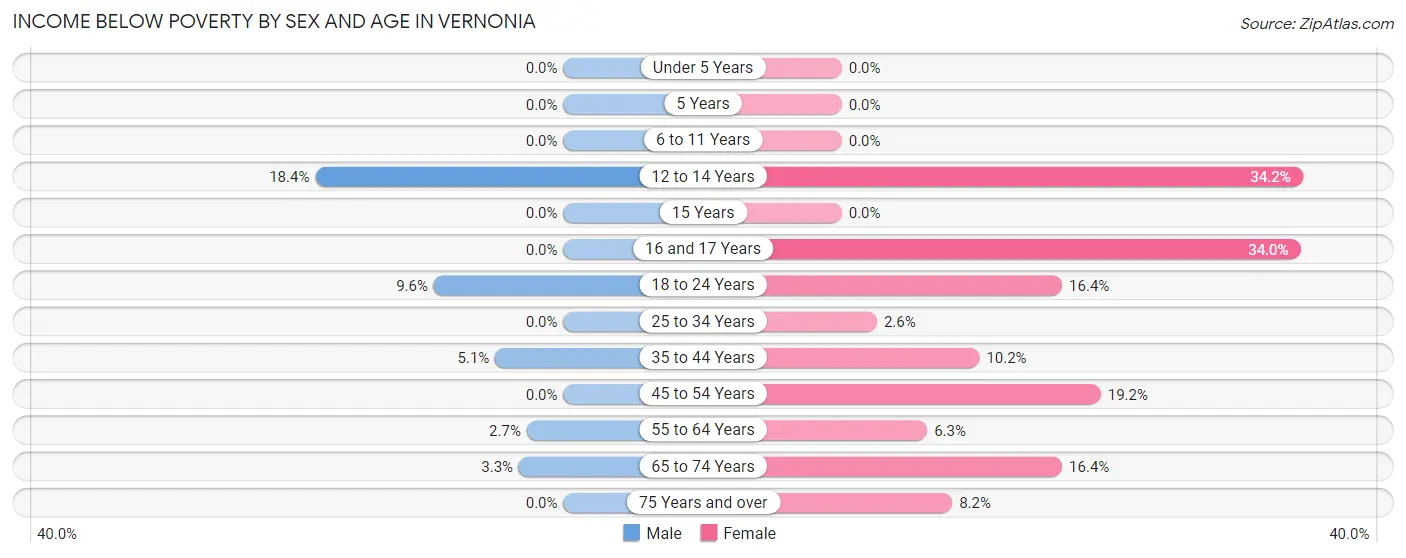
| Age Bracket | Male | Female |
| Under 5 Years | 0 (0.0%) | 0 (0.0%) |
| 5 Years | 0 (0.0%) | 0 (0.0%) |
| 6 to 11 Years | 0 (0.0%) | 0 (0.0%) |
| 12 to 14 Years | 14 (18.4%) | 13 (34.2%) |
| 15 Years | 0 (0.0%) | 0 (0.0%) |
| 16 and 17 Years | 0 (0.0%) | 16 (34.0%) |
| 18 to 24 Years | 10 (9.6%) | 9 (16.4%) |
| 25 to 34 Years | 0 (0.0%) | 4 (2.6%) |
| 35 to 44 Years | 9 (5.1%) | 14 (10.2%) |
| 45 to 54 Years | 0 (0.0%) | 35 (19.2%) |
| 55 to 64 Years | 4 (2.7%) | 9 (6.3%) |
| 65 to 74 Years | 3 (3.3%) | 18 (16.4%) |
| 75 Years and over | 0 (0.0%) | 5 (8.2%) |
| Total | 40 (3.4%) | 123 (11.1%) |
Income Above Poverty by Sex and Age in Vernonia
According to the poverty statistics in Vernonia, males aged under 5 years and females aged under 5 years are the age groups that are most secure financially, with 100.0% of males and 100.0% of females in these age groups living above the poverty line.
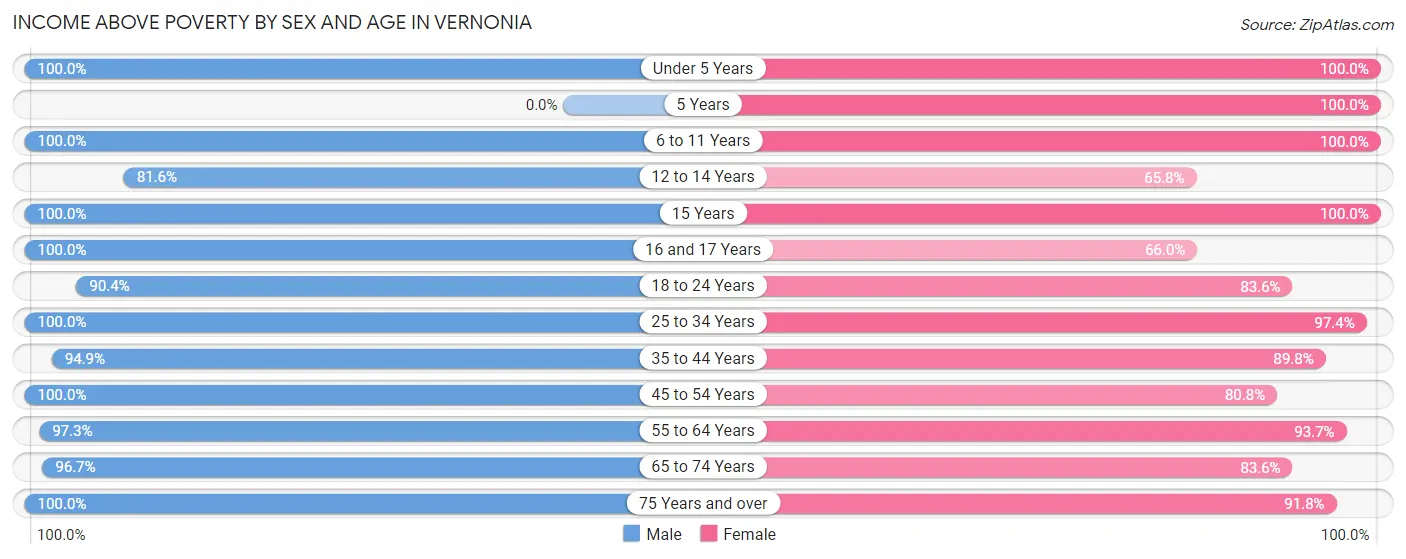
| Age Bracket | Male | Female |
| Under 5 Years | 13 (100.0%) | 59 (100.0%) |
| 5 Years | 0 (0.0%) | 25 (100.0%) |
| 6 to 11 Years | 113 (100.0%) | 79 (100.0%) |
| 12 to 14 Years | 62 (81.6%) | 25 (65.8%) |
| 15 Years | 19 (100.0%) | 21 (100.0%) |
| 16 and 17 Years | 14 (100.0%) | 31 (66.0%) |
| 18 to 24 Years | 94 (90.4%) | 46 (83.6%) |
| 25 to 34 Years | 159 (100.0%) | 149 (97.4%) |
| 35 to 44 Years | 169 (94.9%) | 123 (89.8%) |
| 45 to 54 Years | 230 (100.0%) | 147 (80.8%) |
| 55 to 64 Years | 143 (97.3%) | 133 (93.7%) |
| 65 to 74 Years | 88 (96.7%) | 92 (83.6%) |
| 75 Years and over | 30 (100.0%) | 56 (91.8%) |
| Total | 1,134 (96.6%) | 986 (88.9%) |
Income Below Poverty Among Married-Couple Families in Vernonia
The poverty statistics for married-couple families in Vernonia show that 1.3% or 7 of the total 541 families live below the poverty line. Families with no children have the highest poverty rate of 2.0%, comprising of 7 families. On the other hand, families with 1 or 2 children have the lowest poverty rate of 0.0%, which includes 0 families.
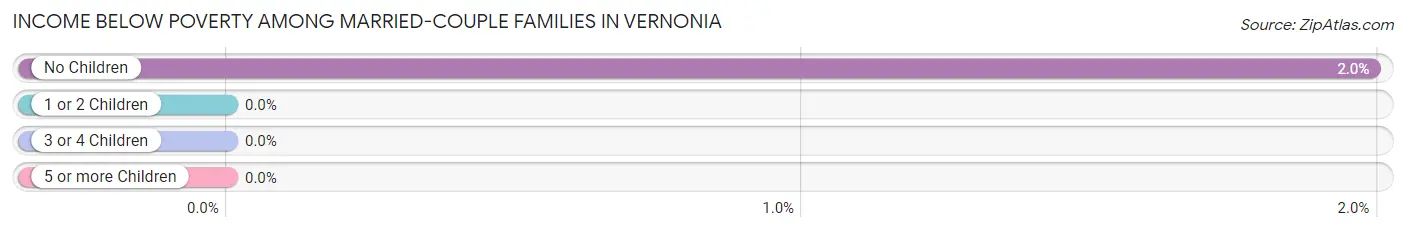
| Children | Above Poverty | Below Poverty |
| No Children | 344 (98.0%) | 7 (2.0%) |
| 1 or 2 Children | 151 (100.0%) | 0 (0.0%) |
| 3 or 4 Children | 39 (100.0%) | 0 (0.0%) |
| 5 or more Children | 0 (0.0%) | 0 (0.0%) |
| Total | 534 (98.7%) | 7 (1.3%) |
Income Below Poverty Among Single-Parent Households in Vernonia
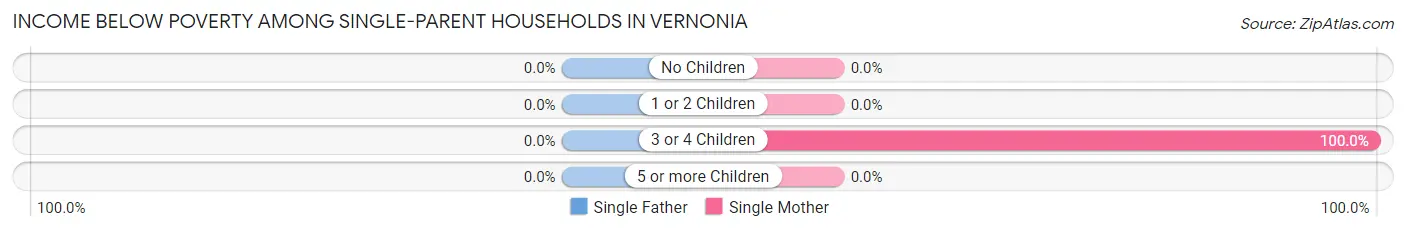
| Children | Single Father | Single Mother |
| No Children | 0 (0.0%) | 0 (0.0%) |
| 1 or 2 Children | 0 (0.0%) | 0 (0.0%) |
| 3 or 4 Children | 0 (0.0%) | 14 (100.0%) |
| 5 or more Children | 0 (0.0%) | 0 (0.0%) |
| Total | 0 (0.0%) | 14 (18.9%) |
Income Below Poverty Among Married-Couple vs Single-Parent Households in Vernonia
The poverty data for Vernonia shows that 7 of the married-couple family households (1.3%) and 14 of the single-parent households (14.3%) are living below the poverty level. Within the married-couple family households, those with no children have the highest poverty rate, with 7 households (2.0%) falling below the poverty line. Among the single-parent households, those with 3 or 4 children have the highest poverty rate, with 14 household (100.0%) living below poverty.
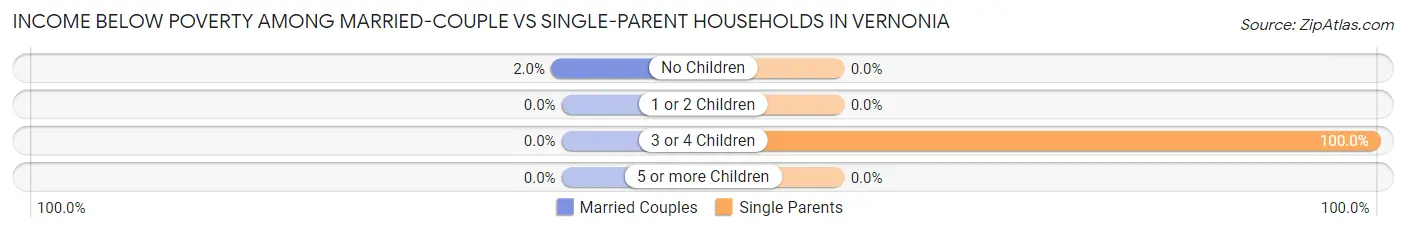
| Children | Married-Couple Families | Single-Parent Households |
| No Children | 7 (2.0%) | 0 (0.0%) |
| 1 or 2 Children | 0 (0.0%) | 0 (0.0%) |
| 3 or 4 Children | 0 (0.0%) | 14 (100.0%) |
| 5 or more Children | 0 (0.0%) | 0 (0.0%) |
| Total | 7 (1.3%) | 14 (14.3%) |
Race in Vernonia
The most populous races in Vernonia are White / Caucasian (2,178 | 95.3%), Hispanic or Latino (128 | 5.6%), and Two or more Races (47 | 2.1%).
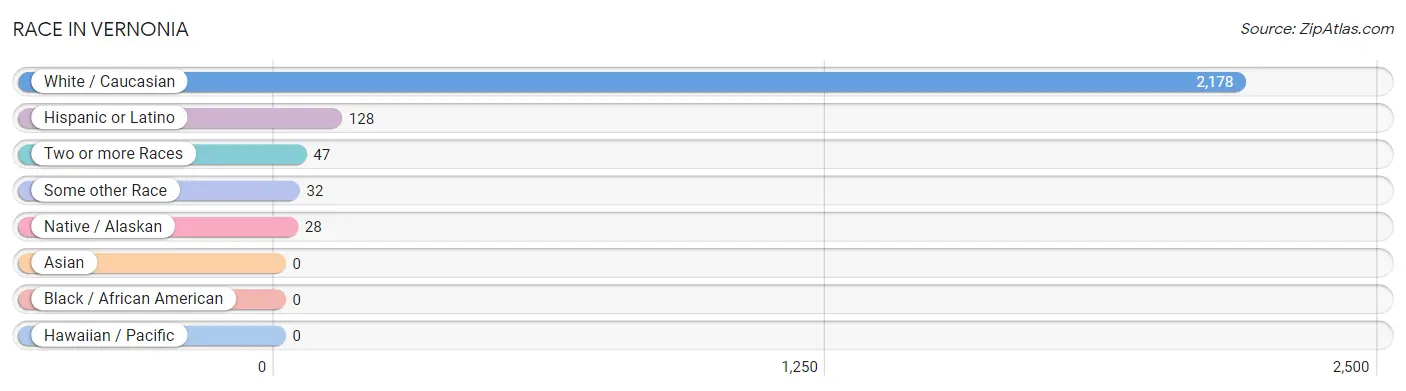
| Race | # Population | % Population |
| Asian | 0 | 0.0% |
| Black / African American | 0 | 0.0% |
| Hawaiian / Pacific | 0 | 0.0% |
| Hispanic or Latino | 128 | 5.6% |
| Native / Alaskan | 28 | 1.2% |
| White / Caucasian | 2,178 | 95.3% |
| Two or more Races | 47 | 2.1% |
| Some other Race | 32 | 1.4% |
| Total | 2,285 | 100.0% |
Ancestry in Vernonia
The most populous ancestries reported in Vernonia are English (423 | 18.5%), German (316 | 13.8%), Irish (227 | 9.9%), American (199 | 8.7%), and European (130 | 5.7%), together accounting for 56.7% of all Vernonia residents.
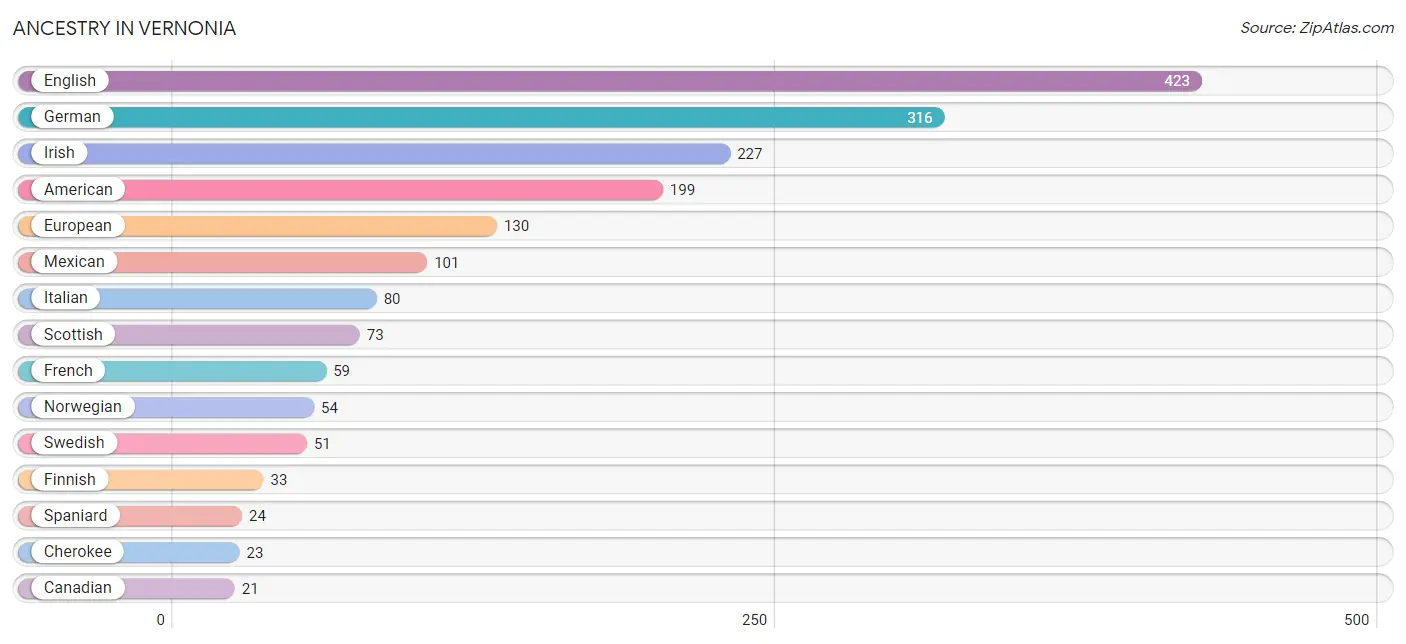
| Ancestry | # Population | % Population |
| American | 199 | 8.7% |
| Belgian | 8 | 0.4% |
| Blackfeet | 13 | 0.6% |
| British | 6 | 0.3% |
| Burmese | 9 | 0.4% |
| Canadian | 21 | 0.9% |
| Cherokee | 23 | 1.0% |
| Croatian | 5 | 0.2% |
| Czech | 4 | 0.2% |
| Czechoslovakian | 15 | 0.7% |
| Danish | 5 | 0.2% |
| Eastern European | 4 | 0.2% |
| English | 423 | 18.5% |
| European | 130 | 5.7% |
| Finnish | 33 | 1.4% |
| French | 59 | 2.6% |
| French Canadian | 9 | 0.4% |
| German | 316 | 13.8% |
| Irish | 227 | 9.9% |
| Italian | 80 | 3.5% |
| Mexican | 101 | 4.4% |
| Mexican American Indian | 3 | 0.1% |
| Norwegian | 54 | 2.4% |
| Polish | 4 | 0.2% |
| Russian | 5 | 0.2% |
| Scotch-Irish | 19 | 0.8% |
| Scottish | 73 | 3.2% |
| Sioux | 4 | 0.2% |
| Spaniard | 24 | 1.1% |
| Swedish | 51 | 2.2% |
| Swiss | 11 | 0.5% |
| Welsh | 3 | 0.1% | View All 32 Rows |
Immigrants in Vernonia
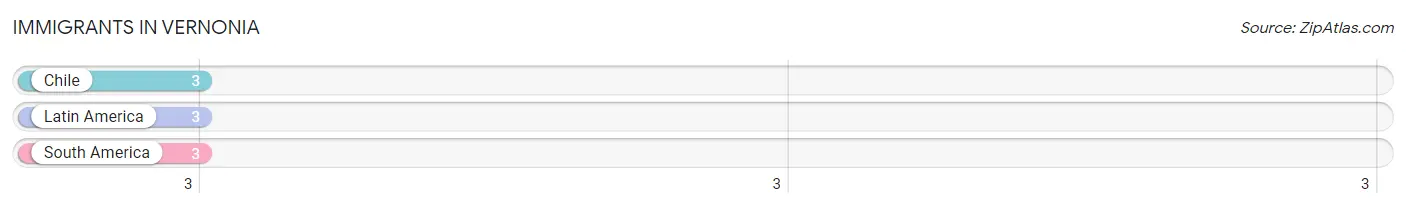
The most numerous immigrant groups reported in Vernonia came from Chile (3 | 0.1%), Latin America (3 | 0.1%), and South America (3 | 0.1%), together accounting for 0.4% of all Vernonia residents.
| Immigration Origin | # Population | % Population |
| Chile | 3 | 0.1% |
| Latin America | 3 | 0.1% |
| South America | 3 | 0.1% | View All 3 Rows |
Sex and Age in Vernonia
Sex and Age in Vernonia
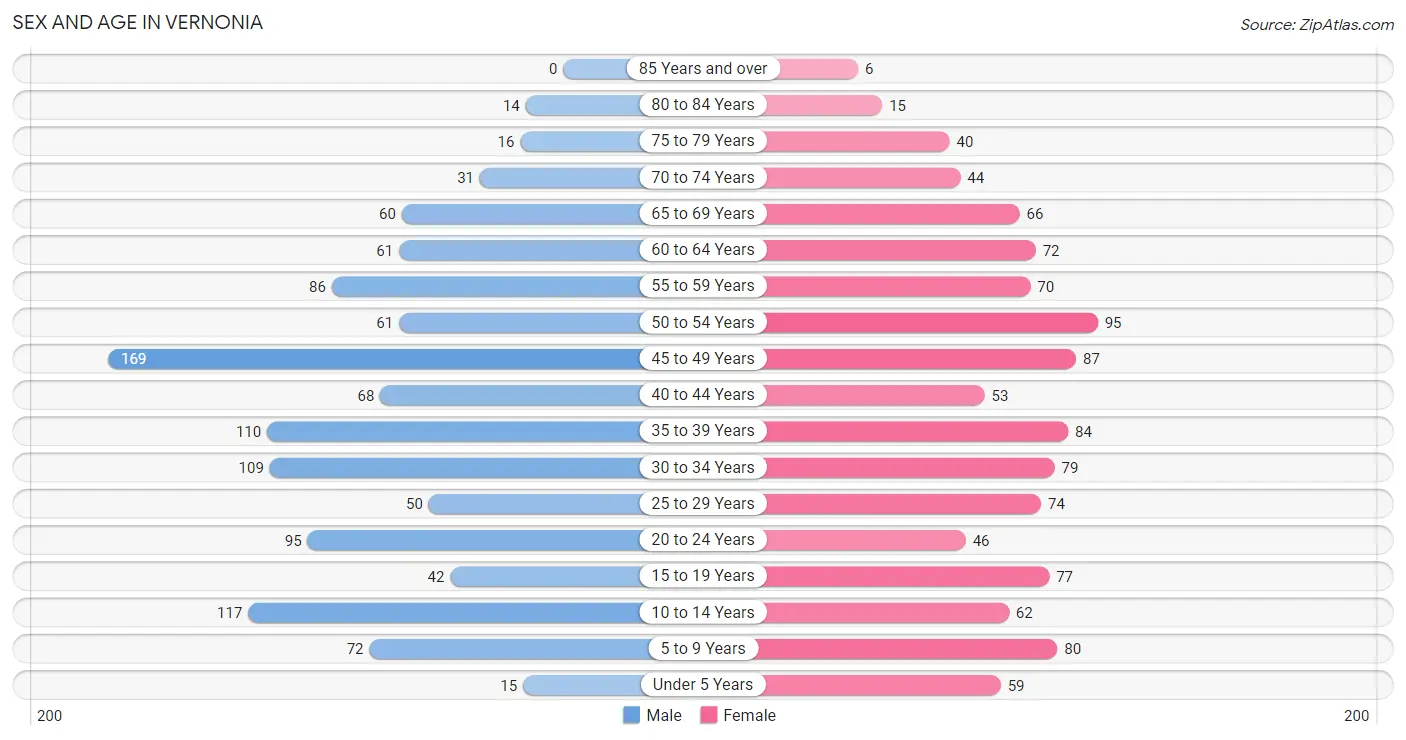
The most populous age groups in Vernonia are 45 to 49 Years (169 | 14.4%) for men and 50 to 54 Years (95 | 8.6%) for women.
| Age Bracket | Male | Female |
| Under 5 Years | 15 (1.3%) | 59 (5.3%) |
| 5 to 9 Years | 72 (6.1%) | 80 (7.2%) |
| 10 to 14 Years | 117 (10.0%) | 62 (5.6%) |
| 15 to 19 Years | 42 (3.6%) | 77 (6.9%) |
| 20 to 24 Years | 95 (8.1%) | 46 (4.2%) |
| 25 to 29 Years | 50 (4.3%) | 74 (6.7%) |
| 30 to 34 Years | 109 (9.3%) | 79 (7.1%) |
| 35 to 39 Years | 110 (9.3%) | 84 (7.6%) |
| 40 to 44 Years | 68 (5.8%) | 53 (4.8%) |
| 45 to 49 Years | 169 (14.4%) | 87 (7.8%) |
| 50 to 54 Years | 61 (5.2%) | 95 (8.6%) |
| 55 to 59 Years | 86 (7.3%) | 70 (6.3%) |
| 60 to 64 Years | 61 (5.2%) | 72 (6.5%) |
| 65 to 69 Years | 60 (5.1%) | 66 (5.9%) |
| 70 to 74 Years | 31 (2.6%) | 44 (4.0%) |
| 75 to 79 Years | 16 (1.4%) | 40 (3.6%) |
| 80 to 84 Years | 14 (1.2%) | 15 (1.3%) |
| 85 Years and over | 0 (0.0%) | 6 (0.5%) |
| Total | 1,176 (100.0%) | 1,109 (100.0%) |
Families and Households in Vernonia
Median Family Size in Vernonia
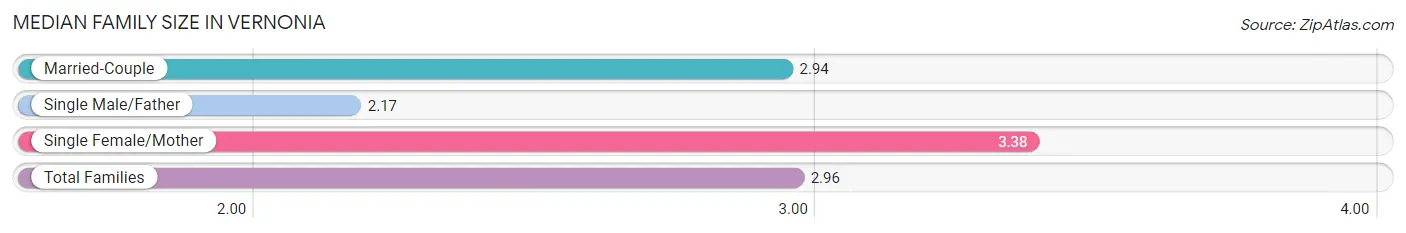
The median family size in Vernonia is 2.96 persons per family, with single female/mother families (74 | 11.6%) accounting for the largest median family size of 3.38 persons per family. On the other hand, single male/father families (24 | 3.8%) represent the smallest median family size with 2.17 persons per family.
| Family Type | # Families | Family Size |
| Married-Couple | 541 (84.7%) | 2.94 |
| Single Male/Father | 24 (3.8%) | 2.17 |
| Single Female/Mother | 74 (11.6%) | 3.38 |
| Total Families | 639 (100.0%) | 2.96 |
Median Household Size in Vernonia
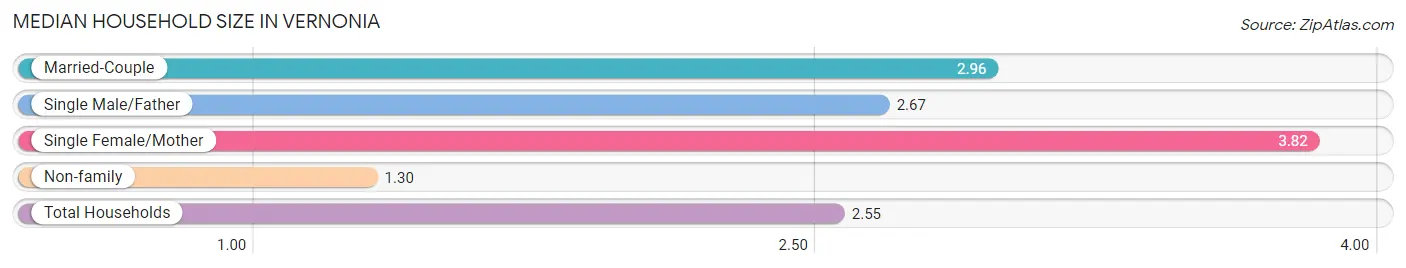
The median household size in Vernonia is 2.55 persons per household, with single female/mother households (74 | 8.3%) accounting for the largest median household size of 3.82 persons per household. non-family households (256 | 28.6%) represent the smallest median household size with 1.30 persons per household.
| Household Type | # Households | Household Size |
| Married-Couple | 541 (60.5%) | 2.96 |
| Single Male/Father | 24 (2.7%) | 2.67 |
| Single Female/Mother | 74 (8.3%) | 3.82 |
| Non-family | 256 (28.6%) | 1.30 |
| Total Households | 895 (100.0%) | 2.55 |
Household Size by Marriage Status in Vernonia
Out of a total of 895 households in Vernonia, 639 (71.4%) are family households, while 256 (28.6%) are nonfamily households. The most numerous type of family households are 2-person households, comprising 343, and the most common type of nonfamily households are 1-person households, comprising 179.
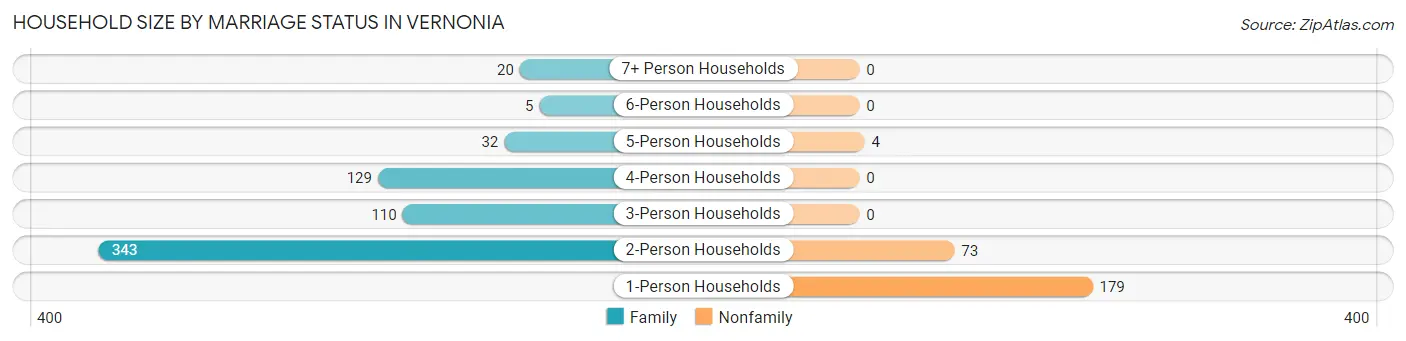
| Household Size | Family Households | Nonfamily Households |
| 1-Person Households | - | 179 (20.0%) |
| 2-Person Households | 343 (38.3%) | 73 (8.2%) |
| 3-Person Households | 110 (12.3%) | 0 (0.0%) |
| 4-Person Households | 129 (14.4%) | 0 (0.0%) |
| 5-Person Households | 32 (3.6%) | 4 (0.4%) |
| 6-Person Households | 5 (0.6%) | 0 (0.0%) |
| 7+ Person Households | 20 (2.2%) | 0 (0.0%) |
| Total | 639 (71.4%) | 256 (28.6%) |
Female Fertility in Vernonia
Fertility by Age in Vernonia
Average fertility rate in Vernonia is 34.0 births per 1,000 women. Women in the age bracket of 20 to 34 years have the highest fertility rate with 85.0 births per 1,000 women. Women in the age bracket of 20 to 34 years acount for 100.0% of all women with births.
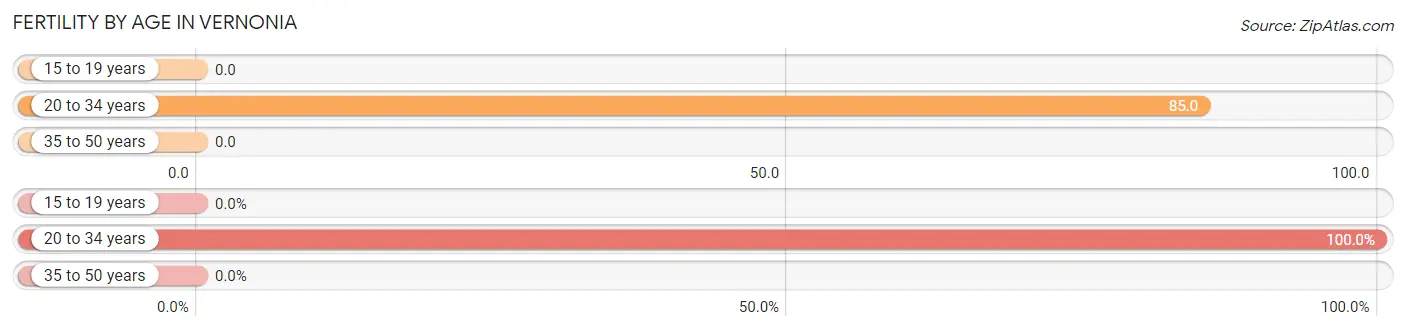
| Age Bracket | Women with Births | Births / 1,000 Women |
| 15 to 19 years | 0 (0.0%) | 0.0 |
| 20 to 34 years | 17 (100.0%) | 85.0 |
| 35 to 50 years | 0 (0.0%) | 0.0 |
| Total | 17 (100.0%) | 34.0 |
Fertility by Age by Marriage Status in Vernonia
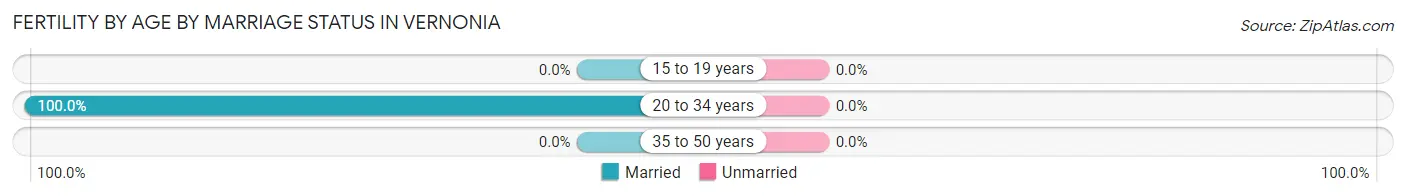
| Age Bracket | Married | Unmarried |
| 15 to 19 years | 0 (0.0%) | 0 (0.0%) |
| 20 to 34 years | 17 (100.0%) | 0 (0.0%) |
| 35 to 50 years | 0 (0.0%) | 0 (0.0%) |
| Total | 17 (100.0%) | 0 (0.0%) |
Fertility by Education in Vernonia
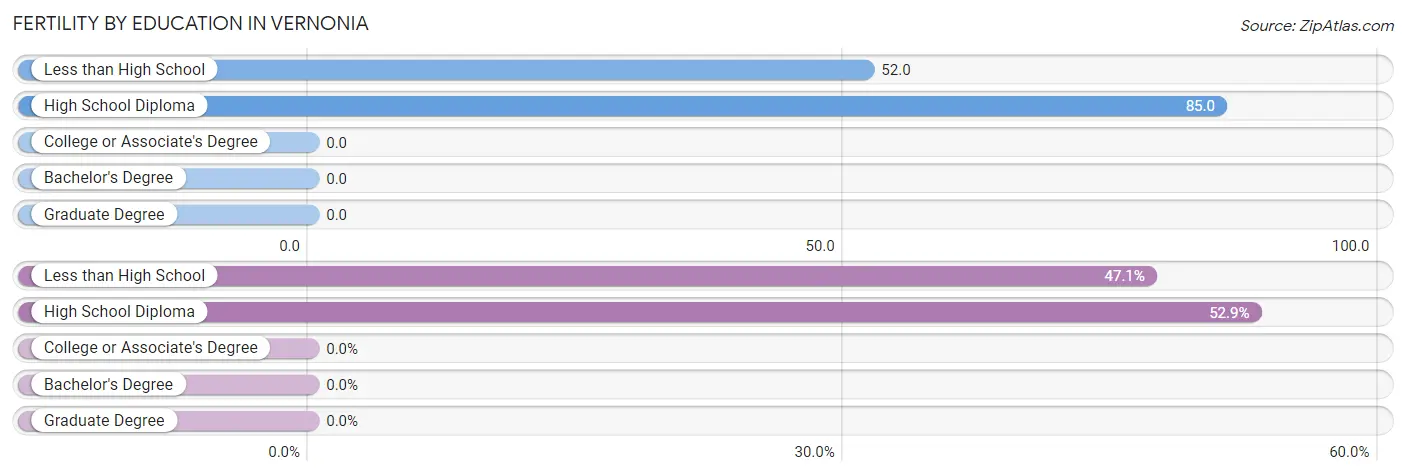
| Educational Attainment | Women with Births | Births / 1,000 Women |
| Less than High School | 8 (47.1%) | 52.0 |
| High School Diploma | 9 (52.9%) | 85.0 |
| College or Associate's Degree | 0 (0.0%) | 0.0 |
| Bachelor's Degree | 0 (0.0%) | 0.0 |
| Graduate Degree | 0 (0.0%) | 0.0 |
| Total | 17 (100.0%) | 34.0 |
Fertility by Education by Marriage Status in Vernonia
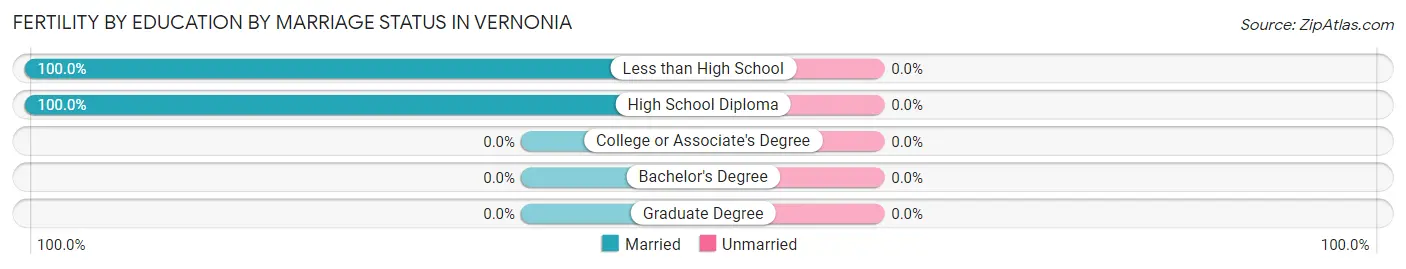
| Educational Attainment | Married | Unmarried |
| Less than High School | 8 (100.0%) | 0 (0.0%) |
| High School Diploma | 9 (100.0%) | 0 (0.0%) |
| College or Associate's Degree | 0 (0.0%) | 0 (0.0%) |
| Bachelor's Degree | 0 (0.0%) | 0 (0.0%) |
| Graduate Degree | 0 (0.0%) | 0 (0.0%) |
| Total | 17 (100.0%) | 0 (0.0%) |
Employment Characteristics in Vernonia
Employment by Class of Employer in Vernonia
Among the 1,144 employed individuals in Vernonia, private company employees (906 | 79.2%), not-for-profit organizations (133 | 11.6%), and state government employees (47 | 4.1%) make up the most common classes of employment.
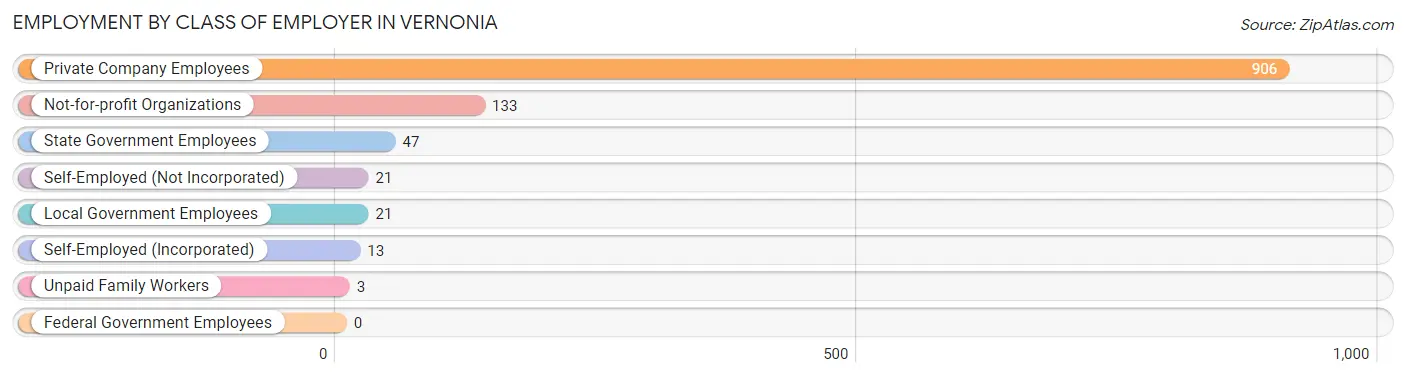
| Employer Class | # Employees | % Employees |
| Private Company Employees | 906 | 79.2% |
| Self-Employed (Incorporated) | 13 | 1.1% |
| Self-Employed (Not Incorporated) | 21 | 1.8% |
| Not-for-profit Organizations | 133 | 11.6% |
| Local Government Employees | 21 | 1.8% |
| State Government Employees | 47 | 4.1% |
| Federal Government Employees | 0 | 0.0% |
| Unpaid Family Workers | 3 | 0.3% |
| Total | 1,144 | 100.0% |
Employment Status by Age in Vernonia
According to the labor force statistics for Vernonia, out of the total population over 16 years of age (1,840), 70.2% or 1,292 individuals are in the labor force, with 7.7% or 99 of them unemployed. The age group with the highest labor force participation rate is 20 to 24 years, with 93.6% or 132 individuals in the labor force. Within the labor force, the 25 to 29 years age range has the highest percentage of unemployed individuals, with 25.8% or 25 of them being unemployed.
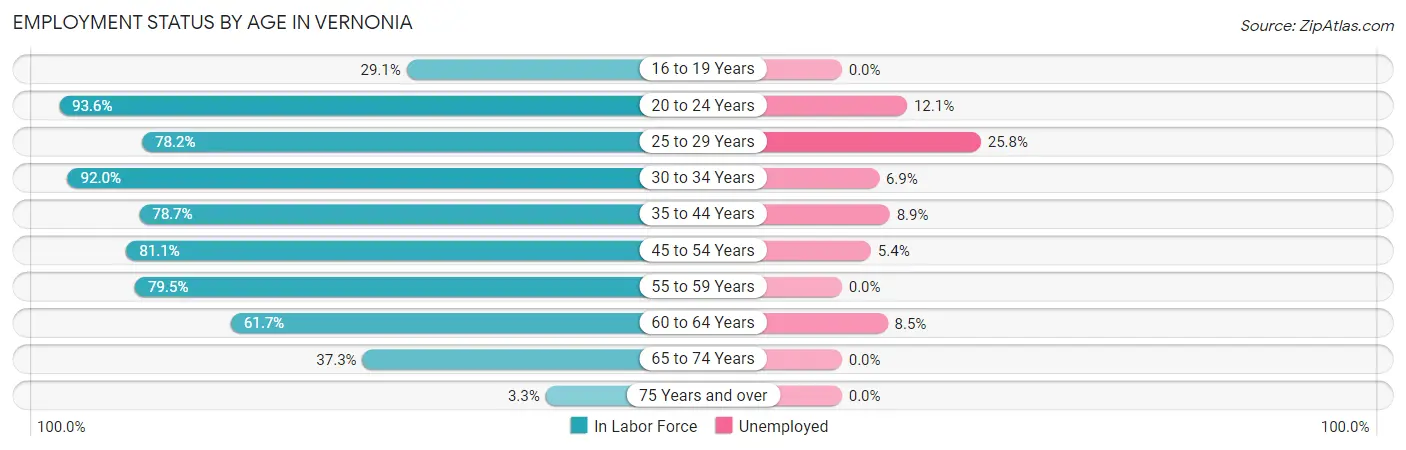
| Age Bracket | In Labor Force | Unemployed |
| 16 to 19 Years | 23 (29.1%) | 0 (0.0%) |
| 20 to 24 Years | 132 (93.6%) | 16 (12.1%) |
| 25 to 29 Years | 97 (78.2%) | 25 (25.8%) |
| 30 to 34 Years | 173 (92.0%) | 12 (6.9%) |
| 35 to 44 Years | 248 (78.7%) | 22 (8.9%) |
| 45 to 54 Years | 334 (81.1%) | 18 (5.4%) |
| 55 to 59 Years | 124 (79.5%) | 0 (0.0%) |
| 60 to 64 Years | 82 (61.7%) | 7 (8.5%) |
| 65 to 74 Years | 75 (37.3%) | 0 (0.0%) |
| 75 Years and over | 3 (3.3%) | 0 (0.0%) |
| Total | 1,292 (70.2%) | 99 (7.7%) |
Employment Status by Educational Attainment in Vernonia
According to labor force statistics for Vernonia, 79.7% of individuals (1,058) out of the total population between 25 and 64 years of age (1,328) are in the labor force, with 7.9% or 84 of them being unemployed. The group with the highest labor force participation rate are those with the educational attainment of bachelor's degree or higher, with 94.6% or 158 individuals in the labor force. Within the labor force, individuals with less than high school education have the highest percentage of unemployment, with 19.3% or 16 of them being unemployed.
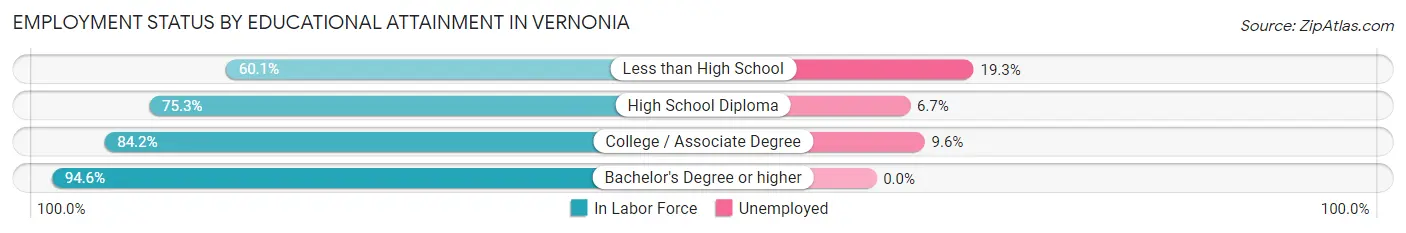
| Educational Attainment | In Labor Force | Unemployed |
| Less than High School | 83 (60.1%) | 27 (19.3%) |
| High School Diploma | 371 (75.3%) | 33 (6.7%) |
| College / Associate Degree | 446 (84.2%) | 51 (9.6%) |
| Bachelor's Degree or higher | 158 (94.6%) | 0 (0.0%) |
| Total | 1,058 (79.7%) | 105 (7.9%) |
Employment Occupations by Sex in Vernonia
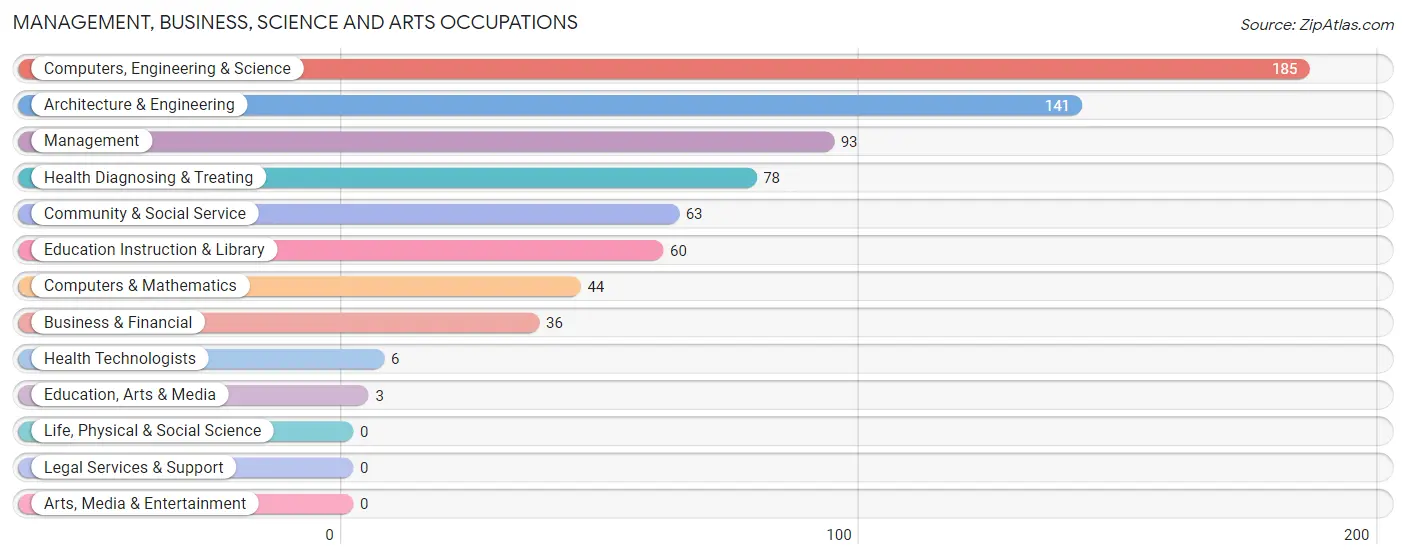
Management, Business, Science and Arts Occupations
The most common Management, Business, Science and Arts occupations in Vernonia are Computers, Engineering & Science (185 | 15.5%), Architecture & Engineering (141 | 11.8%), Management (93 | 7.8%), Health Diagnosing & Treating (78 | 6.6%), and Community & Social Service (63 | 5.3%).
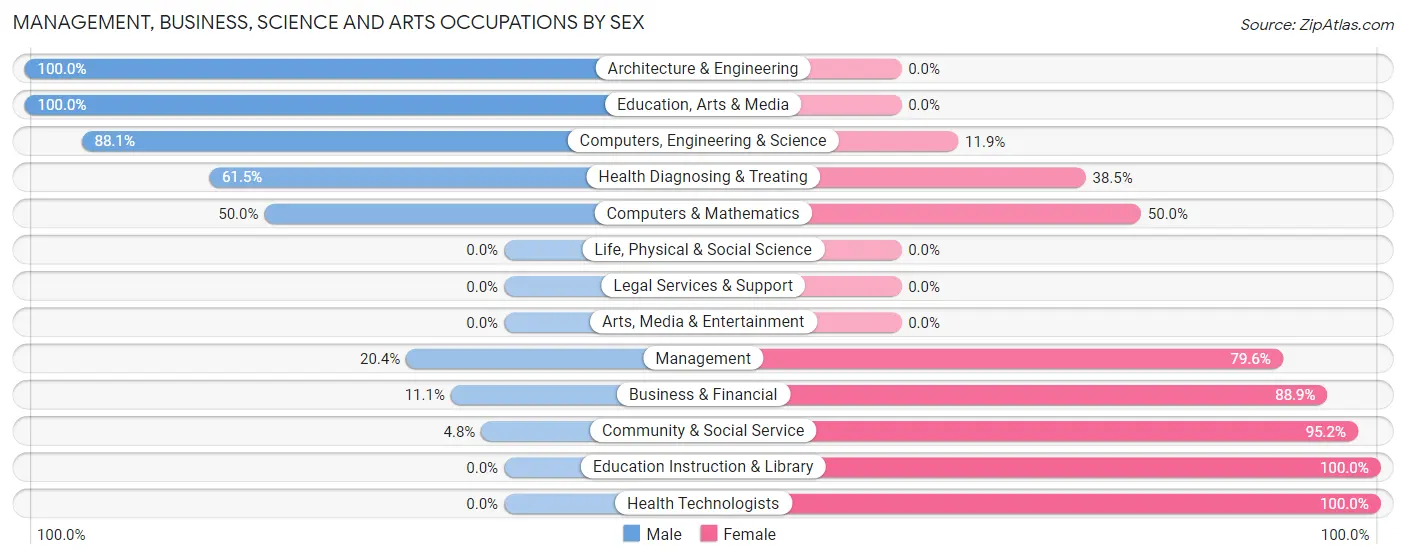
Management, Business, Science and Arts Occupations by Sex
Within the Management, Business, Science and Arts occupations in Vernonia, the most male-oriented occupations are Architecture & Engineering (100.0%), Education, Arts & Media (100.0%), and Computers, Engineering & Science (88.1%), while the most female-oriented occupations are Education Instruction & Library (100.0%), Health Technologists (100.0%), and Community & Social Service (95.2%).
| Occupation | Male | Female |
| Management | 19 (20.4%) | 74 (79.6%) |
| Business & Financial | 4 (11.1%) | 32 (88.9%) |
| Computers, Engineering & Science | 163 (88.1%) | 22 (11.9%) |
| Computers & Mathematics | 22 (50.0%) | 22 (50.0%) |
| Architecture & Engineering | 141 (100.0%) | 0 (0.0%) |
| Life, Physical & Social Science | 0 (0.0%) | 0 (0.0%) |
| Community & Social Service | 3 (4.8%) | 60 (95.2%) |
| Education, Arts & Media | 3 (100.0%) | 0 (0.0%) |
| Legal Services & Support | 0 (0.0%) | 0 (0.0%) |
| Education Instruction & Library | 0 (0.0%) | 60 (100.0%) |
| Arts, Media & Entertainment | 0 (0.0%) | 0 (0.0%) |
| Health Diagnosing & Treating | 48 (61.5%) | 30 (38.5%) |
| Health Technologists | 0 (0.0%) | 6 (100.0%) |
| Total (Category) | 237 (52.1%) | 218 (47.9%) |
| Total (Overall) | 698 (58.6%) | 493 (41.4%) |
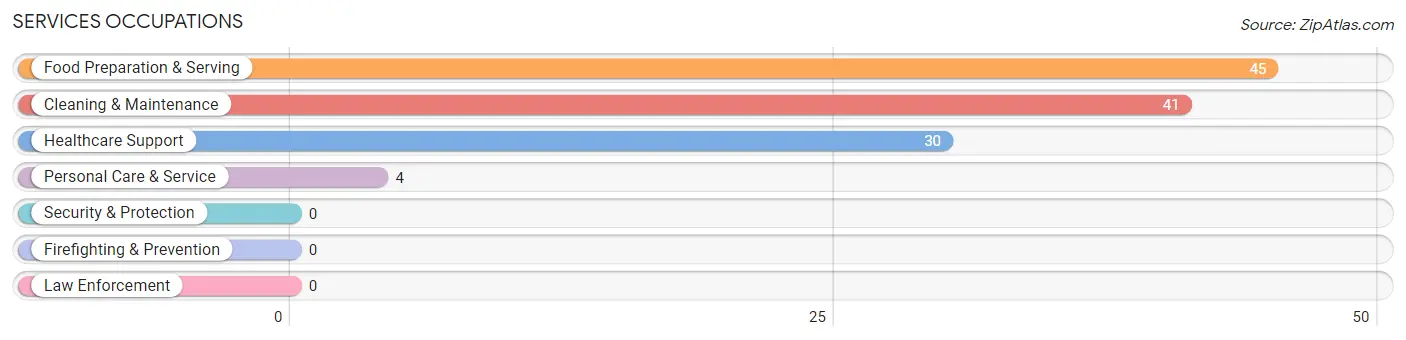
Services Occupations
The most common Services occupations in Vernonia are Food Preparation & Serving (45 | 3.8%), Cleaning & Maintenance (41 | 3.4%), Healthcare Support (30 | 2.5%), and Personal Care & Service (4 | 0.3%).
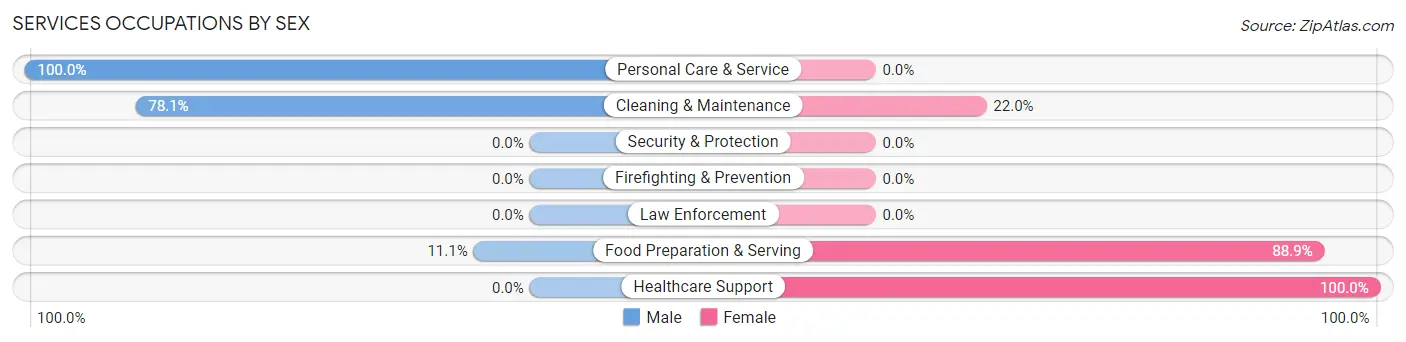
Services Occupations by Sex
Within the Services occupations in Vernonia, the most male-oriented occupations are Personal Care & Service (100.0%), Cleaning & Maintenance (78.0%), and Food Preparation & Serving (11.1%), while the most female-oriented occupations are Healthcare Support (100.0%), Food Preparation & Serving (88.9%), and Cleaning & Maintenance (22.0%).
| Occupation | Male | Female |
| Healthcare Support | 0 (0.0%) | 30 (100.0%) |
| Security & Protection | 0 (0.0%) | 0 (0.0%) |
| Firefighting & Prevention | 0 (0.0%) | 0 (0.0%) |
| Law Enforcement | 0 (0.0%) | 0 (0.0%) |
| Food Preparation & Serving | 5 (11.1%) | 40 (88.9%) |
| Cleaning & Maintenance | 32 (78.0%) | 9 (22.0%) |
| Personal Care & Service | 4 (100.0%) | 0 (0.0%) |
| Total (Category) | 41 (34.2%) | 79 (65.8%) |
| Total (Overall) | 698 (58.6%) | 493 (41.4%) |
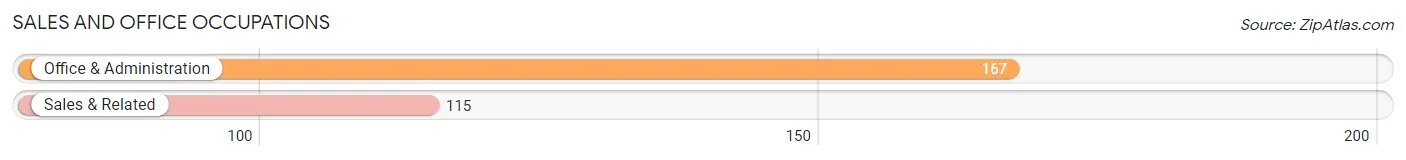
Sales and Office Occupations
The most common Sales and Office occupations in Vernonia are Office & Administration (167 | 14.0%), and Sales & Related (115 | 9.7%).
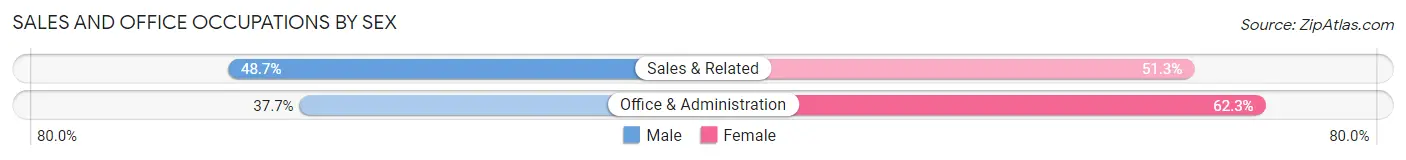
Sales and Office Occupations by Sex
| Occupation | Male | Female |
| Sales & Related | 56 (48.7%) | 59 (51.3%) |
| Office & Administration | 63 (37.7%) | 104 (62.3%) |
| Total (Category) | 119 (42.2%) | 163 (57.8%) |
| Total (Overall) | 698 (58.6%) | 493 (41.4%) |
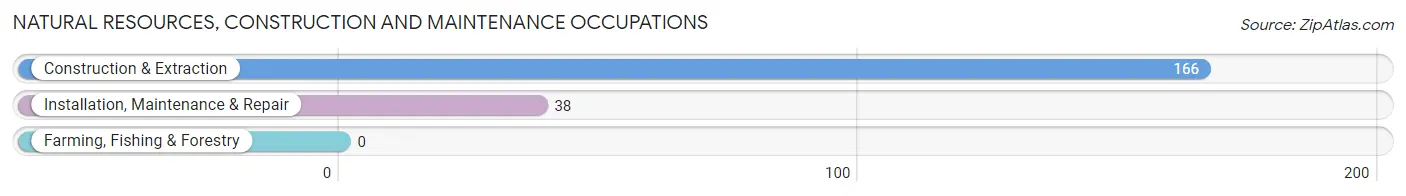
Natural Resources, Construction and Maintenance Occupations
The most common Natural Resources, Construction and Maintenance occupations in Vernonia are Construction & Extraction (166 | 13.9%), and Installation, Maintenance & Repair (38 | 3.2%).
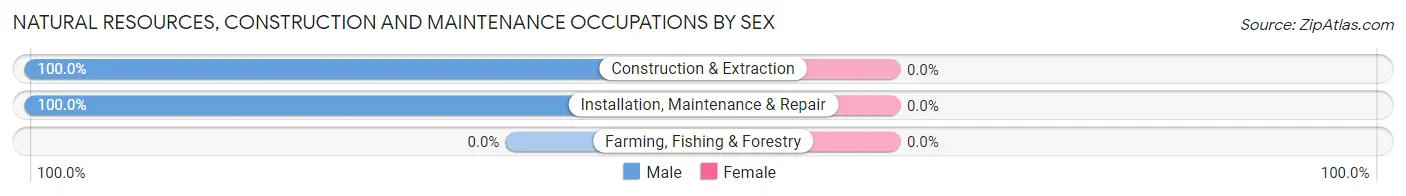
Natural Resources, Construction and Maintenance Occupations by Sex
| Occupation | Male | Female |
| Farming, Fishing & Forestry | 0 (0.0%) | 0 (0.0%) |
| Construction & Extraction | 166 (100.0%) | 0 (0.0%) |
| Installation, Maintenance & Repair | 38 (100.0%) | 0 (0.0%) |
| Total (Category) | 204 (100.0%) | 0 (0.0%) |
| Total (Overall) | 698 (58.6%) | 493 (41.4%) |
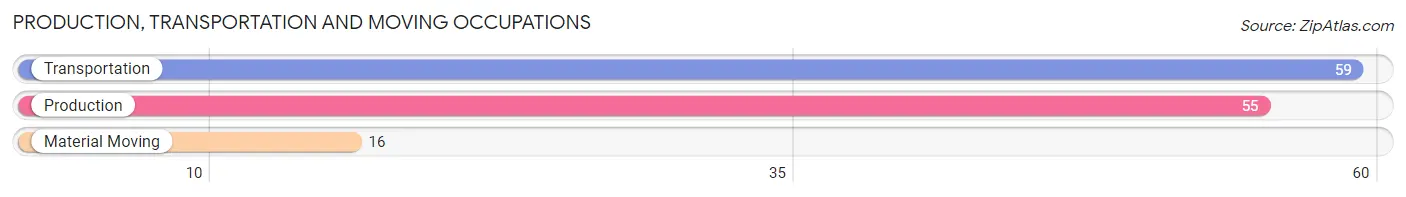
Production, Transportation and Moving Occupations
The most common Production, Transportation and Moving occupations in Vernonia are Transportation (59 | 5.0%), Production (55 | 4.6%), and Material Moving (16 | 1.3%).
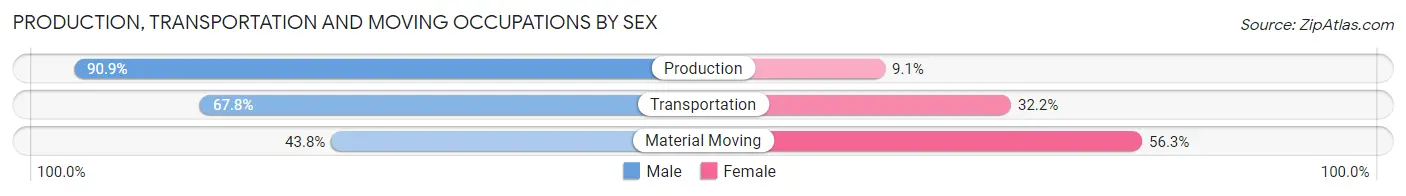
Production, Transportation and Moving Occupations by Sex
| Occupation | Male | Female |
| Production | 50 (90.9%) | 5 (9.1%) |
| Transportation | 40 (67.8%) | 19 (32.2%) |
| Material Moving | 7 (43.8%) | 9 (56.2%) |
| Total (Category) | 97 (74.6%) | 33 (25.4%) |
| Total (Overall) | 698 (58.6%) | 493 (41.4%) |
Employment Industries by Sex in Vernonia
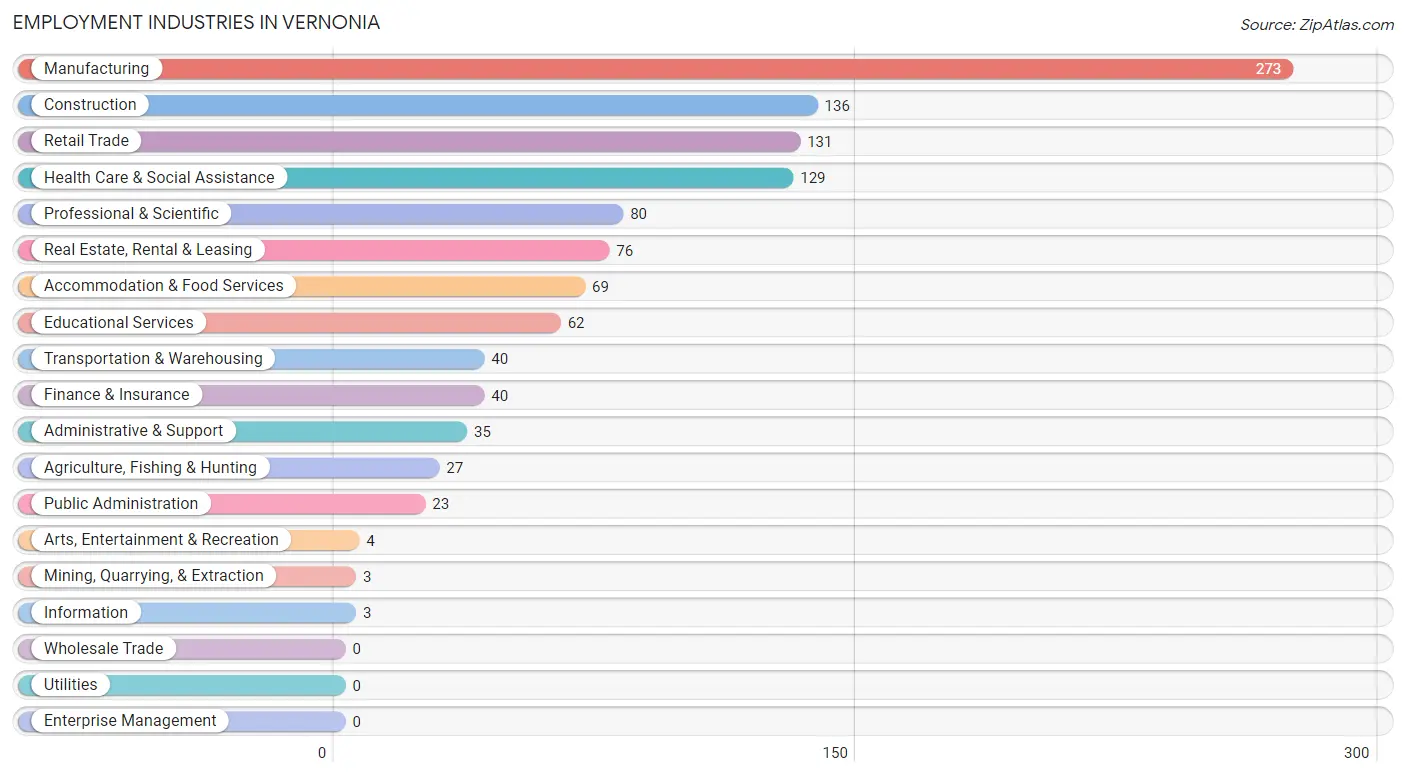
Employment Industries in Vernonia
The major employment industries in Vernonia include Manufacturing (273 | 22.9%), Construction (136 | 11.4%), Retail Trade (131 | 11.0%), Health Care & Social Assistance (129 | 10.8%), and Professional & Scientific (80 | 6.7%).
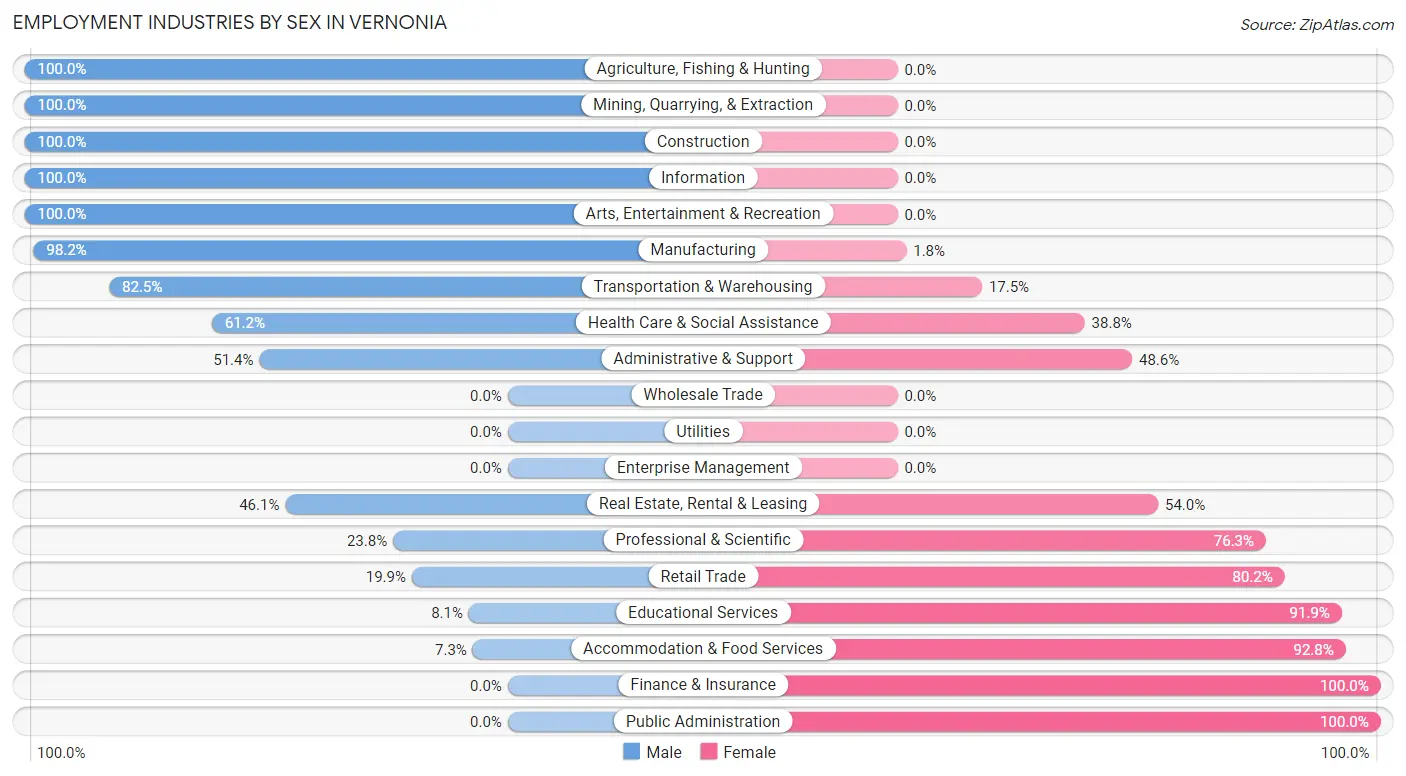
Employment Industries by Sex in Vernonia
The Vernonia industries that see more men than women are Agriculture, Fishing & Hunting (100.0%), Mining, Quarrying, & Extraction (100.0%), and Construction (100.0%), whereas the industries that tend to have a higher number of women are Finance & Insurance (100.0%), Public Administration (100.0%), and Accommodation & Food Services (92.7%).
| Industry | Male | Female |
| Agriculture, Fishing & Hunting | 27 (100.0%) | 0 (0.0%) |
| Mining, Quarrying, & Extraction | 3 (100.0%) | 0 (0.0%) |
| Construction | 136 (100.0%) | 0 (0.0%) |
| Manufacturing | 268 (98.2%) | 5 (1.8%) |
| Wholesale Trade | 0 (0.0%) | 0 (0.0%) |
| Retail Trade | 26 (19.9%) | 105 (80.1%) |
| Transportation & Warehousing | 33 (82.5%) | 7 (17.5%) |
| Utilities | 0 (0.0%) | 0 (0.0%) |
| Information | 3 (100.0%) | 0 (0.0%) |
| Finance & Insurance | 0 (0.0%) | 40 (100.0%) |
| Real Estate, Rental & Leasing | 35 (46.1%) | 41 (53.9%) |
| Professional & Scientific | 19 (23.7%) | 61 (76.2%) |
| Enterprise Management | 0 (0.0%) | 0 (0.0%) |
| Administrative & Support | 18 (51.4%) | 17 (48.6%) |
| Educational Services | 5 (8.1%) | 57 (91.9%) |
| Health Care & Social Assistance | 79 (61.2%) | 50 (38.8%) |
| Arts, Entertainment & Recreation | 4 (100.0%) | 0 (0.0%) |
| Accommodation & Food Services | 5 (7.2%) | 64 (92.7%) |
| Public Administration | 0 (0.0%) | 23 (100.0%) |
| Total | 698 (58.6%) | 493 (41.4%) |
Education in Vernonia
School Enrollment in Vernonia
The most common levels of schooling among the 561 students in Vernonia are middle school (143 | 25.5%), high school (142 | 25.3%), and elementary school (114 | 20.3%).
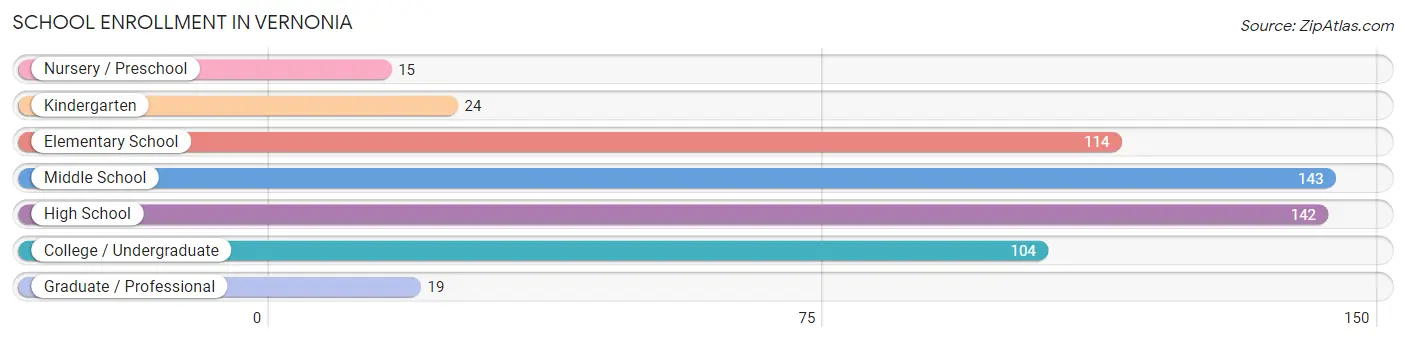
| School Level | # Students | % Students |
| Nursery / Preschool | 15 | 2.7% |
| Kindergarten | 24 | 4.3% |
| Elementary School | 114 | 20.3% |
| Middle School | 143 | 25.5% |
| High School | 142 | 25.3% |
| College / Undergraduate | 104 | 18.5% |
| Graduate / Professional | 19 | 3.4% |
| Total | 561 | 100.0% |
School Enrollment by Age by Funding Source in Vernonia
Out of a total of 561 students who are enrolled in schools in Vernonia, 19 (3.4%) attend a private institution, while the remaining 542 (96.6%) are enrolled in public schools. The age group of 25 to 34 year olds has the highest likelihood of being enrolled in private schools, with 9 (16.7% in the age bracket) enrolled. Conversely, the age group of 3 to 4 year olds has the lowest likelihood of being enrolled in a private school, with 2 (100.0% in the age bracket) attending a public institution.
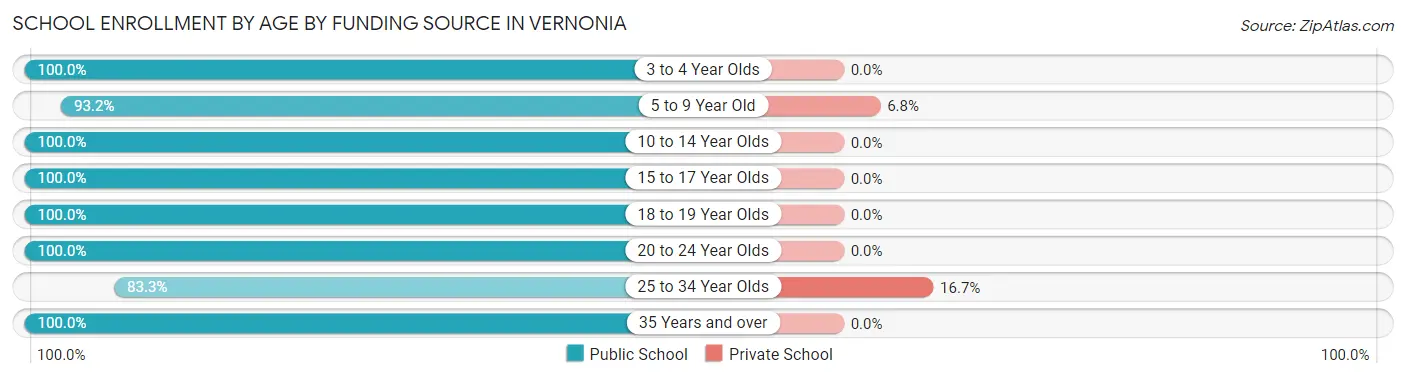
| Age Bracket | Public School | Private School |
| 3 to 4 Year Olds | 2 (100.0%) | 0 (0.0%) |
| 5 to 9 Year Old | 137 (93.2%) | 10 (6.8%) |
| 10 to 14 Year Olds | 179 (100.0%) | 0 (0.0%) |
| 15 to 17 Year Olds | 101 (100.0%) | 0 (0.0%) |
| 18 to 19 Year Olds | 13 (100.0%) | 0 (0.0%) |
| 20 to 24 Year Olds | 35 (100.0%) | 0 (0.0%) |
| 25 to 34 Year Olds | 45 (83.3%) | 9 (16.7%) |
| 35 Years and over | 30 (100.0%) | 0 (0.0%) |
| Total | 542 (96.6%) | 19 (3.4%) |
Educational Attainment by Field of Study in Vernonia
Engineering (36 | 16.1%), education (35 | 15.6%), arts & humanities (35 | 15.6%), liberal arts & history (28 | 12.5%), and computers & mathematics (22 | 9.8%) are the most common fields of study among 224 individuals in Vernonia who have obtained a bachelor's degree or higher.
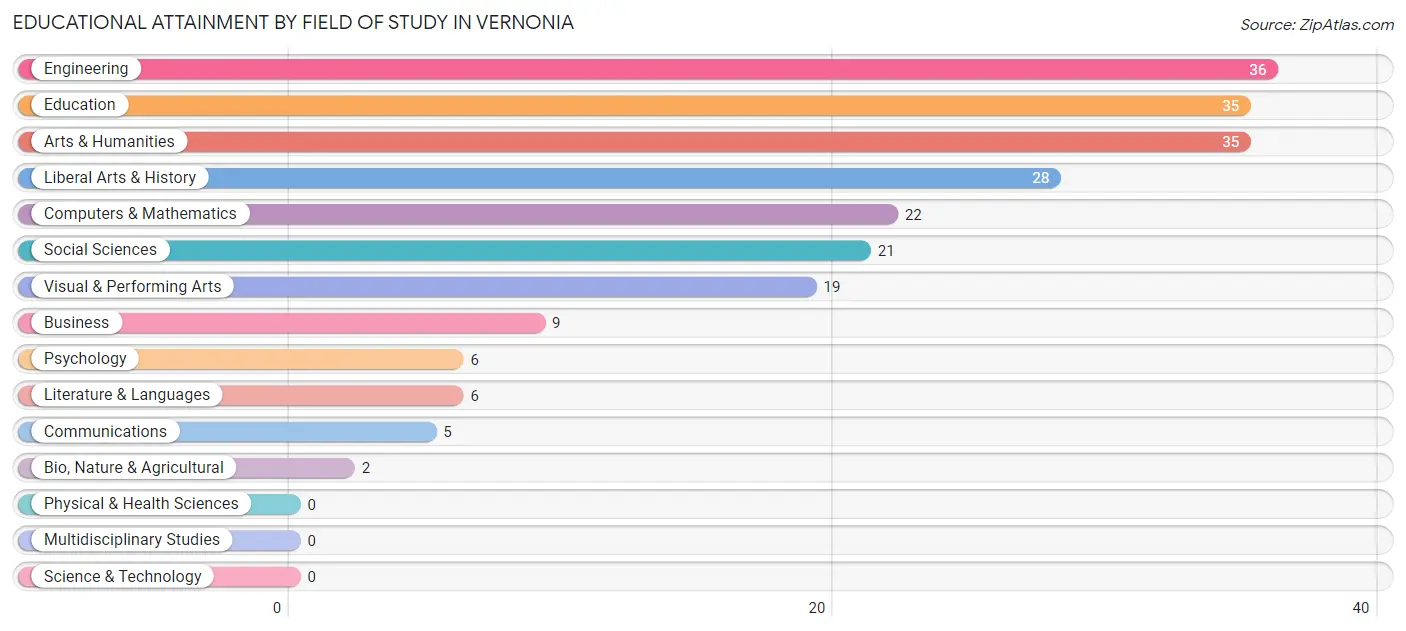
| Field of Study | # Graduates | % Graduates |
| Computers & Mathematics | 22 | 9.8% |
| Bio, Nature & Agricultural | 2 | 0.9% |
| Physical & Health Sciences | 0 | 0.0% |
| Psychology | 6 | 2.7% |
| Social Sciences | 21 | 9.4% |
| Engineering | 36 | 16.1% |
| Multidisciplinary Studies | 0 | 0.0% |
| Science & Technology | 0 | 0.0% |
| Business | 9 | 4.0% |
| Education | 35 | 15.6% |
| Literature & Languages | 6 | 2.7% |
| Liberal Arts & History | 28 | 12.5% |
| Visual & Performing Arts | 19 | 8.5% |
| Communications | 5 | 2.2% |
| Arts & Humanities | 35 | 15.6% |
| Total | 224 | 100.0% |
Transportation & Commute in Vernonia
Vehicle Availability by Sex in Vernonia
The most prevalent vehicle ownership categories in Vernonia are males with 4 vehicles (225, accounting for 34.6%) and females with 4 vehicles (123, making up 45.7%).
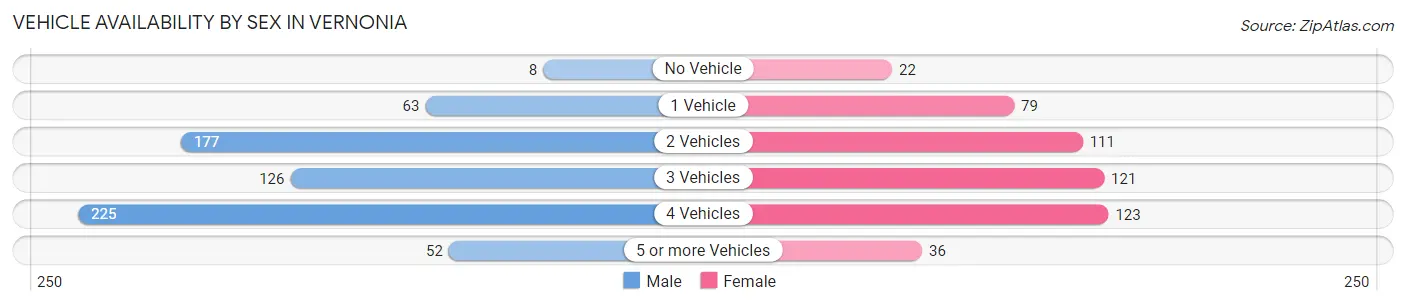
| Vehicles Available | Male | Female |
| No Vehicle | 8 (1.2%) | 22 (4.5%) |
| 1 Vehicle | 63 (9.7%) | 79 (16.1%) |
| 2 Vehicles | 177 (27.2%) | 111 (22.6%) |
| 3 Vehicles | 126 (19.4%) | 121 (24.6%) |
| 4 Vehicles | 225 (34.6%) | 123 (25.0%) |
| 5 or more Vehicles | 52 (8.0%) | 36 (7.3%) |
| Total | 651 (100.0%) | 492 (100.0%) |
Commute Time in Vernonia
The most frequently occuring commute durations in Vernonia are 45 to 59 minutes (315 commuters, 30.7%), 60 to 89 minutes (284 commuters, 27.7%), and 5 to 9 minutes (138 commuters, 13.4%).
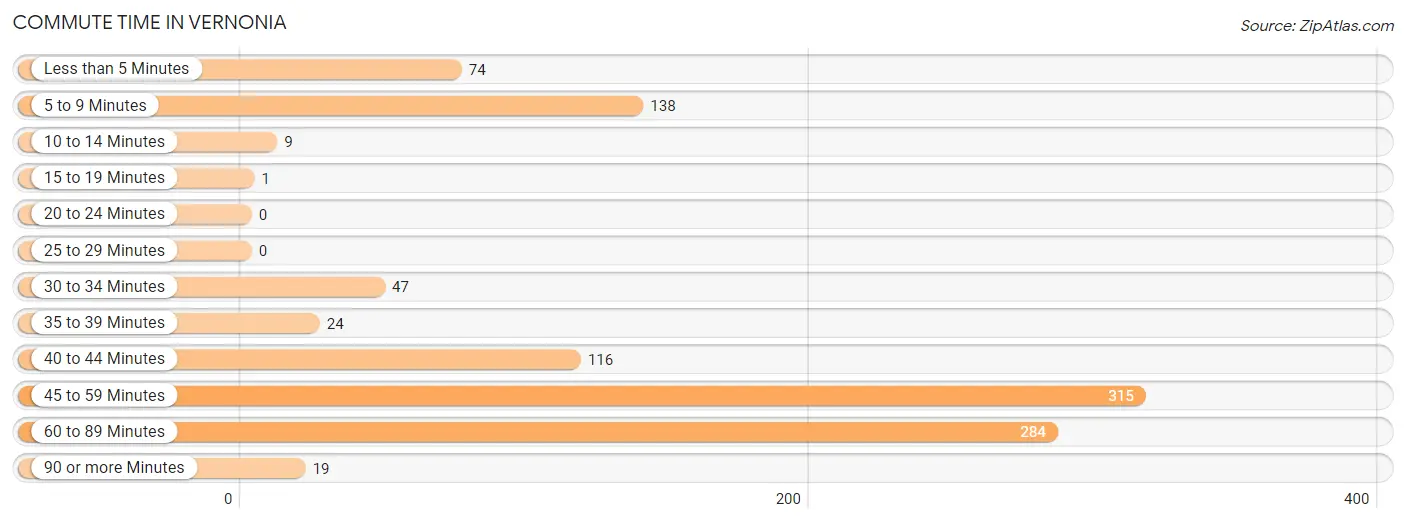
| Commute Time | # Commuters | % Commuters |
| Less than 5 Minutes | 74 | 7.2% |
| 5 to 9 Minutes | 138 | 13.4% |
| 10 to 14 Minutes | 9 | 0.9% |
| 15 to 19 Minutes | 1 | 0.1% |
| 20 to 24 Minutes | 0 | 0.0% |
| 25 to 29 Minutes | 0 | 0.0% |
| 30 to 34 Minutes | 47 | 4.6% |
| 35 to 39 Minutes | 24 | 2.3% |
| 40 to 44 Minutes | 116 | 11.3% |
| 45 to 59 Minutes | 315 | 30.7% |
| 60 to 89 Minutes | 284 | 27.7% |
| 90 or more Minutes | 19 | 1.8% |
Commute Time by Sex in Vernonia
The most common commute times in Vernonia are 60 to 89 minutes (206 commuters, 33.4%) for males and 5 to 9 minutes (125 commuters, 30.4%) for females.
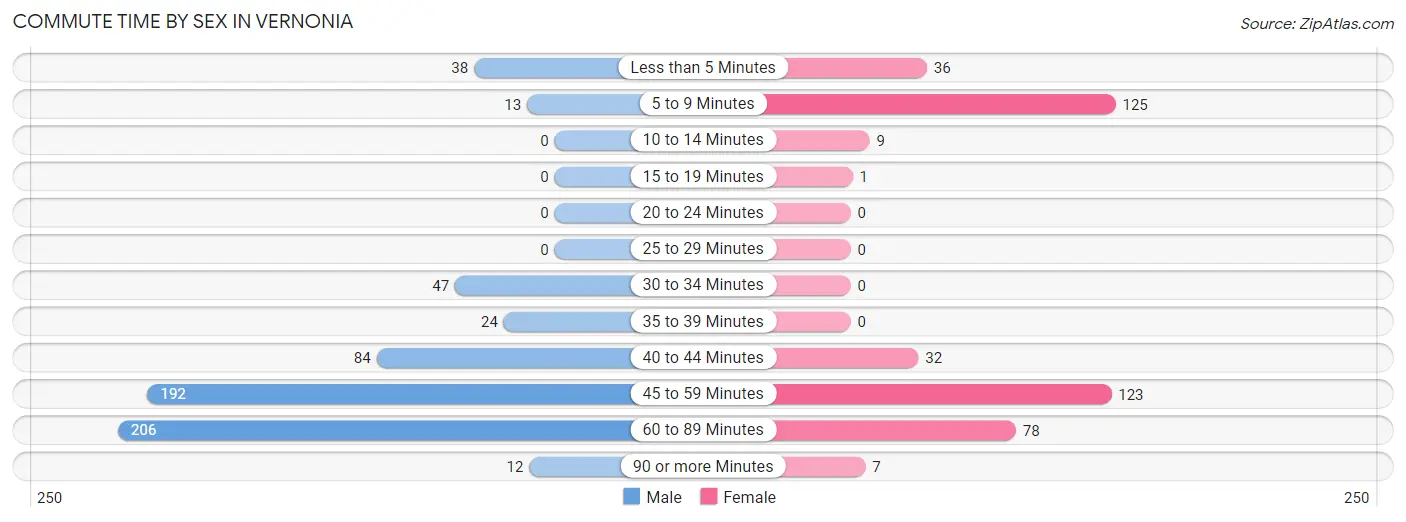
| Commute Time | Male | Female |
| Less than 5 Minutes | 38 (6.2%) | 36 (8.8%) |
| 5 to 9 Minutes | 13 (2.1%) | 125 (30.4%) |
| 10 to 14 Minutes | 0 (0.0%) | 9 (2.2%) |
| 15 to 19 Minutes | 0 (0.0%) | 1 (0.2%) |
| 20 to 24 Minutes | 0 (0.0%) | 0 (0.0%) |
| 25 to 29 Minutes | 0 (0.0%) | 0 (0.0%) |
| 30 to 34 Minutes | 47 (7.6%) | 0 (0.0%) |
| 35 to 39 Minutes | 24 (3.9%) | 0 (0.0%) |
| 40 to 44 Minutes | 84 (13.6%) | 32 (7.8%) |
| 45 to 59 Minutes | 192 (31.2%) | 123 (29.9%) |
| 60 to 89 Minutes | 206 (33.4%) | 78 (19.0%) |
| 90 or more Minutes | 12 (1.9%) | 7 (1.7%) |
Time of Departure to Work by Sex in Vernonia
The most frequent times of departure to work in Vernonia are 12:00 AM to 4:59 AM (155, 25.2%) for males and 7:00 AM to 7:29 AM (79, 19.2%) for females.
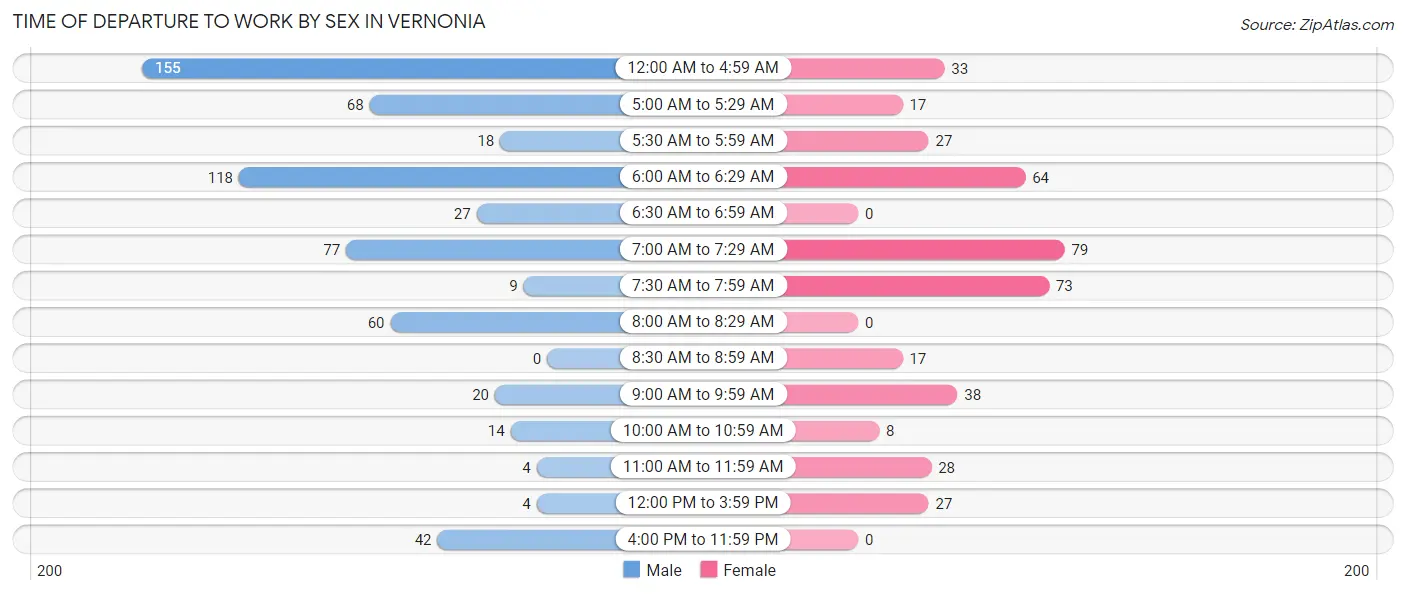
| Time of Departure | Male | Female |
| 12:00 AM to 4:59 AM | 155 (25.2%) | 33 (8.0%) |
| 5:00 AM to 5:29 AM | 68 (11.0%) | 17 (4.1%) |
| 5:30 AM to 5:59 AM | 18 (2.9%) | 27 (6.6%) |
| 6:00 AM to 6:29 AM | 118 (19.2%) | 64 (15.6%) |
| 6:30 AM to 6:59 AM | 27 (4.4%) | 0 (0.0%) |
| 7:00 AM to 7:29 AM | 77 (12.5%) | 79 (19.2%) |
| 7:30 AM to 7:59 AM | 9 (1.5%) | 73 (17.8%) |
| 8:00 AM to 8:29 AM | 60 (9.7%) | 0 (0.0%) |
| 8:30 AM to 8:59 AM | 0 (0.0%) | 17 (4.1%) |
| 9:00 AM to 9:59 AM | 20 (3.3%) | 38 (9.2%) |
| 10:00 AM to 10:59 AM | 14 (2.3%) | 8 (1.9%) |
| 11:00 AM to 11:59 AM | 4 (0.6%) | 28 (6.8%) |
| 12:00 PM to 3:59 PM | 4 (0.6%) | 27 (6.6%) |
| 4:00 PM to 11:59 PM | 42 (6.8%) | 0 (0.0%) |
| Total | 616 (100.0%) | 411 (100.0%) |
Housing Occupancy in Vernonia
Occupancy by Ownership in Vernonia
Of the total 895 dwellings in Vernonia, owner-occupied units account for 695 (77.6%), while renter-occupied units make up 200 (22.4%).
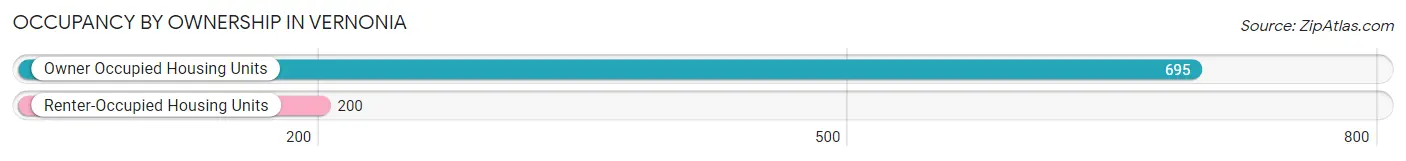
| Occupancy | # Housing Units | % Housing Units |
| Owner Occupied Housing Units | 695 | 77.6% |
| Renter-Occupied Housing Units | 200 | 22.4% |
| Total Occupied Housing Units | 895 | 100.0% |
Occupancy by Household Size in Vernonia
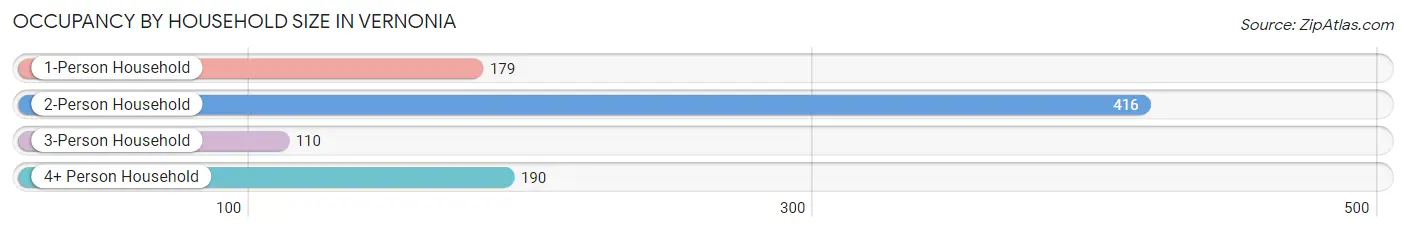
| Household Size | # Housing Units | % Housing Units |
| 1-Person Household | 179 | 20.0% |
| 2-Person Household | 416 | 46.5% |
| 3-Person Household | 110 | 12.3% |
| 4+ Person Household | 190 | 21.2% |
| Total Housing Units | 895 | 100.0% |
Occupancy by Ownership by Household Size in Vernonia
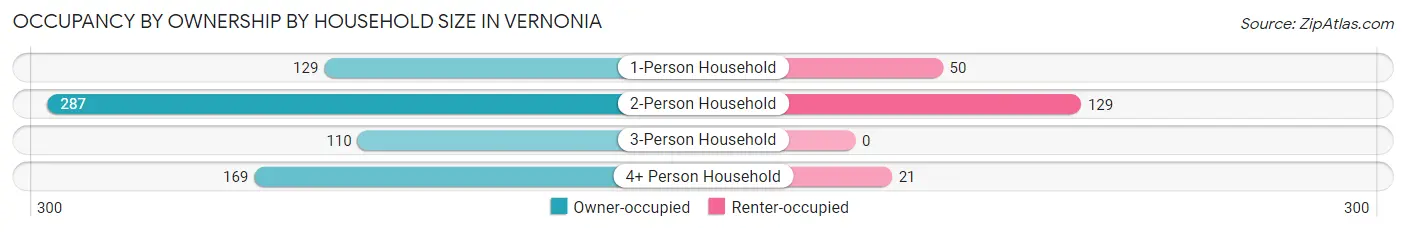
| Household Size | Owner-occupied | Renter-occupied |
| 1-Person Household | 129 (72.1%) | 50 (27.9%) |
| 2-Person Household | 287 (69.0%) | 129 (31.0%) |
| 3-Person Household | 110 (100.0%) | 0 (0.0%) |
| 4+ Person Household | 169 (88.9%) | 21 (11.1%) |
| Total Housing Units | 695 (77.6%) | 200 (22.4%) |
Occupancy by Educational Attainment in Vernonia
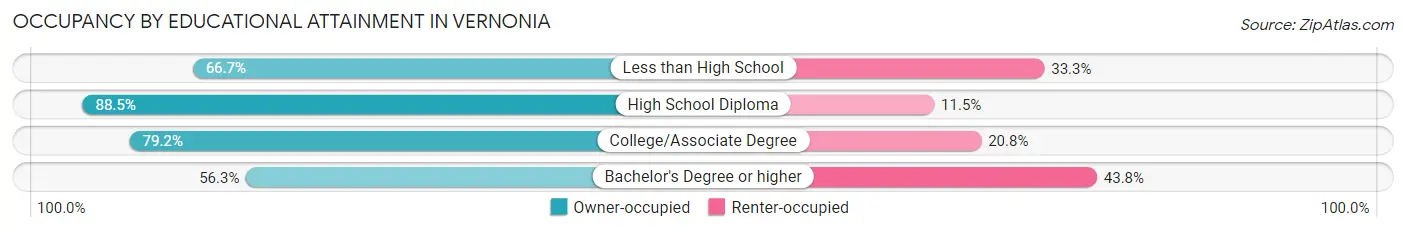
| Household Size | Owner-occupied | Renter-occupied |
| Less than High School | 52 (66.7%) | 26 (33.3%) |
| High School Diploma | 277 (88.5%) | 36 (11.5%) |
| College/Associate Degree | 285 (79.2%) | 75 (20.8%) |
| Bachelor's Degree or higher | 81 (56.2%) | 63 (43.8%) |
Occupancy by Age of Householder in Vernonia
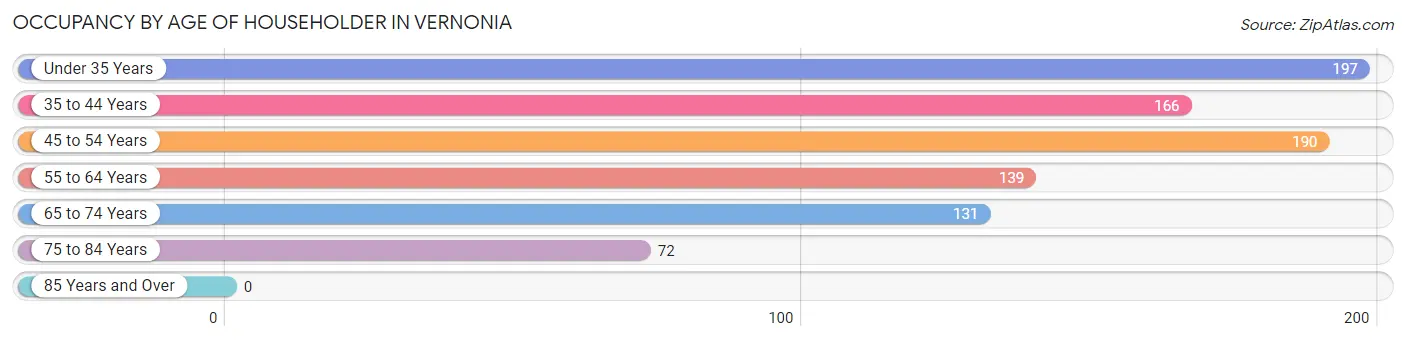
| Age Bracket | # Households | % Households |
| Under 35 Years | 197 | 22.0% |
| 35 to 44 Years | 166 | 18.5% |
| 45 to 54 Years | 190 | 21.2% |
| 55 to 64 Years | 139 | 15.5% |
| 65 to 74 Years | 131 | 14.6% |
| 75 to 84 Years | 72 | 8.0% |
| 85 Years and Over | 0 | 0.0% |
| Total | 895 | 100.0% |
Housing Finances in Vernonia
Median Income by Occupancy in Vernonia
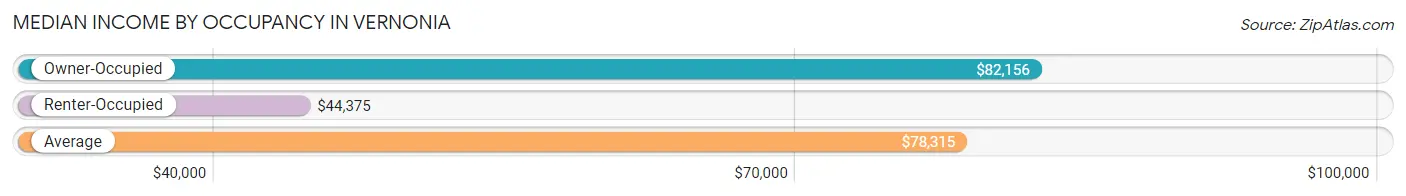
| Occupancy Type | # Households | Median Income |
| Owner-Occupied | 695 (77.6%) | $82,156 |
| Renter-Occupied | 200 (22.4%) | $44,375 |
| Average | 895 (100.0%) | $78,315 |
Occupancy by Householder Income Bracket in Vernonia
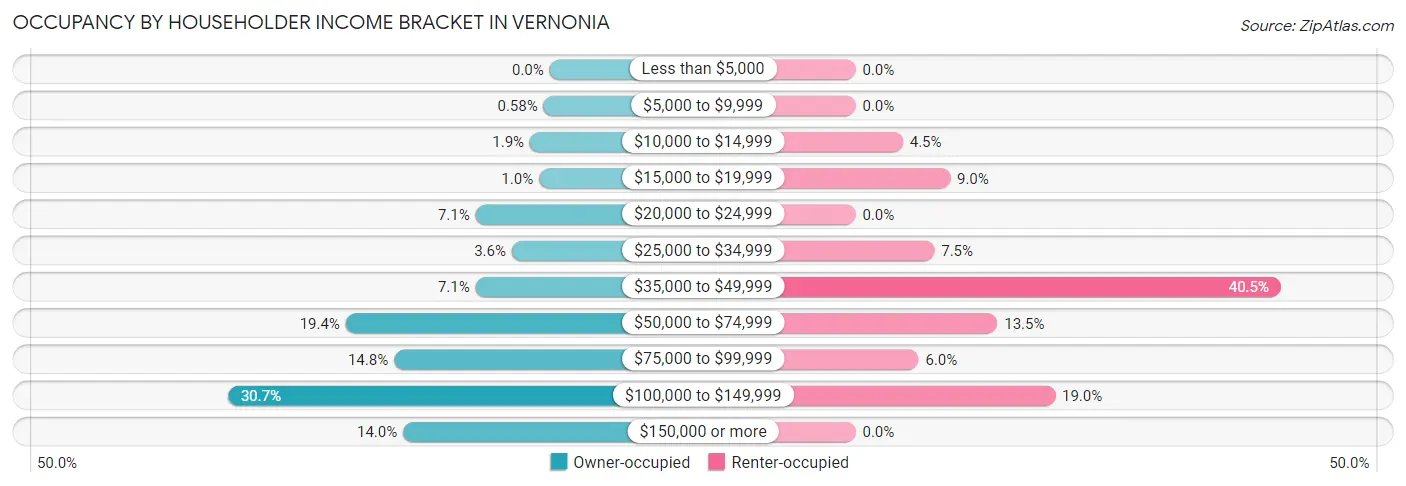
| Income Bracket | Owner-occupied | Renter-occupied |
| Less than $5,000 | 0 (0.0%) | 0 (0.0%) |
| $5,000 to $9,999 | 4 (0.6%) | 0 (0.0%) |
| $10,000 to $14,999 | 13 (1.9%) | 9 (4.5%) |
| $15,000 to $19,999 | 7 (1.0%) | 18 (9.0%) |
| $20,000 to $24,999 | 49 (7.0%) | 0 (0.0%) |
| $25,000 to $34,999 | 25 (3.6%) | 15 (7.5%) |
| $35,000 to $49,999 | 49 (7.0%) | 81 (40.5%) |
| $50,000 to $74,999 | 135 (19.4%) | 27 (13.5%) |
| $75,000 to $99,999 | 103 (14.8%) | 12 (6.0%) |
| $100,000 to $149,999 | 213 (30.6%) | 38 (19.0%) |
| $150,000 or more | 97 (14.0%) | 0 (0.0%) |
| Total | 695 (100.0%) | 200 (100.0%) |
Monthly Housing Cost Tiers in Vernonia
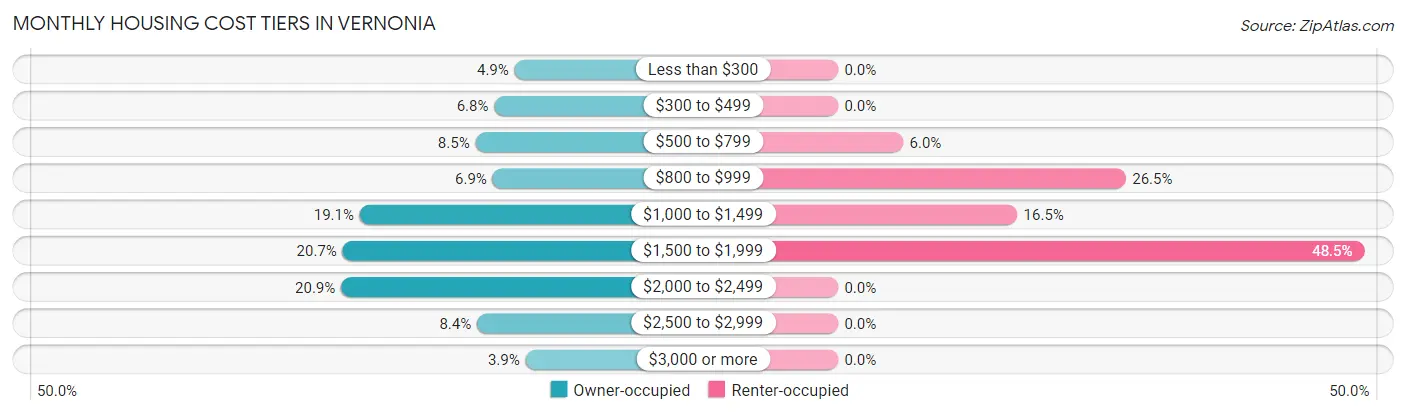
| Monthly Cost | Owner-occupied | Renter-occupied |
| Less than $300 | 34 (4.9%) | 0 (0.0%) |
| $300 to $499 | 47 (6.8%) | 0 (0.0%) |
| $500 to $799 | 59 (8.5%) | 12 (6.0%) |
| $800 to $999 | 48 (6.9%) | 53 (26.5%) |
| $1,000 to $1,499 | 133 (19.1%) | 33 (16.5%) |
| $1,500 to $1,999 | 144 (20.7%) | 97 (48.5%) |
| $2,000 to $2,499 | 145 (20.9%) | 0 (0.0%) |
| $2,500 to $2,999 | 58 (8.4%) | 0 (0.0%) |
| $3,000 or more | 27 (3.9%) | 0 (0.0%) |
| Total | 695 (100.0%) | 200 (100.0%) |
Physical Housing Characteristics in Vernonia
Housing Structures in Vernonia
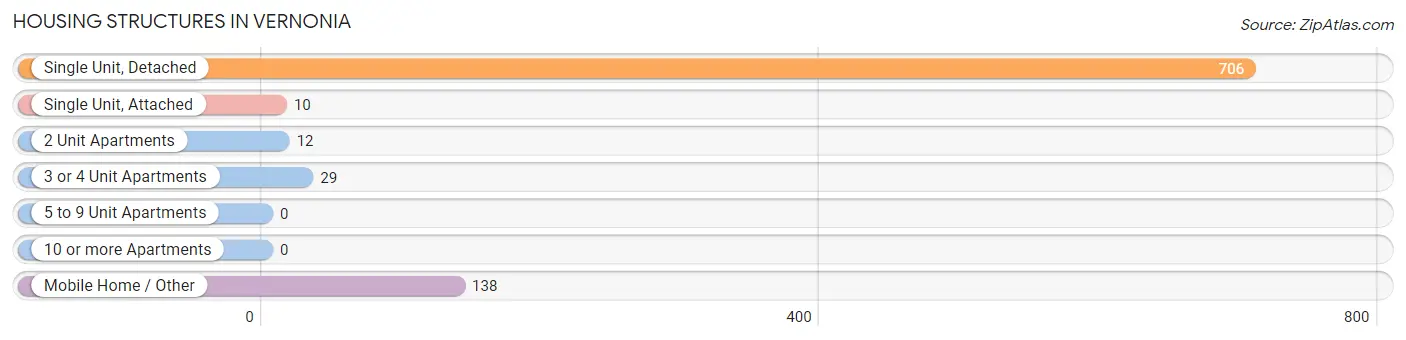
| Structure Type | # Housing Units | % Housing Units |
| Single Unit, Detached | 706 | 78.9% |
| Single Unit, Attached | 10 | 1.1% |
| 2 Unit Apartments | 12 | 1.3% |
| 3 or 4 Unit Apartments | 29 | 3.2% |
| 5 to 9 Unit Apartments | 0 | 0.0% |
| 10 or more Apartments | 0 | 0.0% |
| Mobile Home / Other | 138 | 15.4% |
| Total | 895 | 100.0% |
Housing Structures by Occupancy in Vernonia
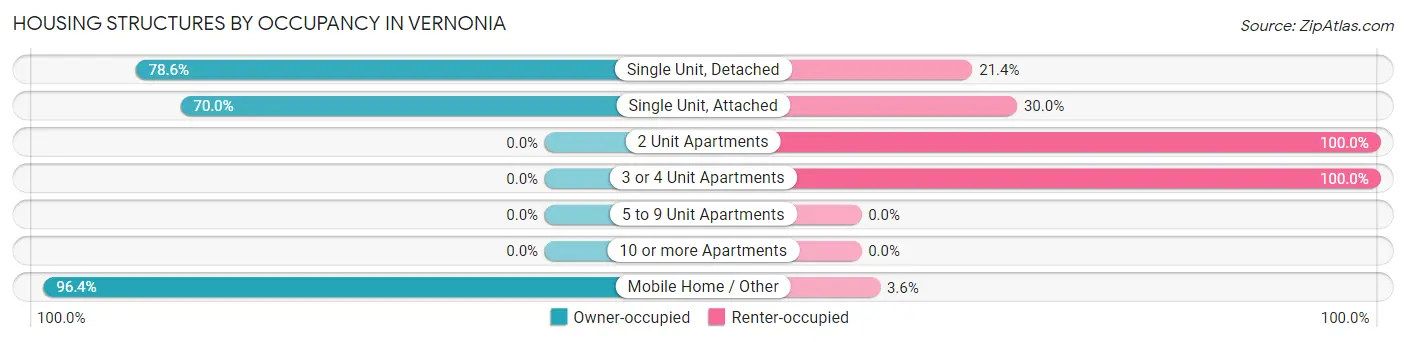
| Structure Type | Owner-occupied | Renter-occupied |
| Single Unit, Detached | 555 (78.6%) | 151 (21.4%) |
| Single Unit, Attached | 7 (70.0%) | 3 (30.0%) |
| 2 Unit Apartments | 0 (0.0%) | 12 (100.0%) |
| 3 or 4 Unit Apartments | 0 (0.0%) | 29 (100.0%) |
| 5 to 9 Unit Apartments | 0 (0.0%) | 0 (0.0%) |
| 10 or more Apartments | 0 (0.0%) | 0 (0.0%) |
| Mobile Home / Other | 133 (96.4%) | 5 (3.6%) |
| Total | 695 (77.6%) | 200 (22.4%) |
Housing Structures by Number of Rooms in Vernonia
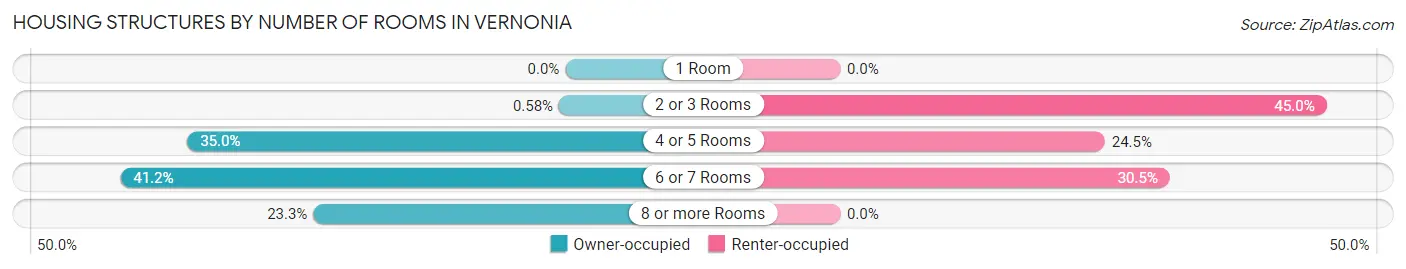
| Number of Rooms | Owner-occupied | Renter-occupied |
| 1 Room | 0 (0.0%) | 0 (0.0%) |
| 2 or 3 Rooms | 4 (0.6%) | 90 (45.0%) |
| 4 or 5 Rooms | 243 (35.0%) | 49 (24.5%) |
| 6 or 7 Rooms | 286 (41.1%) | 61 (30.5%) |
| 8 or more Rooms | 162 (23.3%) | 0 (0.0%) |
| Total | 695 (100.0%) | 200 (100.0%) |
Housing Structure by Heating Type in Vernonia
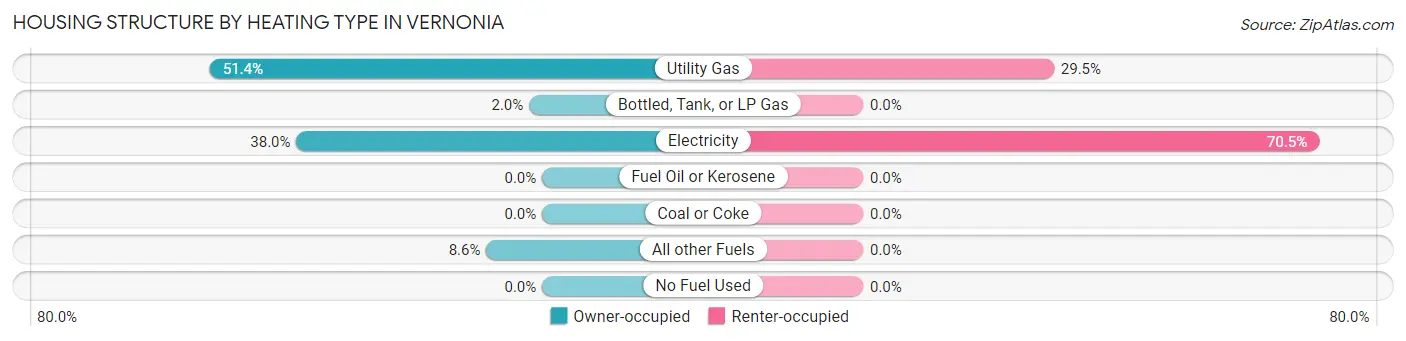
| Heating Type | Owner-occupied | Renter-occupied |
| Utility Gas | 357 (51.4%) | 59 (29.5%) |
| Bottled, Tank, or LP Gas | 14 (2.0%) | 0 (0.0%) |
| Electricity | 264 (38.0%) | 141 (70.5%) |
| Fuel Oil or Kerosene | 0 (0.0%) | 0 (0.0%) |
| Coal or Coke | 0 (0.0%) | 0 (0.0%) |
| All other Fuels | 60 (8.6%) | 0 (0.0%) |
| No Fuel Used | 0 (0.0%) | 0 (0.0%) |
| Total | 695 (100.0%) | 200 (100.0%) |
Household Vehicle Usage in Vernonia
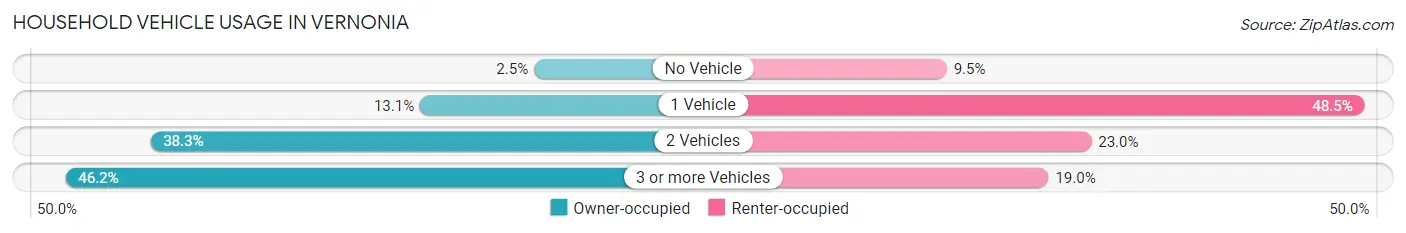
| Vehicles per Household | Owner-occupied | Renter-occupied |
| No Vehicle | 17 (2.5%) | 19 (9.5%) |
| 1 Vehicle | 91 (13.1%) | 97 (48.5%) |
| 2 Vehicles | 266 (38.3%) | 46 (23.0%) |
| 3 or more Vehicles | 321 (46.2%) | 38 (19.0%) |
| Total | 695 (100.0%) | 200 (100.0%) |
Real Estate & Mortgages in Vernonia
Real Estate and Mortgage Overview in Vernonia
| Characteristic | Without Mortgage | With Mortgage |
| Housing Units | 166 | 529 |
| Median Property Value | $230,200 | $309,000 |
| Median Household Income | $52,833 | $72 |
| Monthly Housing Costs | $506 | $27 |
| Real Estate Taxes | $2,306 | $0 |
Property Value by Mortgage Status in Vernonia
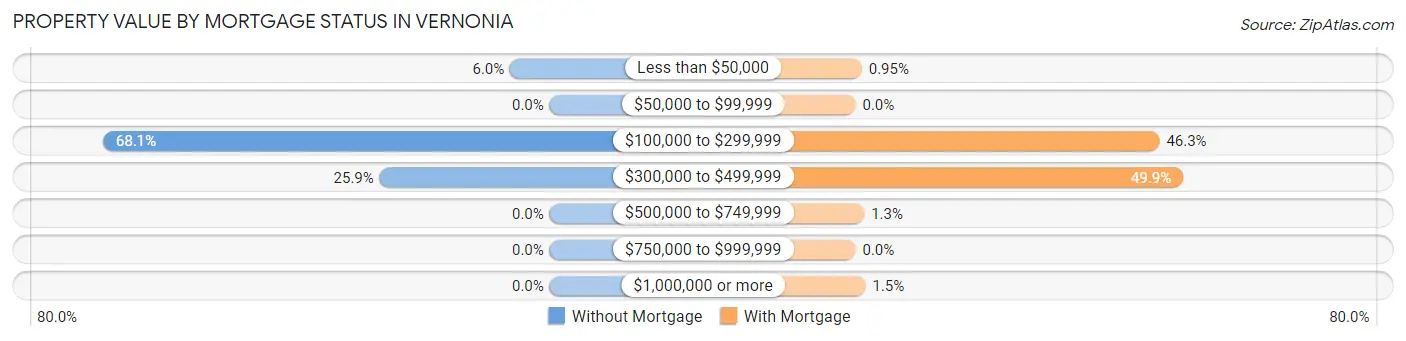
| Property Value | Without Mortgage | With Mortgage |
| Less than $50,000 | 10 (6.0%) | 5 (0.9%) |
| $50,000 to $99,999 | 0 (0.0%) | 0 (0.0%) |
| $100,000 to $299,999 | 113 (68.1%) | 245 (46.3%) |
| $300,000 to $499,999 | 43 (25.9%) | 264 (49.9%) |
| $500,000 to $749,999 | 0 (0.0%) | 7 (1.3%) |
| $750,000 to $999,999 | 0 (0.0%) | 0 (0.0%) |
| $1,000,000 or more | 0 (0.0%) | 8 (1.5%) |
| Total | 166 (100.0%) | 529 (100.0%) |
Household Income by Mortgage Status in Vernonia
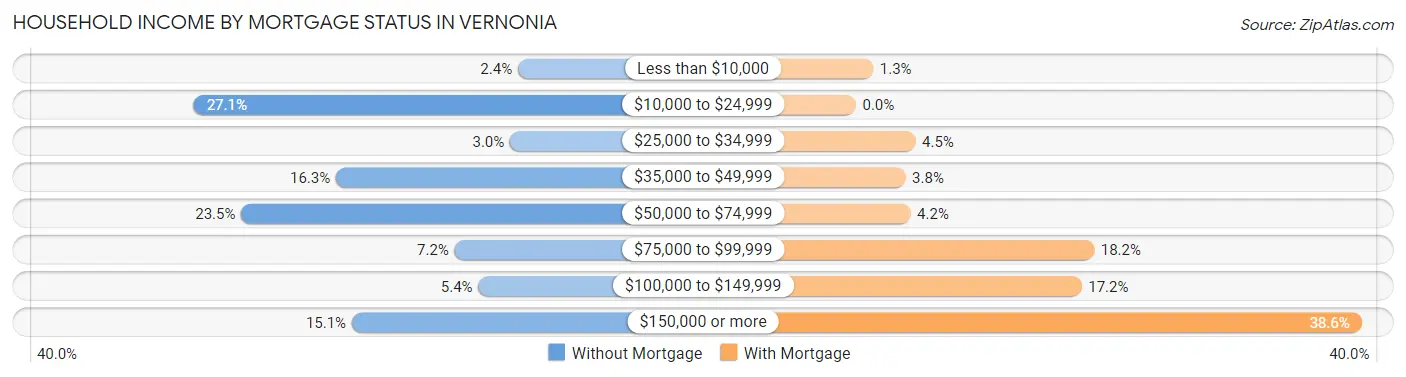
| Household Income | Without Mortgage | With Mortgage |
| Less than $10,000 | 4 (2.4%) | 7 (1.3%) |
| $10,000 to $24,999 | 45 (27.1%) | 0 (0.0%) |
| $25,000 to $34,999 | 5 (3.0%) | 24 (4.5%) |
| $35,000 to $49,999 | 27 (16.3%) | 20 (3.8%) |
| $50,000 to $74,999 | 39 (23.5%) | 22 (4.2%) |
| $75,000 to $99,999 | 12 (7.2%) | 96 (18.1%) |
| $100,000 to $149,999 | 9 (5.4%) | 91 (17.2%) |
| $150,000 or more | 25 (15.1%) | 204 (38.6%) |
| Total | 166 (100.0%) | 529 (100.0%) |
Property Value to Household Income Ratio in Vernonia
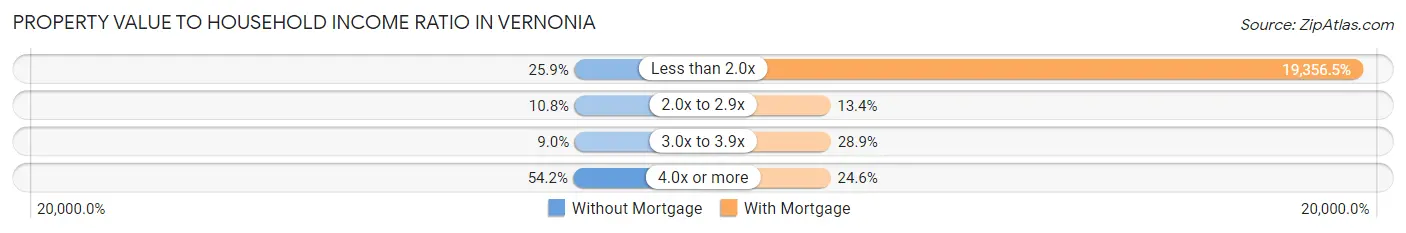
| Value-to-Income Ratio | Without Mortgage | With Mortgage |
| Less than 2.0x | 43 (25.9%) | 102,396 (19,356.5%) |
| 2.0x to 2.9x | 18 (10.8%) | 71 (13.4%) |
| 3.0x to 3.9x | 15 (9.0%) | 153 (28.9%) |
| 4.0x or more | 90 (54.2%) | 130 (24.6%) |
| Total | 166 (100.0%) | 529 (100.0%) |
Real Estate Taxes by Mortgage Status in Vernonia
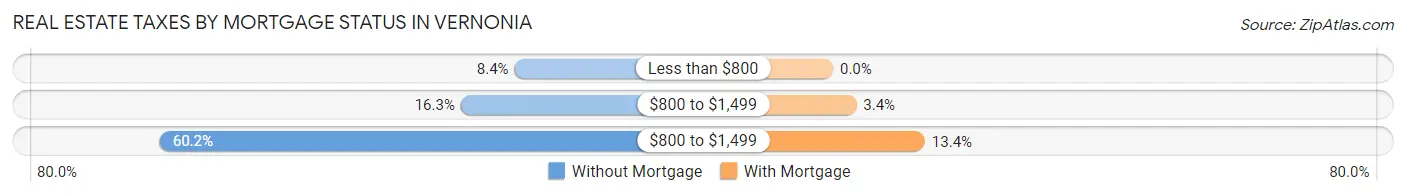
| Property Taxes | Without Mortgage | With Mortgage |
| Less than $800 | 14 (8.4%) | 0 (0.0%) |
| $800 to $1,499 | 27 (16.3%) | 18 (3.4%) |
| $800 to $1,499 | 100 (60.2%) | 71 (13.4%) |
| Total | 166 (100.0%) | 529 (100.0%) |
Health & Disability in Vernonia
Health Insurance Coverage by Age in Vernonia
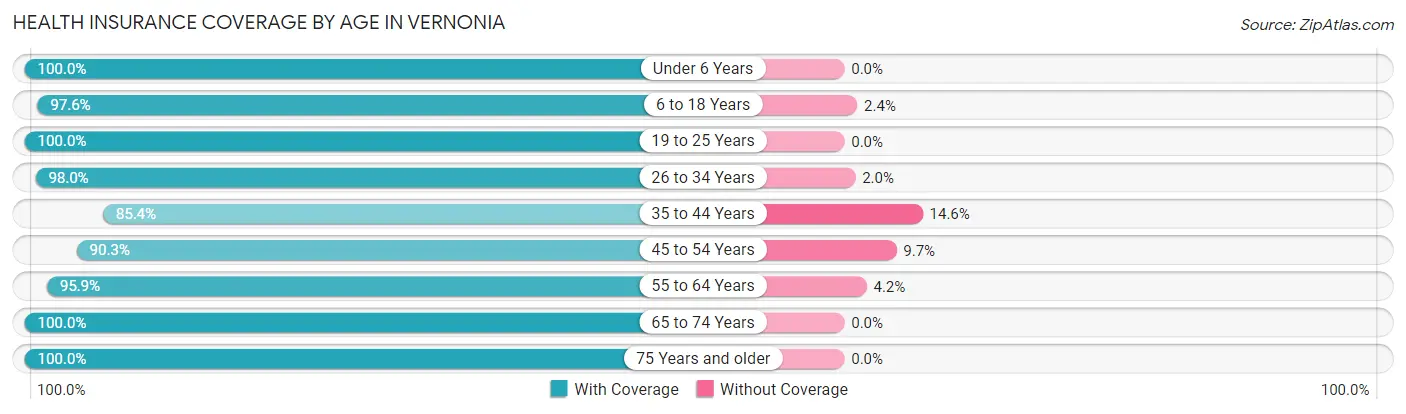
| Age Bracket | With Coverage | Without Coverage |
| Under 6 Years | 99 (100.0%) | 0 (0.0%) |
| 6 to 18 Years | 406 (97.6%) | 10 (2.4%) |
| 19 to 25 Years | 166 (100.0%) | 0 (0.0%) |
| 26 to 34 Years | 290 (98.0%) | 6 (2.0%) |
| 35 to 44 Years | 269 (85.4%) | 46 (14.6%) |
| 45 to 54 Years | 372 (90.3%) | 40 (9.7%) |
| 55 to 64 Years | 277 (95.9%) | 12 (4.2%) |
| 65 to 74 Years | 201 (100.0%) | 0 (0.0%) |
| 75 Years and older | 91 (100.0%) | 0 (0.0%) |
| Total | 2,171 (95.0%) | 114 (5.0%) |
Health Insurance Coverage by Citizenship Status in Vernonia
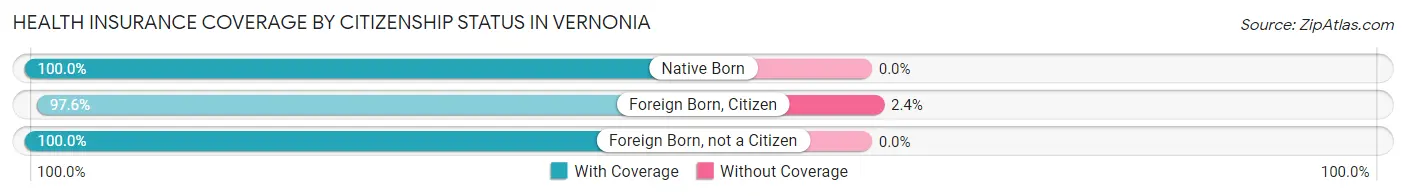
| Citizenship Status | With Coverage | Without Coverage |
| Native Born | 99 (100.0%) | 0 (0.0%) |
| Foreign Born, Citizen | 406 (97.6%) | 10 (2.4%) |
| Foreign Born, not a Citizen | 166 (100.0%) | 0 (0.0%) |
Health Insurance Coverage by Household Income in Vernonia
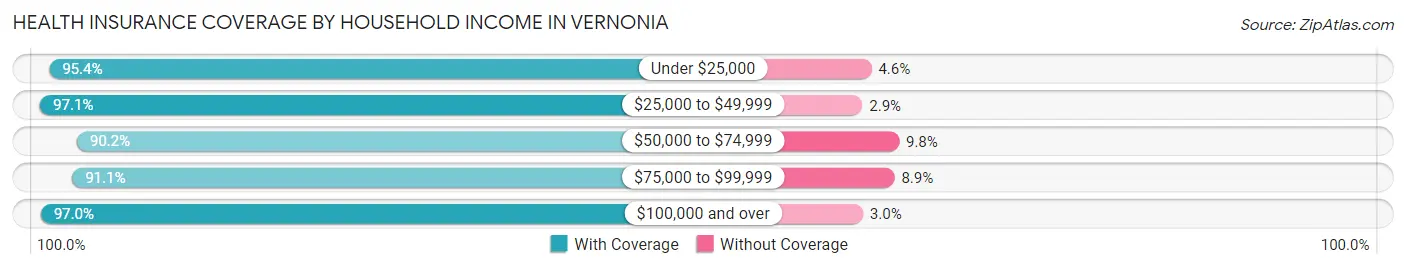
| Household Income | With Coverage | Without Coverage |
| Under $25,000 | 165 (95.4%) | 8 (4.6%) |
| $25,000 to $49,999 | 299 (97.1%) | 9 (2.9%) |
| $50,000 to $74,999 | 295 (90.2%) | 32 (9.8%) |
| $75,000 to $99,999 | 316 (91.1%) | 31 (8.9%) |
| $100,000 and over | 1,091 (97.0%) | 34 (3.0%) |
Public vs Private Health Insurance Coverage by Age in Vernonia
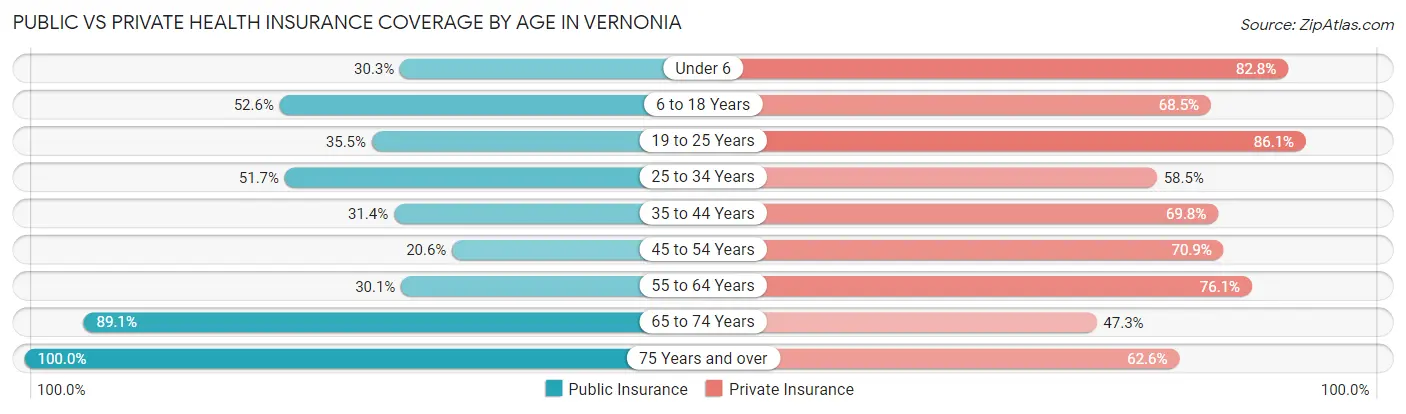
| Age Bracket | Public Insurance | Private Insurance |
| Under 6 | 30 (30.3%) | 82 (82.8%) |
| 6 to 18 Years | 219 (52.6%) | 285 (68.5%) |
| 19 to 25 Years | 59 (35.5%) | 143 (86.1%) |
| 25 to 34 Years | 153 (51.7%) | 173 (58.5%) |
| 35 to 44 Years | 99 (31.4%) | 220 (69.8%) |
| 45 to 54 Years | 85 (20.6%) | 292 (70.9%) |
| 55 to 64 Years | 87 (30.1%) | 220 (76.1%) |
| 65 to 74 Years | 179 (89.0%) | 95 (47.3%) |
| 75 Years and over | 91 (100.0%) | 57 (62.6%) |
| Total | 1,002 (43.9%) | 1,567 (68.6%) |
Disability Status by Sex by Age in Vernonia
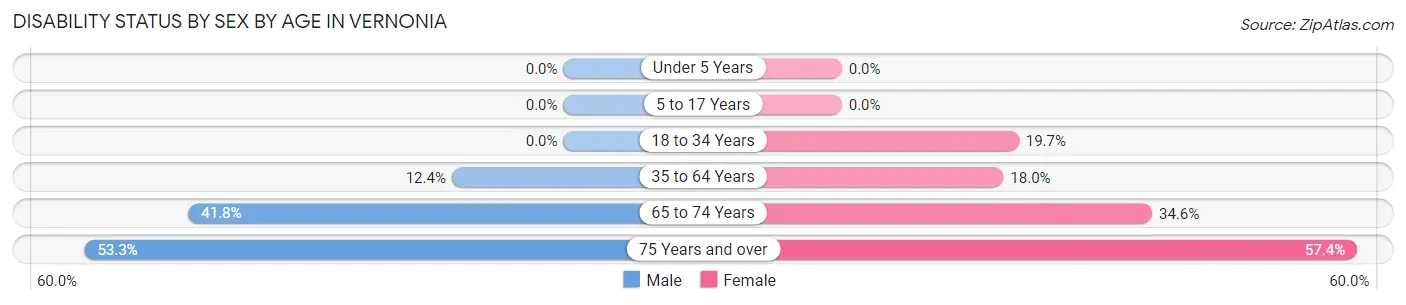
| Age Bracket | Male | Female |
| Under 5 Years | 0 (0.0%) | 0 (0.0%) |
| 5 to 17 Years | 0 (0.0%) | 0 (0.0%) |
| 18 to 34 Years | 0 (0.0%) | 41 (19.7%) |
| 35 to 64 Years | 69 (12.4%) | 83 (18.0%) |
| 65 to 74 Years | 38 (41.8%) | 38 (34.5%) |
| 75 Years and over | 16 (53.3%) | 35 (57.4%) |
Disability Class by Sex by Age in Vernonia
Disability Class: Hearing Difficulty
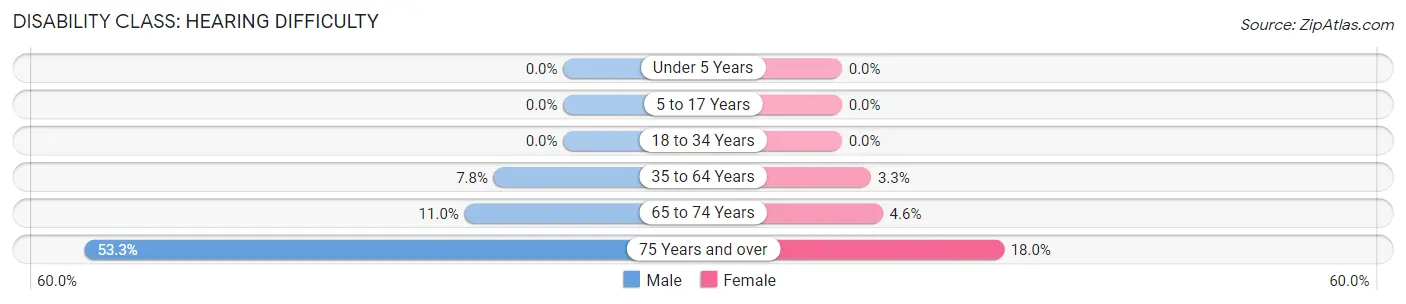
| Age Bracket | Male | Female |
| Under 5 Years | 0 (0.0%) | 0 (0.0%) |
| 5 to 17 Years | 0 (0.0%) | 0 (0.0%) |
| 18 to 34 Years | 0 (0.0%) | 0 (0.0%) |
| 35 to 64 Years | 43 (7.7%) | 15 (3.3%) |
| 65 to 74 Years | 10 (11.0%) | 5 (4.5%) |
| 75 Years and over | 16 (53.3%) | 11 (18.0%) |
Disability Class: Vision Difficulty
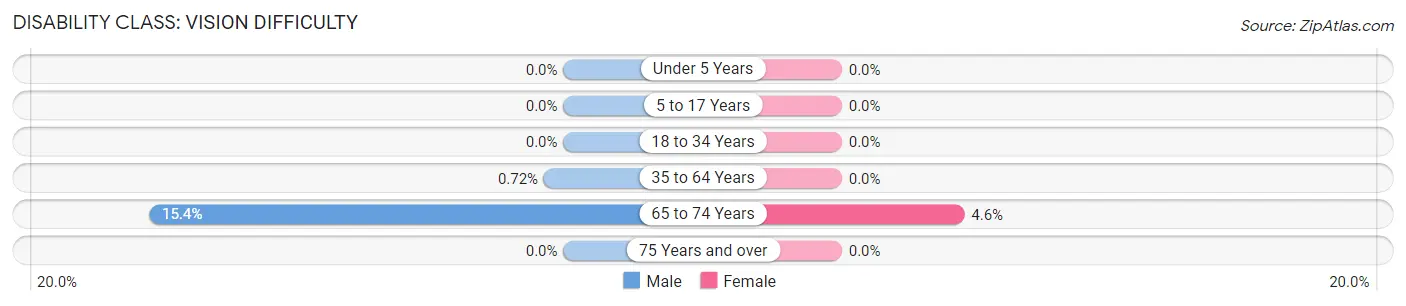
| Age Bracket | Male | Female |
| Under 5 Years | 0 (0.0%) | 0 (0.0%) |
| 5 to 17 Years | 0 (0.0%) | 0 (0.0%) |
| 18 to 34 Years | 0 (0.0%) | 0 (0.0%) |
| 35 to 64 Years | 4 (0.7%) | 0 (0.0%) |
| 65 to 74 Years | 14 (15.4%) | 5 (4.5%) |
| 75 Years and over | 0 (0.0%) | 0 (0.0%) |
Disability Class: Cognitive Difficulty
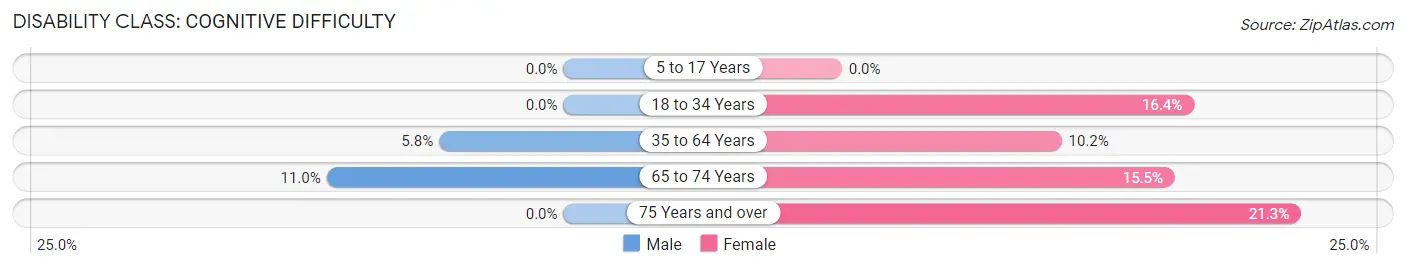
| Age Bracket | Male | Female |
| 5 to 17 Years | 0 (0.0%) | 0 (0.0%) |
| 18 to 34 Years | 0 (0.0%) | 34 (16.4%) |
| 35 to 64 Years | 32 (5.8%) | 47 (10.2%) |
| 65 to 74 Years | 10 (11.0%) | 17 (15.4%) |
| 75 Years and over | 0 (0.0%) | 13 (21.3%) |
Disability Class: Ambulatory Difficulty
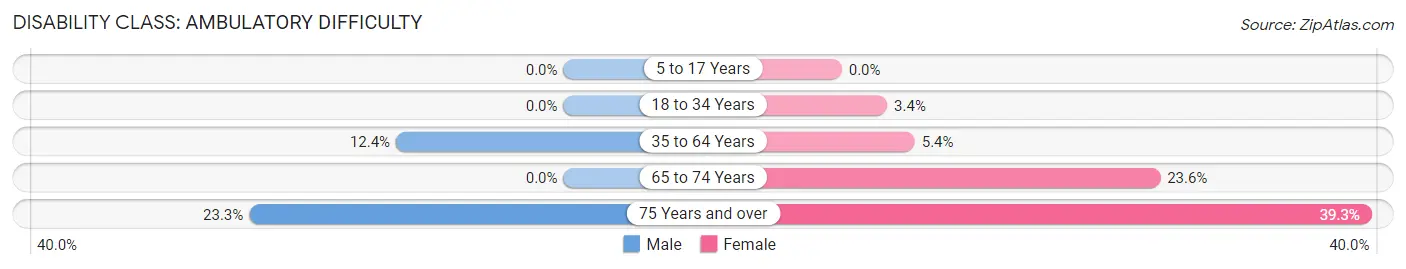
| Age Bracket | Male | Female |
| 5 to 17 Years | 0 (0.0%) | 0 (0.0%) |
| 18 to 34 Years | 0 (0.0%) | 7 (3.4%) |
| 35 to 64 Years | 69 (12.4%) | 25 (5.4%) |
| 65 to 74 Years | 0 (0.0%) | 26 (23.6%) |
| 75 Years and over | 7 (23.3%) | 24 (39.3%) |
Disability Class: Self-Care Difficulty
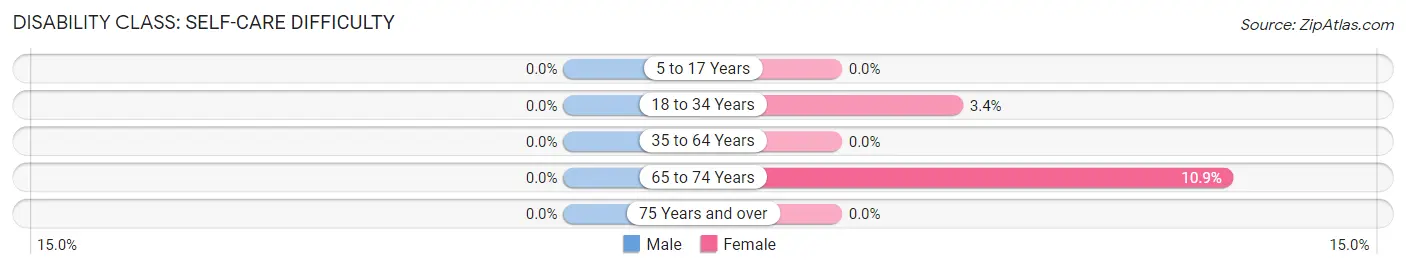
| Age Bracket | Male | Female |
| 5 to 17 Years | 0 (0.0%) | 0 (0.0%) |
| 18 to 34 Years | 0 (0.0%) | 7 (3.4%) |
| 35 to 64 Years | 0 (0.0%) | 0 (0.0%) |
| 65 to 74 Years | 0 (0.0%) | 12 (10.9%) |
| 75 Years and over | 0 (0.0%) | 0 (0.0%) |
Technology Access in Vernonia
Computing Device Access in Vernonia
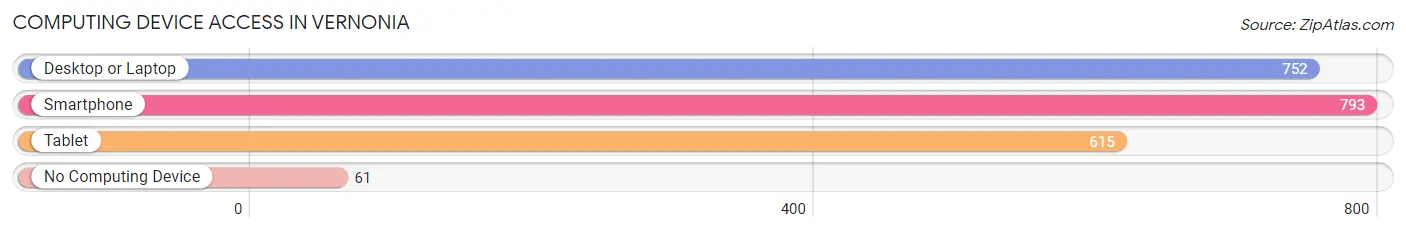
| Device Type | # Households | % Households |
| Desktop or Laptop | 752 | 84.0% |
| Smartphone | 793 | 88.6% |
| Tablet | 615 | 68.7% |
| No Computing Device | 61 | 6.8% |
| Total | 895 | 100.0% |
Internet Access in Vernonia
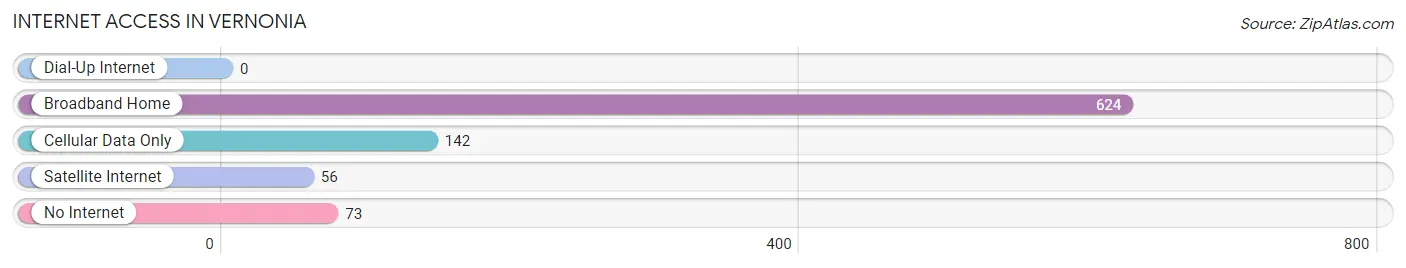
| Internet Type | # Households | % Households |
| Dial-Up Internet | 0 | 0.0% |
| Broadband Home | 624 | 69.7% |
| Cellular Data Only | 142 | 15.9% |
| Satellite Internet | 56 | 6.3% |
| No Internet | 73 | 8.2% |
| Total | 895 | 100.0% |
Vernonia Summary
Vernonia is a small city located in the northwest corner of Oregon, in Columbia County. It is situated on the Nehalem River, about 25 miles east of the Pacific Ocean. The city has a population of 2,150 people, according to the 2010 census.
History
Vernonia was founded in 1891 by a group of settlers from Iowa. The town was named after the nearby Vernonia Lake, which was named after a type of wildflower that grew in the area. The settlers were attracted to the area by the abundance of timber and the potential for logging. The first sawmill was built in 1892, and the town quickly grew as more settlers arrived.
In the early 1900s, the town was a bustling logging community. The timber industry provided jobs for many of the town’s residents, and the town’s population grew to over 1,000 people. The town also had a thriving agricultural industry, with many farmers growing hay, oats, and other crops.
In the 1920s, the timber industry began to decline, and the town’s population began to decline as well. The Great Depression further exacerbated the decline, and by 1940 the population had dropped to just over 500 people.
In the 1950s, the timber industry began to rebound, and the town’s population began to grow again. The town also began to diversify its economy, with the establishment of a cannery, a furniture factory, and a sawmill.
Geography
Vernonia is located in the northwest corner of Oregon, in Columbia County. It is situated on the Nehalem River, about 25 miles east of the Pacific Ocean. The city is surrounded by forests and mountains, and is located in the foothills of the Cascade Range.
The city has a total area of 2.2 square miles, all of which is land. The city is located at an elevation of 545 feet above sea level.
Economy
Vernonia’s economy is largely based on timber and agriculture. The timber industry is still a major employer in the city, and the city is home to several sawmills and lumber companies. The city also has a thriving agricultural industry, with many farmers growing hay, oats, and other crops.
The city also has a growing tourism industry, with many visitors coming to the area to enjoy the natural beauty of the area. The city is also home to several small businesses, including restaurants, shops, and other services.
Demographics
According to the 2010 census, the population of Vernonia was 2,150 people. The racial makeup of the city was 94.3% White, 0.7% African American, 0.7% Native American, 0.7% Asian, 0.2% Pacific Islander, 0.7% from other races, and 2.4% from two or more races. Hispanic or Latino of any race were 2.4% of the population.
The median income for a household in the city was $35,938, and the median income for a family was $41,250. The per capita income for the city was $17,845. About 14.2% of families and 17.2% of the population were below the poverty line, including 22.2% of those under age 18 and 8.3% of those age 65 or over.
Common Questions
What is Per Capita Income in Vernonia?
Per Capita income in Vernonia is $35,902.
What is the Median Family Income in Vernonia?
Median Family Income in Vernonia is $88,750.
What is the Median Household income in Vernonia?
Median Household Income in Vernonia is $78,315.
What is Income or Wage Gap in Vernonia?
Income or Wage Gap in Vernonia is 37.2%.
Women in Vernonia earn 62.8 cents for every dollar earned by a man.
What is Inequality or Gini Index in Vernonia?
Inequality or Gini Index in Vernonia is 0.35.
What is the Total Population of Vernonia?
Total Population of Vernonia is 2,285.
What is the Total Male Population of Vernonia?
Total Male Population of Vernonia is 1,176.
What is the Total Female Population of Vernonia?
Total Female Population of Vernonia is 1,109.
What is the Ratio of Males per 100 Females in Vernonia?
There are 106.04 Males per 100 Females in Vernonia.
What is the Ratio of Females per 100 Males in Vernonia?
There are 94.30 Females per 100 Males in Vernonia.
What is the Median Population Age in Vernonia?
Median Population Age in Vernonia is 39.3 Years.
What is the Average Family Size in Vernonia
Average Family Size in Vernonia is 3.0 People.
What is the Average Household Size in Vernonia
Average Household Size in Vernonia is 2.5 People.
How Large is the Labor Force in Vernonia?
There are 1,292 People in the Labor Forcein in Vernonia.
What is the Percentage of People in the Labor Force in Vernonia?
70.2% of People are in the Labor Force in Vernonia.
What is the Unemployment Rate in Vernonia?
Unemployment Rate in Vernonia is 7.7%.