West Haven Sylvan, OR Map & Demographics
West Haven Sylvan Map
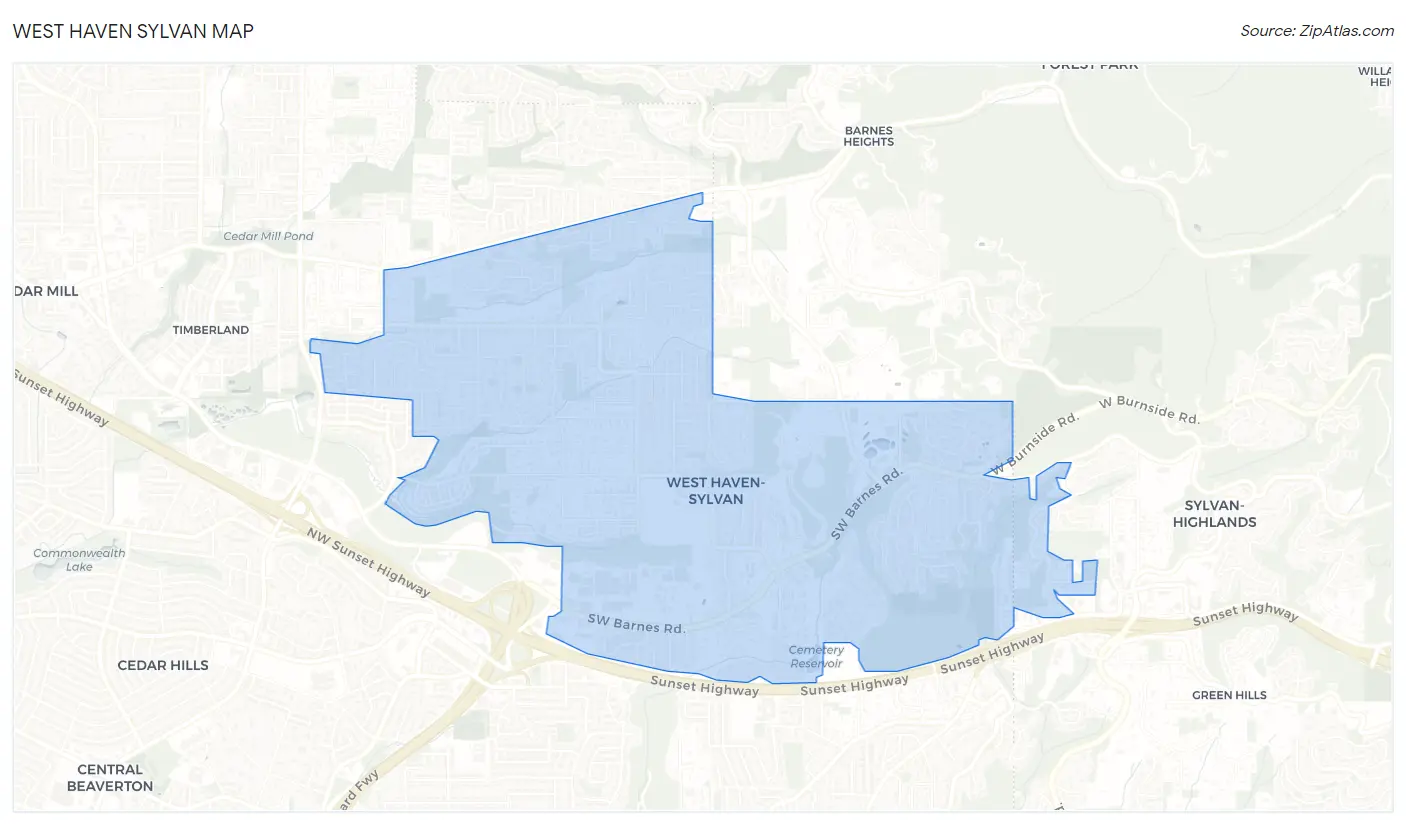
West Haven Sylvan Overview
$69,802
PER CAPITA INCOME
$139,570
AVG FAMILY INCOME
$113,854
AVG HOUSEHOLD INCOME
0.5%
WAGE / INCOME GAP [ % ]
99.5¢/ $1
WAGE / INCOME GAP [ $ ]
0.45
INEQUALITY / GINI INDEX
8,376
TOTAL POPULATION
3,988
MALE POPULATION
4,388
FEMALE POPULATION
90.88
MALES / 100 FEMALES
110.03
FEMALES / 100 MALES
34.0
MEDIAN AGE
2.7
AVG FAMILY SIZE
2.1
AVG HOUSEHOLD SIZE
5,135
LABOR FORCE [ PEOPLE ]
72.2%
PERCENT IN LABOR FORCE
3.9%
UNEMPLOYMENT RATE
Income in West Haven Sylvan
Income Overview in West Haven Sylvan
Per Capita Income in West Haven Sylvan is $69,802, while median incomes of families and households are $139,570 and $113,854 respectively.
| Characteristic | Number | Measure |
| Per Capita Income | 8,376 | $69,802 |
| Median Family Income | 2,273 | $139,570 |
| Mean Family Income | 2,273 | $191,501 |
| Median Household Income | 3,917 | $113,854 |
| Mean Household Income | 3,917 | $148,430 |
| Income Deficit | 2,273 | $0 |
| Wage / Income Gap (%) | 8,376 | 0.54% |
| Wage / Income Gap ($) | 8,376 | 99.46¢ per $1 |
| Gini / Inequality Index | 8,376 | 0.45 |
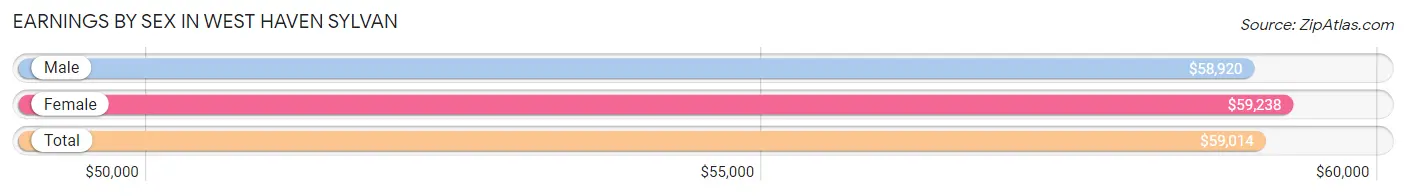
Earnings by Sex in West Haven Sylvan
Average Earnings in West Haven Sylvan are $59,014, $58,920 for men and $59,238 for women, a difference of 0.5%.
| Sex | Number | Average Earnings |
| Male | 2,727 (50.2%) | $58,920 |
| Female | 2,701 (49.8%) | $59,238 |
| Total | 5,428 (100.0%) | $59,014 |
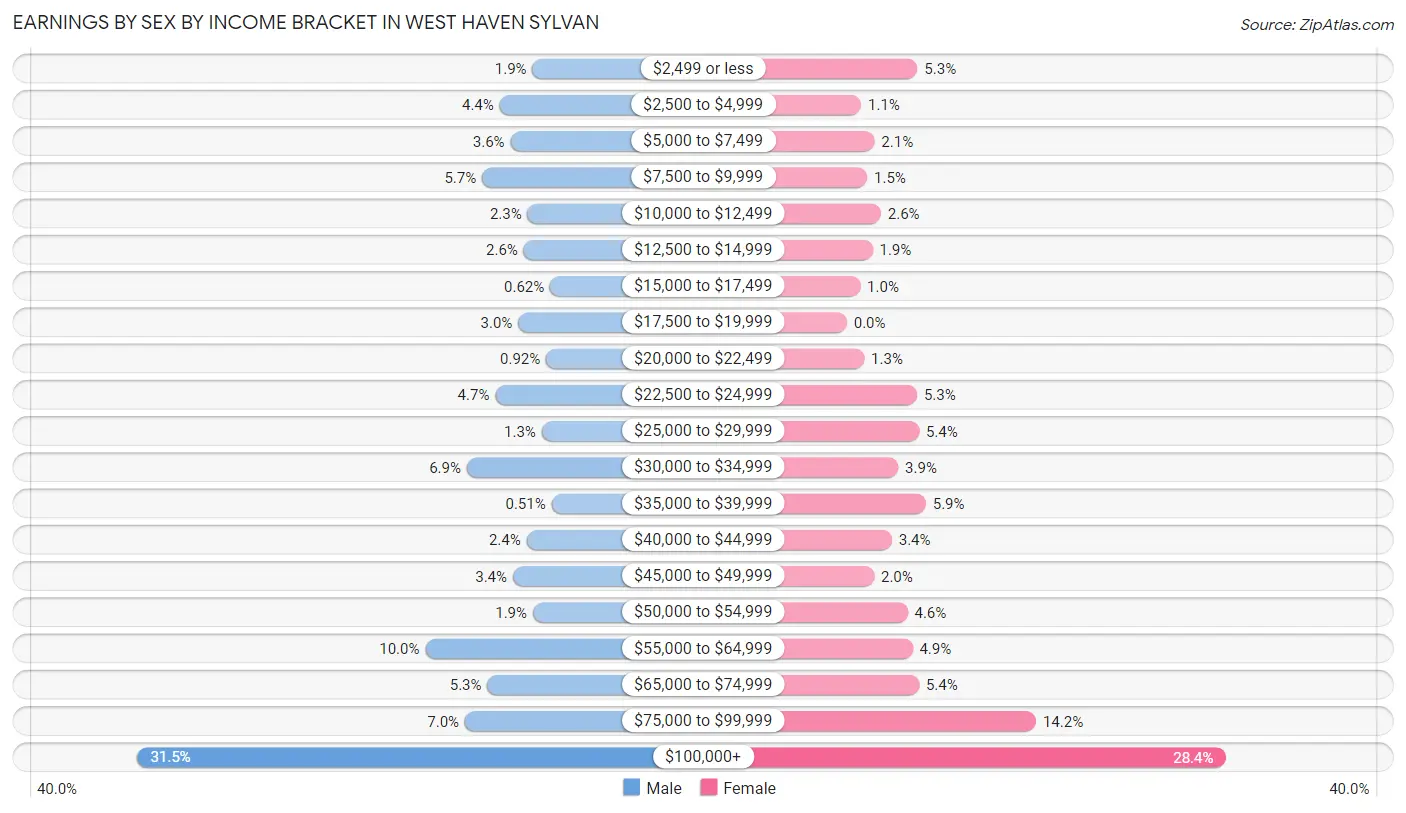
Earnings by Sex by Income Bracket in West Haven Sylvan
The most common earnings brackets in West Haven Sylvan are $100,000+ for men (860 | 31.5%) and $100,000+ for women (766 | 28.4%).
| Income | Male | Female |
| $2,499 or less | 53 (1.9%) | 143 (5.3%) |
| $2,500 to $4,999 | 120 (4.4%) | 29 (1.1%) |
| $5,000 to $7,499 | 98 (3.6%) | 56 (2.1%) |
| $7,500 to $9,999 | 156 (5.7%) | 41 (1.5%) |
| $10,000 to $12,499 | 63 (2.3%) | 69 (2.5%) |
| $12,500 to $14,999 | 71 (2.6%) | 52 (1.9%) |
| $15,000 to $17,499 | 17 (0.6%) | 27 (1.0%) |
| $17,500 to $19,999 | 82 (3.0%) | 0 (0.0%) |
| $20,000 to $22,499 | 25 (0.9%) | 35 (1.3%) |
| $22,500 to $24,999 | 129 (4.7%) | 142 (5.3%) |
| $25,000 to $29,999 | 34 (1.3%) | 146 (5.4%) |
| $30,000 to $34,999 | 187 (6.9%) | 104 (3.8%) |
| $35,000 to $39,999 | 14 (0.5%) | 160 (5.9%) |
| $40,000 to $44,999 | 65 (2.4%) | 91 (3.4%) |
| $45,000 to $49,999 | 93 (3.4%) | 55 (2.0%) |
| $50,000 to $54,999 | 52 (1.9%) | 123 (4.5%) |
| $55,000 to $64,999 | 272 (10.0%) | 133 (4.9%) |
| $65,000 to $74,999 | 145 (5.3%) | 146 (5.4%) |
| $75,000 to $99,999 | 191 (7.0%) | 383 (14.2%) |
| $100,000+ | 860 (31.5%) | 766 (28.4%) |
| Total | 2,727 (100.0%) | 2,701 (100.0%) |
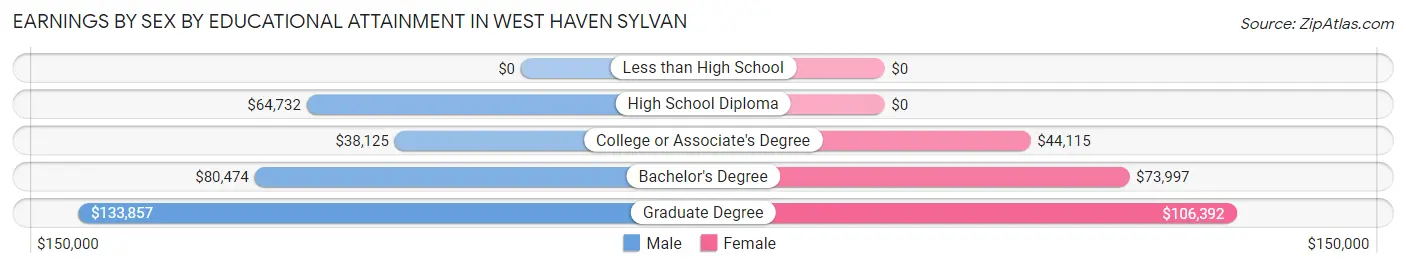
Earnings by Sex by Educational Attainment in West Haven Sylvan
Average earnings in West Haven Sylvan are $73,526 for men and $79,292 for women, a difference of 7.3%. Men with an educational attainment of graduate degree enjoy the highest average annual earnings of $133,857, while those with college or associate's degree education earn the least with $38,125. Women with an educational attainment of graduate degree earn the most with the average annual earnings of $106,392, while those with college or associate's degree education have the smallest earnings of $44,115.
| Educational Attainment | Male Income | Female Income |
| Less than High School | - | - |
| High School Diploma | $64,732 | $0 |
| College or Associate's Degree | $38,125 | $44,115 |
| Bachelor's Degree | $80,474 | $73,997 |
| Graduate Degree | $133,857 | $106,392 |
| Total | $73,526 | $79,292 |
Family Income in West Haven Sylvan
Family Income Brackets in West Haven Sylvan
According to the West Haven Sylvan family income data, there are 780 families falling into the $100,000 to $149,999 income range, which is the most common income bracket and makes up 34.3% of all families. Conversely, the $10,000 to $14,999 income bracket is the least frequent group with only 20 families (0.9%) belonging to this category.
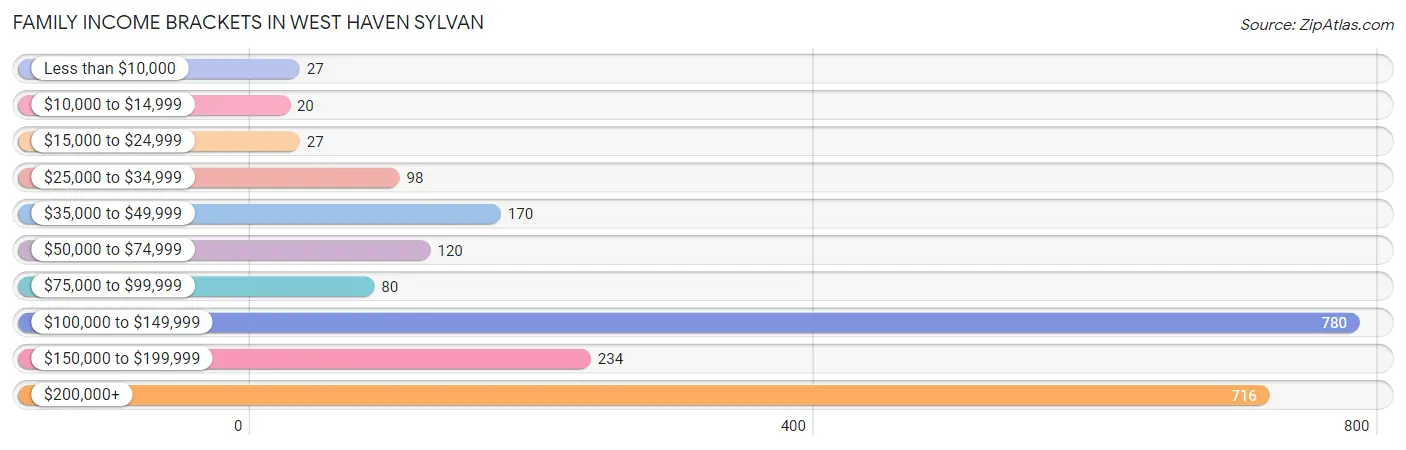
| Income Bracket | # Families | % Families |
| Less than $10,000 | 27 | 1.2% |
| $10,000 to $14,999 | 20 | 0.9% |
| $15,000 to $24,999 | 27 | 1.2% |
| $25,000 to $34,999 | 98 | 4.3% |
| $35,000 to $49,999 | 170 | 7.5% |
| $50,000 to $74,999 | 120 | 5.3% |
| $75,000 to $99,999 | 80 | 3.5% |
| $100,000 to $149,999 | 780 | 34.3% |
| $150,000 to $199,999 | 234 | 10.3% |
| $200,000+ | 716 | 31.5% |
Family Income by Famaliy Size in West Haven Sylvan
4-person families (302 | 13.3%) account for the highest median family income in West Haven Sylvan with $250,001 per family, while 4-person families (302 | 13.3%) have the highest median income of $62,500 per family member.
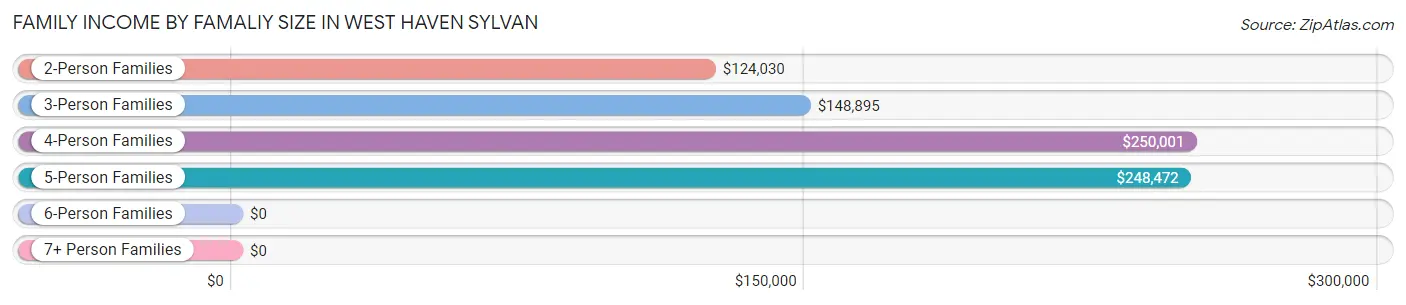
| Income Bracket | # Families | Median Income |
| 2-Person Families | 1,407 (61.9%) | $124,030 |
| 3-Person Families | 480 (21.1%) | $148,895 |
| 4-Person Families | 302 (13.3%) | $250,001 |
| 5-Person Families | 71 (3.1%) | $248,472 |
| 6-Person Families | 0 (0.0%) | $0 |
| 7+ Person Families | 13 (0.6%) | $0 |
| Total | 2,273 (100.0%) | $139,570 |
Family Income by Number of Earners in West Haven Sylvan
The median family income in West Haven Sylvan is $139,570, with families comprising 2 earners (1,347) having the highest median family income of $140,598, while families with no earners (269) have the lowest median family income of $136,719, accounting for 59.3% and 11.8% of families, respectively.
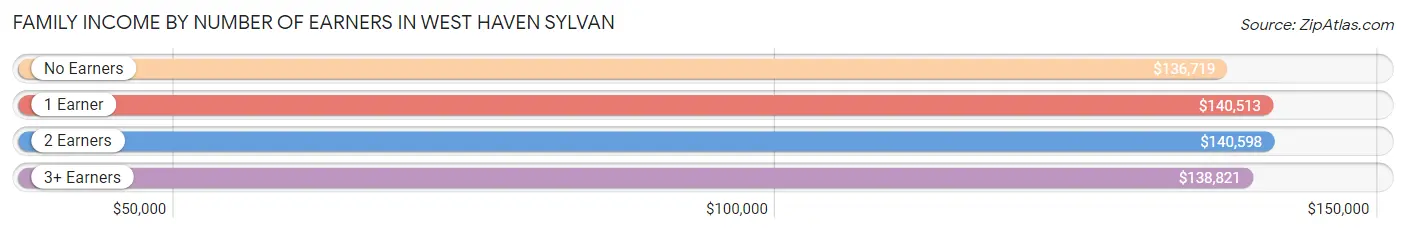
| Number of Earners | # Families | Median Income |
| No Earners | 269 (11.8%) | $136,719 |
| 1 Earner | 526 (23.1%) | $140,513 |
| 2 Earners | 1,347 (59.3%) | $140,598 |
| 3+ Earners | 131 (5.8%) | $138,821 |
| Total | 2,273 (100.0%) | $139,570 |
Household Income in West Haven Sylvan
Household Income Brackets in West Haven Sylvan
With 1,171 households falling in the category, the $100,000 to $149,999 income range is the most frequent in West Haven Sylvan, accounting for 29.9% of all households. In contrast, only 59 households (1.5%) fall into the $15,000 to $24,999 income bracket, making it the least populous group.
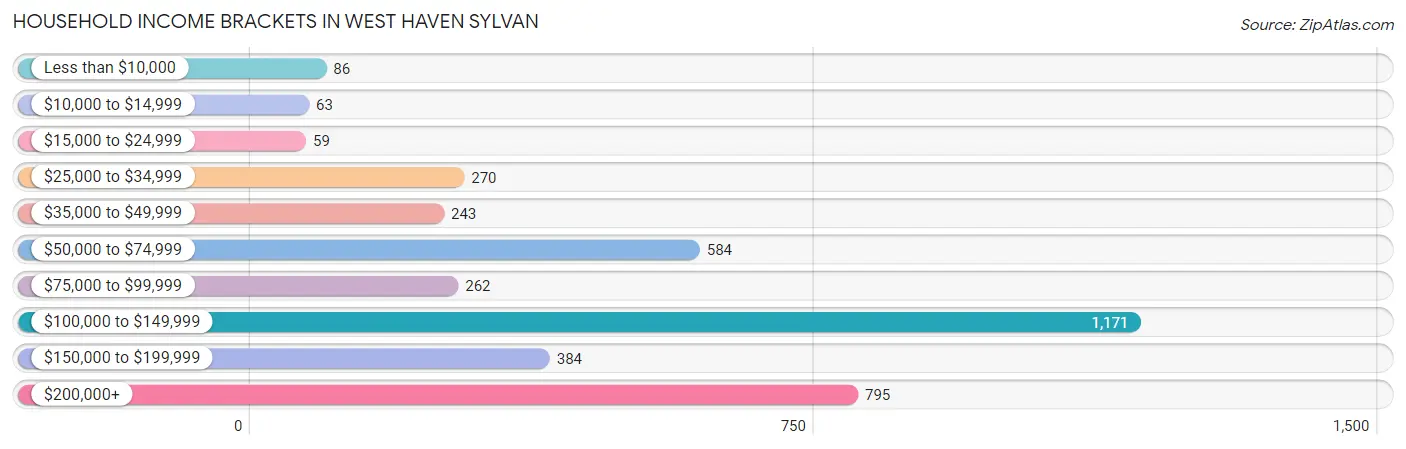
| Income Bracket | # Households | % Households |
| Less than $10,000 | 86 | 2.2% |
| $10,000 to $14,999 | 63 | 1.6% |
| $15,000 to $24,999 | 59 | 1.5% |
| $25,000 to $34,999 | 270 | 6.9% |
| $35,000 to $49,999 | 243 | 6.2% |
| $50,000 to $74,999 | 584 | 14.9% |
| $75,000 to $99,999 | 262 | 6.7% |
| $100,000 to $149,999 | 1,171 | 29.9% |
| $150,000 to $199,999 | 384 | 9.8% |
| $200,000+ | 795 | 20.3% |
Household Income by Householder Age in West Haven Sylvan
The median household income in West Haven Sylvan is $113,854, with the highest median household income of $146,167 found in the 45 to 64 years age bracket for the primary householder. A total of 972 households (24.8%) fall into this category. Meanwhile, the 15 to 24 years age bracket for the primary householder has the lowest median household income of $37,763, with 488 households (12.5%) in this group.
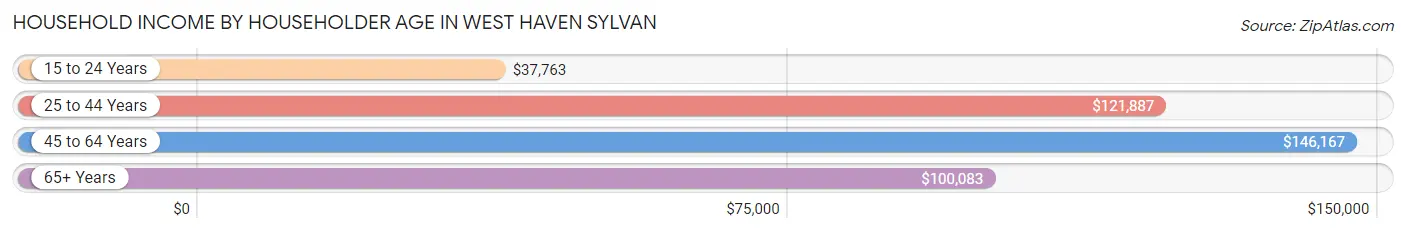
| Income Bracket | # Households | Median Income |
| 15 to 24 Years | 488 (12.5%) | $37,763 |
| 25 to 44 Years | 1,607 (41.0%) | $121,887 |
| 45 to 64 Years | 972 (24.8%) | $146,167 |
| 65+ Years | 850 (21.7%) | $100,083 |
| Total | 3,917 (100.0%) | $113,854 |
Poverty in West Haven Sylvan
Income Below Poverty by Sex and Age in West Haven Sylvan
With 3.9% poverty level for males and 6.7% for females among the residents of West Haven Sylvan, 18 to 24 year old males and 12 to 14 year old females are the most vulnerable to poverty, with 70 males (11.8%) and 36 females (48.6%) in their respective age groups living below the poverty level.
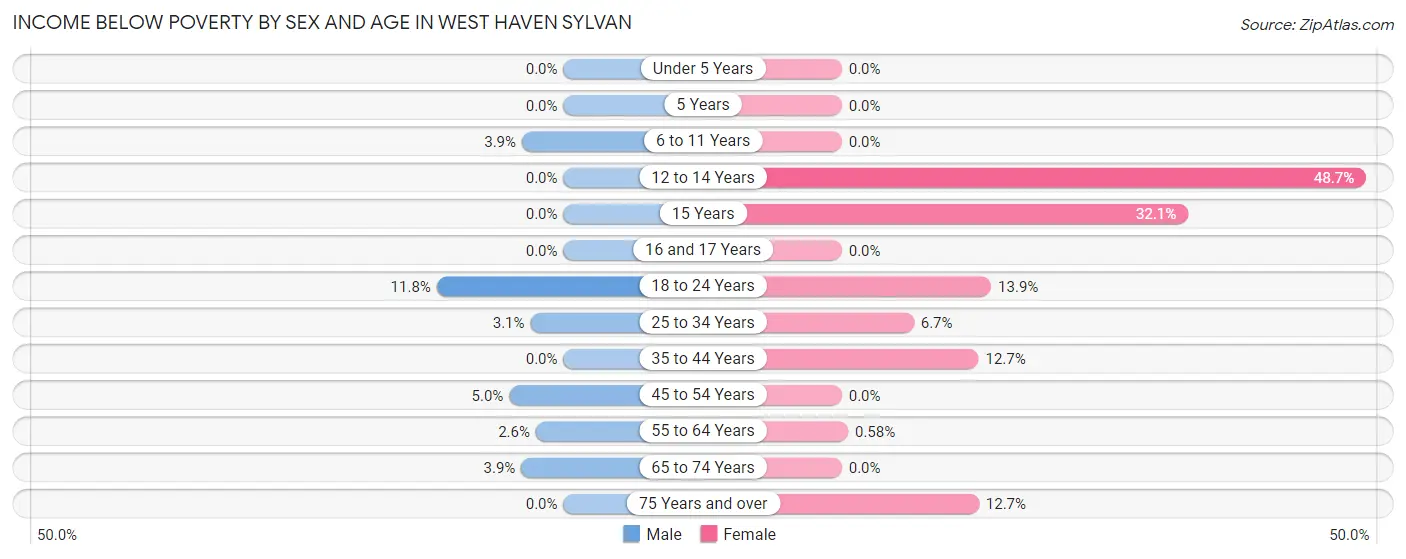
| Age Bracket | Male | Female |
| Under 5 Years | 0 (0.0%) | 0 (0.0%) |
| 5 Years | 0 (0.0%) | 0 (0.0%) |
| 6 to 11 Years | 8 (3.8%) | 0 (0.0%) |
| 12 to 14 Years | 0 (0.0%) | 36 (48.6%) |
| 15 Years | 0 (0.0%) | 9 (32.1%) |
| 16 and 17 Years | 0 (0.0%) | 0 (0.0%) |
| 18 to 24 Years | 70 (11.8%) | 74 (13.9%) |
| 25 to 34 Years | 26 (3.1%) | 60 (6.7%) |
| 35 to 44 Years | 0 (0.0%) | 82 (12.7%) |
| 45 to 54 Years | 30 (5.0%) | 0 (0.0%) |
| 55 to 64 Years | 6 (2.6%) | 2 (0.6%) |
| 65 to 74 Years | 14 (3.9%) | 0 (0.0%) |
| 75 Years and over | 0 (0.0%) | 29 (12.7%) |
| Total | 154 (3.9%) | 292 (6.7%) |
Income Above Poverty by Sex and Age in West Haven Sylvan
According to the poverty statistics in West Haven Sylvan, males aged under 5 years and females aged under 5 years are the age groups that are most secure financially, with 100.0% of males and 100.0% of females in these age groups living above the poverty line.
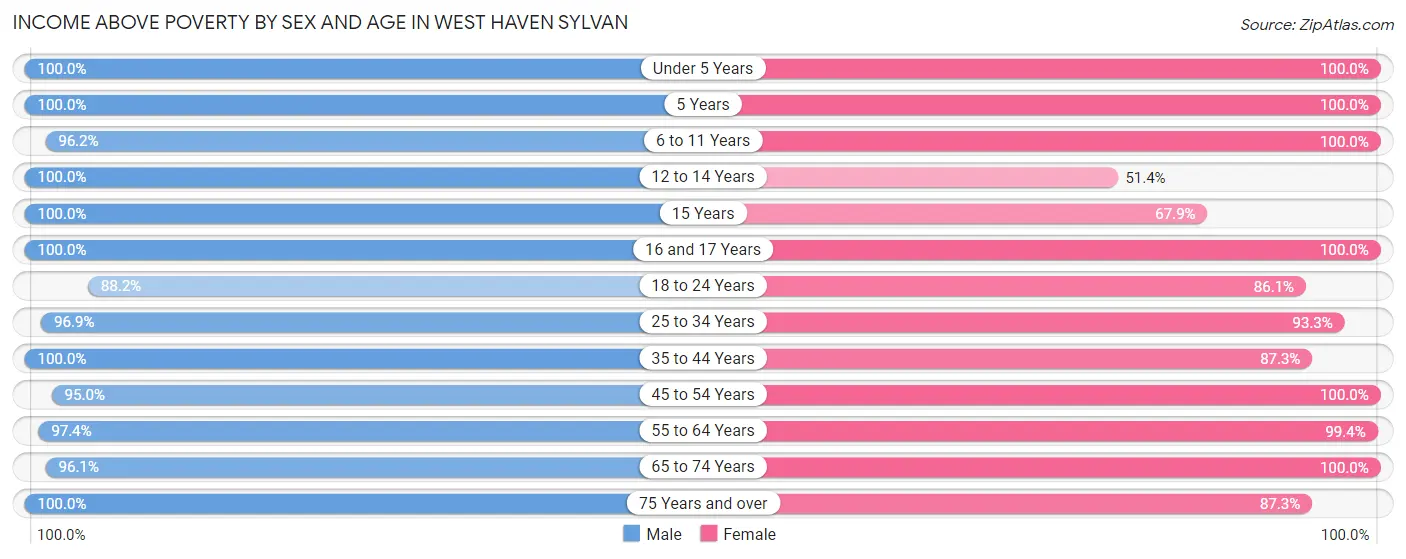
| Age Bracket | Male | Female |
| Under 5 Years | 231 (100.0%) | 123 (100.0%) |
| 5 Years | 16 (100.0%) | 28 (100.0%) |
| 6 to 11 Years | 200 (96.2%) | 291 (100.0%) |
| 12 to 14 Years | 220 (100.0%) | 38 (51.3%) |
| 15 Years | 45 (100.0%) | 19 (67.9%) |
| 16 and 17 Years | 69 (100.0%) | 94 (100.0%) |
| 18 to 24 Years | 525 (88.2%) | 460 (86.1%) |
| 25 to 34 Years | 823 (96.9%) | 838 (93.3%) |
| 35 to 44 Years | 317 (100.0%) | 564 (87.3%) |
| 45 to 54 Years | 566 (95.0%) | 444 (100.0%) |
| 55 to 64 Years | 228 (97.4%) | 343 (99.4%) |
| 65 to 74 Years | 344 (96.1%) | 655 (100.0%) |
| 75 Years and over | 241 (100.0%) | 199 (87.3%) |
| Total | 3,825 (96.1%) | 4,096 (93.3%) |
Income Below Poverty Among Married-Couple Families in West Haven Sylvan
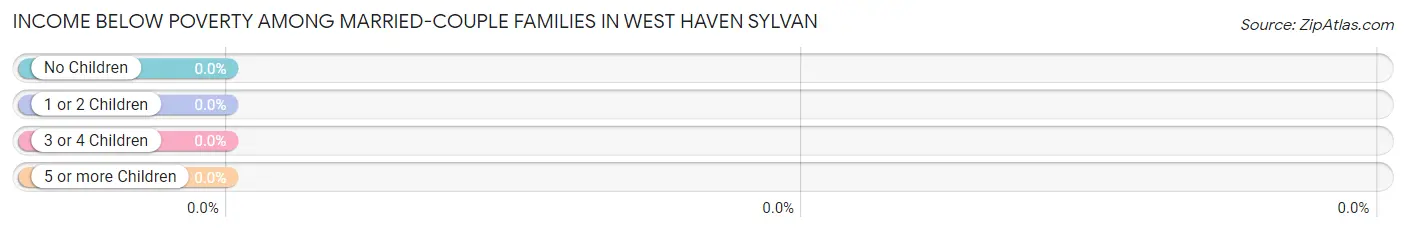
| Children | Above Poverty | Below Poverty |
| No Children | 1,291 (100.0%) | 0 (0.0%) |
| 1 or 2 Children | 554 (100.0%) | 0 (0.0%) |
| 3 or 4 Children | 58 (100.0%) | 0 (0.0%) |
| 5 or more Children | 13 (100.0%) | 0 (0.0%) |
| Total | 1,916 (100.0%) | 0 (0.0%) |
Income Below Poverty Among Single-Parent Households in West Haven Sylvan
According to the poverty data in West Haven Sylvan, 76.9% or 30 single-father households and 8.8% or 28 single-mother households are living below the poverty line. Among single-father households, those with no children have the highest poverty rate, with 20 households (100.0%) experiencing poverty. Likewise, among single-mother households, those with 1 or 2 children have the highest poverty rate, with 28 households (11.2%) falling below the poverty line.
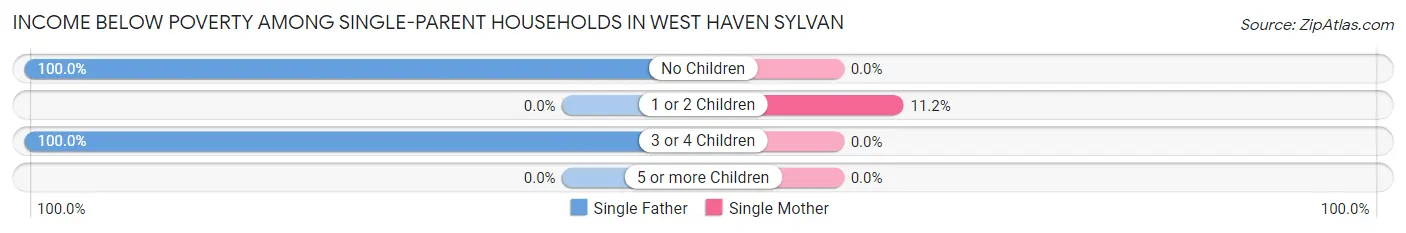
| Children | Single Father | Single Mother |
| No Children | 20 (100.0%) | 0 (0.0%) |
| 1 or 2 Children | 0 (0.0%) | 28 (11.2%) |
| 3 or 4 Children | 10 (100.0%) | 0 (0.0%) |
| 5 or more Children | 0 (0.0%) | 0 (0.0%) |
| Total | 30 (76.9%) | 28 (8.8%) |
Income Below Poverty Among Married-Couple vs Single-Parent Households in West Haven Sylvan
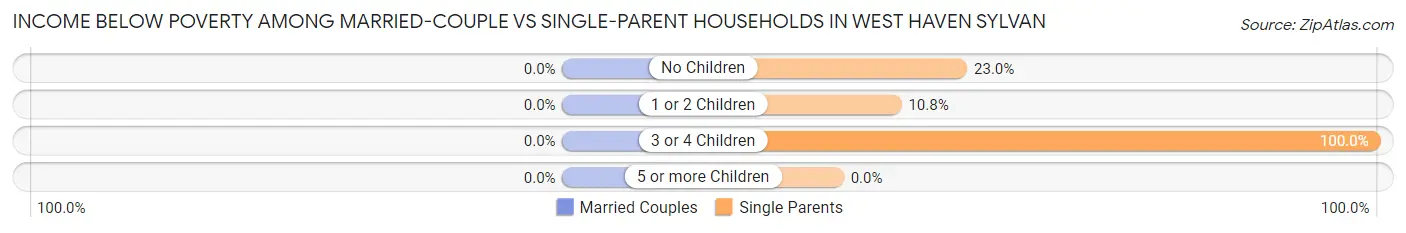
| Children | Married-Couple Families | Single-Parent Households |
| No Children | 0 (0.0%) | 20 (23.0%) |
| 1 or 2 Children | 0 (0.0%) | 28 (10.8%) |
| 3 or 4 Children | 0 (0.0%) | 10 (100.0%) |
| 5 or more Children | 0 (0.0%) | 0 (0.0%) |
| Total | 0 (0.0%) | 58 (16.3%) |
Race in West Haven Sylvan
The most populous races in West Haven Sylvan are White / Caucasian (6,797 | 81.1%), Asian (615 | 7.3%), and Two or more Races (585 | 7.0%).
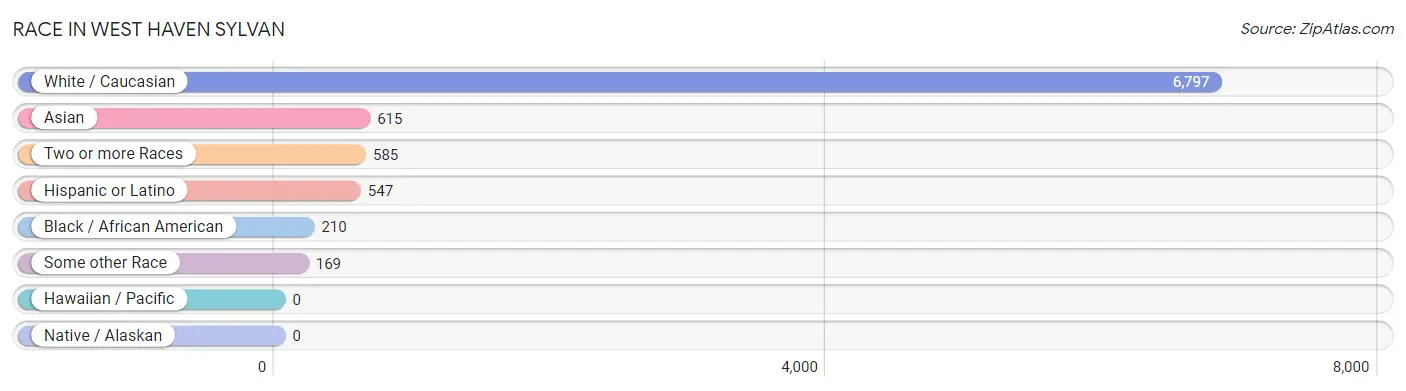
| Race | # Population | % Population |
| Asian | 615 | 7.3% |
| Black / African American | 210 | 2.5% |
| Hawaiian / Pacific | 0 | 0.0% |
| Hispanic or Latino | 547 | 6.5% |
| Native / Alaskan | 0 | 0.0% |
| White / Caucasian | 6,797 | 81.1% |
| Two or more Races | 585 | 7.0% |
| Some other Race | 169 | 2.0% |
| Total | 8,376 | 100.0% |
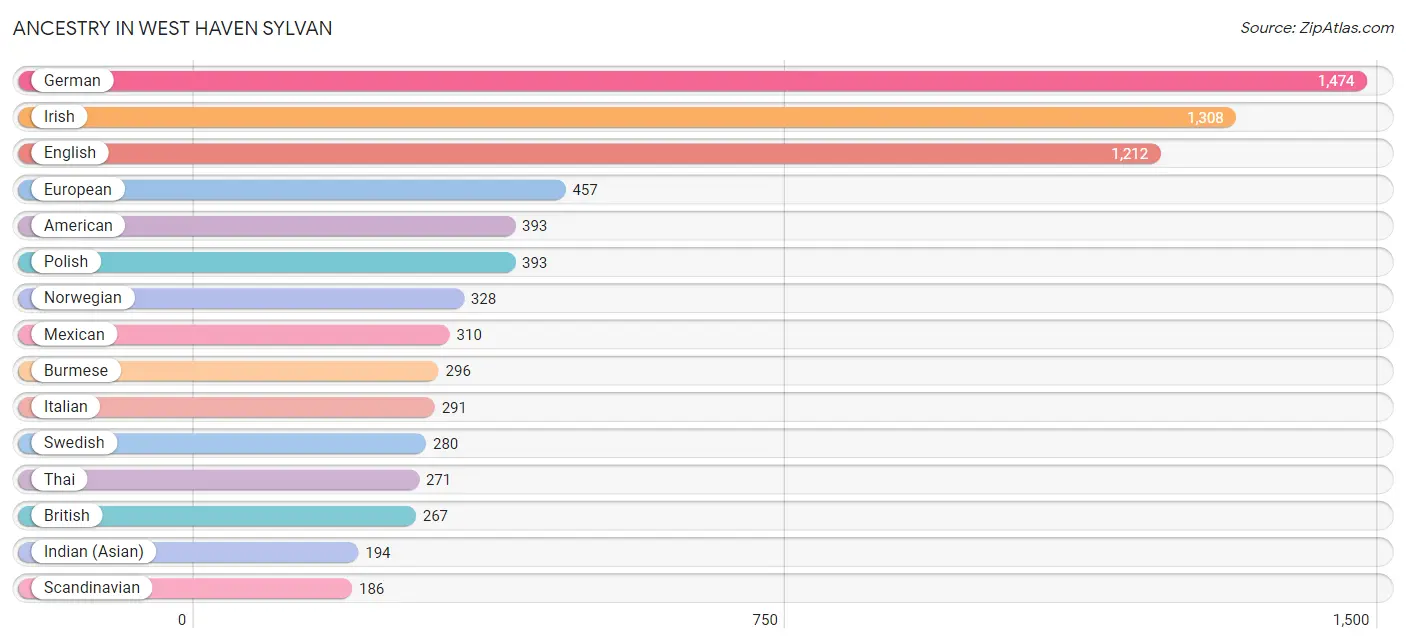
Ancestry in West Haven Sylvan
The most populous ancestries reported in West Haven Sylvan are German (1,474 | 17.6%), Irish (1,308 | 15.6%), English (1,212 | 14.5%), European (457 | 5.5%), and American (393 | 4.7%), together accounting for 57.8% of all West Haven Sylvan residents.
| Ancestry | # Population | % Population |
| African | 71 | 0.9% |
| American | 393 | 4.7% |
| Arab | 148 | 1.8% |
| Belgian | 67 | 0.8% |
| Bhutanese | 47 | 0.6% |
| British | 267 | 3.2% |
| Burmese | 296 | 3.5% |
| Cajun | 16 | 0.2% |
| Celtic | 58 | 0.7% |
| Central American | 34 | 0.4% |
| Croatian | 88 | 1.1% |
| Czech | 63 | 0.7% |
| Danish | 73 | 0.9% |
| Dominican | 168 | 2.0% |
| Dutch | 108 | 1.3% |
| Eastern European | 78 | 0.9% |
| Egyptian | 65 | 0.8% |
| English | 1,212 | 14.5% |
| European | 457 | 5.5% |
| Finnish | 89 | 1.1% |
| French | 157 | 1.9% |
| French Canadian | 52 | 0.6% |
| German | 1,474 | 17.6% |
| Greek | 21 | 0.3% |
| Guatemalan | 34 | 0.4% |
| Hungarian | 42 | 0.5% |
| Indian (Asian) | 194 | 2.3% |
| Iranian | 31 | 0.4% |
| Iraqi | 11 | 0.1% |
| Irish | 1,308 | 15.6% |
| Italian | 291 | 3.5% |
| Korean | 117 | 1.4% |
| Lebanese | 57 | 0.7% |
| Macedonian | 36 | 0.4% |
| Mexican | 310 | 3.7% |
| Northern European | 7 | 0.1% |
| Norwegian | 328 | 3.9% |
| Polish | 393 | 4.7% |
| Portuguese | 105 | 1.3% |
| Romanian | 18 | 0.2% |
| Russian | 27 | 0.3% |
| Scandinavian | 186 | 2.2% |
| Scotch-Irish | 52 | 0.6% |
| Scottish | 79 | 0.9% |
| Serbian | 4 | 0.1% |
| Slavic | 16 | 0.2% |
| Slovene | 174 | 2.1% |
| Spaniard | 35 | 0.4% |
| Sri Lankan | 49 | 0.6% |
| Subsaharan African | 71 | 0.9% |
| Swedish | 280 | 3.3% |
| Swiss | 10 | 0.1% |
| Thai | 271 | 3.2% |
| Turkish | 20 | 0.2% |
| Vietnamese | 34 | 0.4% |
| Welsh | 98 | 1.2% | View All 56 Rows |
Immigrants in West Haven Sylvan
The most numerous immigrant groups reported in West Haven Sylvan came from Asia (439 | 5.2%), Europe (191 | 2.3%), Eastern Asia (165 | 2.0%), Latin America (150 | 1.8%), and India (143 | 1.7%), together accounting for 13.0% of all West Haven Sylvan residents.
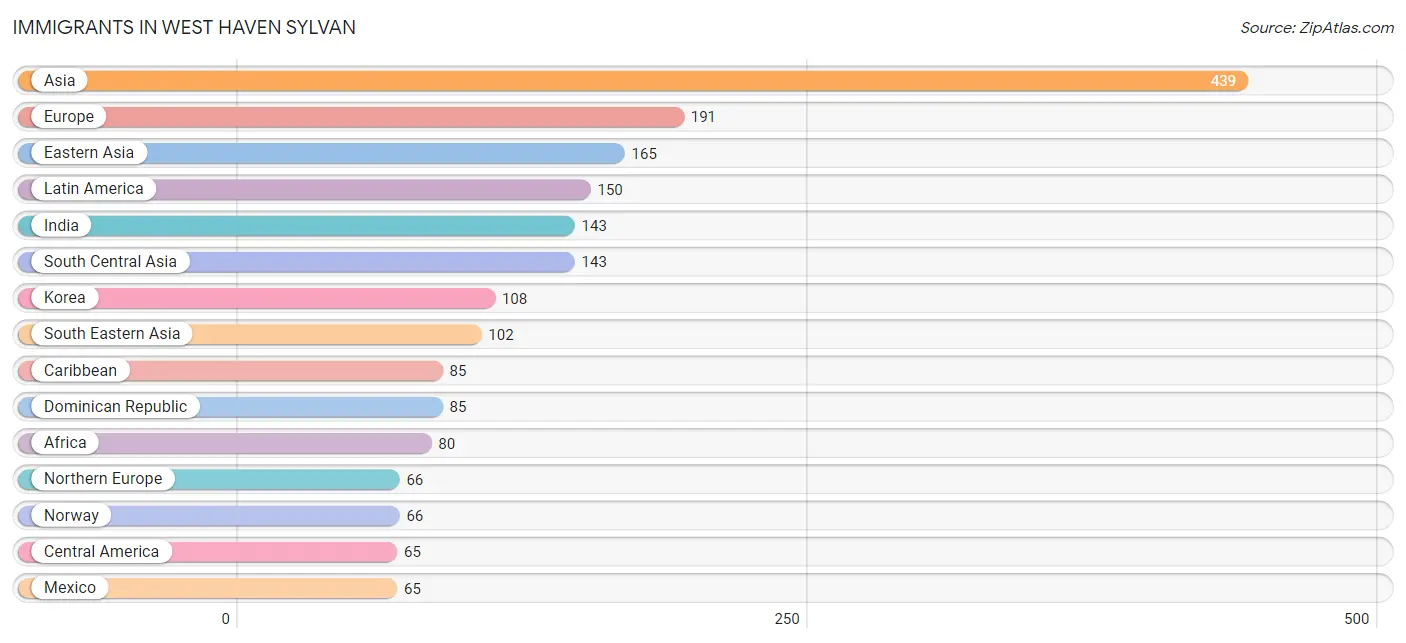
| Immigration Origin | # Population | % Population |
| Africa | 80 | 1.0% |
| Asia | 439 | 5.2% |
| Canada | 31 | 0.4% |
| Caribbean | 85 | 1.0% |
| Central America | 65 | 0.8% |
| China | 29 | 0.4% |
| Croatia | 15 | 0.2% |
| Dominican Republic | 85 | 1.0% |
| Eastern Africa | 46 | 0.5% |
| Eastern Asia | 165 | 2.0% |
| Eastern Europe | 61 | 0.7% |
| Egypt | 34 | 0.4% |
| Europe | 191 | 2.3% |
| France | 13 | 0.2% |
| Germany | 16 | 0.2% |
| Hungary | 18 | 0.2% |
| India | 143 | 1.7% |
| Israel | 11 | 0.1% |
| Japan | 28 | 0.3% |
| Kenya | 46 | 0.5% |
| Korea | 108 | 1.3% |
| Latin America | 150 | 1.8% |
| Lebanon | 18 | 0.2% |
| Malaysia | 56 | 0.7% |
| Mexico | 65 | 0.8% |
| Northern Africa | 34 | 0.4% |
| Northern Europe | 66 | 0.8% |
| Norway | 66 | 0.8% |
| Philippines | 19 | 0.2% |
| Poland | 19 | 0.2% |
| Serbia | 9 | 0.1% |
| South Central Asia | 143 | 1.7% |
| South Eastern Asia | 102 | 1.2% |
| Southern Europe | 35 | 0.4% |
| Spain | 35 | 0.4% |
| Vietnam | 27 | 0.3% |
| Western Asia | 29 | 0.4% |
| Western Europe | 29 | 0.4% | View All 38 Rows |
Sex and Age in West Haven Sylvan
Sex and Age in West Haven Sylvan
The most populous age groups in West Haven Sylvan are 20 to 24 Years (556 | 13.9%) for men and 25 to 29 Years (527 | 12.0%) for women.
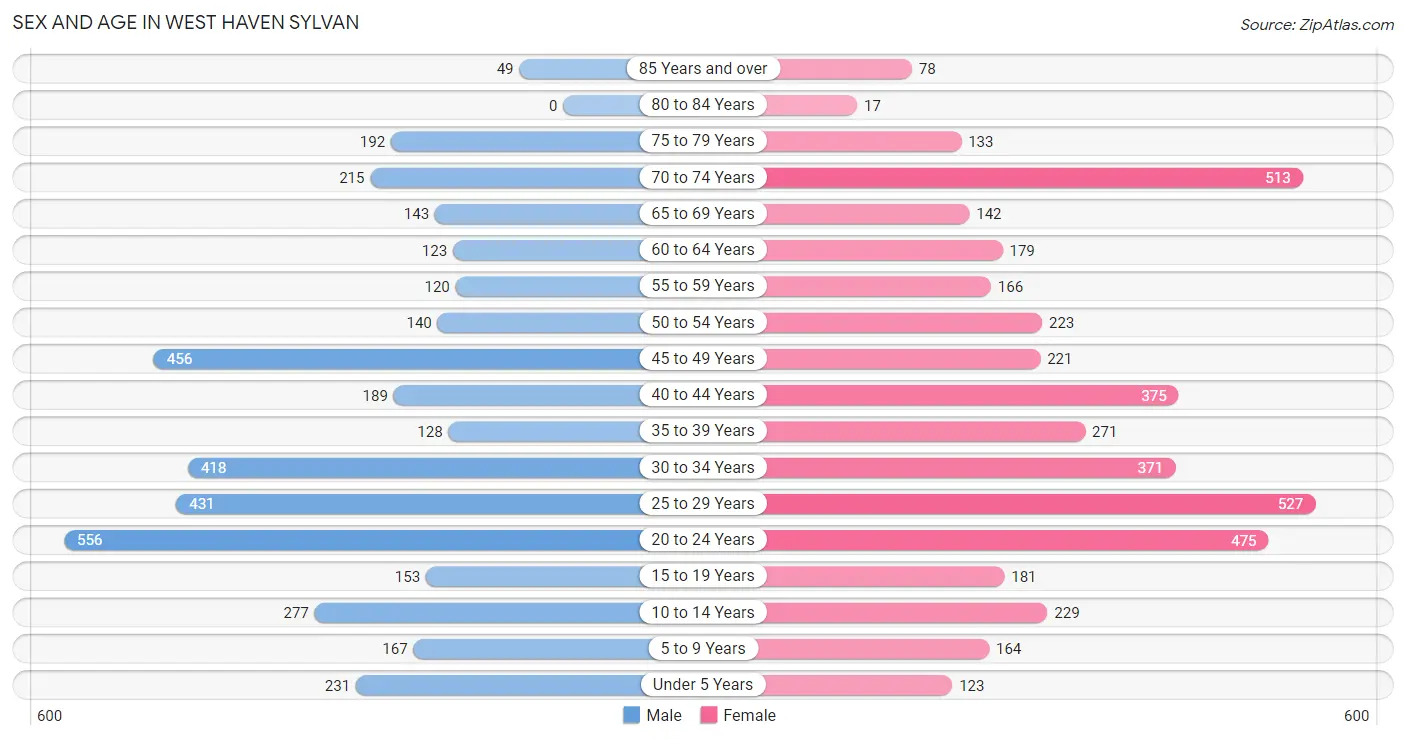
| Age Bracket | Male | Female |
| Under 5 Years | 231 (5.8%) | 123 (2.8%) |
| 5 to 9 Years | 167 (4.2%) | 164 (3.7%) |
| 10 to 14 Years | 277 (7.0%) | 229 (5.2%) |
| 15 to 19 Years | 153 (3.8%) | 181 (4.1%) |
| 20 to 24 Years | 556 (13.9%) | 475 (10.8%) |
| 25 to 29 Years | 431 (10.8%) | 527 (12.0%) |
| 30 to 34 Years | 418 (10.5%) | 371 (8.5%) |
| 35 to 39 Years | 128 (3.2%) | 271 (6.2%) |
| 40 to 44 Years | 189 (4.7%) | 375 (8.6%) |
| 45 to 49 Years | 456 (11.4%) | 221 (5.0%) |
| 50 to 54 Years | 140 (3.5%) | 223 (5.1%) |
| 55 to 59 Years | 120 (3.0%) | 166 (3.8%) |
| 60 to 64 Years | 123 (3.1%) | 179 (4.1%) |
| 65 to 69 Years | 143 (3.6%) | 142 (3.2%) |
| 70 to 74 Years | 215 (5.4%) | 513 (11.7%) |
| 75 to 79 Years | 192 (4.8%) | 133 (3.0%) |
| 80 to 84 Years | 0 (0.0%) | 17 (0.4%) |
| 85 Years and over | 49 (1.2%) | 78 (1.8%) |
| Total | 3,988 (100.0%) | 4,388 (100.0%) |
Families and Households in West Haven Sylvan
Median Family Size in West Haven Sylvan
The median family size in West Haven Sylvan is 2.66 persons per family, with married-couple families (1,916 | 84.3%) accounting for the largest median family size of 2.74 persons per family. On the other hand, single male/father families (39 | 1.7%) represent the smallest median family size with 2.23 persons per family.
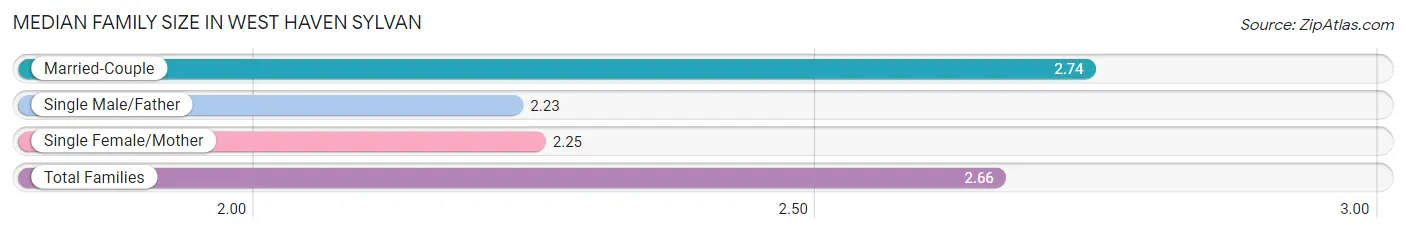
| Family Type | # Families | Family Size |
| Married-Couple | 1,916 (84.3%) | 2.74 |
| Single Male/Father | 39 (1.7%) | 2.23 |
| Single Female/Mother | 318 (14.0%) | 2.25 |
| Total Families | 2,273 (100.0%) | 2.66 |
Median Household Size in West Haven Sylvan
The median household size in West Haven Sylvan is 2.12 persons per household, with married-couple households (1,916 | 48.9%) accounting for the largest median household size of 2.74 persons per household. non-family households (1,644 | 42.0%) represent the smallest median household size with 1.36 persons per household.
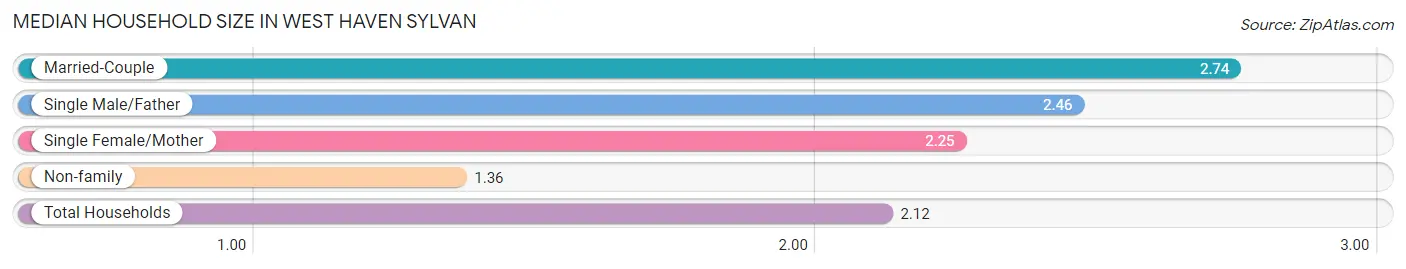
| Household Type | # Households | Household Size |
| Married-Couple | 1,916 (48.9%) | 2.74 |
| Single Male/Father | 39 (1.0%) | 2.46 |
| Single Female/Mother | 318 (8.1%) | 2.25 |
| Non-family | 1,644 (42.0%) | 1.36 |
| Total Households | 3,917 (100.0%) | 2.12 |
Household Size by Marriage Status in West Haven Sylvan
Out of a total of 3,917 households in West Haven Sylvan, 2,273 (58.0%) are family households, while 1,644 (42.0%) are nonfamily households. The most numerous type of family households are 2-person households, comprising 1,407, and the most common type of nonfamily households are 1-person households, comprising 1,271.
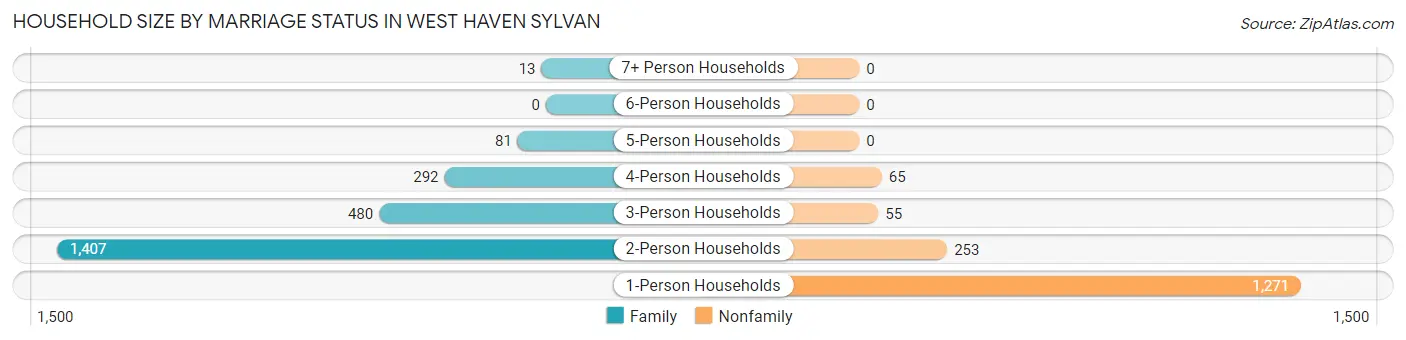
| Household Size | Family Households | Nonfamily Households |
| 1-Person Households | - | 1,271 (32.5%) |
| 2-Person Households | 1,407 (35.9%) | 253 (6.5%) |
| 3-Person Households | 480 (12.2%) | 55 (1.4%) |
| 4-Person Households | 292 (7.4%) | 65 (1.7%) |
| 5-Person Households | 81 (2.1%) | 0 (0.0%) |
| 6-Person Households | 0 (0.0%) | 0 (0.0%) |
| 7+ Person Households | 13 (0.3%) | 0 (0.0%) |
| Total | 2,273 (58.0%) | 1,644 (42.0%) |
Female Fertility in West Haven Sylvan
Fertility by Age in West Haven Sylvan
Average fertility rate in West Haven Sylvan is 43.0 births per 1,000 women. Women in the age bracket of 35 to 50 years have the highest fertility rate with 55.0 births per 1,000 women. Women in the age bracket of 20 to 34 years acount for 52.3% of all women with births.
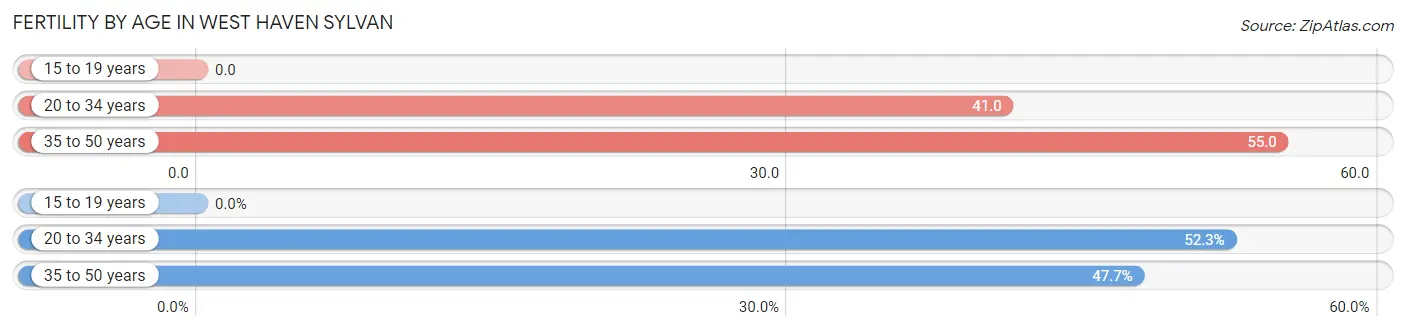
| Age Bracket | Women with Births | Births / 1,000 Women |
| 15 to 19 years | 0 (0.0%) | 0.0 |
| 20 to 34 years | 56 (52.3%) | 41.0 |
| 35 to 50 years | 51 (47.7%) | 55.0 |
| Total | 107 (100.0%) | 43.0 |
Fertility by Age by Marriage Status in West Haven Sylvan
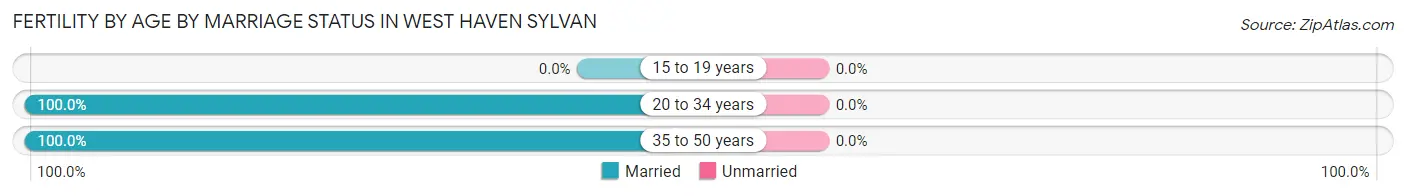
| Age Bracket | Married | Unmarried |
| 15 to 19 years | 0 (0.0%) | 0 (0.0%) |
| 20 to 34 years | 56 (100.0%) | 0 (0.0%) |
| 35 to 50 years | 51 (100.0%) | 0 (0.0%) |
| Total | 107 (100.0%) | 0 (0.0%) |
Fertility by Education in West Haven Sylvan
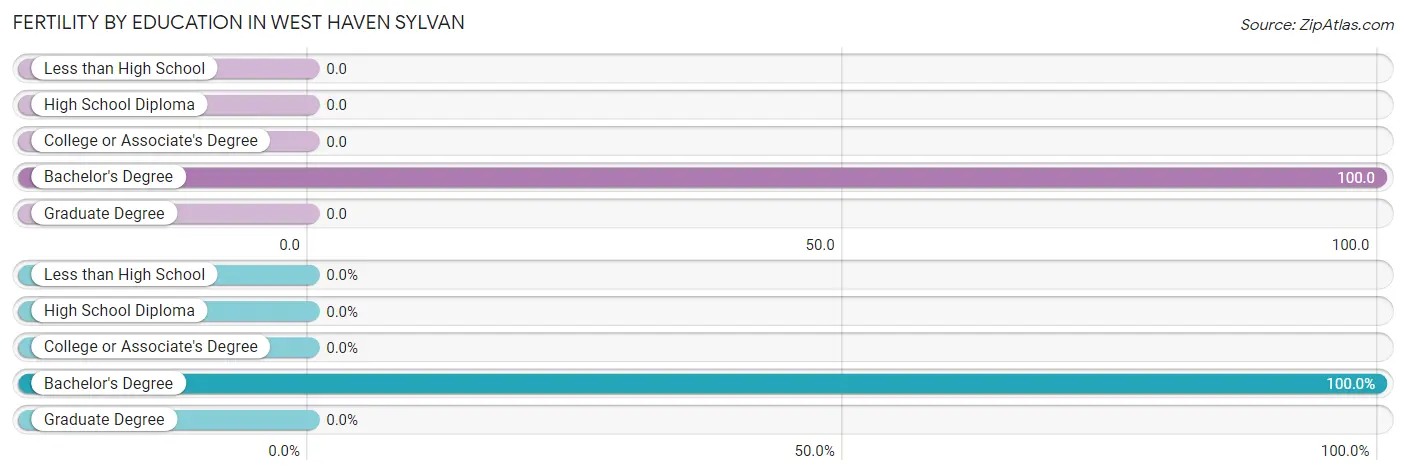
| Educational Attainment | Women with Births | Births / 1,000 Women |
| Less than High School | 0 (0.0%) | 0.0 |
| High School Diploma | 0 (0.0%) | 0.0 |
| College or Associate's Degree | 0 (0.0%) | 0.0 |
| Bachelor's Degree | 107 (100.0%) | 100.0 |
| Graduate Degree | 0 (0.0%) | 0.0 |
| Total | 107 (100.0%) | 43.0 |
Fertility by Education by Marriage Status in West Haven Sylvan
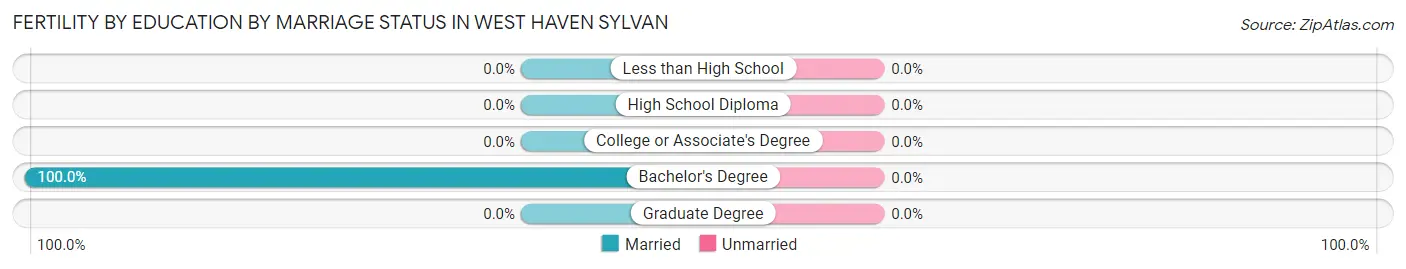
| Educational Attainment | Married | Unmarried |
| Less than High School | 0 (0.0%) | 0 (0.0%) |
| High School Diploma | 0 (0.0%) | 0 (0.0%) |
| College or Associate's Degree | 0 (0.0%) | 0 (0.0%) |
| Bachelor's Degree | 107 (100.0%) | 0 (0.0%) |
| Graduate Degree | 0 (0.0%) | 0 (0.0%) |
| Total | 107 (100.0%) | 0 (0.0%) |
Employment Characteristics in West Haven Sylvan
Employment by Class of Employer in West Haven Sylvan
Among the 4,778 employed individuals in West Haven Sylvan, private company employees (3,234 | 67.7%), not-for-profit organizations (539 | 11.3%), and state government employees (401 | 8.4%) make up the most common classes of employment.
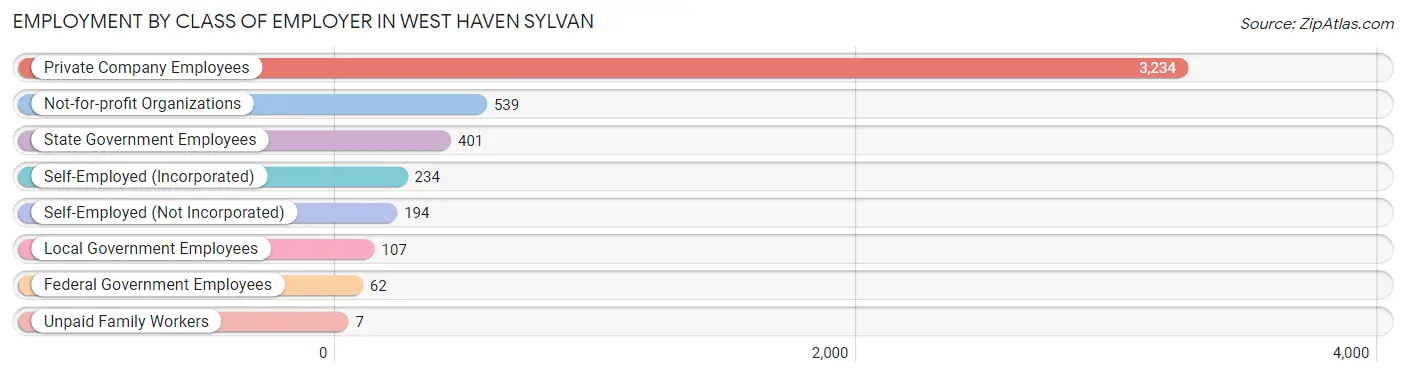
| Employer Class | # Employees | % Employees |
| Private Company Employees | 3,234 | 67.7% |
| Self-Employed (Incorporated) | 234 | 4.9% |
| Self-Employed (Not Incorporated) | 194 | 4.1% |
| Not-for-profit Organizations | 539 | 11.3% |
| Local Government Employees | 107 | 2.2% |
| State Government Employees | 401 | 8.4% |
| Federal Government Employees | 62 | 1.3% |
| Unpaid Family Workers | 7 | 0.2% |
| Total | 4,778 | 100.0% |
Employment Status by Age in West Haven Sylvan
According to the labor force statistics for West Haven Sylvan, out of the total population over 16 years of age (7,112), 72.2% or 5,135 individuals are in the labor force, with 3.9% or 200 of them unemployed. The age group with the highest labor force participation rate is 45 to 54 years, with 93.2% or 969 individuals in the labor force. Within the labor force, the 20 to 24 years age range has the highest percentage of unemployed individuals, with 14.1% or 135 of them being unemployed.
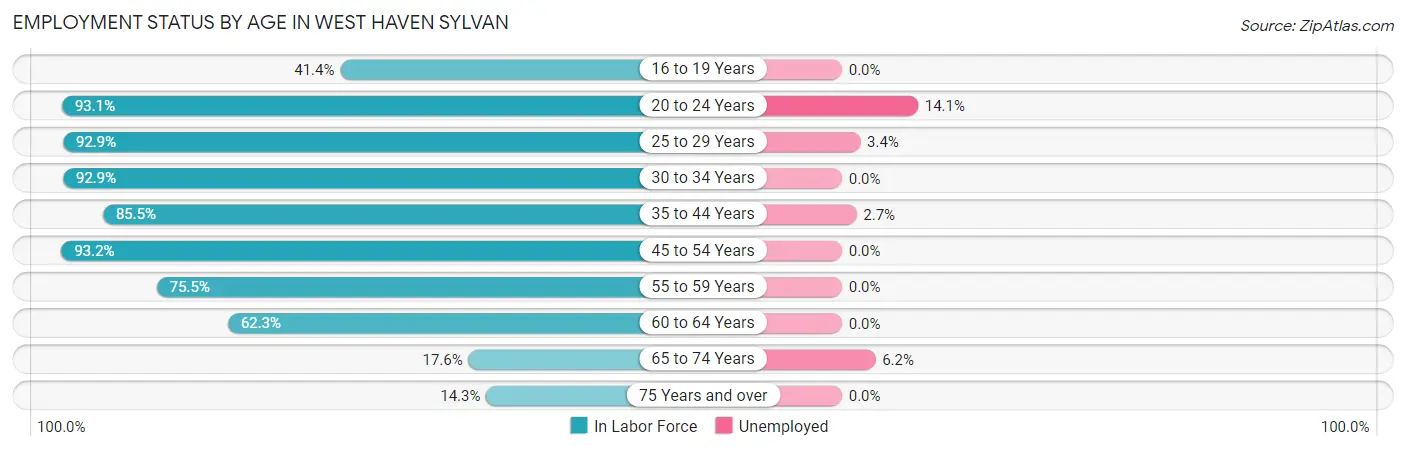
| Age Bracket | In Labor Force | Unemployed |
| 16 to 19 Years | 108 (41.4%) | 0 (0.0%) |
| 20 to 24 Years | 960 (93.1%) | 135 (14.1%) |
| 25 to 29 Years | 890 (92.9%) | 30 (3.4%) |
| 30 to 34 Years | 733 (92.9%) | 0 (0.0%) |
| 35 to 44 Years | 823 (85.5%) | 22 (2.7%) |
| 45 to 54 Years | 969 (93.2%) | 0 (0.0%) |
| 55 to 59 Years | 216 (75.5%) | 0 (0.0%) |
| 60 to 64 Years | 188 (62.3%) | 0 (0.0%) |
| 65 to 74 Years | 178 (17.6%) | 11 (6.2%) |
| 75 Years and over | 67 (14.3%) | 0 (0.0%) |
| Total | 5,135 (72.2%) | 200 (3.9%) |
Employment Status by Educational Attainment in West Haven Sylvan
According to labor force statistics for West Haven Sylvan, 88.0% of individuals (3,817) out of the total population between 25 and 64 years of age (4,338) are in the labor force, with 1.4% or 53 of them being unemployed. The group with the highest labor force participation rate are those with the educational attainment of college / associate degree, with 93.0% or 950 individuals in the labor force. Within the labor force, individuals with college / associate degree education have the highest percentage of unemployment, with 3.8% or 36 of them being unemployed.
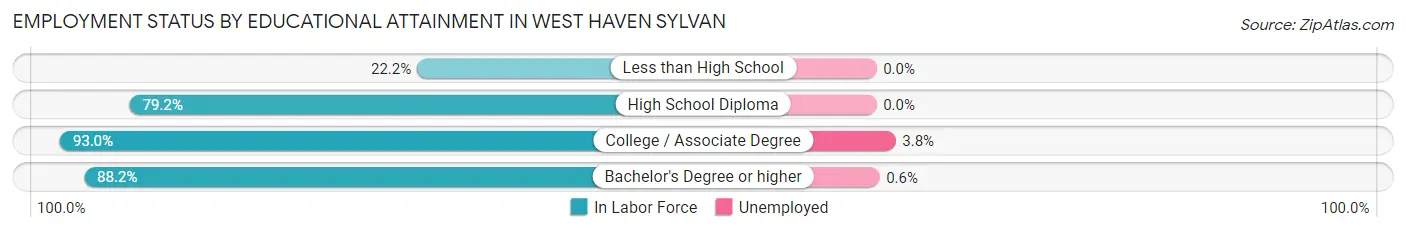
| Educational Attainment | In Labor Force | Unemployed |
| Less than High School | 12 (22.2%) | 0 (0.0%) |
| High School Diploma | 179 (79.2%) | 0 (0.0%) |
| College / Associate Degree | 950 (93.0%) | 39 (3.8%) |
| Bachelor's Degree or higher | 2,678 (88.2%) | 18 (0.6%) |
| Total | 3,817 (88.0%) | 61 (1.4%) |
Employment Occupations by Sex in West Haven Sylvan
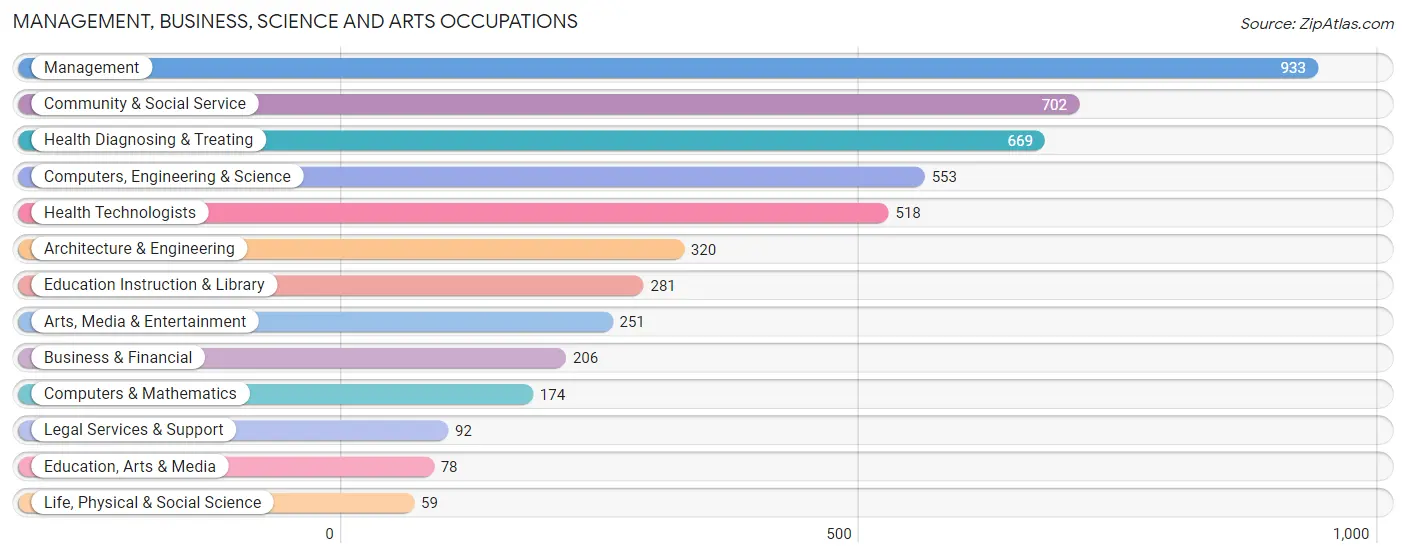
Management, Business, Science and Arts Occupations
The most common Management, Business, Science and Arts occupations in West Haven Sylvan are Management (933 | 18.9%), Community & Social Service (702 | 14.2%), Health Diagnosing & Treating (669 | 13.6%), Computers, Engineering & Science (553 | 11.2%), and Health Technologists (518 | 10.5%).
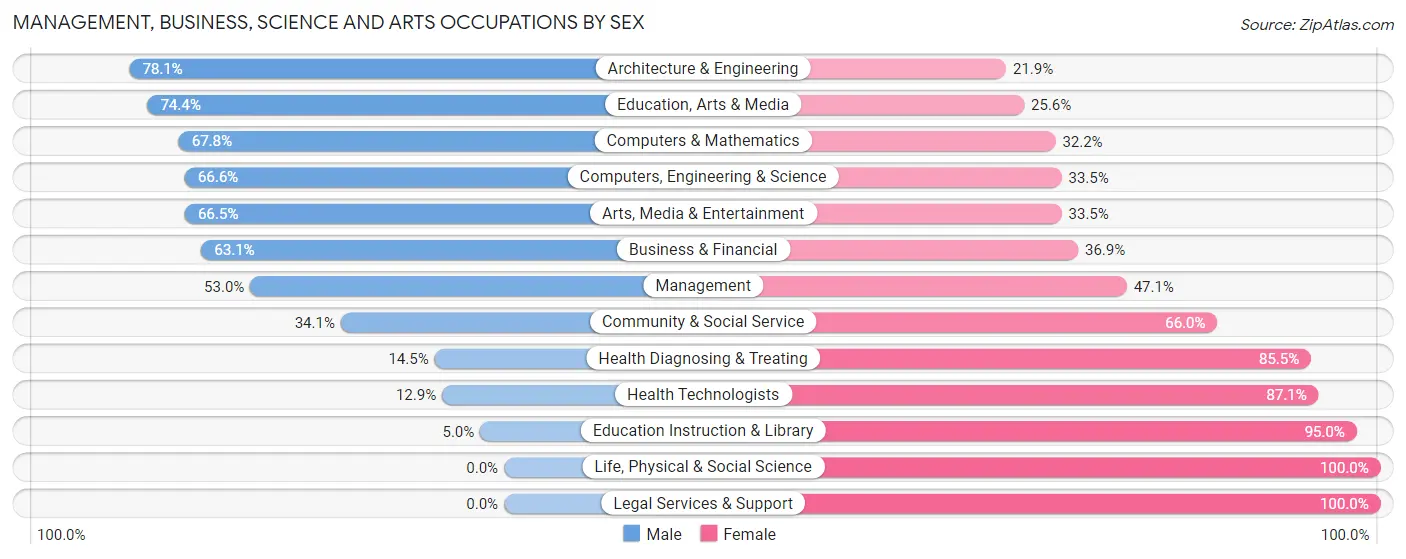
Management, Business, Science and Arts Occupations by Sex
Within the Management, Business, Science and Arts occupations in West Haven Sylvan, the most male-oriented occupations are Architecture & Engineering (78.1%), Education, Arts & Media (74.4%), and Computers & Mathematics (67.8%), while the most female-oriented occupations are Life, Physical & Social Science (100.0%), Legal Services & Support (100.0%), and Education Instruction & Library (95.0%).
| Occupation | Male | Female |
| Management | 494 (52.9%) | 439 (47.0%) |
| Business & Financial | 130 (63.1%) | 76 (36.9%) |
| Computers, Engineering & Science | 368 (66.5%) | 185 (33.5%) |
| Computers & Mathematics | 118 (67.8%) | 56 (32.2%) |
| Architecture & Engineering | 250 (78.1%) | 70 (21.9%) |
| Life, Physical & Social Science | 0 (0.0%) | 59 (100.0%) |
| Community & Social Service | 239 (34.1%) | 463 (65.9%) |
| Education, Arts & Media | 58 (74.4%) | 20 (25.6%) |
| Legal Services & Support | 0 (0.0%) | 92 (100.0%) |
| Education Instruction & Library | 14 (5.0%) | 267 (95.0%) |
| Arts, Media & Entertainment | 167 (66.5%) | 84 (33.5%) |
| Health Diagnosing & Treating | 97 (14.5%) | 572 (85.5%) |
| Health Technologists | 67 (12.9%) | 451 (87.1%) |
| Total (Category) | 1,328 (43.4%) | 1,735 (56.6%) |
| Total (Overall) | 2,497 (50.6%) | 2,437 (49.4%) |
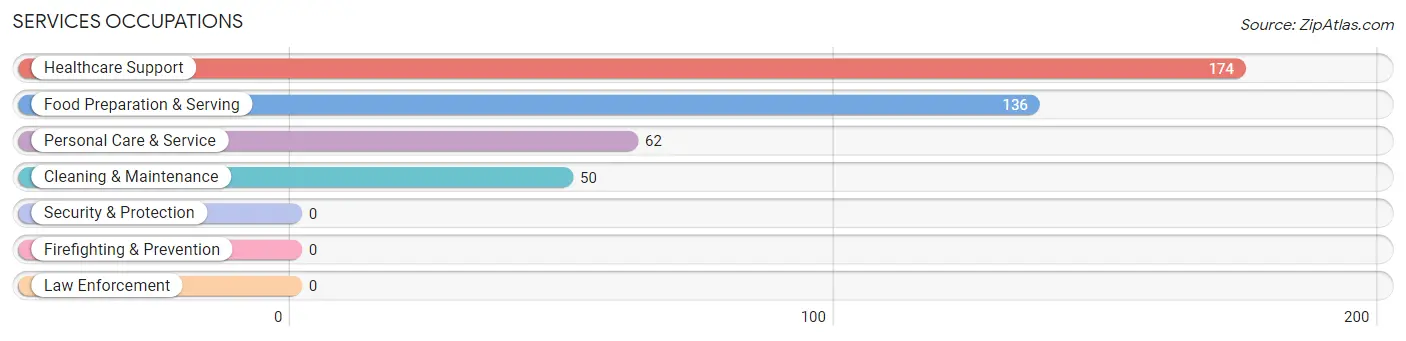
Services Occupations
The most common Services occupations in West Haven Sylvan are Healthcare Support (174 | 3.5%), Food Preparation & Serving (136 | 2.8%), Personal Care & Service (62 | 1.3%), and Cleaning & Maintenance (50 | 1.0%).
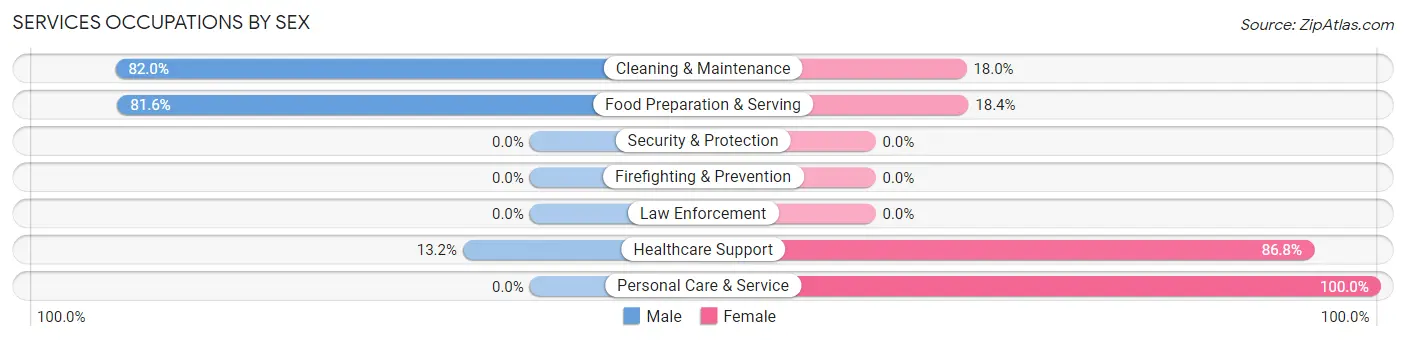
Services Occupations by Sex
Within the Services occupations in West Haven Sylvan, the most male-oriented occupations are Cleaning & Maintenance (82.0%), Food Preparation & Serving (81.6%), and Healthcare Support (13.2%), while the most female-oriented occupations are Personal Care & Service (100.0%), Healthcare Support (86.8%), and Food Preparation & Serving (18.4%).
| Occupation | Male | Female |
| Healthcare Support | 23 (13.2%) | 151 (86.8%) |
| Security & Protection | 0 (0.0%) | 0 (0.0%) |
| Firefighting & Prevention | 0 (0.0%) | 0 (0.0%) |
| Law Enforcement | 0 (0.0%) | 0 (0.0%) |
| Food Preparation & Serving | 111 (81.6%) | 25 (18.4%) |
| Cleaning & Maintenance | 41 (82.0%) | 9 (18.0%) |
| Personal Care & Service | 0 (0.0%) | 62 (100.0%) |
| Total (Category) | 175 (41.5%) | 247 (58.5%) |
| Total (Overall) | 2,497 (50.6%) | 2,437 (49.4%) |
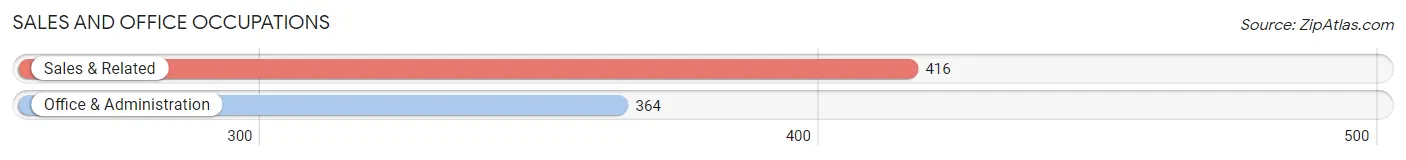
Sales and Office Occupations
The most common Sales and Office occupations in West Haven Sylvan are Sales & Related (416 | 8.4%), and Office & Administration (364 | 7.4%).
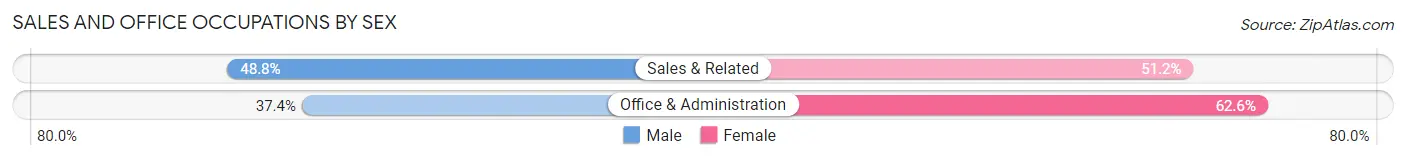
Sales and Office Occupations by Sex
| Occupation | Male | Female |
| Sales & Related | 203 (48.8%) | 213 (51.2%) |
| Office & Administration | 136 (37.4%) | 228 (62.6%) |
| Total (Category) | 339 (43.5%) | 441 (56.5%) |
| Total (Overall) | 2,497 (50.6%) | 2,437 (49.4%) |
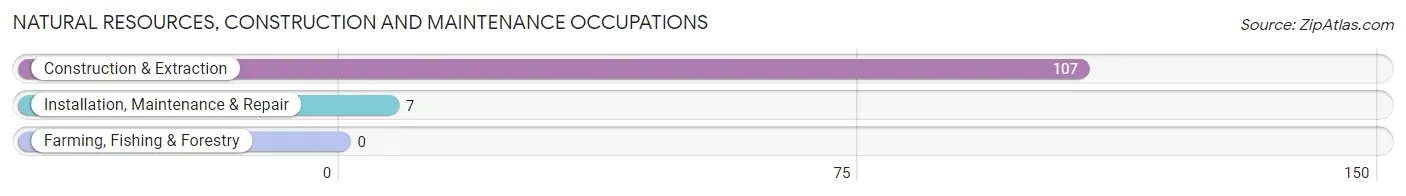
Natural Resources, Construction and Maintenance Occupations
The most common Natural Resources, Construction and Maintenance occupations in West Haven Sylvan are Construction & Extraction (107 | 2.2%), and Installation, Maintenance & Repair (7 | 0.1%).
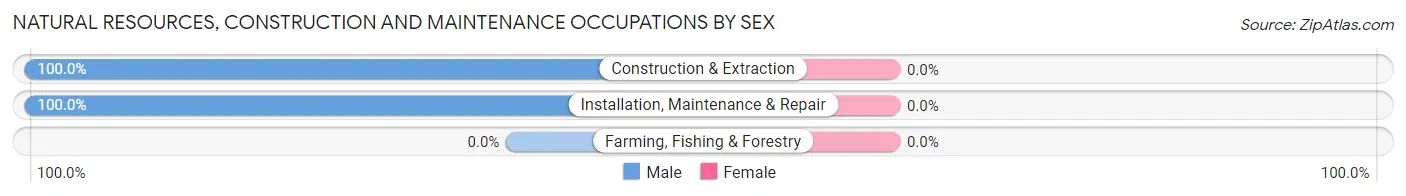
Natural Resources, Construction and Maintenance Occupations by Sex
| Occupation | Male | Female |
| Farming, Fishing & Forestry | 0 (0.0%) | 0 (0.0%) |
| Construction & Extraction | 107 (100.0%) | 0 (0.0%) |
| Installation, Maintenance & Repair | 7 (100.0%) | 0 (0.0%) |
| Total (Category) | 114 (100.0%) | 0 (0.0%) |
| Total (Overall) | 2,497 (50.6%) | 2,437 (49.4%) |
Production, Transportation and Moving Occupations
The most common Production, Transportation and Moving occupations in West Haven Sylvan are Production (222 | 4.5%), Material Moving (209 | 4.2%), and Transportation (124 | 2.5%).
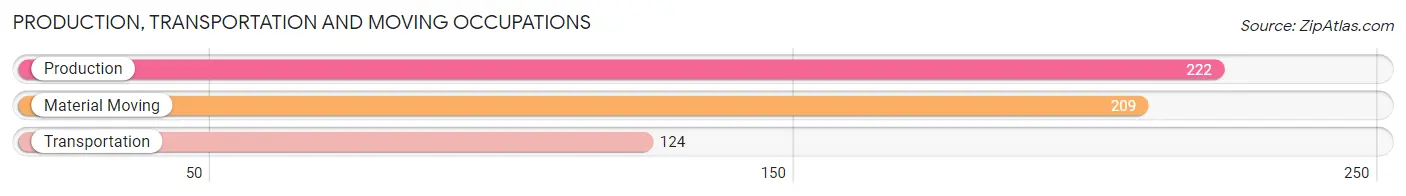
Production, Transportation and Moving Occupations by Sex
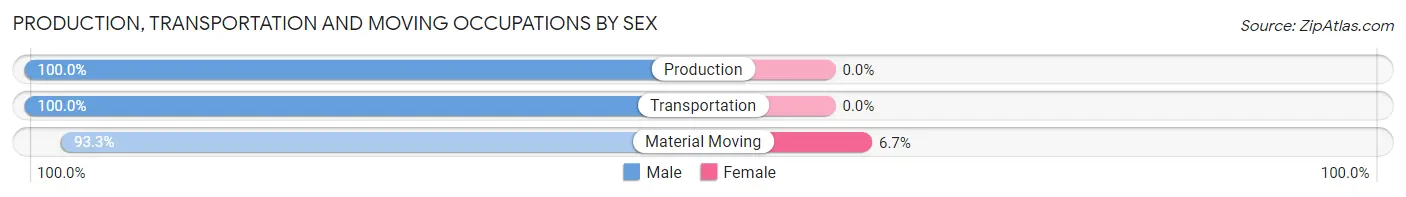
| Occupation | Male | Female |
| Production | 222 (100.0%) | 0 (0.0%) |
| Transportation | 124 (100.0%) | 0 (0.0%) |
| Material Moving | 195 (93.3%) | 14 (6.7%) |
| Total (Category) | 541 (97.5%) | 14 (2.5%) |
| Total (Overall) | 2,497 (50.6%) | 2,437 (49.4%) |
Employment Industries by Sex in West Haven Sylvan
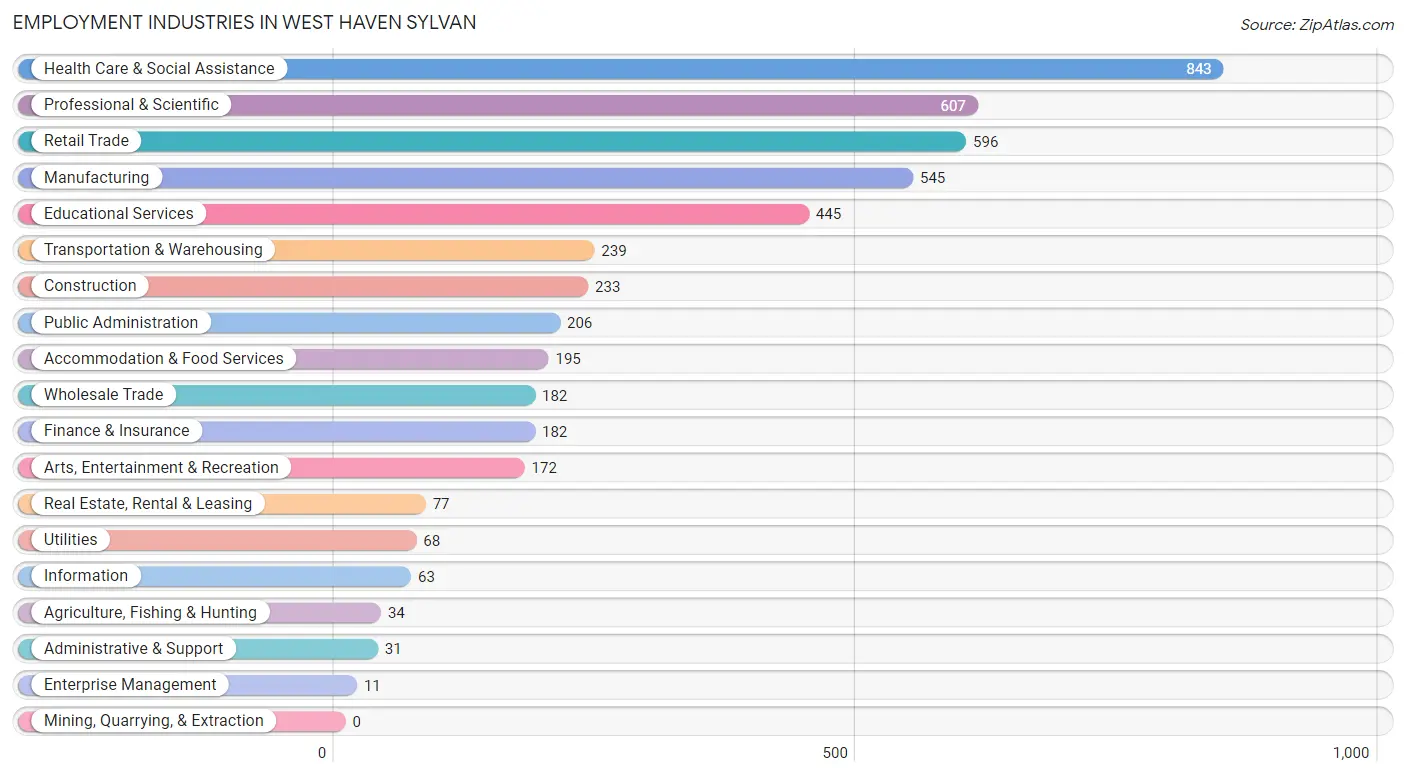
Employment Industries in West Haven Sylvan
The major employment industries in West Haven Sylvan include Health Care & Social Assistance (843 | 17.1%), Professional & Scientific (607 | 12.3%), Retail Trade (596 | 12.1%), Manufacturing (545 | 11.1%), and Educational Services (445 | 9.0%).
Employment Industries by Sex in West Haven Sylvan
The West Haven Sylvan industries that see more men than women are Utilities (100.0%), Enterprise Management (100.0%), and Construction (85.0%), whereas the industries that tend to have a higher number of women are Agriculture, Fishing & Hunting (100.0%), Health Care & Social Assistance (89.0%), and Real Estate, Rental & Leasing (77.9%).
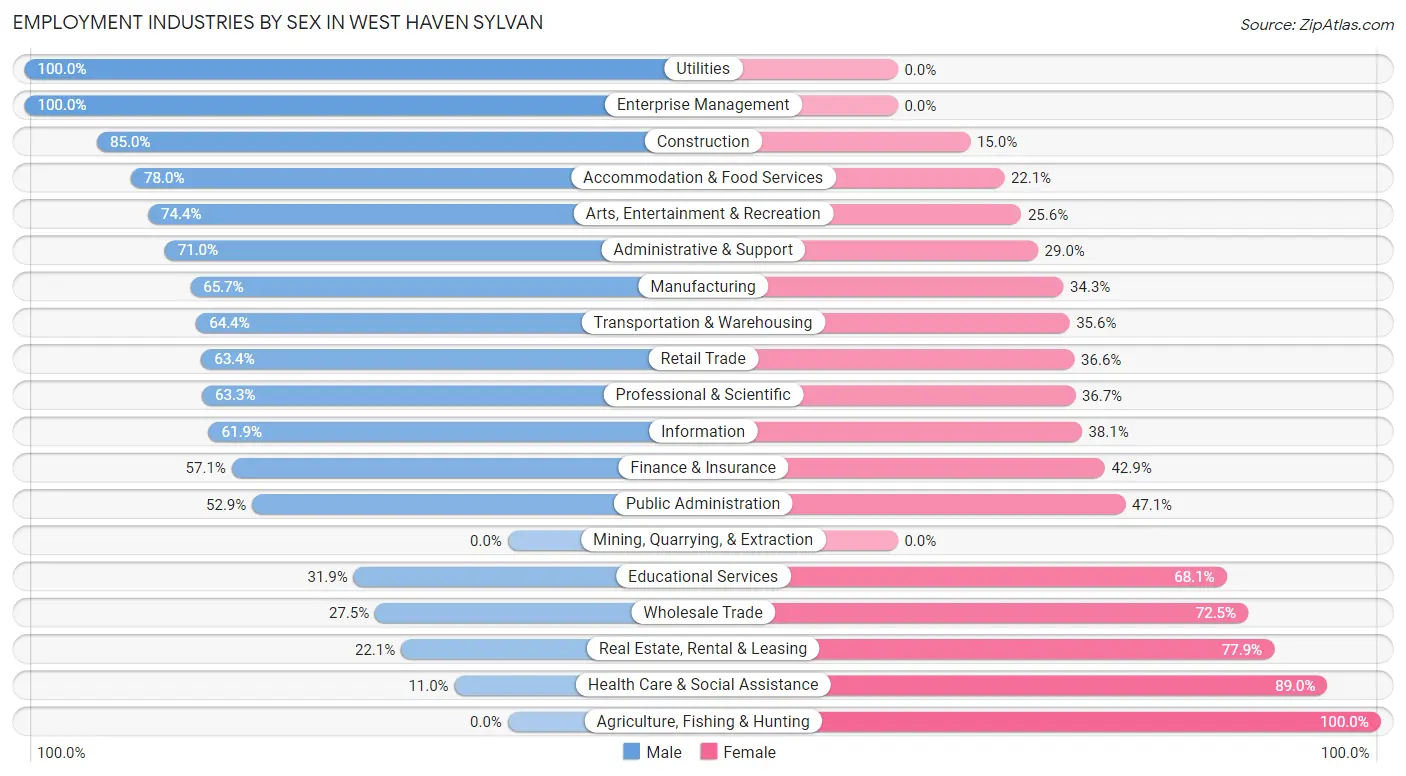
| Industry | Male | Female |
| Agriculture, Fishing & Hunting | 0 (0.0%) | 34 (100.0%) |
| Mining, Quarrying, & Extraction | 0 (0.0%) | 0 (0.0%) |
| Construction | 198 (85.0%) | 35 (15.0%) |
| Manufacturing | 358 (65.7%) | 187 (34.3%) |
| Wholesale Trade | 50 (27.5%) | 132 (72.5%) |
| Retail Trade | 378 (63.4%) | 218 (36.6%) |
| Transportation & Warehousing | 154 (64.4%) | 85 (35.6%) |
| Utilities | 68 (100.0%) | 0 (0.0%) |
| Information | 39 (61.9%) | 24 (38.1%) |
| Finance & Insurance | 104 (57.1%) | 78 (42.9%) |
| Real Estate, Rental & Leasing | 17 (22.1%) | 60 (77.9%) |
| Professional & Scientific | 384 (63.3%) | 223 (36.7%) |
| Enterprise Management | 11 (100.0%) | 0 (0.0%) |
| Administrative & Support | 22 (71.0%) | 9 (29.0%) |
| Educational Services | 142 (31.9%) | 303 (68.1%) |
| Health Care & Social Assistance | 93 (11.0%) | 750 (89.0%) |
| Arts, Entertainment & Recreation | 128 (74.4%) | 44 (25.6%) |
| Accommodation & Food Services | 152 (77.9%) | 43 (22.1%) |
| Public Administration | 109 (52.9%) | 97 (47.1%) |
| Total | 2,497 (50.6%) | 2,437 (49.4%) |
Education in West Haven Sylvan
School Enrollment in West Haven Sylvan
The most common levels of schooling among the 1,944 students in West Haven Sylvan are middle school (457 | 23.5%), college / undergraduate (421 | 21.7%), and high school (374 | 19.2%).
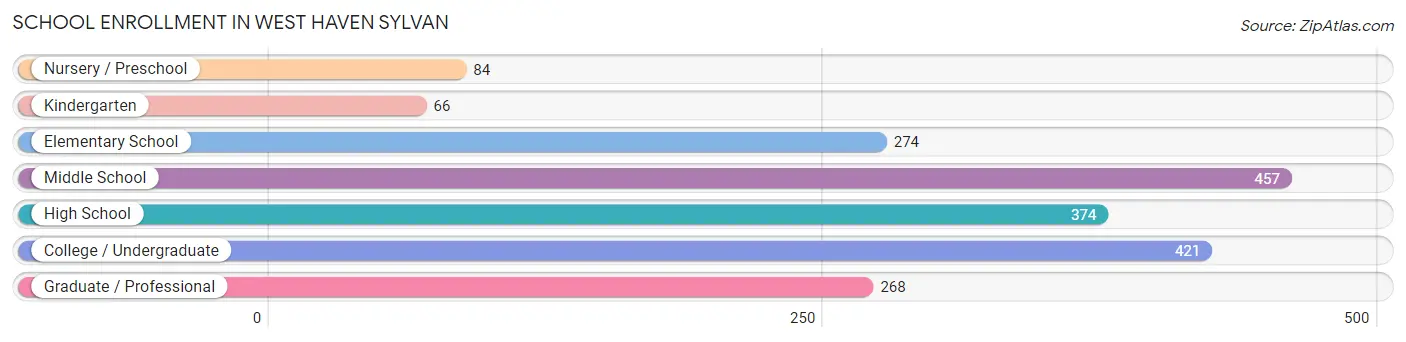
| School Level | # Students | % Students |
| Nursery / Preschool | 84 | 4.3% |
| Kindergarten | 66 | 3.4% |
| Elementary School | 274 | 14.1% |
| Middle School | 457 | 23.5% |
| High School | 374 | 19.2% |
| College / Undergraduate | 421 | 21.7% |
| Graduate / Professional | 268 | 13.8% |
| Total | 1,944 | 100.0% |
School Enrollment by Age by Funding Source in West Haven Sylvan
Out of a total of 1,944 students who are enrolled in schools in West Haven Sylvan, 375 (19.3%) attend a private institution, while the remaining 1,569 (80.7%) are enrolled in public schools. The age group of 3 to 4 year olds has the highest likelihood of being enrolled in private schools, with 56 (82.4% in the age bracket) enrolled. Conversely, the age group of 35 years and over has the lowest likelihood of being enrolled in a private school, with 168 (100.0% in the age bracket) attending a public institution.
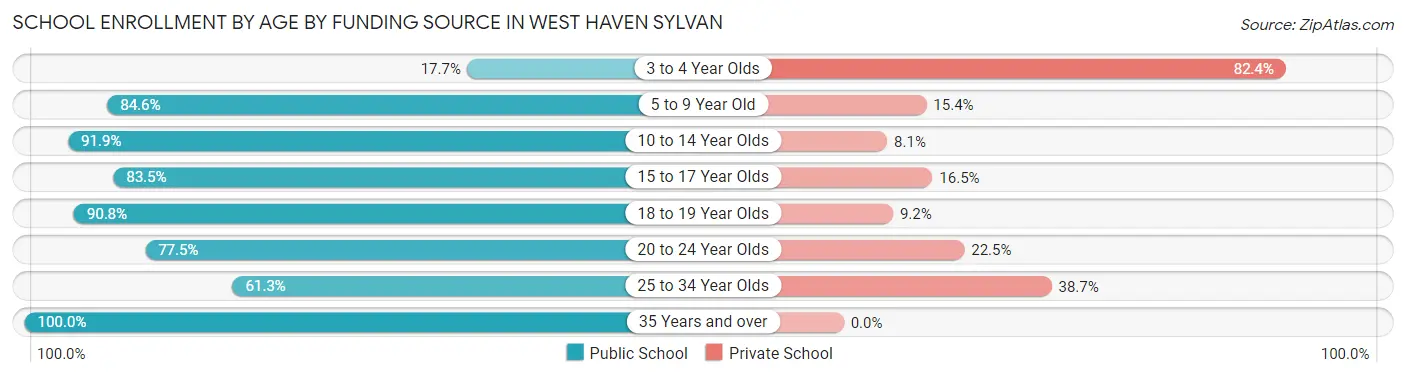
| Age Bracket | Public School | Private School |
| 3 to 4 Year Olds | 12 (17.6%) | 56 (82.4%) |
| 5 to 9 Year Old | 280 (84.6%) | 51 (15.4%) |
| 10 to 14 Year Olds | 465 (91.9%) | 41 (8.1%) |
| 15 to 17 Year Olds | 197 (83.5%) | 39 (16.5%) |
| 18 to 19 Year Olds | 89 (90.8%) | 9 (9.2%) |
| 20 to 24 Year Olds | 138 (77.5%) | 40 (22.5%) |
| 25 to 34 Year Olds | 220 (61.3%) | 139 (38.7%) |
| 35 Years and over | 168 (100.0%) | 0 (0.0%) |
| Total | 1,569 (80.7%) | 375 (19.3%) |
Educational Attainment by Field of Study in West Haven Sylvan
Business (873 | 20.8%), engineering (511 | 12.2%), bio, nature & agricultural (414 | 9.9%), science & technology (392 | 9.4%), and social sciences (320 | 7.6%) are the most common fields of study among 4,190 individuals in West Haven Sylvan who have obtained a bachelor's degree or higher.

| Field of Study | # Graduates | % Graduates |
| Computers & Mathematics | 110 | 2.6% |
| Bio, Nature & Agricultural | 414 | 9.9% |
| Physical & Health Sciences | 192 | 4.6% |
| Psychology | 161 | 3.8% |
| Social Sciences | 320 | 7.6% |
| Engineering | 511 | 12.2% |
| Multidisciplinary Studies | 124 | 3.0% |
| Science & Technology | 392 | 9.4% |
| Business | 873 | 20.8% |
| Education | 215 | 5.1% |
| Literature & Languages | 175 | 4.2% |
| Liberal Arts & History | 149 | 3.6% |
| Visual & Performing Arts | 275 | 6.6% |
| Communications | 128 | 3.0% |
| Arts & Humanities | 151 | 3.6% |
| Total | 4,190 | 100.0% |
Transportation & Commute in West Haven Sylvan
Vehicle Availability by Sex in West Haven Sylvan
The most prevalent vehicle ownership categories in West Haven Sylvan are males with 2 vehicles (1,118, accounting for 45.3%) and females with 2 vehicles (923, making up 48.4%).
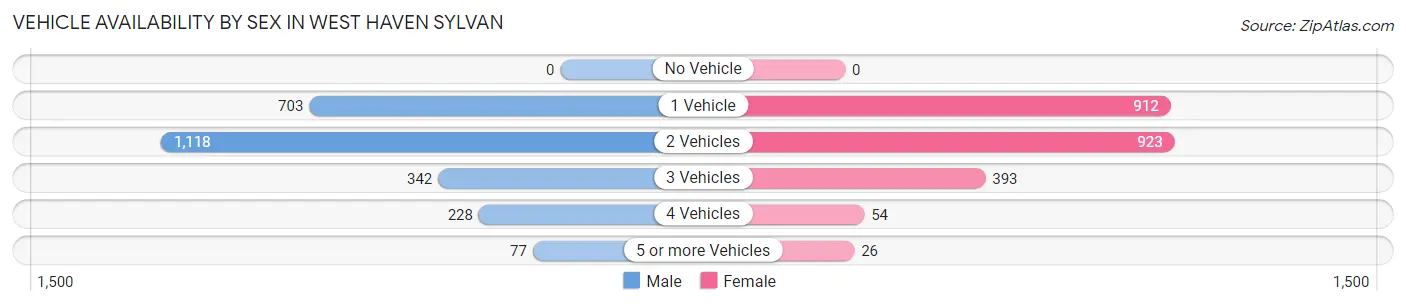
| Vehicles Available | Male | Female |
| No Vehicle | 0 (0.0%) | 0 (0.0%) |
| 1 Vehicle | 703 (28.5%) | 912 (39.5%) |
| 2 Vehicles | 1,118 (45.3%) | 923 (40.0%) |
| 3 Vehicles | 342 (13.9%) | 393 (17.0%) |
| 4 Vehicles | 228 (9.2%) | 54 (2.3%) |
| 5 or more Vehicles | 77 (3.1%) | 26 (1.1%) |
| Total | 2,468 (100.0%) | 2,308 (100.0%) |
Commute Time in West Haven Sylvan
The most frequently occuring commute durations in West Haven Sylvan are 15 to 19 minutes (843 commuters, 21.1%), 30 to 34 minutes (612 commuters, 15.3%), and 20 to 24 minutes (501 commuters, 12.6%).
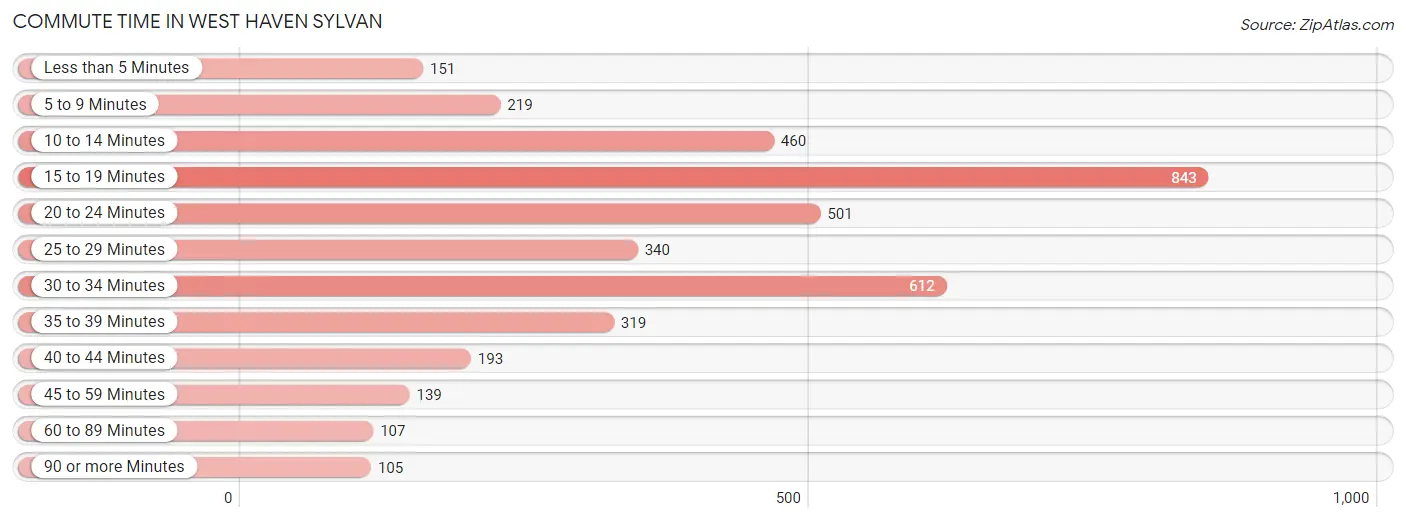
| Commute Time | # Commuters | % Commuters |
| Less than 5 Minutes | 151 | 3.8% |
| 5 to 9 Minutes | 219 | 5.5% |
| 10 to 14 Minutes | 460 | 11.5% |
| 15 to 19 Minutes | 843 | 21.1% |
| 20 to 24 Minutes | 501 | 12.6% |
| 25 to 29 Minutes | 340 | 8.5% |
| 30 to 34 Minutes | 612 | 15.3% |
| 35 to 39 Minutes | 319 | 8.0% |
| 40 to 44 Minutes | 193 | 4.8% |
| 45 to 59 Minutes | 139 | 3.5% |
| 60 to 89 Minutes | 107 | 2.7% |
| 90 or more Minutes | 105 | 2.6% |
Commute Time by Sex in West Haven Sylvan
The most common commute times in West Haven Sylvan are 30 to 34 minutes (447 commuters, 21.3%) for males and 15 to 19 minutes (590 commuters, 31.2%) for females.
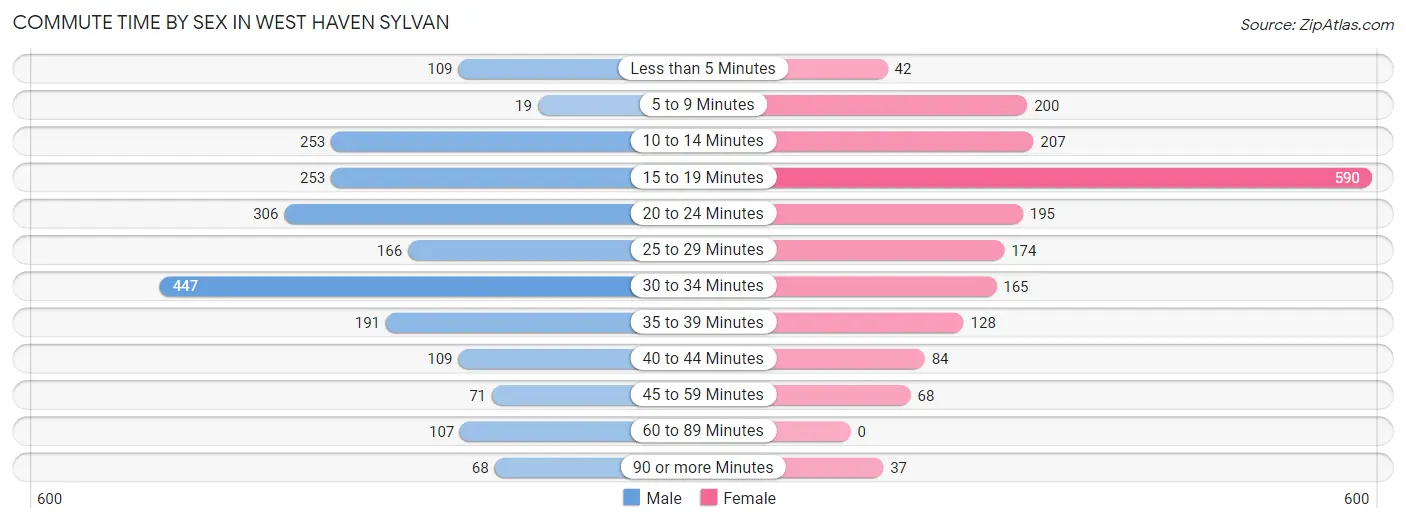
| Commute Time | Male | Female |
| Less than 5 Minutes | 109 (5.2%) | 42 (2.2%) |
| 5 to 9 Minutes | 19 (0.9%) | 200 (10.6%) |
| 10 to 14 Minutes | 253 (12.0%) | 207 (11.0%) |
| 15 to 19 Minutes | 253 (12.0%) | 590 (31.2%) |
| 20 to 24 Minutes | 306 (14.6%) | 195 (10.3%) |
| 25 to 29 Minutes | 166 (7.9%) | 174 (9.2%) |
| 30 to 34 Minutes | 447 (21.3%) | 165 (8.7%) |
| 35 to 39 Minutes | 191 (9.1%) | 128 (6.8%) |
| 40 to 44 Minutes | 109 (5.2%) | 84 (4.4%) |
| 45 to 59 Minutes | 71 (3.4%) | 68 (3.6%) |
| 60 to 89 Minutes | 107 (5.1%) | 0 (0.0%) |
| 90 or more Minutes | 68 (3.2%) | 37 (2.0%) |
Time of Departure to Work by Sex in West Haven Sylvan
The most frequent times of departure to work in West Haven Sylvan are 7:00 AM to 7:29 AM (434, 20.7%) for males and 8:00 AM to 8:29 AM (315, 16.7%) for females.
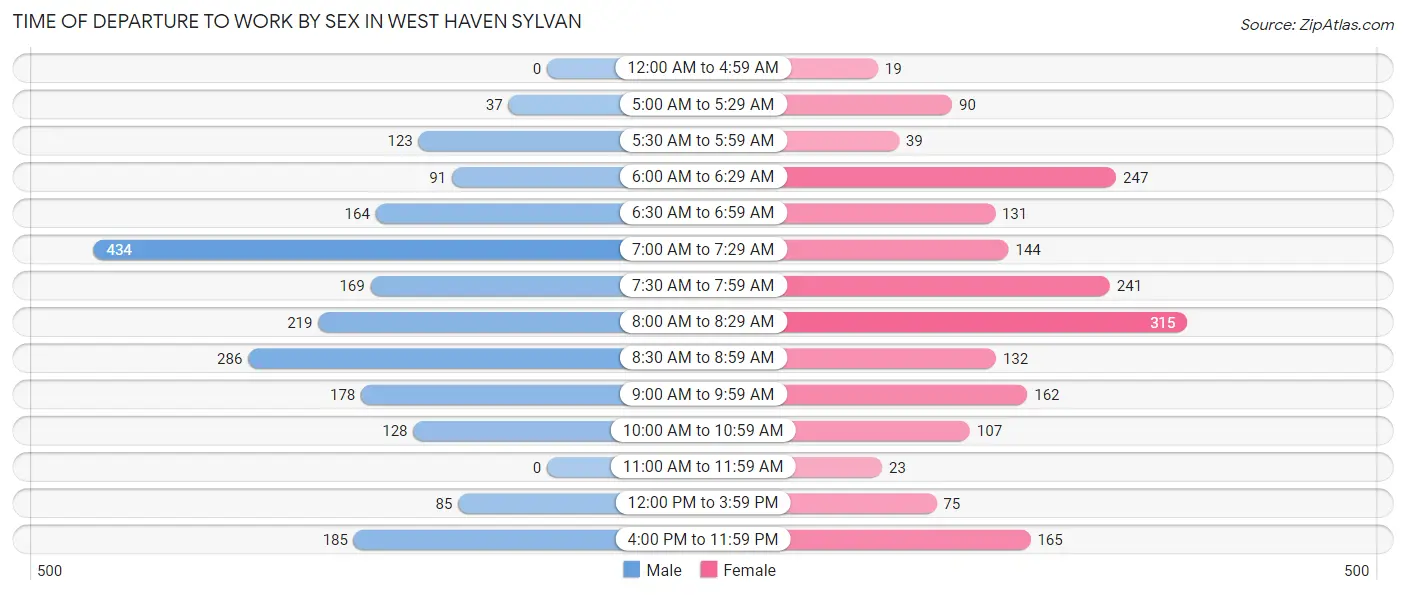
| Time of Departure | Male | Female |
| 12:00 AM to 4:59 AM | 0 (0.0%) | 19 (1.0%) |
| 5:00 AM to 5:29 AM | 37 (1.8%) | 90 (4.8%) |
| 5:30 AM to 5:59 AM | 123 (5.9%) | 39 (2.1%) |
| 6:00 AM to 6:29 AM | 91 (4.3%) | 247 (13.1%) |
| 6:30 AM to 6:59 AM | 164 (7.8%) | 131 (6.9%) |
| 7:00 AM to 7:29 AM | 434 (20.7%) | 144 (7.6%) |
| 7:30 AM to 7:59 AM | 169 (8.1%) | 241 (12.8%) |
| 8:00 AM to 8:29 AM | 219 (10.4%) | 315 (16.7%) |
| 8:30 AM to 8:59 AM | 286 (13.6%) | 132 (7.0%) |
| 9:00 AM to 9:59 AM | 178 (8.5%) | 162 (8.6%) |
| 10:00 AM to 10:59 AM | 128 (6.1%) | 107 (5.7%) |
| 11:00 AM to 11:59 AM | 0 (0.0%) | 23 (1.2%) |
| 12:00 PM to 3:59 PM | 85 (4.1%) | 75 (4.0%) |
| 4:00 PM to 11:59 PM | 185 (8.8%) | 165 (8.7%) |
| Total | 2,099 (100.0%) | 1,890 (100.0%) |
Housing Occupancy in West Haven Sylvan
Occupancy by Ownership in West Haven Sylvan
Of the total 3,917 dwellings in West Haven Sylvan, owner-occupied units account for 1,995 (50.9%), while renter-occupied units make up 1,922 (49.1%).
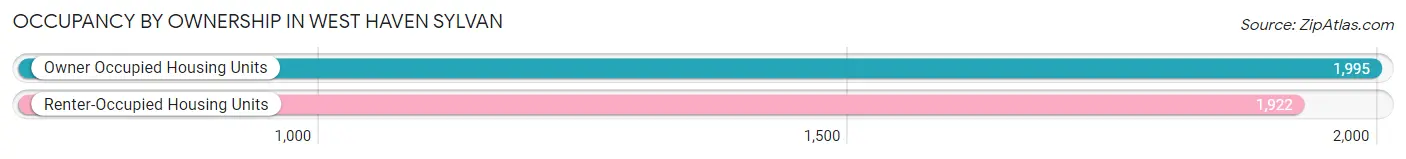
| Occupancy | # Housing Units | % Housing Units |
| Owner Occupied Housing Units | 1,995 | 50.9% |
| Renter-Occupied Housing Units | 1,922 | 49.1% |
| Total Occupied Housing Units | 3,917 | 100.0% |
Occupancy by Household Size in West Haven Sylvan
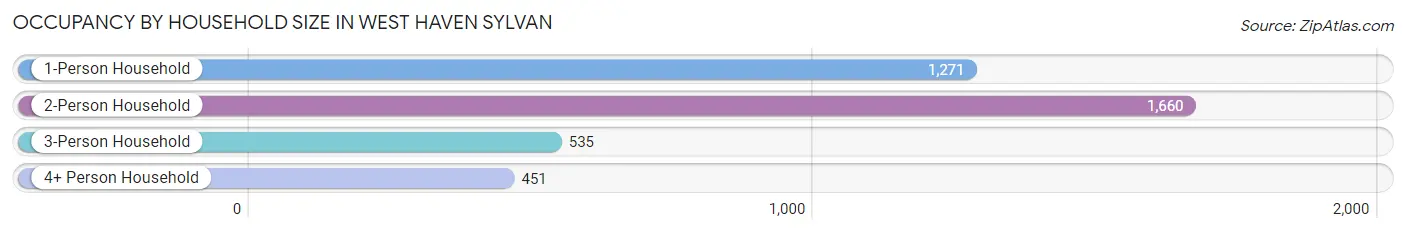
| Household Size | # Housing Units | % Housing Units |
| 1-Person Household | 1,271 | 32.5% |
| 2-Person Household | 1,660 | 42.4% |
| 3-Person Household | 535 | 13.7% |
| 4+ Person Household | 451 | 11.5% |
| Total Housing Units | 3,917 | 100.0% |
Occupancy by Ownership by Household Size in West Haven Sylvan
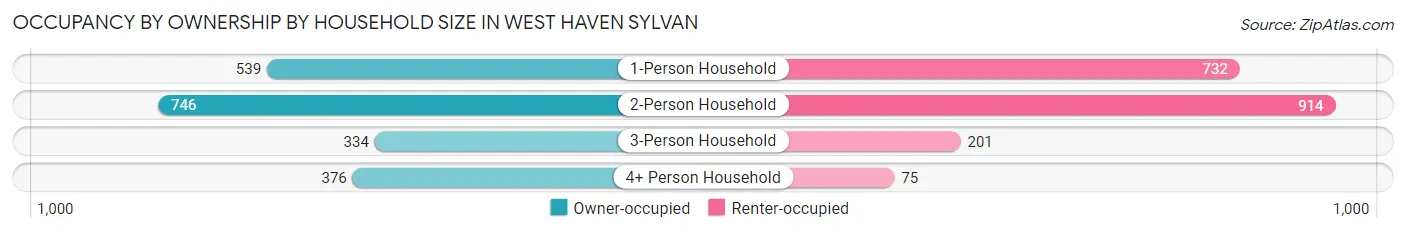
| Household Size | Owner-occupied | Renter-occupied |
| 1-Person Household | 539 (42.4%) | 732 (57.6%) |
| 2-Person Household | 746 (44.9%) | 914 (55.1%) |
| 3-Person Household | 334 (62.4%) | 201 (37.6%) |
| 4+ Person Household | 376 (83.4%) | 75 (16.6%) |
| Total Housing Units | 1,995 (50.9%) | 1,922 (49.1%) |
Occupancy by Educational Attainment in West Haven Sylvan
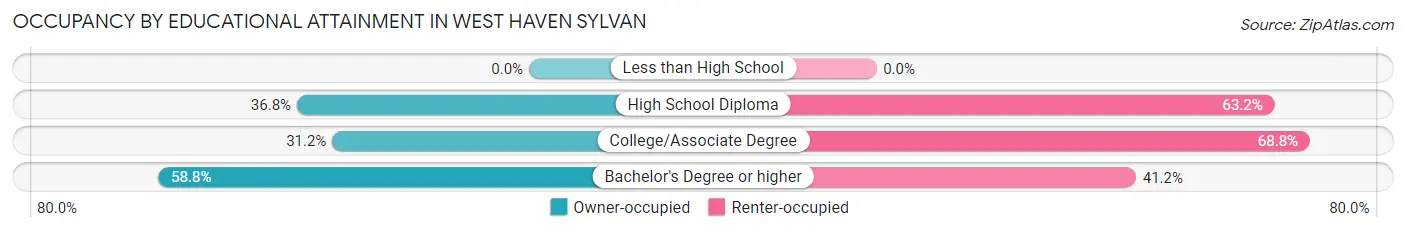
| Household Size | Owner-occupied | Renter-occupied |
| Less than High School | 0 (0.0%) | 0 (0.0%) |
| High School Diploma | 67 (36.8%) | 115 (63.2%) |
| College/Associate Degree | 304 (31.2%) | 670 (68.8%) |
| Bachelor's Degree or higher | 1,624 (58.8%) | 1,137 (41.2%) |
Occupancy by Age of Householder in West Haven Sylvan
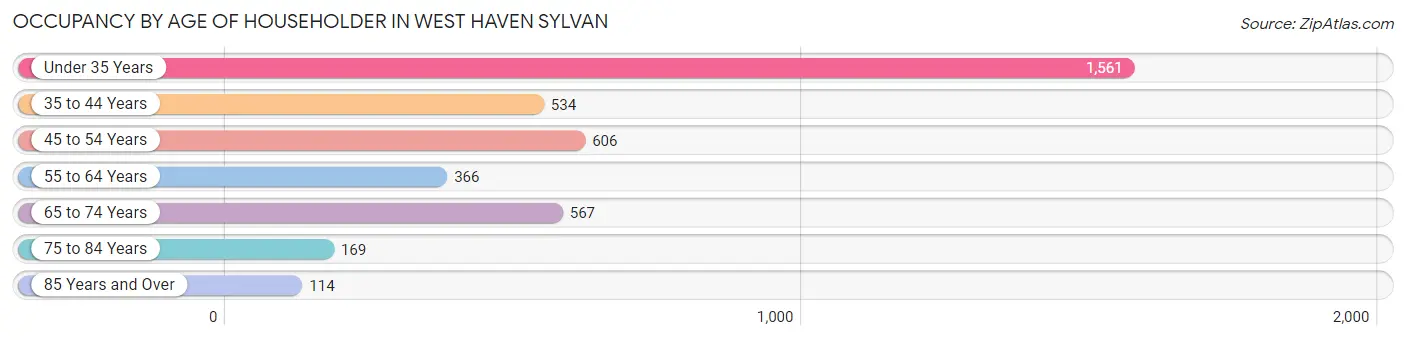
| Age Bracket | # Households | % Households |
| Under 35 Years | 1,561 | 39.9% |
| 35 to 44 Years | 534 | 13.6% |
| 45 to 54 Years | 606 | 15.5% |
| 55 to 64 Years | 366 | 9.3% |
| 65 to 74 Years | 567 | 14.5% |
| 75 to 84 Years | 169 | 4.3% |
| 85 Years and Over | 114 | 2.9% |
| Total | 3,917 | 100.0% |
Housing Finances in West Haven Sylvan
Median Income by Occupancy in West Haven Sylvan
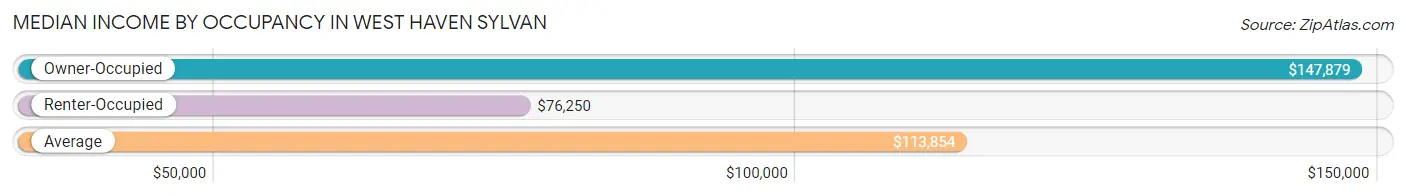
| Occupancy Type | # Households | Median Income |
| Owner-Occupied | 1,995 (50.9%) | $147,879 |
| Renter-Occupied | 1,922 (49.1%) | $76,250 |
| Average | 3,917 (100.0%) | $113,854 |
Occupancy by Householder Income Bracket in West Haven Sylvan
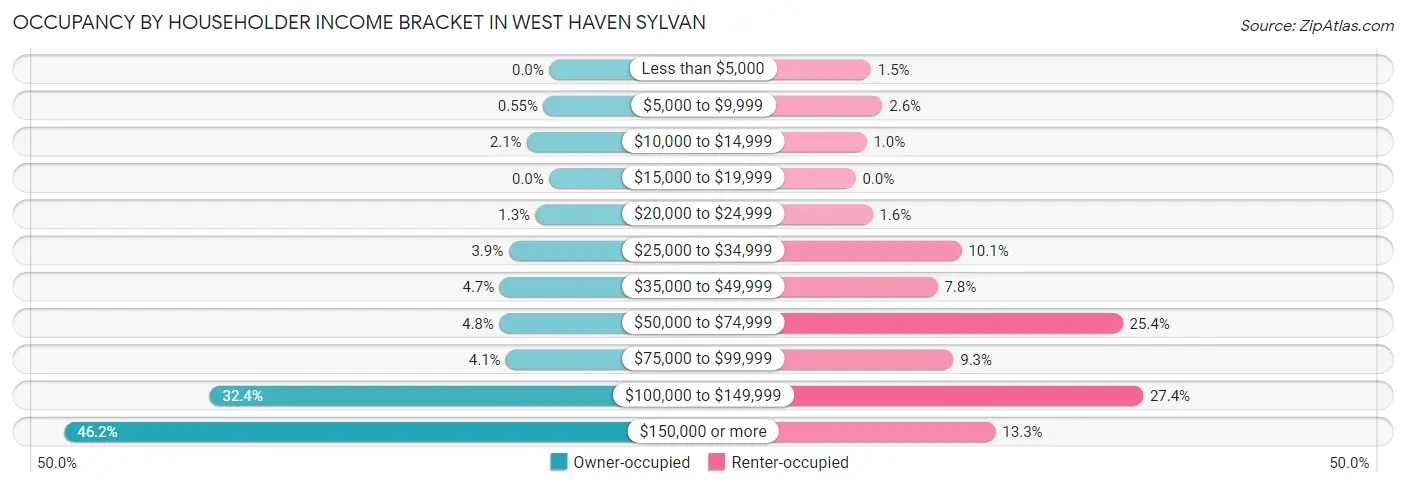
| Income Bracket | Owner-occupied | Renter-occupied |
| Less than $5,000 | 0 (0.0%) | 28 (1.5%) |
| $5,000 to $9,999 | 11 (0.5%) | 49 (2.5%) |
| $10,000 to $14,999 | 42 (2.1%) | 20 (1.0%) |
| $15,000 to $19,999 | 0 (0.0%) | 0 (0.0%) |
| $20,000 to $24,999 | 26 (1.3%) | 31 (1.6%) |
| $25,000 to $34,999 | 77 (3.9%) | 194 (10.1%) |
| $35,000 to $49,999 | 94 (4.7%) | 150 (7.8%) |
| $50,000 to $74,999 | 95 (4.8%) | 489 (25.4%) |
| $75,000 to $99,999 | 82 (4.1%) | 179 (9.3%) |
| $100,000 to $149,999 | 646 (32.4%) | 526 (27.4%) |
| $150,000 or more | 922 (46.2%) | 256 (13.3%) |
| Total | 1,995 (100.0%) | 1,922 (100.0%) |
Monthly Housing Cost Tiers in West Haven Sylvan
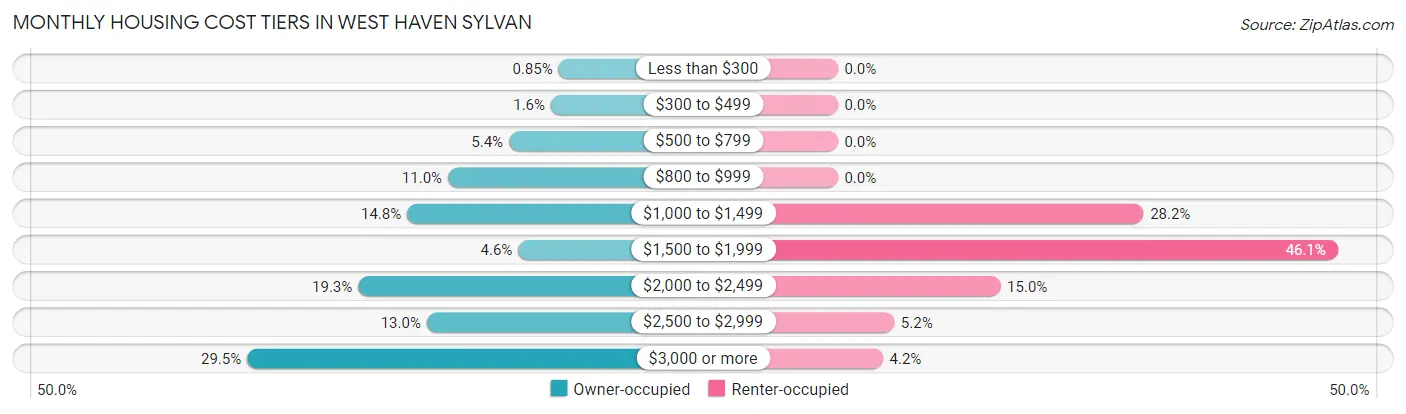
| Monthly Cost | Owner-occupied | Renter-occupied |
| Less than $300 | 17 (0.9%) | 0 (0.0%) |
| $300 to $499 | 31 (1.5%) | 0 (0.0%) |
| $500 to $799 | 108 (5.4%) | 0 (0.0%) |
| $800 to $999 | 220 (11.0%) | 0 (0.0%) |
| $1,000 to $1,499 | 295 (14.8%) | 541 (28.1%) |
| $1,500 to $1,999 | 91 (4.6%) | 885 (46.1%) |
| $2,000 to $2,499 | 385 (19.3%) | 288 (15.0%) |
| $2,500 to $2,999 | 259 (13.0%) | 100 (5.2%) |
| $3,000 or more | 589 (29.5%) | 80 (4.2%) |
| Total | 1,995 (100.0%) | 1,922 (100.0%) |
Physical Housing Characteristics in West Haven Sylvan
Housing Structures in West Haven Sylvan
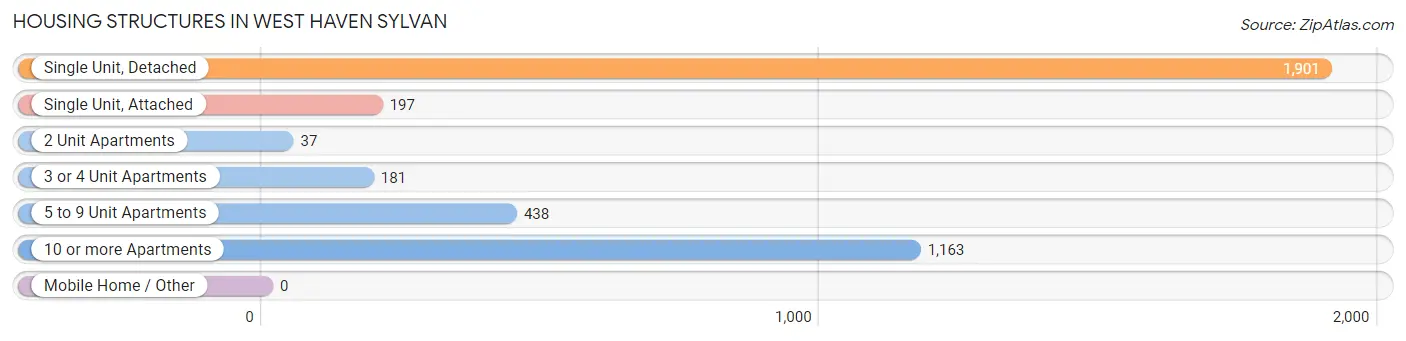
| Structure Type | # Housing Units | % Housing Units |
| Single Unit, Detached | 1,901 | 48.5% |
| Single Unit, Attached | 197 | 5.0% |
| 2 Unit Apartments | 37 | 0.9% |
| 3 or 4 Unit Apartments | 181 | 4.6% |
| 5 to 9 Unit Apartments | 438 | 11.2% |
| 10 or more Apartments | 1,163 | 29.7% |
| Mobile Home / Other | 0 | 0.0% |
| Total | 3,917 | 100.0% |
Housing Structures by Occupancy in West Haven Sylvan
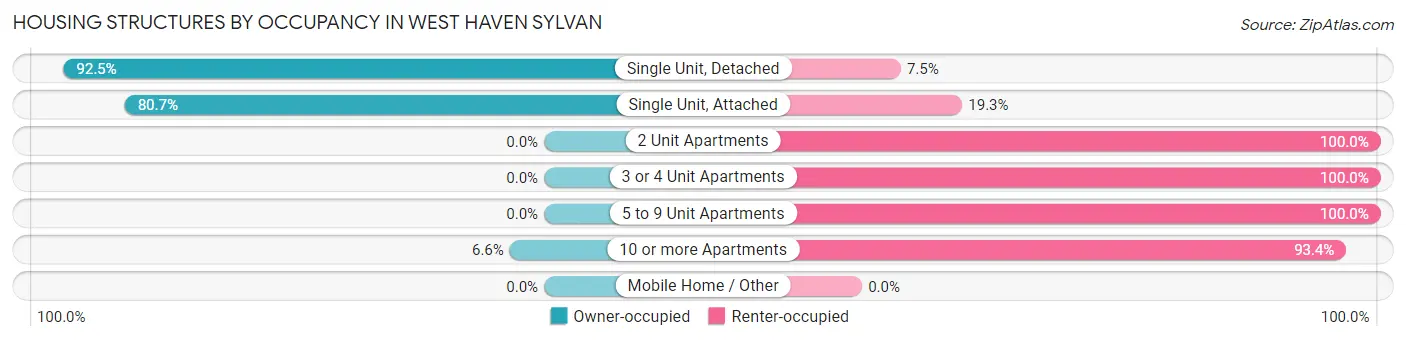
| Structure Type | Owner-occupied | Renter-occupied |
| Single Unit, Detached | 1,759 (92.5%) | 142 (7.5%) |
| Single Unit, Attached | 159 (80.7%) | 38 (19.3%) |
| 2 Unit Apartments | 0 (0.0%) | 37 (100.0%) |
| 3 or 4 Unit Apartments | 0 (0.0%) | 181 (100.0%) |
| 5 to 9 Unit Apartments | 0 (0.0%) | 438 (100.0%) |
| 10 or more Apartments | 77 (6.6%) | 1,086 (93.4%) |
| Mobile Home / Other | 0 (0.0%) | 0 (0.0%) |
| Total | 1,995 (50.9%) | 1,922 (49.1%) |
Housing Structures by Number of Rooms in West Haven Sylvan
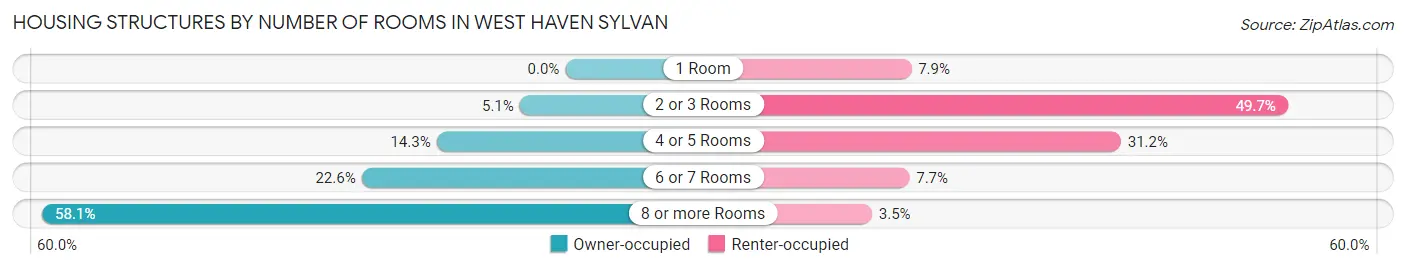
| Number of Rooms | Owner-occupied | Renter-occupied |
| 1 Room | 0 (0.0%) | 152 (7.9%) |
| 2 or 3 Rooms | 101 (5.1%) | 955 (49.7%) |
| 4 or 5 Rooms | 285 (14.3%) | 599 (31.2%) |
| 6 or 7 Rooms | 451 (22.6%) | 148 (7.7%) |
| 8 or more Rooms | 1,158 (58.1%) | 68 (3.5%) |
| Total | 1,995 (100.0%) | 1,922 (100.0%) |
Housing Structure by Heating Type in West Haven Sylvan
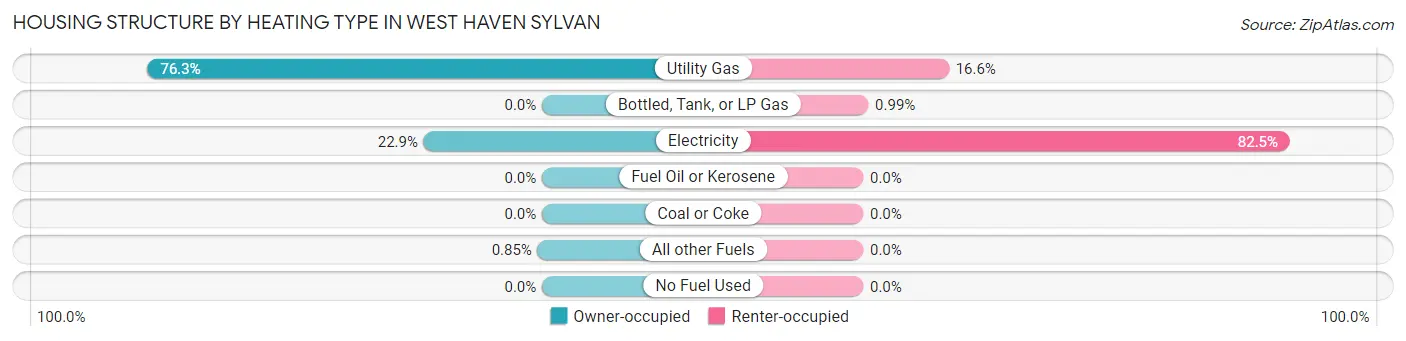
| Heating Type | Owner-occupied | Renter-occupied |
| Utility Gas | 1,522 (76.3%) | 318 (16.6%) |
| Bottled, Tank, or LP Gas | 0 (0.0%) | 19 (1.0%) |
| Electricity | 456 (22.9%) | 1,585 (82.5%) |
| Fuel Oil or Kerosene | 0 (0.0%) | 0 (0.0%) |
| Coal or Coke | 0 (0.0%) | 0 (0.0%) |
| All other Fuels | 17 (0.9%) | 0 (0.0%) |
| No Fuel Used | 0 (0.0%) | 0 (0.0%) |
| Total | 1,995 (100.0%) | 1,922 (100.0%) |
Household Vehicle Usage in West Haven Sylvan
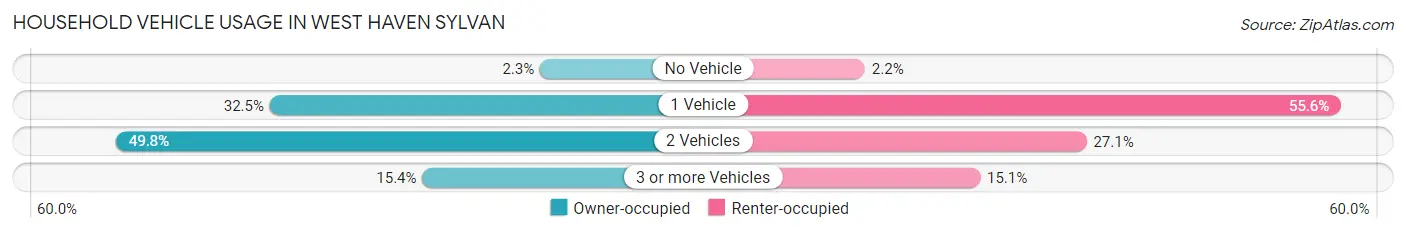
| Vehicles per Household | Owner-occupied | Renter-occupied |
| No Vehicle | 45 (2.3%) | 43 (2.2%) |
| 1 Vehicle | 649 (32.5%) | 1,068 (55.6%) |
| 2 Vehicles | 993 (49.8%) | 520 (27.1%) |
| 3 or more Vehicles | 308 (15.4%) | 291 (15.1%) |
| Total | 1,995 (100.0%) | 1,922 (100.0%) |
Real Estate & Mortgages in West Haven Sylvan
Real Estate and Mortgage Overview in West Haven Sylvan
| Characteristic | Without Mortgage | With Mortgage |
| Housing Units | 715 | 1,280 |
| Median Property Value | $633,900 | $717,700 |
| Median Household Income | $101,208 | $765 |
| Monthly Housing Costs | $962 | $584 |
| Real Estate Taxes | $6,908 | $0 |
Property Value by Mortgage Status in West Haven Sylvan
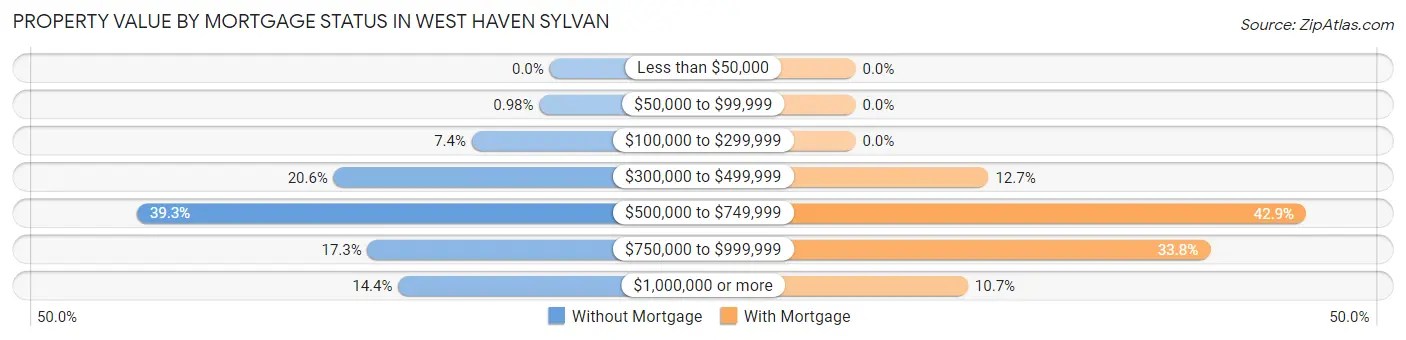
| Property Value | Without Mortgage | With Mortgage |
| Less than $50,000 | 0 (0.0%) | 0 (0.0%) |
| $50,000 to $99,999 | 7 (1.0%) | 0 (0.0%) |
| $100,000 to $299,999 | 53 (7.4%) | 0 (0.0%) |
| $300,000 to $499,999 | 147 (20.6%) | 162 (12.7%) |
| $500,000 to $749,999 | 281 (39.3%) | 549 (42.9%) |
| $750,000 to $999,999 | 124 (17.3%) | 432 (33.8%) |
| $1,000,000 or more | 103 (14.4%) | 137 (10.7%) |
| Total | 715 (100.0%) | 1,280 (100.0%) |
Household Income by Mortgage Status in West Haven Sylvan
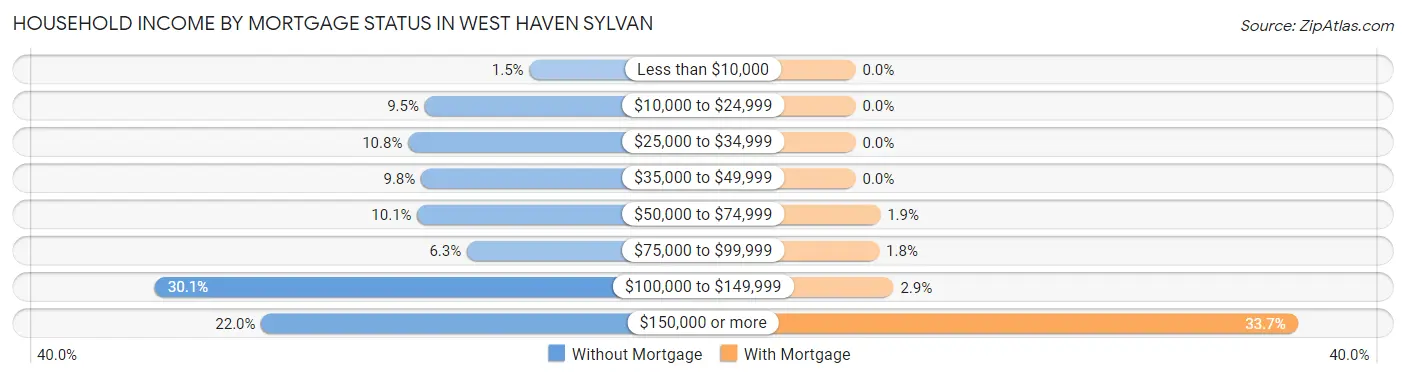
| Household Income | Without Mortgage | With Mortgage |
| Less than $10,000 | 11 (1.5%) | 0 (0.0%) |
| $10,000 to $24,999 | 68 (9.5%) | 0 (0.0%) |
| $25,000 to $34,999 | 77 (10.8%) | 0 (0.0%) |
| $35,000 to $49,999 | 70 (9.8%) | 0 (0.0%) |
| $50,000 to $74,999 | 72 (10.1%) | 24 (1.9%) |
| $75,000 to $99,999 | 45 (6.3%) | 23 (1.8%) |
| $100,000 to $149,999 | 215 (30.1%) | 37 (2.9%) |
| $150,000 or more | 157 (22.0%) | 431 (33.7%) |
| Total | 715 (100.0%) | 1,280 (100.0%) |
Property Value to Household Income Ratio in West Haven Sylvan
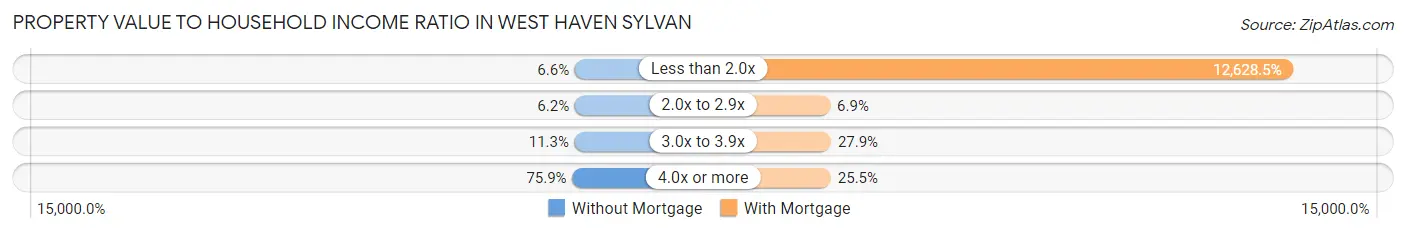
| Value-to-Income Ratio | Without Mortgage | With Mortgage |
| Less than 2.0x | 47 (6.6%) | 161,645 (12,628.5%) |
| 2.0x to 2.9x | 44 (6.1%) | 88 (6.9%) |
| 3.0x to 3.9x | 81 (11.3%) | 357 (27.9%) |
| 4.0x or more | 543 (75.9%) | 326 (25.5%) |
| Total | 715 (100.0%) | 1,280 (100.0%) |
Real Estate Taxes by Mortgage Status in West Haven Sylvan
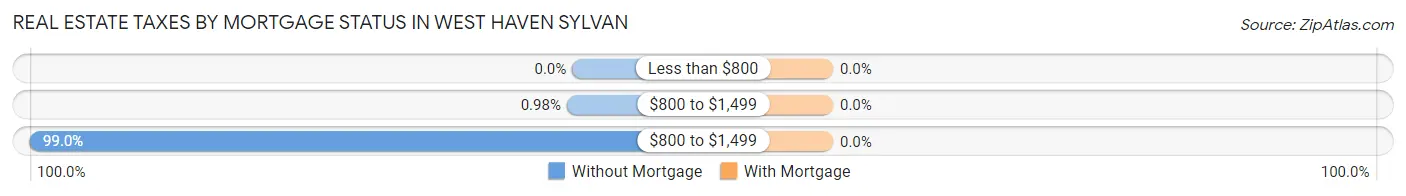
| Property Taxes | Without Mortgage | With Mortgage |
| Less than $800 | 0 (0.0%) | 0 (0.0%) |
| $800 to $1,499 | 7 (1.0%) | 0 (0.0%) |
| $800 to $1,499 | 708 (99.0%) | 0 (0.0%) |
| Total | 715 (100.0%) | 1,280 (100.0%) |
Health & Disability in West Haven Sylvan
Health Insurance Coverage by Age in West Haven Sylvan
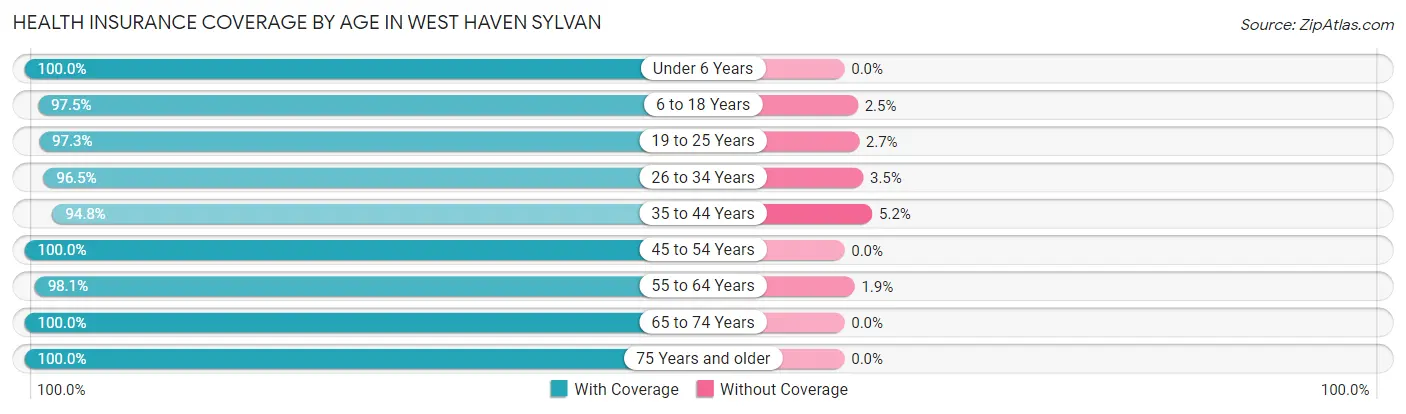
| Age Bracket | With Coverage | Without Coverage |
| Under 6 Years | 398 (100.0%) | 0 (0.0%) |
| 6 to 18 Years | 1,090 (97.5%) | 28 (2.5%) |
| 19 to 25 Years | 1,434 (97.3%) | 40 (2.7%) |
| 26 to 34 Years | 1,267 (96.5%) | 46 (3.5%) |
| 35 to 44 Years | 913 (94.8%) | 50 (5.2%) |
| 45 to 54 Years | 1,040 (100.0%) | 0 (0.0%) |
| 55 to 64 Years | 568 (98.1%) | 11 (1.9%) |
| 65 to 74 Years | 1,013 (100.0%) | 0 (0.0%) |
| 75 Years and older | 469 (100.0%) | 0 (0.0%) |
| Total | 8,192 (97.9%) | 175 (2.1%) |
Health Insurance Coverage by Citizenship Status in West Haven Sylvan
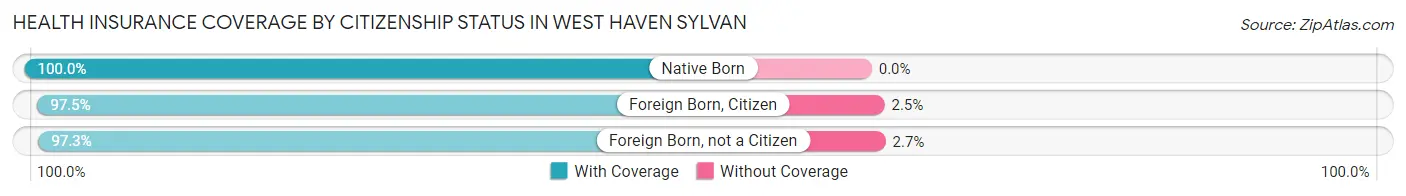
| Citizenship Status | With Coverage | Without Coverage |
| Native Born | 398 (100.0%) | 0 (0.0%) |
| Foreign Born, Citizen | 1,090 (97.5%) | 28 (2.5%) |
| Foreign Born, not a Citizen | 1,434 (97.3%) | 40 (2.7%) |
Health Insurance Coverage by Household Income in West Haven Sylvan
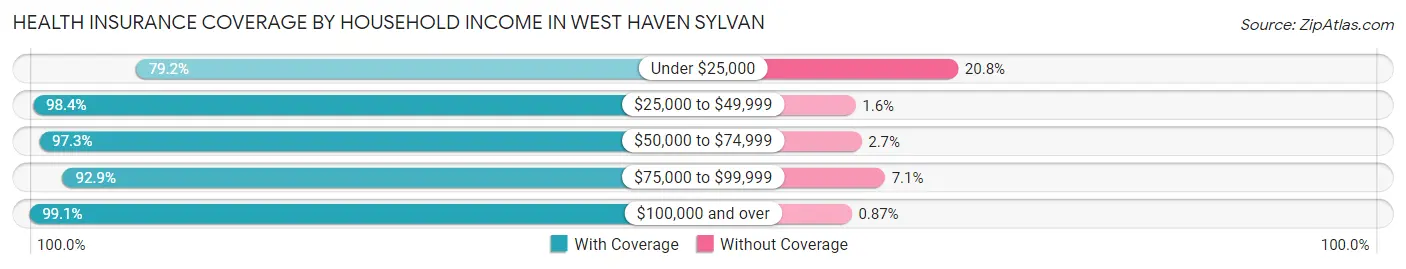
| Household Income | With Coverage | Without Coverage |
| Under $25,000 | 213 (79.2%) | 56 (20.8%) |
| $25,000 to $49,999 | 854 (98.4%) | 14 (1.6%) |
| $50,000 to $74,999 | 790 (97.3%) | 22 (2.7%) |
| $75,000 to $99,999 | 418 (92.9%) | 32 (7.1%) |
| $100,000 and over | 5,841 (99.1%) | 51 (0.9%) |
Public vs Private Health Insurance Coverage by Age in West Haven Sylvan
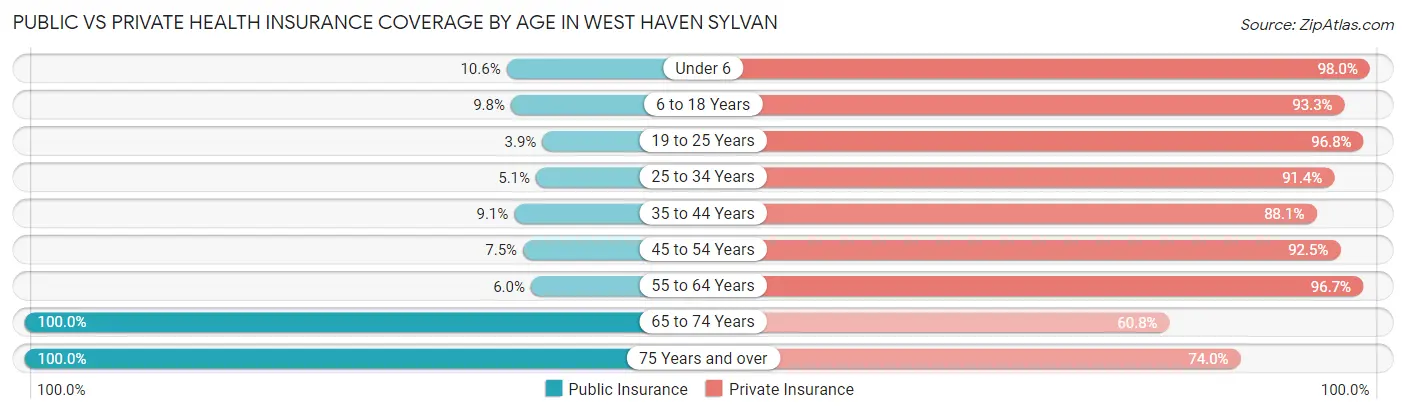
| Age Bracket | Public Insurance | Private Insurance |
| Under 6 | 42 (10.5%) | 390 (98.0%) |
| 6 to 18 Years | 109 (9.8%) | 1,043 (93.3%) |
| 19 to 25 Years | 58 (3.9%) | 1,427 (96.8%) |
| 25 to 34 Years | 67 (5.1%) | 1,200 (91.4%) |
| 35 to 44 Years | 88 (9.1%) | 848 (88.1%) |
| 45 to 54 Years | 78 (7.5%) | 962 (92.5%) |
| 55 to 64 Years | 35 (6.0%) | 560 (96.7%) |
| 65 to 74 Years | 1,013 (100.0%) | 616 (60.8%) |
| 75 Years and over | 469 (100.0%) | 347 (74.0%) |
| Total | 1,959 (23.4%) | 7,393 (88.4%) |
Disability Status by Sex by Age in West Haven Sylvan
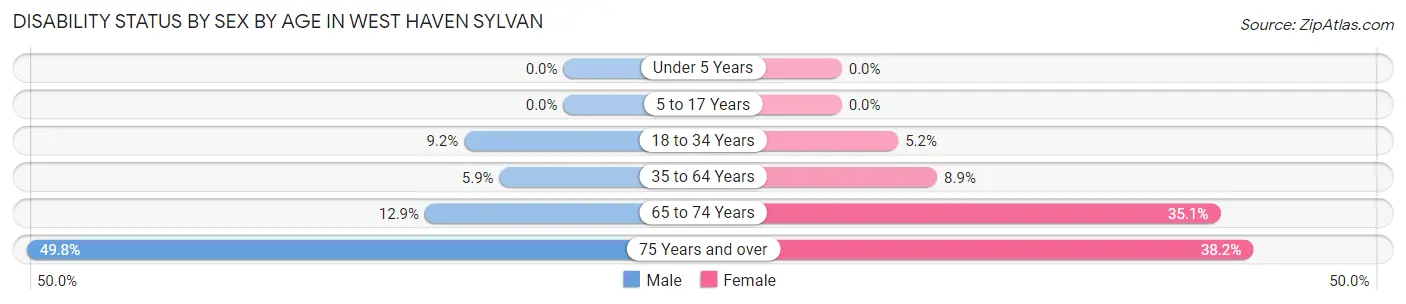
| Age Bracket | Male | Female |
| Under 5 Years | 0 (0.0%) | 0 (0.0%) |
| 5 to 17 Years | 0 (0.0%) | 0 (0.0%) |
| 18 to 34 Years | 133 (9.2%) | 75 (5.2%) |
| 35 to 64 Years | 68 (5.9%) | 127 (8.8%) |
| 65 to 74 Years | 46 (12.9%) | 230 (35.1%) |
| 75 Years and over | 120 (49.8%) | 87 (38.2%) |
Disability Class by Sex by Age in West Haven Sylvan
Disability Class: Hearing Difficulty
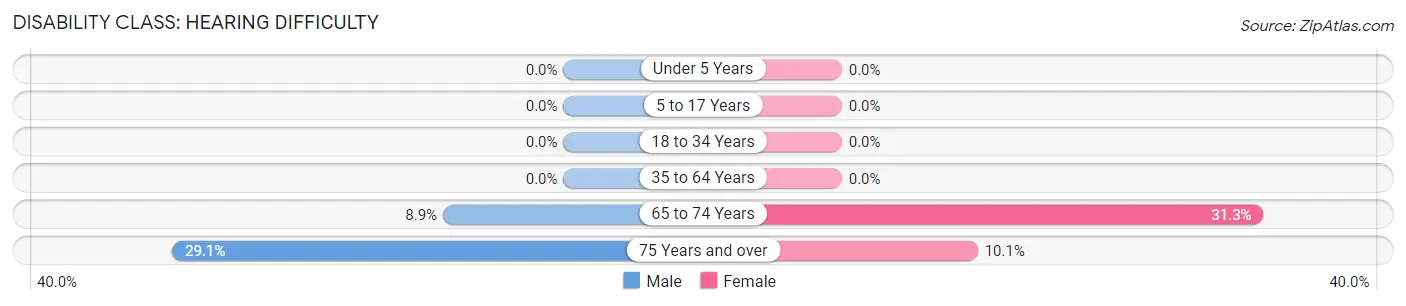
| Age Bracket | Male | Female |
| Under 5 Years | 0 (0.0%) | 0 (0.0%) |
| 5 to 17 Years | 0 (0.0%) | 0 (0.0%) |
| 18 to 34 Years | 0 (0.0%) | 0 (0.0%) |
| 35 to 64 Years | 0 (0.0%) | 0 (0.0%) |
| 65 to 74 Years | 32 (8.9%) | 205 (31.3%) |
| 75 Years and over | 70 (29.0%) | 23 (10.1%) |
Disability Class: Vision Difficulty
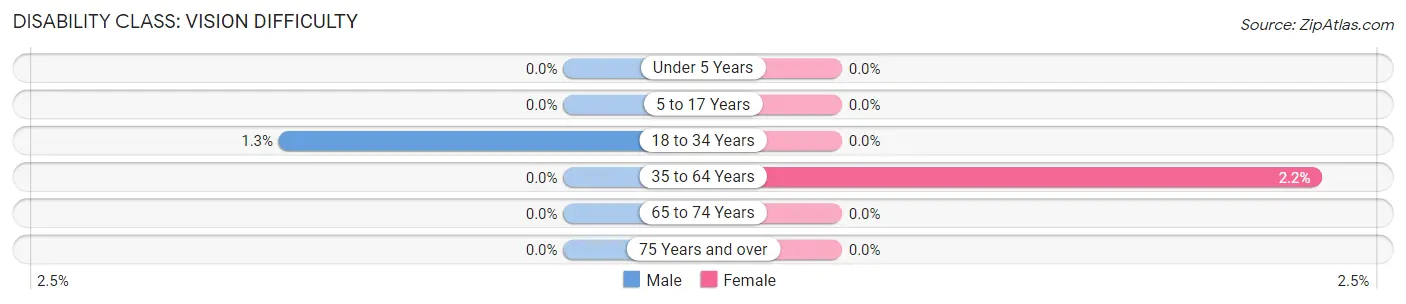
| Age Bracket | Male | Female |
| Under 5 Years | 0 (0.0%) | 0 (0.0%) |
| 5 to 17 Years | 0 (0.0%) | 0 (0.0%) |
| 18 to 34 Years | 19 (1.3%) | 0 (0.0%) |
| 35 to 64 Years | 0 (0.0%) | 32 (2.2%) |
| 65 to 74 Years | 0 (0.0%) | 0 (0.0%) |
| 75 Years and over | 0 (0.0%) | 0 (0.0%) |
Disability Class: Cognitive Difficulty
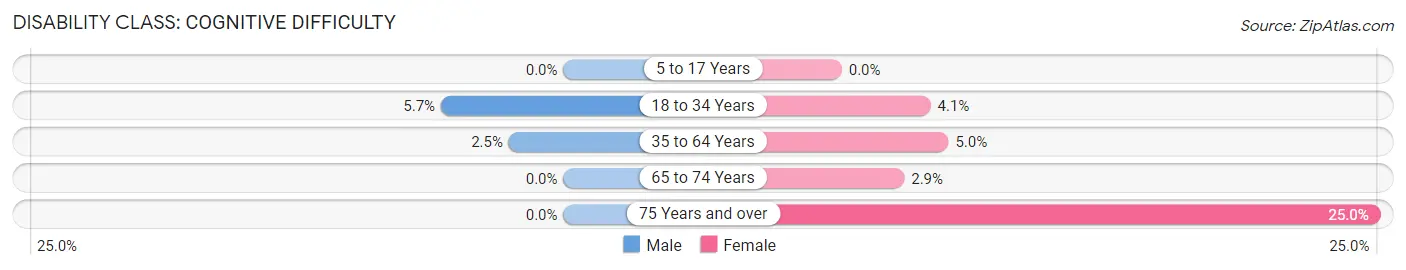
| Age Bracket | Male | Female |
| 5 to 17 Years | 0 (0.0%) | 0 (0.0%) |
| 18 to 34 Years | 82 (5.7%) | 59 (4.1%) |
| 35 to 64 Years | 29 (2.5%) | 71 (5.0%) |
| 65 to 74 Years | 0 (0.0%) | 19 (2.9%) |
| 75 Years and over | 0 (0.0%) | 57 (25.0%) |
Disability Class: Ambulatory Difficulty
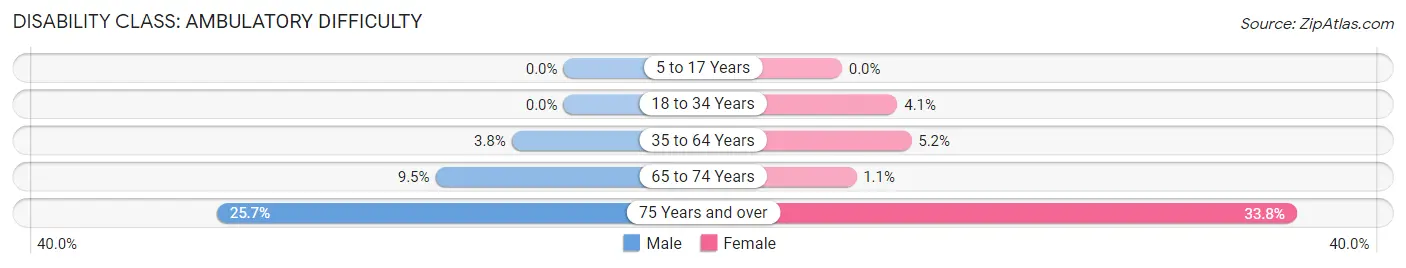
| Age Bracket | Male | Female |
| 5 to 17 Years | 0 (0.0%) | 0 (0.0%) |
| 18 to 34 Years | 0 (0.0%) | 59 (4.1%) |
| 35 to 64 Years | 44 (3.8%) | 74 (5.2%) |
| 65 to 74 Years | 34 (9.5%) | 7 (1.1%) |
| 75 Years and over | 62 (25.7%) | 77 (33.8%) |
Disability Class: Self-Care Difficulty
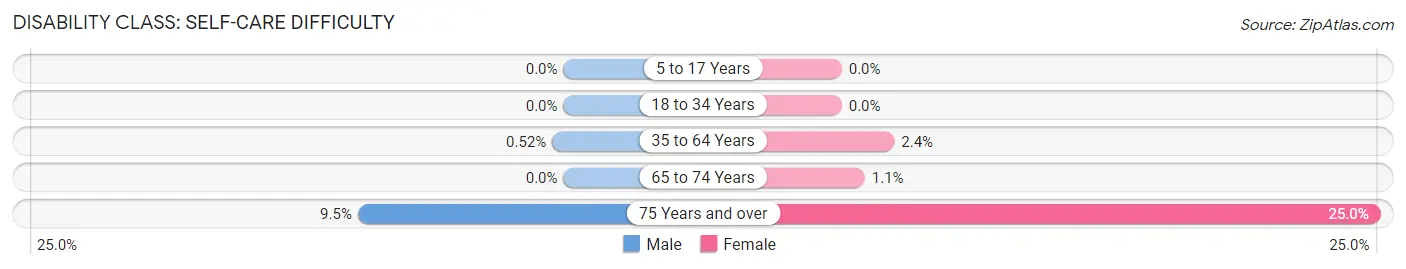
| Age Bracket | Male | Female |
| 5 to 17 Years | 0 (0.0%) | 0 (0.0%) |
| 18 to 34 Years | 0 (0.0%) | 0 (0.0%) |
| 35 to 64 Years | 6 (0.5%) | 35 (2.4%) |
| 65 to 74 Years | 0 (0.0%) | 7 (1.1%) |
| 75 Years and over | 23 (9.5%) | 57 (25.0%) |
Technology Access in West Haven Sylvan
Computing Device Access in West Haven Sylvan
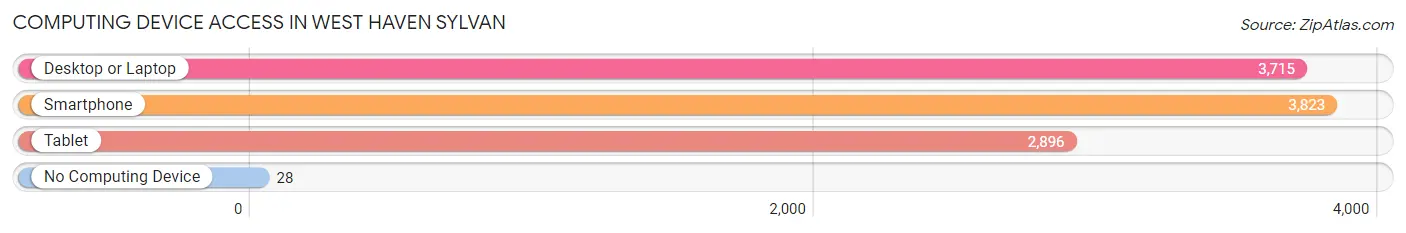
| Device Type | # Households | % Households |
| Desktop or Laptop | 3,715 | 94.8% |
| Smartphone | 3,823 | 97.6% |
| Tablet | 2,896 | 73.9% |
| No Computing Device | 28 | 0.7% |
| Total | 3,917 | 100.0% |
Internet Access in West Haven Sylvan
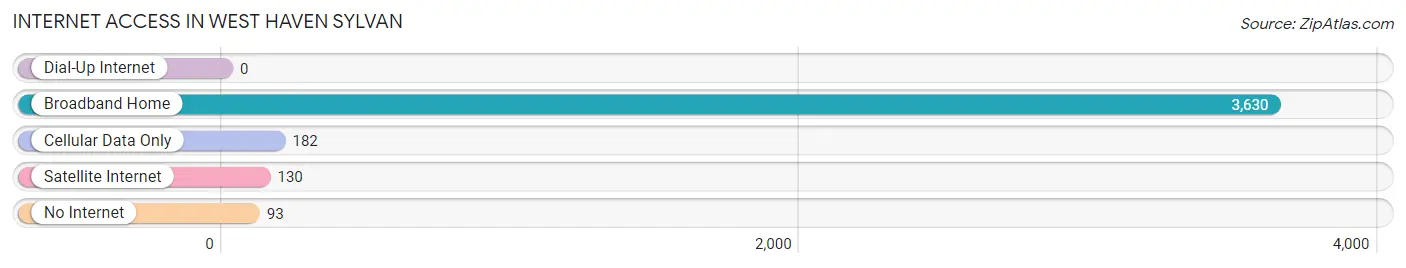
| Internet Type | # Households | % Households |
| Dial-Up Internet | 0 | 0.0% |
| Broadband Home | 3,630 | 92.7% |
| Cellular Data Only | 182 | 4.6% |
| Satellite Internet | 130 | 3.3% |
| No Internet | 93 | 2.4% |
| Total | 3,917 | 100.0% |
West Haven Sylvan Summary
History
The small town of West Haven Sylvan, Oregon is located in Washington County, just west of Portland. The town was founded in 1851 by a group of settlers from the East Coast. The settlers were looking for a place to settle and start a new life, and they found it in West Haven Sylvan. The town was named after the nearby Sylvan Creek, which was named after the sylvan trees that grew along its banks.
The first settlers in West Haven Sylvan were mostly farmers, and the town quickly grew to become a thriving agricultural community. The town was known for its dairy farms, and the local economy was largely based on the production of milk and other dairy products. The town also had a few small businesses, such as a general store and a blacksmith shop.
In the late 1800s, the town began to experience a period of growth and prosperity. The population increased, and new businesses opened up, including a bank, a post office, and a hotel. The town also became a popular destination for tourists, who came to enjoy the scenic beauty of the area.
In the early 1900s, the town experienced a period of decline. The population decreased, and many of the businesses closed. However, the town was able to survive, and in the 1950s, it began to experience a period of growth and revitalization. The population increased, and new businesses opened up, including a grocery store, a hardware store, and a movie theater.
Geography
West Haven Sylvan is located in Washington County, Oregon, just west of Portland. The town is situated in the foothills of the Cascade Mountains, and is surrounded by lush forests and rolling hills. The town is located on the banks of Sylvan Creek, which is a tributary of the Tualatin River.
The town has a total area of 1.2 square miles, and is located at an elevation of 845 feet. The climate in West Haven Sylvan is mild and temperate, with warm summers and cool winters. The average annual temperature is around 50 degrees Fahrenheit.
Economy
The economy of West Haven Sylvan is largely based on agriculture and tourism. The town is home to several dairy farms, which produce milk and other dairy products. The town also has a few small businesses, such as a grocery store, a hardware store, and a movie theater.
Tourism is also an important part of the local economy. The town is a popular destination for tourists, who come to enjoy the scenic beauty of the area. The town also hosts several festivals and events throughout the year, which attract visitors from all over the region.
Demographics
As of the 2010 census, the population of West Haven Sylvan was 1,845. The population is mostly white (94.3%), with a small percentage of African Americans (2.2%), Asians (1.2%), and Native Americans (0.7%). The median household income is $50,000, and the median age is 39.
Conclusion
West Haven Sylvan is a small town in Washington County, Oregon, located just west of Portland. The town was founded in 1851 by a group of settlers from the East Coast, and has since grown to become a thriving agricultural community. The town is known for its dairy farms, and the local economy is largely based on the production of milk and other dairy products. Tourism is also an important part of the local economy, and the town is a popular destination for visitors from all over the region. The population of West Haven Sylvan is mostly white, with a small percentage of African Americans, Asians, and Native Americans. The median household income is $50,000, and the median age is 39.
Common Questions
What is Per Capita Income in West Haven Sylvan?
Per Capita income in West Haven Sylvan is $69,802.
What is the Median Family Income in West Haven Sylvan?
Median Family Income in West Haven Sylvan is $139,570.
What is the Median Household income in West Haven Sylvan?
Median Household Income in West Haven Sylvan is $113,854.
What is Income or Wage Gap in West Haven Sylvan?
Income or Wage Gap in West Haven Sylvan is 0.5%.
Women in West Haven Sylvan earn 99.5 cents for every dollar earned by a man.
What is Inequality or Gini Index in West Haven Sylvan?
Inequality or Gini Index in West Haven Sylvan is 0.45.
What is the Total Population of West Haven Sylvan?
Total Population of West Haven Sylvan is 8,376.
What is the Total Male Population of West Haven Sylvan?
Total Male Population of West Haven Sylvan is 3,988.
What is the Total Female Population of West Haven Sylvan?
Total Female Population of West Haven Sylvan is 4,388.
What is the Ratio of Males per 100 Females in West Haven Sylvan?
There are 90.88 Males per 100 Females in West Haven Sylvan.
What is the Ratio of Females per 100 Males in West Haven Sylvan?
There are 110.03 Females per 100 Males in West Haven Sylvan.
What is the Median Population Age in West Haven Sylvan?
Median Population Age in West Haven Sylvan is 34.0 Years.
What is the Average Family Size in West Haven Sylvan
Average Family Size in West Haven Sylvan is 2.7 People.
What is the Average Household Size in West Haven Sylvan
Average Household Size in West Haven Sylvan is 2.1 People.
How Large is the Labor Force in West Haven Sylvan?
There are 5,135 People in the Labor Forcein in West Haven Sylvan.
What is the Percentage of People in the Labor Force in West Haven Sylvan?
72.2% of People are in the Labor Force in West Haven Sylvan.
What is the Unemployment Rate in West Haven Sylvan?
Unemployment Rate in West Haven Sylvan is 3.9%.