Mcminnville, OR Map & Demographics
Mcminnville Map
Mcminnville Overview
$32,385
PER CAPITA INCOME
$85,955
AVG FAMILY INCOME
$65,318
AVG HOUSEHOLD INCOME
21.3%
WAGE / INCOME GAP [ % ]
78.7¢/ $1
WAGE / INCOME GAP [ $ ]
$10,742
FAMILY INCOME DEFICIT
0.46
INEQUALITY / GINI INDEX
34,432
TOTAL POPULATION
16,871
MALE POPULATION
17,561
FEMALE POPULATION
96.07
MALES / 100 FEMALES
104.09
FEMALES / 100 MALES
40.1
MEDIAN AGE
3.0
AVG FAMILY SIZE
2.5
AVG HOUSEHOLD SIZE
15,302
LABOR FORCE [ PEOPLE ]
55.3%
PERCENT IN LABOR FORCE
3.7%
UNEMPLOYMENT RATE
Mcminnville Zip Codes
Income in Mcminnville
Income Overview in Mcminnville
Per Capita Income in Mcminnville is $32,385, while median incomes of families and households are $85,955 and $65,318 respectively.
| Characteristic | Number | Measure |
| Per Capita Income | 34,432 | $32,385 |
| Median Family Income | 8,391 | $85,955 |
| Mean Family Income | 8,391 | $99,813 |
| Median Household Income | 12,887 | $65,318 |
| Mean Household Income | 12,887 | $86,004 |
| Income Deficit | 8,391 | $10,742 |
| Wage / Income Gap (%) | 34,432 | 21.26% |
| Wage / Income Gap ($) | 34,432 | 78.74¢ per $1 |
| Gini / Inequality Index | 34,432 | 0.46 |
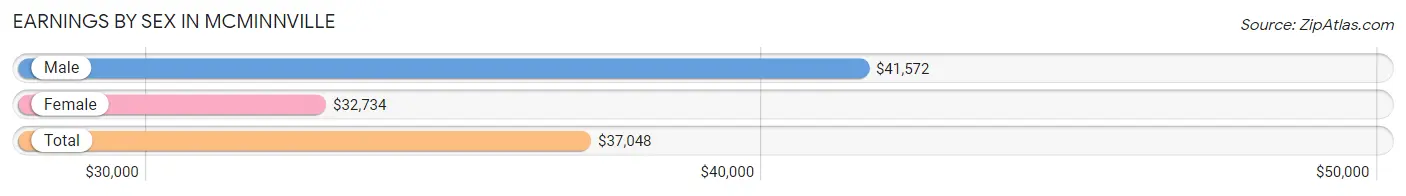
Earnings by Sex in Mcminnville
Average Earnings in Mcminnville are $37,048, $41,572 for men and $32,734 for women, a difference of 21.3%.
| Sex | Number | Average Earnings |
| Male | 8,369 (50.8%) | $41,572 |
| Female | 8,109 (49.2%) | $32,734 |
| Total | 16,478 (100.0%) | $37,048 |
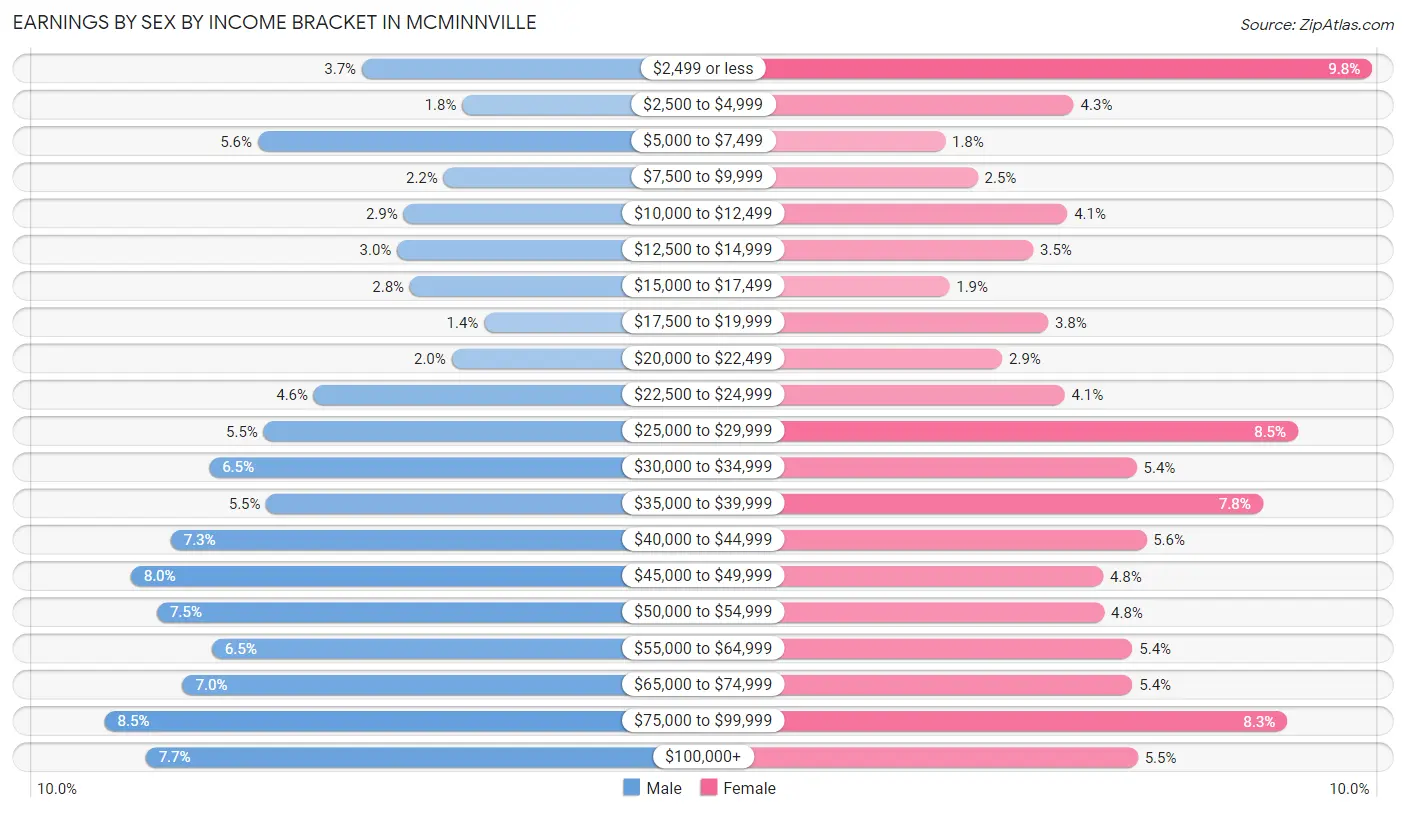
Earnings by Sex by Income Bracket in Mcminnville
The most common earnings brackets in Mcminnville are $75,000 to $99,999 for men (711 | 8.5%) and $2,499 or less for women (798 | 9.8%).
| Income | Male | Female |
| $2,499 or less | 308 (3.7%) | 798 (9.8%) |
| $2,500 to $4,999 | 151 (1.8%) | 345 (4.3%) |
| $5,000 to $7,499 | 471 (5.6%) | 149 (1.8%) |
| $7,500 to $9,999 | 180 (2.1%) | 199 (2.5%) |
| $10,000 to $12,499 | 243 (2.9%) | 335 (4.1%) |
| $12,500 to $14,999 | 253 (3.0%) | 283 (3.5%) |
| $15,000 to $17,499 | 233 (2.8%) | 156 (1.9%) |
| $17,500 to $19,999 | 116 (1.4%) | 306 (3.8%) |
| $20,000 to $22,499 | 167 (2.0%) | 236 (2.9%) |
| $22,500 to $24,999 | 383 (4.6%) | 331 (4.1%) |
| $25,000 to $29,999 | 462 (5.5%) | 685 (8.5%) |
| $30,000 to $34,999 | 547 (6.5%) | 440 (5.4%) |
| $35,000 to $39,999 | 458 (5.5%) | 632 (7.8%) |
| $40,000 to $44,999 | 608 (7.3%) | 455 (5.6%) |
| $45,000 to $49,999 | 670 (8.0%) | 389 (4.8%) |
| $50,000 to $54,999 | 629 (7.5%) | 391 (4.8%) |
| $55,000 to $64,999 | 543 (6.5%) | 434 (5.3%) |
| $65,000 to $74,999 | 589 (7.0%) | 434 (5.3%) |
| $75,000 to $99,999 | 711 (8.5%) | 669 (8.3%) |
| $100,000+ | 647 (7.7%) | 442 (5.4%) |
| Total | 8,369 (100.0%) | 8,109 (100.0%) |
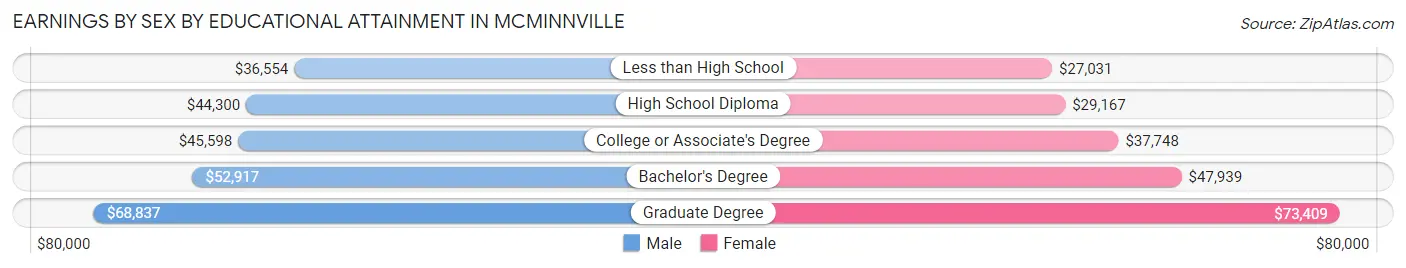
Earnings by Sex by Educational Attainment in Mcminnville
Average earnings in Mcminnville are $46,404 for men and $39,453 for women, a difference of 15.0%. Men with an educational attainment of graduate degree enjoy the highest average annual earnings of $68,837, while those with less than high school education earn the least with $36,554. Women with an educational attainment of graduate degree earn the most with the average annual earnings of $73,409, while those with less than high school education have the smallest earnings of $27,031.
| Educational Attainment | Male Income | Female Income |
| Less than High School | $36,554 | $27,031 |
| High School Diploma | $44,300 | $29,167 |
| College or Associate's Degree | $45,598 | $37,748 |
| Bachelor's Degree | $52,917 | $47,939 |
| Graduate Degree | $68,837 | $73,409 |
| Total | $46,404 | $39,453 |
Family Income in Mcminnville
Family Income Brackets in Mcminnville
According to the Mcminnville family income data, there are 2,123 families falling into the $100,000 to $149,999 income range, which is the most common income bracket and makes up 25.3% of all families. Conversely, the $10,000 to $14,999 income bracket is the least frequent group with only 227 families (2.7%) belonging to this category.
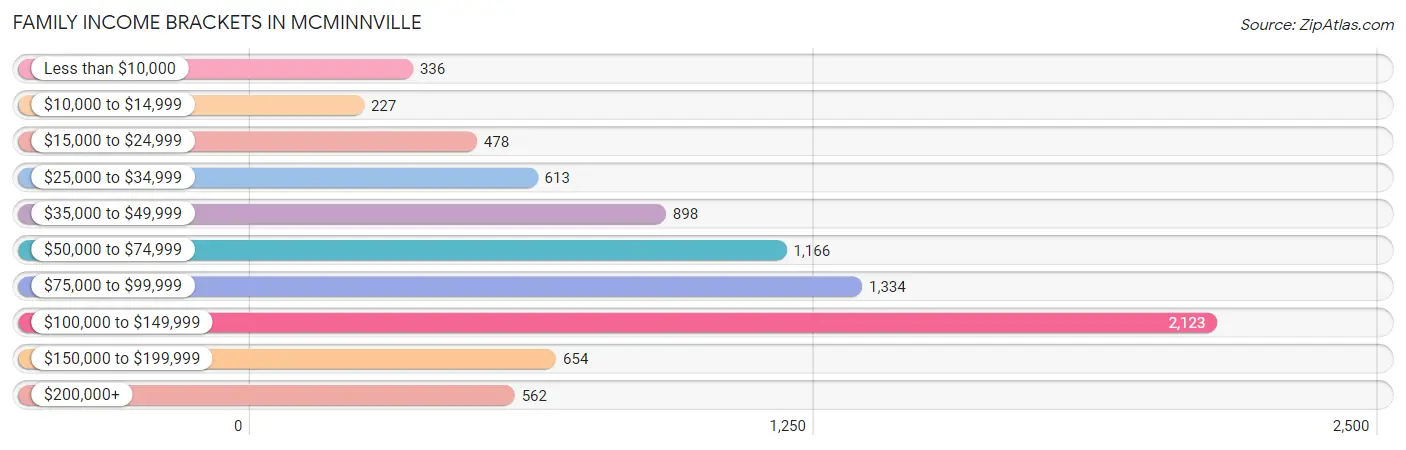
| Income Bracket | # Families | % Families |
| Less than $10,000 | 336 | 4.0% |
| $10,000 to $14,999 | 227 | 2.7% |
| $15,000 to $24,999 | 478 | 5.7% |
| $25,000 to $34,999 | 613 | 7.3% |
| $35,000 to $49,999 | 898 | 10.7% |
| $50,000 to $74,999 | 1,166 | 13.9% |
| $75,000 to $99,999 | 1,334 | 15.9% |
| $100,000 to $149,999 | 2,123 | 25.3% |
| $150,000 to $199,999 | 654 | 7.8% |
| $200,000+ | 562 | 6.7% |
Family Income by Famaliy Size in Mcminnville
7+ person families (205 | 2.4%) account for the highest median family income in Mcminnville with $130,802 per family, while 2-person families (4,432 | 52.8%) have the highest median income of $37,255 per family member.
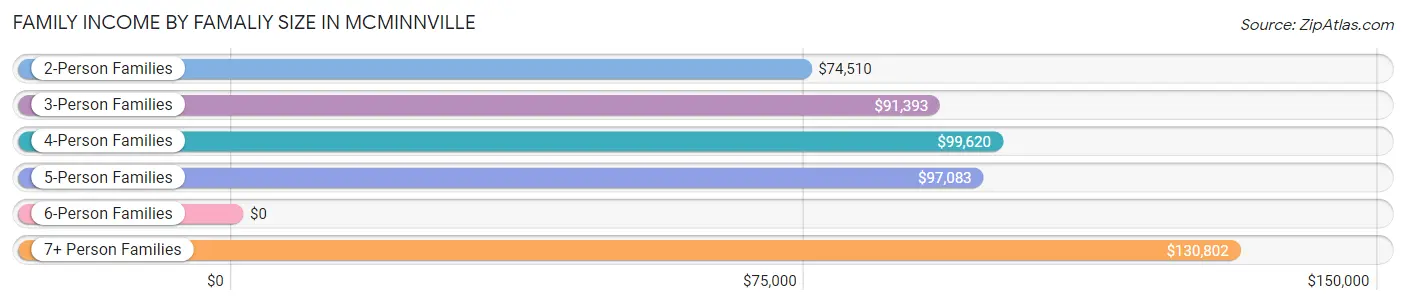
| Income Bracket | # Families | Median Income |
| 2-Person Families | 4,432 (52.8%) | $74,510 |
| 3-Person Families | 1,426 (17.0%) | $91,393 |
| 4-Person Families | 1,452 (17.3%) | $99,620 |
| 5-Person Families | 612 (7.3%) | $97,083 |
| 6-Person Families | 264 (3.2%) | $0 |
| 7+ Person Families | 205 (2.4%) | $130,802 |
| Total | 8,391 (100.0%) | $85,955 |
Family Income by Number of Earners in Mcminnville
The median family income in Mcminnville is $85,955, with families comprising 3+ earners (992) having the highest median family income of $122,585, while families with 1 earner (2,792) have the lowest median family income of $52,237, accounting for 11.8% and 33.3% of families, respectively.
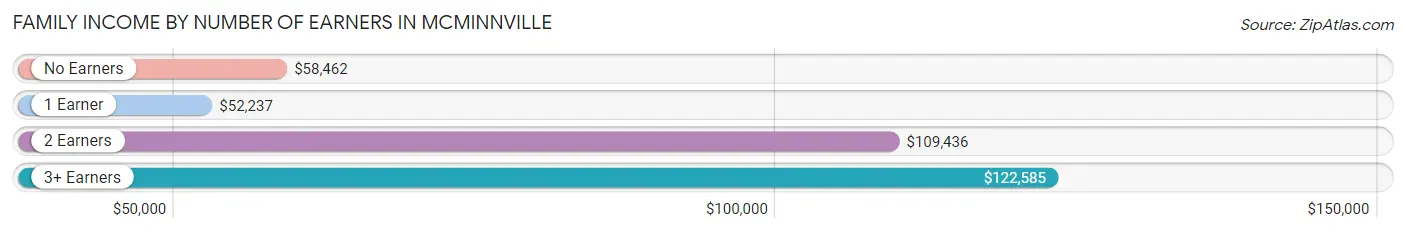
| Number of Earners | # Families | Median Income |
| No Earners | 1,740 (20.7%) | $58,462 |
| 1 Earner | 2,792 (33.3%) | $52,237 |
| 2 Earners | 2,867 (34.2%) | $109,436 |
| 3+ Earners | 992 (11.8%) | $122,585 |
| Total | 8,391 (100.0%) | $85,955 |
Household Income in Mcminnville
Household Income Brackets in Mcminnville
With 2,358 households falling in the category, the $100,000 to $149,999 income range is the most frequent in Mcminnville, accounting for 18.3% of all households. In contrast, only 670 households (5.2%) fall into the $10,000 to $14,999 income bracket, making it the least populous group.
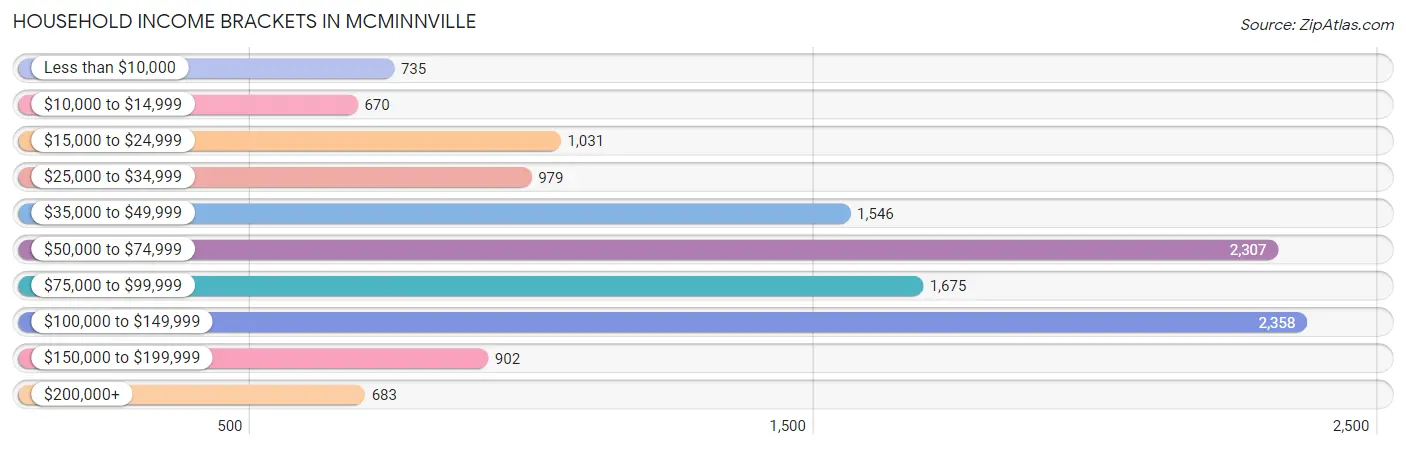
| Income Bracket | # Households | % Households |
| Less than $10,000 | 735 | 5.7% |
| $10,000 to $14,999 | 670 | 5.2% |
| $15,000 to $24,999 | 1,031 | 8.0% |
| $25,000 to $34,999 | 979 | 7.6% |
| $35,000 to $49,999 | 1,546 | 12.0% |
| $50,000 to $74,999 | 2,307 | 17.9% |
| $75,000 to $99,999 | 1,675 | 13.0% |
| $100,000 to $149,999 | 2,358 | 18.3% |
| $150,000 to $199,999 | 902 | 7.0% |
| $200,000+ | 683 | 5.3% |
Household Income by Householder Age in Mcminnville
The median household income in Mcminnville is $65,318, with the highest median household income of $88,796 found in the 45 to 64 years age bracket for the primary householder. A total of 4,276 households (33.2%) fall into this category. Meanwhile, the 65+ years age bracket for the primary householder has the lowest median household income of $49,595, with 4,245 households (32.9%) in this group.
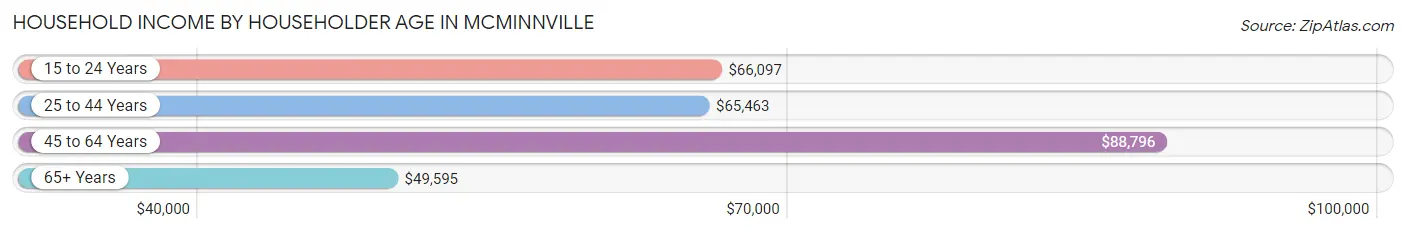
| Income Bracket | # Households | Median Income |
| 15 to 24 Years | 557 (4.3%) | $66,097 |
| 25 to 44 Years | 3,809 (29.6%) | $65,463 |
| 45 to 64 Years | 4,276 (33.2%) | $88,796 |
| 65+ Years | 4,245 (32.9%) | $49,595 |
| Total | 12,887 (100.0%) | $65,318 |
Poverty in Mcminnville
Income Below Poverty by Sex and Age in Mcminnville
With 16.8% poverty level for males and 17.1% for females among the residents of Mcminnville, 6 to 11 year old males and under 5 year old females are the most vulnerable to poverty, with 775 males (47.4%) and 227 females (29.2%) in their respective age groups living below the poverty level.
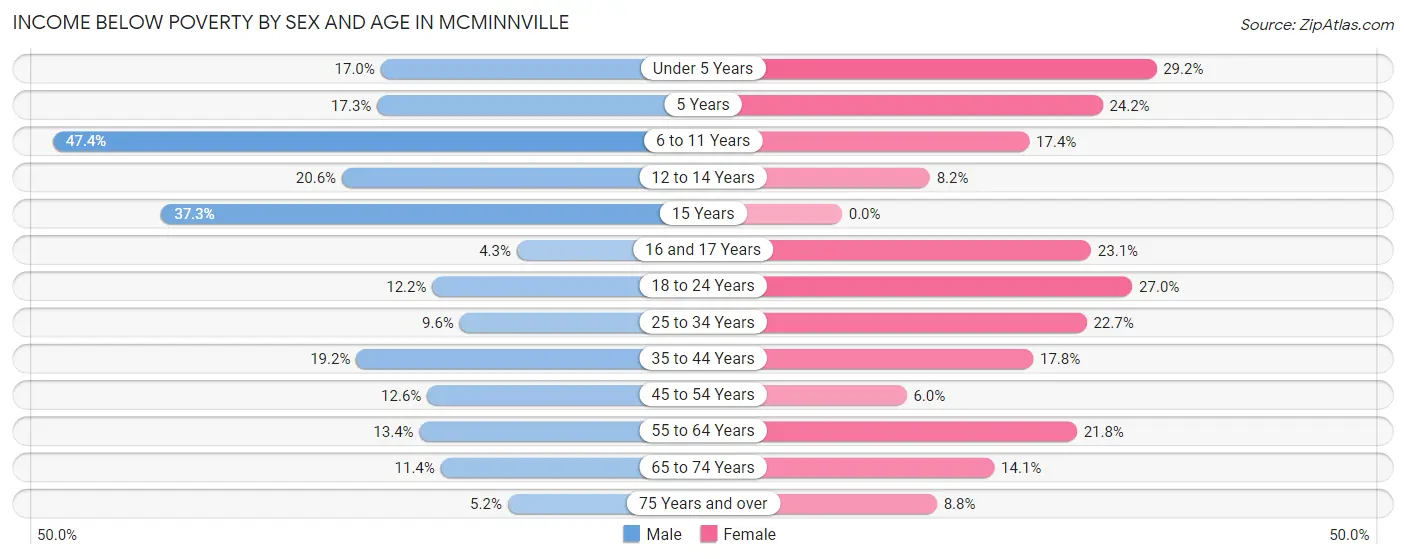
| Age Bracket | Male | Female |
| Under 5 Years | 106 (17.0%) | 227 (29.2%) |
| 5 Years | 61 (17.3%) | 30 (24.2%) |
| 6 to 11 Years | 775 (47.4%) | 254 (17.4%) |
| 12 to 14 Years | 163 (20.5%) | 43 (8.2%) |
| 15 Years | 97 (37.3%) | 0 (0.0%) |
| 16 and 17 Years | 16 (4.3%) | 117 (23.1%) |
| 18 to 24 Years | 168 (12.2%) | 363 (27.0%) |
| 25 to 34 Years | 192 (9.6%) | 423 (22.7%) |
| 35 to 44 Years | 357 (19.2%) | 368 (17.7%) |
| 45 to 54 Years | 262 (12.6%) | 118 (6.0%) |
| 55 to 64 Years | 239 (13.4%) | 476 (21.8%) |
| 65 to 74 Years | 215 (11.4%) | 257 (14.1%) |
| 75 Years and over | 59 (5.2%) | 163 (8.8%) |
| Total | 2,710 (16.8%) | 2,839 (17.1%) |
Income Above Poverty by Sex and Age in Mcminnville
According to the poverty statistics in Mcminnville, males aged 16 and 17 years and females aged 15 years are the age groups that are most secure financially, with 95.7% of males and 100.0% of females in these age groups living above the poverty line.
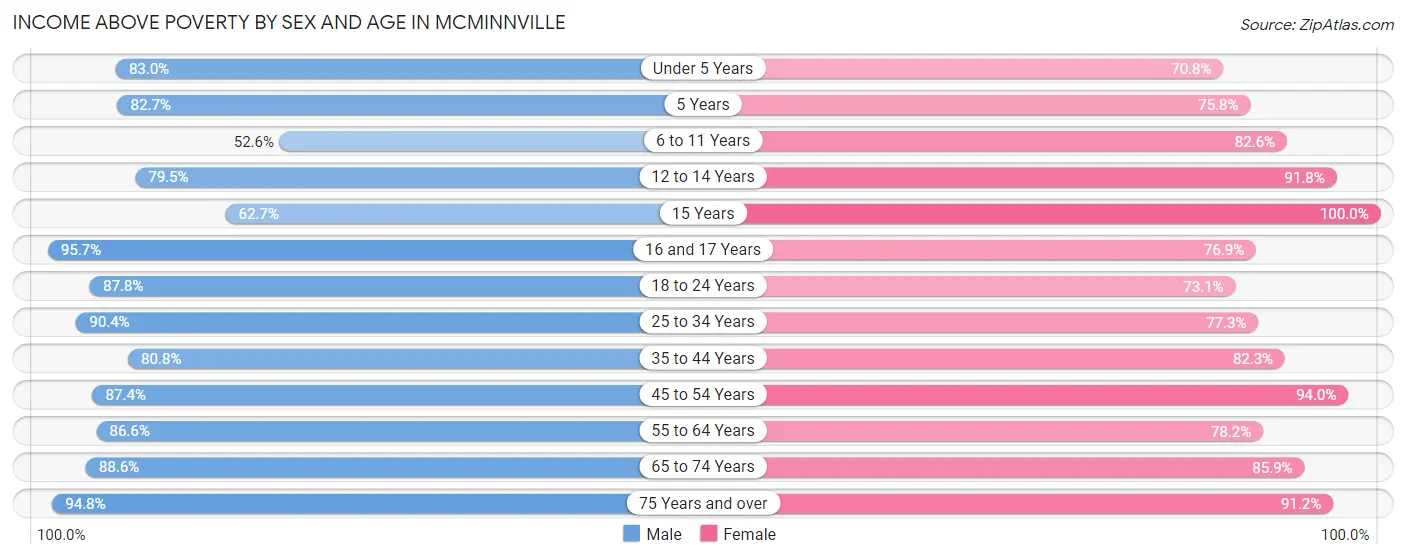
| Age Bracket | Male | Female |
| Under 5 Years | 519 (83.0%) | 551 (70.8%) |
| 5 Years | 292 (82.7%) | 94 (75.8%) |
| 6 to 11 Years | 861 (52.6%) | 1,207 (82.6%) |
| 12 to 14 Years | 630 (79.4%) | 484 (91.8%) |
| 15 Years | 163 (62.7%) | 108 (100.0%) |
| 16 and 17 Years | 354 (95.7%) | 389 (76.9%) |
| 18 to 24 Years | 1,214 (87.8%) | 984 (73.1%) |
| 25 to 34 Years | 1,803 (90.4%) | 1,440 (77.3%) |
| 35 to 44 Years | 1,500 (80.8%) | 1,705 (82.3%) |
| 45 to 54 Years | 1,810 (87.4%) | 1,850 (94.0%) |
| 55 to 64 Years | 1,550 (86.6%) | 1,707 (78.2%) |
| 65 to 74 Years | 1,673 (88.6%) | 1,561 (85.9%) |
| 75 Years and over | 1,084 (94.8%) | 1,687 (91.2%) |
| Total | 13,453 (83.2%) | 13,767 (82.9%) |
Income Below Poverty Among Married-Couple Families in Mcminnville
The poverty statistics for married-couple families in Mcminnville show that 7.4% or 414 of the total 5,617 families live below the poverty line. Families with 3 or 4 children have the highest poverty rate of 35.5%, comprising of 136 families. On the other hand, families with 5 or more children have the lowest poverty rate of 0.0%, which includes 0 families.
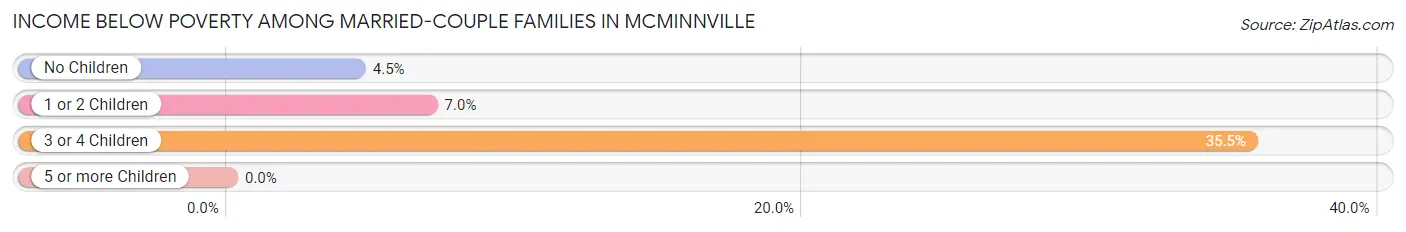
| Children | Above Poverty | Below Poverty |
| No Children | 3,240 (95.6%) | 151 (4.4%) |
| 1 or 2 Children | 1,701 (93.0%) | 127 (7.0%) |
| 3 or 4 Children | 247 (64.5%) | 136 (35.5%) |
| 5 or more Children | 15 (100.0%) | 0 (0.0%) |
| Total | 5,203 (92.6%) | 414 (7.4%) |
Income Below Poverty Among Single-Parent Households in Mcminnville
According to the poverty data in Mcminnville, 21.7% or 100 single-father households and 24.1% or 557 single-mother households are living below the poverty line. Among single-father households, those with no children have the highest poverty rate, with 58 households (28.6%) experiencing poverty. Likewise, among single-mother households, those with 3 or 4 children have the highest poverty rate, with 244 households (62.1%) falling below the poverty line.
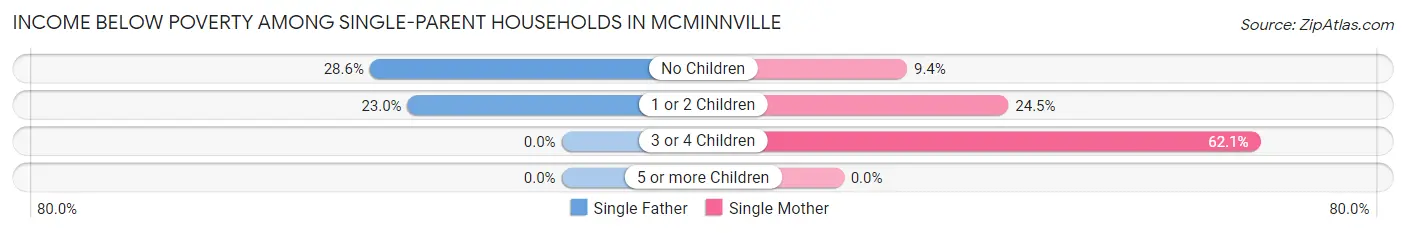
| Children | Single Father | Single Mother |
| No Children | 58 (28.6%) | 99 (9.4%) |
| 1 or 2 Children | 42 (23.0%) | 214 (24.5%) |
| 3 or 4 Children | 0 (0.0%) | 244 (62.1%) |
| 5 or more Children | 0 (0.0%) | 0 (0.0%) |
| Total | 100 (21.7%) | 557 (24.1%) |
Income Below Poverty Among Married-Couple vs Single-Parent Households in Mcminnville
The poverty data for Mcminnville shows that 414 of the married-couple family households (7.4%) and 657 of the single-parent households (23.7%) are living below the poverty level. Within the married-couple family households, those with 3 or 4 children have the highest poverty rate, with 136 households (35.5%) falling below the poverty line. Among the single-parent households, those with 3 or 4 children have the highest poverty rate, with 244 household (52.2%) living below poverty.
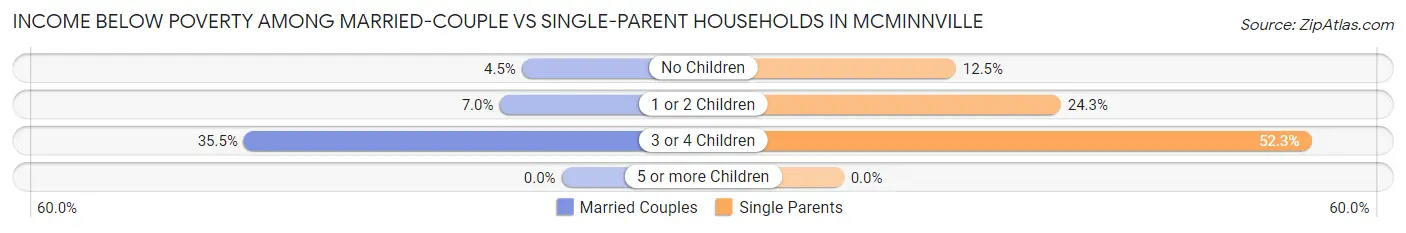
| Children | Married-Couple Families | Single-Parent Households |
| No Children | 151 (4.4%) | 157 (12.5%) |
| 1 or 2 Children | 127 (7.0%) | 256 (24.3%) |
| 3 or 4 Children | 136 (35.5%) | 244 (52.2%) |
| 5 or more Children | 0 (0.0%) | 0 (0.0%) |
| Total | 414 (7.4%) | 657 (23.7%) |
Race in Mcminnville
The most populous races in Mcminnville are White / Caucasian (26,986 | 78.4%), Hispanic or Latino (6,369 | 18.5%), and Two or more Races (4,062 | 11.8%).
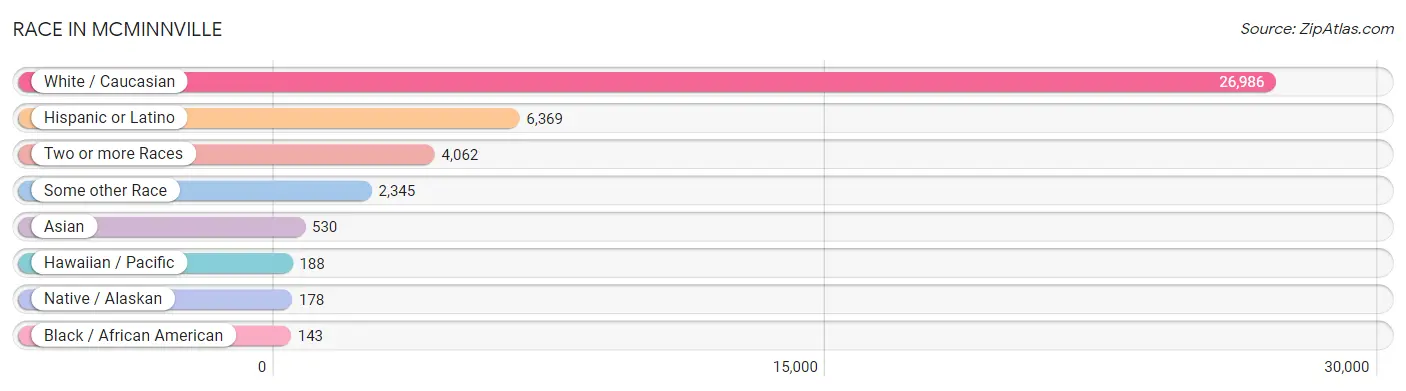
| Race | # Population | % Population |
| Asian | 530 | 1.5% |
| Black / African American | 143 | 0.4% |
| Hawaiian / Pacific | 188 | 0.5% |
| Hispanic or Latino | 6,369 | 18.5% |
| Native / Alaskan | 178 | 0.5% |
| White / Caucasian | 26,986 | 78.4% |
| Two or more Races | 4,062 | 11.8% |
| Some other Race | 2,345 | 6.8% |
| Total | 34,432 | 100.0% |
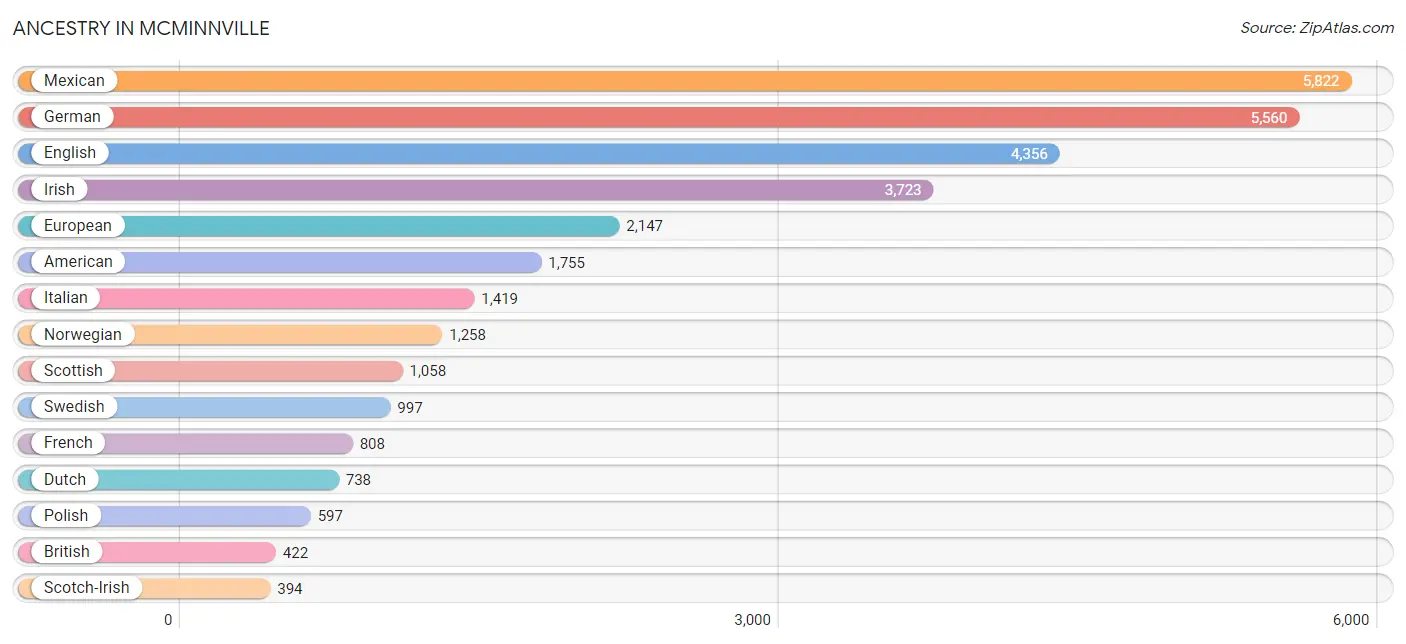
Ancestry in Mcminnville
The most populous ancestries reported in Mcminnville are Mexican (5,822 | 16.9%), German (5,560 | 16.2%), English (4,356 | 12.7%), Irish (3,723 | 10.8%), and European (2,147 | 6.2%), together accounting for 62.8% of all Mcminnville residents.
| Ancestry | # Population | % Population |
| American | 1,755 | 5.1% |
| Arab | 26 | 0.1% |
| Armenian | 17 | 0.1% |
| Australian | 70 | 0.2% |
| Bangladeshi | 2 | 0.0% |
| Basque | 13 | 0.0% |
| Belgian | 51 | 0.2% |
| Bhutanese | 227 | 0.7% |
| Blackfeet | 24 | 0.1% |
| Brazilian | 63 | 0.2% |
| British | 422 | 1.2% |
| Burmese | 43 | 0.1% |
| Canadian | 47 | 0.1% |
| Central American | 134 | 0.4% |
| Cherokee | 363 | 1.1% |
| Chickasaw | 25 | 0.1% |
| Chinese | 15 | 0.0% |
| Chippewa | 30 | 0.1% |
| Choctaw | 304 | 0.9% |
| Comanche | 1 | 0.0% |
| Croatian | 13 | 0.0% |
| Czech | 88 | 0.3% |
| Czechoslovakian | 9 | 0.0% |
| Danish | 339 | 1.0% |
| Dutch | 738 | 2.1% |
| Eastern European | 206 | 0.6% |
| Ecuadorian | 14 | 0.0% |
| English | 4,356 | 12.7% |
| Estonian | 18 | 0.1% |
| European | 2,147 | 6.2% |
| Finnish | 173 | 0.5% |
| French | 808 | 2.4% |
| French Canadian | 134 | 0.4% |
| German | 5,560 | 16.2% |
| German Russian | 60 | 0.2% |
| Greek | 14 | 0.0% |
| Guamanian / Chamorro | 75 | 0.2% |
| Guatemalan | 88 | 0.3% |
| Hopi | 13 | 0.0% |
| Hungarian | 122 | 0.4% |
| Indian (Asian) | 324 | 0.9% |
| Iranian | 52 | 0.2% |
| Irish | 3,723 | 10.8% |
| Italian | 1,419 | 4.1% |
| Korean | 251 | 0.7% |
| Lithuanian | 26 | 0.1% |
| Luxembourger | 8 | 0.0% |
| Mexican | 5,822 | 16.9% |
| Mexican American Indian | 286 | 0.8% |
| Native Hawaiian | 174 | 0.5% |
| Nicaraguan | 5 | 0.0% |
| Northern European | 64 | 0.2% |
| Norwegian | 1,258 | 3.6% |
| Panamanian | 41 | 0.1% |
| Peruvian | 24 | 0.1% |
| Polish | 597 | 1.7% |
| Portuguese | 66 | 0.2% |
| Puerto Rican | 37 | 0.1% |
| Puget Sound Salish | 11 | 0.0% |
| Russian | 177 | 0.5% |
| Scandinavian | 233 | 0.7% |
| Scotch-Irish | 394 | 1.1% |
| Scottish | 1,058 | 3.1% |
| Seminole | 151 | 0.4% |
| Sioux | 162 | 0.5% |
| Slavic | 3 | 0.0% |
| Slovak | 26 | 0.1% |
| South American | 38 | 0.1% |
| Spaniard | 27 | 0.1% |
| Spanish | 144 | 0.4% |
| Sri Lankan | 8 | 0.0% |
| Subsaharan African | 196 | 0.6% |
| Swedish | 997 | 2.9% |
| Swiss | 225 | 0.6% |
| Thai | 3 | 0.0% |
| Ukrainian | 1 | 0.0% |
| Welsh | 345 | 1.0% |
| Yugoslavian | 41 | 0.1% |
| Yup'ik | 56 | 0.2% | View All 79 Rows |
Immigrants in Mcminnville
The most numerous immigrant groups reported in Mcminnville came from Latin America (1,884 | 5.5%), Central America (1,870 | 5.4%), Mexico (1,783 | 5.2%), Asia (496 | 1.4%), and Eastern Asia (263 | 0.8%), together accounting for 18.3% of all Mcminnville residents.
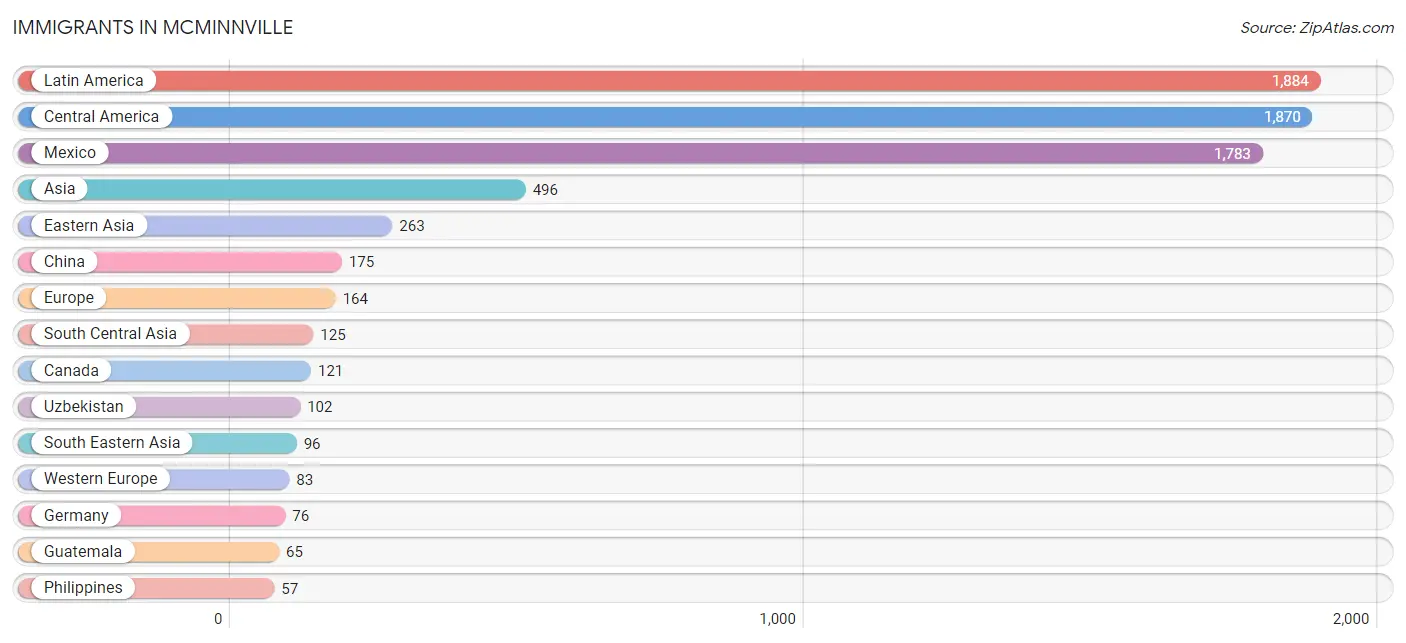
| Immigration Origin | # Population | % Population |
| Asia | 496 | 1.4% |
| Australia | 15 | 0.0% |
| Canada | 121 | 0.4% |
| Central America | 1,870 | 5.4% |
| China | 175 | 0.5% |
| Czechoslovakia | 6 | 0.0% |
| Eastern Asia | 263 | 0.8% |
| Eastern Europe | 12 | 0.0% |
| Ecuador | 14 | 0.0% |
| Europe | 164 | 0.5% |
| Germany | 76 | 0.2% |
| Guatemala | 65 | 0.2% |
| Hong Kong | 13 | 0.0% |
| Indonesia | 16 | 0.1% |
| Iran | 23 | 0.1% |
| Italy | 43 | 0.1% |
| Japan | 33 | 0.1% |
| Jordan | 12 | 0.0% |
| Korea | 55 | 0.2% |
| Latin America | 1,884 | 5.5% |
| Lithuania | 6 | 0.0% |
| Mexico | 1,783 | 5.2% |
| Netherlands | 7 | 0.0% |
| Northern Europe | 26 | 0.1% |
| Oceania | 15 | 0.0% |
| Panama | 22 | 0.1% |
| Philippines | 57 | 0.2% |
| Scotland | 19 | 0.1% |
| South America | 14 | 0.0% |
| South Central Asia | 125 | 0.4% |
| South Eastern Asia | 96 | 0.3% |
| Southern Europe | 43 | 0.1% |
| Taiwan | 50 | 0.2% |
| Uzbekistan | 102 | 0.3% |
| Vietnam | 5 | 0.0% |
| Western Asia | 12 | 0.0% |
| Western Europe | 83 | 0.2% | View All 37 Rows |
Sex and Age in Mcminnville
Sex and Age in Mcminnville
The most populous age groups in Mcminnville are 10 to 14 Years (1,434 | 8.5%) for men and 20 to 24 Years (1,379 | 7.9%) for women.
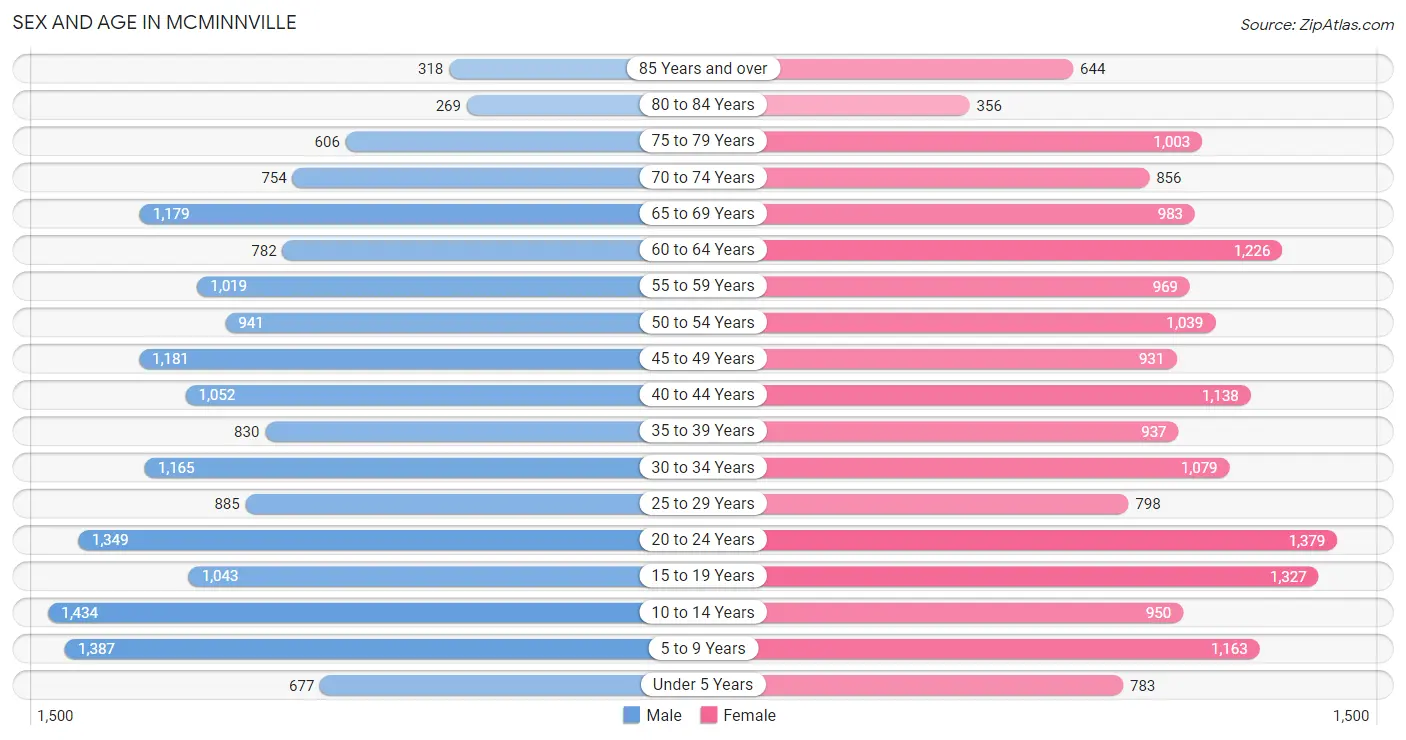
| Age Bracket | Male | Female |
| Under 5 Years | 677 (4.0%) | 783 (4.5%) |
| 5 to 9 Years | 1,387 (8.2%) | 1,163 (6.6%) |
| 10 to 14 Years | 1,434 (8.5%) | 950 (5.4%) |
| 15 to 19 Years | 1,043 (6.2%) | 1,327 (7.6%) |
| 20 to 24 Years | 1,349 (8.0%) | 1,379 (7.9%) |
| 25 to 29 Years | 885 (5.2%) | 798 (4.5%) |
| 30 to 34 Years | 1,165 (6.9%) | 1,079 (6.1%) |
| 35 to 39 Years | 830 (4.9%) | 937 (5.3%) |
| 40 to 44 Years | 1,052 (6.2%) | 1,138 (6.5%) |
| 45 to 49 Years | 1,181 (7.0%) | 931 (5.3%) |
| 50 to 54 Years | 941 (5.6%) | 1,039 (5.9%) |
| 55 to 59 Years | 1,019 (6.0%) | 969 (5.5%) |
| 60 to 64 Years | 782 (4.6%) | 1,226 (7.0%) |
| 65 to 69 Years | 1,179 (7.0%) | 983 (5.6%) |
| 70 to 74 Years | 754 (4.5%) | 856 (4.9%) |
| 75 to 79 Years | 606 (3.6%) | 1,003 (5.7%) |
| 80 to 84 Years | 269 (1.6%) | 356 (2.0%) |
| 85 Years and over | 318 (1.9%) | 644 (3.7%) |
| Total | 16,871 (100.0%) | 17,561 (100.0%) |
Families and Households in Mcminnville
Median Family Size in Mcminnville
The median family size in Mcminnville is 3.03 persons per family, with single male/father families (460 | 5.5%) accounting for the largest median family size of 3.66 persons per family. On the other hand, single female/mother families (2,314 | 27.6%) represent the smallest median family size with 2.77 persons per family.
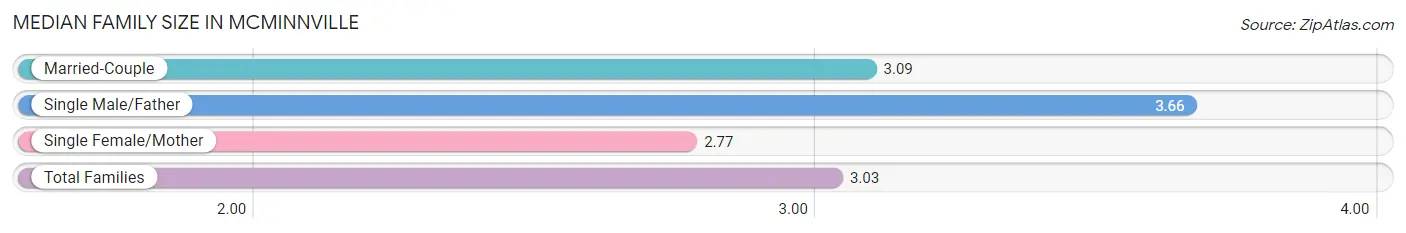
| Family Type | # Families | Family Size |
| Married-Couple | 5,617 (66.9%) | 3.09 |
| Single Male/Father | 460 (5.5%) | 3.66 |
| Single Female/Mother | 2,314 (27.6%) | 2.77 |
| Total Families | 8,391 (100.0%) | 3.03 |
Median Household Size in Mcminnville
The median household size in Mcminnville is 2.52 persons per household, with single male/father households (460 | 3.6%) accounting for the largest median household size of 4.08 persons per household. non-family households (4,496 | 34.9%) represent the smallest median household size with 1.35 persons per household.
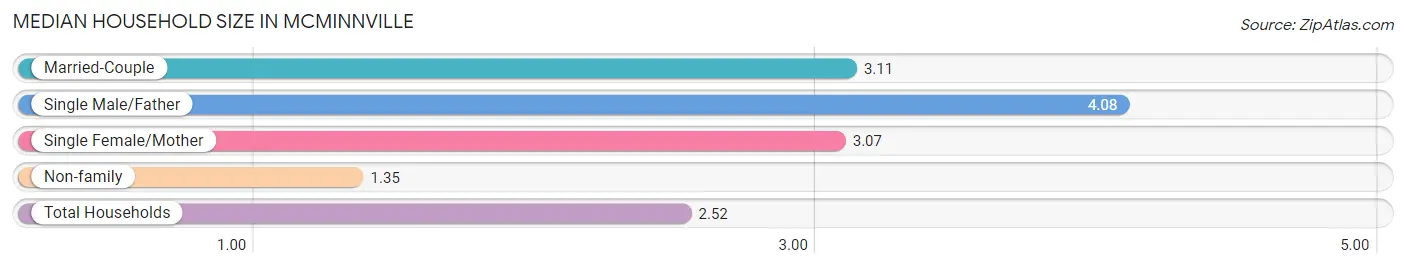
| Household Type | # Households | Household Size |
| Married-Couple | 5,617 (43.6%) | 3.11 |
| Single Male/Father | 460 (3.6%) | 4.08 |
| Single Female/Mother | 2,314 (18.0%) | 3.07 |
| Non-family | 4,496 (34.9%) | 1.35 |
| Total Households | 12,887 (100.0%) | 2.52 |
Household Size by Marriage Status in Mcminnville
Out of a total of 12,887 households in Mcminnville, 8,391 (65.1%) are family households, while 4,496 (34.9%) are nonfamily households. The most numerous type of family households are 2-person households, comprising 4,260, and the most common type of nonfamily households are 1-person households, comprising 3,505.
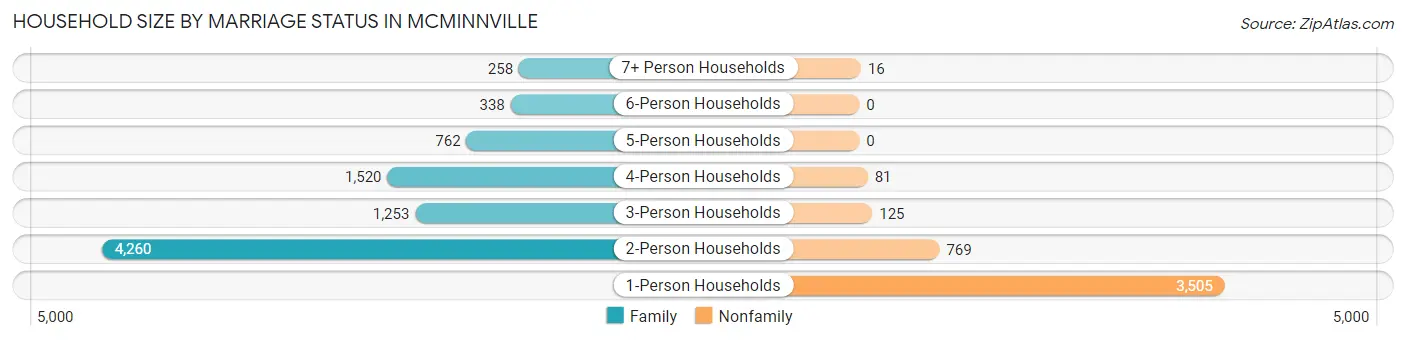
| Household Size | Family Households | Nonfamily Households |
| 1-Person Households | - | 3,505 (27.2%) |
| 2-Person Households | 4,260 (33.1%) | 769 (6.0%) |
| 3-Person Households | 1,253 (9.7%) | 125 (1.0%) |
| 4-Person Households | 1,520 (11.8%) | 81 (0.6%) |
| 5-Person Households | 762 (5.9%) | 0 (0.0%) |
| 6-Person Households | 338 (2.6%) | 0 (0.0%) |
| 7+ Person Households | 258 (2.0%) | 16 (0.1%) |
| Total | 8,391 (65.1%) | 4,496 (34.9%) |
Female Fertility in Mcminnville
Fertility by Age in Mcminnville
Average fertility rate in Mcminnville is 68.0 births per 1,000 women. Women in the age bracket of 20 to 34 years have the highest fertility rate with 122.0 births per 1,000 women. Women in the age bracket of 20 to 34 years acount for 73.3% of all women with births.
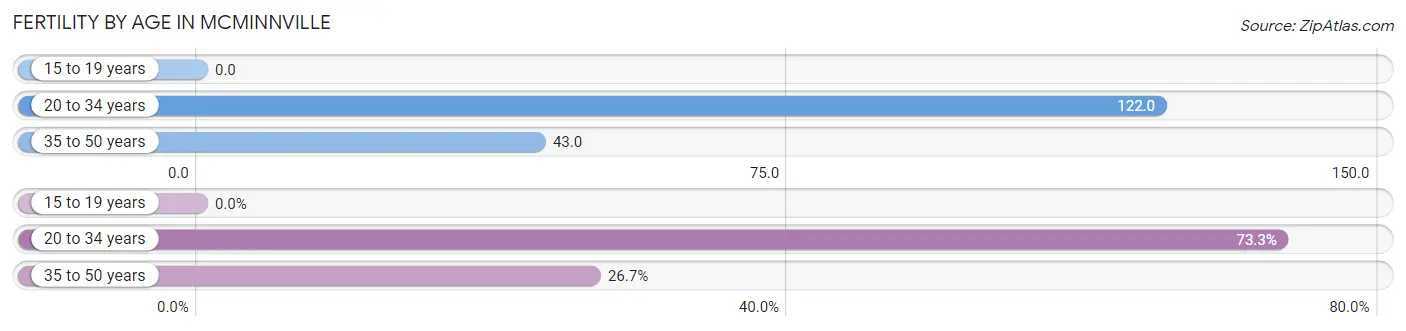
| Age Bracket | Women with Births | Births / 1,000 Women |
| 15 to 19 years | 0 (0.0%) | 0.0 |
| 20 to 34 years | 396 (73.3%) | 122.0 |
| 35 to 50 years | 144 (26.7%) | 43.0 |
| Total | 540 (100.0%) | 68.0 |
Fertility by Age by Marriage Status in Mcminnville
45.9% of women with births (540) in Mcminnville are married. The highest percentage of unmarried women with births falls into 20 to 34 years age bracket with 57.8% of them unmarried at the time of birth, while the lowest percentage of unmarried women with births belong to 35 to 50 years age bracket with 43.8% of them unmarried.
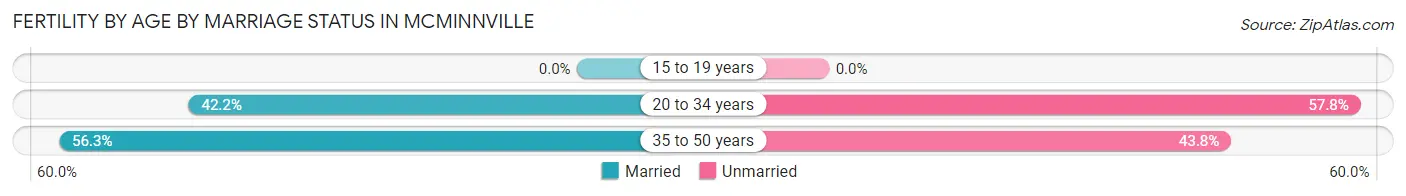
| Age Bracket | Married | Unmarried |
| 15 to 19 years | 0 (0.0%) | 0 (0.0%) |
| 20 to 34 years | 167 (42.2%) | 229 (57.8%) |
| 35 to 50 years | 81 (56.2%) | 63 (43.8%) |
| Total | 248 (45.9%) | 292 (54.1%) |
Fertility by Education in Mcminnville
Average fertility rate in Mcminnville is 68.0 births per 1,000 women. Women with the education attainment of less than high school have the highest fertility rate of 73.0 births per 1,000 women, while women with the education attainment of college or associate's degree have the lowest fertility at 65.0 births per 1,000 women. Women with the education attainment of college or associate's degree represent 33.0% of all women with births.
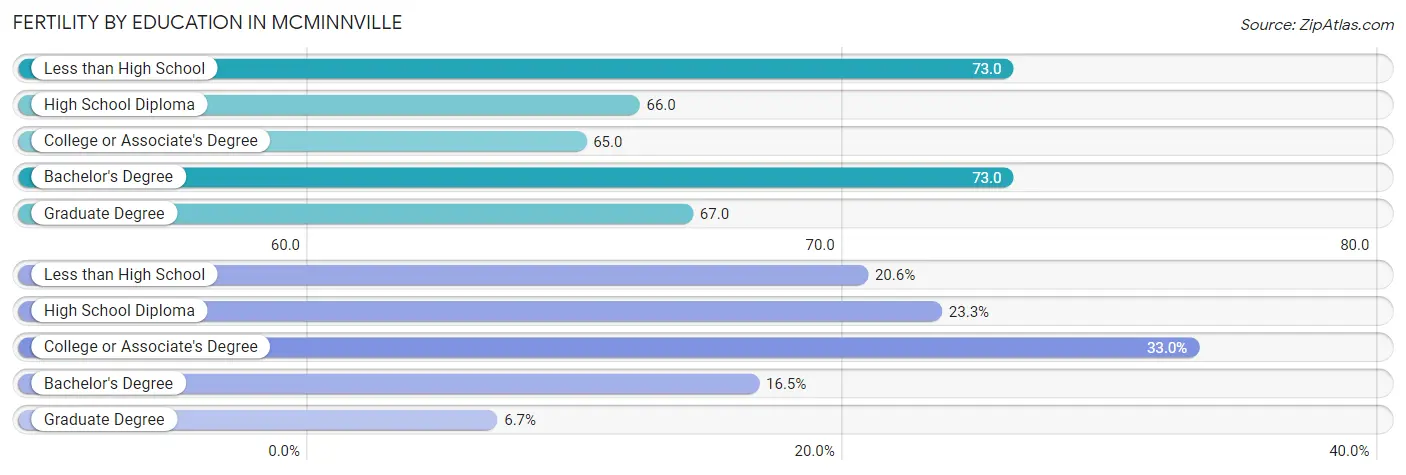
| Educational Attainment | Women with Births | Births / 1,000 Women |
| Less than High School | 111 (20.6%) | 73.0 |
| High School Diploma | 126 (23.3%) | 66.0 |
| College or Associate's Degree | 178 (33.0%) | 65.0 |
| Bachelor's Degree | 89 (16.5%) | 73.0 |
| Graduate Degree | 36 (6.7%) | 67.0 |
| Total | 540 (100.0%) | 68.0 |
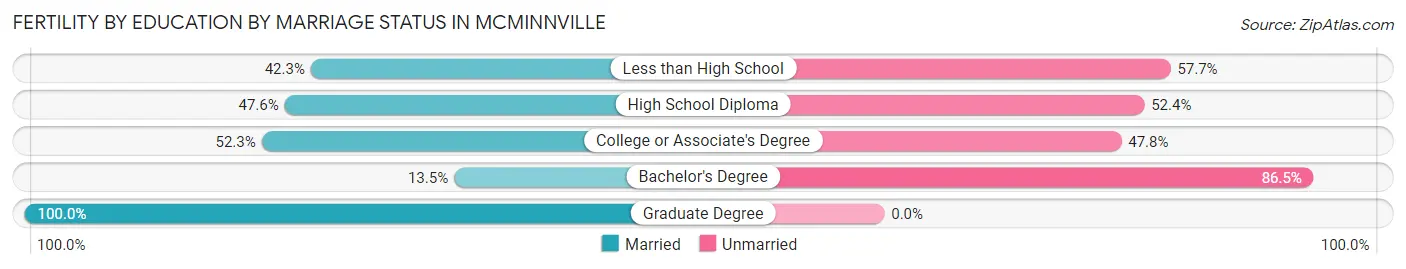
Fertility by Education by Marriage Status in Mcminnville
54.1% of women with births in Mcminnville are unmarried. Women with the educational attainment of graduate degree are most likely to be married with 100.0% of them married at childbirth, while women with the educational attainment of bachelor's degree are least likely to be married with 86.5% of them unmarried at childbirth.
| Educational Attainment | Married | Unmarried |
| Less than High School | 47 (42.3%) | 64 (57.7%) |
| High School Diploma | 60 (47.6%) | 66 (52.4%) |
| College or Associate's Degree | 93 (52.2%) | 85 (47.7%) |
| Bachelor's Degree | 12 (13.5%) | 77 (86.5%) |
| Graduate Degree | 36 (100.0%) | 0 (0.0%) |
| Total | 248 (45.9%) | 292 (54.1%) |
Employment Characteristics in Mcminnville
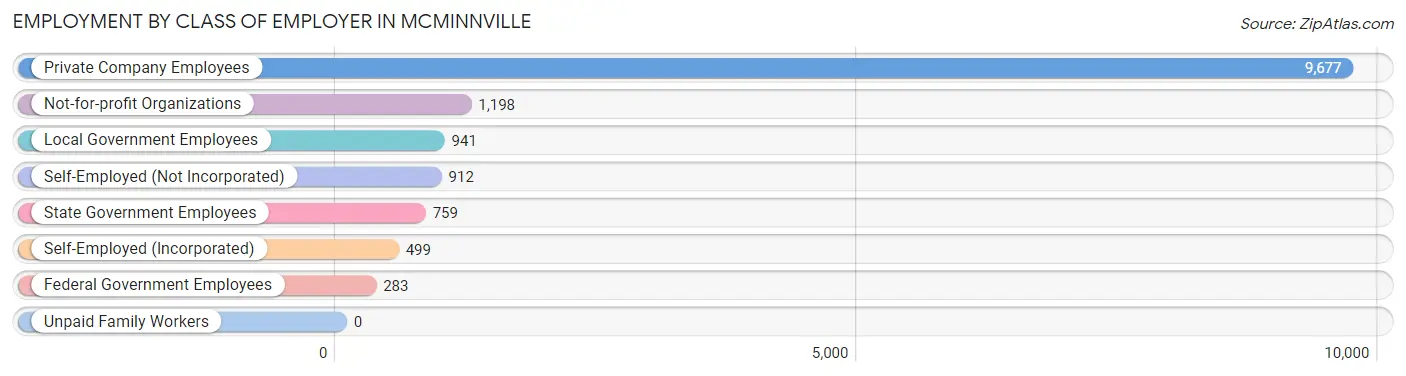
Employment by Class of Employer in Mcminnville
Among the 14,269 employed individuals in Mcminnville, private company employees (9,677 | 67.8%), not-for-profit organizations (1,198 | 8.4%), and local government employees (941 | 6.6%) make up the most common classes of employment.
| Employer Class | # Employees | % Employees |
| Private Company Employees | 9,677 | 67.8% |
| Self-Employed (Incorporated) | 499 | 3.5% |
| Self-Employed (Not Incorporated) | 912 | 6.4% |
| Not-for-profit Organizations | 1,198 | 8.4% |
| Local Government Employees | 941 | 6.6% |
| State Government Employees | 759 | 5.3% |
| Federal Government Employees | 283 | 2.0% |
| Unpaid Family Workers | 0 | 0.0% |
| Total | 14,269 | 100.0% |
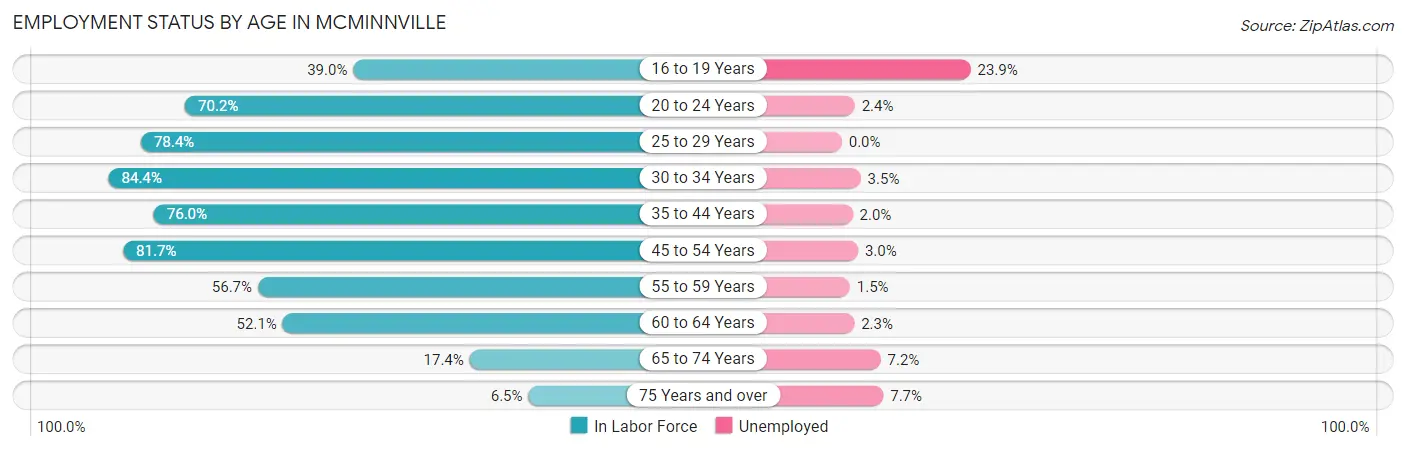
Employment Status by Age in Mcminnville
According to the labor force statistics for Mcminnville, out of the total population over 16 years of age (27,670), 55.3% or 15,302 individuals are in the labor force, with 3.7% or 566 of them unemployed. The age group with the highest labor force participation rate is 30 to 34 years, with 84.4% or 1,894 individuals in the labor force. Within the labor force, the 16 to 19 years age range has the highest percentage of unemployed individuals, with 23.9% or 187 of them being unemployed.
| Age Bracket | In Labor Force | Unemployed |
| 16 to 19 Years | 781 (39.0%) | 187 (23.9%) |
| 20 to 24 Years | 1,915 (70.2%) | 46 (2.4%) |
| 25 to 29 Years | 1,319 (78.4%) | 0 (0.0%) |
| 30 to 34 Years | 1,894 (84.4%) | 66 (3.5%) |
| 35 to 44 Years | 3,007 (76.0%) | 60 (2.0%) |
| 45 to 54 Years | 3,343 (81.7%) | 100 (3.0%) |
| 55 to 59 Years | 1,127 (56.7%) | 17 (1.5%) |
| 60 to 64 Years | 1,046 (52.1%) | 24 (2.3%) |
| 65 to 74 Years | 656 (17.4%) | 47 (7.2%) |
| 75 Years and over | 208 (6.5%) | 16 (7.7%) |
| Total | 15,302 (55.3%) | 566 (3.7%) |
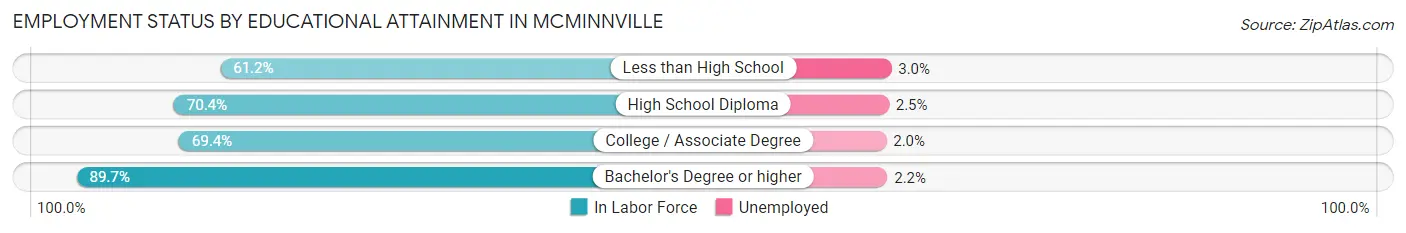
Employment Status by Educational Attainment in Mcminnville
According to labor force statistics for Mcminnville, 73.5% of individuals (11,739) out of the total population between 25 and 64 years of age (15,972) are in the labor force, with 2.3% or 270 of them being unemployed. The group with the highest labor force participation rate are those with the educational attainment of bachelor's degree or higher, with 89.7% or 3,667 individuals in the labor force. Within the labor force, individuals with less than high school education have the highest percentage of unemployment, with 3.0% or 47 of them being unemployed.
| Educational Attainment | In Labor Force | Unemployed |
| Less than High School | 1,560 (61.2%) | 76 (3.0%) |
| High School Diploma | 2,555 (70.4%) | 91 (2.5%) |
| College / Associate Degree | 3,960 (69.4%) | 114 (2.0%) |
| Bachelor's Degree or higher | 3,667 (89.7%) | 90 (2.2%) |
| Total | 11,739 (73.5%) | 367 (2.3%) |
Employment Occupations by Sex in Mcminnville
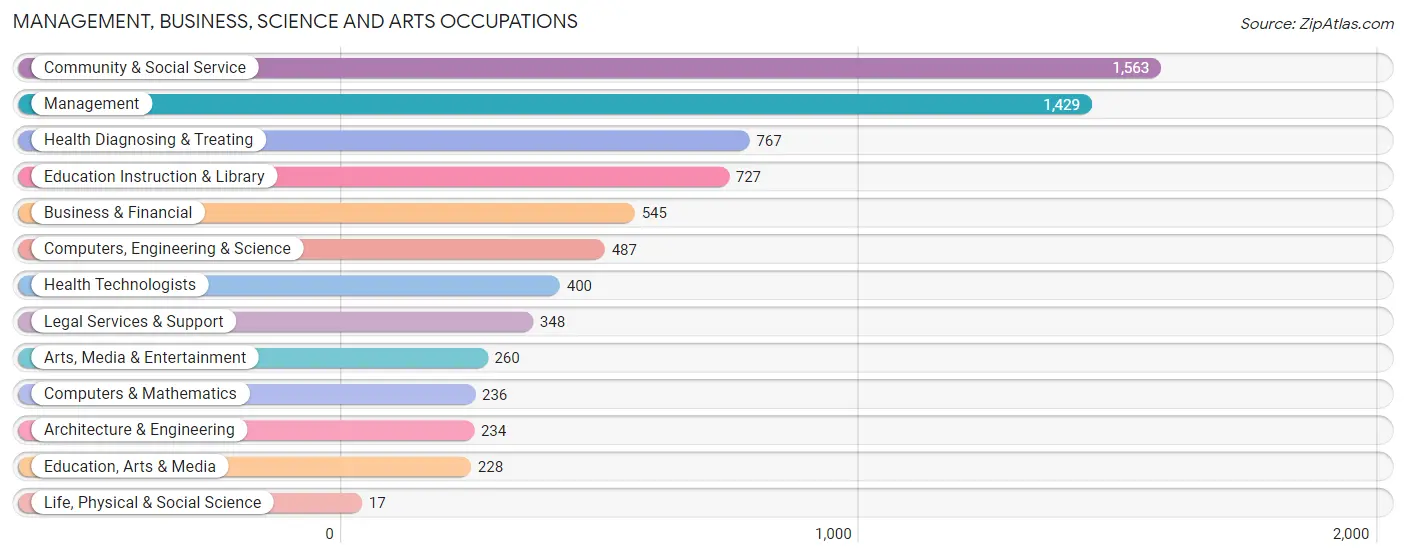
Management, Business, Science and Arts Occupations
The most common Management, Business, Science and Arts occupations in Mcminnville are Community & Social Service (1,563 | 10.6%), Management (1,429 | 9.7%), Health Diagnosing & Treating (767 | 5.2%), Education Instruction & Library (727 | 4.9%), and Business & Financial (545 | 3.7%).
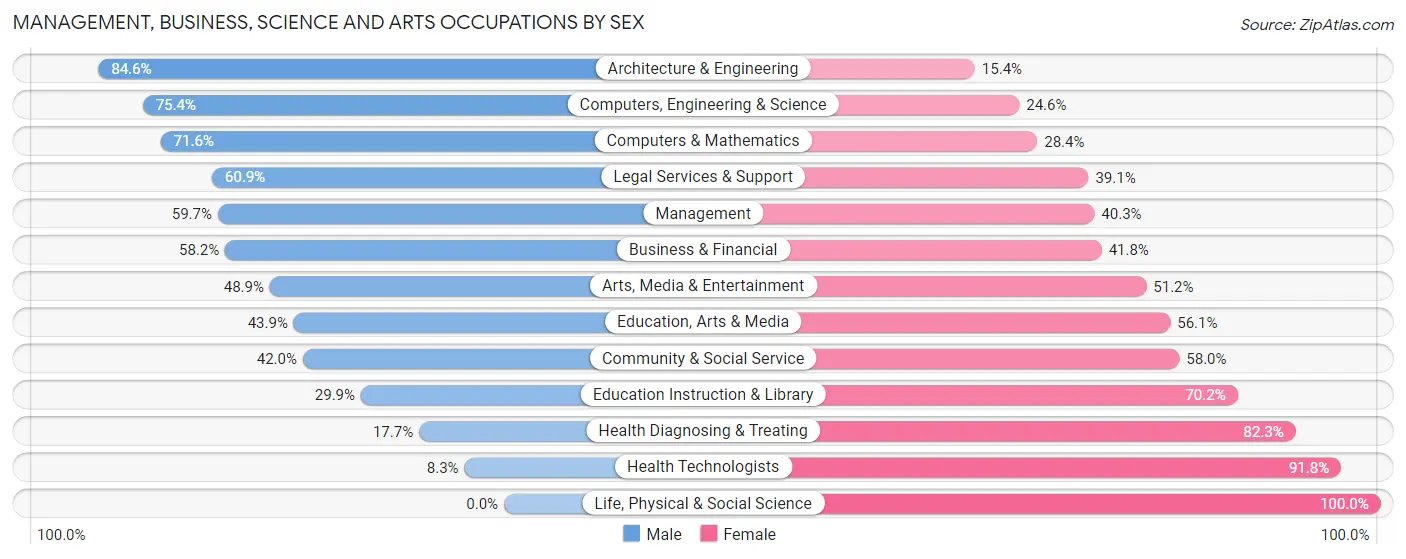
Management, Business, Science and Arts Occupations by Sex
Within the Management, Business, Science and Arts occupations in Mcminnville, the most male-oriented occupations are Architecture & Engineering (84.6%), Computers, Engineering & Science (75.4%), and Computers & Mathematics (71.6%), while the most female-oriented occupations are Life, Physical & Social Science (100.0%), Health Technologists (91.7%), and Health Diagnosing & Treating (82.3%).
| Occupation | Male | Female |
| Management | 853 (59.7%) | 576 (40.3%) |
| Business & Financial | 317 (58.2%) | 228 (41.8%) |
| Computers, Engineering & Science | 367 (75.4%) | 120 (24.6%) |
| Computers & Mathematics | 169 (71.6%) | 67 (28.4%) |
| Architecture & Engineering | 198 (84.6%) | 36 (15.4%) |
| Life, Physical & Social Science | 0 (0.0%) | 17 (100.0%) |
| Community & Social Service | 656 (42.0%) | 907 (58.0%) |
| Education, Arts & Media | 100 (43.9%) | 128 (56.1%) |
| Legal Services & Support | 212 (60.9%) | 136 (39.1%) |
| Education Instruction & Library | 217 (29.8%) | 510 (70.2%) |
| Arts, Media & Entertainment | 127 (48.8%) | 133 (51.1%) |
| Health Diagnosing & Treating | 136 (17.7%) | 631 (82.3%) |
| Health Technologists | 33 (8.3%) | 367 (91.7%) |
| Total (Category) | 2,329 (48.6%) | 2,462 (51.4%) |
| Total (Overall) | 7,614 (51.8%) | 7,089 (48.2%) |
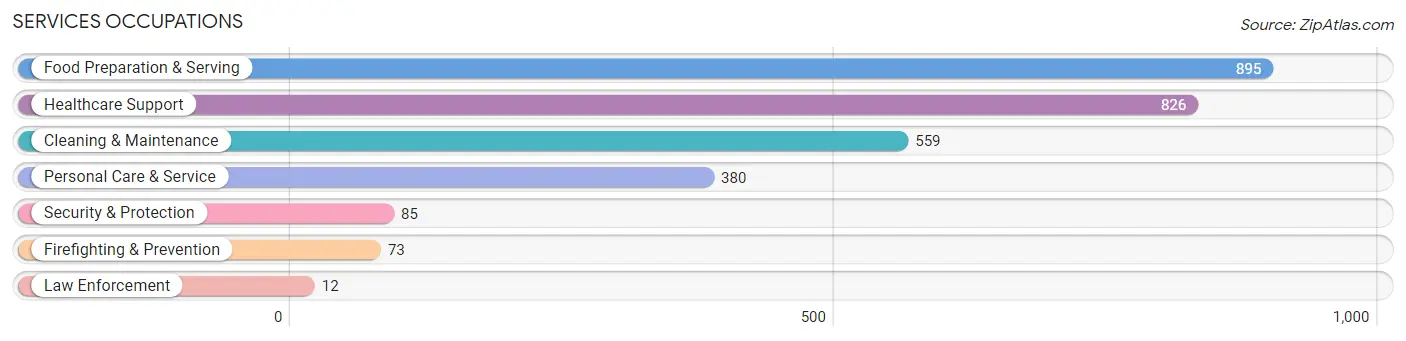
Services Occupations
The most common Services occupations in Mcminnville are Food Preparation & Serving (895 | 6.1%), Healthcare Support (826 | 5.6%), Cleaning & Maintenance (559 | 3.8%), Personal Care & Service (380 | 2.6%), and Security & Protection (85 | 0.6%).
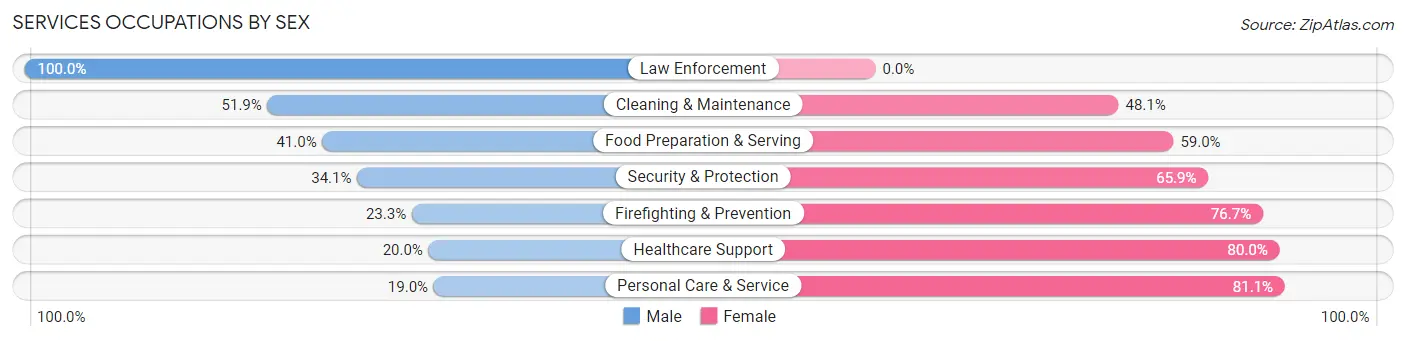
Services Occupations by Sex
Within the Services occupations in Mcminnville, the most male-oriented occupations are Law Enforcement (100.0%), Cleaning & Maintenance (51.9%), and Food Preparation & Serving (41.0%), while the most female-oriented occupations are Personal Care & Service (81.0%), Healthcare Support (80.0%), and Firefighting & Prevention (76.7%).
| Occupation | Male | Female |
| Healthcare Support | 165 (20.0%) | 661 (80.0%) |
| Security & Protection | 29 (34.1%) | 56 (65.9%) |
| Firefighting & Prevention | 17 (23.3%) | 56 (76.7%) |
| Law Enforcement | 12 (100.0%) | 0 (0.0%) |
| Food Preparation & Serving | 367 (41.0%) | 528 (59.0%) |
| Cleaning & Maintenance | 290 (51.9%) | 269 (48.1%) |
| Personal Care & Service | 72 (19.0%) | 308 (81.0%) |
| Total (Category) | 923 (33.6%) | 1,822 (66.4%) |
| Total (Overall) | 7,614 (51.8%) | 7,089 (48.2%) |
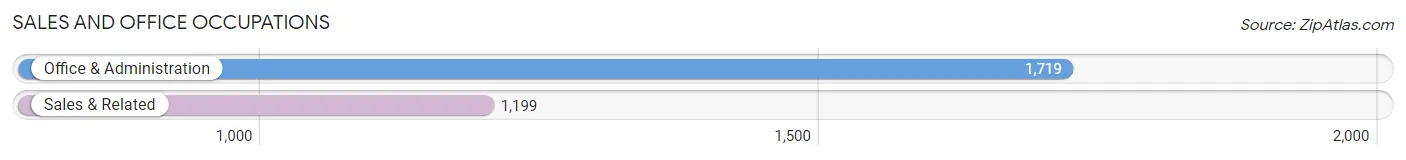
Sales and Office Occupations
The most common Sales and Office occupations in Mcminnville are Office & Administration (1,719 | 11.7%), and Sales & Related (1,199 | 8.2%).
Sales and Office Occupations by Sex
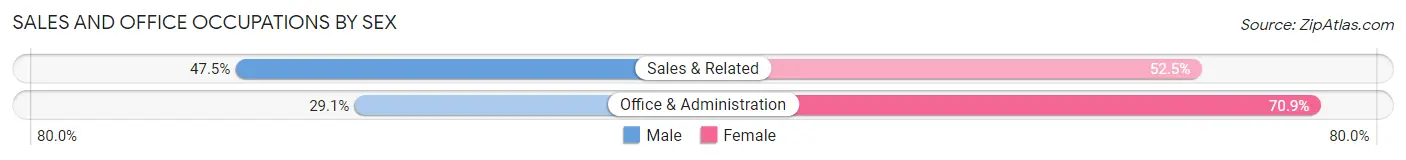
| Occupation | Male | Female |
| Sales & Related | 569 (47.5%) | 630 (52.5%) |
| Office & Administration | 501 (29.1%) | 1,218 (70.9%) |
| Total (Category) | 1,070 (36.7%) | 1,848 (63.3%) |
| Total (Overall) | 7,614 (51.8%) | 7,089 (48.2%) |
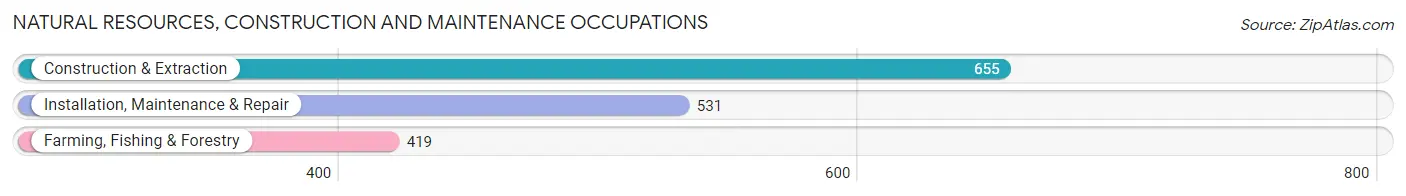
Natural Resources, Construction and Maintenance Occupations
The most common Natural Resources, Construction and Maintenance occupations in Mcminnville are Construction & Extraction (655 | 4.4%), Installation, Maintenance & Repair (531 | 3.6%), and Farming, Fishing & Forestry (419 | 2.9%).
Natural Resources, Construction and Maintenance Occupations by Sex
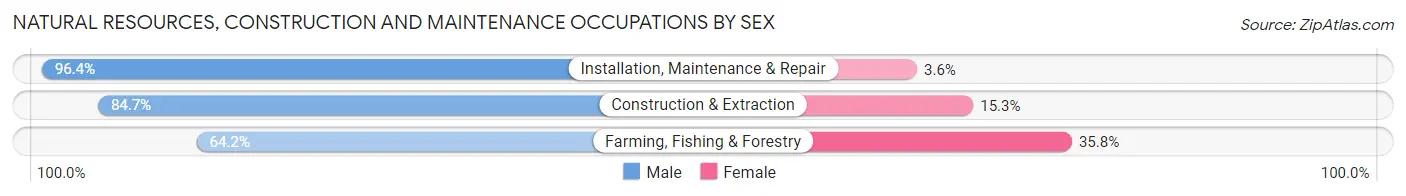
| Occupation | Male | Female |
| Farming, Fishing & Forestry | 269 (64.2%) | 150 (35.8%) |
| Construction & Extraction | 555 (84.7%) | 100 (15.3%) |
| Installation, Maintenance & Repair | 512 (96.4%) | 19 (3.6%) |
| Total (Category) | 1,336 (83.2%) | 269 (16.8%) |
| Total (Overall) | 7,614 (51.8%) | 7,089 (48.2%) |
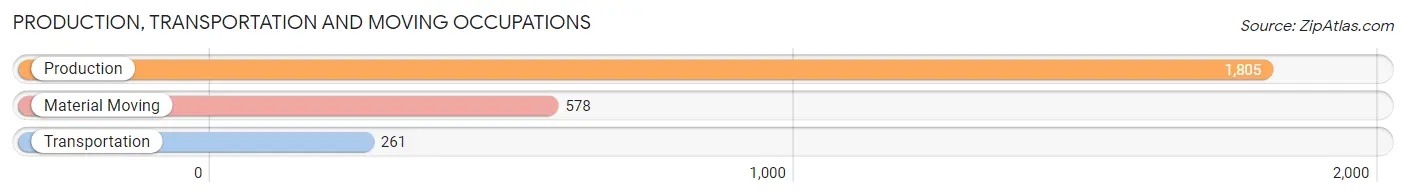
Production, Transportation and Moving Occupations
The most common Production, Transportation and Moving occupations in Mcminnville are Production (1,805 | 12.3%), Material Moving (578 | 3.9%), and Transportation (261 | 1.8%).
Production, Transportation and Moving Occupations by Sex
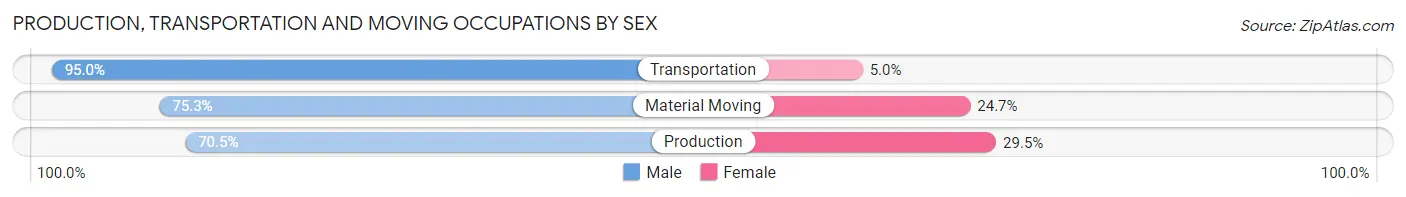
| Occupation | Male | Female |
| Production | 1,273 (70.5%) | 532 (29.5%) |
| Transportation | 248 (95.0%) | 13 (5.0%) |
| Material Moving | 435 (75.3%) | 143 (24.7%) |
| Total (Category) | 1,956 (74.0%) | 688 (26.0%) |
| Total (Overall) | 7,614 (51.8%) | 7,089 (48.2%) |
Employment Industries by Sex in Mcminnville
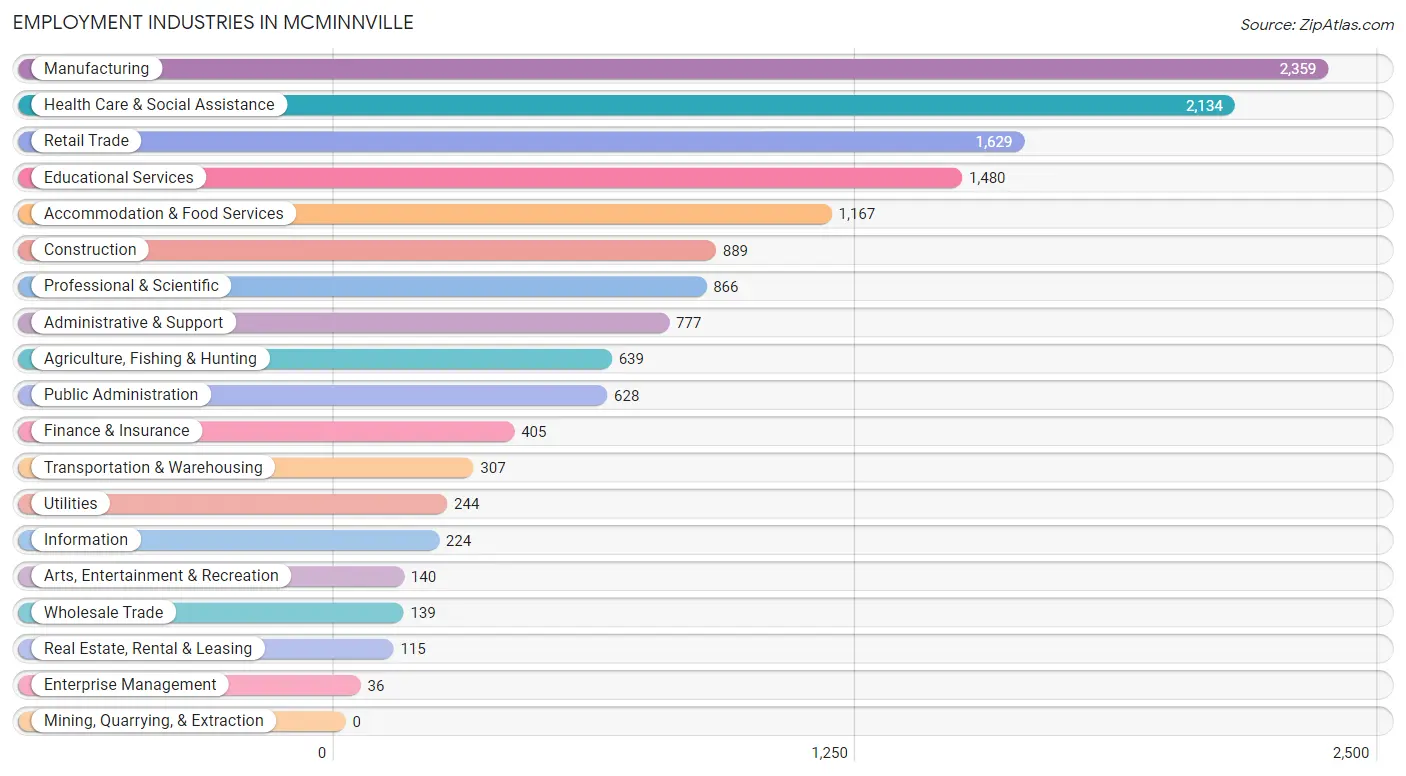
Employment Industries in Mcminnville
The major employment industries in Mcminnville include Manufacturing (2,359 | 16.0%), Health Care & Social Assistance (2,134 | 14.5%), Retail Trade (1,629 | 11.1%), Educational Services (1,480 | 10.1%), and Accommodation & Food Services (1,167 | 7.9%).
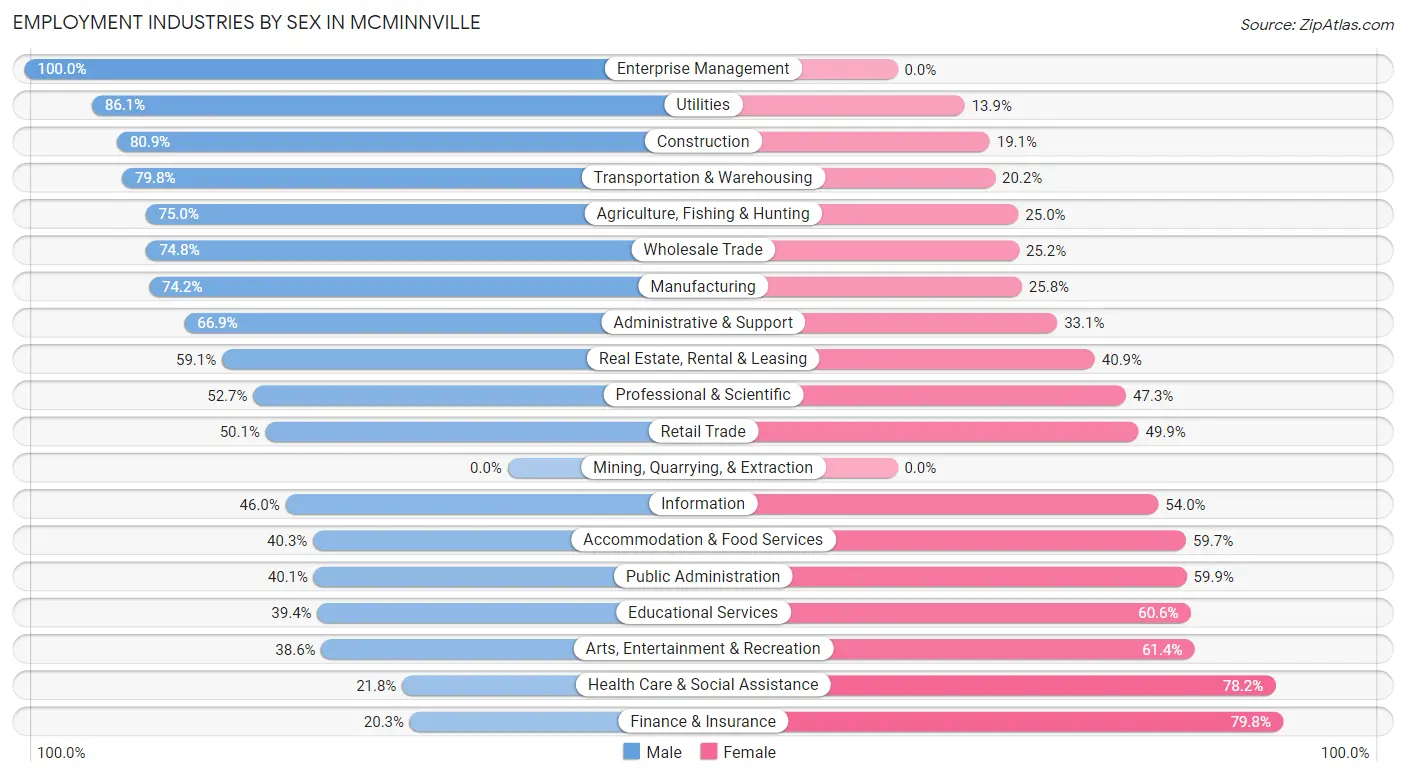
Employment Industries by Sex in Mcminnville
The Mcminnville industries that see more men than women are Enterprise Management (100.0%), Utilities (86.1%), and Construction (80.9%), whereas the industries that tend to have a higher number of women are Finance & Insurance (79.7%), Health Care & Social Assistance (78.2%), and Arts, Entertainment & Recreation (61.4%).
| Industry | Male | Female |
| Agriculture, Fishing & Hunting | 479 (75.0%) | 160 (25.0%) |
| Mining, Quarrying, & Extraction | 0 (0.0%) | 0 (0.0%) |
| Construction | 719 (80.9%) | 170 (19.1%) |
| Manufacturing | 1,751 (74.2%) | 608 (25.8%) |
| Wholesale Trade | 104 (74.8%) | 35 (25.2%) |
| Retail Trade | 816 (50.1%) | 813 (49.9%) |
| Transportation & Warehousing | 245 (79.8%) | 62 (20.2%) |
| Utilities | 210 (86.1%) | 34 (13.9%) |
| Information | 103 (46.0%) | 121 (54.0%) |
| Finance & Insurance | 82 (20.3%) | 323 (79.7%) |
| Real Estate, Rental & Leasing | 68 (59.1%) | 47 (40.9%) |
| Professional & Scientific | 456 (52.7%) | 410 (47.3%) |
| Enterprise Management | 36 (100.0%) | 0 (0.0%) |
| Administrative & Support | 520 (66.9%) | 257 (33.1%) |
| Educational Services | 583 (39.4%) | 897 (60.6%) |
| Health Care & Social Assistance | 466 (21.8%) | 1,668 (78.2%) |
| Arts, Entertainment & Recreation | 54 (38.6%) | 86 (61.4%) |
| Accommodation & Food Services | 470 (40.3%) | 697 (59.7%) |
| Public Administration | 252 (40.1%) | 376 (59.9%) |
| Total | 7,614 (51.8%) | 7,089 (48.2%) |
Education in Mcminnville
School Enrollment in Mcminnville
The most common levels of schooling among the 8,710 students in Mcminnville are college / undergraduate (2,199 | 25.3%), middle school (2,031 | 23.3%), and elementary school (1,974 | 22.7%).
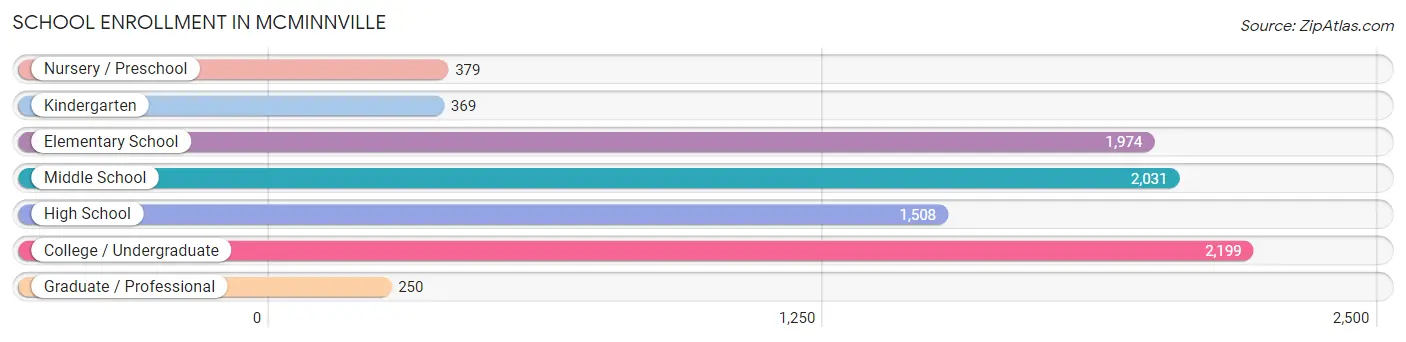
| School Level | # Students | % Students |
| Nursery / Preschool | 379 | 4.3% |
| Kindergarten | 369 | 4.2% |
| Elementary School | 1,974 | 22.7% |
| Middle School | 2,031 | 23.3% |
| High School | 1,508 | 17.3% |
| College / Undergraduate | 2,199 | 25.3% |
| Graduate / Professional | 250 | 2.9% |
| Total | 8,710 | 100.0% |
School Enrollment by Age by Funding Source in Mcminnville
Out of a total of 8,710 students who are enrolled in schools in Mcminnville, 1,855 (21.3%) attend a private institution, while the remaining 6,855 (78.7%) are enrolled in public schools. The age group of 18 to 19 year olds has the highest likelihood of being enrolled in private schools, with 485 (58.7% in the age bracket) enrolled. Conversely, the age group of 15 to 17 year olds has the lowest likelihood of being enrolled in a private school, with 1,187 (98.1% in the age bracket) attending a public institution.
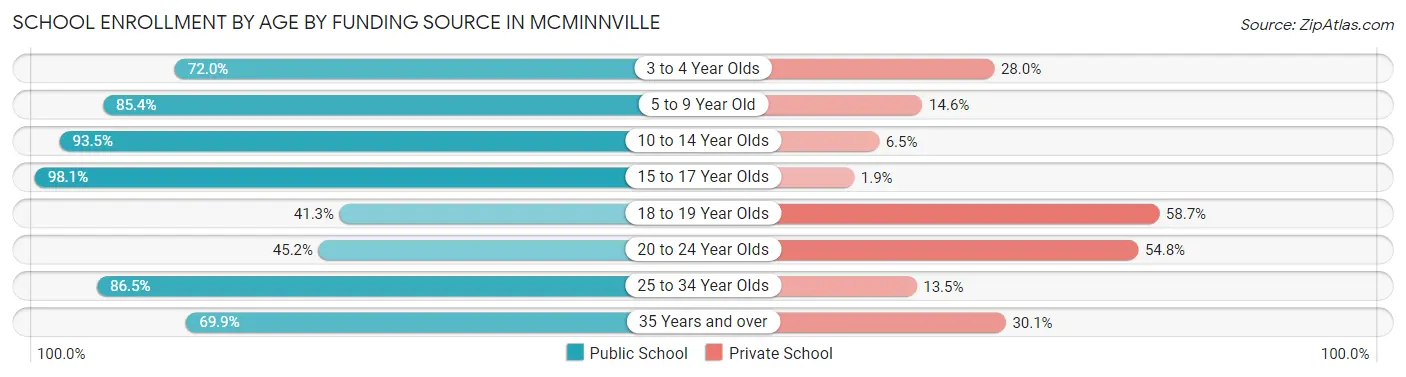
| Age Bracket | Public School | Private School |
| 3 to 4 Year Olds | 162 (72.0%) | 63 (28.0%) |
| 5 to 9 Year Old | 1,950 (85.4%) | 334 (14.6%) |
| 10 to 14 Year Olds | 2,203 (93.5%) | 154 (6.5%) |
| 15 to 17 Year Olds | 1,187 (98.1%) | 23 (1.9%) |
| 18 to 19 Year Olds | 341 (41.3%) | 485 (58.7%) |
| 20 to 24 Year Olds | 549 (45.2%) | 666 (54.8%) |
| 25 to 34 Year Olds | 243 (86.5%) | 38 (13.5%) |
| 35 Years and over | 218 (69.9%) | 94 (30.1%) |
| Total | 6,855 (78.7%) | 1,855 (21.3%) |
Educational Attainment by Field of Study in Mcminnville
Business (892 | 13.4%), education (868 | 13.0%), social sciences (750 | 11.2%), bio, nature & agricultural (681 | 10.2%), and engineering (500 | 7.5%) are the most common fields of study among 6,683 individuals in Mcminnville who have obtained a bachelor's degree or higher.
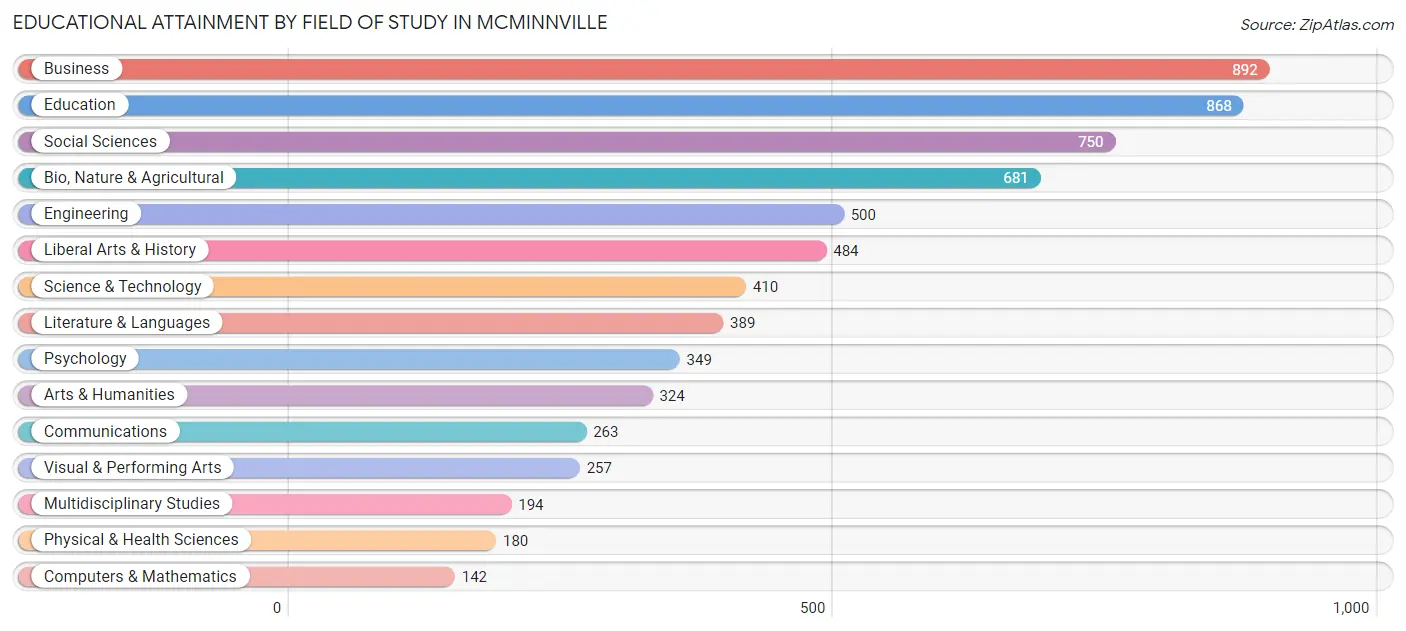
| Field of Study | # Graduates | % Graduates |
| Computers & Mathematics | 142 | 2.1% |
| Bio, Nature & Agricultural | 681 | 10.2% |
| Physical & Health Sciences | 180 | 2.7% |
| Psychology | 349 | 5.2% |
| Social Sciences | 750 | 11.2% |
| Engineering | 500 | 7.5% |
| Multidisciplinary Studies | 194 | 2.9% |
| Science & Technology | 410 | 6.1% |
| Business | 892 | 13.4% |
| Education | 868 | 13.0% |
| Literature & Languages | 389 | 5.8% |
| Liberal Arts & History | 484 | 7.2% |
| Visual & Performing Arts | 257 | 3.8% |
| Communications | 263 | 3.9% |
| Arts & Humanities | 324 | 4.9% |
| Total | 6,683 | 100.0% |
Transportation & Commute in Mcminnville
Vehicle Availability by Sex in Mcminnville
The most prevalent vehicle ownership categories in Mcminnville are males with 2 vehicles (3,241, accounting for 43.8%) and females with 2 vehicles (3,026, making up 50.9%).
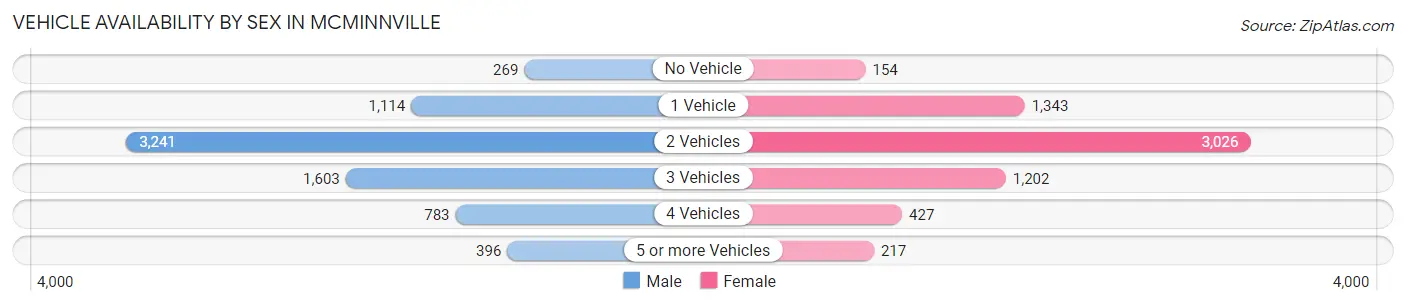
| Vehicles Available | Male | Female |
| No Vehicle | 269 (3.6%) | 154 (2.4%) |
| 1 Vehicle | 1,114 (15.0%) | 1,343 (21.1%) |
| 2 Vehicles | 3,241 (43.8%) | 3,026 (47.5%) |
| 3 Vehicles | 1,603 (21.6%) | 1,202 (18.9%) |
| 4 Vehicles | 783 (10.6%) | 427 (6.7%) |
| 5 or more Vehicles | 396 (5.3%) | 217 (3.4%) |
| Total | 7,406 (100.0%) | 6,369 (100.0%) |
Commute Time in Mcminnville
The most frequently occuring commute durations in Mcminnville are 5 to 9 minutes (3,422 commuters, 26.7%), 10 to 14 minutes (2,480 commuters, 19.3%), and 45 to 59 minutes (1,187 commuters, 9.3%).
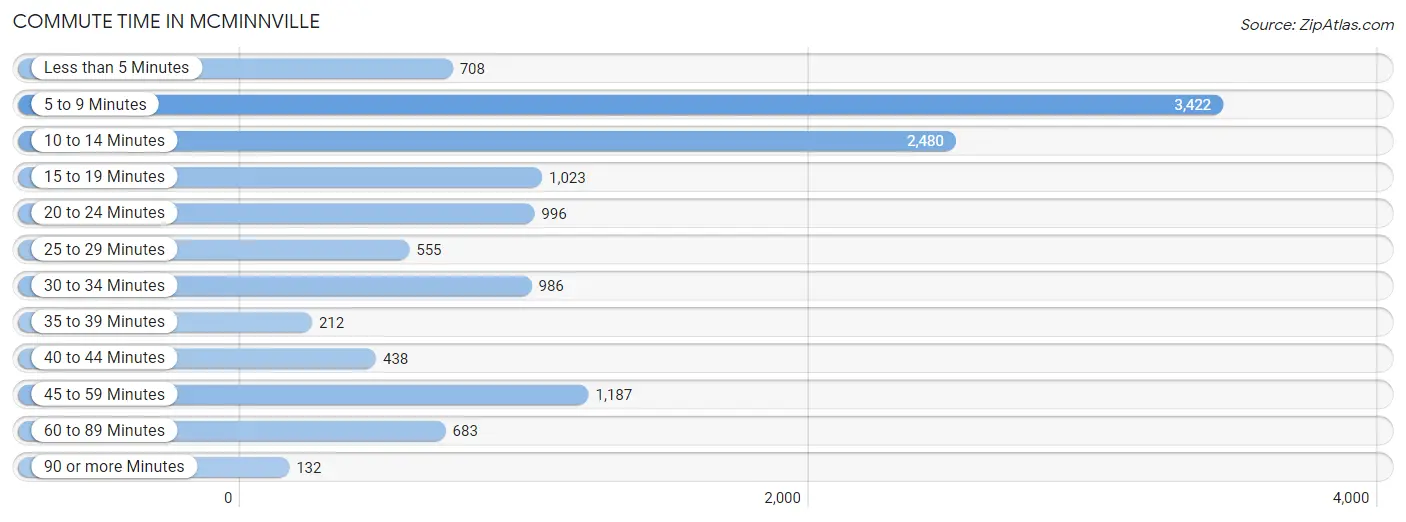
| Commute Time | # Commuters | % Commuters |
| Less than 5 Minutes | 708 | 5.5% |
| 5 to 9 Minutes | 3,422 | 26.7% |
| 10 to 14 Minutes | 2,480 | 19.3% |
| 15 to 19 Minutes | 1,023 | 8.0% |
| 20 to 24 Minutes | 996 | 7.8% |
| 25 to 29 Minutes | 555 | 4.3% |
| 30 to 34 Minutes | 986 | 7.7% |
| 35 to 39 Minutes | 212 | 1.7% |
| 40 to 44 Minutes | 438 | 3.4% |
| 45 to 59 Minutes | 1,187 | 9.3% |
| 60 to 89 Minutes | 683 | 5.3% |
| 90 or more Minutes | 132 | 1.0% |
Commute Time by Sex in Mcminnville
The most common commute times in Mcminnville are 5 to 9 minutes (1,267 commuters, 18.5%) for males and 5 to 9 minutes (2,155 commuters, 36.1%) for females.
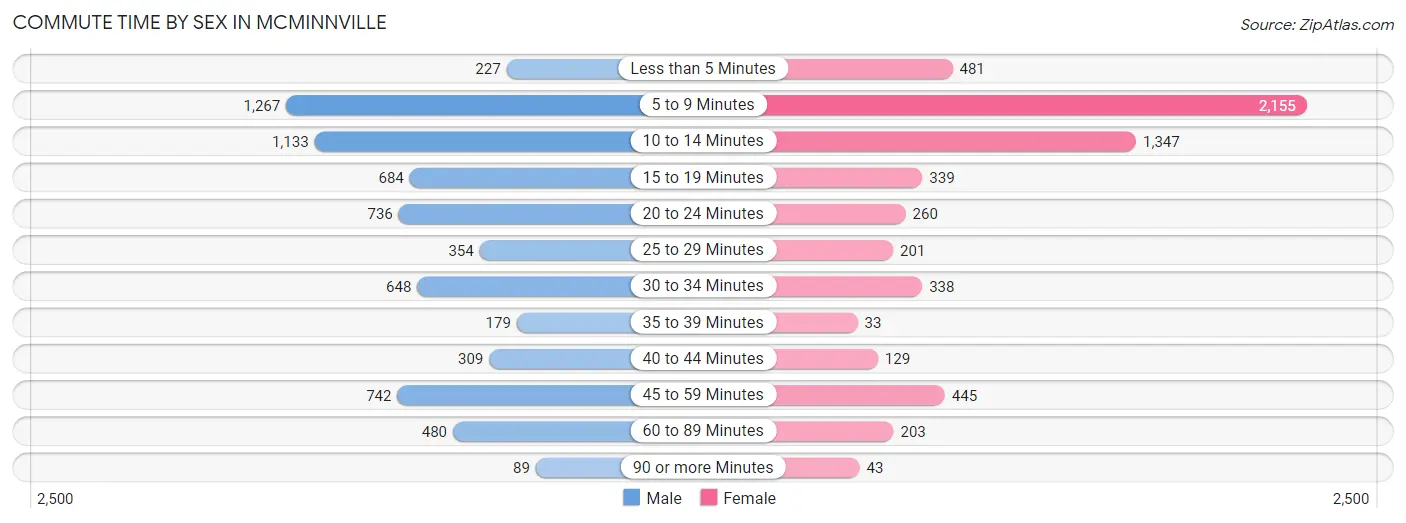
| Commute Time | Male | Female |
| Less than 5 Minutes | 227 (3.3%) | 481 (8.1%) |
| 5 to 9 Minutes | 1,267 (18.5%) | 2,155 (36.1%) |
| 10 to 14 Minutes | 1,133 (16.5%) | 1,347 (22.6%) |
| 15 to 19 Minutes | 684 (10.0%) | 339 (5.7%) |
| 20 to 24 Minutes | 736 (10.7%) | 260 (4.3%) |
| 25 to 29 Minutes | 354 (5.2%) | 201 (3.4%) |
| 30 to 34 Minutes | 648 (9.5%) | 338 (5.7%) |
| 35 to 39 Minutes | 179 (2.6%) | 33 (0.5%) |
| 40 to 44 Minutes | 309 (4.5%) | 129 (2.2%) |
| 45 to 59 Minutes | 742 (10.8%) | 445 (7.4%) |
| 60 to 89 Minutes | 480 (7.0%) | 203 (3.4%) |
| 90 or more Minutes | 89 (1.3%) | 43 (0.7%) |
Time of Departure to Work by Sex in Mcminnville
The most frequent times of departure to work in Mcminnville are 7:00 AM to 7:29 AM (799, 11.7%) for males and 7:30 AM to 7:59 AM (1,174, 19.7%) for females.
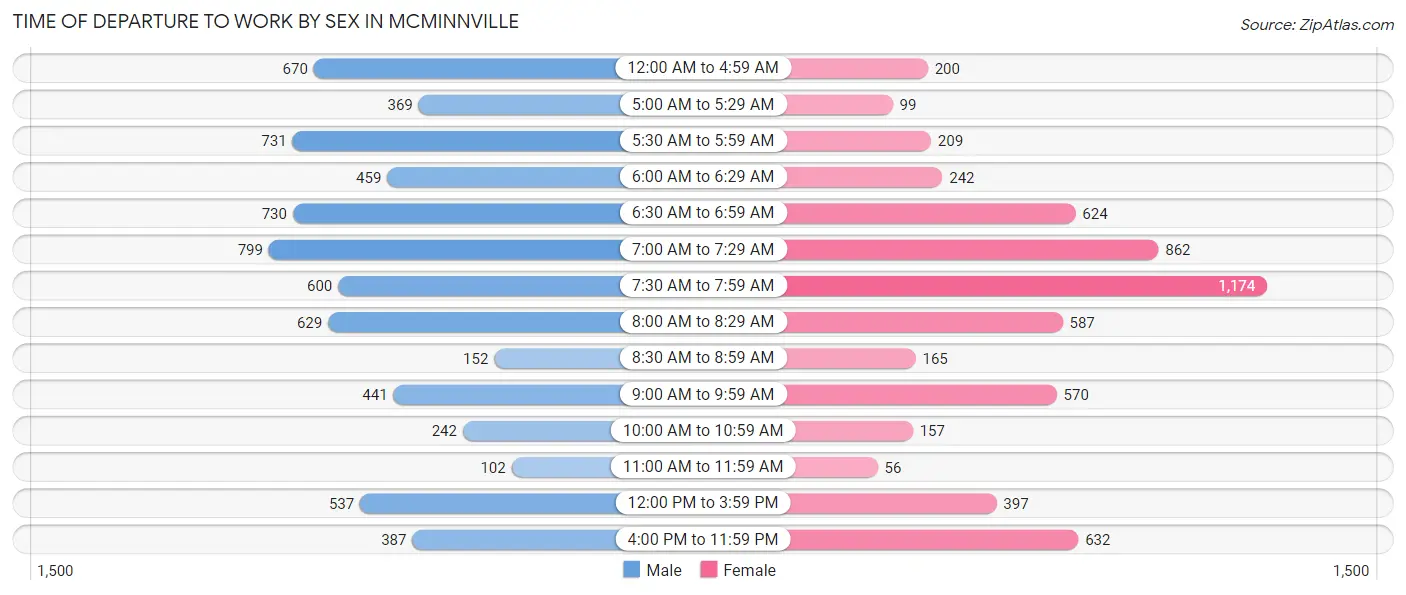
| Time of Departure | Male | Female |
| 12:00 AM to 4:59 AM | 670 (9.8%) | 200 (3.4%) |
| 5:00 AM to 5:29 AM | 369 (5.4%) | 99 (1.7%) |
| 5:30 AM to 5:59 AM | 731 (10.7%) | 209 (3.5%) |
| 6:00 AM to 6:29 AM | 459 (6.7%) | 242 (4.1%) |
| 6:30 AM to 6:59 AM | 730 (10.7%) | 624 (10.4%) |
| 7:00 AM to 7:29 AM | 799 (11.7%) | 862 (14.4%) |
| 7:30 AM to 7:59 AM | 600 (8.8%) | 1,174 (19.7%) |
| 8:00 AM to 8:29 AM | 629 (9.2%) | 587 (9.8%) |
| 8:30 AM to 8:59 AM | 152 (2.2%) | 165 (2.8%) |
| 9:00 AM to 9:59 AM | 441 (6.4%) | 570 (9.5%) |
| 10:00 AM to 10:59 AM | 242 (3.5%) | 157 (2.6%) |
| 11:00 AM to 11:59 AM | 102 (1.5%) | 56 (0.9%) |
| 12:00 PM to 3:59 PM | 537 (7.8%) | 397 (6.7%) |
| 4:00 PM to 11:59 PM | 387 (5.7%) | 632 (10.6%) |
| Total | 6,848 (100.0%) | 5,974 (100.0%) |
Housing Occupancy in Mcminnville
Occupancy by Ownership in Mcminnville
Of the total 12,887 dwellings in Mcminnville, owner-occupied units account for 7,931 (61.5%), while renter-occupied units make up 4,956 (38.5%).
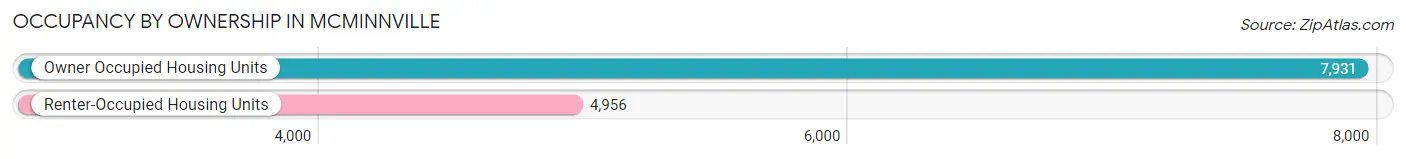
| Occupancy | # Housing Units | % Housing Units |
| Owner Occupied Housing Units | 7,931 | 61.5% |
| Renter-Occupied Housing Units | 4,956 | 38.5% |
| Total Occupied Housing Units | 12,887 | 100.0% |
Occupancy by Household Size in Mcminnville
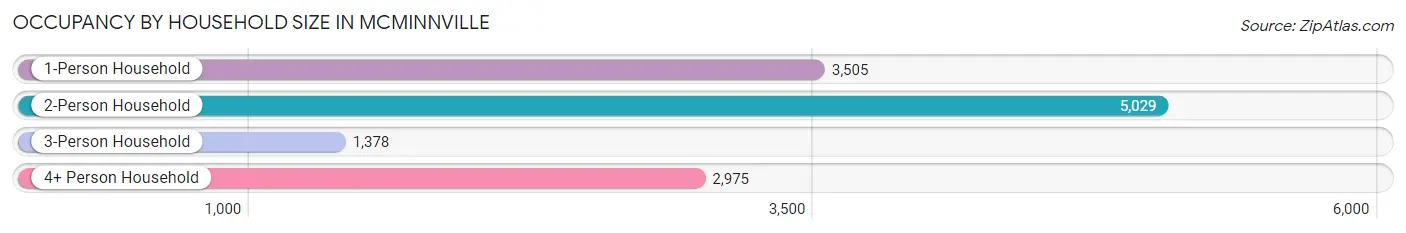
| Household Size | # Housing Units | % Housing Units |
| 1-Person Household | 3,505 | 27.2% |
| 2-Person Household | 5,029 | 39.0% |
| 3-Person Household | 1,378 | 10.7% |
| 4+ Person Household | 2,975 | 23.1% |
| Total Housing Units | 12,887 | 100.0% |
Occupancy by Ownership by Household Size in Mcminnville
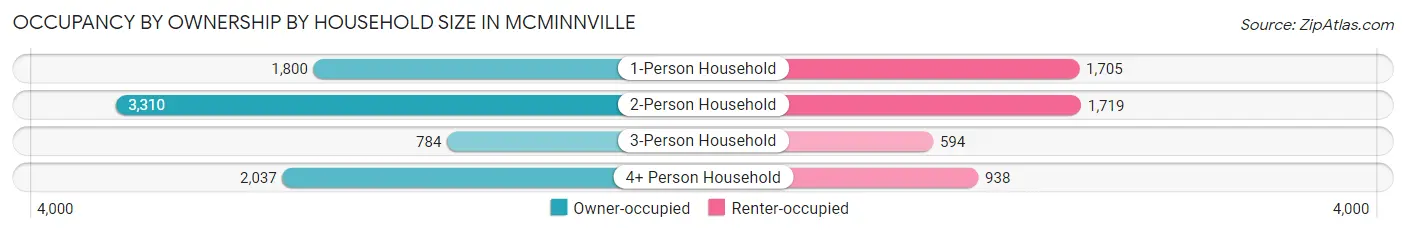
| Household Size | Owner-occupied | Renter-occupied |
| 1-Person Household | 1,800 (51.4%) | 1,705 (48.6%) |
| 2-Person Household | 3,310 (65.8%) | 1,719 (34.2%) |
| 3-Person Household | 784 (56.9%) | 594 (43.1%) |
| 4+ Person Household | 2,037 (68.5%) | 938 (31.5%) |
| Total Housing Units | 7,931 (61.5%) | 4,956 (38.5%) |
Occupancy by Educational Attainment in Mcminnville
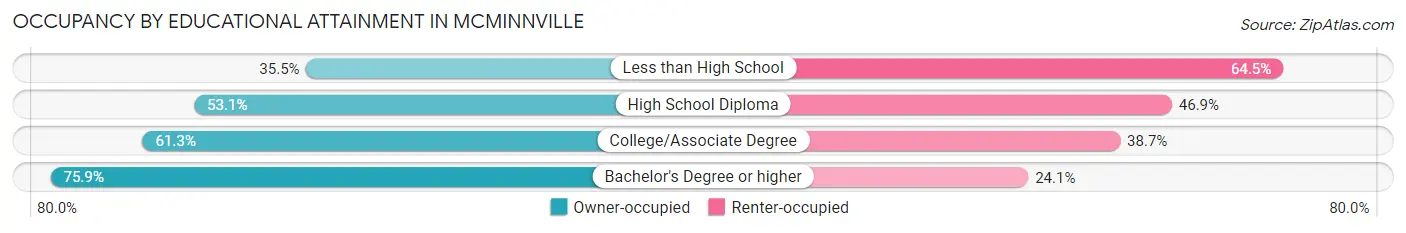
| Household Size | Owner-occupied | Renter-occupied |
| Less than High School | 439 (35.5%) | 799 (64.5%) |
| High School Diploma | 1,491 (53.1%) | 1,317 (46.9%) |
| College/Associate Degree | 2,975 (61.3%) | 1,878 (38.7%) |
| Bachelor's Degree or higher | 3,026 (75.9%) | 962 (24.1%) |
Occupancy by Age of Householder in Mcminnville
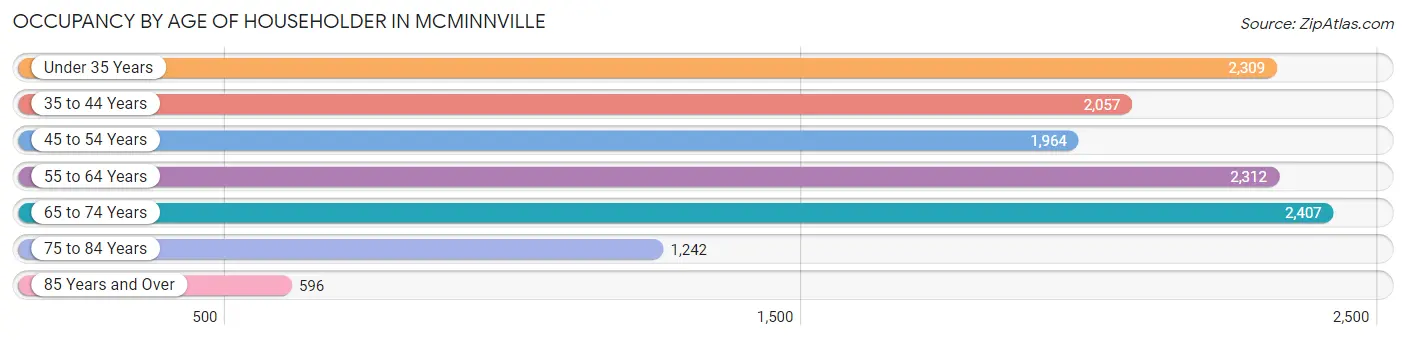
| Age Bracket | # Households | % Households |
| Under 35 Years | 2,309 | 17.9% |
| 35 to 44 Years | 2,057 | 16.0% |
| 45 to 54 Years | 1,964 | 15.2% |
| 55 to 64 Years | 2,312 | 17.9% |
| 65 to 74 Years | 2,407 | 18.7% |
| 75 to 84 Years | 1,242 | 9.6% |
| 85 Years and Over | 596 | 4.6% |
| Total | 12,887 | 100.0% |
Housing Finances in Mcminnville
Median Income by Occupancy in Mcminnville
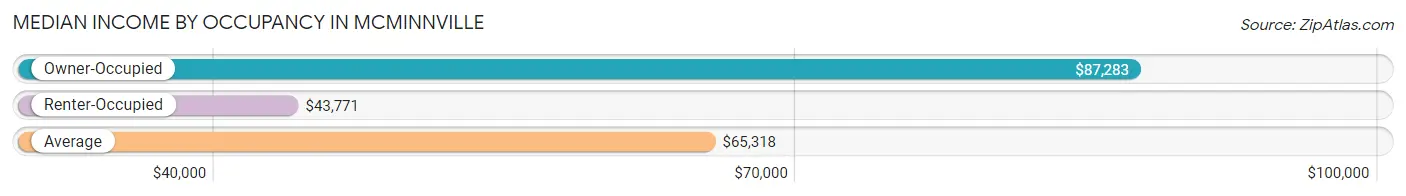
| Occupancy Type | # Households | Median Income |
| Owner-Occupied | 7,931 (61.5%) | $87,283 |
| Renter-Occupied | 4,956 (38.5%) | $43,771 |
| Average | 12,887 (100.0%) | $65,318 |
Occupancy by Householder Income Bracket in Mcminnville
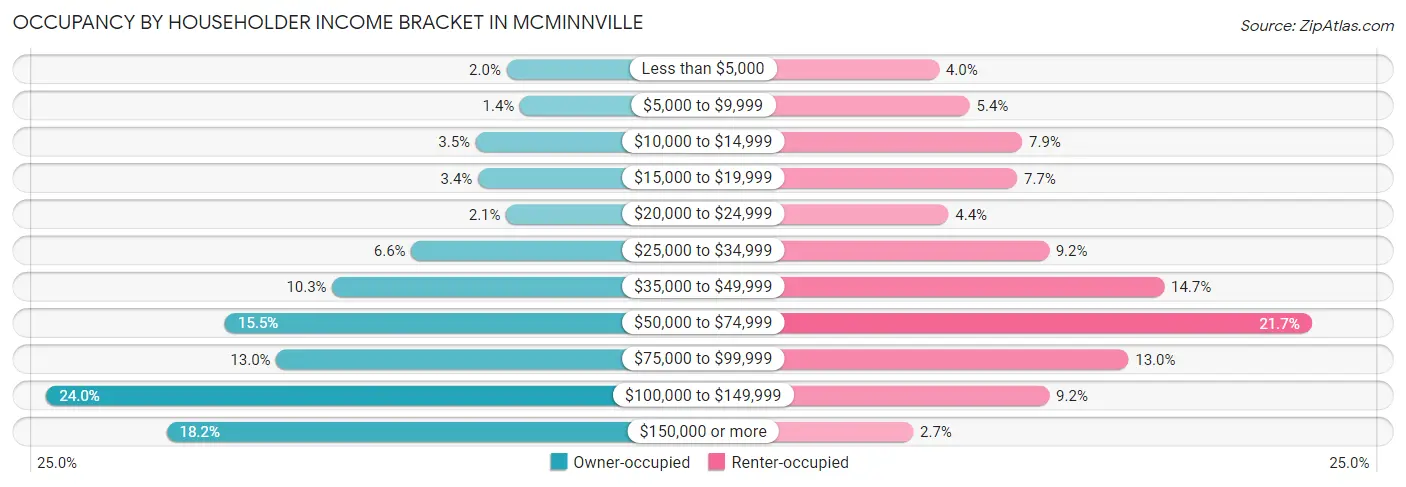
| Income Bracket | Owner-occupied | Renter-occupied |
| Less than $5,000 | 162 (2.0%) | 197 (4.0%) |
| $5,000 to $9,999 | 111 (1.4%) | 269 (5.4%) |
| $10,000 to $14,999 | 278 (3.5%) | 393 (7.9%) |
| $15,000 to $19,999 | 270 (3.4%) | 381 (7.7%) |
| $20,000 to $24,999 | 163 (2.1%) | 219 (4.4%) |
| $25,000 to $34,999 | 522 (6.6%) | 456 (9.2%) |
| $35,000 to $49,999 | 820 (10.3%) | 728 (14.7%) |
| $50,000 to $74,999 | 1,226 (15.5%) | 1,076 (21.7%) |
| $75,000 to $99,999 | 1,032 (13.0%) | 644 (13.0%) |
| $100,000 to $149,999 | 1,900 (24.0%) | 457 (9.2%) |
| $150,000 or more | 1,447 (18.2%) | 136 (2.7%) |
| Total | 7,931 (100.0%) | 4,956 (100.0%) |
Monthly Housing Cost Tiers in Mcminnville
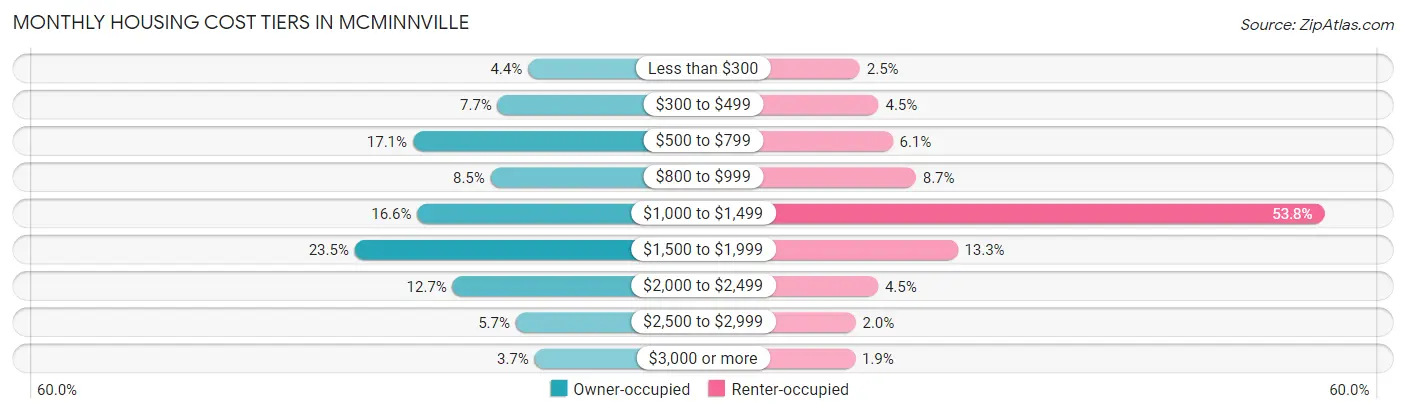
| Monthly Cost | Owner-occupied | Renter-occupied |
| Less than $300 | 347 (4.4%) | 123 (2.5%) |
| $300 to $499 | 614 (7.7%) | 225 (4.5%) |
| $500 to $799 | 1,357 (17.1%) | 302 (6.1%) |
| $800 to $999 | 676 (8.5%) | 429 (8.7%) |
| $1,000 to $1,499 | 1,318 (16.6%) | 2,666 (53.8%) |
| $1,500 to $1,999 | 1,866 (23.5%) | 657 (13.3%) |
| $2,000 to $2,499 | 1,008 (12.7%) | 222 (4.5%) |
| $2,500 to $2,999 | 455 (5.7%) | 99 (2.0%) |
| $3,000 or more | 290 (3.7%) | 96 (1.9%) |
| Total | 7,931 (100.0%) | 4,956 (100.0%) |
Physical Housing Characteristics in Mcminnville
Housing Structures in Mcminnville
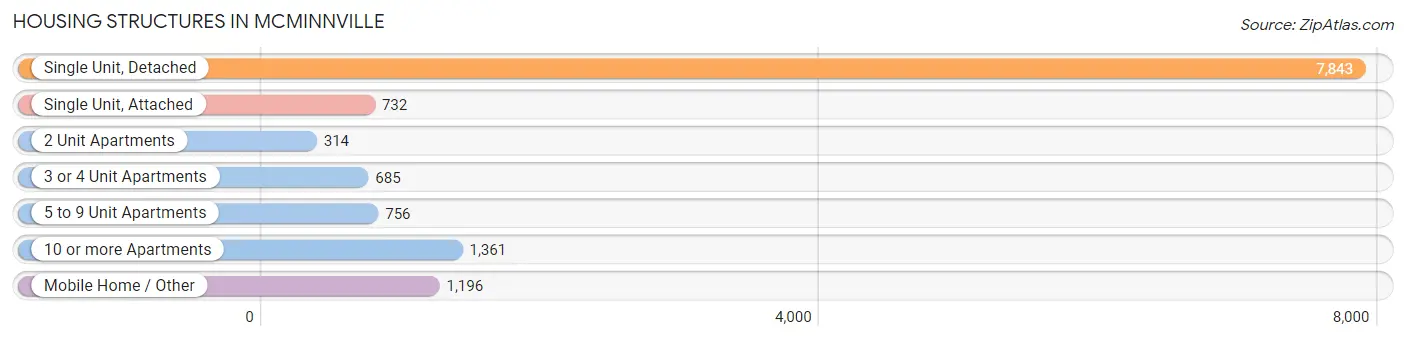
| Structure Type | # Housing Units | % Housing Units |
| Single Unit, Detached | 7,843 | 60.9% |
| Single Unit, Attached | 732 | 5.7% |
| 2 Unit Apartments | 314 | 2.4% |
| 3 or 4 Unit Apartments | 685 | 5.3% |
| 5 to 9 Unit Apartments | 756 | 5.9% |
| 10 or more Apartments | 1,361 | 10.6% |
| Mobile Home / Other | 1,196 | 9.3% |
| Total | 12,887 | 100.0% |
Housing Structures by Occupancy in Mcminnville
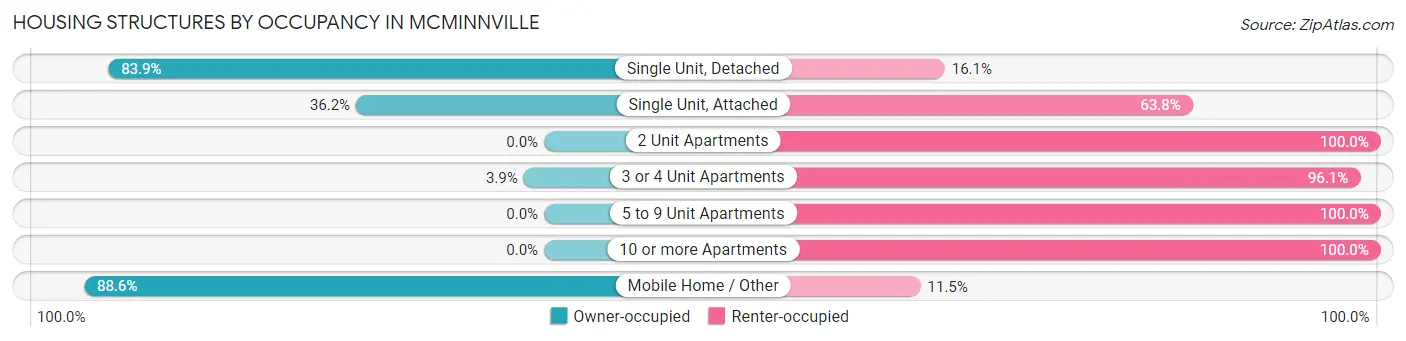
| Structure Type | Owner-occupied | Renter-occupied |
| Single Unit, Detached | 6,580 (83.9%) | 1,263 (16.1%) |
| Single Unit, Attached | 265 (36.2%) | 467 (63.8%) |
| 2 Unit Apartments | 0 (0.0%) | 314 (100.0%) |
| 3 or 4 Unit Apartments | 27 (3.9%) | 658 (96.1%) |
| 5 to 9 Unit Apartments | 0 (0.0%) | 756 (100.0%) |
| 10 or more Apartments | 0 (0.0%) | 1,361 (100.0%) |
| Mobile Home / Other | 1,059 (88.5%) | 137 (11.5%) |
| Total | 7,931 (61.5%) | 4,956 (38.5%) |
Housing Structures by Number of Rooms in Mcminnville
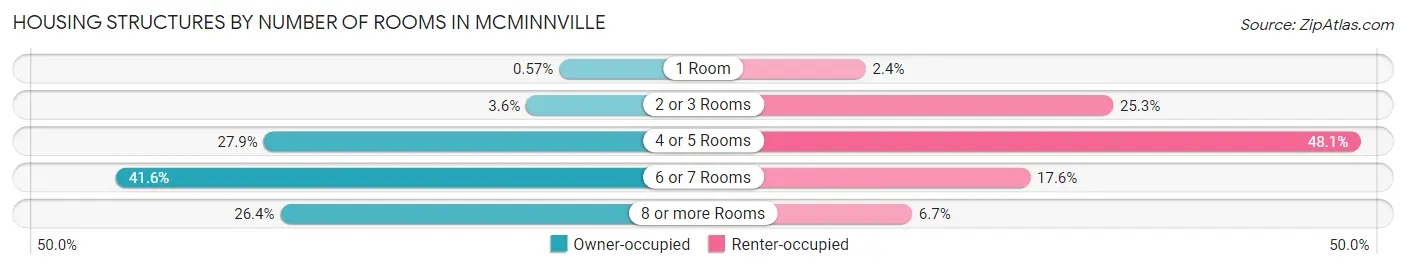
| Number of Rooms | Owner-occupied | Renter-occupied |
| 1 Room | 45 (0.6%) | 118 (2.4%) |
| 2 or 3 Rooms | 288 (3.6%) | 1,252 (25.3%) |
| 4 or 5 Rooms | 2,213 (27.9%) | 2,384 (48.1%) |
| 6 or 7 Rooms | 3,295 (41.5%) | 872 (17.6%) |
| 8 or more Rooms | 2,090 (26.4%) | 330 (6.7%) |
| Total | 7,931 (100.0%) | 4,956 (100.0%) |
Housing Structure by Heating Type in Mcminnville
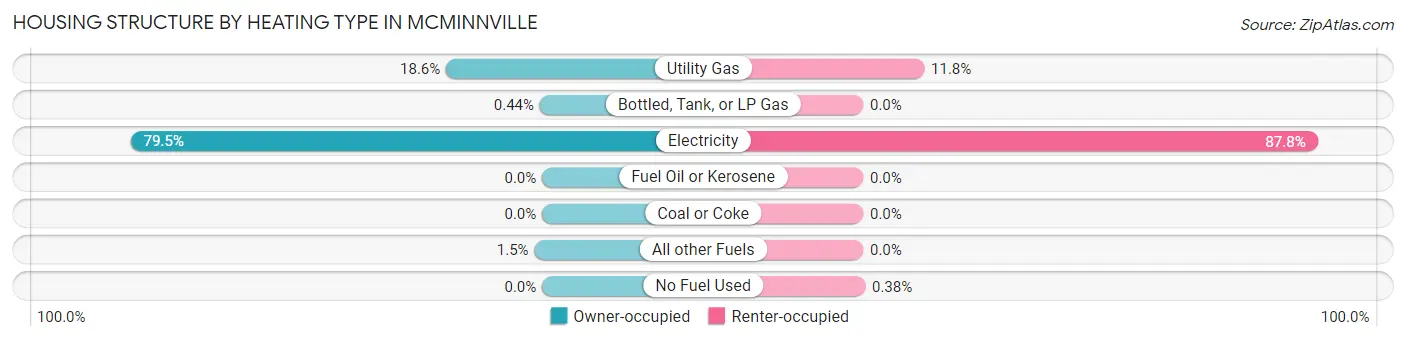
| Heating Type | Owner-occupied | Renter-occupied |
| Utility Gas | 1,471 (18.5%) | 585 (11.8%) |
| Bottled, Tank, or LP Gas | 35 (0.4%) | 0 (0.0%) |
| Electricity | 6,307 (79.5%) | 4,352 (87.8%) |
| Fuel Oil or Kerosene | 0 (0.0%) | 0 (0.0%) |
| Coal or Coke | 0 (0.0%) | 0 (0.0%) |
| All other Fuels | 118 (1.5%) | 0 (0.0%) |
| No Fuel Used | 0 (0.0%) | 19 (0.4%) |
| Total | 7,931 (100.0%) | 4,956 (100.0%) |
Household Vehicle Usage in Mcminnville
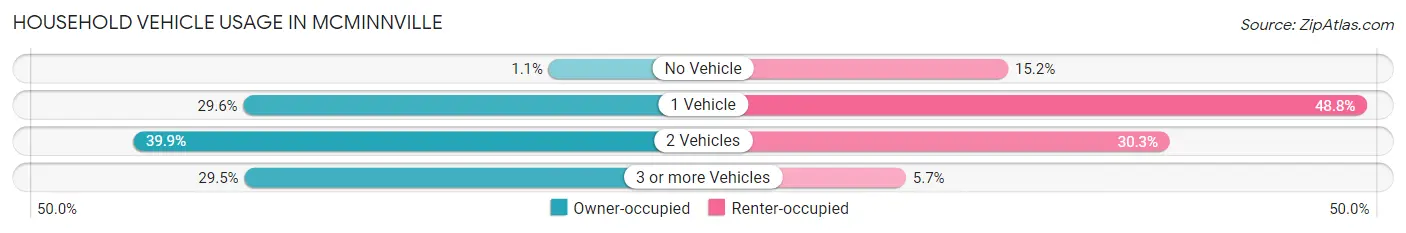
| Vehicles per Household | Owner-occupied | Renter-occupied |
| No Vehicle | 84 (1.1%) | 755 (15.2%) |
| 1 Vehicle | 2,345 (29.6%) | 2,416 (48.7%) |
| 2 Vehicles | 3,164 (39.9%) | 1,503 (30.3%) |
| 3 or more Vehicles | 2,338 (29.5%) | 282 (5.7%) |
| Total | 7,931 (100.0%) | 4,956 (100.0%) |
Real Estate & Mortgages in Mcminnville
Real Estate and Mortgage Overview in Mcminnville
| Characteristic | Without Mortgage | With Mortgage |
| Housing Units | 2,738 | 5,193 |
| Median Property Value | $313,600 | $388,000 |
| Median Household Income | $54,615 | $1,141 |
| Monthly Housing Costs | $600 | $290 |
| Real Estate Taxes | $3,337 | $150 |
Property Value by Mortgage Status in Mcminnville
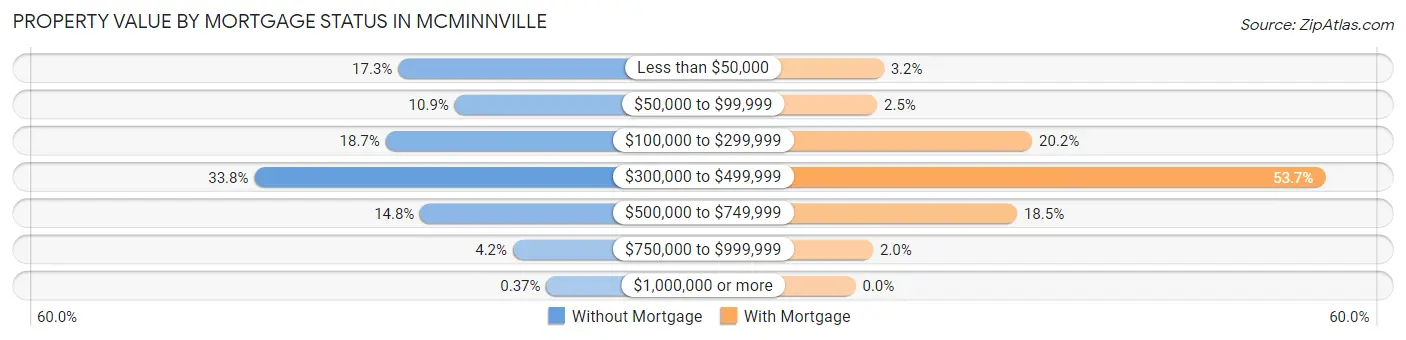
| Property Value | Without Mortgage | With Mortgage |
| Less than $50,000 | 474 (17.3%) | 167 (3.2%) |
| $50,000 to $99,999 | 297 (10.8%) | 128 (2.5%) |
| $100,000 to $299,999 | 513 (18.7%) | 1,048 (20.2%) |
| $300,000 to $499,999 | 924 (33.8%) | 2,788 (53.7%) |
| $500,000 to $749,999 | 405 (14.8%) | 958 (18.4%) |
| $750,000 to $999,999 | 115 (4.2%) | 104 (2.0%) |
| $1,000,000 or more | 10 (0.4%) | 0 (0.0%) |
| Total | 2,738 (100.0%) | 5,193 (100.0%) |
Household Income by Mortgage Status in Mcminnville
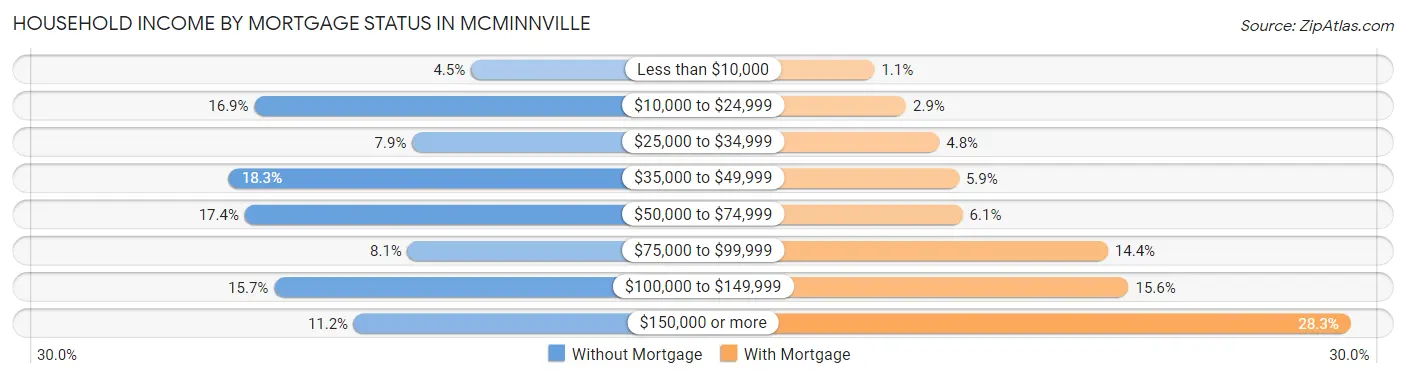
| Household Income | Without Mortgage | With Mortgage |
| Less than $10,000 | 123 (4.5%) | 56 (1.1%) |
| $10,000 to $24,999 | 462 (16.9%) | 150 (2.9%) |
| $25,000 to $34,999 | 215 (7.9%) | 249 (4.8%) |
| $35,000 to $49,999 | 502 (18.3%) | 307 (5.9%) |
| $50,000 to $74,999 | 477 (17.4%) | 318 (6.1%) |
| $75,000 to $99,999 | 222 (8.1%) | 749 (14.4%) |
| $100,000 to $149,999 | 431 (15.7%) | 810 (15.6%) |
| $150,000 or more | 306 (11.2%) | 1,469 (28.3%) |
| Total | 2,738 (100.0%) | 5,193 (100.0%) |
Property Value to Household Income Ratio in Mcminnville
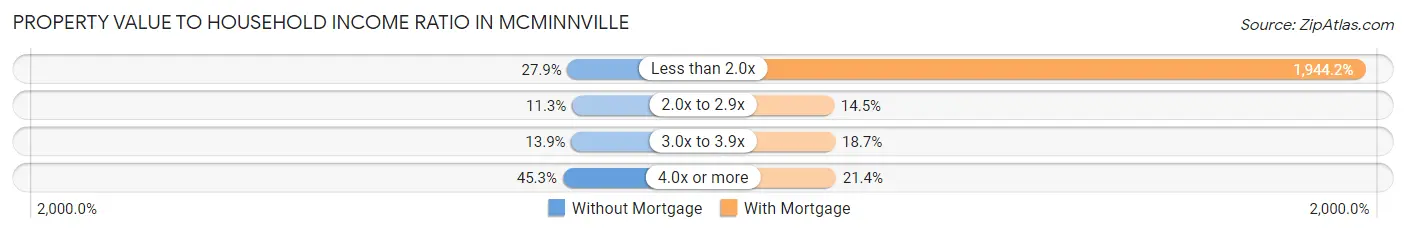
| Value-to-Income Ratio | Without Mortgage | With Mortgage |
| Less than 2.0x | 764 (27.9%) | 100,964 (1,944.2%) |
| 2.0x to 2.9x | 308 (11.3%) | 754 (14.5%) |
| 3.0x to 3.9x | 380 (13.9%) | 972 (18.7%) |
| 4.0x or more | 1,239 (45.3%) | 1,113 (21.4%) |
| Total | 2,738 (100.0%) | 5,193 (100.0%) |
Real Estate Taxes by Mortgage Status in Mcminnville
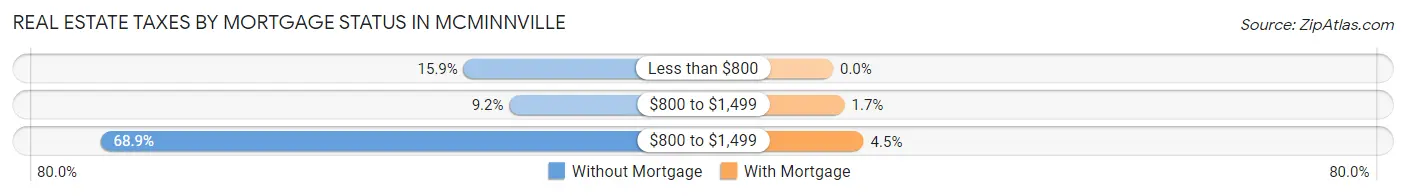
| Property Taxes | Without Mortgage | With Mortgage |
| Less than $800 | 434 (15.9%) | 0 (0.0%) |
| $800 to $1,499 | 251 (9.2%) | 88 (1.7%) |
| $800 to $1,499 | 1,886 (68.9%) | 232 (4.5%) |
| Total | 2,738 (100.0%) | 5,193 (100.0%) |
Health & Disability in Mcminnville
Health Insurance Coverage by Age in Mcminnville
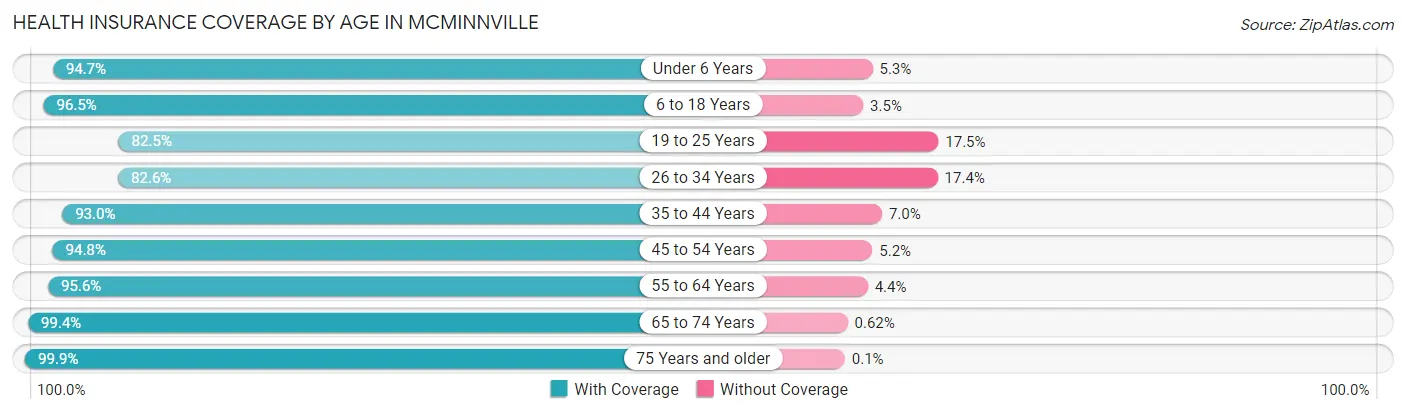
| Age Bracket | With Coverage | Without Coverage |
| Under 6 Years | 1,835 (94.7%) | 102 (5.3%) |
| 6 to 18 Years | 5,996 (96.5%) | 219 (3.5%) |
| 19 to 25 Years | 2,980 (82.5%) | 634 (17.5%) |
| 26 to 34 Years | 2,951 (82.6%) | 622 (17.4%) |
| 35 to 44 Years | 3,643 (93.0%) | 275 (7.0%) |
| 45 to 54 Years | 3,809 (94.8%) | 210 (5.2%) |
| 55 to 64 Years | 3,799 (95.6%) | 173 (4.4%) |
| 65 to 74 Years | 3,683 (99.4%) | 23 (0.6%) |
| 75 Years and older | 2,990 (99.9%) | 3 (0.1%) |
| Total | 31,686 (93.3%) | 2,261 (6.7%) |
Health Insurance Coverage by Citizenship Status in Mcminnville
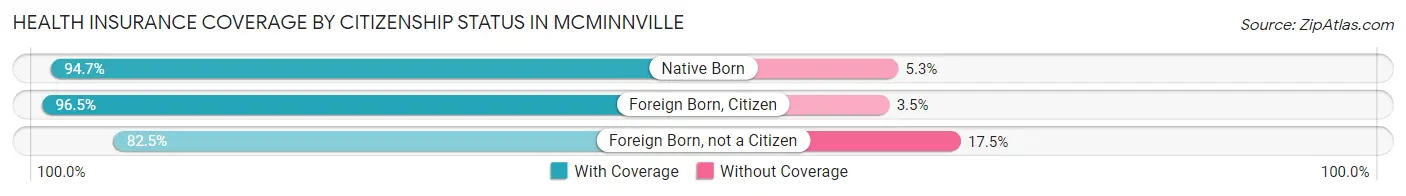
| Citizenship Status | With Coverage | Without Coverage |
| Native Born | 1,835 (94.7%) | 102 (5.3%) |
| Foreign Born, Citizen | 5,996 (96.5%) | 219 (3.5%) |
| Foreign Born, not a Citizen | 2,980 (82.5%) | 634 (17.5%) |
Health Insurance Coverage by Household Income in Mcminnville
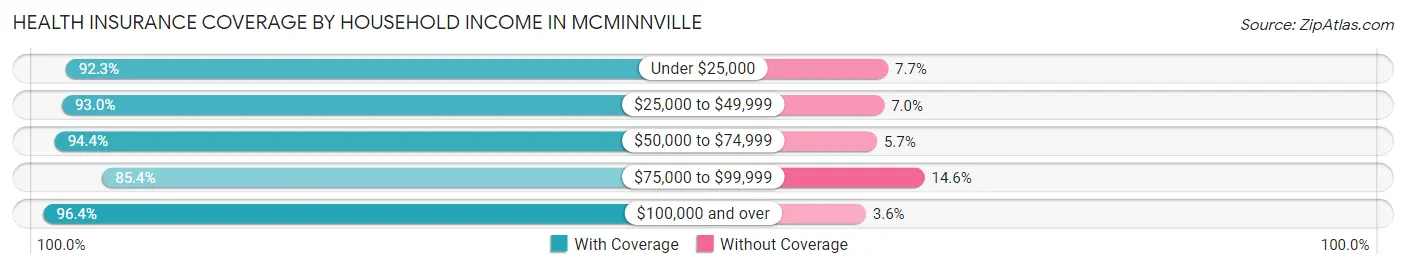
| Household Income | With Coverage | Without Coverage |
| Under $25,000 | 4,017 (92.3%) | 337 (7.7%) |
| $25,000 to $49,999 | 4,879 (93.0%) | 368 (7.0%) |
| $50,000 to $74,999 | 5,106 (94.4%) | 306 (5.7%) |
| $75,000 to $99,999 | 4,474 (85.4%) | 763 (14.6%) |
| $100,000 and over | 11,814 (96.4%) | 438 (3.6%) |
Public vs Private Health Insurance Coverage by Age in Mcminnville
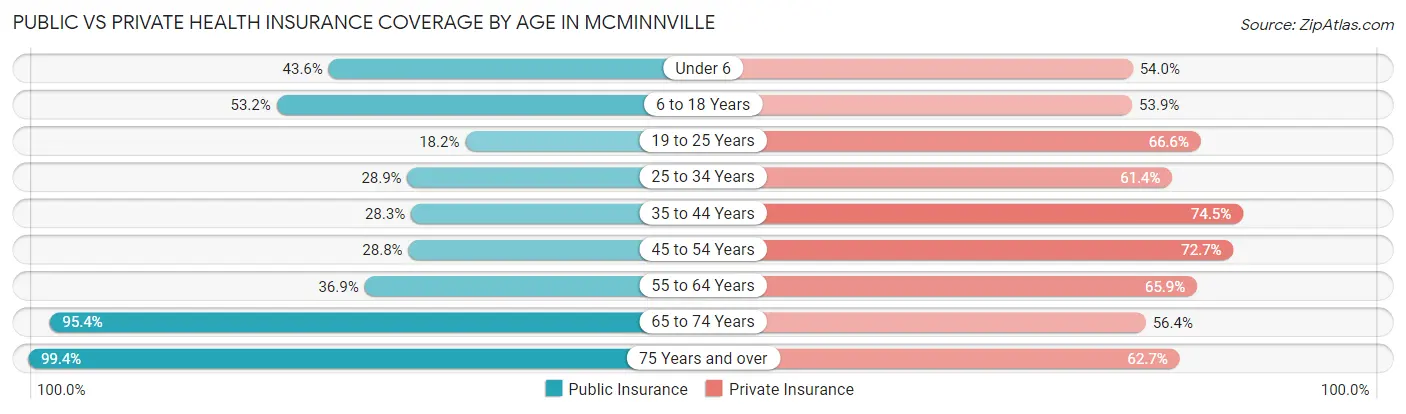
| Age Bracket | Public Insurance | Private Insurance |
| Under 6 | 844 (43.6%) | 1,046 (54.0%) |
| 6 to 18 Years | 3,308 (53.2%) | 3,349 (53.9%) |
| 19 to 25 Years | 658 (18.2%) | 2,408 (66.6%) |
| 25 to 34 Years | 1,034 (28.9%) | 2,192 (61.4%) |
| 35 to 44 Years | 1,108 (28.3%) | 2,918 (74.5%) |
| 45 to 54 Years | 1,156 (28.8%) | 2,921 (72.7%) |
| 55 to 64 Years | 1,466 (36.9%) | 2,619 (65.9%) |
| 65 to 74 Years | 3,535 (95.4%) | 2,091 (56.4%) |
| 75 Years and over | 2,974 (99.4%) | 1,877 (62.7%) |
| Total | 16,083 (47.4%) | 21,421 (63.1%) |
Disability Status by Sex by Age in Mcminnville
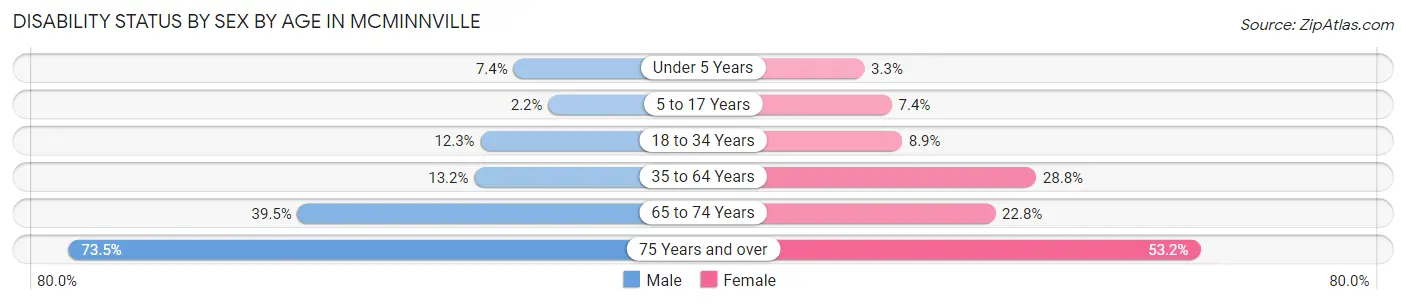
| Age Bracket | Male | Female |
| Under 5 Years | 50 (7.4%) | 26 (3.3%) |
| 5 to 17 Years | 77 (2.2%) | 202 (7.4%) |
| 18 to 34 Years | 461 (12.3%) | 352 (8.9%) |
| 35 to 64 Years | 752 (13.2%) | 1,794 (28.8%) |
| 65 to 74 Years | 745 (39.5%) | 414 (22.8%) |
| 75 Years and over | 840 (73.5%) | 985 (53.2%) |
Disability Class by Sex by Age in Mcminnville
Disability Class: Hearing Difficulty
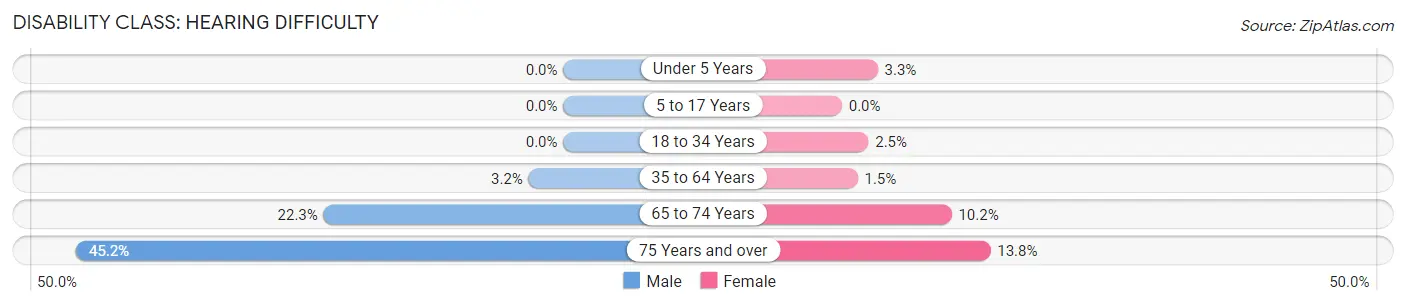
| Age Bracket | Male | Female |
| Under 5 Years | 0 (0.0%) | 26 (3.3%) |
| 5 to 17 Years | 0 (0.0%) | 0 (0.0%) |
| 18 to 34 Years | 0 (0.0%) | 97 (2.5%) |
| 35 to 64 Years | 183 (3.2%) | 91 (1.5%) |
| 65 to 74 Years | 420 (22.3%) | 185 (10.2%) |
| 75 Years and over | 517 (45.2%) | 255 (13.8%) |
Disability Class: Vision Difficulty
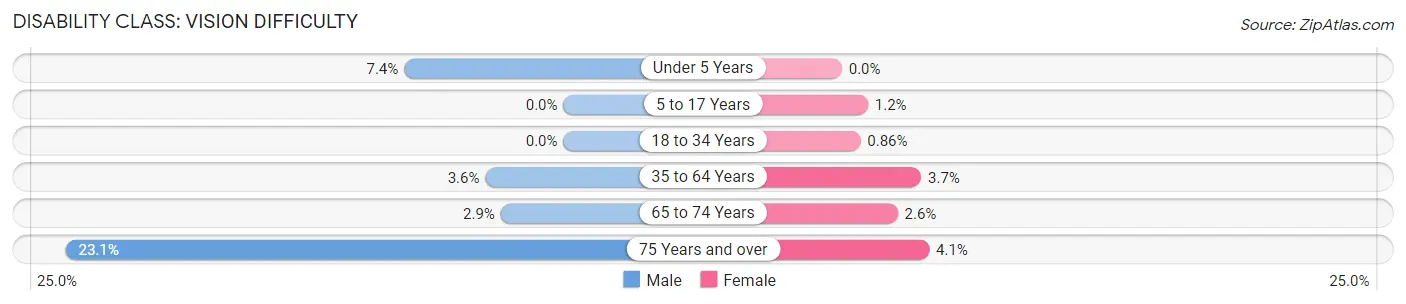
| Age Bracket | Male | Female |
| Under 5 Years | 50 (7.4%) | 0 (0.0%) |
| 5 to 17 Years | 0 (0.0%) | 33 (1.2%) |
| 18 to 34 Years | 0 (0.0%) | 34 (0.9%) |
| 35 to 64 Years | 206 (3.6%) | 229 (3.7%) |
| 65 to 74 Years | 55 (2.9%) | 47 (2.6%) |
| 75 Years and over | 264 (23.1%) | 75 (4.1%) |
Disability Class: Cognitive Difficulty
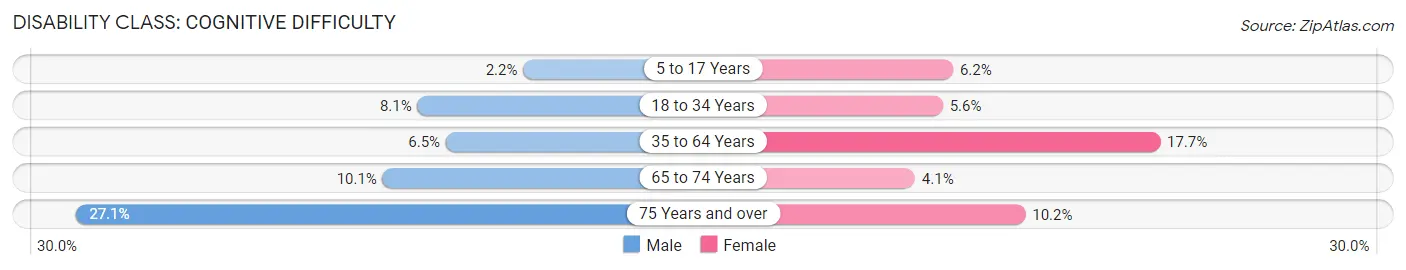
| Age Bracket | Male | Female |
| 5 to 17 Years | 77 (2.2%) | 169 (6.2%) |
| 18 to 34 Years | 304 (8.1%) | 222 (5.6%) |
| 35 to 64 Years | 372 (6.5%) | 1,103 (17.7%) |
| 65 to 74 Years | 190 (10.1%) | 74 (4.1%) |
| 75 Years and over | 310 (27.1%) | 189 (10.2%) |
Disability Class: Ambulatory Difficulty
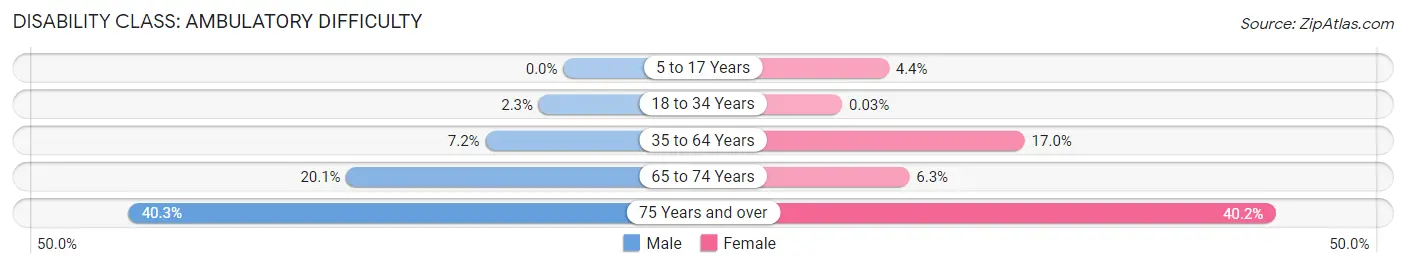
| Age Bracket | Male | Female |
| 5 to 17 Years | 0 (0.0%) | 119 (4.4%) |
| 18 to 34 Years | 85 (2.3%) | 1 (0.0%) |
| 35 to 64 Years | 411 (7.2%) | 1,056 (17.0%) |
| 65 to 74 Years | 380 (20.1%) | 114 (6.3%) |
| 75 Years and over | 461 (40.3%) | 744 (40.2%) |
Disability Class: Self-Care Difficulty
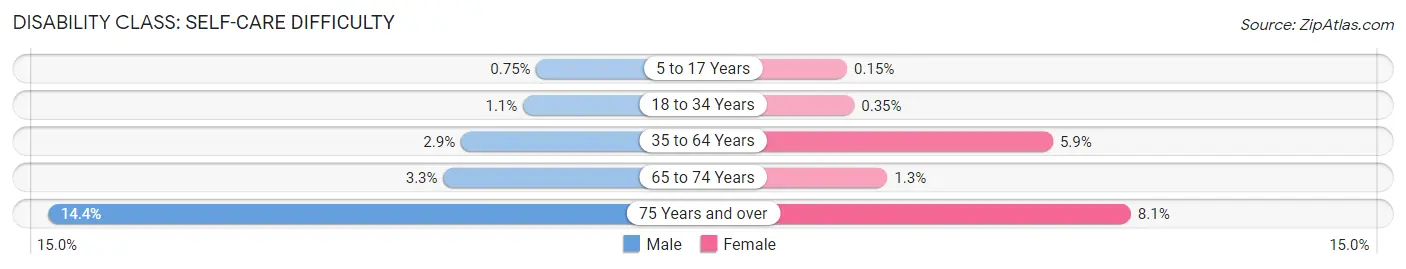
| Age Bracket | Male | Female |
| 5 to 17 Years | 26 (0.7%) | 4 (0.2%) |
| 18 to 34 Years | 42 (1.1%) | 14 (0.4%) |
| 35 to 64 Years | 162 (2.9%) | 366 (5.9%) |
| 65 to 74 Years | 63 (3.3%) | 23 (1.3%) |
| 75 Years and over | 164 (14.3%) | 149 (8.1%) |
Technology Access in Mcminnville
Computing Device Access in Mcminnville
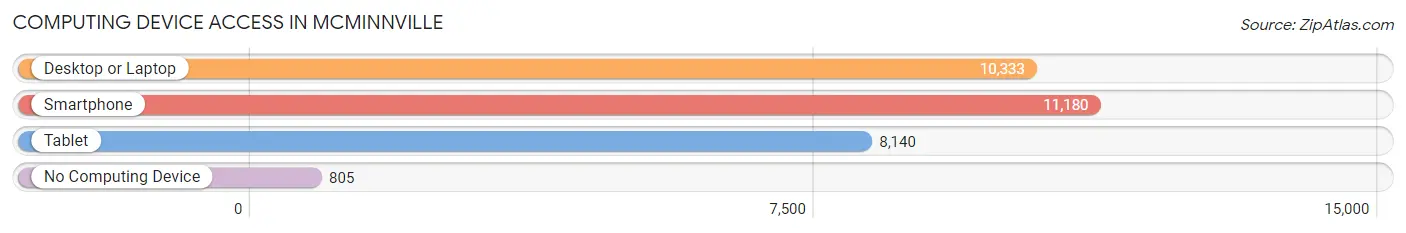
| Device Type | # Households | % Households |
| Desktop or Laptop | 10,333 | 80.2% |
| Smartphone | 11,180 | 86.8% |
| Tablet | 8,140 | 63.2% |
| No Computing Device | 805 | 6.2% |
| Total | 12,887 | 100.0% |
Internet Access in Mcminnville
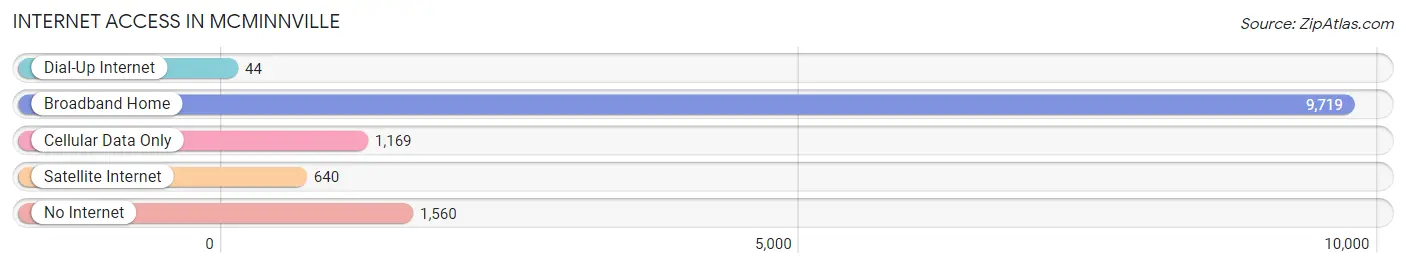
| Internet Type | # Households | % Households |
| Dial-Up Internet | 44 | 0.3% |
| Broadband Home | 9,719 | 75.4% |
| Cellular Data Only | 1,169 | 9.1% |
| Satellite Internet | 640 | 5.0% |
| No Internet | 1,560 | 12.1% |
| Total | 12,887 | 100.0% |
Mcminnville Summary
Mcminnville, Oregon is a city located in Yamhill County, Oregon, United States. It is the county seat of Yamhill County and is located in the heart of the Willamette Valley, approximately 35 miles southwest of Portland. The city has a population of 32,187 as of the 2010 census, making it the largest city in Yamhill County.
History
Mcminnville was founded in 1856 by William T. Newby, who named the city after his hometown of McMinnville, Tennessee. The city was incorporated in 1876 and has since grown to become the largest city in Yamhill County.
Mcminnville has a rich history, having been the site of the first Oregon State Fair in 1861 and the first Oregon State Penitentiary in 1866. The city was also the site of the first Oregon State University in 1868.
Geography
Mcminnville is located in the heart of the Willamette Valley, approximately 35 miles southwest of Portland. The city is situated on the banks of the Yamhill River and is surrounded by rolling hills and vineyards. The city has a total area of 8.3 square miles, all of which is land.
Economy
Mcminnville is a major agricultural center in the Willamette Valley, with a variety of crops grown in the area. The city is also home to several wineries and vineyards, as well as a number of manufacturing and technology companies. The city is also home to the Evergreen Aviation & Space Museum, which houses a variety of aircraft and space artifacts.
Demographics
As of the 2010 census, Mcminnville had a population of 32,187. The racial makeup of the city was 82.3% White, 0.7% African American, 1.2% Native American, 1.3% Asian, 0.2% Pacific Islander, 11.2% from other races, and 3.3% from two or more races. Hispanic or Latino of any race were 20.2% of the population.
The median income for a household in the city was $45,837, and the median income for a family was $54,837. The per capita income for the city was $22,837. About 11.2% of families and 15.2% of the population were below the poverty line, including 22.2% of those under age 18 and 8.2% of those age 65 or over.
Mcminnville is a vibrant and diverse city with a rich history and a bright future. The city is home to a variety of businesses, industries, and attractions, making it an ideal place to live, work, and play.
Common Questions
What is Per Capita Income in Mcminnville?
Per Capita income in Mcminnville is $32,385.
What is the Median Family Income in Mcminnville?
Median Family Income in Mcminnville is $85,955.
What is the Median Household income in Mcminnville?
Median Household Income in Mcminnville is $65,318.
What is Income or Wage Gap in Mcminnville?
Income or Wage Gap in Mcminnville is 21.3%.
Women in Mcminnville earn 78.7 cents for every dollar earned by a man.
What is Family Income Deficit in Mcminnville?
Family Income Deficit in Mcminnville is $10,742.
Families that are below poverty line in Mcminnville earn $10,742 less on average than the poverty threshold level.
What is Inequality or Gini Index in Mcminnville?
Inequality or Gini Index in Mcminnville is 0.46.
What is the Total Population of Mcminnville?
Total Population of Mcminnville is 34,432.
What is the Total Male Population of Mcminnville?
Total Male Population of Mcminnville is 16,871.
What is the Total Female Population of Mcminnville?
Total Female Population of Mcminnville is 17,561.
What is the Ratio of Males per 100 Females in Mcminnville?
There are 96.07 Males per 100 Females in Mcminnville.
What is the Ratio of Females per 100 Males in Mcminnville?
There are 104.09 Females per 100 Males in Mcminnville.
What is the Median Population Age in Mcminnville?
Median Population Age in Mcminnville is 40.1 Years.
What is the Average Family Size in Mcminnville
Average Family Size in Mcminnville is 3.0 People.
What is the Average Household Size in Mcminnville
Average Household Size in Mcminnville is 2.5 People.
How Large is the Labor Force in Mcminnville?
There are 15,302 People in the Labor Forcein in Mcminnville.
What is the Percentage of People in the Labor Force in Mcminnville?
55.3% of People are in the Labor Force in Mcminnville.
What is the Unemployment Rate in Mcminnville?
Unemployment Rate in Mcminnville is 3.7%.