Barview, OR Map & Demographics
Barview Map
Barview Overview
$40,591
PER CAPITA INCOME
$84,000
AVG FAMILY INCOME
$70,294
AVG HOUSEHOLD INCOME
2.0%
WAGE / INCOME GAP [ % ]
98.0¢/ $1
WAGE / INCOME GAP [ $ ]
0.44
INEQUALITY / GINI INDEX
1,726
TOTAL POPULATION
950
MALE POPULATION
776
FEMALE POPULATION
122.42
MALES / 100 FEMALES
81.68
FEMALES / 100 MALES
52.7
MEDIAN AGE
3.0
AVG FAMILY SIZE
2.5
AVG HOUSEHOLD SIZE
772
LABOR FORCE [ PEOPLE ]
50.0%
PERCENT IN LABOR FORCE
10.2%
UNEMPLOYMENT RATE
Income in Barview
Income Overview in Barview
Per Capita Income in Barview is $40,591, while median incomes of families and households are $84,000 and $70,294 respectively.
| Characteristic | Number | Measure |
| Per Capita Income | 1,726 | $40,591 |
| Median Family Income | 478 | $84,000 |
| Mean Family Income | 478 | $106,133 |
| Median Household Income | 674 | $70,294 |
| Mean Household Income | 674 | $103,455 |
| Income Deficit | 478 | $0 |
| Wage / Income Gap (%) | 1,726 | 2.00% |
| Wage / Income Gap ($) | 1,726 | 98.00¢ per $1 |
| Gini / Inequality Index | 1,726 | 0.44 |
Earnings by Sex in Barview
Average Earnings in Barview are $39,674, $39,420 for men and $40,224 for women, a difference of 2.0%.
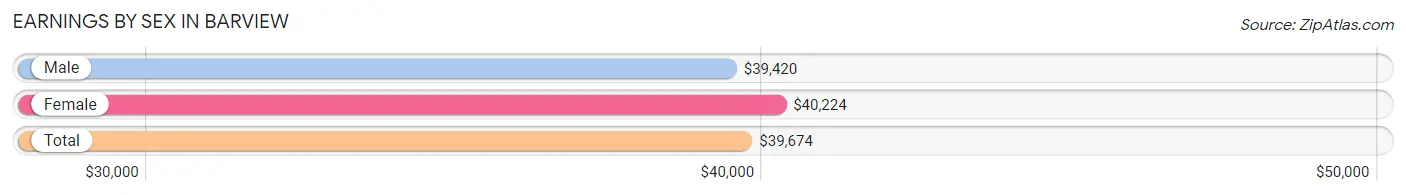
| Sex | Number | Average Earnings |
| Male | 390 (49.2%) | $39,420 |
| Female | 402 (50.8%) | $40,224 |
| Total | 792 (100.0%) | $39,674 |
Earnings by Sex by Income Bracket in Barview
The most common earnings brackets in Barview are $55,000 to $64,999 for men (89 | 22.8%) and $40,000 to $44,999 for women (78 | 19.4%).
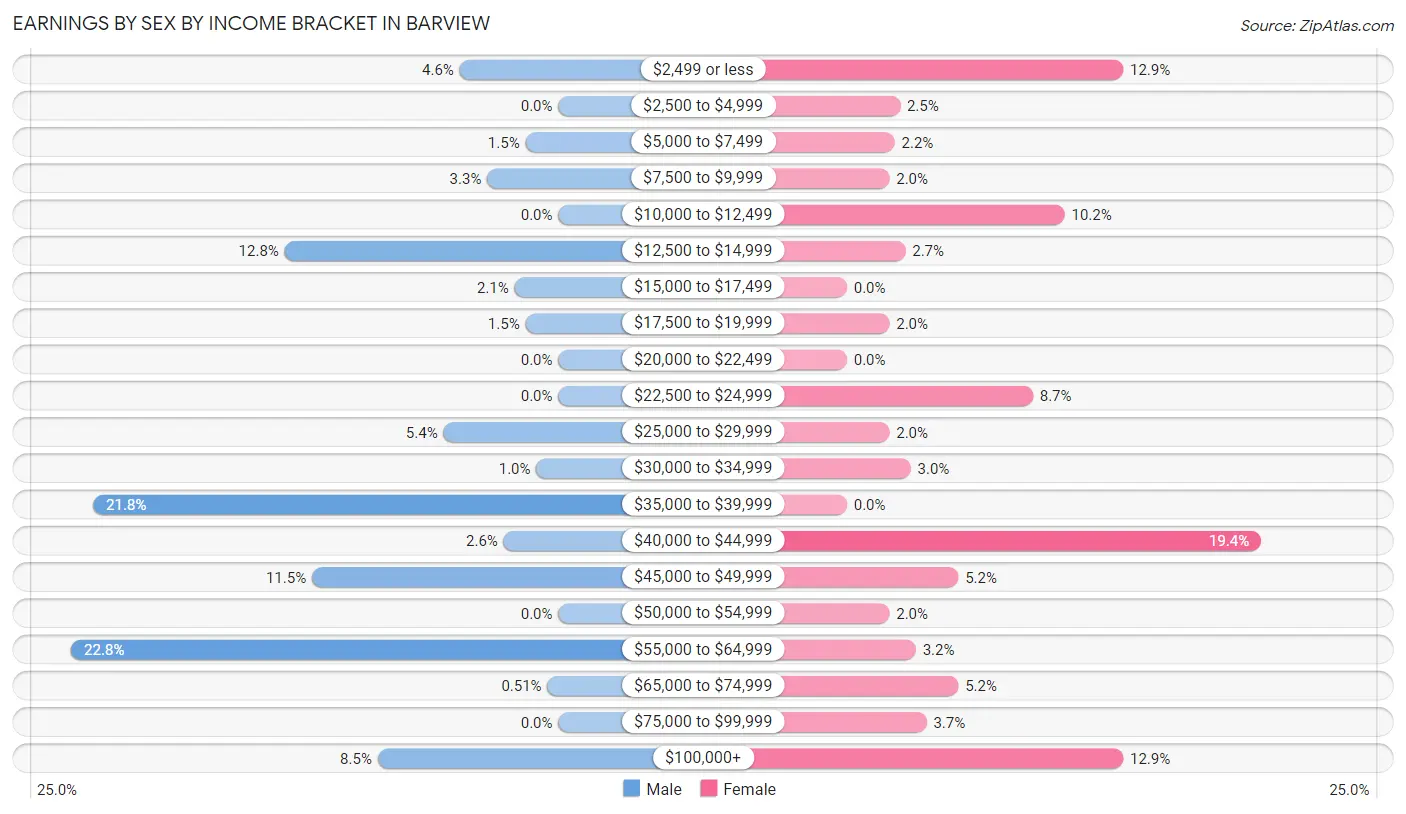
| Income | Male | Female |
| $2,499 or less | 18 (4.6%) | 52 (12.9%) |
| $2,500 to $4,999 | 0 (0.0%) | 10 (2.5%) |
| $5,000 to $7,499 | 6 (1.5%) | 9 (2.2%) |
| $7,500 to $9,999 | 13 (3.3%) | 8 (2.0%) |
| $10,000 to $12,499 | 0 (0.0%) | 41 (10.2%) |
| $12,500 to $14,999 | 50 (12.8%) | 11 (2.7%) |
| $15,000 to $17,499 | 8 (2.1%) | 0 (0.0%) |
| $17,500 to $19,999 | 6 (1.5%) | 8 (2.0%) |
| $20,000 to $22,499 | 0 (0.0%) | 0 (0.0%) |
| $22,500 to $24,999 | 0 (0.0%) | 35 (8.7%) |
| $25,000 to $29,999 | 21 (5.4%) | 8 (2.0%) |
| $30,000 to $34,999 | 4 (1.0%) | 12 (3.0%) |
| $35,000 to $39,999 | 85 (21.8%) | 0 (0.0%) |
| $40,000 to $44,999 | 10 (2.6%) | 78 (19.4%) |
| $45,000 to $49,999 | 45 (11.5%) | 21 (5.2%) |
| $50,000 to $54,999 | 0 (0.0%) | 8 (2.0%) |
| $55,000 to $64,999 | 89 (22.8%) | 13 (3.2%) |
| $65,000 to $74,999 | 2 (0.5%) | 21 (5.2%) |
| $75,000 to $99,999 | 0 (0.0%) | 15 (3.7%) |
| $100,000+ | 33 (8.5%) | 52 (12.9%) |
| Total | 390 (100.0%) | 402 (100.0%) |
Earnings by Sex by Educational Attainment in Barview
Average earnings in Barview are $39,493 for men and $40,321 for women, a difference of 2.1%. Men with an educational attainment of less than high school enjoy the highest average annual earnings of $39,250, while those with college or associate's degree education earn the least with $36,442. Women with an educational attainment of college or associate's degree earn the most with the average annual earnings of $41,440, while those with high school diploma education have the smallest earnings of $23,536.
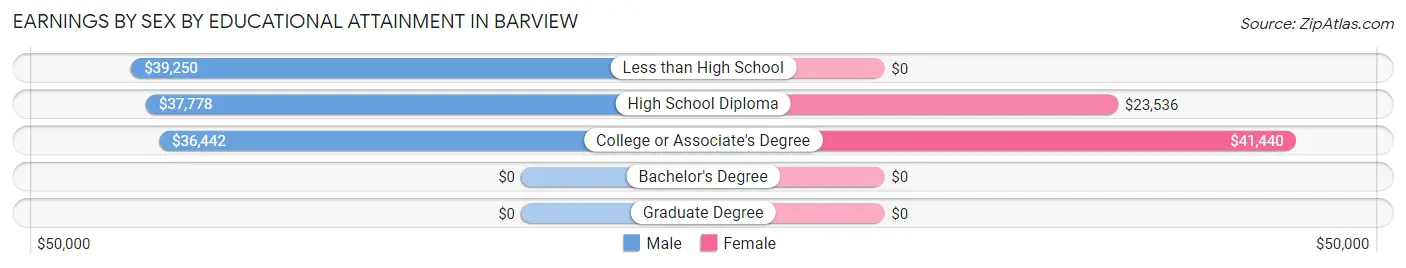
| Educational Attainment | Male Income | Female Income |
| Less than High School | $39,250 | $0 |
| High School Diploma | $37,778 | $23,536 |
| College or Associate's Degree | $36,442 | $41,440 |
| Bachelor's Degree | - | - |
| Graduate Degree | - | - |
| Total | $39,493 | $40,321 |
Family Income in Barview
Family Income Brackets in Barview
According to the Barview family income data, there are 152 families falling into the $100,000 to $149,999 income range, which is the most common income bracket and makes up 31.8% of all families.
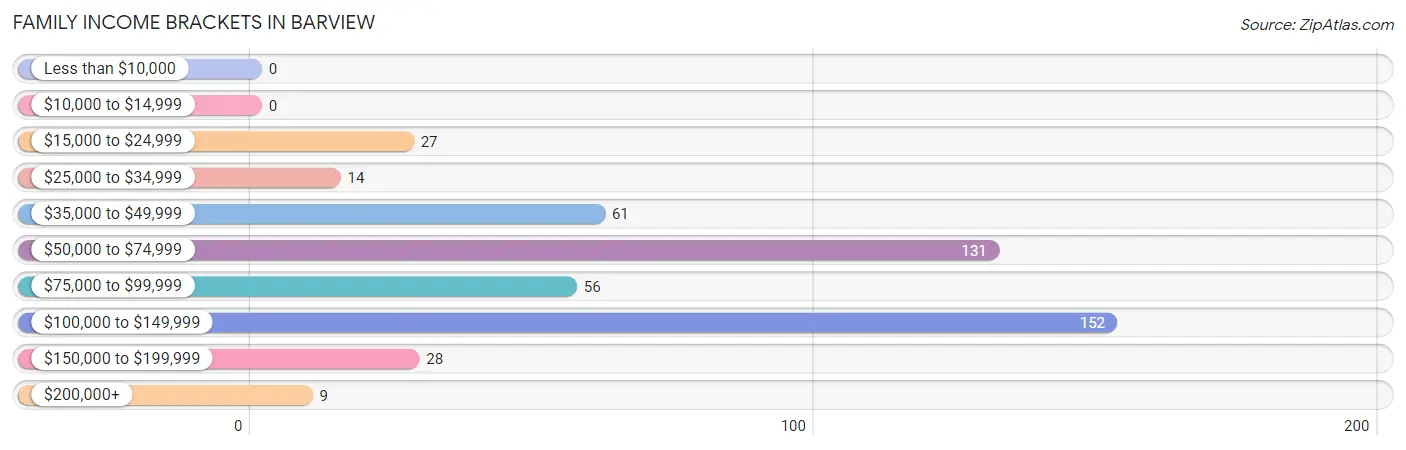
| Income Bracket | # Families | % Families |
| Less than $10,000 | 0 | 0.0% |
| $10,000 to $14,999 | 0 | 0.0% |
| $15,000 to $24,999 | 27 | 5.6% |
| $25,000 to $34,999 | 14 | 2.9% |
| $35,000 to $49,999 | 61 | 12.8% |
| $50,000 to $74,999 | 131 | 27.4% |
| $75,000 to $99,999 | 56 | 11.7% |
| $100,000 to $149,999 | 152 | 31.8% |
| $150,000 to $199,999 | 28 | 5.9% |
| $200,000+ | 9 | 1.9% |
Family Income by Famaliy Size in Barview
5-person families (107 | 22.4%) account for the highest median family income in Barview with $116,325 per family, while 3-person families (42 | 8.8%) have the highest median income of $37,083 per family member.
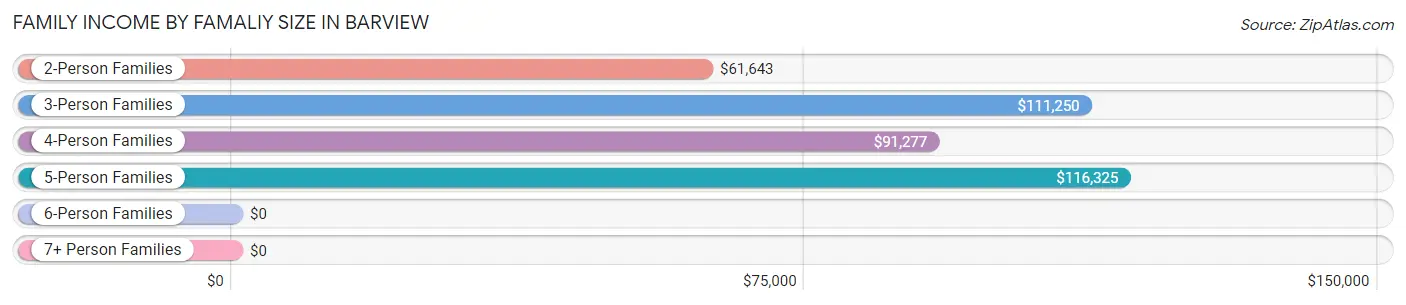
| Income Bracket | # Families | Median Income |
| 2-Person Families | 250 (52.3%) | $61,643 |
| 3-Person Families | 42 (8.8%) | $111,250 |
| 4-Person Families | 79 (16.5%) | $91,277 |
| 5-Person Families | 107 (22.4%) | $116,325 |
| 6-Person Families | 0 (0.0%) | $0 |
| 7+ Person Families | 0 (0.0%) | $0 |
| Total | 478 (100.0%) | $84,000 |
Family Income by Number of Earners in Barview
The median family income in Barview is $84,000, with families comprising 3+ earners (83) having the highest median family income of $117,075, while families with no earners (96) have the lowest median family income of $60,643, accounting for 17.4% and 20.1% of families, respectively.
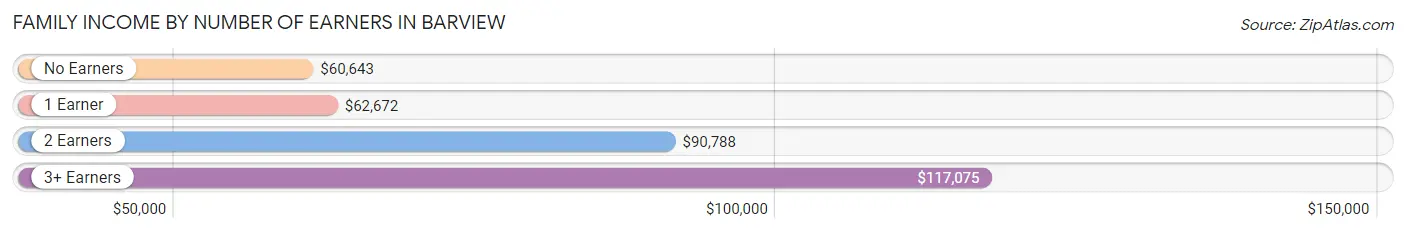
| Number of Earners | # Families | Median Income |
| No Earners | 96 (20.1%) | $60,643 |
| 1 Earner | 166 (34.7%) | $62,672 |
| 2 Earners | 133 (27.8%) | $90,788 |
| 3+ Earners | 83 (17.4%) | $117,075 |
| Total | 478 (100.0%) | $84,000 |
Household Income in Barview
Household Income Brackets in Barview
With 203 households falling in the category, the $50,000 to $74,999 income range is the most frequent in Barview, accounting for 30.1% of all households.
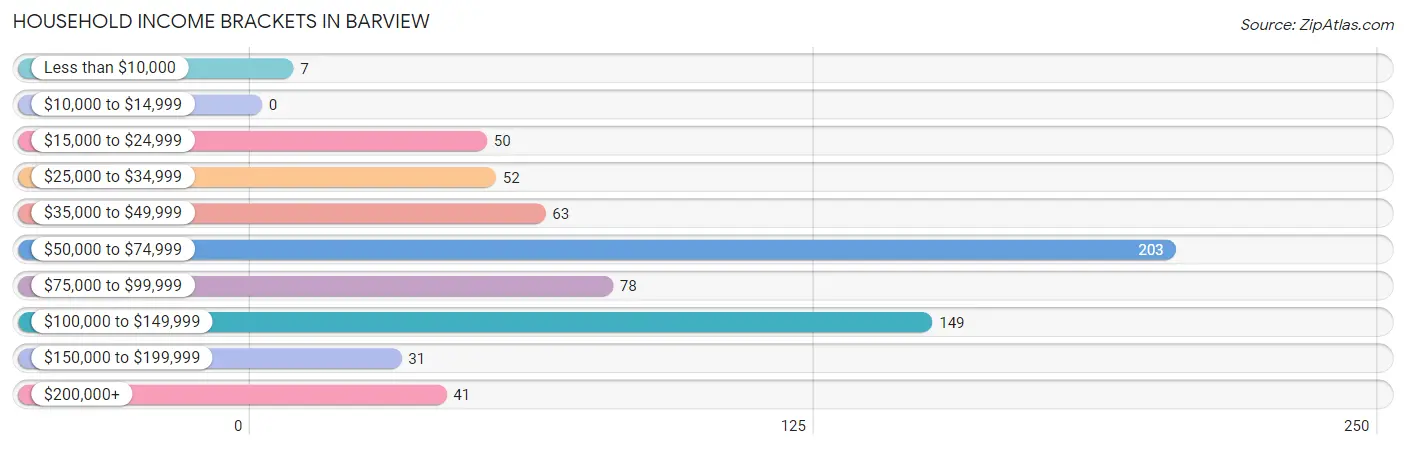
| Income Bracket | # Households | % Households |
| Less than $10,000 | 7 | 1.0% |
| $10,000 to $14,999 | 0 | 0.0% |
| $15,000 to $24,999 | 50 | 7.4% |
| $25,000 to $34,999 | 52 | 7.7% |
| $35,000 to $49,999 | 63 | 9.3% |
| $50,000 to $74,999 | 203 | 30.1% |
| $75,000 to $99,999 | 78 | 11.6% |
| $100,000 to $149,999 | 149 | 22.1% |
| $150,000 to $199,999 | 31 | 4.6% |
| $200,000+ | 41 | 6.1% |
Household Income by Householder Age in Barview
The median household income in Barview is $70,294, with the highest median household income of $72,321 found in the 65+ years age bracket for the primary householder. A total of 269 households (39.9%) fall into this category.
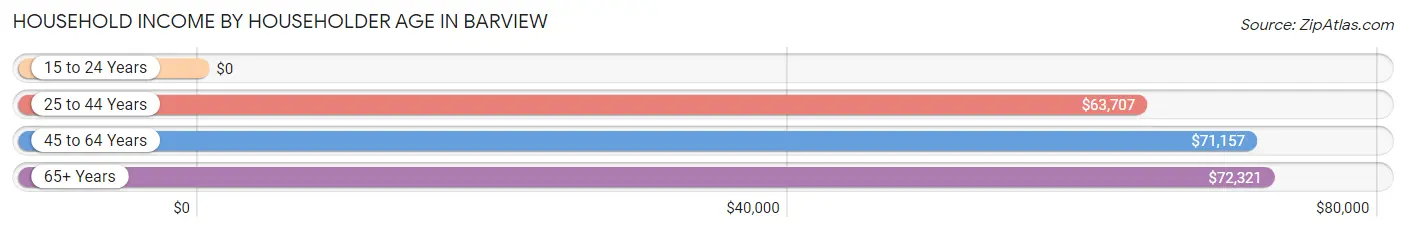
| Income Bracket | # Households | Median Income |
| 15 to 24 Years | 0 (0.0%) | $0 |
| 25 to 44 Years | 74 (11.0%) | $63,707 |
| 45 to 64 Years | 331 (49.1%) | $71,157 |
| 65+ Years | 269 (39.9%) | $72,321 |
| Total | 674 (100.0%) | $70,294 |
Poverty in Barview
Income Below Poverty by Sex and Age in Barview
With 3.5% poverty level for males and 2.1% for females among the residents of Barview, 35 to 44 year old males and 25 to 34 year old females are the most vulnerable to poverty, with 21 males (16.9%) and 9 females (9.4%) in their respective age groups living below the poverty level.
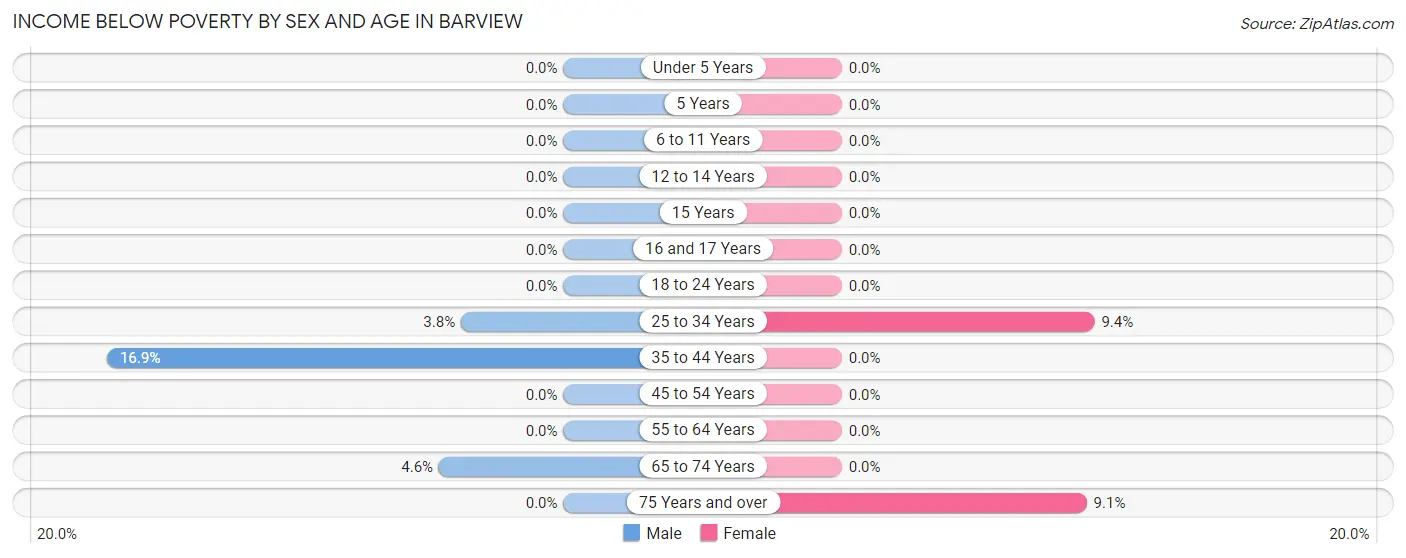
| Age Bracket | Male | Female |
| Under 5 Years | 0 (0.0%) | 0 (0.0%) |
| 5 Years | 0 (0.0%) | 0 (0.0%) |
| 6 to 11 Years | 0 (0.0%) | 0 (0.0%) |
| 12 to 14 Years | 0 (0.0%) | 0 (0.0%) |
| 15 Years | 0 (0.0%) | 0 (0.0%) |
| 16 and 17 Years | 0 (0.0%) | 0 (0.0%) |
| 18 to 24 Years | 0 (0.0%) | 0 (0.0%) |
| 25 to 34 Years | 6 (3.8%) | 9 (9.4%) |
| 35 to 44 Years | 21 (16.9%) | 0 (0.0%) |
| 45 to 54 Years | 0 (0.0%) | 0 (0.0%) |
| 55 to 64 Years | 0 (0.0%) | 0 (0.0%) |
| 65 to 74 Years | 6 (4.6%) | 0 (0.0%) |
| 75 Years and over | 0 (0.0%) | 7 (9.1%) |
| Total | 33 (3.5%) | 16 (2.1%) |
Income Above Poverty by Sex and Age in Barview
According to the poverty statistics in Barview, males aged under 5 years and females aged under 5 years are the age groups that are most secure financially, with 100.0% of males and 100.0% of females in these age groups living above the poverty line.
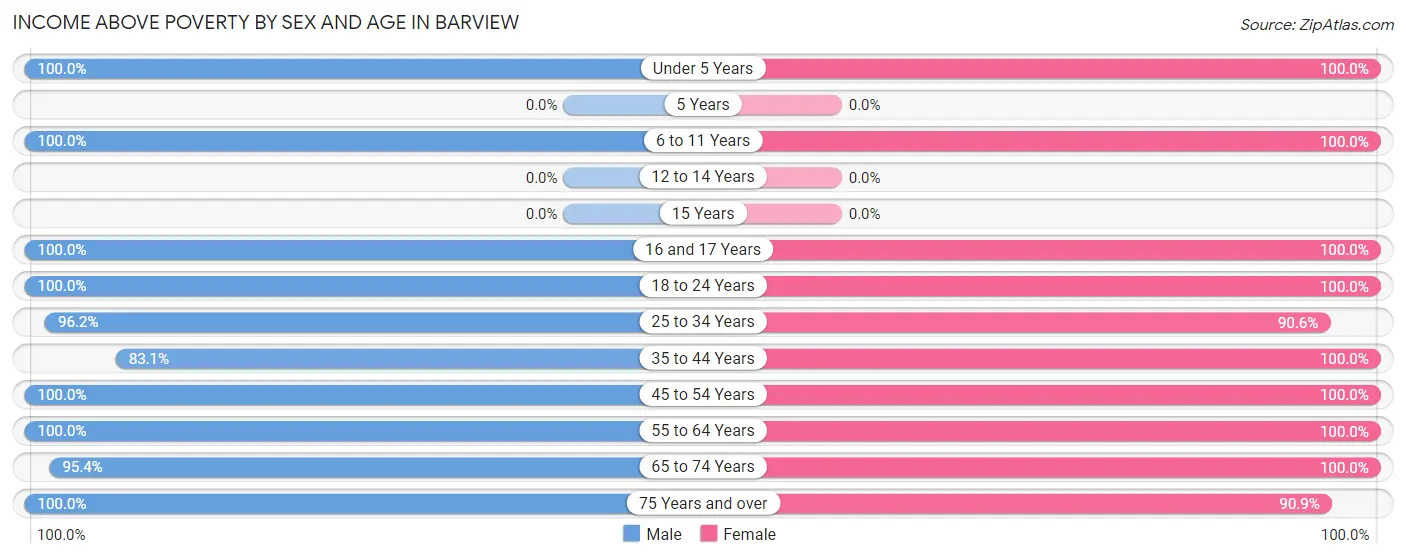
| Age Bracket | Male | Female |
| Under 5 Years | 108 (100.0%) | 36 (100.0%) |
| 5 Years | 0 (0.0%) | 0 (0.0%) |
| 6 to 11 Years | 12 (100.0%) | 24 (100.0%) |
| 12 to 14 Years | 0 (0.0%) | 0 (0.0%) |
| 15 Years | 0 (0.0%) | 0 (0.0%) |
| 16 and 17 Years | 31 (100.0%) | 17 (100.0%) |
| 18 to 24 Years | 4 (100.0%) | 20 (100.0%) |
| 25 to 34 Years | 152 (96.2%) | 87 (90.6%) |
| 35 to 44 Years | 103 (83.1%) | 97 (100.0%) |
| 45 to 54 Years | 89 (100.0%) | 53 (100.0%) |
| 55 to 64 Years | 218 (100.0%) | 191 (100.0%) |
| 65 to 74 Years | 124 (95.4%) | 162 (100.0%) |
| 75 Years and over | 76 (100.0%) | 70 (90.9%) |
| Total | 917 (96.5%) | 757 (97.9%) |
Income Below Poverty Among Married-Couple Families in Barview
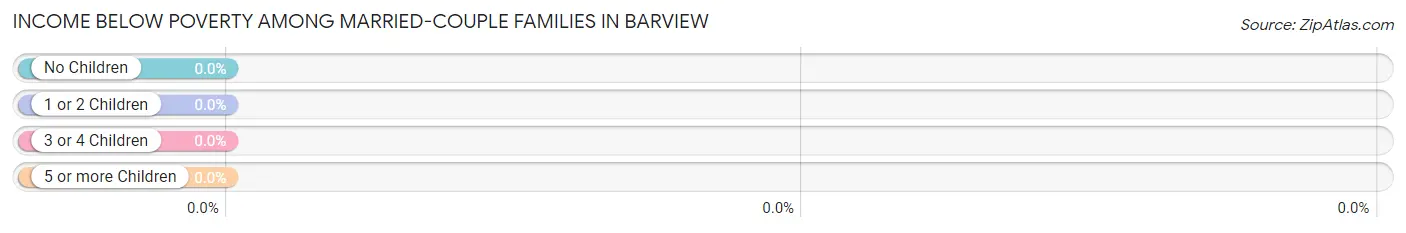
| Children | Above Poverty | Below Poverty |
| No Children | 270 (100.0%) | 0 (0.0%) |
| 1 or 2 Children | 76 (100.0%) | 0 (0.0%) |
| 3 or 4 Children | 0 (0.0%) | 0 (0.0%) |
| 5 or more Children | 0 (0.0%) | 0 (0.0%) |
| Total | 346 (100.0%) | 0 (0.0%) |
Income Below Poverty Among Single-Parent Households in Barview
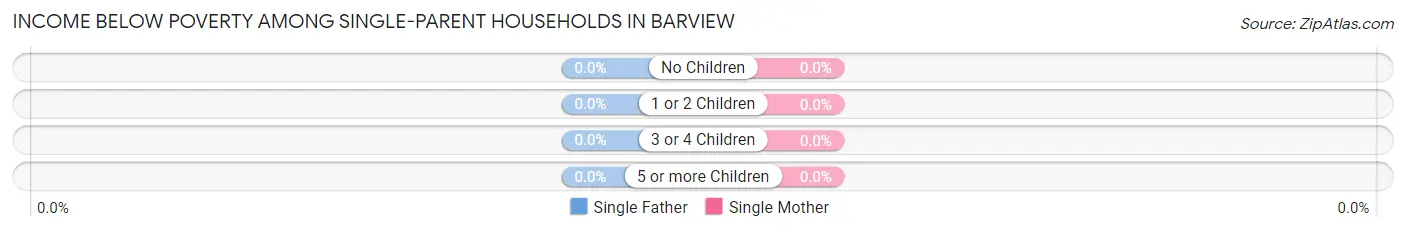
| Children | Single Father | Single Mother |
| No Children | 0 (0.0%) | 0 (0.0%) |
| 1 or 2 Children | 0 (0.0%) | 0 (0.0%) |
| 3 or 4 Children | 0 (0.0%) | 0 (0.0%) |
| 5 or more Children | 0 (0.0%) | 0 (0.0%) |
| Total | 0 (0.0%) | 0 (0.0%) |
Income Below Poverty Among Married-Couple vs Single-Parent Households in Barview
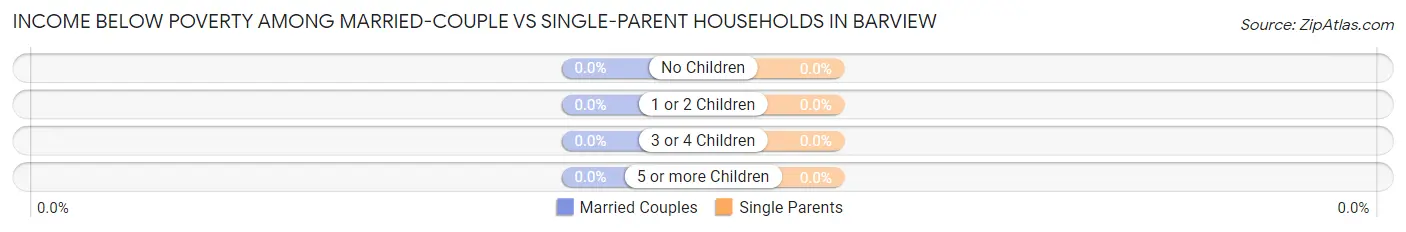
| Children | Married-Couple Families | Single-Parent Households |
| No Children | 0 (0.0%) | 0 (0.0%) |
| 1 or 2 Children | 0 (0.0%) | 0 (0.0%) |
| 3 or 4 Children | 0 (0.0%) | 0 (0.0%) |
| 5 or more Children | 0 (0.0%) | 0 (0.0%) |
| Total | 0 (0.0%) | 0 (0.0%) |
Race in Barview
The most populous races in Barview are White / Caucasian (1,461 | 84.7%), Hispanic or Latino (123 | 7.1%), and Native / Alaskan (109 | 6.3%).
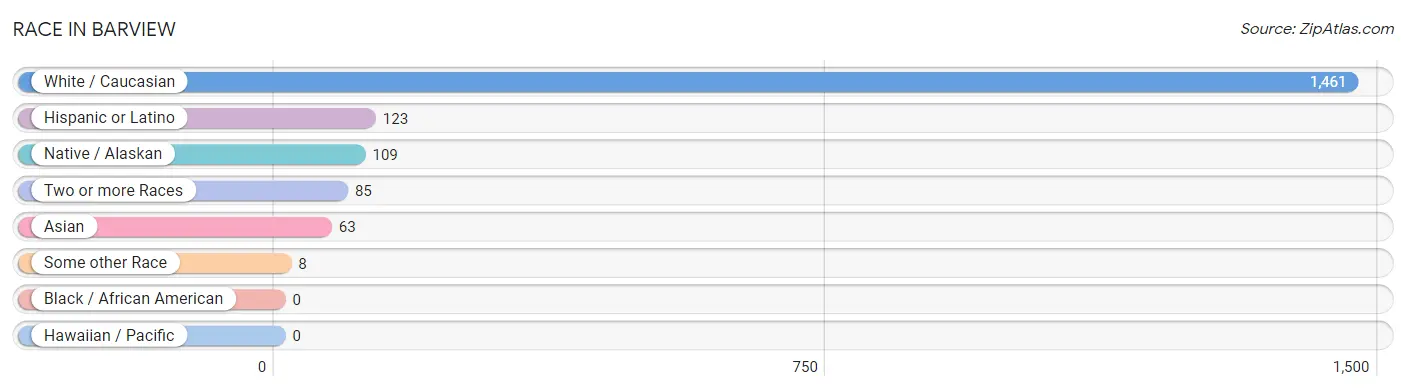
| Race | # Population | % Population |
| Asian | 63 | 3.6% |
| Black / African American | 0 | 0.0% |
| Hawaiian / Pacific | 0 | 0.0% |
| Hispanic or Latino | 123 | 7.1% |
| Native / Alaskan | 109 | 6.3% |
| White / Caucasian | 1,461 | 84.7% |
| Two or more Races | 85 | 4.9% |
| Some other Race | 8 | 0.5% |
| Total | 1,726 | 100.0% |
Ancestry in Barview
The most populous ancestries reported in Barview are German (373 | 21.6%), European (263 | 15.2%), French (262 | 15.2%), Irish (243 | 14.1%), and English (171 | 9.9%), together accounting for 76.0% of all Barview residents.
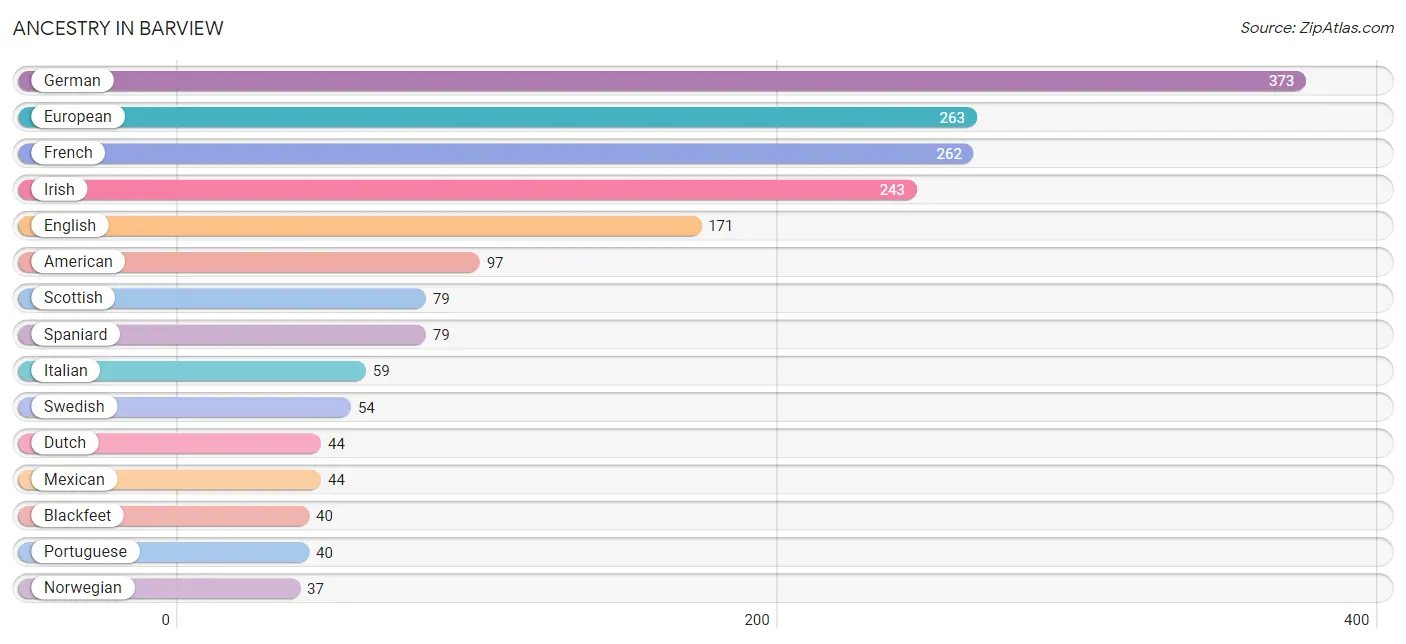
| Ancestry | # Population | % Population |
| American | 97 | 5.6% |
| Apache | 6 | 0.4% |
| Bhutanese | 32 | 1.8% |
| Blackfeet | 40 | 2.3% |
| British | 5 | 0.3% |
| Cajun | 5 | 0.3% |
| Cherokee | 34 | 2.0% |
| Crow | 13 | 0.7% |
| Czechoslovakian | 11 | 0.6% |
| Dutch | 44 | 2.5% |
| Eastern European | 6 | 0.4% |
| English | 171 | 9.9% |
| European | 263 | 15.2% |
| French | 262 | 15.2% |
| German | 373 | 21.6% |
| Greek | 8 | 0.5% |
| Indian (Asian) | 13 | 0.7% |
| Irish | 243 | 14.1% |
| Italian | 59 | 3.4% |
| Korean | 23 | 1.3% |
| Mexican | 44 | 2.5% |
| Norwegian | 37 | 2.1% |
| Polish | 13 | 0.7% |
| Portuguese | 40 | 2.3% |
| Scotch-Irish | 24 | 1.4% |
| Scottish | 79 | 4.6% |
| Spaniard | 79 | 4.6% |
| Swedish | 54 | 3.1% |
| Swiss | 5 | 0.3% |
| Welsh | 5 | 0.3% |
| Yaqui | 9 | 0.5% | View All 31 Rows |
Immigrants in Barview
The most numerous immigrant groups reported in Barview came from Asia (55 | 3.2%), Eastern Asia (32 | 1.8%), Japan (32 | 1.8%), Philippines (23 | 1.3%), and South Eastern Asia (23 | 1.3%), together accounting for 9.6% of all Barview residents.
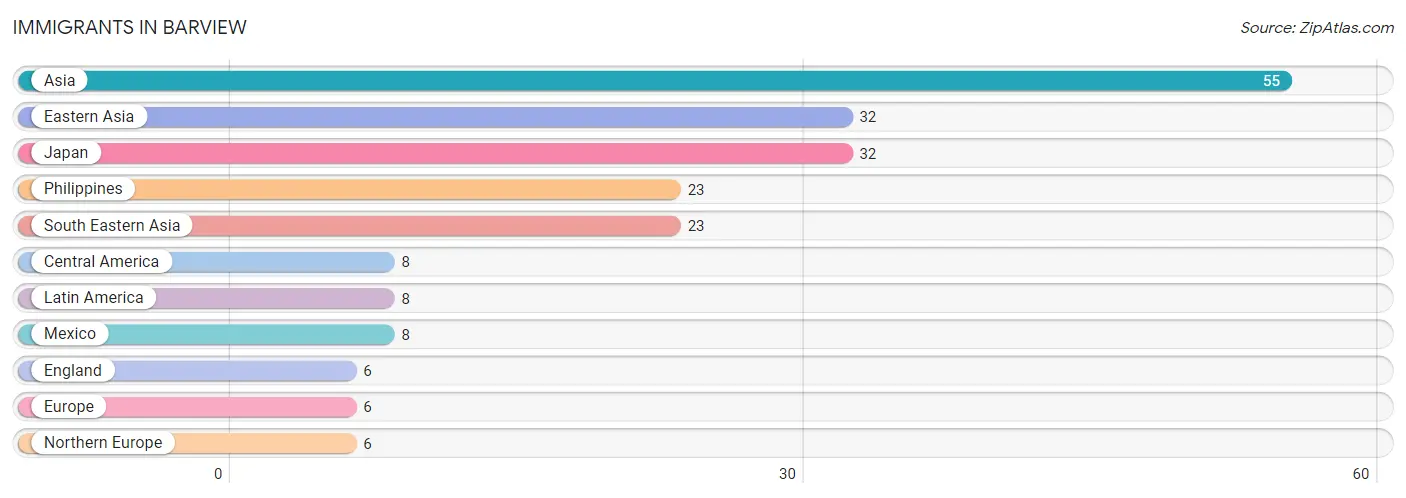
| Immigration Origin | # Population | % Population |
| Asia | 55 | 3.2% |
| Central America | 8 | 0.5% |
| Eastern Asia | 32 | 1.8% |
| England | 6 | 0.4% |
| Europe | 6 | 0.4% |
| Japan | 32 | 1.8% |
| Latin America | 8 | 0.5% |
| Mexico | 8 | 0.5% |
| Northern Europe | 6 | 0.4% |
| Philippines | 23 | 1.3% |
| South Eastern Asia | 23 | 1.3% | View All 11 Rows |
Sex and Age in Barview
Sex and Age in Barview
The most populous age groups in Barview are 60 to 64 Years (136 | 14.3%) for men and 60 to 64 Years (114 | 14.7%) for women.
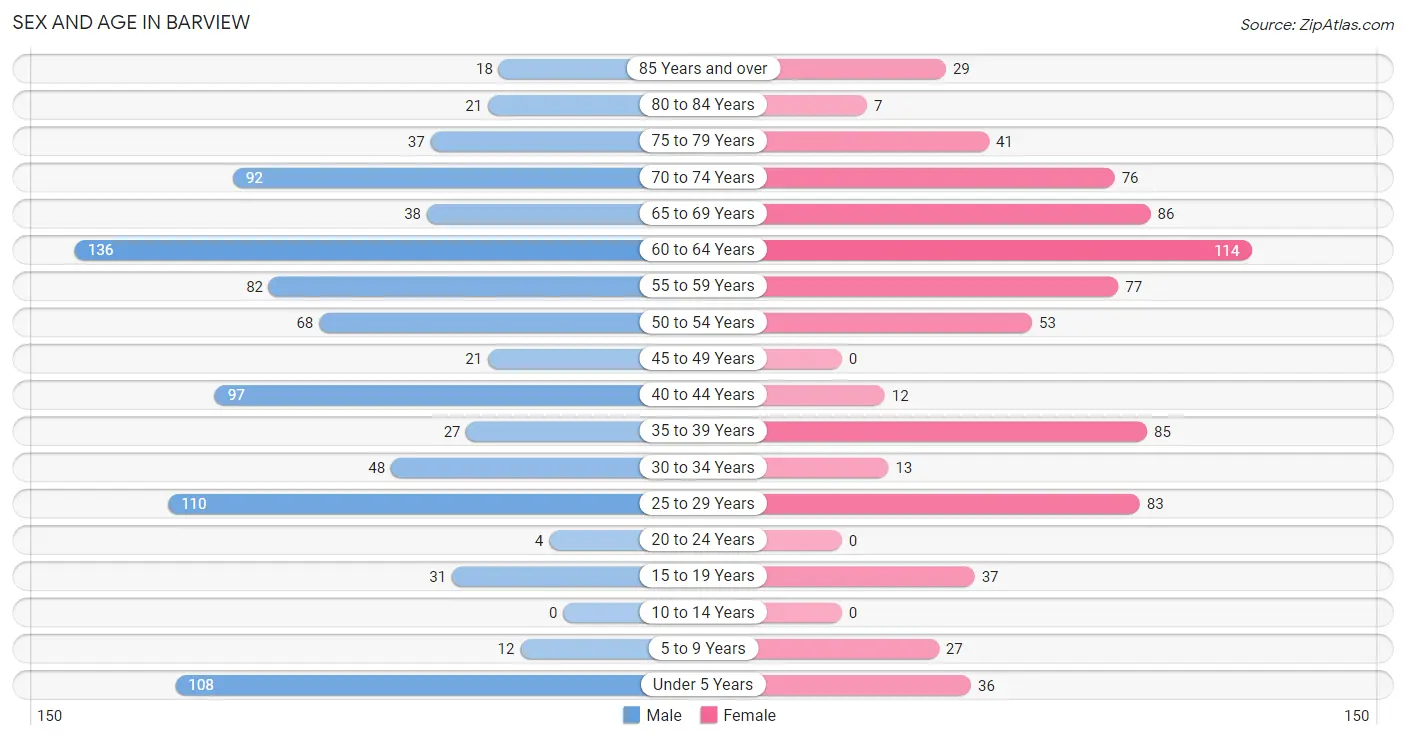
| Age Bracket | Male | Female |
| Under 5 Years | 108 (11.4%) | 36 (4.6%) |
| 5 to 9 Years | 12 (1.3%) | 27 (3.5%) |
| 10 to 14 Years | 0 (0.0%) | 0 (0.0%) |
| 15 to 19 Years | 31 (3.3%) | 37 (4.8%) |
| 20 to 24 Years | 4 (0.4%) | 0 (0.0%) |
| 25 to 29 Years | 110 (11.6%) | 83 (10.7%) |
| 30 to 34 Years | 48 (5.1%) | 13 (1.7%) |
| 35 to 39 Years | 27 (2.8%) | 85 (11.0%) |
| 40 to 44 Years | 97 (10.2%) | 12 (1.5%) |
| 45 to 49 Years | 21 (2.2%) | 0 (0.0%) |
| 50 to 54 Years | 68 (7.2%) | 53 (6.8%) |
| 55 to 59 Years | 82 (8.6%) | 77 (9.9%) |
| 60 to 64 Years | 136 (14.3%) | 114 (14.7%) |
| 65 to 69 Years | 38 (4.0%) | 86 (11.1%) |
| 70 to 74 Years | 92 (9.7%) | 76 (9.8%) |
| 75 to 79 Years | 37 (3.9%) | 41 (5.3%) |
| 80 to 84 Years | 21 (2.2%) | 7 (0.9%) |
| 85 Years and over | 18 (1.9%) | 29 (3.7%) |
| Total | 950 (100.0%) | 776 (100.0%) |
Families and Households in Barview
Median Family Size in Barview
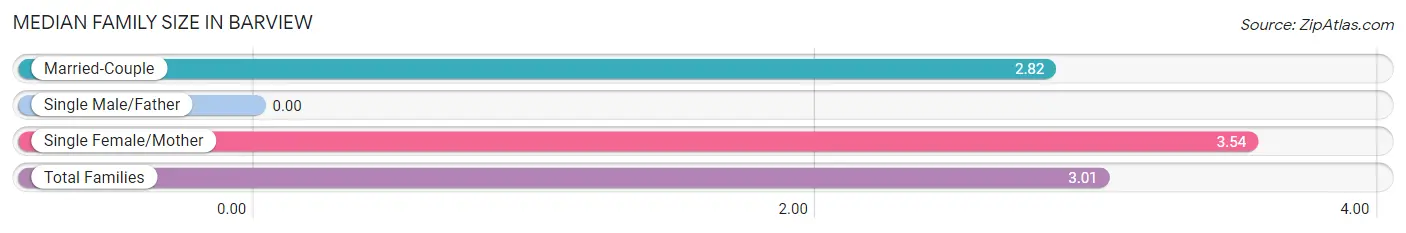
| Family Type | # Families | Family Size |
| Married-Couple | 346 (72.4%) | 2.82 |
| Single Male/Father | 0 (0.0%) | - |
| Single Female/Mother | 132 (27.6%) | 3.54 |
| Total Families | 478 (100.0%) | 3.01 |
Median Household Size in Barview
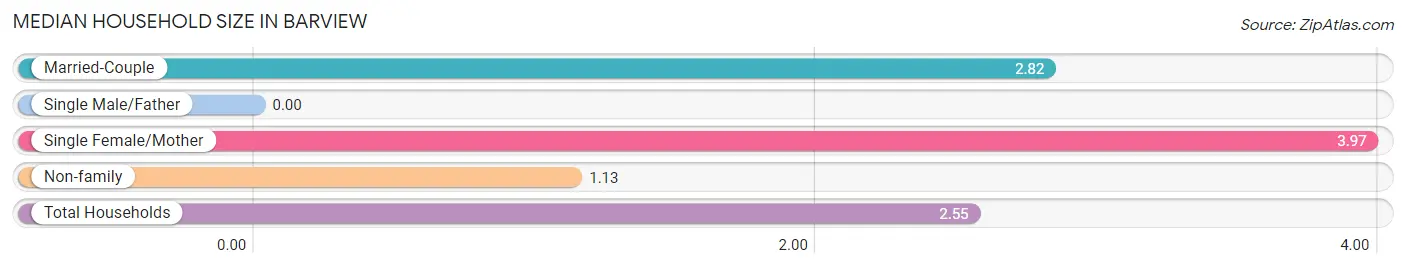
| Household Type | # Households | Household Size |
| Married-Couple | 346 (51.3%) | 2.82 |
| Single Male/Father | 0 (0.0%) | - |
| Single Female/Mother | 132 (19.6%) | 3.97 |
| Non-family | 196 (29.1%) | 1.13 |
| Total Households | 674 (100.0%) | 2.55 |
Household Size by Marriage Status in Barview
Out of a total of 674 households in Barview, 478 (70.9%) are family households, while 196 (29.1%) are nonfamily households. The most numerous type of family households are 2-person households, comprising 239, and the most common type of nonfamily households are 1-person households, comprising 168.
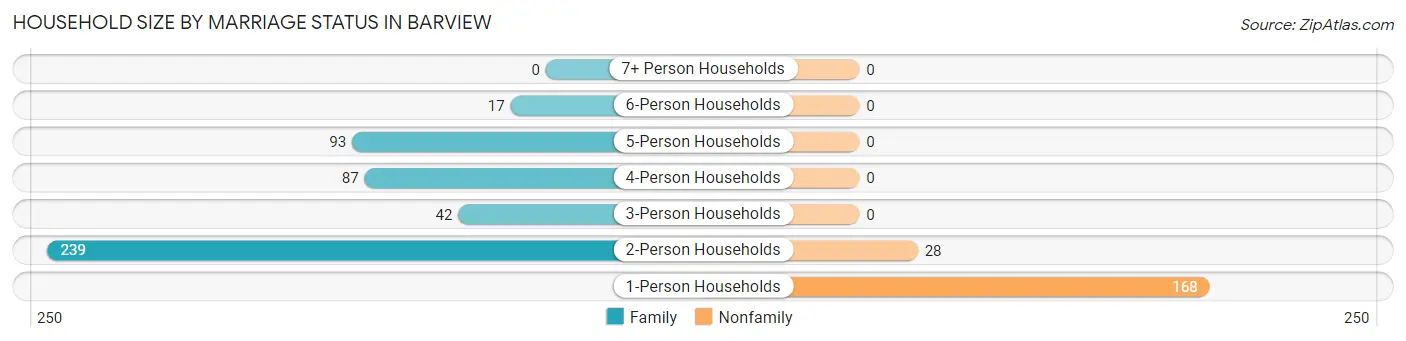
| Household Size | Family Households | Nonfamily Households |
| 1-Person Households | - | 168 (24.9%) |
| 2-Person Households | 239 (35.5%) | 28 (4.2%) |
| 3-Person Households | 42 (6.2%) | 0 (0.0%) |
| 4-Person Households | 87 (12.9%) | 0 (0.0%) |
| 5-Person Households | 93 (13.8%) | 0 (0.0%) |
| 6-Person Households | 17 (2.5%) | 0 (0.0%) |
| 7+ Person Households | 0 (0.0%) | 0 (0.0%) |
| Total | 478 (70.9%) | 196 (29.1%) |
Female Fertility in Barview
Fertility by Age in Barview
Average fertility rate in Barview is 33.0 births per 1,000 women. Women in the age bracket of 20 to 34 years have the highest fertility rate with 94.0 births per 1,000 women. Women in the age bracket of 20 to 34 years acount for 100.0% of all women with births.
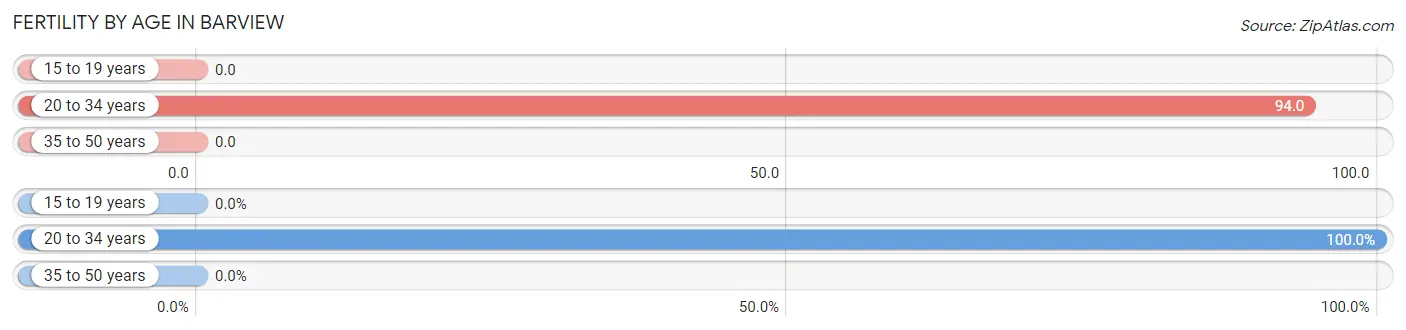
| Age Bracket | Women with Births | Births / 1,000 Women |
| 15 to 19 years | 0 (0.0%) | 0.0 |
| 20 to 34 years | 9 (100.0%) | 94.0 |
| 35 to 50 years | 0 (0.0%) | 0.0 |
| Total | 9 (100.0%) | 33.0 |
Fertility by Age by Marriage Status in Barview
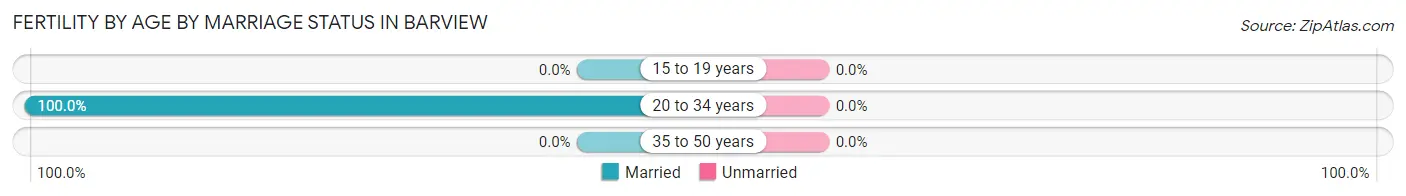
| Age Bracket | Married | Unmarried |
| 15 to 19 years | 0 (0.0%) | 0 (0.0%) |
| 20 to 34 years | 9 (100.0%) | 0 (0.0%) |
| 35 to 50 years | 0 (0.0%) | 0 (0.0%) |
| Total | 9 (100.0%) | 0 (0.0%) |
Fertility by Education in Barview
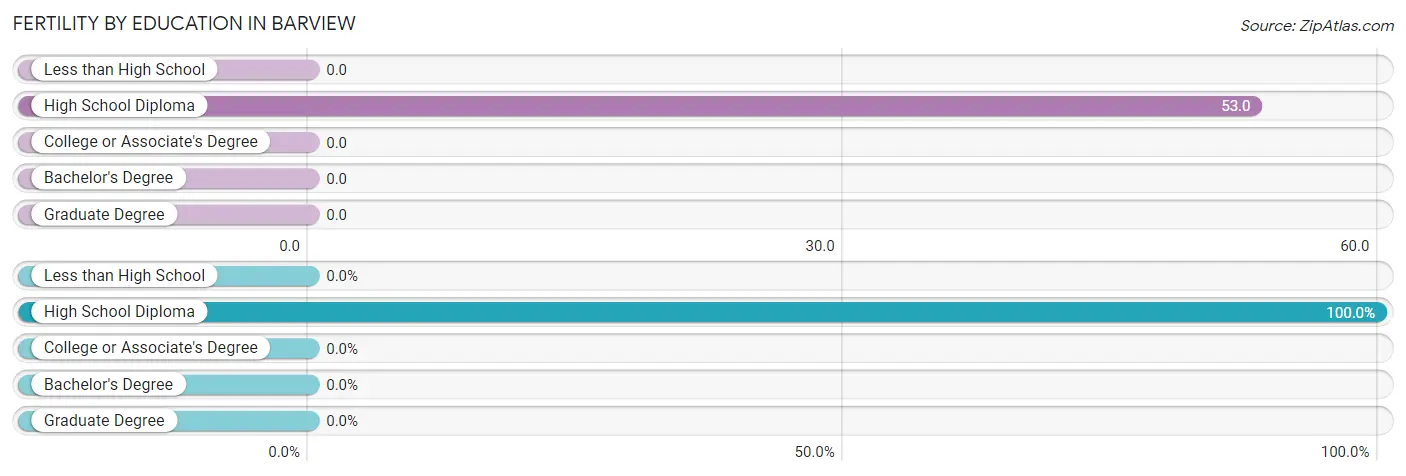
| Educational Attainment | Women with Births | Births / 1,000 Women |
| Less than High School | 0 (0.0%) | 0.0 |
| High School Diploma | 9 (100.0%) | 53.0 |
| College or Associate's Degree | 0 (0.0%) | 0.0 |
| Bachelor's Degree | 0 (0.0%) | 0.0 |
| Graduate Degree | 0 (0.0%) | 0.0 |
| Total | 9 (100.0%) | 33.0 |
Fertility by Education by Marriage Status in Barview
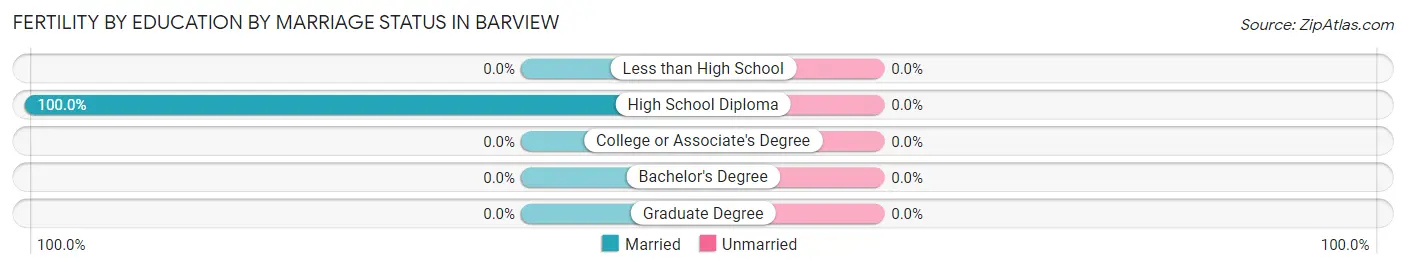
| Educational Attainment | Married | Unmarried |
| Less than High School | 0 (0.0%) | 0 (0.0%) |
| High School Diploma | 9 (100.0%) | 0 (0.0%) |
| College or Associate's Degree | 0 (0.0%) | 0 (0.0%) |
| Bachelor's Degree | 0 (0.0%) | 0 (0.0%) |
| Graduate Degree | 0 (0.0%) | 0 (0.0%) |
| Total | 9 (100.0%) | 0 (0.0%) |
Employment Characteristics in Barview
Employment by Class of Employer in Barview
Among the 693 employed individuals in Barview, private company employees (360 | 51.9%), not-for-profit organizations (111 | 16.0%), and self-employed (not incorporated) (103 | 14.9%) make up the most common classes of employment.
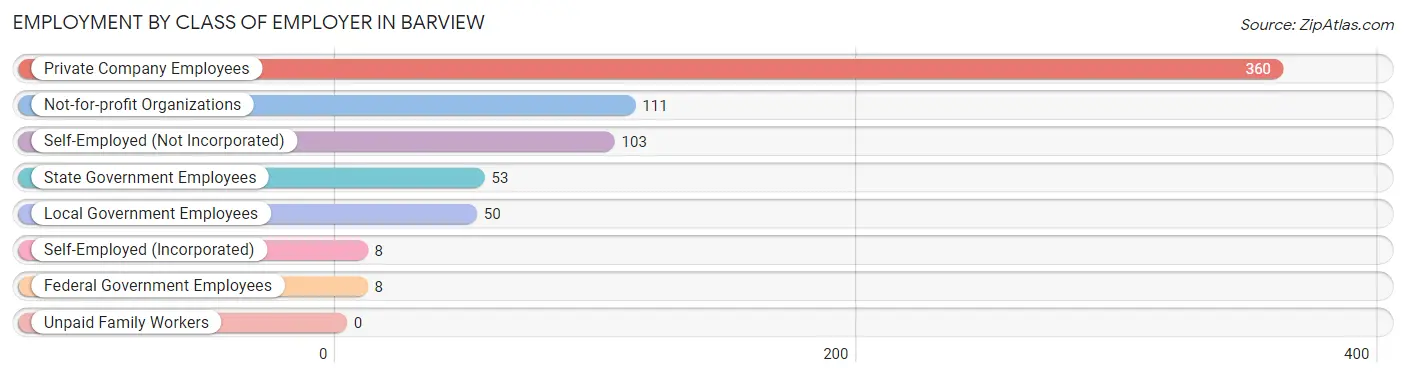
| Employer Class | # Employees | % Employees |
| Private Company Employees | 360 | 51.9% |
| Self-Employed (Incorporated) | 8 | 1.1% |
| Self-Employed (Not Incorporated) | 103 | 14.9% |
| Not-for-profit Organizations | 111 | 16.0% |
| Local Government Employees | 50 | 7.2% |
| State Government Employees | 53 | 7.6% |
| Federal Government Employees | 8 | 1.1% |
| Unpaid Family Workers | 0 | 0.0% |
| Total | 693 | 100.0% |
Employment Status by Age in Barview
According to the labor force statistics for Barview, out of the total population over 16 years of age (1,543), 50.0% or 772 individuals are in the labor force, with 10.2% or 79 of them unemployed. The age group with the highest labor force participation rate is 20 to 24 years, with 100.0% or 4 individuals in the labor force. Within the labor force, the 55 to 59 years age range has the highest percentage of unemployed individuals, with 33.1% or 50 of them being unemployed.
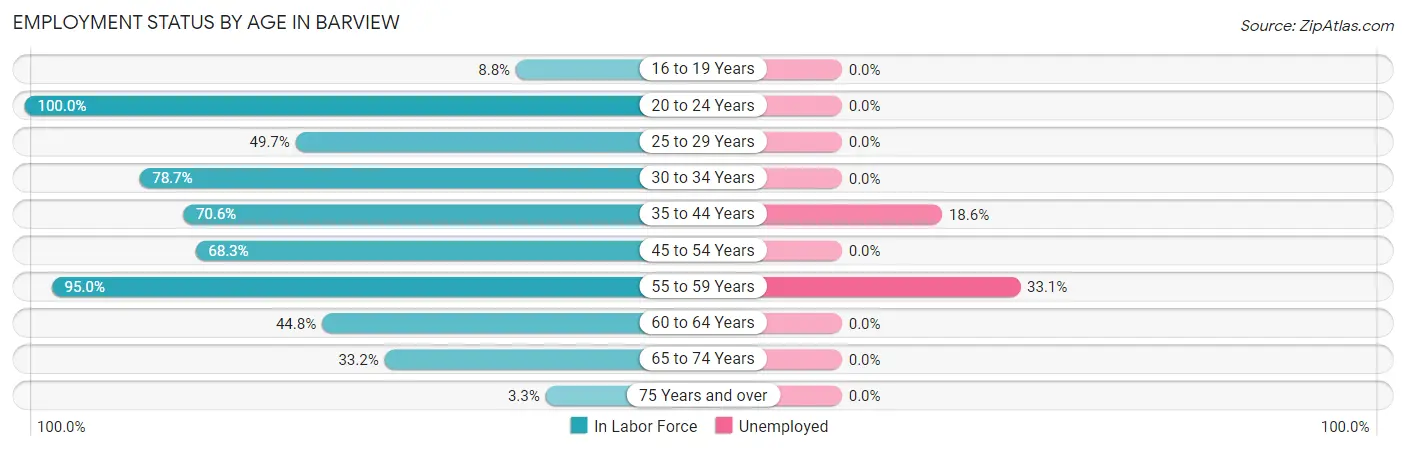
| Age Bracket | In Labor Force | Unemployed |
| 16 to 19 Years | 6 (8.8%) | 0 (0.0%) |
| 20 to 24 Years | 4 (100.0%) | 0 (0.0%) |
| 25 to 29 Years | 96 (49.7%) | 0 (0.0%) |
| 30 to 34 Years | 48 (78.7%) | 0 (0.0%) |
| 35 to 44 Years | 156 (70.6%) | 29 (18.6%) |
| 45 to 54 Years | 97 (68.3%) | 0 (0.0%) |
| 55 to 59 Years | 151 (95.0%) | 50 (33.1%) |
| 60 to 64 Years | 112 (44.8%) | 0 (0.0%) |
| 65 to 74 Years | 97 (33.2%) | 0 (0.0%) |
| 75 Years and over | 5 (3.3%) | 0 (0.0%) |
| Total | 772 (50.0%) | 79 (10.2%) |
Employment Status by Educational Attainment in Barview
According to labor force statistics for Barview, 64.3% of individuals (660) out of the total population between 25 and 64 years of age (1,026) are in the labor force, with 12.0% or 79 of them being unemployed. The group with the highest labor force participation rate are those with the educational attainment of bachelor's degree or higher, with 100.0% or 109 individuals in the labor force. Within the labor force, individuals with college / associate degree education have the highest percentage of unemployment, with 23.6% or 29 of them being unemployed.
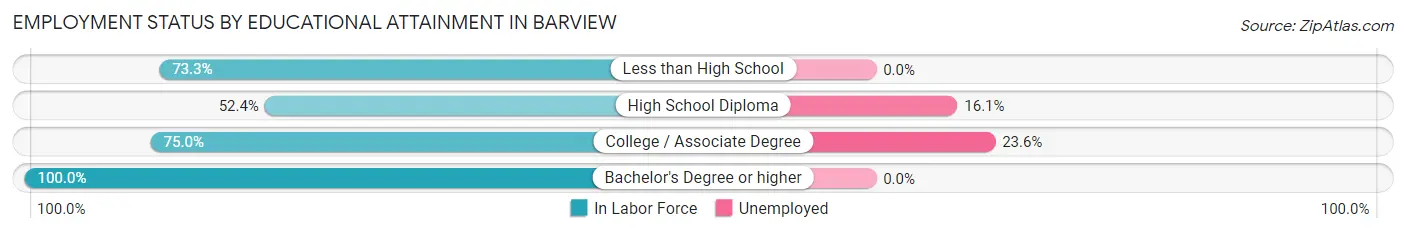
| Educational Attainment | In Labor Force | Unemployed |
| Less than High School | 118 (73.3%) | 0 (0.0%) |
| High School Diploma | 310 (52.4%) | 95 (16.1%) |
| College / Associate Degree | 123 (75.0%) | 39 (23.6%) |
| Bachelor's Degree or higher | 109 (100.0%) | 0 (0.0%) |
| Total | 660 (64.3%) | 123 (12.0%) |
Employment Occupations by Sex in Barview
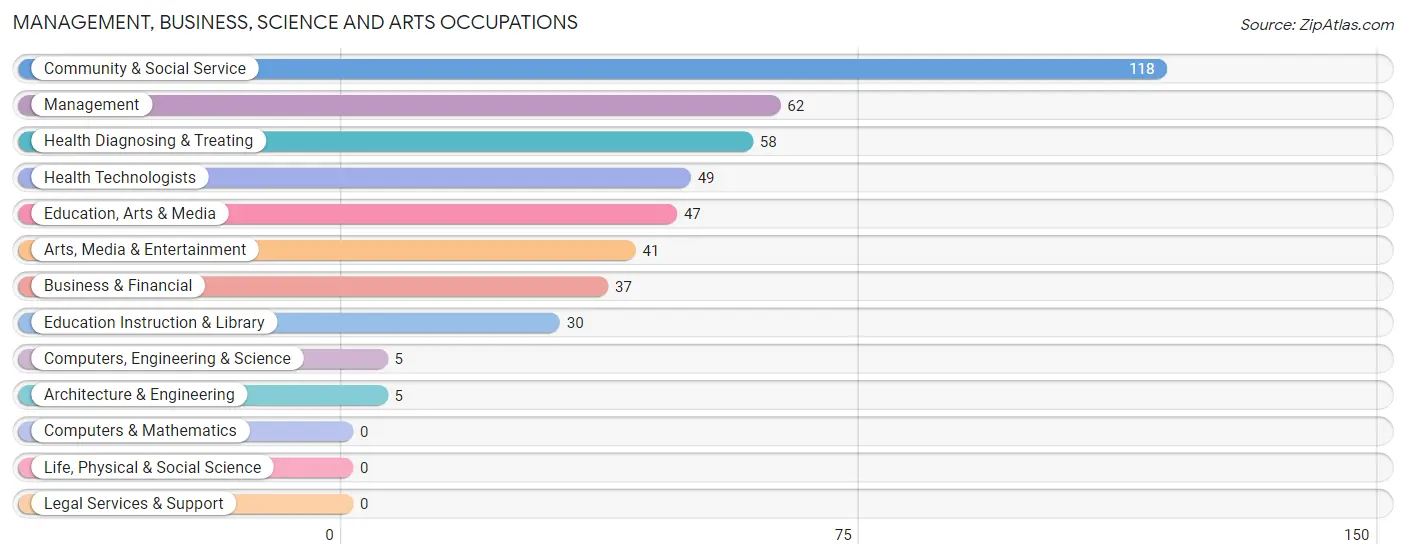
Management, Business, Science and Arts Occupations
The most common Management, Business, Science and Arts occupations in Barview are Community & Social Service (118 | 17.0%), Management (62 | 8.9%), Health Diagnosing & Treating (58 | 8.4%), Health Technologists (49 | 7.1%), and Education, Arts & Media (47 | 6.8%).
Management, Business, Science and Arts Occupations by Sex
Within the Management, Business, Science and Arts occupations in Barview, the most male-oriented occupations are Education Instruction & Library (60.0%), Management (54.8%), and Health Diagnosing & Treating (44.8%), while the most female-oriented occupations are Computers, Engineering & Science (100.0%), Architecture & Engineering (100.0%), and Education, Arts & Media (100.0%).
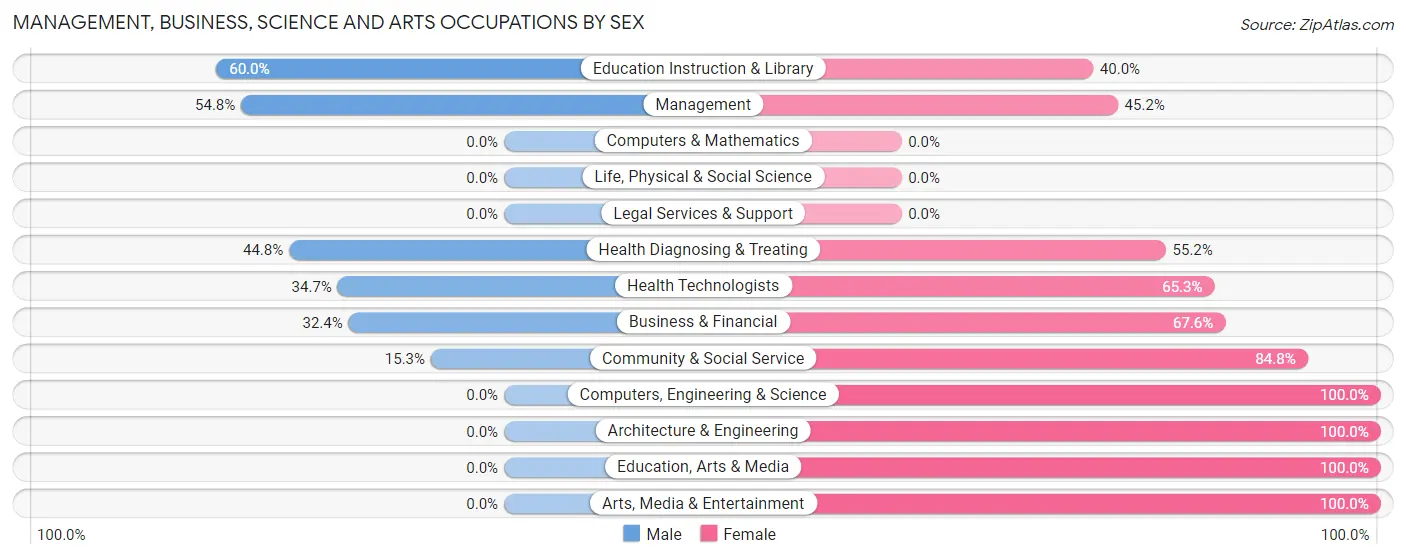
| Occupation | Male | Female |
| Management | 34 (54.8%) | 28 (45.2%) |
| Business & Financial | 12 (32.4%) | 25 (67.6%) |
| Computers, Engineering & Science | 0 (0.0%) | 5 (100.0%) |
| Computers & Mathematics | 0 (0.0%) | 0 (0.0%) |
| Architecture & Engineering | 0 (0.0%) | 5 (100.0%) |
| Life, Physical & Social Science | 0 (0.0%) | 0 (0.0%) |
| Community & Social Service | 18 (15.2%) | 100 (84.8%) |
| Education, Arts & Media | 0 (0.0%) | 47 (100.0%) |
| Legal Services & Support | 0 (0.0%) | 0 (0.0%) |
| Education Instruction & Library | 18 (60.0%) | 12 (40.0%) |
| Arts, Media & Entertainment | 0 (0.0%) | 41 (100.0%) |
| Health Diagnosing & Treating | 26 (44.8%) | 32 (55.2%) |
| Health Technologists | 17 (34.7%) | 32 (65.3%) |
| Total (Category) | 90 (32.1%) | 190 (67.9%) |
| Total (Overall) | 330 (47.6%) | 363 (52.4%) |
Services Occupations
The most common Services occupations in Barview are Healthcare Support (35 | 5.1%), Cleaning & Maintenance (16 | 2.3%), and Food Preparation & Serving (13 | 1.9%).

Services Occupations by Sex
Within the Services occupations in Barview, the most male-oriented occupations are Cleaning & Maintenance (100.0%), Food Preparation & Serving (46.2%), and Healthcare Support (45.7%), while the most female-oriented occupations are Healthcare Support (54.3%), and Food Preparation & Serving (53.8%).
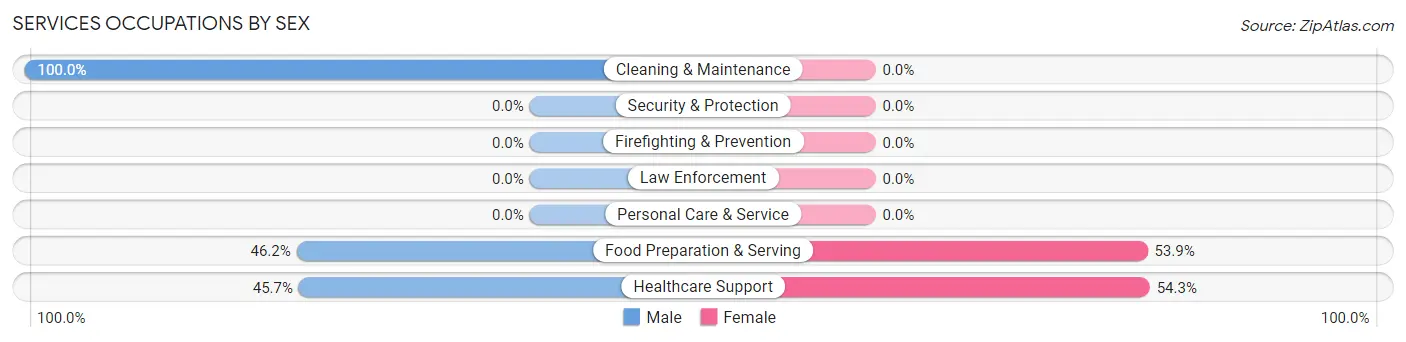
| Occupation | Male | Female |
| Healthcare Support | 16 (45.7%) | 19 (54.3%) |
| Security & Protection | 0 (0.0%) | 0 (0.0%) |
| Firefighting & Prevention | 0 (0.0%) | 0 (0.0%) |
| Law Enforcement | 0 (0.0%) | 0 (0.0%) |
| Food Preparation & Serving | 6 (46.2%) | 7 (53.8%) |
| Cleaning & Maintenance | 16 (100.0%) | 0 (0.0%) |
| Personal Care & Service | 0 (0.0%) | 0 (0.0%) |
| Total (Category) | 38 (59.4%) | 26 (40.6%) |
| Total (Overall) | 330 (47.6%) | 363 (52.4%) |
Sales and Office Occupations
The most common Sales and Office occupations in Barview are Office & Administration (153 | 22.1%), and Sales & Related (67 | 9.7%).

Sales and Office Occupations by Sex
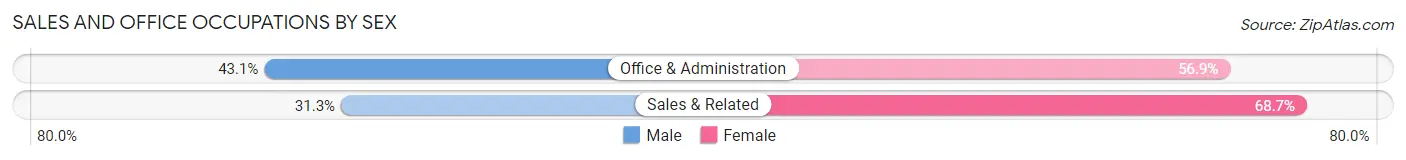
| Occupation | Male | Female |
| Sales & Related | 21 (31.3%) | 46 (68.7%) |
| Office & Administration | 66 (43.1%) | 87 (56.9%) |
| Total (Category) | 87 (39.6%) | 133 (60.5%) |
| Total (Overall) | 330 (47.6%) | 363 (52.4%) |
Natural Resources, Construction and Maintenance Occupations
The most common Natural Resources, Construction and Maintenance occupations in Barview are Construction & Extraction (61 | 8.8%), Installation, Maintenance & Repair (4 | 0.6%), and Farming, Fishing & Forestry (3 | 0.4%).

Natural Resources, Construction and Maintenance Occupations by Sex

| Occupation | Male | Female |
| Farming, Fishing & Forestry | 3 (100.0%) | 0 (0.0%) |
| Construction & Extraction | 53 (86.9%) | 8 (13.1%) |
| Installation, Maintenance & Repair | 4 (100.0%) | 0 (0.0%) |
| Total (Category) | 60 (88.2%) | 8 (11.8%) |
| Total (Overall) | 330 (47.6%) | 363 (52.4%) |
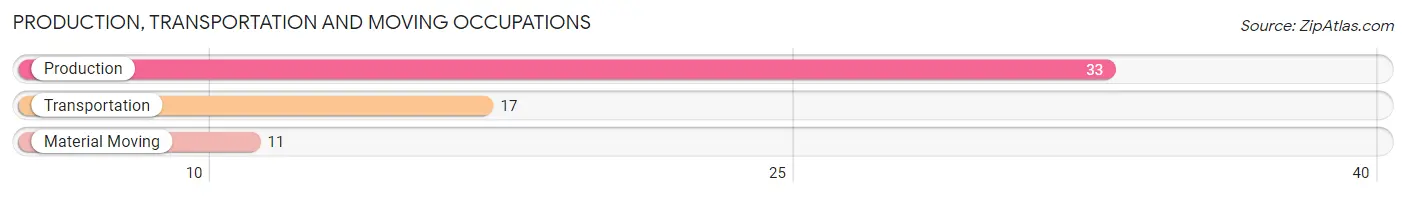
Production, Transportation and Moving Occupations
The most common Production, Transportation and Moving occupations in Barview are Production (33 | 4.8%), Transportation (17 | 2.5%), and Material Moving (11 | 1.6%).
Production, Transportation and Moving Occupations by Sex
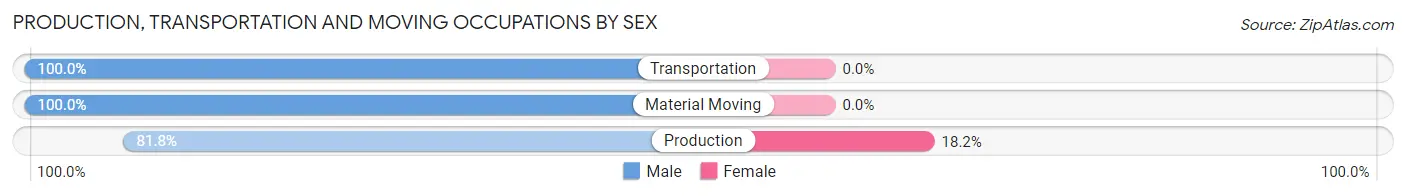
| Occupation | Male | Female |
| Production | 27 (81.8%) | 6 (18.2%) |
| Transportation | 17 (100.0%) | 0 (0.0%) |
| Material Moving | 11 (100.0%) | 0 (0.0%) |
| Total (Category) | 55 (90.2%) | 6 (9.8%) |
| Total (Overall) | 330 (47.6%) | 363 (52.4%) |
Employment Industries by Sex in Barview
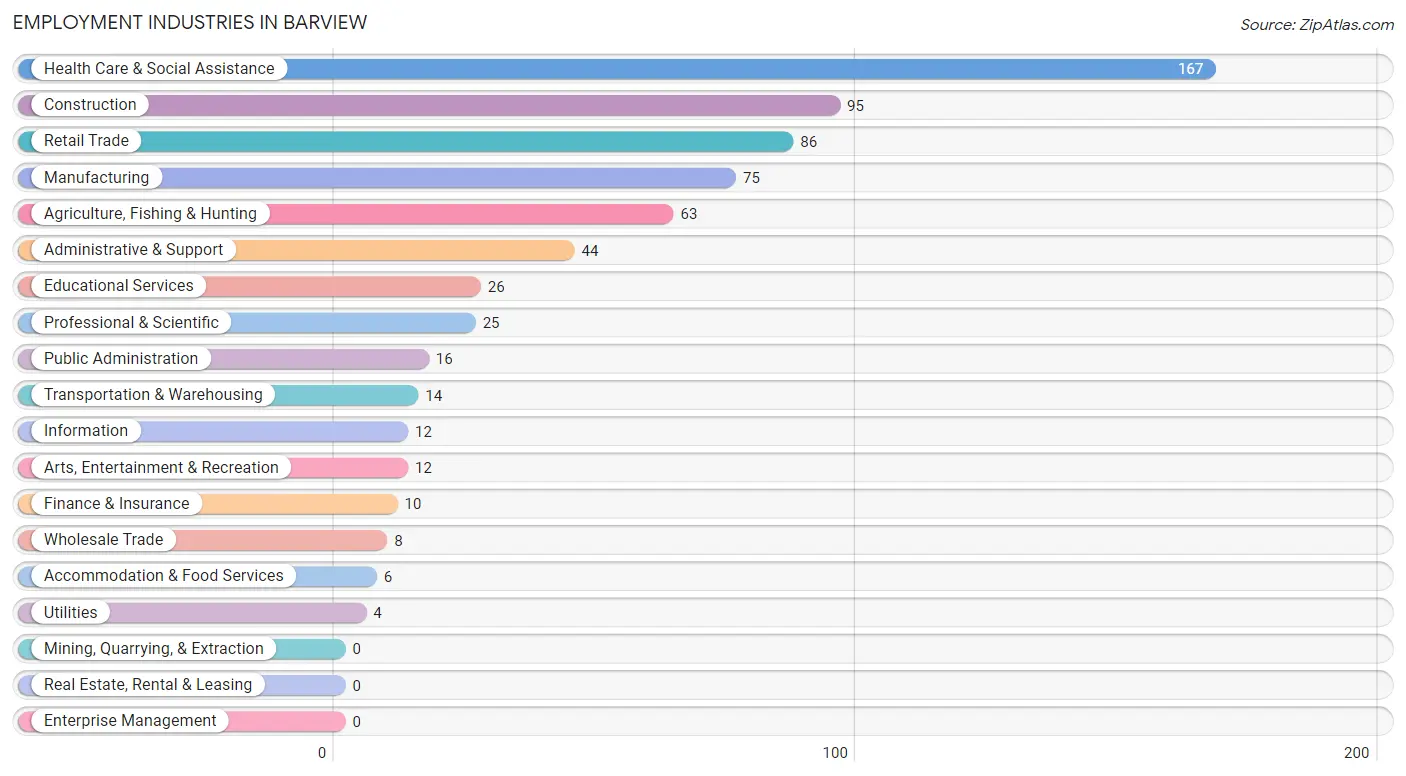
Employment Industries in Barview
The major employment industries in Barview include Health Care & Social Assistance (167 | 24.1%), Construction (95 | 13.7%), Retail Trade (86 | 12.4%), Manufacturing (75 | 10.8%), and Agriculture, Fishing & Hunting (63 | 9.1%).
Employment Industries by Sex in Barview
The Barview industries that see more men than women are Agriculture, Fishing & Hunting (100.0%), Utilities (100.0%), and Information (100.0%), whereas the industries that tend to have a higher number of women are Wholesale Trade (100.0%), Finance & Insurance (100.0%), and Administrative & Support (100.0%).
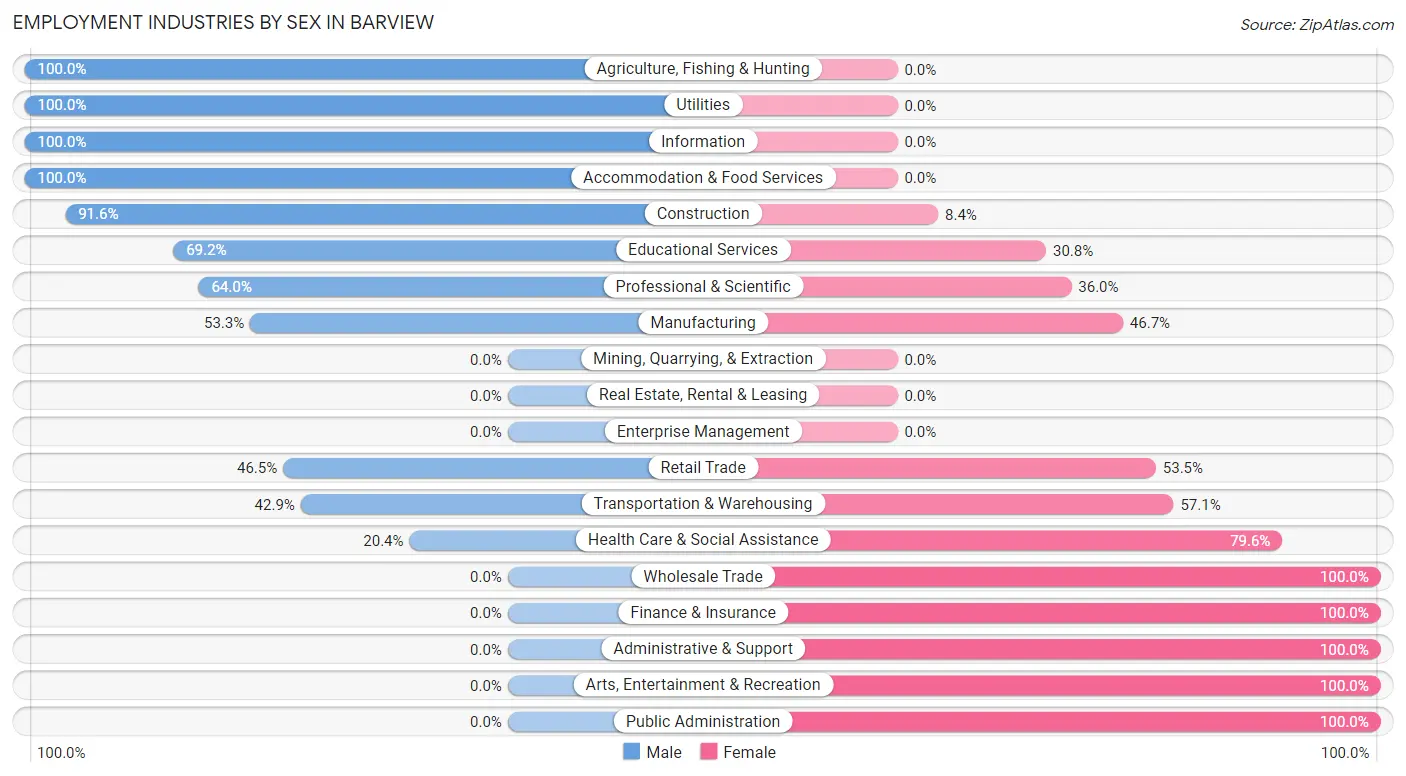
| Industry | Male | Female |
| Agriculture, Fishing & Hunting | 63 (100.0%) | 0 (0.0%) |
| Mining, Quarrying, & Extraction | 0 (0.0%) | 0 (0.0%) |
| Construction | 87 (91.6%) | 8 (8.4%) |
| Manufacturing | 40 (53.3%) | 35 (46.7%) |
| Wholesale Trade | 0 (0.0%) | 8 (100.0%) |
| Retail Trade | 40 (46.5%) | 46 (53.5%) |
| Transportation & Warehousing | 6 (42.9%) | 8 (57.1%) |
| Utilities | 4 (100.0%) | 0 (0.0%) |
| Information | 12 (100.0%) | 0 (0.0%) |
| Finance & Insurance | 0 (0.0%) | 10 (100.0%) |
| Real Estate, Rental & Leasing | 0 (0.0%) | 0 (0.0%) |
| Professional & Scientific | 16 (64.0%) | 9 (36.0%) |
| Enterprise Management | 0 (0.0%) | 0 (0.0%) |
| Administrative & Support | 0 (0.0%) | 44 (100.0%) |
| Educational Services | 18 (69.2%) | 8 (30.8%) |
| Health Care & Social Assistance | 34 (20.4%) | 133 (79.6%) |
| Arts, Entertainment & Recreation | 0 (0.0%) | 12 (100.0%) |
| Accommodation & Food Services | 6 (100.0%) | 0 (0.0%) |
| Public Administration | 0 (0.0%) | 16 (100.0%) |
| Total | 330 (47.6%) | 363 (52.4%) |
Education in Barview
School Enrollment in Barview
The most common levels of schooling among the 110 students in Barview are high school (62 | 56.4%), elementary school (39 | 35.4%), and college / undergraduate (6 | 5.4%).
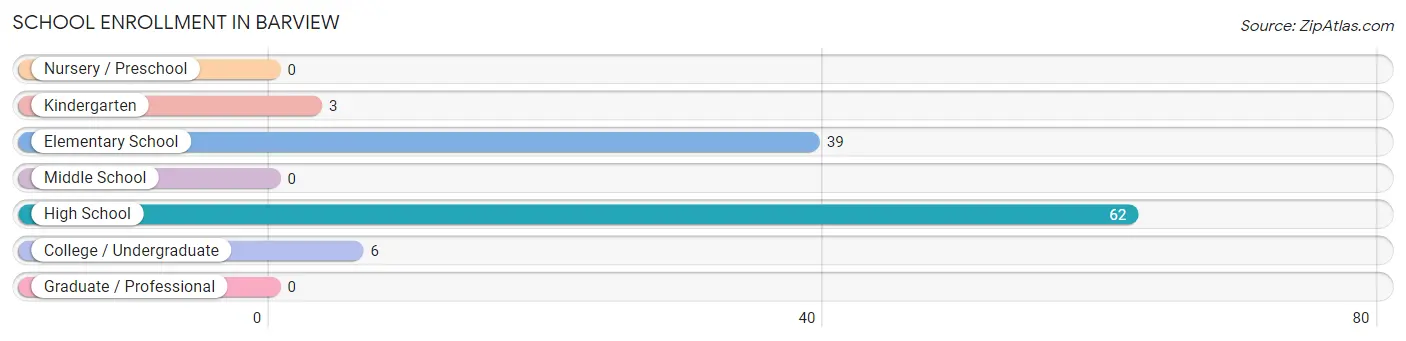
| School Level | # Students | % Students |
| Nursery / Preschool | 0 | 0.0% |
| Kindergarten | 3 | 2.7% |
| Elementary School | 39 | 35.4% |
| Middle School | 0 | 0.0% |
| High School | 62 | 56.4% |
| College / Undergraduate | 6 | 5.4% |
| Graduate / Professional | 0 | 0.0% |
| Total | 110 | 100.0% |
School Enrollment by Age by Funding Source in Barview
Out of a total of 110 students who are enrolled in schools in Barview, 48 (43.6%) attend a private institution, while the remaining 62 (56.4%) are enrolled in public schools. The age group of 18 to 19 year olds has the highest likelihood of being enrolled in private schools, with 14 (70.0% in the age bracket) enrolled. Conversely, the age group of 3 to 4 year olds has the lowest likelihood of being enrolled in a private school, with 3 (100.0% in the age bracket) attending a public institution.
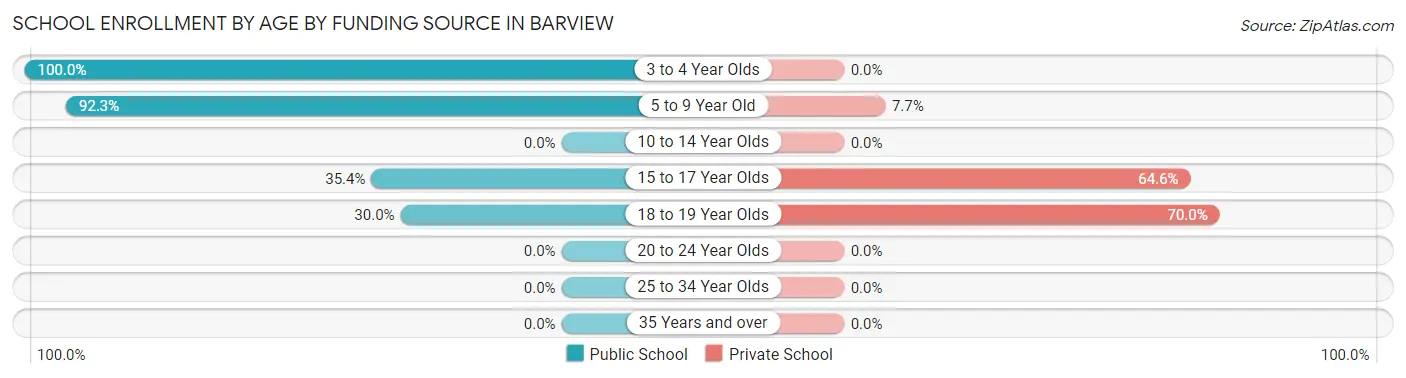
| Age Bracket | Public School | Private School |
| 3 to 4 Year Olds | 3 (100.0%) | 0 (0.0%) |
| 5 to 9 Year Old | 36 (92.3%) | 3 (7.7%) |
| 10 to 14 Year Olds | 0 (0.0%) | 0 (0.0%) |
| 15 to 17 Year Olds | 17 (35.4%) | 31 (64.6%) |
| 18 to 19 Year Olds | 6 (30.0%) | 14 (70.0%) |
| 20 to 24 Year Olds | 0 (0.0%) | 0 (0.0%) |
| 25 to 34 Year Olds | 0 (0.0%) | 0 (0.0%) |
| 35 Years and over | 0 (0.0%) | 0 (0.0%) |
| Total | 62 (56.4%) | 48 (43.6%) |
Educational Attainment by Field of Study in Barview
Bio, nature & agricultural (71 | 34.3%), education (40 | 19.3%), science & technology (33 | 15.9%), business (21 | 10.1%), and liberal arts & history (16 | 7.7%) are the most common fields of study among 207 individuals in Barview who have obtained a bachelor's degree or higher.
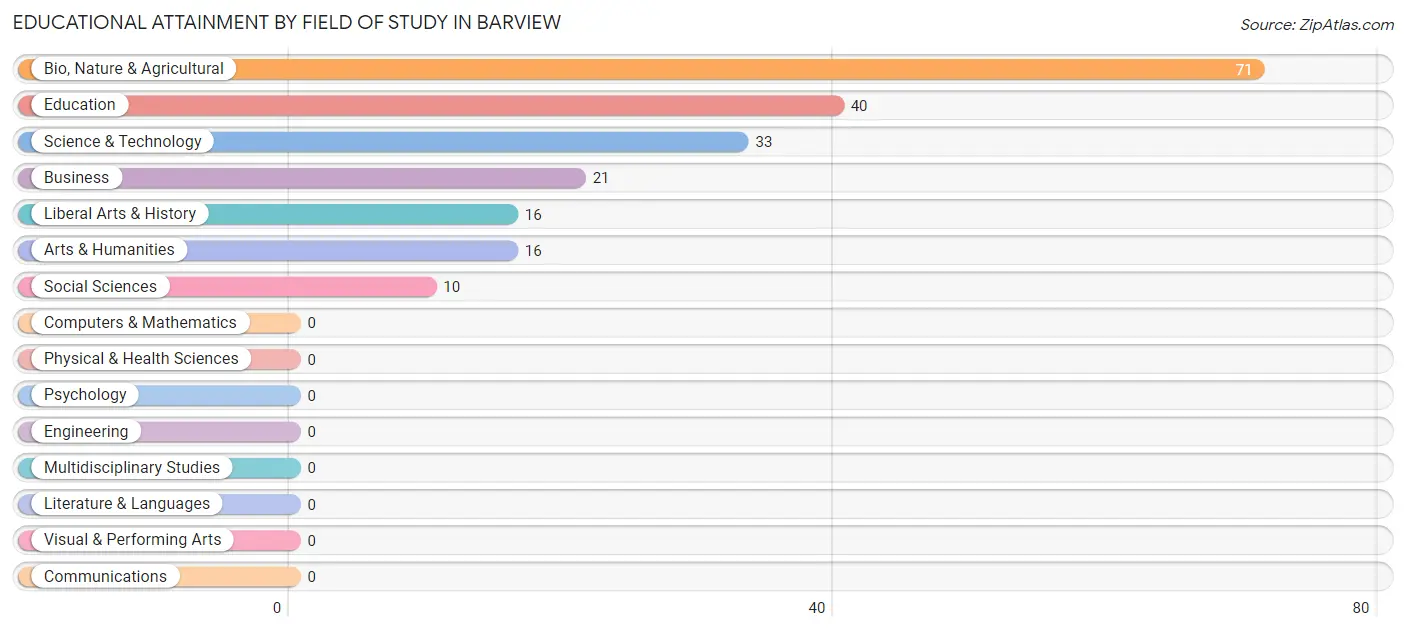
| Field of Study | # Graduates | % Graduates |
| Computers & Mathematics | 0 | 0.0% |
| Bio, Nature & Agricultural | 71 | 34.3% |
| Physical & Health Sciences | 0 | 0.0% |
| Psychology | 0 | 0.0% |
| Social Sciences | 10 | 4.8% |
| Engineering | 0 | 0.0% |
| Multidisciplinary Studies | 0 | 0.0% |
| Science & Technology | 33 | 15.9% |
| Business | 21 | 10.1% |
| Education | 40 | 19.3% |
| Literature & Languages | 0 | 0.0% |
| Liberal Arts & History | 16 | 7.7% |
| Visual & Performing Arts | 0 | 0.0% |
| Communications | 0 | 0.0% |
| Arts & Humanities | 16 | 7.7% |
| Total | 207 | 100.0% |
Transportation & Commute in Barview
Vehicle Availability by Sex in Barview
The most prevalent vehicle ownership categories in Barview are males with 3 vehicles (143, accounting for 43.3%) and females with 3 vehicles (97, making up 39.4%).
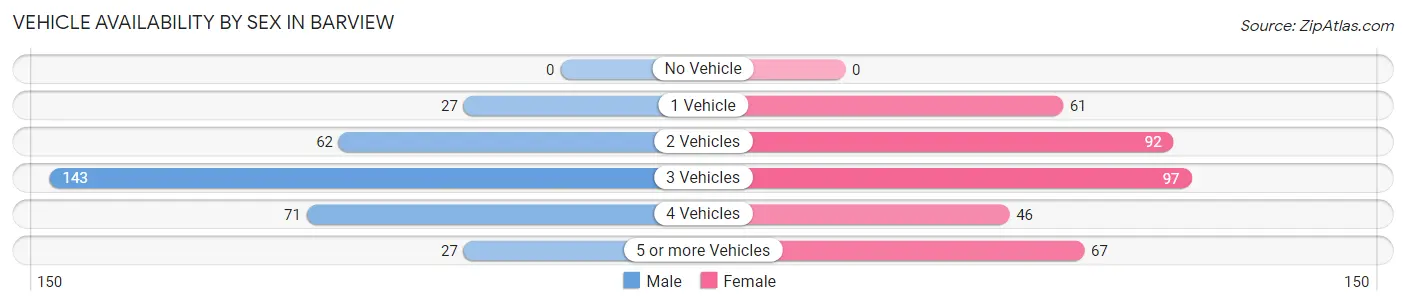
| Vehicles Available | Male | Female |
| No Vehicle | 0 (0.0%) | 0 (0.0%) |
| 1 Vehicle | 27 (8.2%) | 61 (16.8%) |
| 2 Vehicles | 62 (18.8%) | 92 (25.3%) |
| 3 Vehicles | 143 (43.3%) | 97 (26.7%) |
| 4 Vehicles | 71 (21.5%) | 46 (12.7%) |
| 5 or more Vehicles | 27 (8.2%) | 67 (18.5%) |
| Total | 330 (100.0%) | 363 (100.0%) |
Commute Time in Barview
The most frequently occuring commute durations in Barview are 15 to 19 minutes (214 commuters, 35.8%), 10 to 14 minutes (94 commuters, 15.8%), and 20 to 24 minutes (83 commuters, 13.9%).
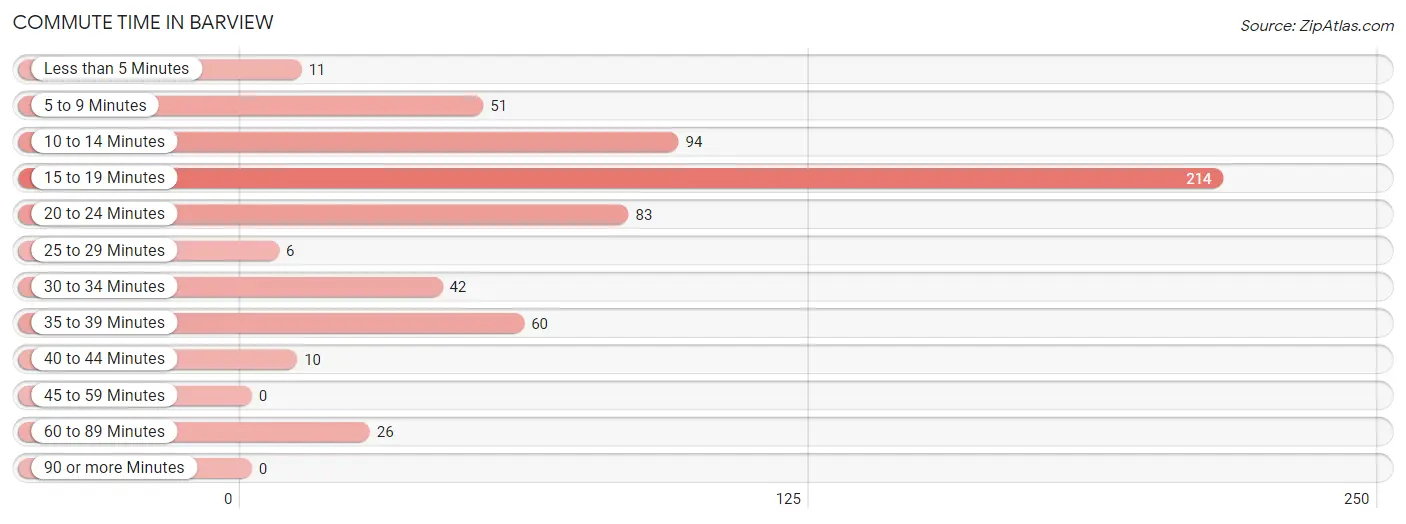
| Commute Time | # Commuters | % Commuters |
| Less than 5 Minutes | 11 | 1.8% |
| 5 to 9 Minutes | 51 | 8.5% |
| 10 to 14 Minutes | 94 | 15.8% |
| 15 to 19 Minutes | 214 | 35.8% |
| 20 to 24 Minutes | 83 | 13.9% |
| 25 to 29 Minutes | 6 | 1.0% |
| 30 to 34 Minutes | 42 | 7.0% |
| 35 to 39 Minutes | 60 | 10.1% |
| 40 to 44 Minutes | 10 | 1.7% |
| 45 to 59 Minutes | 0 | 0.0% |
| 60 to 89 Minutes | 26 | 4.4% |
| 90 or more Minutes | 0 | 0.0% |
Commute Time by Sex in Barview
The most common commute times in Barview are 15 to 19 minutes (115 commuters, 36.2%) for males and 15 to 19 minutes (99 commuters, 35.5%) for females.
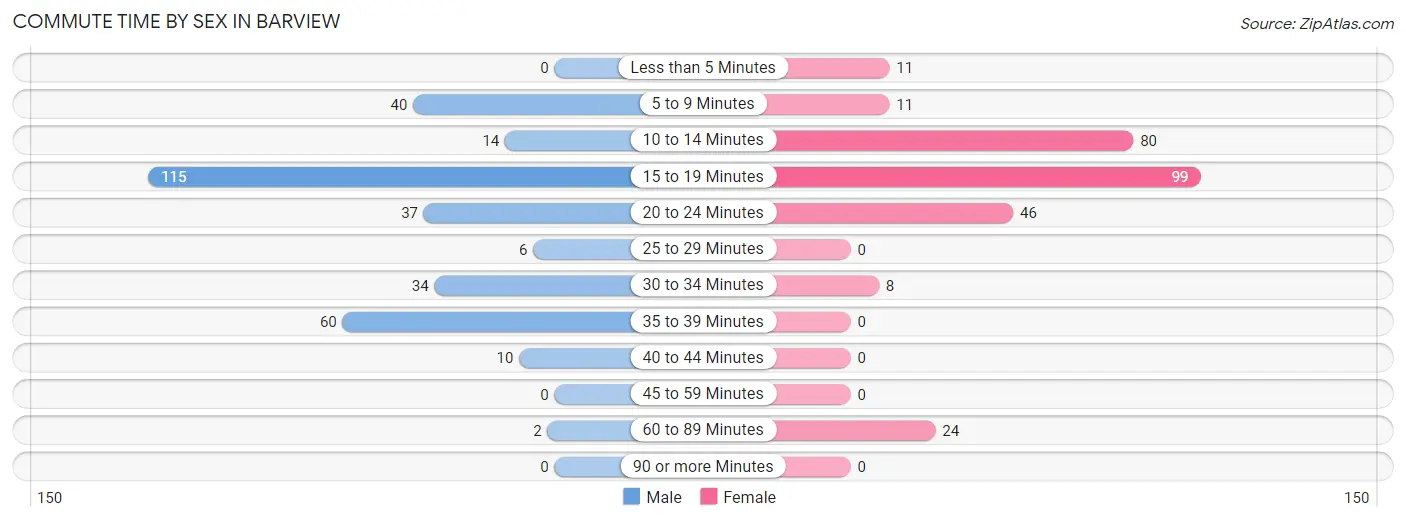
| Commute Time | Male | Female |
| Less than 5 Minutes | 0 (0.0%) | 11 (3.9%) |
| 5 to 9 Minutes | 40 (12.6%) | 11 (3.9%) |
| 10 to 14 Minutes | 14 (4.4%) | 80 (28.7%) |
| 15 to 19 Minutes | 115 (36.2%) | 99 (35.5%) |
| 20 to 24 Minutes | 37 (11.6%) | 46 (16.5%) |
| 25 to 29 Minutes | 6 (1.9%) | 0 (0.0%) |
| 30 to 34 Minutes | 34 (10.7%) | 8 (2.9%) |
| 35 to 39 Minutes | 60 (18.9%) | 0 (0.0%) |
| 40 to 44 Minutes | 10 (3.1%) | 0 (0.0%) |
| 45 to 59 Minutes | 0 (0.0%) | 0 (0.0%) |
| 60 to 89 Minutes | 2 (0.6%) | 24 (8.6%) |
| 90 or more Minutes | 0 (0.0%) | 0 (0.0%) |
Time of Departure to Work by Sex in Barview
The most frequent times of departure to work in Barview are 7:00 AM to 7:29 AM (115, 36.2%) for males and 7:30 AM to 7:59 AM (69, 24.7%) for females.
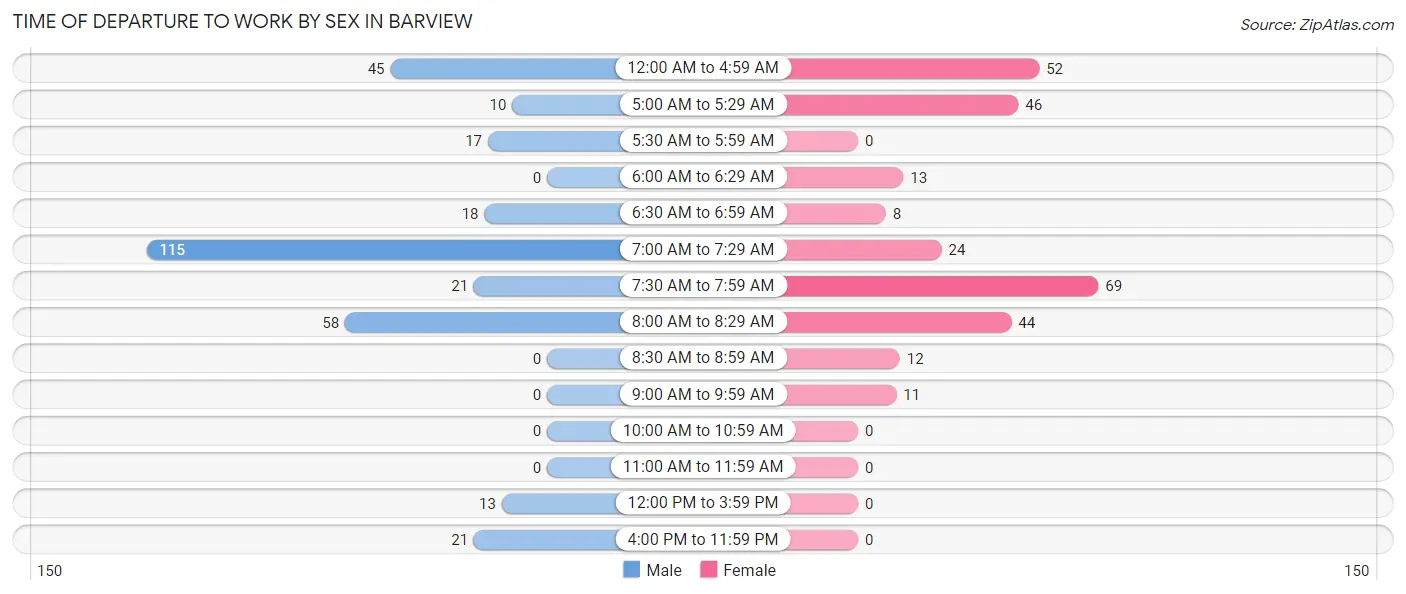
| Time of Departure | Male | Female |
| 12:00 AM to 4:59 AM | 45 (14.1%) | 52 (18.6%) |
| 5:00 AM to 5:29 AM | 10 (3.1%) | 46 (16.5%) |
| 5:30 AM to 5:59 AM | 17 (5.3%) | 0 (0.0%) |
| 6:00 AM to 6:29 AM | 0 (0.0%) | 13 (4.7%) |
| 6:30 AM to 6:59 AM | 18 (5.7%) | 8 (2.9%) |
| 7:00 AM to 7:29 AM | 115 (36.2%) | 24 (8.6%) |
| 7:30 AM to 7:59 AM | 21 (6.6%) | 69 (24.7%) |
| 8:00 AM to 8:29 AM | 58 (18.2%) | 44 (15.8%) |
| 8:30 AM to 8:59 AM | 0 (0.0%) | 12 (4.3%) |
| 9:00 AM to 9:59 AM | 0 (0.0%) | 11 (3.9%) |
| 10:00 AM to 10:59 AM | 0 (0.0%) | 0 (0.0%) |
| 11:00 AM to 11:59 AM | 0 (0.0%) | 0 (0.0%) |
| 12:00 PM to 3:59 PM | 13 (4.1%) | 0 (0.0%) |
| 4:00 PM to 11:59 PM | 21 (6.6%) | 0 (0.0%) |
| Total | 318 (100.0%) | 279 (100.0%) |
Housing Occupancy in Barview
Occupancy by Ownership in Barview
Of the total 674 dwellings in Barview, owner-occupied units account for 602 (89.3%), while renter-occupied units make up 72 (10.7%).
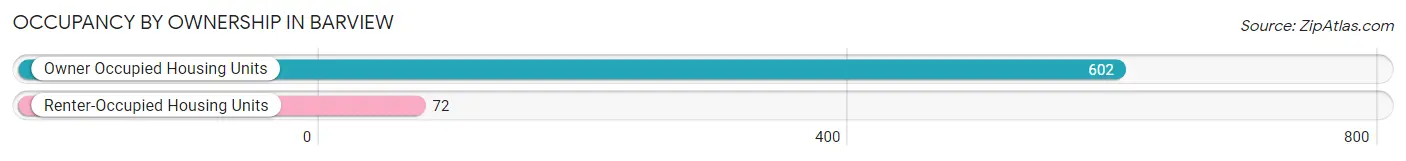
| Occupancy | # Housing Units | % Housing Units |
| Owner Occupied Housing Units | 602 | 89.3% |
| Renter-Occupied Housing Units | 72 | 10.7% |
| Total Occupied Housing Units | 674 | 100.0% |
Occupancy by Household Size in Barview
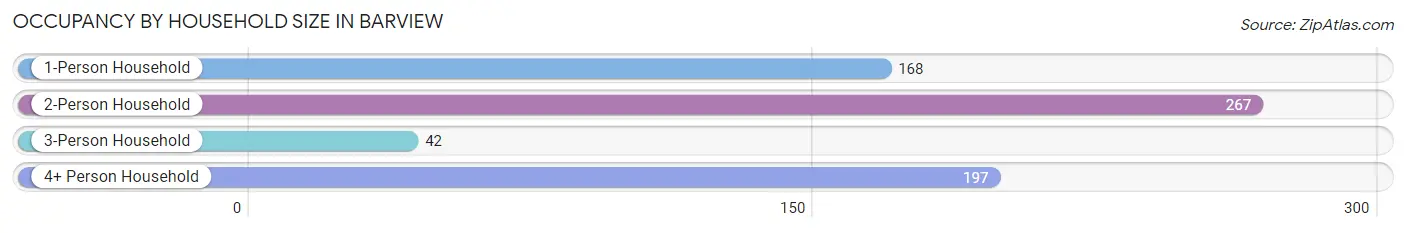
| Household Size | # Housing Units | % Housing Units |
| 1-Person Household | 168 | 24.9% |
| 2-Person Household | 267 | 39.6% |
| 3-Person Household | 42 | 6.2% |
| 4+ Person Household | 197 | 29.2% |
| Total Housing Units | 674 | 100.0% |
Occupancy by Ownership by Household Size in Barview
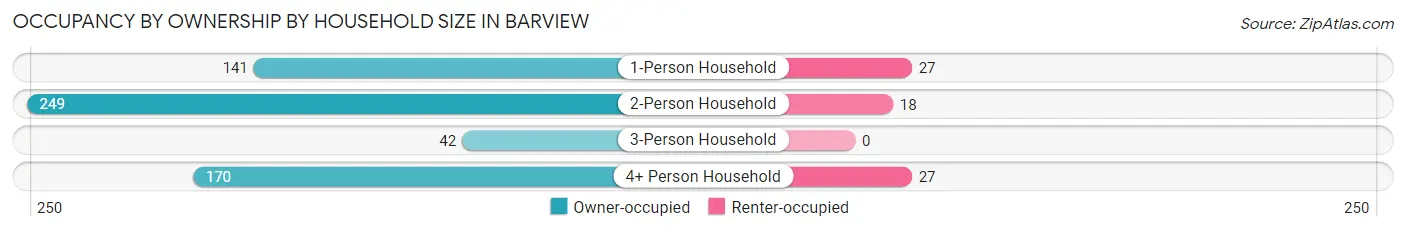
| Household Size | Owner-occupied | Renter-occupied |
| 1-Person Household | 141 (83.9%) | 27 (16.1%) |
| 2-Person Household | 249 (93.3%) | 18 (6.7%) |
| 3-Person Household | 42 (100.0%) | 0 (0.0%) |
| 4+ Person Household | 170 (86.3%) | 27 (13.7%) |
| Total Housing Units | 602 (89.3%) | 72 (10.7%) |
Occupancy by Educational Attainment in Barview
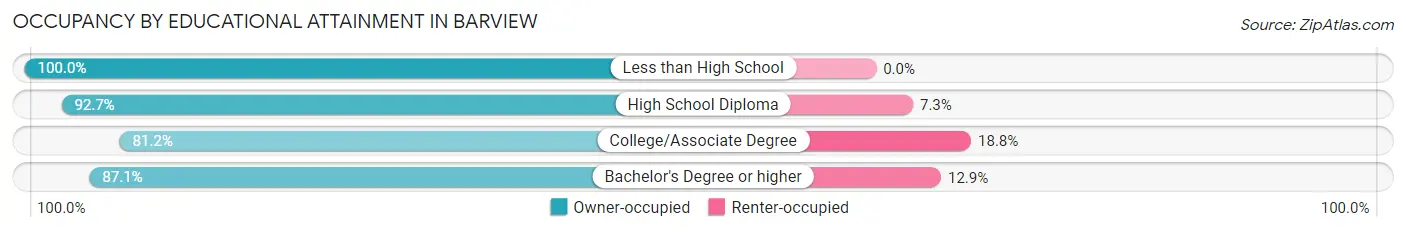
| Household Size | Owner-occupied | Renter-occupied |
| Less than High School | 63 (100.0%) | 0 (0.0%) |
| High School Diploma | 279 (92.7%) | 22 (7.3%) |
| College/Associate Degree | 138 (81.2%) | 32 (18.8%) |
| Bachelor's Degree or higher | 122 (87.1%) | 18 (12.9%) |
Occupancy by Age of Householder in Barview
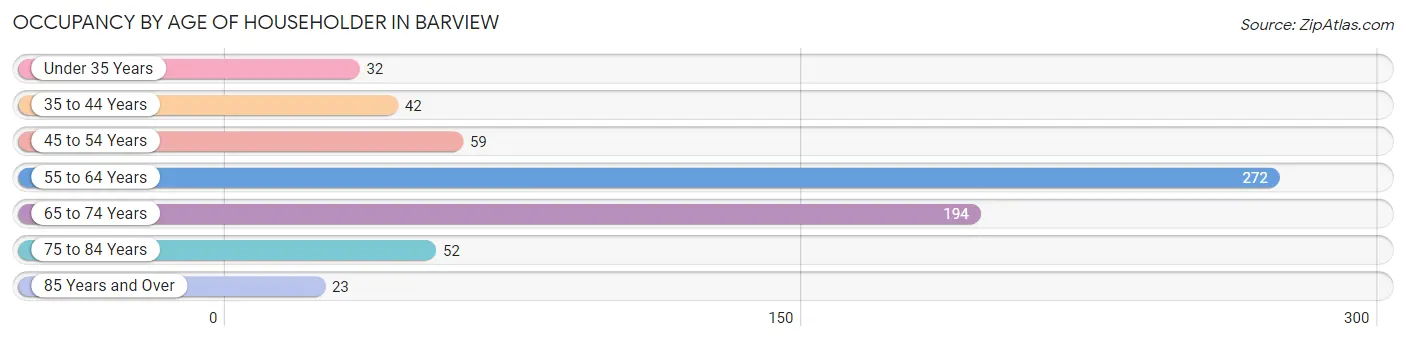
| Age Bracket | # Households | % Households |
| Under 35 Years | 32 | 4.8% |
| 35 to 44 Years | 42 | 6.2% |
| 45 to 54 Years | 59 | 8.7% |
| 55 to 64 Years | 272 | 40.4% |
| 65 to 74 Years | 194 | 28.8% |
| 75 to 84 Years | 52 | 7.7% |
| 85 Years and Over | 23 | 3.4% |
| Total | 674 | 100.0% |
Housing Finances in Barview
Median Income by Occupancy in Barview
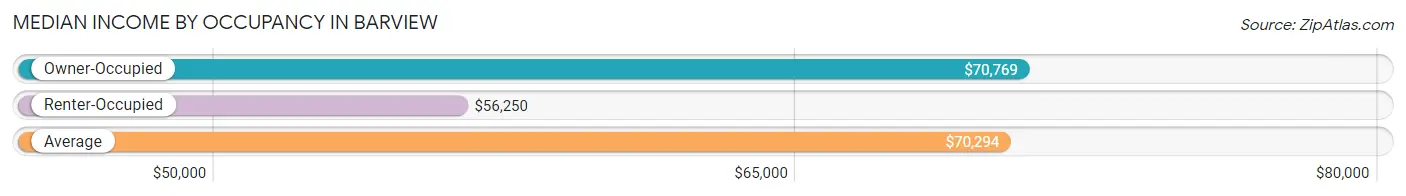
| Occupancy Type | # Households | Median Income |
| Owner-Occupied | 602 (89.3%) | $70,769 |
| Renter-Occupied | 72 (10.7%) | $56,250 |
| Average | 674 (100.0%) | $70,294 |
Occupancy by Householder Income Bracket in Barview
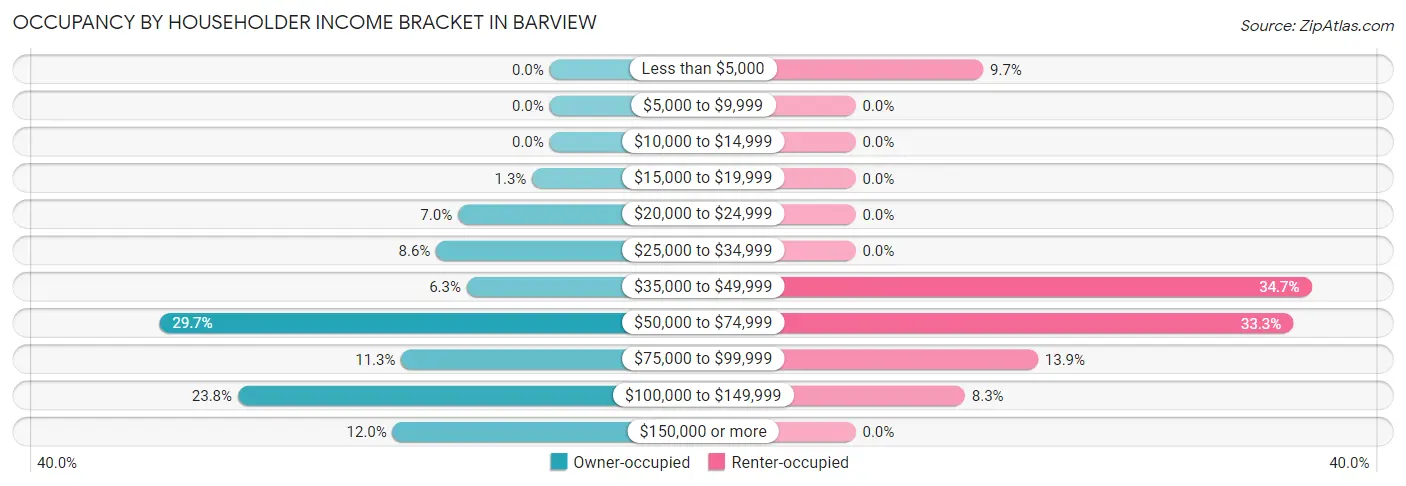
| Income Bracket | Owner-occupied | Renter-occupied |
| Less than $5,000 | 0 (0.0%) | 7 (9.7%) |
| $5,000 to $9,999 | 0 (0.0%) | 0 (0.0%) |
| $10,000 to $14,999 | 0 (0.0%) | 0 (0.0%) |
| $15,000 to $19,999 | 8 (1.3%) | 0 (0.0%) |
| $20,000 to $24,999 | 42 (7.0%) | 0 (0.0%) |
| $25,000 to $34,999 | 52 (8.6%) | 0 (0.0%) |
| $35,000 to $49,999 | 38 (6.3%) | 25 (34.7%) |
| $50,000 to $74,999 | 179 (29.7%) | 24 (33.3%) |
| $75,000 to $99,999 | 68 (11.3%) | 10 (13.9%) |
| $100,000 to $149,999 | 143 (23.7%) | 6 (8.3%) |
| $150,000 or more | 72 (12.0%) | 0 (0.0%) |
| Total | 602 (100.0%) | 72 (100.0%) |
Monthly Housing Cost Tiers in Barview
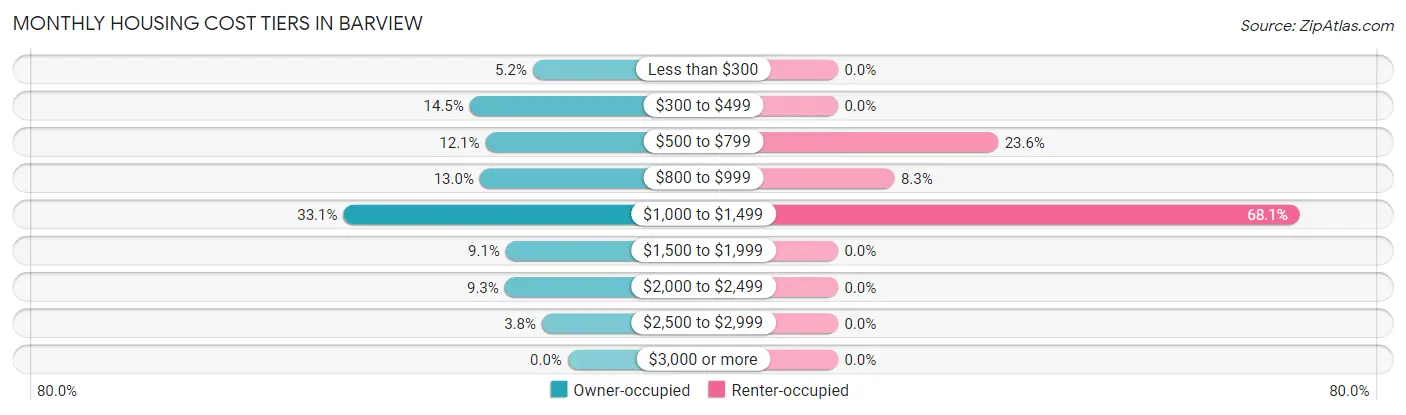
| Monthly Cost | Owner-occupied | Renter-occupied |
| Less than $300 | 31 (5.1%) | 0 (0.0%) |
| $300 to $499 | 87 (14.4%) | 0 (0.0%) |
| $500 to $799 | 73 (12.1%) | 17 (23.6%) |
| $800 to $999 | 78 (13.0%) | 6 (8.3%) |
| $1,000 to $1,499 | 199 (33.1%) | 49 (68.1%) |
| $1,500 to $1,999 | 55 (9.1%) | 0 (0.0%) |
| $2,000 to $2,499 | 56 (9.3%) | 0 (0.0%) |
| $2,500 to $2,999 | 23 (3.8%) | 0 (0.0%) |
| $3,000 or more | 0 (0.0%) | 0 (0.0%) |
| Total | 602 (100.0%) | 72 (100.0%) |
Physical Housing Characteristics in Barview
Housing Structures in Barview
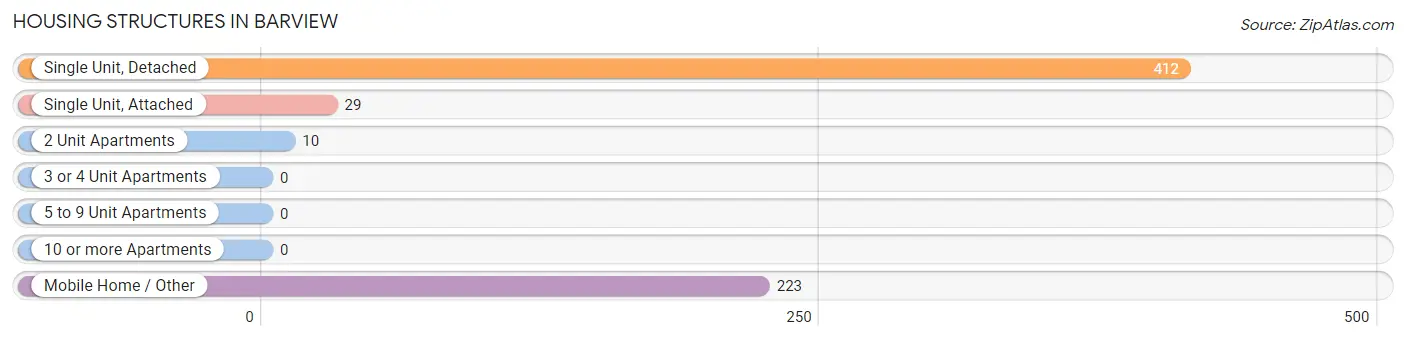
| Structure Type | # Housing Units | % Housing Units |
| Single Unit, Detached | 412 | 61.1% |
| Single Unit, Attached | 29 | 4.3% |
| 2 Unit Apartments | 10 | 1.5% |
| 3 or 4 Unit Apartments | 0 | 0.0% |
| 5 to 9 Unit Apartments | 0 | 0.0% |
| 10 or more Apartments | 0 | 0.0% |
| Mobile Home / Other | 223 | 33.1% |
| Total | 674 | 100.0% |
Housing Structures by Occupancy in Barview
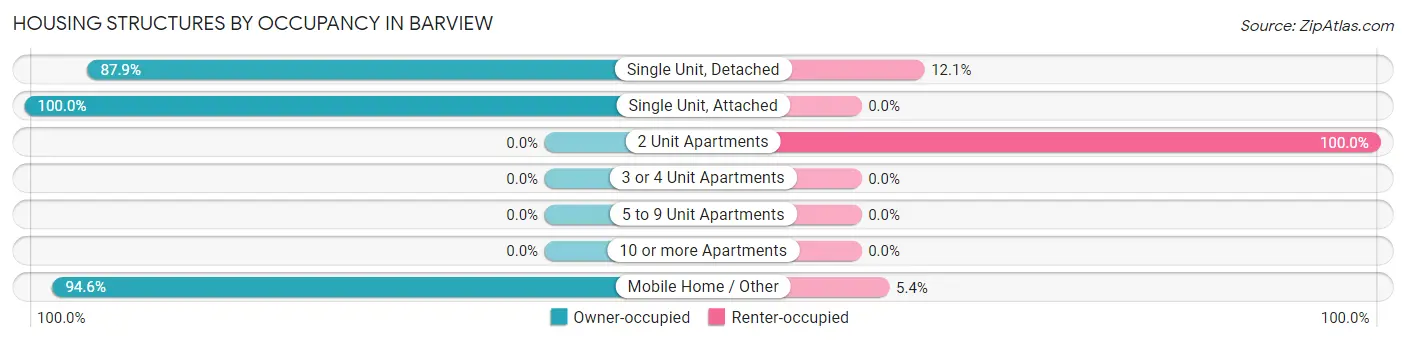
| Structure Type | Owner-occupied | Renter-occupied |
| Single Unit, Detached | 362 (87.9%) | 50 (12.1%) |
| Single Unit, Attached | 29 (100.0%) | 0 (0.0%) |
| 2 Unit Apartments | 0 (0.0%) | 10 (100.0%) |
| 3 or 4 Unit Apartments | 0 (0.0%) | 0 (0.0%) |
| 5 to 9 Unit Apartments | 0 (0.0%) | 0 (0.0%) |
| 10 or more Apartments | 0 (0.0%) | 0 (0.0%) |
| Mobile Home / Other | 211 (94.6%) | 12 (5.4%) |
| Total | 602 (89.3%) | 72 (10.7%) |
Housing Structures by Number of Rooms in Barview
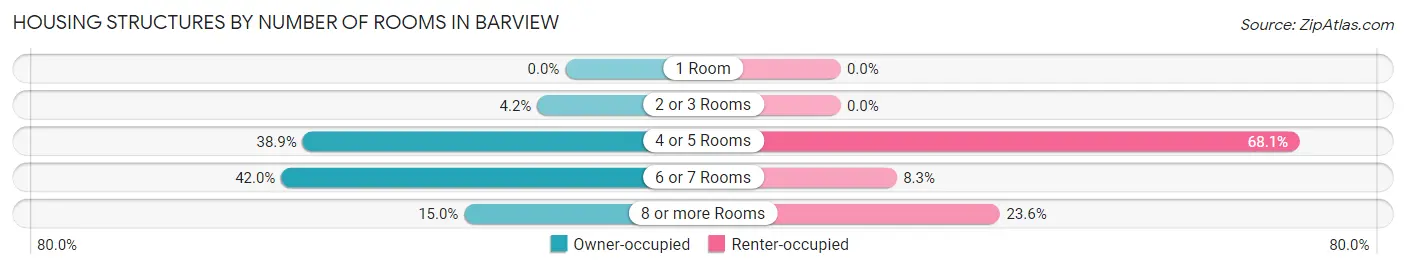
| Number of Rooms | Owner-occupied | Renter-occupied |
| 1 Room | 0 (0.0%) | 0 (0.0%) |
| 2 or 3 Rooms | 25 (4.2%) | 0 (0.0%) |
| 4 or 5 Rooms | 234 (38.9%) | 49 (68.1%) |
| 6 or 7 Rooms | 253 (42.0%) | 6 (8.3%) |
| 8 or more Rooms | 90 (14.9%) | 17 (23.6%) |
| Total | 602 (100.0%) | 72 (100.0%) |
Housing Structure by Heating Type in Barview
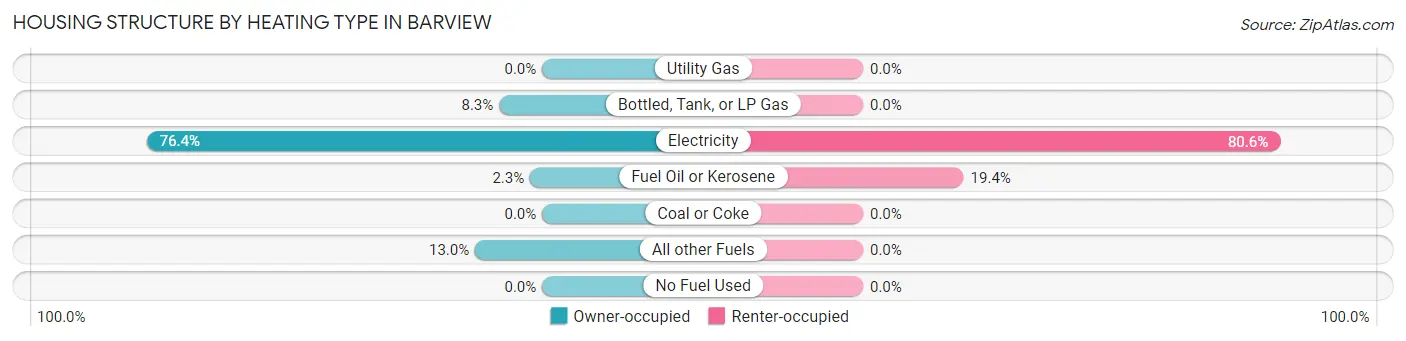
| Heating Type | Owner-occupied | Renter-occupied |
| Utility Gas | 0 (0.0%) | 0 (0.0%) |
| Bottled, Tank, or LP Gas | 50 (8.3%) | 0 (0.0%) |
| Electricity | 460 (76.4%) | 58 (80.6%) |
| Fuel Oil or Kerosene | 14 (2.3%) | 14 (19.4%) |
| Coal or Coke | 0 (0.0%) | 0 (0.0%) |
| All other Fuels | 78 (13.0%) | 0 (0.0%) |
| No Fuel Used | 0 (0.0%) | 0 (0.0%) |
| Total | 602 (100.0%) | 72 (100.0%) |
Household Vehicle Usage in Barview
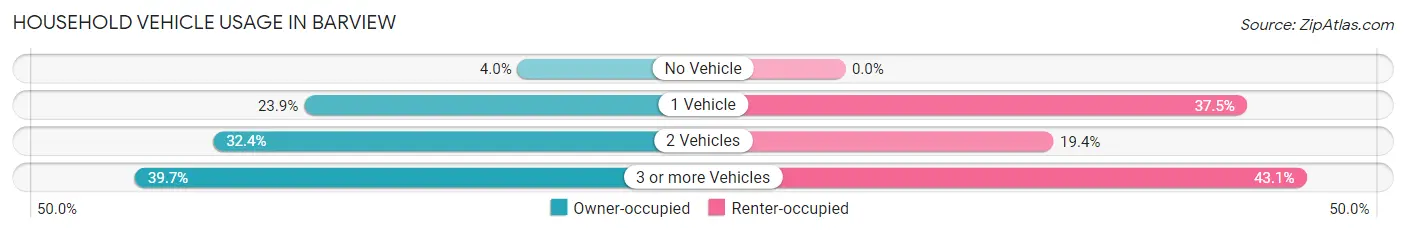
| Vehicles per Household | Owner-occupied | Renter-occupied |
| No Vehicle | 24 (4.0%) | 0 (0.0%) |
| 1 Vehicle | 144 (23.9%) | 27 (37.5%) |
| 2 Vehicles | 195 (32.4%) | 14 (19.4%) |
| 3 or more Vehicles | 239 (39.7%) | 31 (43.1%) |
| Total | 602 (100.0%) | 72 (100.0%) |
Real Estate & Mortgages in Barview
Real Estate and Mortgage Overview in Barview
| Characteristic | Without Mortgage | With Mortgage |
| Housing Units | 261 | 341 |
| Median Property Value | $173,800 | $197,700 |
| Median Household Income | $70,956 | $21 |
| Monthly Housing Costs | $524 | $0 |
| Real Estate Taxes | $1,713 | $66 |
Property Value by Mortgage Status in Barview
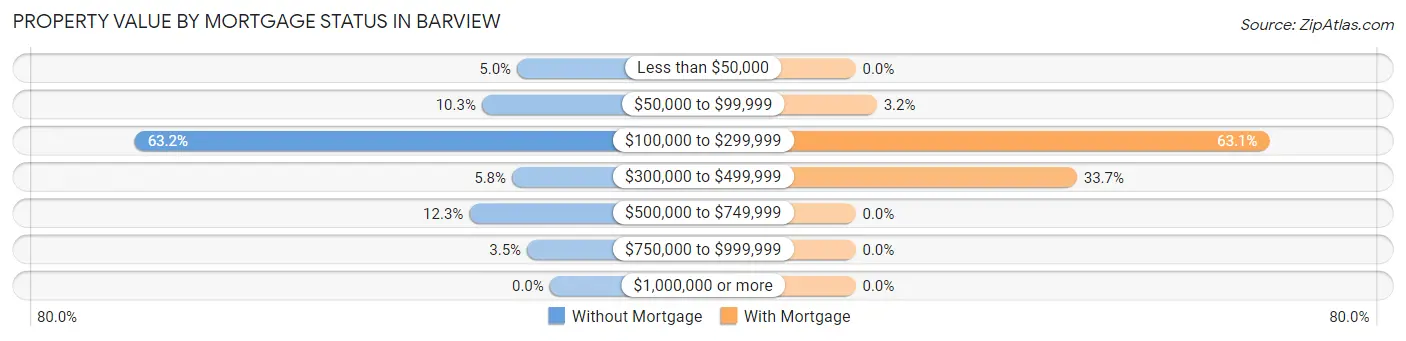
| Property Value | Without Mortgage | With Mortgage |
| Less than $50,000 | 13 (5.0%) | 0 (0.0%) |
| $50,000 to $99,999 | 27 (10.3%) | 11 (3.2%) |
| $100,000 to $299,999 | 165 (63.2%) | 215 (63.0%) |
| $300,000 to $499,999 | 15 (5.8%) | 115 (33.7%) |
| $500,000 to $749,999 | 32 (12.3%) | 0 (0.0%) |
| $750,000 to $999,999 | 9 (3.5%) | 0 (0.0%) |
| $1,000,000 or more | 0 (0.0%) | 0 (0.0%) |
| Total | 261 (100.0%) | 341 (100.0%) |
Household Income by Mortgage Status in Barview
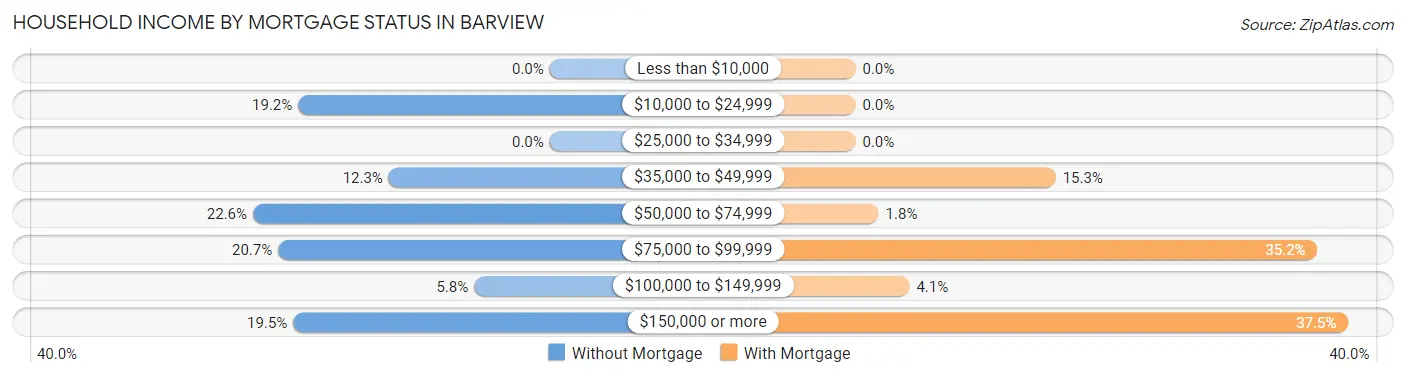
| Household Income | Without Mortgage | With Mortgage |
| Less than $10,000 | 0 (0.0%) | 0 (0.0%) |
| $10,000 to $24,999 | 50 (19.2%) | 0 (0.0%) |
| $25,000 to $34,999 | 0 (0.0%) | 0 (0.0%) |
| $35,000 to $49,999 | 32 (12.3%) | 52 (15.2%) |
| $50,000 to $74,999 | 59 (22.6%) | 6 (1.8%) |
| $75,000 to $99,999 | 54 (20.7%) | 120 (35.2%) |
| $100,000 to $149,999 | 15 (5.8%) | 14 (4.1%) |
| $150,000 or more | 51 (19.5%) | 128 (37.5%) |
| Total | 261 (100.0%) | 341 (100.0%) |
Property Value to Household Income Ratio in Barview
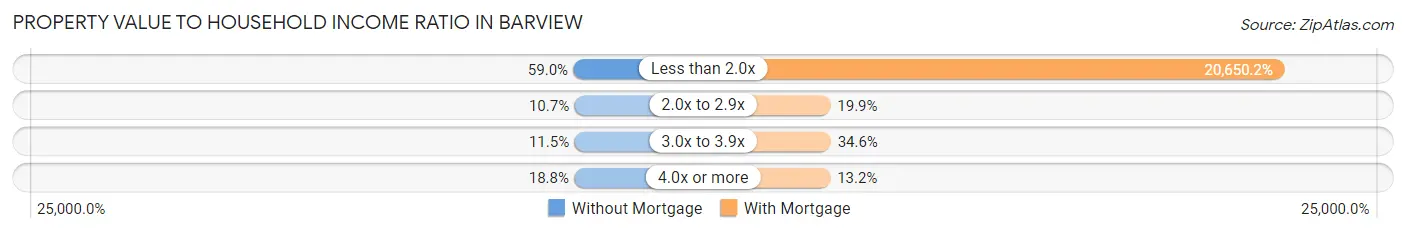
| Value-to-Income Ratio | Without Mortgage | With Mortgage |
| Less than 2.0x | 154 (59.0%) | 70,417 (20,650.1%) |
| 2.0x to 2.9x | 28 (10.7%) | 68 (19.9%) |
| 3.0x to 3.9x | 30 (11.5%) | 118 (34.6%) |
| 4.0x or more | 49 (18.8%) | 45 (13.2%) |
| Total | 261 (100.0%) | 341 (100.0%) |
Real Estate Taxes by Mortgage Status in Barview
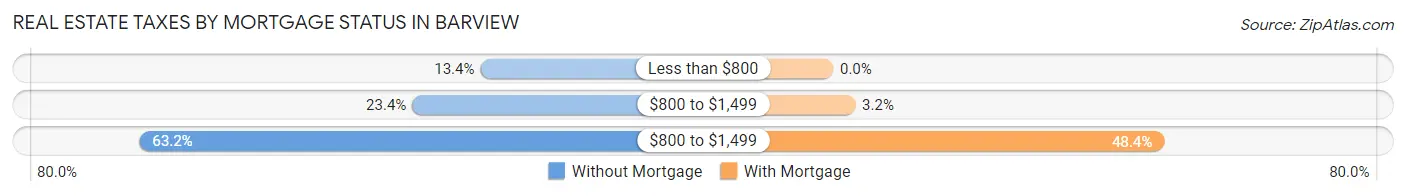
| Property Taxes | Without Mortgage | With Mortgage |
| Less than $800 | 35 (13.4%) | 0 (0.0%) |
| $800 to $1,499 | 61 (23.4%) | 11 (3.2%) |
| $800 to $1,499 | 165 (63.2%) | 165 (48.4%) |
| Total | 261 (100.0%) | 341 (100.0%) |
Health & Disability in Barview
Health Insurance Coverage by Age in Barview
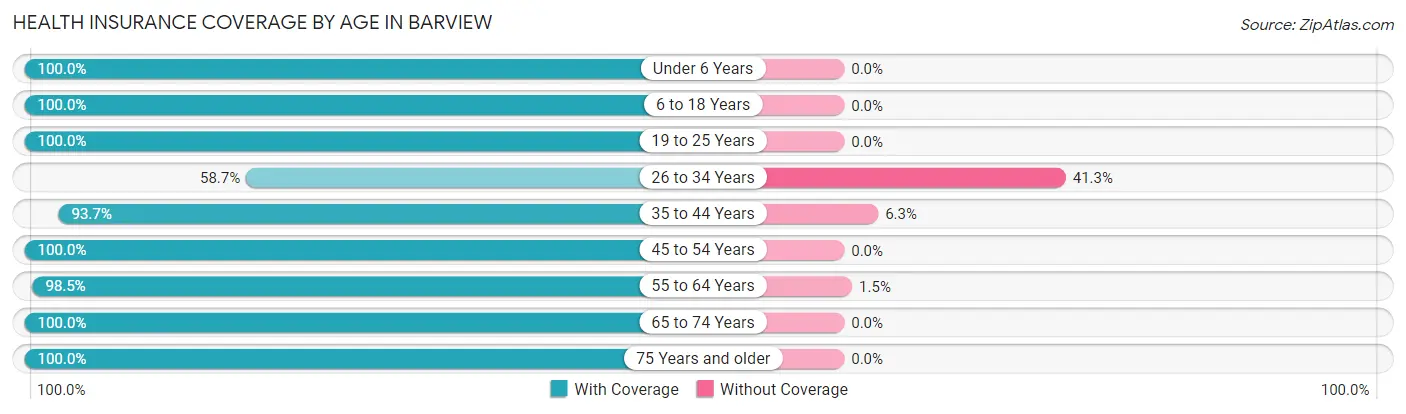
| Age Bracket | With Coverage | Without Coverage |
| Under 6 Years | 144 (100.0%) | 0 (0.0%) |
| 6 to 18 Years | 87 (100.0%) | 0 (0.0%) |
| 19 to 25 Years | 94 (100.0%) | 0 (0.0%) |
| 26 to 34 Years | 108 (58.7%) | 76 (41.3%) |
| 35 to 44 Years | 207 (93.7%) | 14 (6.3%) |
| 45 to 54 Years | 142 (100.0%) | 0 (0.0%) |
| 55 to 64 Years | 403 (98.5%) | 6 (1.5%) |
| 65 to 74 Years | 292 (100.0%) | 0 (0.0%) |
| 75 Years and older | 153 (100.0%) | 0 (0.0%) |
| Total | 1,630 (94.4%) | 96 (5.6%) |
Health Insurance Coverage by Citizenship Status in Barview

| Citizenship Status | With Coverage | Without Coverage |
| Native Born | 144 (100.0%) | 0 (0.0%) |
| Foreign Born, Citizen | 87 (100.0%) | 0 (0.0%) |
| Foreign Born, not a Citizen | 94 (100.0%) | 0 (0.0%) |
Health Insurance Coverage by Household Income in Barview
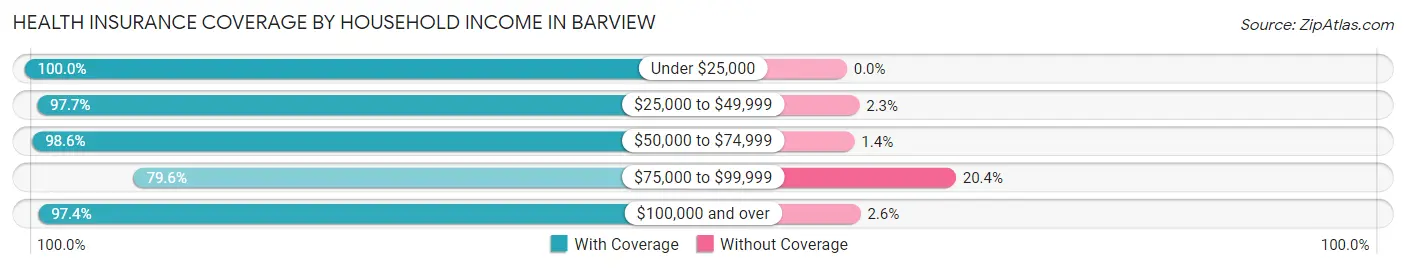
| Household Income | With Coverage | Without Coverage |
| Under $25,000 | 85 (100.0%) | 0 (0.0%) |
| $25,000 to $49,999 | 250 (97.7%) | 6 (2.3%) |
| $50,000 to $74,999 | 415 (98.6%) | 6 (1.4%) |
| $75,000 to $99,999 | 265 (79.6%) | 68 (20.4%) |
| $100,000 and over | 609 (97.4%) | 16 (2.6%) |
Public vs Private Health Insurance Coverage by Age in Barview
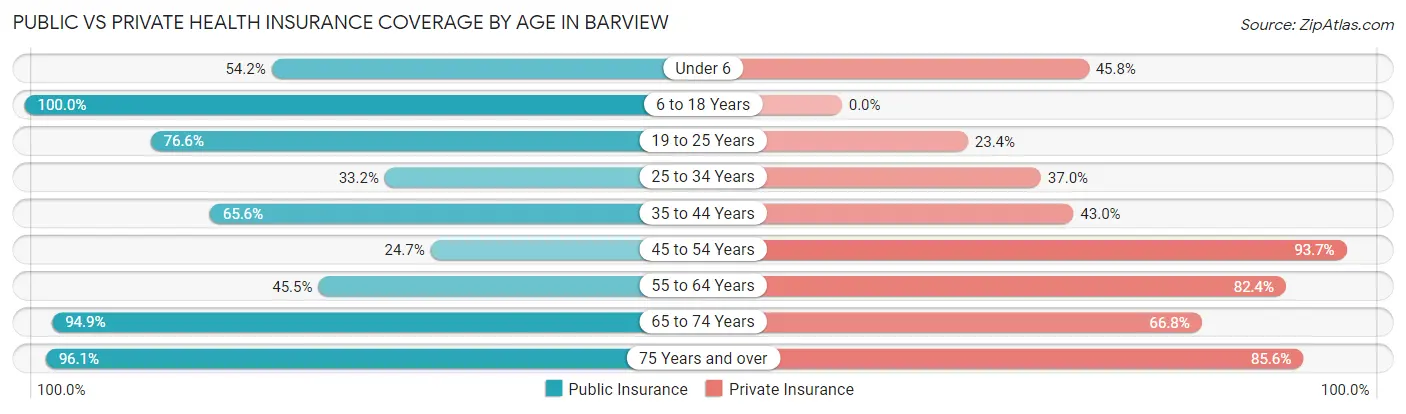
| Age Bracket | Public Insurance | Private Insurance |
| Under 6 | 78 (54.2%) | 66 (45.8%) |
| 6 to 18 Years | 87 (100.0%) | 0 (0.0%) |
| 19 to 25 Years | 72 (76.6%) | 22 (23.4%) |
| 25 to 34 Years | 61 (33.2%) | 68 (37.0%) |
| 35 to 44 Years | 145 (65.6%) | 95 (43.0%) |
| 45 to 54 Years | 35 (24.6%) | 133 (93.7%) |
| 55 to 64 Years | 186 (45.5%) | 337 (82.4%) |
| 65 to 74 Years | 277 (94.9%) | 195 (66.8%) |
| 75 Years and over | 147 (96.1%) | 131 (85.6%) |
| Total | 1,088 (63.0%) | 1,047 (60.7%) |
Disability Status by Sex by Age in Barview
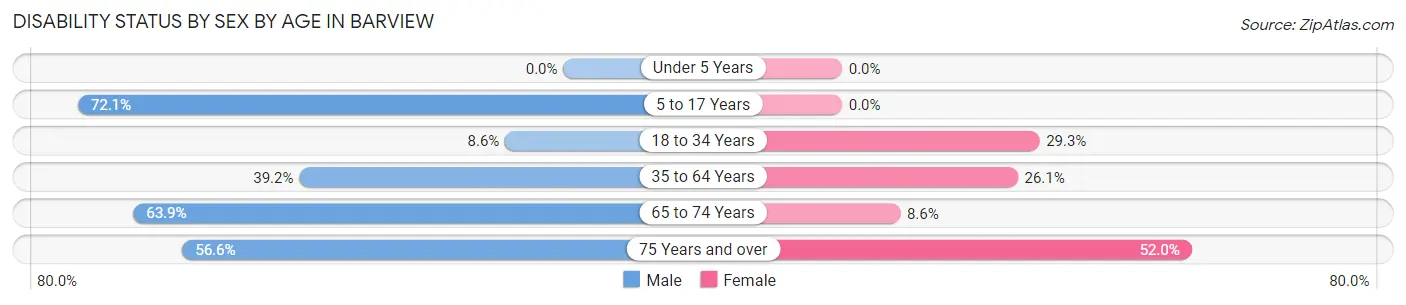
| Age Bracket | Male | Female |
| Under 5 Years | 0 (0.0%) | 0 (0.0%) |
| 5 to 17 Years | 31 (72.1%) | 0 (0.0%) |
| 18 to 34 Years | 14 (8.6%) | 34 (29.3%) |
| 35 to 64 Years | 169 (39.2%) | 89 (26.1%) |
| 65 to 74 Years | 83 (63.8%) | 14 (8.6%) |
| 75 Years and over | 43 (56.6%) | 40 (51.9%) |
Disability Class by Sex by Age in Barview
Disability Class: Hearing Difficulty
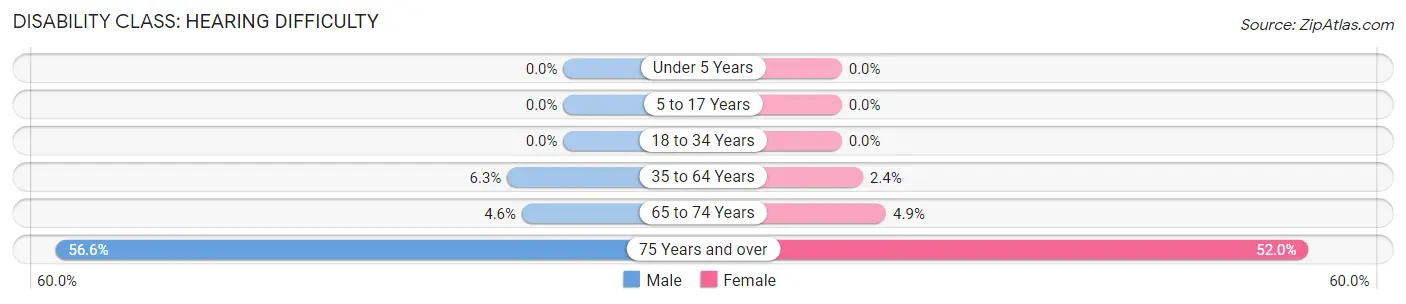
| Age Bracket | Male | Female |
| Under 5 Years | 0 (0.0%) | 0 (0.0%) |
| 5 to 17 Years | 0 (0.0%) | 0 (0.0%) |
| 18 to 34 Years | 0 (0.0%) | 0 (0.0%) |
| 35 to 64 Years | 27 (6.3%) | 8 (2.4%) |
| 65 to 74 Years | 6 (4.6%) | 8 (4.9%) |
| 75 Years and over | 43 (56.6%) | 40 (51.9%) |
Disability Class: Vision Difficulty
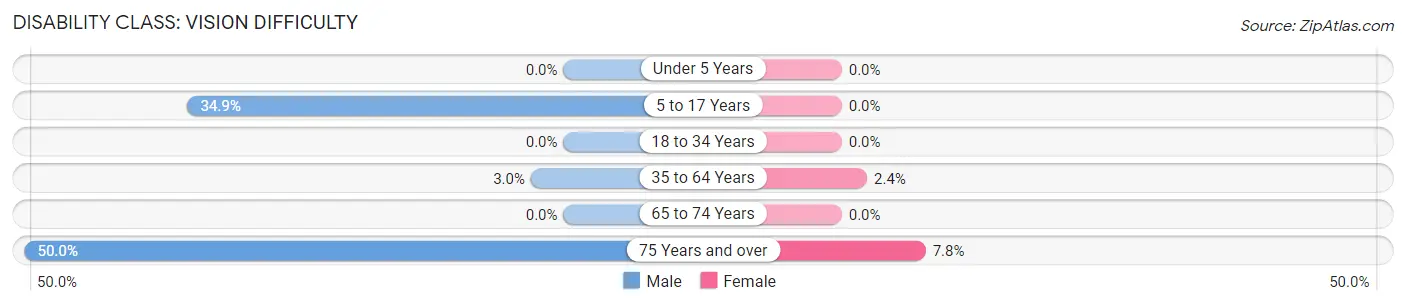
| Age Bracket | Male | Female |
| Under 5 Years | 0 (0.0%) | 0 (0.0%) |
| 5 to 17 Years | 15 (34.9%) | 0 (0.0%) |
| 18 to 34 Years | 0 (0.0%) | 0 (0.0%) |
| 35 to 64 Years | 13 (3.0%) | 8 (2.4%) |
| 65 to 74 Years | 0 (0.0%) | 0 (0.0%) |
| 75 Years and over | 38 (50.0%) | 6 (7.8%) |
Disability Class: Cognitive Difficulty
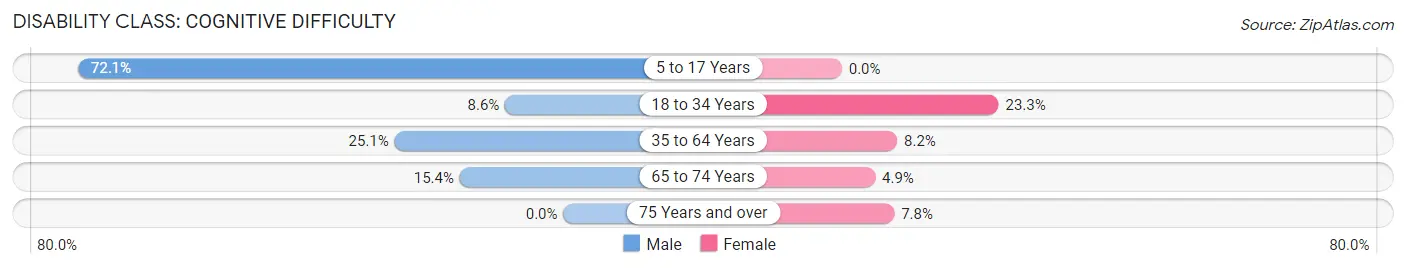
| Age Bracket | Male | Female |
| 5 to 17 Years | 31 (72.1%) | 0 (0.0%) |
| 18 to 34 Years | 14 (8.6%) | 27 (23.3%) |
| 35 to 64 Years | 108 (25.1%) | 28 (8.2%) |
| 65 to 74 Years | 20 (15.4%) | 8 (4.9%) |
| 75 Years and over | 0 (0.0%) | 6 (7.8%) |
Disability Class: Ambulatory Difficulty
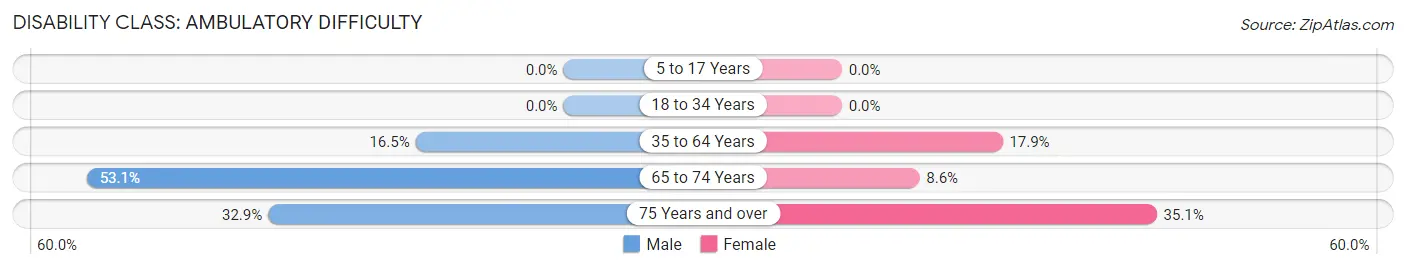
| Age Bracket | Male | Female |
| 5 to 17 Years | 0 (0.0%) | 0 (0.0%) |
| 18 to 34 Years | 0 (0.0%) | 0 (0.0%) |
| 35 to 64 Years | 71 (16.5%) | 61 (17.9%) |
| 65 to 74 Years | 69 (53.1%) | 14 (8.6%) |
| 75 Years and over | 25 (32.9%) | 27 (35.1%) |
Disability Class: Self-Care Difficulty
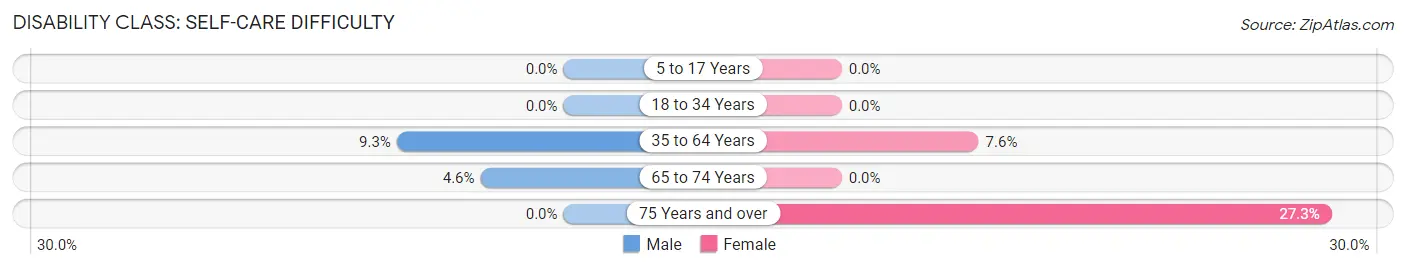
| Age Bracket | Male | Female |
| 5 to 17 Years | 0 (0.0%) | 0 (0.0%) |
| 18 to 34 Years | 0 (0.0%) | 0 (0.0%) |
| 35 to 64 Years | 40 (9.3%) | 26 (7.6%) |
| 65 to 74 Years | 6 (4.6%) | 0 (0.0%) |
| 75 Years and over | 0 (0.0%) | 21 (27.3%) |
Technology Access in Barview
Computing Device Access in Barview
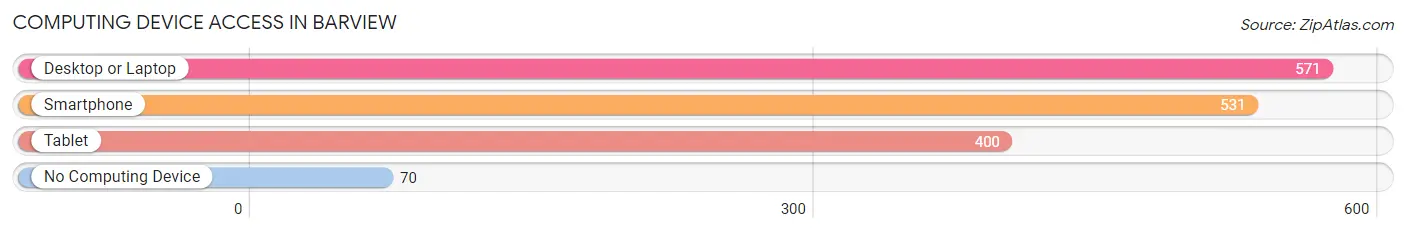
| Device Type | # Households | % Households |
| Desktop or Laptop | 571 | 84.7% |
| Smartphone | 531 | 78.8% |
| Tablet | 400 | 59.4% |
| No Computing Device | 70 | 10.4% |
| Total | 674 | 100.0% |
Internet Access in Barview
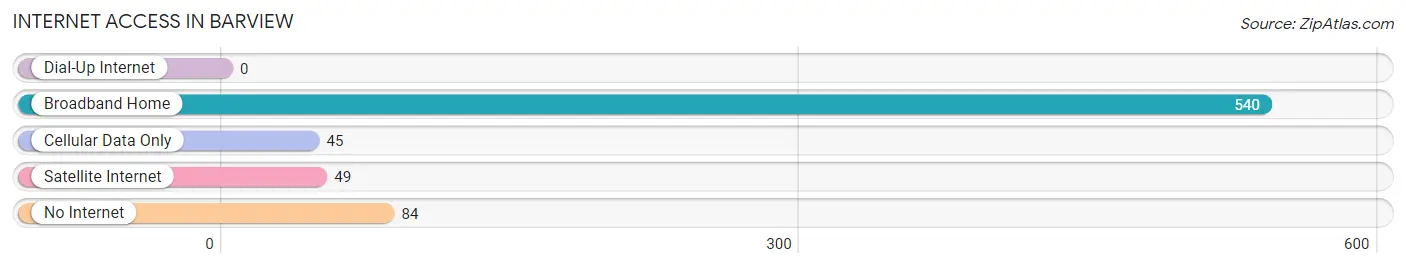
| Internet Type | # Households | % Households |
| Dial-Up Internet | 0 | 0.0% |
| Broadband Home | 540 | 80.1% |
| Cellular Data Only | 45 | 6.7% |
| Satellite Internet | 49 | 7.3% |
| No Internet | 84 | 12.5% |
| Total | 674 | 100.0% |
Barview Summary
Barview is a small unincorporated community located in Tillamook County, Oregon, United States. It is situated on the Oregon Coast, approximately 8 miles south of the city of Tillamook. The community is located on the east side of the Barview Peninsula, which juts out into the Pacific Ocean. The peninsula is bordered by the Tillamook Bay to the east and the Pacific Ocean to the west.
History
Barview was first settled in the late 1800s by a group of fishermen and loggers. The community was named after the nearby Barview Jetty, which was built in the late 1800s to protect the Tillamook Bay from the strong currents of the Pacific Ocean. The jetty was built by the U.S. Army Corps of Engineers and was completed in 1891.
The first post office in Barview was established in 1891. The community was incorporated in 1895 and the first school was built in 1896. The Barview Hotel was built in 1898 and was a popular destination for tourists.
In the early 1900s, the Barview area was a popular destination for tourists and fishermen. The area was known for its excellent fishing and beautiful scenery. The Barview Hotel was a popular destination for tourists and the area was home to several resorts and lodges.
In the 1950s, the Barview area began to decline as the popularity of the area decreased. The Barview Hotel closed in the 1960s and the area became a quiet, rural community.
Geography
Barview is located on the east side of the Barview Peninsula, which juts out into the Pacific Ocean. The peninsula is bordered by the Tillamook Bay to the east and the Pacific Ocean to the west. The community is located approximately 8 miles south of the city of Tillamook.
The Barview area is known for its beautiful scenery and is home to several parks and beaches. The Barview Jetty Park is a popular destination for visitors and is home to a fishing pier, picnic areas, and a beach. The Barview Beach is a popular destination for swimming and sunbathing.
Economy
The economy of Barview is largely based on tourism and fishing. The Barview area is known for its excellent fishing and is home to several fishing charters and guides. The area is also home to several resorts and lodges that cater to tourists.
The Barview area is also home to several small businesses, including restaurants, shops, and galleries. The Barview Jetty Park is a popular destination for visitors and is home to a fishing pier, picnic areas, and a beach.
Demographics
As of the 2010 census, the population of Barview was 1,072. The median age of the population was 44.7 years. The median household income was $41,250 and the median family income was $50,000. The median home value was $179,000.
The population of Barview is predominantly white (94.3%) and the majority of the population is of German (25.2%) and Irish (17.2%) descent. The population is also composed of people of English (14.2%), American (10.2%), and Norwegian (7.2%) descent.
Conclusion
Barview is a small unincorporated community located in Tillamook County, Oregon. It is situated on the Oregon Coast, approximately 8 miles south of the city of Tillamook. The community was first settled in the late 1800s by a group of fishermen and loggers and was named after the nearby Barview Jetty. The economy of Barview is largely based on tourism and fishing and the population is predominantly white. The Barview area is known for its beautiful scenery and is home to several parks and beaches.
Common Questions
What is Per Capita Income in Barview?
Per Capita income in Barview is $40,591.
What is the Median Family Income in Barview?
Median Family Income in Barview is $84,000.
What is the Median Household income in Barview?
Median Household Income in Barview is $70,294.
What is Income or Wage Gap in Barview?
Income or Wage Gap in Barview is 2.0%.
Women in Barview earn 98.0 cents for every dollar earned by a man.
What is Inequality or Gini Index in Barview?
Inequality or Gini Index in Barview is 0.44.
What is the Total Population of Barview?
Total Population of Barview is 1,726.
What is the Total Male Population of Barview?
Total Male Population of Barview is 950.
What is the Total Female Population of Barview?
Total Female Population of Barview is 776.
What is the Ratio of Males per 100 Females in Barview?
There are 122.42 Males per 100 Females in Barview.
What is the Ratio of Females per 100 Males in Barview?
There are 81.68 Females per 100 Males in Barview.
What is the Median Population Age in Barview?
Median Population Age in Barview is 52.7 Years.
What is the Average Family Size in Barview
Average Family Size in Barview is 3.0 People.
What is the Average Household Size in Barview
Average Household Size in Barview is 2.5 People.
How Large is the Labor Force in Barview?
There are 772 People in the Labor Forcein in Barview.
What is the Percentage of People in the Labor Force in Barview?
50.0% of People are in the Labor Force in Barview.
What is the Unemployment Rate in Barview?
Unemployment Rate in Barview is 10.2%.