Sherwood, OR Map & Demographics
Sherwood Map
Sherwood Overview
$47,030
PER CAPITA INCOME
$126,723
AVG FAMILY INCOME
$109,770
AVG HOUSEHOLD INCOME
42.5%
WAGE / INCOME GAP [ % ]
57.5¢/ $1
WAGE / INCOME GAP [ $ ]
$15,722
FAMILY INCOME DEFICIT
0.38
INEQUALITY / GINI INDEX
20,286
TOTAL POPULATION
10,079
MALE POPULATION
10,207
FEMALE POPULATION
98.75
MALES / 100 FEMALES
101.27
FEMALES / 100 MALES
36.4
MEDIAN AGE
3.4
AVG FAMILY SIZE
3.0
AVG HOUSEHOLD SIZE
10,431
LABOR FORCE [ PEOPLE ]
68.5%
PERCENT IN LABOR FORCE
2.9%
UNEMPLOYMENT RATE
Sherwood Zip Codes
Sherwood Area Codes
Income in Sherwood
Income Overview in Sherwood
Per Capita Income in Sherwood is $47,030, while median incomes of families and households are $126,723 and $109,770 respectively.
| Characteristic | Number | Measure |
| Per Capita Income | 20,286 | $47,030 |
| Median Family Income | 5,366 | $126,723 |
| Mean Family Income | 5,366 | $155,003 |
| Median Household Income | 6,829 | $109,770 |
| Mean Household Income | 6,829 | $139,615 |
| Income Deficit | 5,366 | $15,722 |
| Wage / Income Gap (%) | 20,286 | 42.47% |
| Wage / Income Gap ($) | 20,286 | 57.53¢ per $1 |
| Gini / Inequality Index | 20,286 | 0.38 |
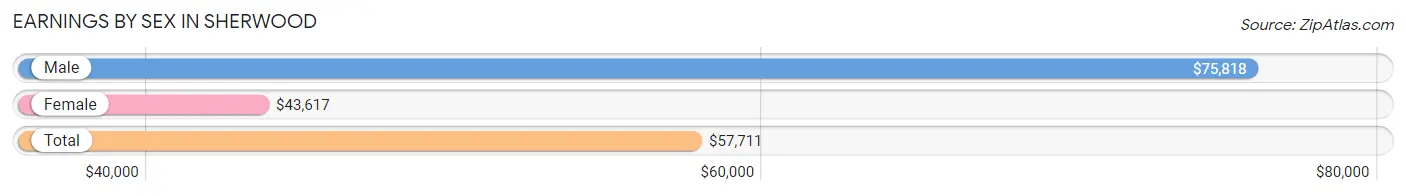
Earnings by Sex in Sherwood
Average Earnings in Sherwood are $57,711, $75,818 for men and $43,617 for women, a difference of 42.5%.
| Sex | Number | Average Earnings |
| Male | 5,735 (53.0%) | $75,818 |
| Female | 5,090 (47.0%) | $43,617 |
| Total | 10,825 (100.0%) | $57,711 |
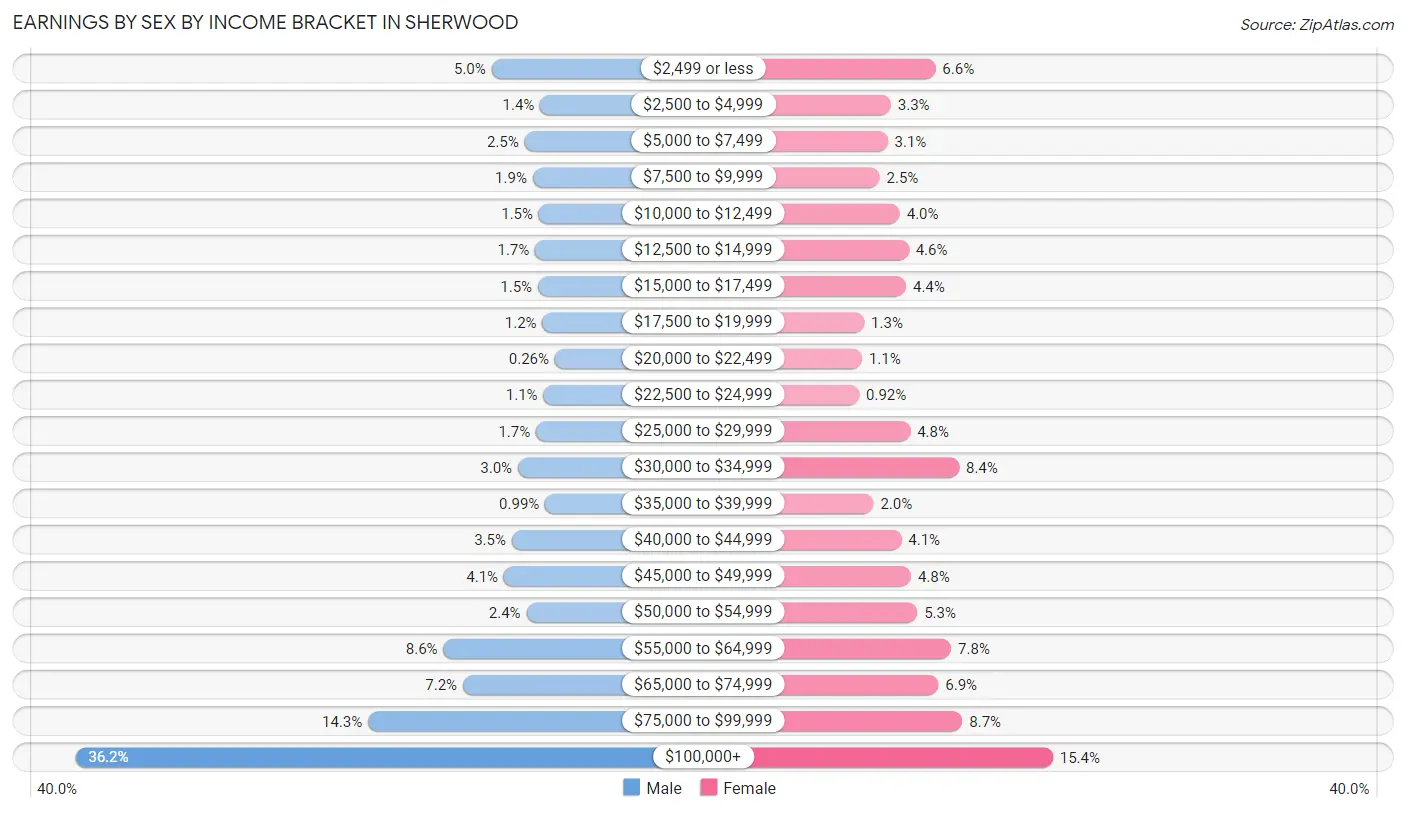
Earnings by Sex by Income Bracket in Sherwood
The most common earnings brackets in Sherwood are $100,000+ for men (2,076 | 36.2%) and $100,000+ for women (786 | 15.4%).
| Income | Male | Female |
| $2,499 or less | 287 (5.0%) | 338 (6.6%) |
| $2,500 to $4,999 | 78 (1.4%) | 168 (3.3%) |
| $5,000 to $7,499 | 145 (2.5%) | 156 (3.1%) |
| $7,500 to $9,999 | 110 (1.9%) | 125 (2.5%) |
| $10,000 to $12,499 | 84 (1.5%) | 202 (4.0%) |
| $12,500 to $14,999 | 100 (1.7%) | 236 (4.6%) |
| $15,000 to $17,499 | 88 (1.5%) | 226 (4.4%) |
| $17,500 to $19,999 | 68 (1.2%) | 66 (1.3%) |
| $20,000 to $22,499 | 15 (0.3%) | 58 (1.1%) |
| $22,500 to $24,999 | 64 (1.1%) | 47 (0.9%) |
| $25,000 to $29,999 | 96 (1.7%) | 242 (4.8%) |
| $30,000 to $34,999 | 174 (3.0%) | 428 (8.4%) |
| $35,000 to $39,999 | 57 (1.0%) | 102 (2.0%) |
| $40,000 to $44,999 | 200 (3.5%) | 208 (4.1%) |
| $45,000 to $49,999 | 234 (4.1%) | 245 (4.8%) |
| $50,000 to $54,999 | 137 (2.4%) | 269 (5.3%) |
| $55,000 to $64,999 | 494 (8.6%) | 398 (7.8%) |
| $65,000 to $74,999 | 410 (7.1%) | 349 (6.9%) |
| $75,000 to $99,999 | 818 (14.3%) | 441 (8.7%) |
| $100,000+ | 2,076 (36.2%) | 786 (15.4%) |
| Total | 5,735 (100.0%) | 5,090 (100.0%) |
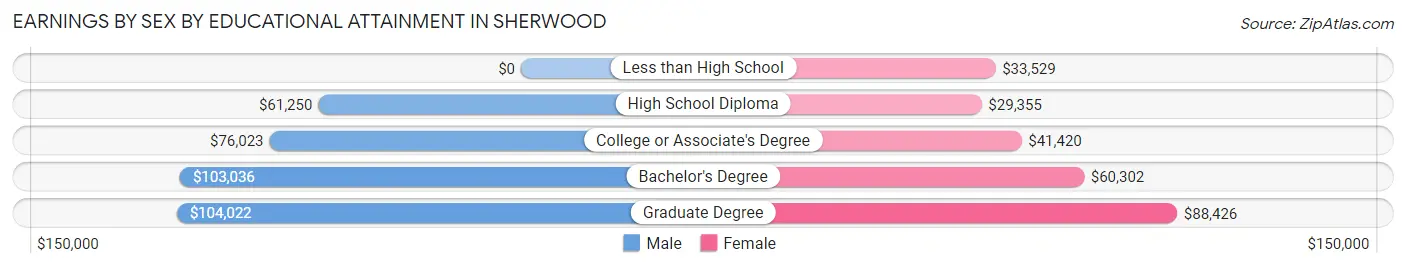
Earnings by Sex by Educational Attainment in Sherwood
Average earnings in Sherwood are $89,022 for men and $50,565 for women, a difference of 43.2%. Men with an educational attainment of graduate degree enjoy the highest average annual earnings of $104,022, while those with high school diploma education earn the least with $61,250. Women with an educational attainment of graduate degree earn the most with the average annual earnings of $88,426, while those with high school diploma education have the smallest earnings of $29,355.
| Educational Attainment | Male Income | Female Income |
| Less than High School | - | - |
| High School Diploma | $61,250 | $29,355 |
| College or Associate's Degree | $76,023 | $41,420 |
| Bachelor's Degree | $103,036 | $60,302 |
| Graduate Degree | $104,022 | $88,426 |
| Total | $89,022 | $50,565 |
Family Income in Sherwood
Family Income Brackets in Sherwood
According to the Sherwood family income data, there are 1,422 families falling into the $200,000+ income range, which is the most common income bracket and makes up 26.5% of all families. Conversely, the $15,000 to $24,999 income bracket is the least frequent group with only 32 families (0.6%) belonging to this category.
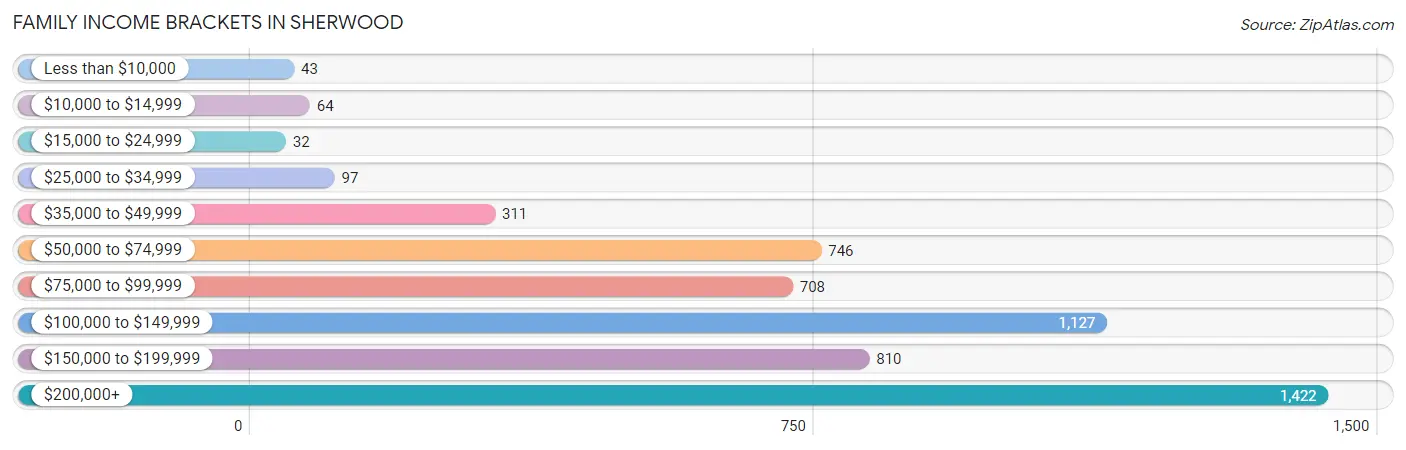
| Income Bracket | # Families | % Families |
| Less than $10,000 | 43 | 0.8% |
| $10,000 to $14,999 | 64 | 1.2% |
| $15,000 to $24,999 | 32 | 0.6% |
| $25,000 to $34,999 | 97 | 1.8% |
| $35,000 to $49,999 | 311 | 5.8% |
| $50,000 to $74,999 | 746 | 13.9% |
| $75,000 to $99,999 | 708 | 13.2% |
| $100,000 to $149,999 | 1,127 | 21.0% |
| $150,000 to $199,999 | 810 | 15.1% |
| $200,000+ | 1,422 | 26.5% |
Family Income by Famaliy Size in Sherwood
6-person families (156 | 2.9%) account for the highest median family income in Sherwood with $217,500 per family, while 2-person families (1,855 | 34.6%) have the highest median income of $47,274 per family member.
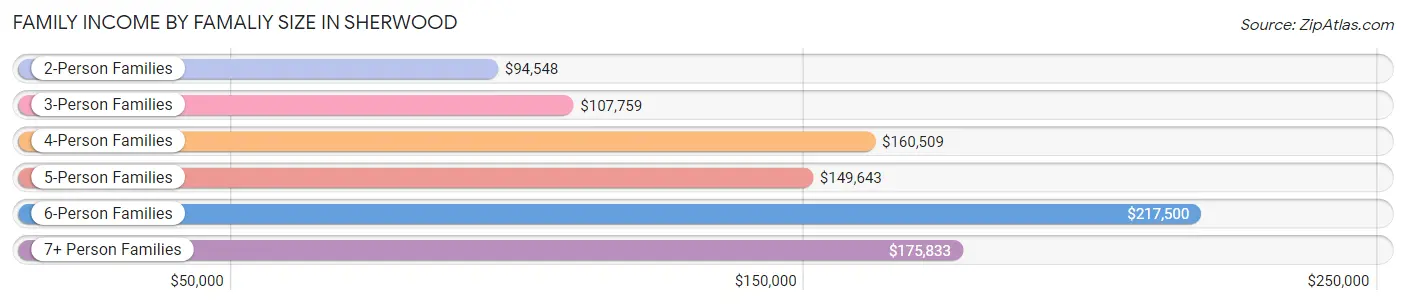
| Income Bracket | # Families | Median Income |
| 2-Person Families | 1,855 (34.6%) | $94,548 |
| 3-Person Families | 1,094 (20.4%) | $107,759 |
| 4-Person Families | 1,465 (27.3%) | $160,509 |
| 5-Person Families | 694 (12.9%) | $149,643 |
| 6-Person Families | 156 (2.9%) | $217,500 |
| 7+ Person Families | 102 (1.9%) | $175,833 |
| Total | 5,366 (100.0%) | $126,723 |
Family Income by Number of Earners in Sherwood
The median family income in Sherwood is $126,723, with families comprising 3+ earners (802) having the highest median family income of $194,200, while families with no earners (526) have the lowest median family income of $70,389, accounting for 14.9% and 9.8% of families, respectively.
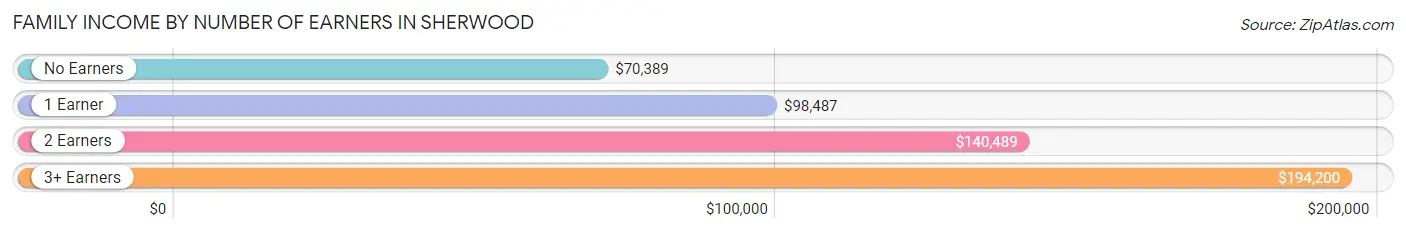
| Number of Earners | # Families | Median Income |
| No Earners | 526 (9.8%) | $70,389 |
| 1 Earner | 1,605 (29.9%) | $98,487 |
| 2 Earners | 2,433 (45.3%) | $140,489 |
| 3+ Earners | 802 (14.9%) | $194,200 |
| Total | 5,366 (100.0%) | $126,723 |
Household Income in Sherwood
Household Income Brackets in Sherwood
With 1,516 households falling in the category, the $100,000 to $149,999 income range is the most frequent in Sherwood, accounting for 22.2% of all households. In contrast, only 89 households (1.3%) fall into the $10,000 to $14,999 income bracket, making it the least populous group.
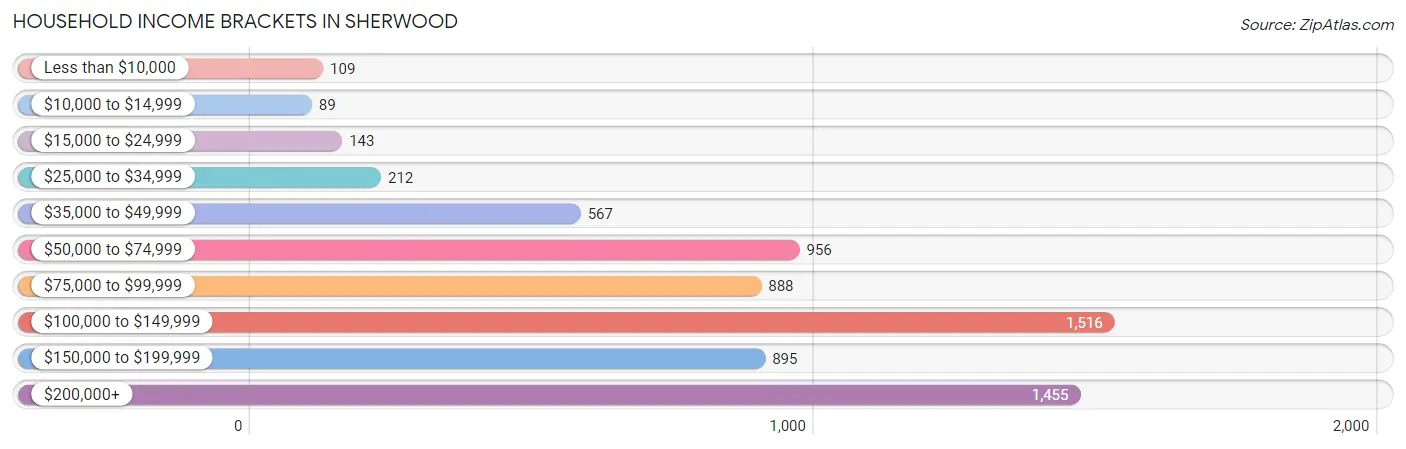
| Income Bracket | # Households | % Households |
| Less than $10,000 | 109 | 1.6% |
| $10,000 to $14,999 | 89 | 1.3% |
| $15,000 to $24,999 | 143 | 2.1% |
| $25,000 to $34,999 | 212 | 3.1% |
| $35,000 to $49,999 | 567 | 8.3% |
| $50,000 to $74,999 | 956 | 14.0% |
| $75,000 to $99,999 | 888 | 13.0% |
| $100,000 to $149,999 | 1,516 | 22.2% |
| $150,000 to $199,999 | 895 | 13.1% |
| $200,000+ | 1,455 | 21.3% |
Household Income by Householder Age in Sherwood
The median household income in Sherwood is $109,770, with the highest median household income of $138,202 found in the 45 to 64 years age bracket for the primary householder. A total of 3,087 households (45.2%) fall into this category. Meanwhile, the 15 to 24 years age bracket for the primary householder has the lowest median household income of $60,750, with 50 households (0.7%) in this group.
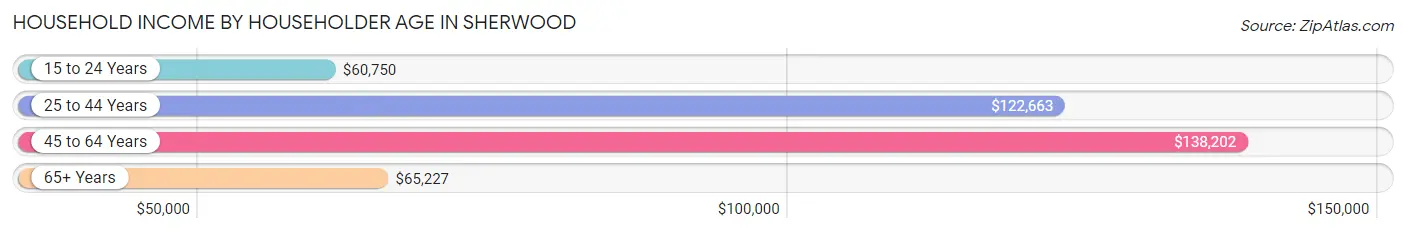
| Income Bracket | # Households | Median Income |
| 15 to 24 Years | 50 (0.7%) | $60,750 |
| 25 to 44 Years | 2,474 (36.2%) | $122,663 |
| 45 to 64 Years | 3,087 (45.2%) | $138,202 |
| 65+ Years | 1,218 (17.8%) | $65,227 |
| Total | 6,829 (100.0%) | $109,770 |
Poverty in Sherwood
Income Below Poverty by Sex and Age in Sherwood
With 4.4% poverty level for males and 4.3% for females among the residents of Sherwood, under 5 year old males and 65 to 74 year old females are the most vulnerable to poverty, with 59 males (11.9%) and 69 females (13.3%) in their respective age groups living below the poverty level.
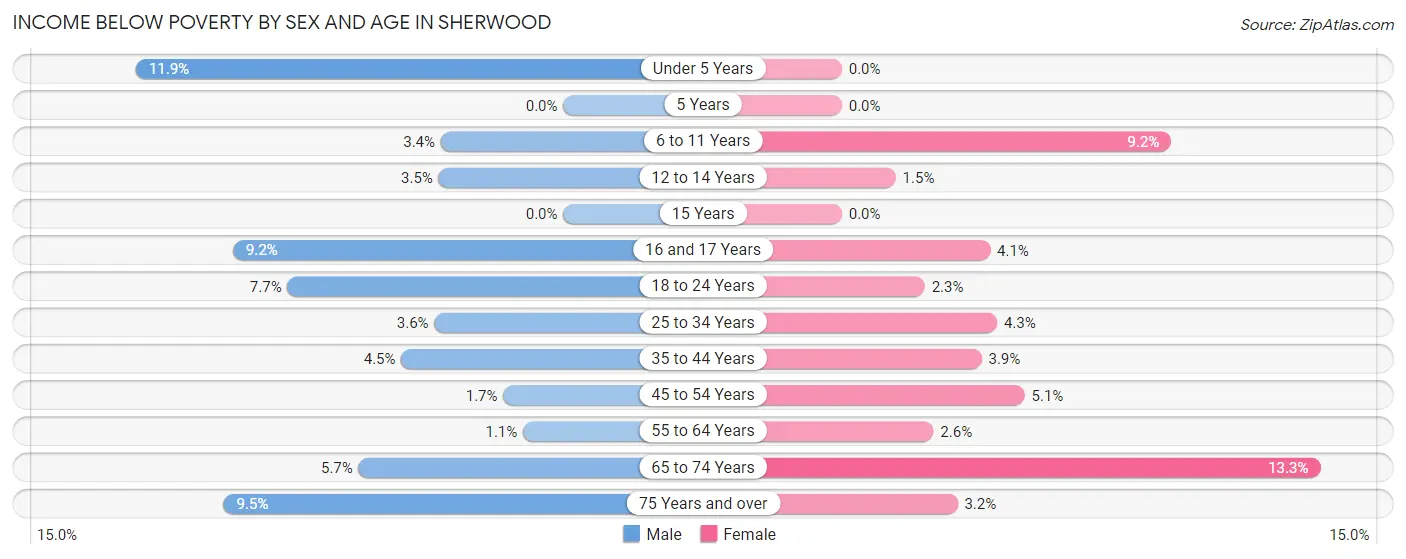
| Age Bracket | Male | Female |
| Under 5 Years | 59 (11.9%) | 0 (0.0%) |
| 5 Years | 0 (0.0%) | 0 (0.0%) |
| 6 to 11 Years | 41 (3.4%) | 71 (9.2%) |
| 12 to 14 Years | 20 (3.5%) | 11 (1.5%) |
| 15 Years | 0 (0.0%) | 0 (0.0%) |
| 16 and 17 Years | 23 (9.2%) | 23 (4.1%) |
| 18 to 24 Years | 80 (7.7%) | 14 (2.3%) |
| 25 to 34 Years | 34 (3.6%) | 49 (4.3%) |
| 35 to 44 Years | 69 (4.5%) | 65 (3.9%) |
| 45 to 54 Years | 30 (1.7%) | 90 (5.1%) |
| 55 to 64 Years | 9 (1.1%) | 27 (2.5%) |
| 65 to 74 Years | 37 (5.7%) | 69 (13.3%) |
| 75 Years and over | 40 (9.5%) | 15 (3.2%) |
| Total | 442 (4.4%) | 434 (4.3%) |
Income Above Poverty by Sex and Age in Sherwood
According to the poverty statistics in Sherwood, males aged 5 years and females aged under 5 years are the age groups that are most secure financially, with 100.0% of males and 100.0% of females in these age groups living above the poverty line.
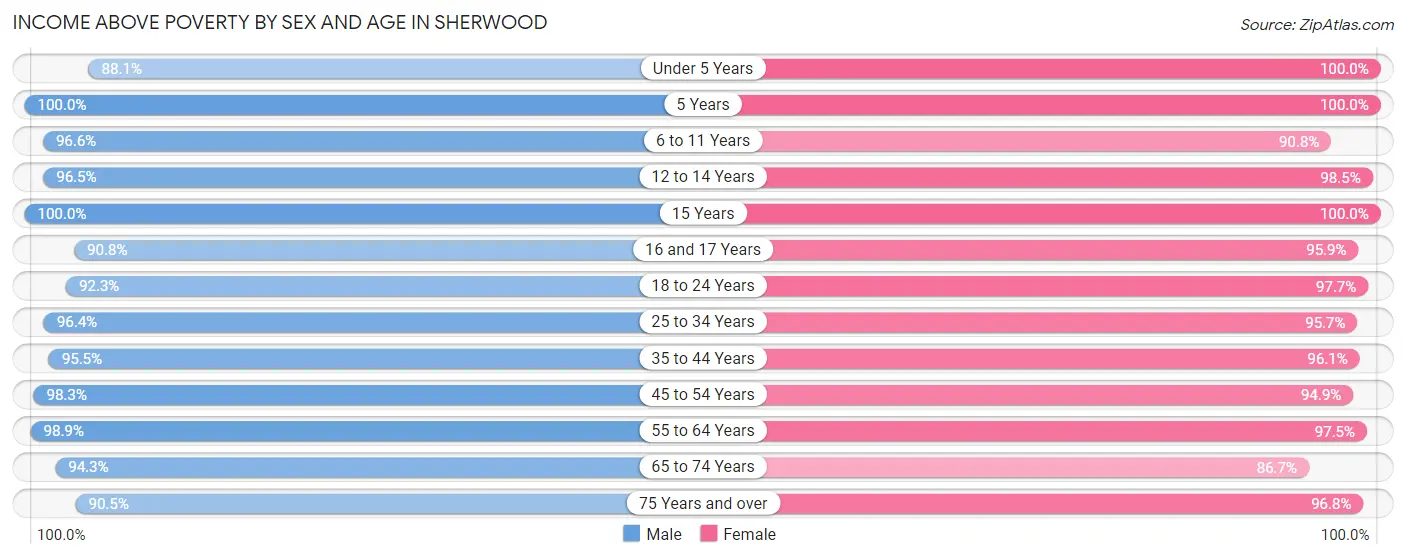
| Age Bracket | Male | Female |
| Under 5 Years | 437 (88.1%) | 427 (100.0%) |
| 5 Years | 110 (100.0%) | 302 (100.0%) |
| 6 to 11 Years | 1,161 (96.6%) | 703 (90.8%) |
| 12 to 14 Years | 557 (96.5%) | 721 (98.5%) |
| 15 Years | 242 (100.0%) | 193 (100.0%) |
| 16 and 17 Years | 227 (90.8%) | 534 (95.9%) |
| 18 to 24 Years | 962 (92.3%) | 592 (97.7%) |
| 25 to 34 Years | 912 (96.4%) | 1,085 (95.7%) |
| 35 to 44 Years | 1,462 (95.5%) | 1,605 (96.1%) |
| 45 to 54 Years | 1,767 (98.3%) | 1,678 (94.9%) |
| 55 to 64 Years | 797 (98.9%) | 1,030 (97.5%) |
| 65 to 74 Years | 612 (94.3%) | 449 (86.7%) |
| 75 Years and over | 383 (90.5%) | 451 (96.8%) |
| Total | 9,629 (95.6%) | 9,770 (95.8%) |
Income Below Poverty Among Married-Couple Families in Sherwood
The poverty statistics for married-couple families in Sherwood show that 1.7% or 75 of the total 4,437 families live below the poverty line. Families with 1 or 2 children have the highest poverty rate of 2.6%, comprising of 47 families. On the other hand, families with 5 or more children have the lowest poverty rate of 0.0%, which includes 0 families.
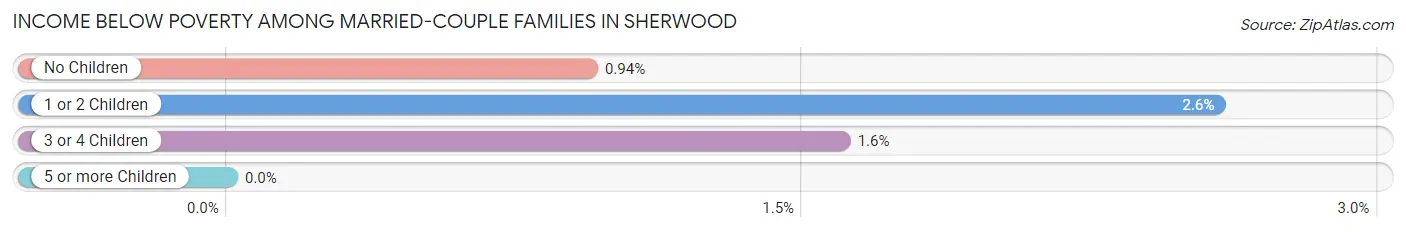
| Children | Above Poverty | Below Poverty |
| No Children | 1,995 (99.1%) | 19 (0.9%) |
| 1 or 2 Children | 1,773 (97.4%) | 47 (2.6%) |
| 3 or 4 Children | 554 (98.4%) | 9 (1.6%) |
| 5 or more Children | 40 (100.0%) | 0 (0.0%) |
| Total | 4,362 (98.3%) | 75 (1.7%) |
Income Below Poverty Among Single-Parent Households in Sherwood
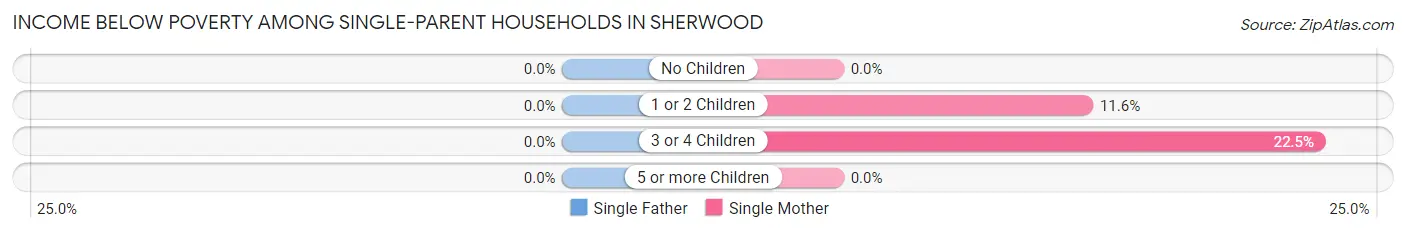
| Children | Single Father | Single Mother |
| No Children | 0 (0.0%) | 0 (0.0%) |
| 1 or 2 Children | 0 (0.0%) | 57 (11.6%) |
| 3 or 4 Children | 0 (0.0%) | 11 (22.5%) |
| 5 or more Children | 0 (0.0%) | 0 (0.0%) |
| Total | 0 (0.0%) | 68 (9.0%) |
Income Below Poverty Among Married-Couple vs Single-Parent Households in Sherwood
The poverty data for Sherwood shows that 75 of the married-couple family households (1.7%) and 68 of the single-parent households (7.3%) are living below the poverty level. Within the married-couple family households, those with 1 or 2 children have the highest poverty rate, with 47 households (2.6%) falling below the poverty line. Among the single-parent households, those with 3 or 4 children have the highest poverty rate, with 11 household (22.5%) living below poverty.
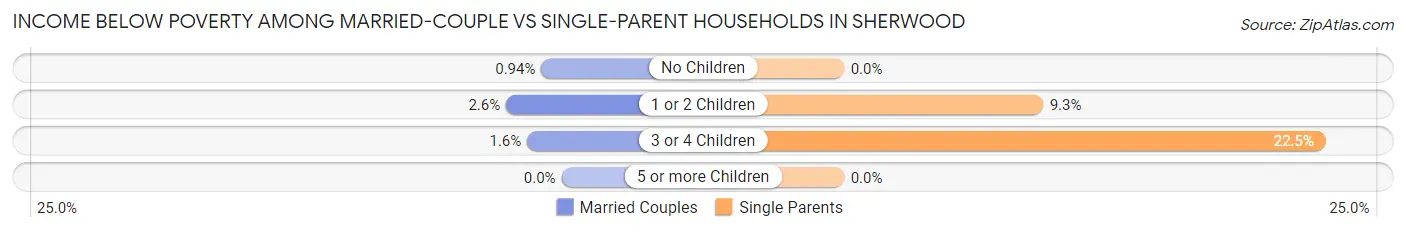
| Children | Married-Couple Families | Single-Parent Households |
| No Children | 19 (0.9%) | 0 (0.0%) |
| 1 or 2 Children | 47 (2.6%) | 57 (9.3%) |
| 3 or 4 Children | 9 (1.6%) | 11 (22.5%) |
| 5 or more Children | 0 (0.0%) | 0 (0.0%) |
| Total | 75 (1.7%) | 68 (7.3%) |
Race in Sherwood
The most populous races in Sherwood are White / Caucasian (16,647 | 82.1%), Two or more Races (2,261 | 11.2%), and Hispanic or Latino (1,464 | 7.2%).
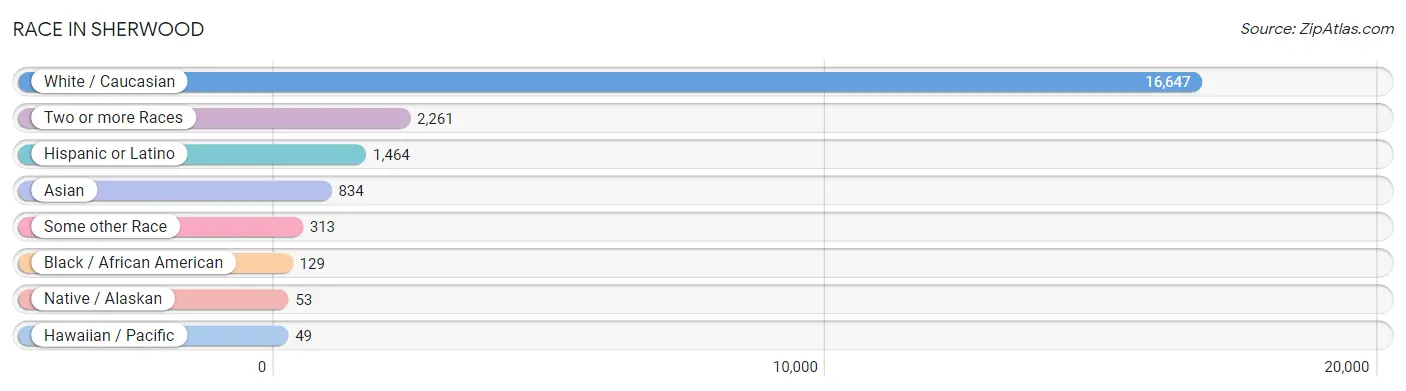
| Race | # Population | % Population |
| Asian | 834 | 4.1% |
| Black / African American | 129 | 0.6% |
| Hawaiian / Pacific | 49 | 0.2% |
| Hispanic or Latino | 1,464 | 7.2% |
| Native / Alaskan | 53 | 0.3% |
| White / Caucasian | 16,647 | 82.1% |
| Two or more Races | 2,261 | 11.2% |
| Some other Race | 313 | 1.5% |
| Total | 20,286 | 100.0% |
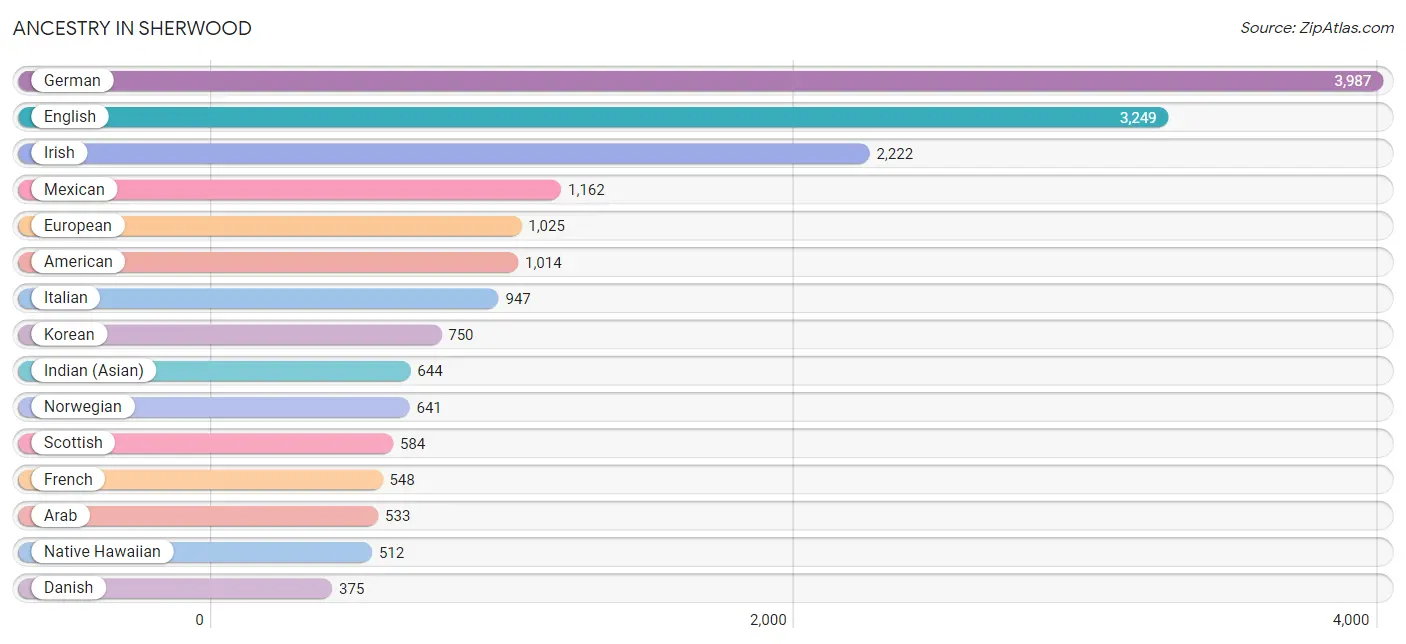
Ancestry in Sherwood
The most populous ancestries reported in Sherwood are German (3,987 | 19.7%), English (3,249 | 16.0%), Irish (2,222 | 11.0%), Mexican (1,162 | 5.7%), and European (1,025 | 5.1%), together accounting for 57.4% of all Sherwood residents.
| Ancestry | # Population | % Population |
| American | 1,014 | 5.0% |
| Arab | 533 | 2.6% |
| Argentinean | 11 | 0.1% |
| Armenian | 75 | 0.4% |
| Austrian | 14 | 0.1% |
| Belgian | 11 | 0.1% |
| Bhutanese | 284 | 1.4% |
| Blackfeet | 65 | 0.3% |
| British | 227 | 1.1% |
| Burmese | 220 | 1.1% |
| Canadian | 90 | 0.4% |
| Celtic | 53 | 0.3% |
| Central American | 76 | 0.4% |
| Cherokee | 23 | 0.1% |
| Costa Rican | 20 | 0.1% |
| Creek | 7 | 0.0% |
| Cuban | 53 | 0.3% |
| Czech | 70 | 0.4% |
| Czechoslovakian | 13 | 0.1% |
| Danish | 375 | 1.8% |
| Dutch | 230 | 1.1% |
| Eastern European | 50 | 0.3% |
| English | 3,249 | 16.0% |
| European | 1,025 | 5.1% |
| Finnish | 105 | 0.5% |
| French | 548 | 2.7% |
| French Canadian | 90 | 0.4% |
| German | 3,987 | 19.7% |
| Greek | 51 | 0.3% |
| Guamanian / Chamorro | 10 | 0.1% |
| Guatemalan | 16 | 0.1% |
| Hungarian | 114 | 0.6% |
| Indian (Asian) | 644 | 3.2% |
| Iranian | 212 | 1.1% |
| Iraqi | 94 | 0.5% |
| Irish | 2,222 | 11.0% |
| Italian | 947 | 4.7% |
| Korean | 750 | 3.7% |
| Laotian | 15 | 0.1% |
| Lebanese | 147 | 0.7% |
| Mexican | 1,162 | 5.7% |
| Native Hawaiian | 512 | 2.5% |
| New Zealander | 12 | 0.1% |
| Nigerian | 22 | 0.1% |
| Northern European | 173 | 0.9% |
| Norwegian | 641 | 3.2% |
| Pakistani | 11 | 0.1% |
| Pennsylvania German | 9 | 0.0% |
| Polish | 220 | 1.1% |
| Portuguese | 170 | 0.8% |
| Puerto Rican | 40 | 0.2% |
| Romanian | 70 | 0.4% |
| Russian | 102 | 0.5% |
| Salvadoran | 40 | 0.2% |
| Samoan | 337 | 1.7% |
| Scandinavian | 258 | 1.3% |
| Scotch-Irish | 233 | 1.1% |
| Scottish | 584 | 2.9% |
| Serbian | 19 | 0.1% |
| Sioux | 6 | 0.0% |
| South American | 11 | 0.1% |
| Spanish | 10 | 0.1% |
| Sri Lankan | 208 | 1.0% |
| Subsaharan African | 22 | 0.1% |
| Swedish | 332 | 1.6% |
| Swiss | 75 | 0.4% |
| Thai | 133 | 0.7% |
| Tlingit-Haida | 15 | 0.1% |
| Ukrainian | 37 | 0.2% |
| Welsh | 199 | 1.0% | View All 70 Rows |
Immigrants in Sherwood
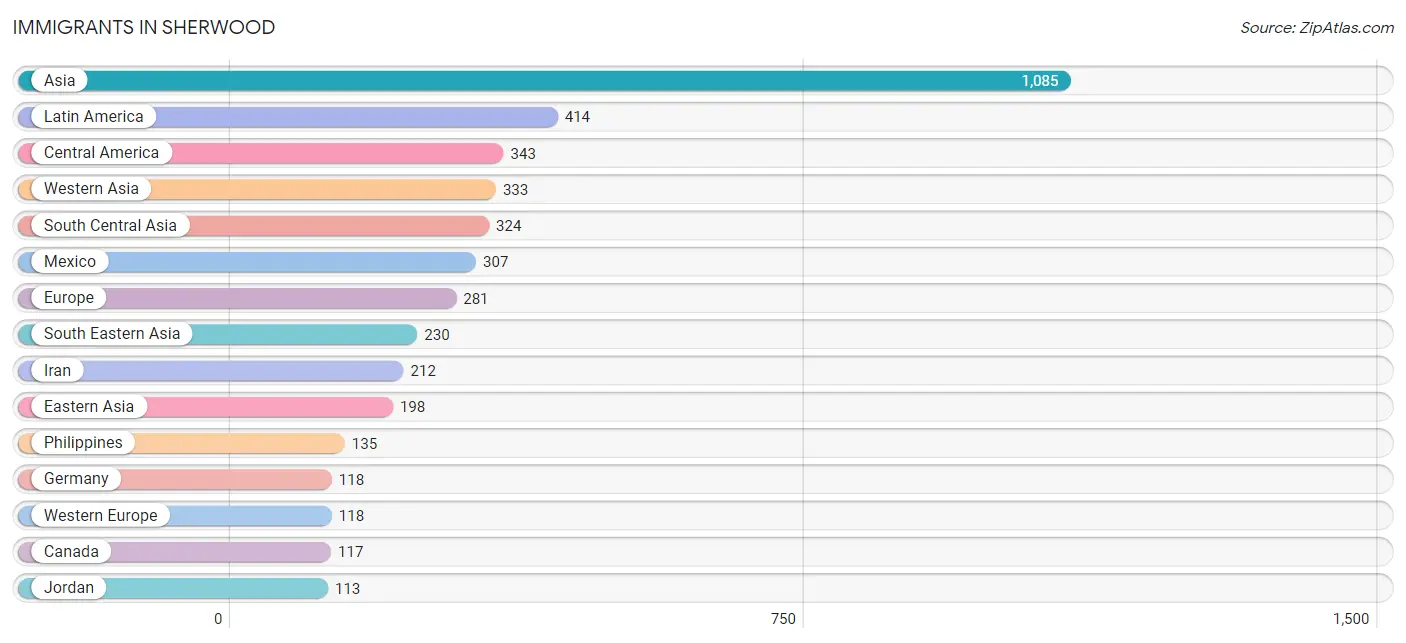
The most numerous immigrant groups reported in Sherwood came from Asia (1,085 | 5.3%), Latin America (414 | 2.0%), Central America (343 | 1.7%), Western Asia (333 | 1.6%), and South Central Asia (324 | 1.6%), together accounting for 12.3% of all Sherwood residents.
| Immigration Origin | # Population | % Population |
| Asia | 1,085 | 5.3% |
| Brazil | 57 | 0.3% |
| Bulgaria | 9 | 0.0% |
| Canada | 117 | 0.6% |
| Caribbean | 14 | 0.1% |
| Central America | 343 | 1.7% |
| China | 81 | 0.4% |
| Costa Rica | 20 | 0.1% |
| Cuba | 14 | 0.1% |
| Eastern Asia | 198 | 1.0% |
| Eastern Europe | 106 | 0.5% |
| England | 16 | 0.1% |
| Europe | 281 | 1.4% |
| Fiji | 33 | 0.2% |
| Germany | 118 | 0.6% |
| Guatemala | 16 | 0.1% |
| Hong Kong | 14 | 0.1% |
| Hungary | 19 | 0.1% |
| India | 101 | 0.5% |
| Iran | 212 | 1.1% |
| Iraq | 99 | 0.5% |
| Japan | 55 | 0.3% |
| Jordan | 113 | 0.6% |
| Kazakhstan | 11 | 0.1% |
| Korea | 62 | 0.3% |
| Kuwait | 9 | 0.0% |
| Latin America | 414 | 2.0% |
| Lebanon | 24 | 0.1% |
| Malaysia | 13 | 0.1% |
| Mexico | 307 | 1.5% |
| Northern Europe | 57 | 0.3% |
| Oceania | 33 | 0.2% |
| Philippines | 135 | 0.7% |
| Romania | 39 | 0.2% |
| Russia | 13 | 0.1% |
| South America | 57 | 0.3% |
| South Central Asia | 324 | 1.6% |
| South Eastern Asia | 230 | 1.1% |
| Sweden | 11 | 0.1% |
| Syria | 76 | 0.4% |
| Thailand | 11 | 0.1% |
| Ukraine | 26 | 0.1% |
| Vietnam | 71 | 0.4% |
| Western Asia | 333 | 1.6% |
| Western Europe | 118 | 0.6% | View All 45 Rows |
Sex and Age in Sherwood
Sex and Age in Sherwood
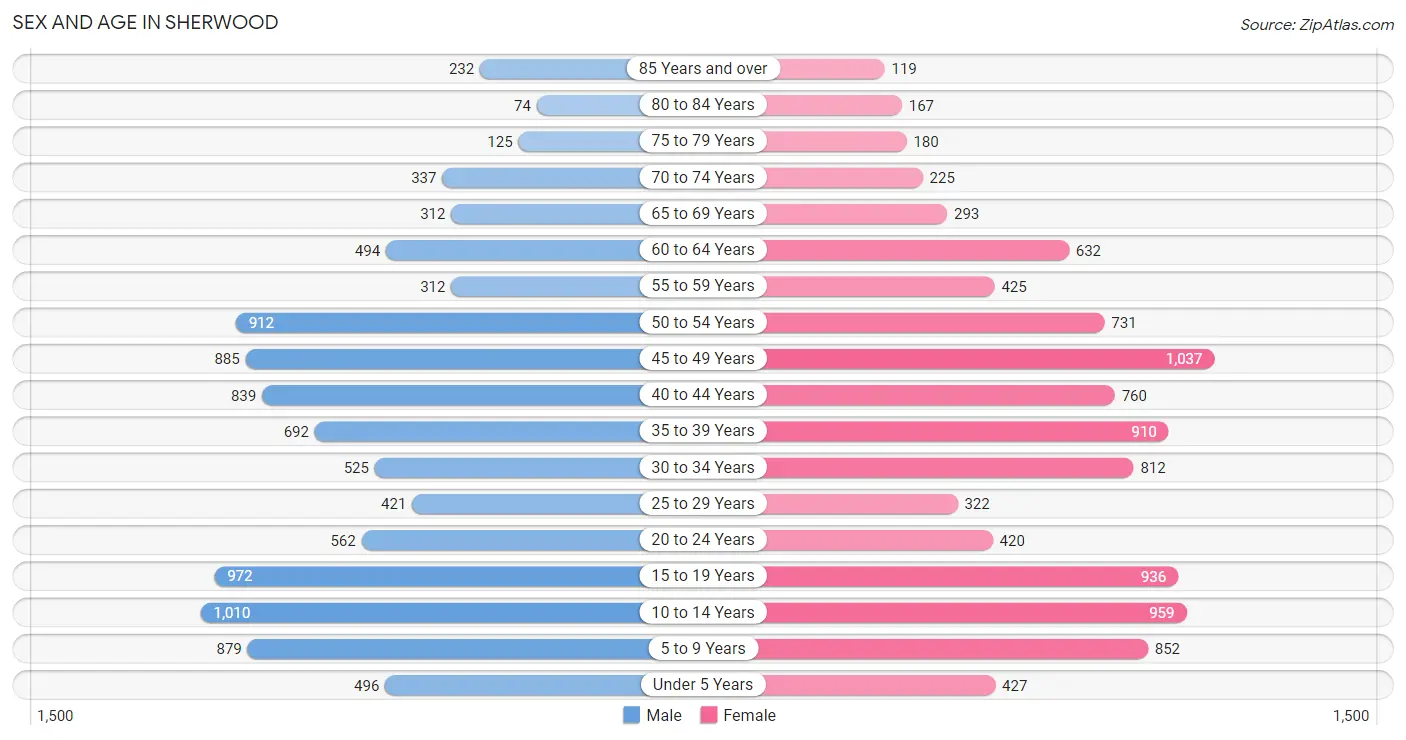
The most populous age groups in Sherwood are 10 to 14 Years (1,010 | 10.0%) for men and 45 to 49 Years (1,037 | 10.2%) for women.
| Age Bracket | Male | Female |
| Under 5 Years | 496 (4.9%) | 427 (4.2%) |
| 5 to 9 Years | 879 (8.7%) | 852 (8.4%) |
| 10 to 14 Years | 1,010 (10.0%) | 959 (9.4%) |
| 15 to 19 Years | 972 (9.6%) | 936 (9.2%) |
| 20 to 24 Years | 562 (5.6%) | 420 (4.1%) |
| 25 to 29 Years | 421 (4.2%) | 322 (3.2%) |
| 30 to 34 Years | 525 (5.2%) | 812 (8.0%) |
| 35 to 39 Years | 692 (6.9%) | 910 (8.9%) |
| 40 to 44 Years | 839 (8.3%) | 760 (7.4%) |
| 45 to 49 Years | 885 (8.8%) | 1,037 (10.2%) |
| 50 to 54 Years | 912 (9.0%) | 731 (7.2%) |
| 55 to 59 Years | 312 (3.1%) | 425 (4.2%) |
| 60 to 64 Years | 494 (4.9%) | 632 (6.2%) |
| 65 to 69 Years | 312 (3.1%) | 293 (2.9%) |
| 70 to 74 Years | 337 (3.3%) | 225 (2.2%) |
| 75 to 79 Years | 125 (1.2%) | 180 (1.8%) |
| 80 to 84 Years | 74 (0.7%) | 167 (1.6%) |
| 85 Years and over | 232 (2.3%) | 119 (1.2%) |
| Total | 10,079 (100.0%) | 10,207 (100.0%) |
Families and Households in Sherwood
Median Family Size in Sherwood
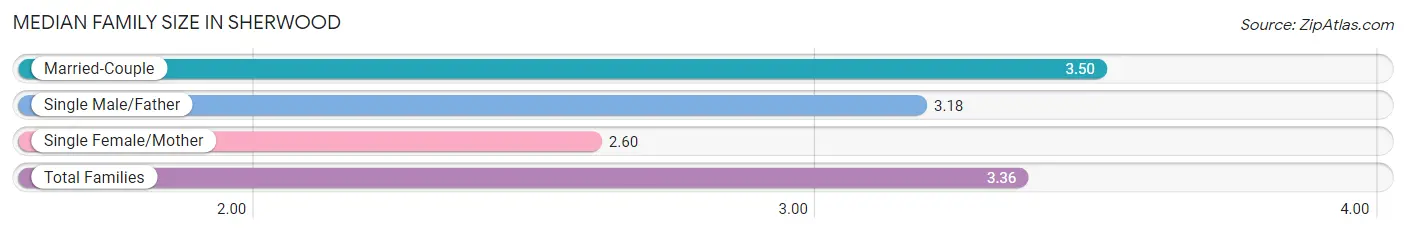
The median family size in Sherwood is 3.36 persons per family, with married-couple families (4,437 | 82.7%) accounting for the largest median family size of 3.5 persons per family. On the other hand, single female/mother families (759 | 14.1%) represent the smallest median family size with 2.60 persons per family.
| Family Type | # Families | Family Size |
| Married-Couple | 4,437 (82.7%) | 3.50 |
| Single Male/Father | 170 (3.2%) | 3.18 |
| Single Female/Mother | 759 (14.1%) | 2.60 |
| Total Families | 5,366 (100.0%) | 3.36 |
Median Household Size in Sherwood
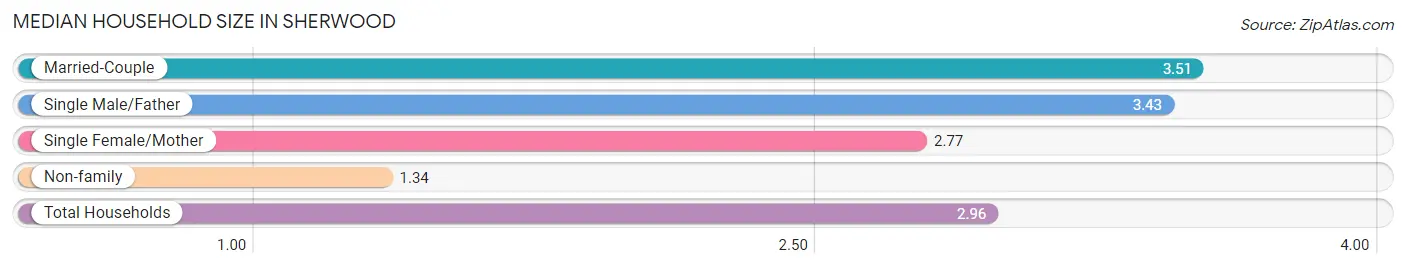
The median household size in Sherwood is 2.96 persons per household, with married-couple households (4,437 | 65.0%) accounting for the largest median household size of 3.51 persons per household. non-family households (1,463 | 21.4%) represent the smallest median household size with 1.34 persons per household.
| Household Type | # Households | Household Size |
| Married-Couple | 4,437 (65.0%) | 3.51 |
| Single Male/Father | 170 (2.5%) | 3.43 |
| Single Female/Mother | 759 (11.1%) | 2.77 |
| Non-family | 1,463 (21.4%) | 1.34 |
| Total Households | 6,829 (100.0%) | 2.96 |
Household Size by Marriage Status in Sherwood
Out of a total of 6,829 households in Sherwood, 5,366 (78.6%) are family households, while 1,463 (21.4%) are nonfamily households. The most numerous type of family households are 2-person households, comprising 1,732, and the most common type of nonfamily households are 1-person households, comprising 1,099.
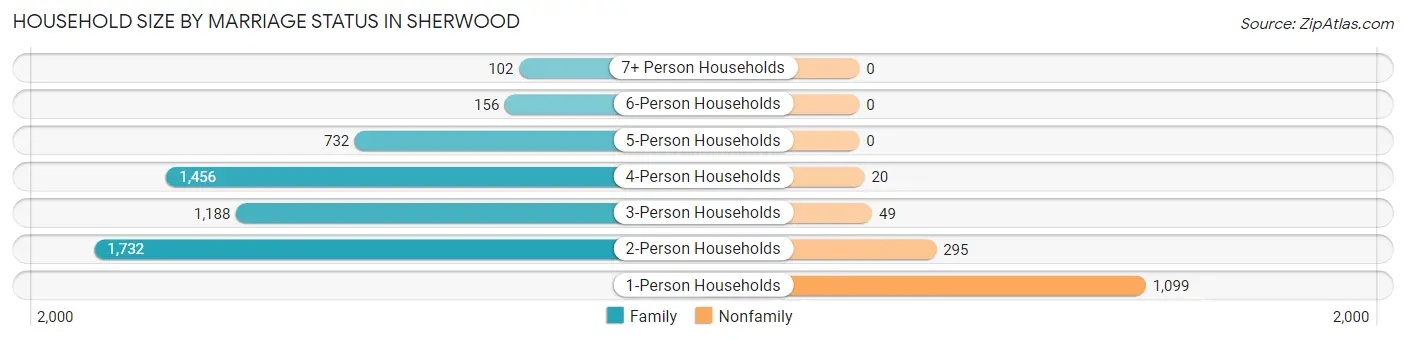
| Household Size | Family Households | Nonfamily Households |
| 1-Person Households | - | 1,099 (16.1%) |
| 2-Person Households | 1,732 (25.4%) | 295 (4.3%) |
| 3-Person Households | 1,188 (17.4%) | 49 (0.7%) |
| 4-Person Households | 1,456 (21.3%) | 20 (0.3%) |
| 5-Person Households | 732 (10.7%) | 0 (0.0%) |
| 6-Person Households | 156 (2.3%) | 0 (0.0%) |
| 7+ Person Households | 102 (1.5%) | 0 (0.0%) |
| Total | 5,366 (78.6%) | 1,463 (21.4%) |
Female Fertility in Sherwood
Fertility by Age in Sherwood
Average fertility rate in Sherwood is 23.0 births per 1,000 women. Women in the age bracket of 35 to 50 years have the highest fertility rate with 36.0 births per 1,000 women. Women in the age bracket of 35 to 50 years acount for 82.8% of all women with births.
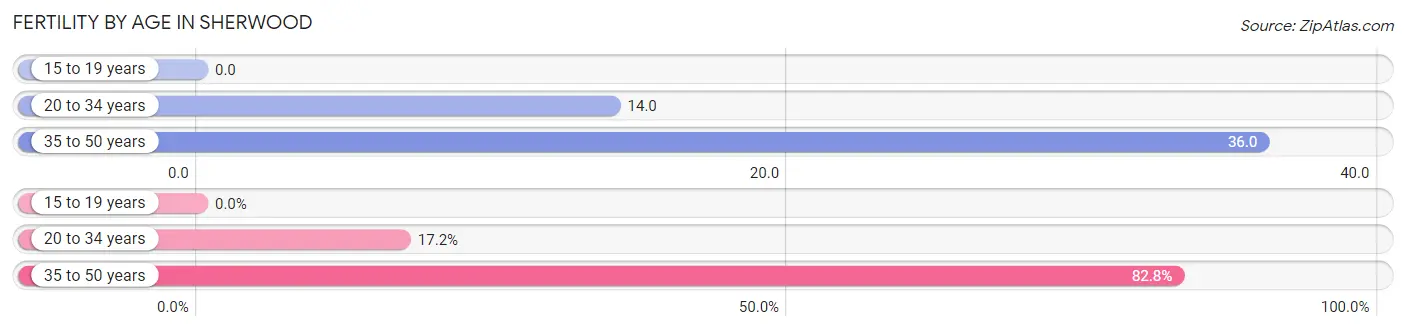
| Age Bracket | Women with Births | Births / 1,000 Women |
| 15 to 19 years | 0 (0.0%) | 0.0 |
| 20 to 34 years | 21 (17.2%) | 14.0 |
| 35 to 50 years | 101 (82.8%) | 36.0 |
| Total | 122 (100.0%) | 23.0 |
Fertility by Age by Marriage Status in Sherwood
68.9% of women with births (122) in Sherwood are married. The highest percentage of unmarried women with births falls into 35 to 50 years age bracket with 37.6% of them unmarried at the time of birth, while the lowest percentage of unmarried women with births belong to 20 to 34 years age bracket with 0.0% of them unmarried.
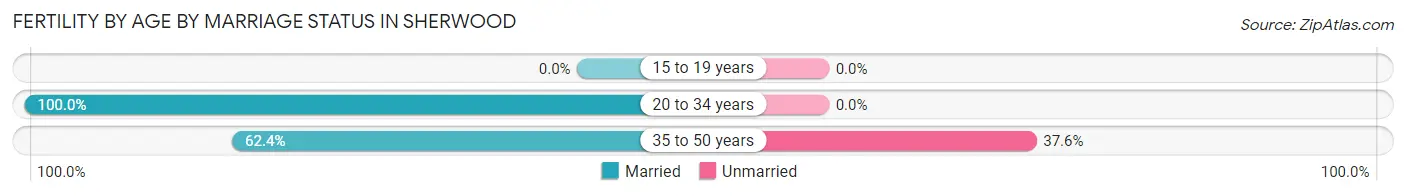
| Age Bracket | Married | Unmarried |
| 15 to 19 years | 0 (0.0%) | 0 (0.0%) |
| 20 to 34 years | 21 (100.0%) | 0 (0.0%) |
| 35 to 50 years | 63 (62.4%) | 38 (37.6%) |
| Total | 84 (68.9%) | 38 (31.1%) |
Fertility by Education in Sherwood
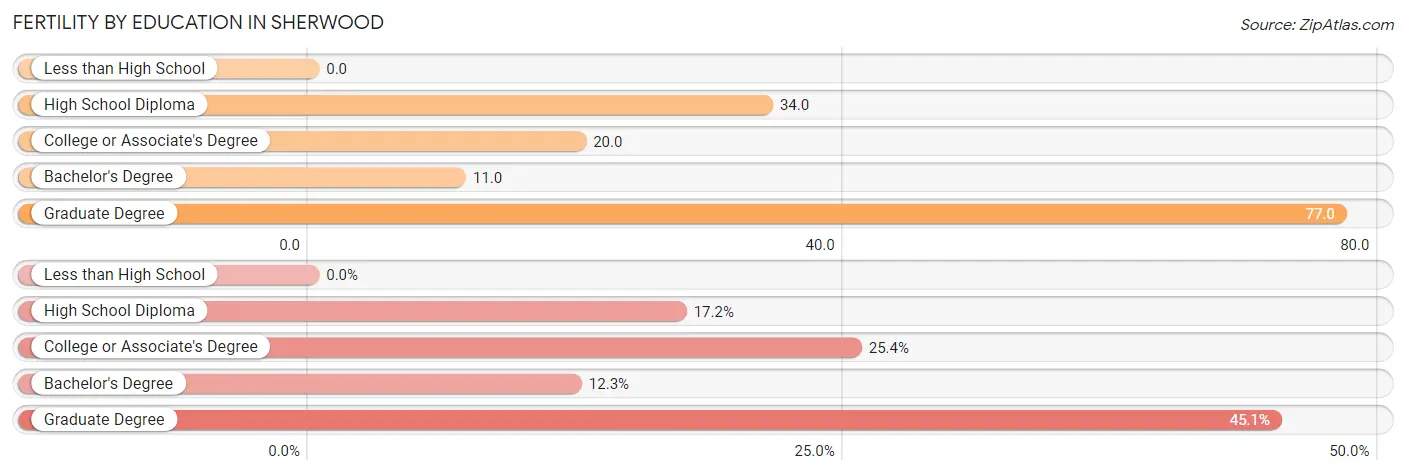
| Educational Attainment | Women with Births | Births / 1,000 Women |
| Less than High School | 0 (0.0%) | 0.0 |
| High School Diploma | 21 (17.2%) | 34.0 |
| College or Associate's Degree | 31 (25.4%) | 20.0 |
| Bachelor's Degree | 15 (12.3%) | 11.0 |
| Graduate Degree | 55 (45.1%) | 77.0 |
| Total | 122 (100.0%) | 23.0 |
Fertility by Education by Marriage Status in Sherwood
31.1% of women with births in Sherwood are unmarried. Women with the educational attainment of high school diploma are most likely to be married with 100.0% of them married at childbirth, while women with the educational attainment of graduate degree are least likely to be married with 69.1% of them unmarried at childbirth.
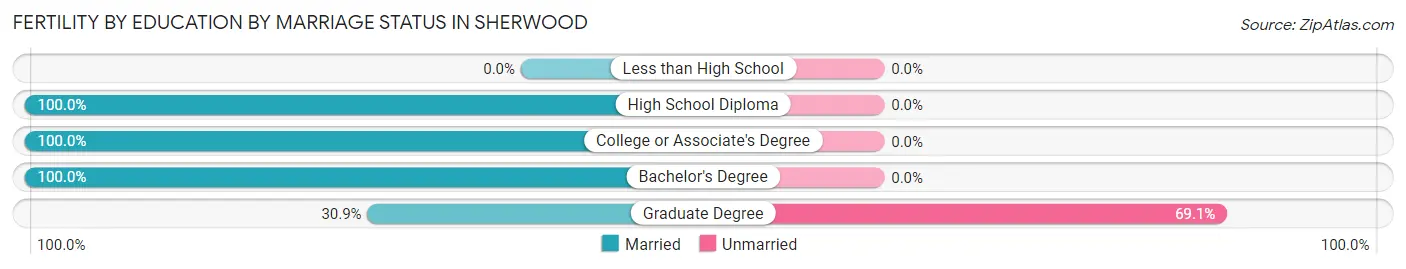
| Educational Attainment | Married | Unmarried |
| Less than High School | 0 (0.0%) | 0 (0.0%) |
| High School Diploma | 21 (100.0%) | 0 (0.0%) |
| College or Associate's Degree | 31 (100.0%) | 0 (0.0%) |
| Bachelor's Degree | 15 (100.0%) | 0 (0.0%) |
| Graduate Degree | 17 (30.9%) | 38 (69.1%) |
| Total | 84 (68.9%) | 38 (31.1%) |
Employment Characteristics in Sherwood
Employment by Class of Employer in Sherwood
Among the 9,961 employed individuals in Sherwood, private company employees (7,081 | 71.1%), not-for-profit organizations (814 | 8.2%), and local government employees (688 | 6.9%) make up the most common classes of employment.
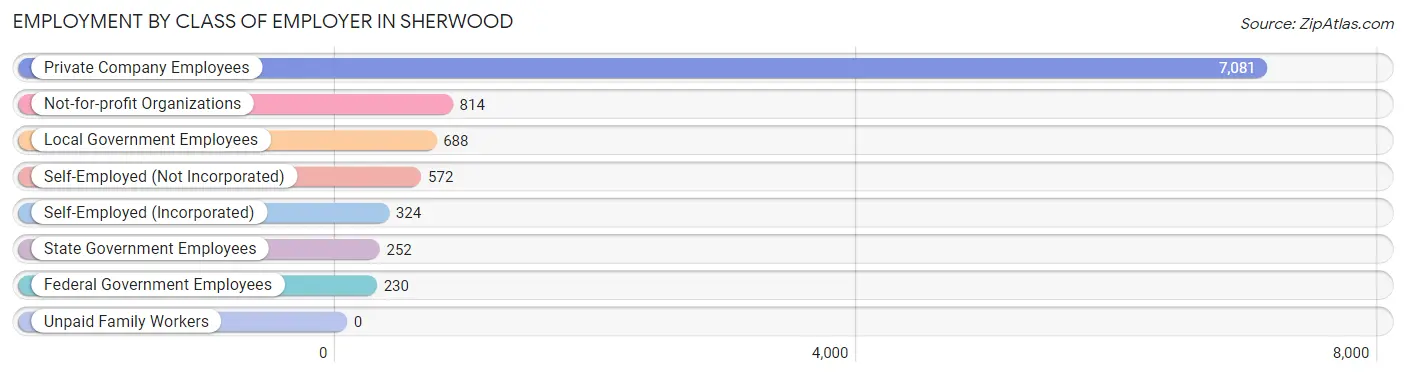
| Employer Class | # Employees | % Employees |
| Private Company Employees | 7,081 | 71.1% |
| Self-Employed (Incorporated) | 324 | 3.3% |
| Self-Employed (Not Incorporated) | 572 | 5.7% |
| Not-for-profit Organizations | 814 | 8.2% |
| Local Government Employees | 688 | 6.9% |
| State Government Employees | 252 | 2.5% |
| Federal Government Employees | 230 | 2.3% |
| Unpaid Family Workers | 0 | 0.0% |
| Total | 9,961 | 100.0% |
Employment Status by Age in Sherwood
According to the labor force statistics for Sherwood, out of the total population over 16 years of age (15,228), 68.5% or 10,431 individuals are in the labor force, with 2.9% or 302 of them unemployed. The age group with the highest labor force participation rate is 45 to 54 years, with 88.6% or 3,159 individuals in the labor force. Within the labor force, the 16 to 19 years age range has the highest percentage of unemployed individuals, with 10.4% or 54 of them being unemployed.
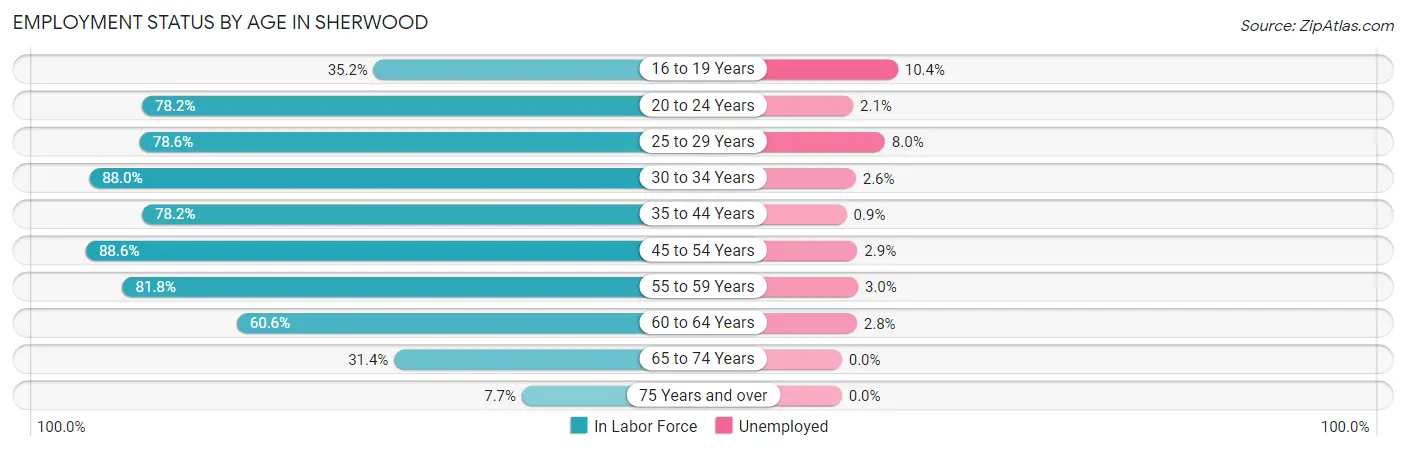
| Age Bracket | In Labor Force | Unemployed |
| 16 to 19 Years | 518 (35.2%) | 54 (10.4%) |
| 20 to 24 Years | 768 (78.2%) | 16 (2.1%) |
| 25 to 29 Years | 584 (78.6%) | 47 (8.0%) |
| 30 to 34 Years | 1,177 (88.0%) | 31 (2.6%) |
| 35 to 44 Years | 2,503 (78.2%) | 23 (0.9%) |
| 45 to 54 Years | 3,159 (88.6%) | 92 (2.9%) |
| 55 to 59 Years | 603 (81.8%) | 18 (3.0%) |
| 60 to 64 Years | 682 (60.6%) | 19 (2.8%) |
| 65 to 74 Years | 366 (31.4%) | 0 (0.0%) |
| 75 Years and over | 69 (7.7%) | 0 (0.0%) |
| Total | 10,431 (68.5%) | 302 (2.9%) |
Employment Status by Educational Attainment in Sherwood
According to labor force statistics for Sherwood, 81.3% of individuals (8,706) out of the total population between 25 and 64 years of age (10,709) are in the labor force, with 2.6% or 226 of them being unemployed. The group with the highest labor force participation rate are those with the educational attainment of bachelor's degree or higher, with 85.6% or 4,670 individuals in the labor force. Within the labor force, individuals with college / associate degree education have the highest percentage of unemployment, with 3.4% or 93 of them being unemployed.
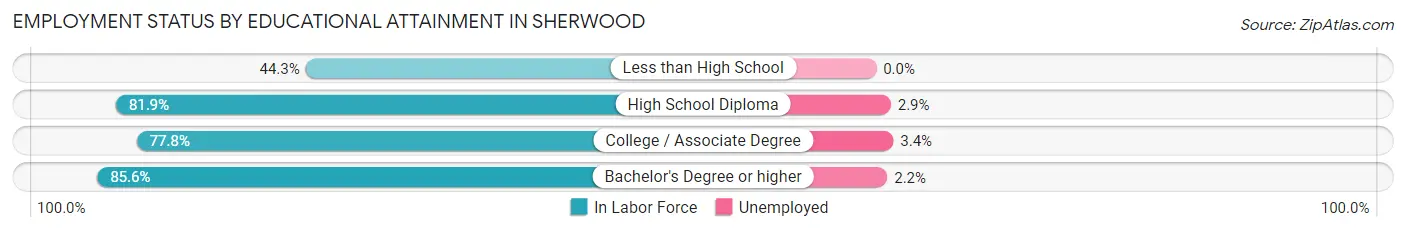
| Educational Attainment | In Labor Force | Unemployed |
| Less than High School | 148 (44.3%) | 0 (0.0%) |
| High School Diploma | 1,151 (81.9%) | 41 (2.9%) |
| College / Associate Degree | 2,734 (77.8%) | 119 (3.4%) |
| Bachelor's Degree or higher | 4,670 (85.6%) | 120 (2.2%) |
| Total | 8,706 (81.3%) | 278 (2.6%) |
Employment Occupations by Sex in Sherwood
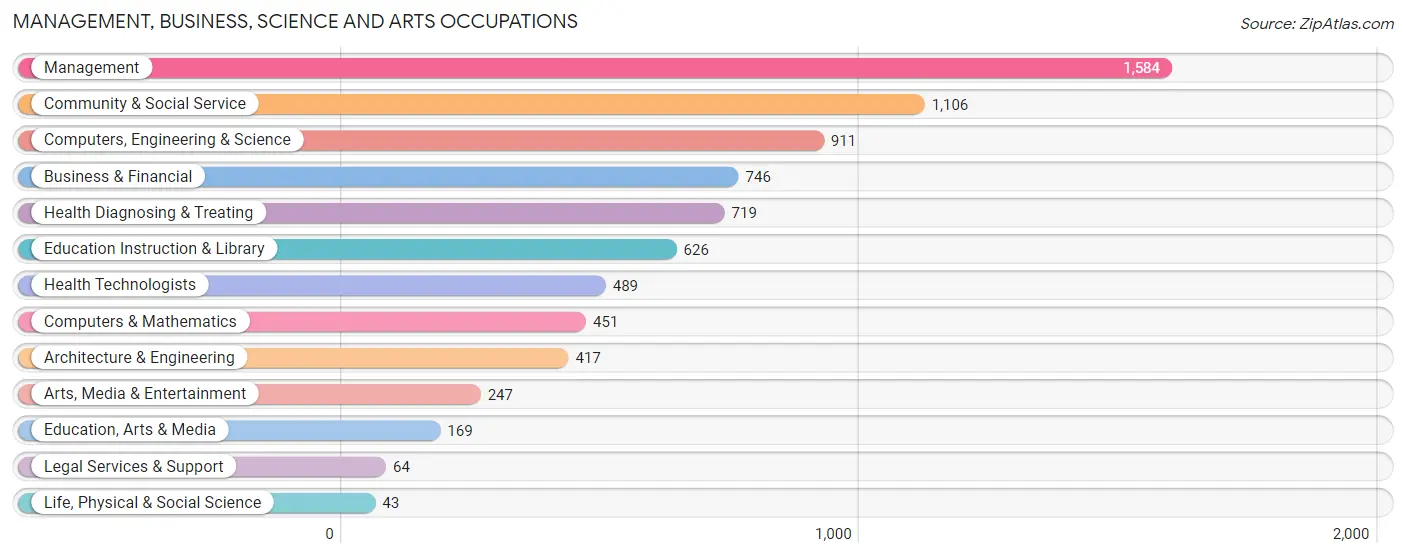
Management, Business, Science and Arts Occupations
The most common Management, Business, Science and Arts occupations in Sherwood are Management (1,584 | 15.7%), Community & Social Service (1,106 | 11.0%), Computers, Engineering & Science (911 | 9.0%), Business & Financial (746 | 7.4%), and Health Diagnosing & Treating (719 | 7.1%).
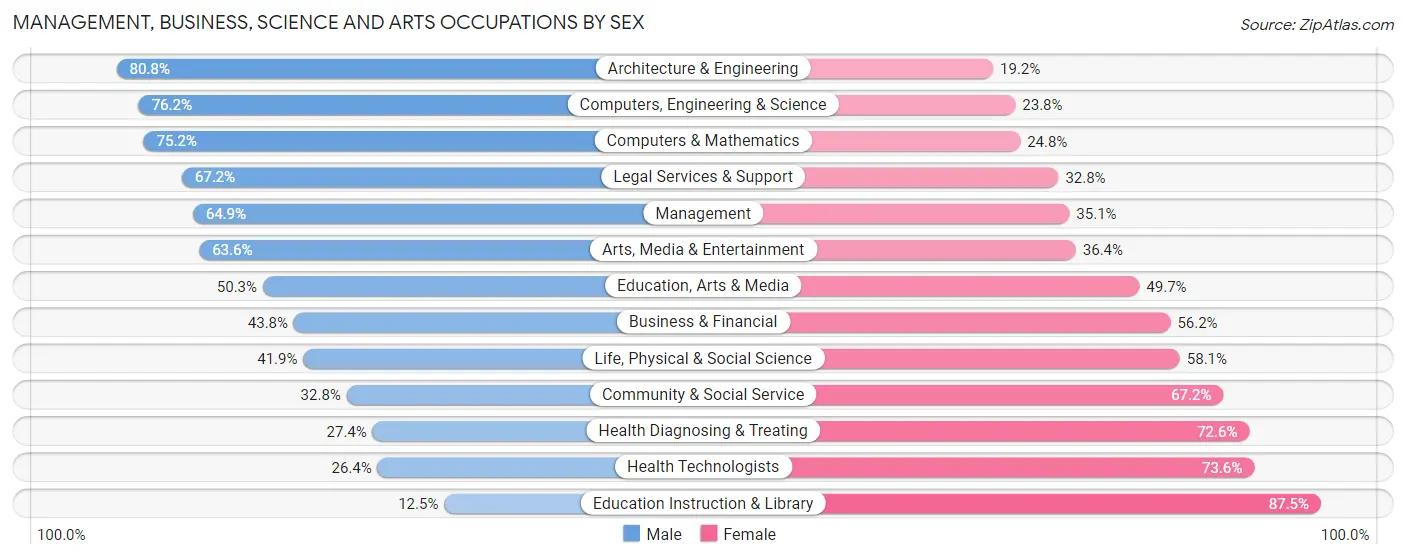
Management, Business, Science and Arts Occupations by Sex
Within the Management, Business, Science and Arts occupations in Sherwood, the most male-oriented occupations are Architecture & Engineering (80.8%), Computers, Engineering & Science (76.2%), and Computers & Mathematics (75.2%), while the most female-oriented occupations are Education Instruction & Library (87.5%), Health Technologists (73.6%), and Health Diagnosing & Treating (72.6%).
| Occupation | Male | Female |
| Management | 1,028 (64.9%) | 556 (35.1%) |
| Business & Financial | 327 (43.8%) | 419 (56.2%) |
| Computers, Engineering & Science | 694 (76.2%) | 217 (23.8%) |
| Computers & Mathematics | 339 (75.2%) | 112 (24.8%) |
| Architecture & Engineering | 337 (80.8%) | 80 (19.2%) |
| Life, Physical & Social Science | 18 (41.9%) | 25 (58.1%) |
| Community & Social Service | 363 (32.8%) | 743 (67.2%) |
| Education, Arts & Media | 85 (50.3%) | 84 (49.7%) |
| Legal Services & Support | 43 (67.2%) | 21 (32.8%) |
| Education Instruction & Library | 78 (12.5%) | 548 (87.5%) |
| Arts, Media & Entertainment | 157 (63.6%) | 90 (36.4%) |
| Health Diagnosing & Treating | 197 (27.4%) | 522 (72.6%) |
| Health Technologists | 129 (26.4%) | 360 (73.6%) |
| Total (Category) | 2,609 (51.5%) | 2,457 (48.5%) |
| Total (Overall) | 5,392 (53.4%) | 4,700 (46.6%) |
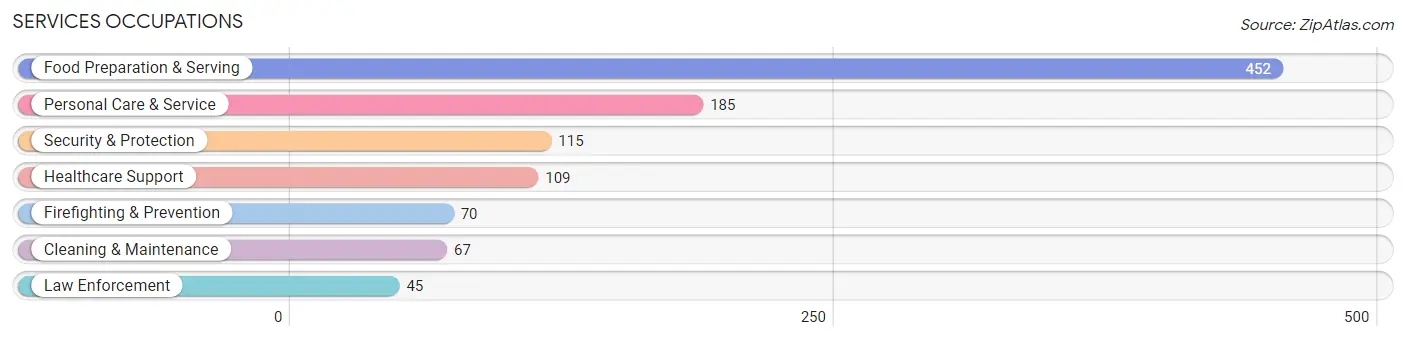
Services Occupations
The most common Services occupations in Sherwood are Food Preparation & Serving (452 | 4.5%), Personal Care & Service (185 | 1.8%), Security & Protection (115 | 1.1%), Healthcare Support (109 | 1.1%), and Firefighting & Prevention (70 | 0.7%).
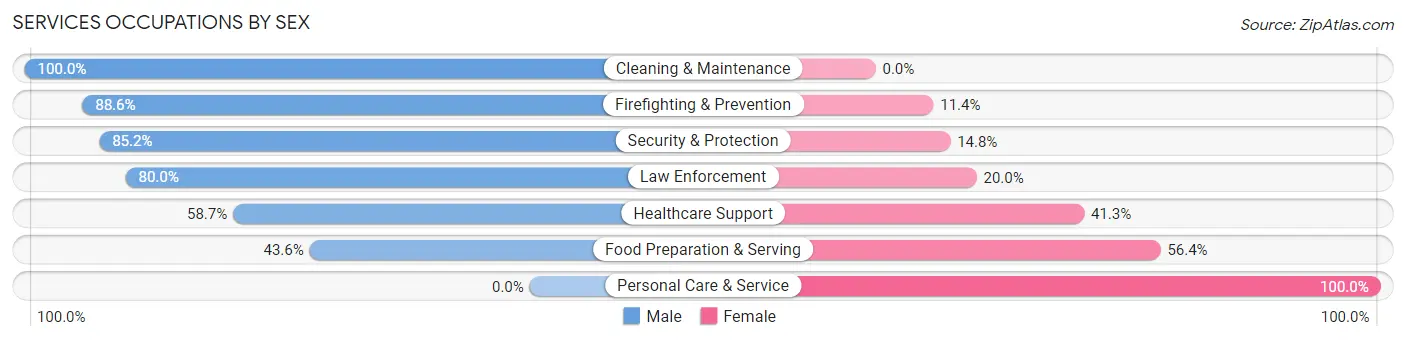
Services Occupations by Sex
Within the Services occupations in Sherwood, the most male-oriented occupations are Cleaning & Maintenance (100.0%), Firefighting & Prevention (88.6%), and Security & Protection (85.2%), while the most female-oriented occupations are Personal Care & Service (100.0%), Food Preparation & Serving (56.4%), and Healthcare Support (41.3%).
| Occupation | Male | Female |
| Healthcare Support | 64 (58.7%) | 45 (41.3%) |
| Security & Protection | 98 (85.2%) | 17 (14.8%) |
| Firefighting & Prevention | 62 (88.6%) | 8 (11.4%) |
| Law Enforcement | 36 (80.0%) | 9 (20.0%) |
| Food Preparation & Serving | 197 (43.6%) | 255 (56.4%) |
| Cleaning & Maintenance | 67 (100.0%) | 0 (0.0%) |
| Personal Care & Service | 0 (0.0%) | 185 (100.0%) |
| Total (Category) | 426 (45.9%) | 502 (54.1%) |
| Total (Overall) | 5,392 (53.4%) | 4,700 (46.6%) |
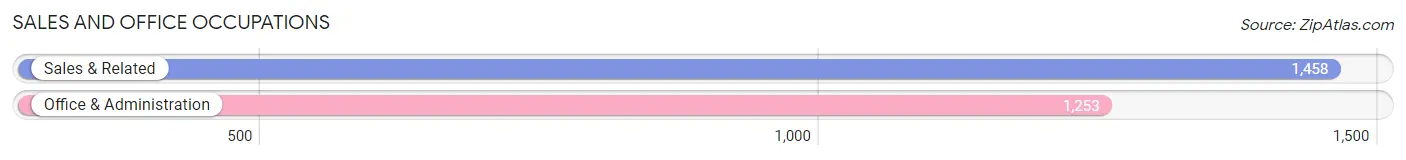
Sales and Office Occupations
The most common Sales and Office occupations in Sherwood are Sales & Related (1,458 | 14.4%), and Office & Administration (1,253 | 12.4%).
Sales and Office Occupations by Sex
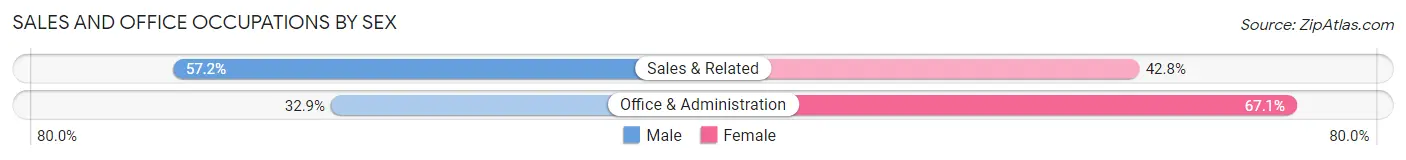
| Occupation | Male | Female |
| Sales & Related | 834 (57.2%) | 624 (42.8%) |
| Office & Administration | 412 (32.9%) | 841 (67.1%) |
| Total (Category) | 1,246 (46.0%) | 1,465 (54.0%) |
| Total (Overall) | 5,392 (53.4%) | 4,700 (46.6%) |
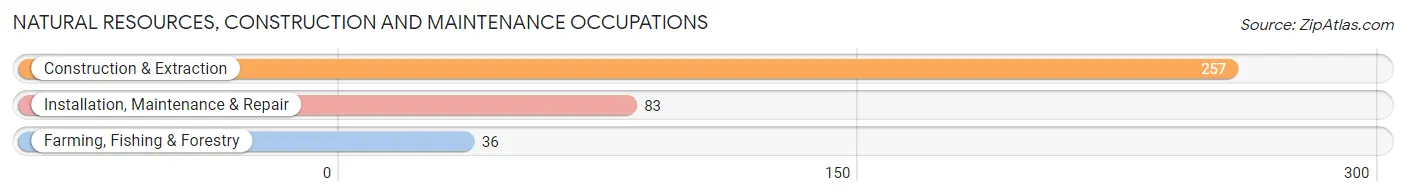
Natural Resources, Construction and Maintenance Occupations
The most common Natural Resources, Construction and Maintenance occupations in Sherwood are Construction & Extraction (257 | 2.5%), Installation, Maintenance & Repair (83 | 0.8%), and Farming, Fishing & Forestry (36 | 0.4%).
Natural Resources, Construction and Maintenance Occupations by Sex
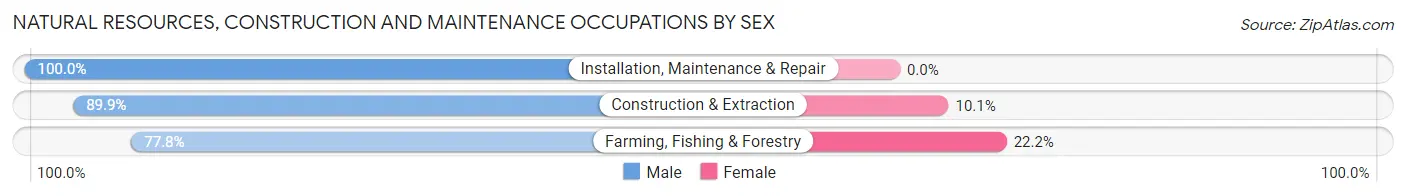
| Occupation | Male | Female |
| Farming, Fishing & Forestry | 28 (77.8%) | 8 (22.2%) |
| Construction & Extraction | 231 (89.9%) | 26 (10.1%) |
| Installation, Maintenance & Repair | 83 (100.0%) | 0 (0.0%) |
| Total (Category) | 342 (91.0%) | 34 (9.0%) |
| Total (Overall) | 5,392 (53.4%) | 4,700 (46.6%) |
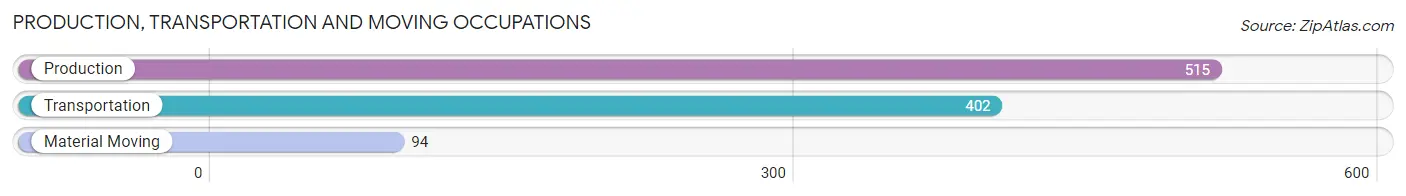
Production, Transportation and Moving Occupations
The most common Production, Transportation and Moving occupations in Sherwood are Production (515 | 5.1%), Transportation (402 | 4.0%), and Material Moving (94 | 0.9%).
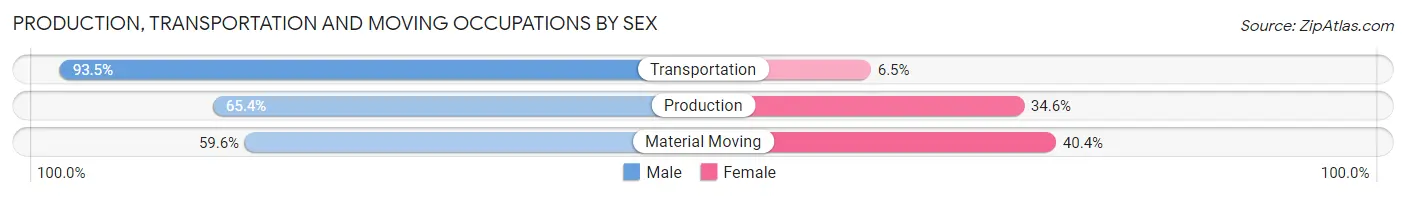
Production, Transportation and Moving Occupations by Sex
| Occupation | Male | Female |
| Production | 337 (65.4%) | 178 (34.6%) |
| Transportation | 376 (93.5%) | 26 (6.5%) |
| Material Moving | 56 (59.6%) | 38 (40.4%) |
| Total (Category) | 769 (76.1%) | 242 (23.9%) |
| Total (Overall) | 5,392 (53.4%) | 4,700 (46.6%) |
Employment Industries by Sex in Sherwood
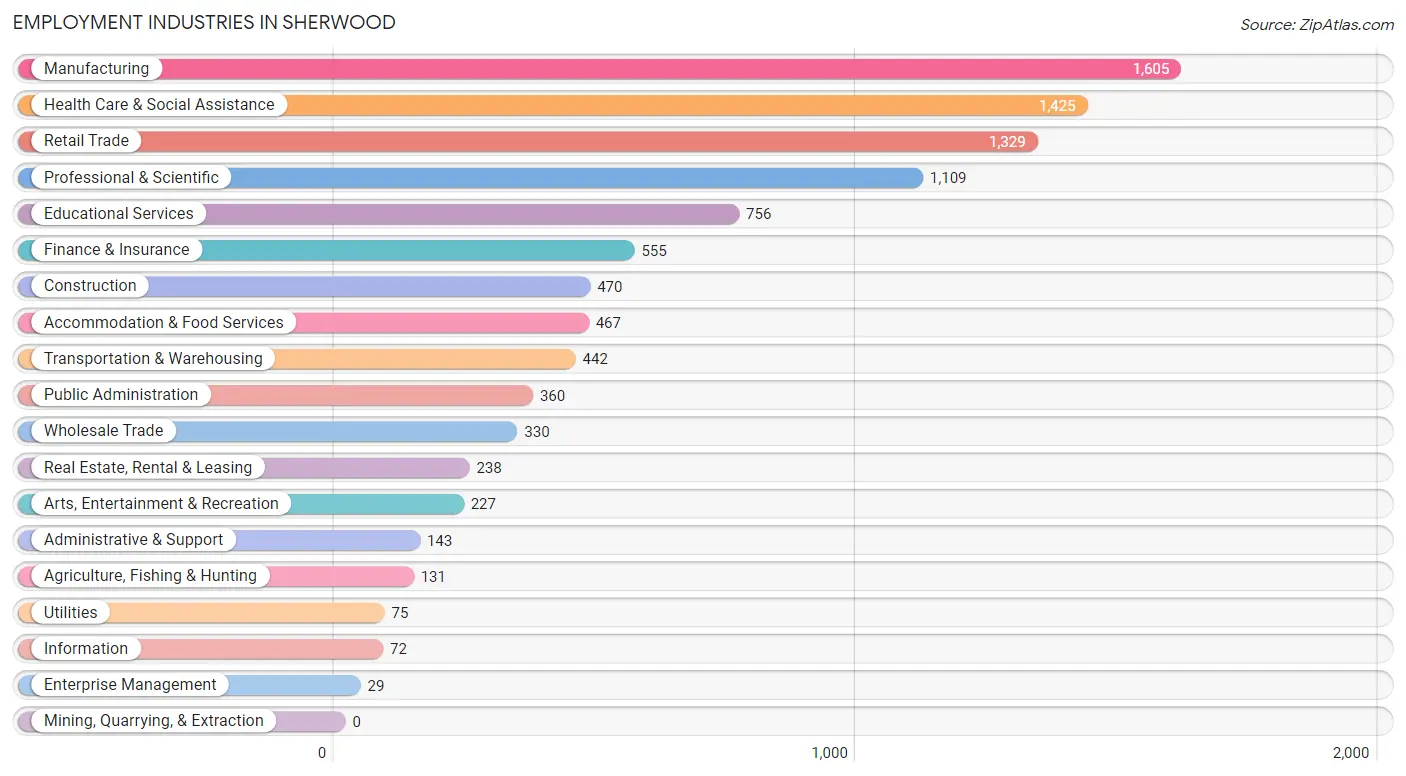
Employment Industries in Sherwood
The major employment industries in Sherwood include Manufacturing (1,605 | 15.9%), Health Care & Social Assistance (1,425 | 14.1%), Retail Trade (1,329 | 13.2%), Professional & Scientific (1,109 | 11.0%), and Educational Services (756 | 7.5%).
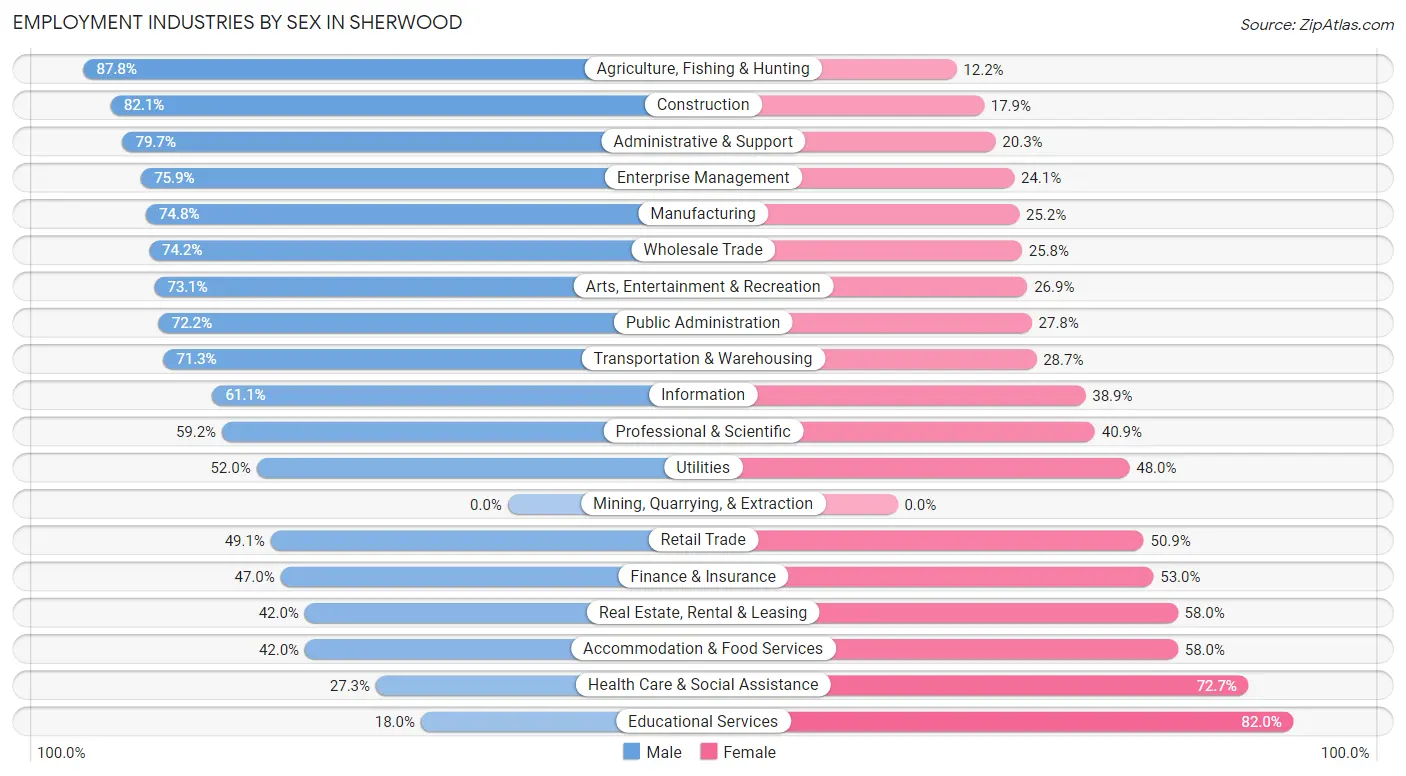
Employment Industries by Sex in Sherwood
The Sherwood industries that see more men than women are Agriculture, Fishing & Hunting (87.8%), Construction (82.1%), and Administrative & Support (79.7%), whereas the industries that tend to have a higher number of women are Educational Services (82.0%), Health Care & Social Assistance (72.7%), and Accommodation & Food Services (58.0%).
| Industry | Male | Female |
| Agriculture, Fishing & Hunting | 115 (87.8%) | 16 (12.2%) |
| Mining, Quarrying, & Extraction | 0 (0.0%) | 0 (0.0%) |
| Construction | 386 (82.1%) | 84 (17.9%) |
| Manufacturing | 1,201 (74.8%) | 404 (25.2%) |
| Wholesale Trade | 245 (74.2%) | 85 (25.8%) |
| Retail Trade | 652 (49.1%) | 677 (50.9%) |
| Transportation & Warehousing | 315 (71.3%) | 127 (28.7%) |
| Utilities | 39 (52.0%) | 36 (48.0%) |
| Information | 44 (61.1%) | 28 (38.9%) |
| Finance & Insurance | 261 (47.0%) | 294 (53.0%) |
| Real Estate, Rental & Leasing | 100 (42.0%) | 138 (58.0%) |
| Professional & Scientific | 656 (59.2%) | 453 (40.8%) |
| Enterprise Management | 22 (75.9%) | 7 (24.1%) |
| Administrative & Support | 114 (79.7%) | 29 (20.3%) |
| Educational Services | 136 (18.0%) | 620 (82.0%) |
| Health Care & Social Assistance | 389 (27.3%) | 1,036 (72.7%) |
| Arts, Entertainment & Recreation | 166 (73.1%) | 61 (26.9%) |
| Accommodation & Food Services | 196 (42.0%) | 271 (58.0%) |
| Public Administration | 260 (72.2%) | 100 (27.8%) |
| Total | 5,392 (53.4%) | 4,700 (46.6%) |
Education in Sherwood
School Enrollment in Sherwood
The most common levels of schooling among the 6,382 students in Sherwood are high school (1,750 | 27.4%), middle school (1,522 | 23.8%), and elementary school (1,254 | 19.7%).
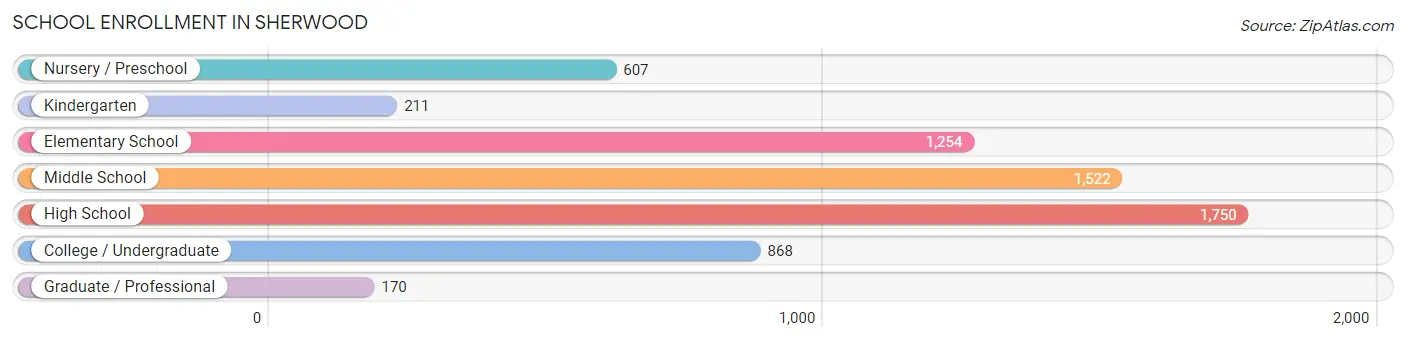
| School Level | # Students | % Students |
| Nursery / Preschool | 607 | 9.5% |
| Kindergarten | 211 | 3.3% |
| Elementary School | 1,254 | 19.7% |
| Middle School | 1,522 | 23.8% |
| High School | 1,750 | 27.4% |
| College / Undergraduate | 868 | 13.6% |
| Graduate / Professional | 170 | 2.7% |
| Total | 6,382 | 100.0% |
School Enrollment by Age by Funding Source in Sherwood
Out of a total of 6,382 students who are enrolled in schools in Sherwood, 976 (15.3%) attend a private institution, while the remaining 5,406 (84.7%) are enrolled in public schools. The age group of 3 to 4 year olds has the highest likelihood of being enrolled in private schools, with 199 (64.6% in the age bracket) enrolled. Conversely, the age group of 10 to 14 year olds has the lowest likelihood of being enrolled in a private school, with 1,825 (94.8% in the age bracket) attending a public institution.
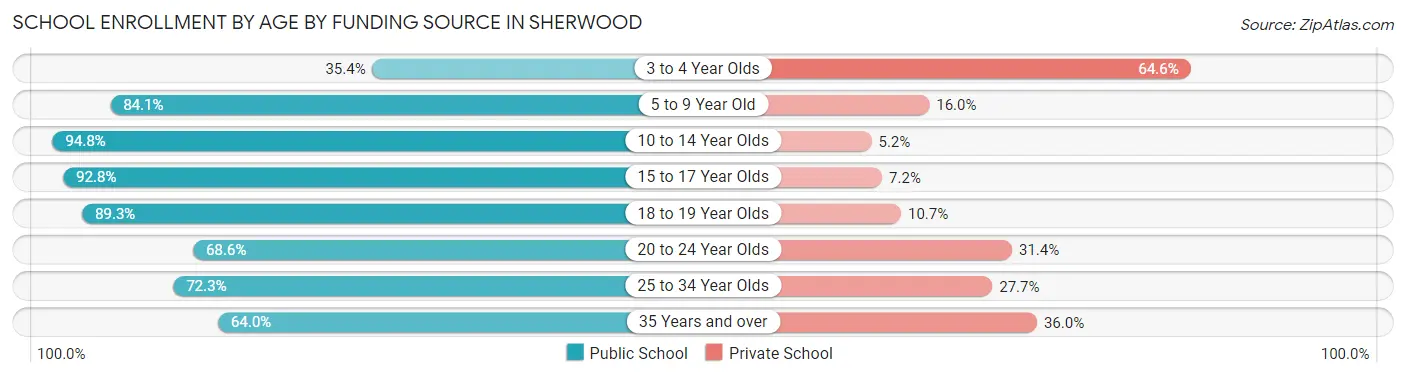
| Age Bracket | Public School | Private School |
| 3 to 4 Year Olds | 109 (35.4%) | 199 (64.6%) |
| 5 to 9 Year Old | 1,307 (84.1%) | 248 (16.0%) |
| 10 to 14 Year Olds | 1,825 (94.8%) | 100 (5.2%) |
| 15 to 17 Year Olds | 1,153 (92.8%) | 89 (7.2%) |
| 18 to 19 Year Olds | 401 (89.3%) | 48 (10.7%) |
| 20 to 24 Year Olds | 221 (68.6%) | 101 (31.4%) |
| 25 to 34 Year Olds | 141 (72.3%) | 54 (27.7%) |
| 35 Years and over | 247 (64.0%) | 139 (36.0%) |
| Total | 5,406 (84.7%) | 976 (15.3%) |
Educational Attainment by Field of Study in Sherwood
Business (1,487 | 21.9%), engineering (643 | 9.5%), education (600 | 8.8%), bio, nature & agricultural (558 | 8.2%), and science & technology (513 | 7.6%) are the most common fields of study among 6,779 individuals in Sherwood who have obtained a bachelor's degree or higher.
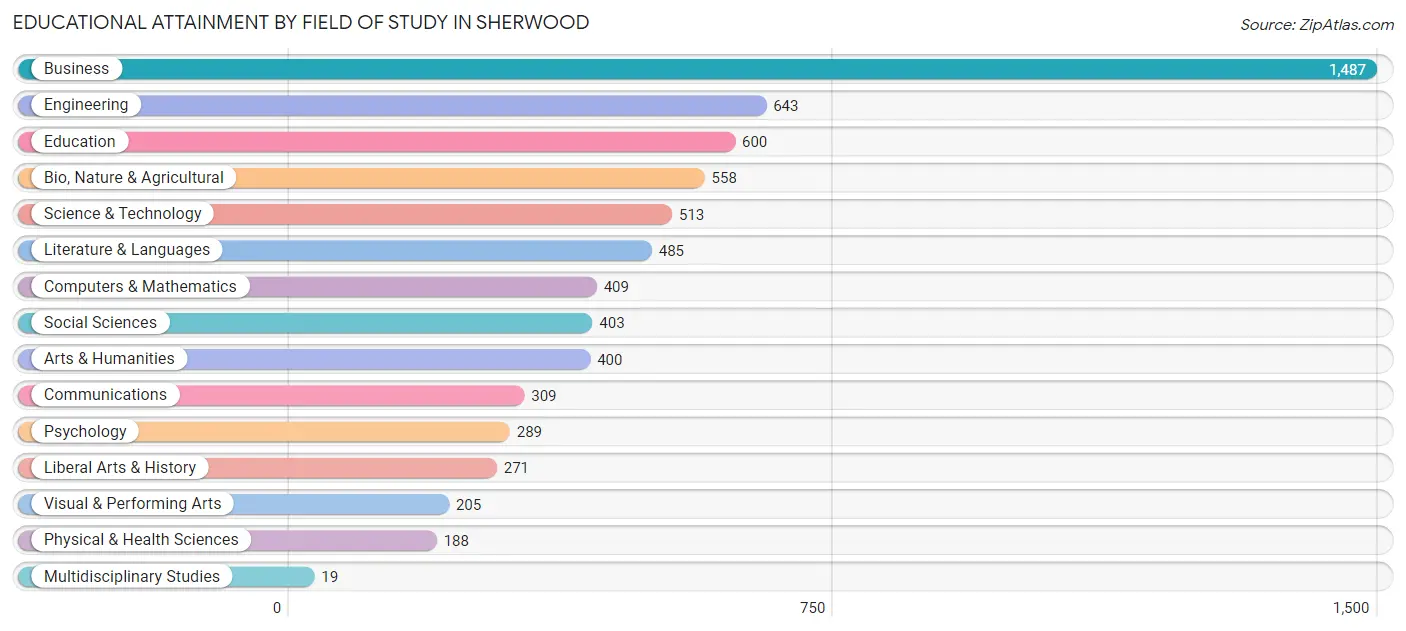
| Field of Study | # Graduates | % Graduates |
| Computers & Mathematics | 409 | 6.0% |
| Bio, Nature & Agricultural | 558 | 8.2% |
| Physical & Health Sciences | 188 | 2.8% |
| Psychology | 289 | 4.3% |
| Social Sciences | 403 | 5.9% |
| Engineering | 643 | 9.5% |
| Multidisciplinary Studies | 19 | 0.3% |
| Science & Technology | 513 | 7.6% |
| Business | 1,487 | 21.9% |
| Education | 600 | 8.8% |
| Literature & Languages | 485 | 7.1% |
| Liberal Arts & History | 271 | 4.0% |
| Visual & Performing Arts | 205 | 3.0% |
| Communications | 309 | 4.6% |
| Arts & Humanities | 400 | 5.9% |
| Total | 6,779 | 100.0% |
Transportation & Commute in Sherwood
Vehicle Availability by Sex in Sherwood
The most prevalent vehicle ownership categories in Sherwood are males with 2 vehicles (2,732, accounting for 51.6%) and females with 2 vehicles (1,905, making up 58.8%).
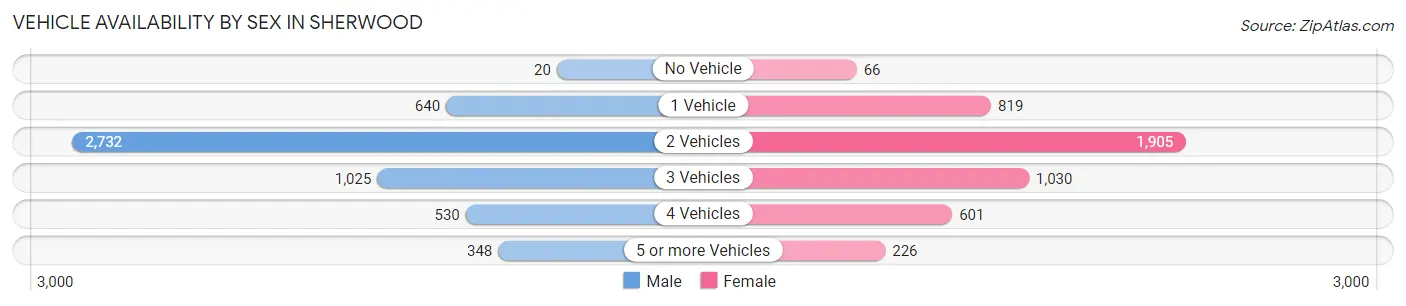
| Vehicles Available | Male | Female |
| No Vehicle | 20 (0.4%) | 66 (1.4%) |
| 1 Vehicle | 640 (12.1%) | 819 (17.6%) |
| 2 Vehicles | 2,732 (51.6%) | 1,905 (41.0%) |
| 3 Vehicles | 1,025 (19.4%) | 1,030 (22.2%) |
| 4 Vehicles | 530 (10.0%) | 601 (12.9%) |
| 5 or more Vehicles | 348 (6.6%) | 226 (4.9%) |
| Total | 5,295 (100.0%) | 4,647 (100.0%) |
Commute Time in Sherwood
The most frequently occuring commute durations in Sherwood are 30 to 34 minutes (1,384 commuters, 17.8%), 15 to 19 minutes (1,209 commuters, 15.5%), and 5 to 9 minutes (1,067 commuters, 13.7%).
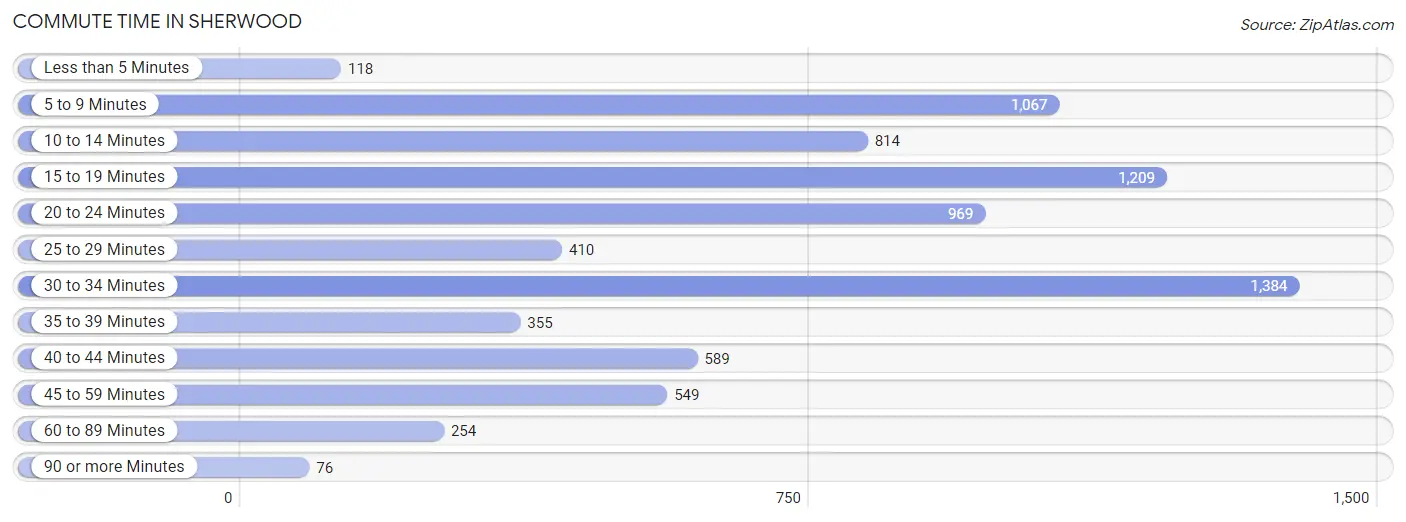
| Commute Time | # Commuters | % Commuters |
| Less than 5 Minutes | 118 | 1.5% |
| 5 to 9 Minutes | 1,067 | 13.7% |
| 10 to 14 Minutes | 814 | 10.4% |
| 15 to 19 Minutes | 1,209 | 15.5% |
| 20 to 24 Minutes | 969 | 12.4% |
| 25 to 29 Minutes | 410 | 5.3% |
| 30 to 34 Minutes | 1,384 | 17.8% |
| 35 to 39 Minutes | 355 | 4.5% |
| 40 to 44 Minutes | 589 | 7.6% |
| 45 to 59 Minutes | 549 | 7.0% |
| 60 to 89 Minutes | 254 | 3.3% |
| 90 or more Minutes | 76 | 1.0% |
Commute Time by Sex in Sherwood
The most common commute times in Sherwood are 30 to 34 minutes (920 commuters, 22.8%) for males and 15 to 19 minutes (713 commuters, 19.0%) for females.
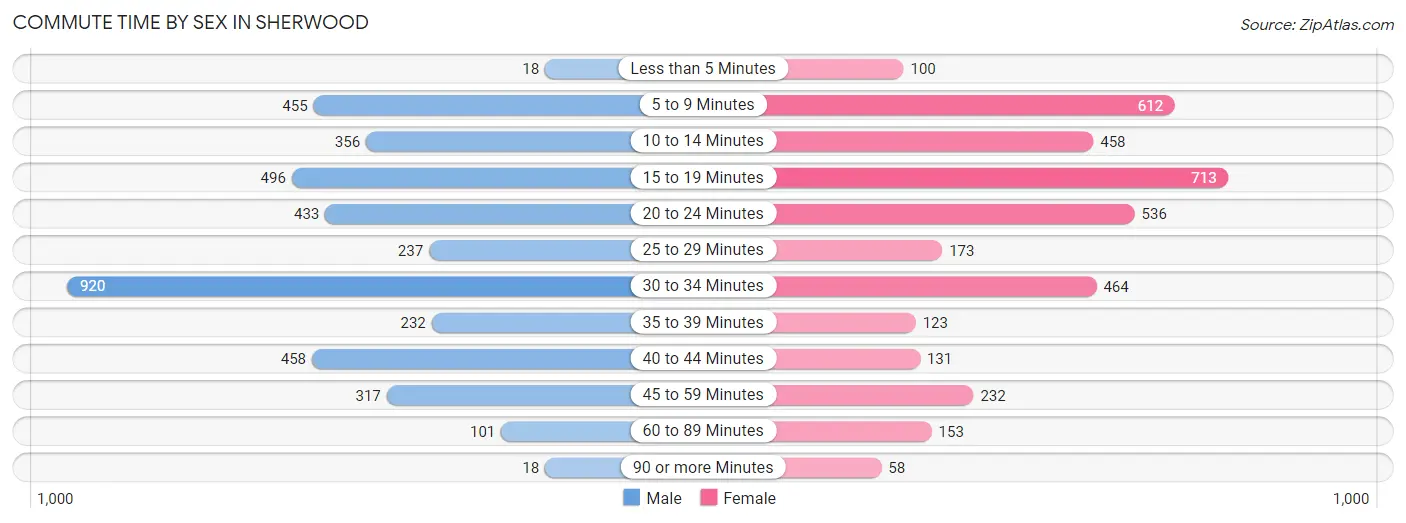
| Commute Time | Male | Female |
| Less than 5 Minutes | 18 (0.4%) | 100 (2.7%) |
| 5 to 9 Minutes | 455 (11.3%) | 612 (16.3%) |
| 10 to 14 Minutes | 356 (8.8%) | 458 (12.2%) |
| 15 to 19 Minutes | 496 (12.3%) | 713 (19.0%) |
| 20 to 24 Minutes | 433 (10.7%) | 536 (14.3%) |
| 25 to 29 Minutes | 237 (5.9%) | 173 (4.6%) |
| 30 to 34 Minutes | 920 (22.8%) | 464 (12.4%) |
| 35 to 39 Minutes | 232 (5.7%) | 123 (3.3%) |
| 40 to 44 Minutes | 458 (11.3%) | 131 (3.5%) |
| 45 to 59 Minutes | 317 (7.8%) | 232 (6.2%) |
| 60 to 89 Minutes | 101 (2.5%) | 153 (4.1%) |
| 90 or more Minutes | 18 (0.4%) | 58 (1.5%) |
Time of Departure to Work by Sex in Sherwood
The most frequent times of departure to work in Sherwood are 7:00 AM to 7:29 AM (647, 16.0%) for males and 7:30 AM to 7:59 AM (670, 17.8%) for females.
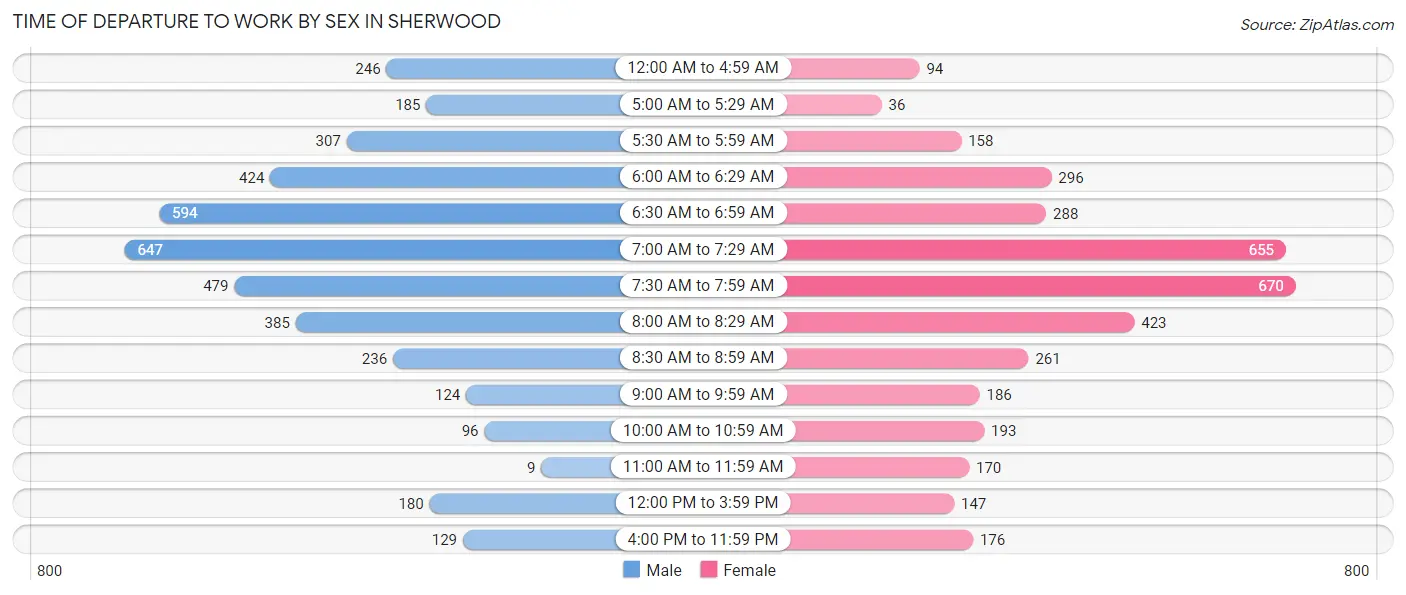
| Time of Departure | Male | Female |
| 12:00 AM to 4:59 AM | 246 (6.1%) | 94 (2.5%) |
| 5:00 AM to 5:29 AM | 185 (4.6%) | 36 (1.0%) |
| 5:30 AM to 5:59 AM | 307 (7.6%) | 158 (4.2%) |
| 6:00 AM to 6:29 AM | 424 (10.5%) | 296 (7.9%) |
| 6:30 AM to 6:59 AM | 594 (14.7%) | 288 (7.7%) |
| 7:00 AM to 7:29 AM | 647 (16.0%) | 655 (17.4%) |
| 7:30 AM to 7:59 AM | 479 (11.8%) | 670 (17.8%) |
| 8:00 AM to 8:29 AM | 385 (9.5%) | 423 (11.3%) |
| 8:30 AM to 8:59 AM | 236 (5.8%) | 261 (7.0%) |
| 9:00 AM to 9:59 AM | 124 (3.1%) | 186 (5.0%) |
| 10:00 AM to 10:59 AM | 96 (2.4%) | 193 (5.1%) |
| 11:00 AM to 11:59 AM | 9 (0.2%) | 170 (4.5%) |
| 12:00 PM to 3:59 PM | 180 (4.4%) | 147 (3.9%) |
| 4:00 PM to 11:59 PM | 129 (3.2%) | 176 (4.7%) |
| Total | 4,041 (100.0%) | 3,753 (100.0%) |
Housing Occupancy in Sherwood
Occupancy by Ownership in Sherwood
Of the total 6,829 dwellings in Sherwood, owner-occupied units account for 5,064 (74.2%), while renter-occupied units make up 1,765 (25.9%).
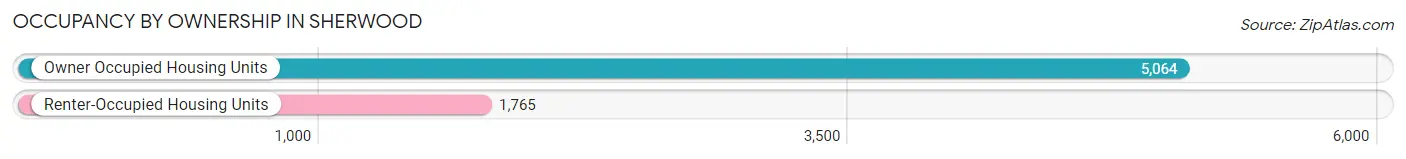
| Occupancy | # Housing Units | % Housing Units |
| Owner Occupied Housing Units | 5,064 | 74.2% |
| Renter-Occupied Housing Units | 1,765 | 25.9% |
| Total Occupied Housing Units | 6,829 | 100.0% |
Occupancy by Household Size in Sherwood
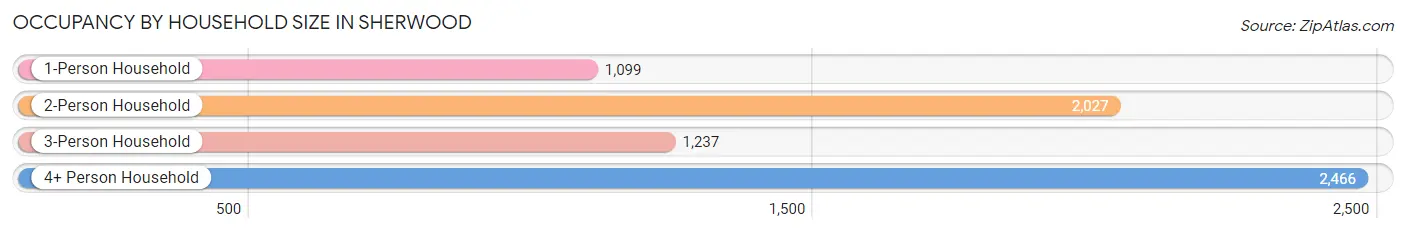
| Household Size | # Housing Units | % Housing Units |
| 1-Person Household | 1,099 | 16.1% |
| 2-Person Household | 2,027 | 29.7% |
| 3-Person Household | 1,237 | 18.1% |
| 4+ Person Household | 2,466 | 36.1% |
| Total Housing Units | 6,829 | 100.0% |
Occupancy by Ownership by Household Size in Sherwood
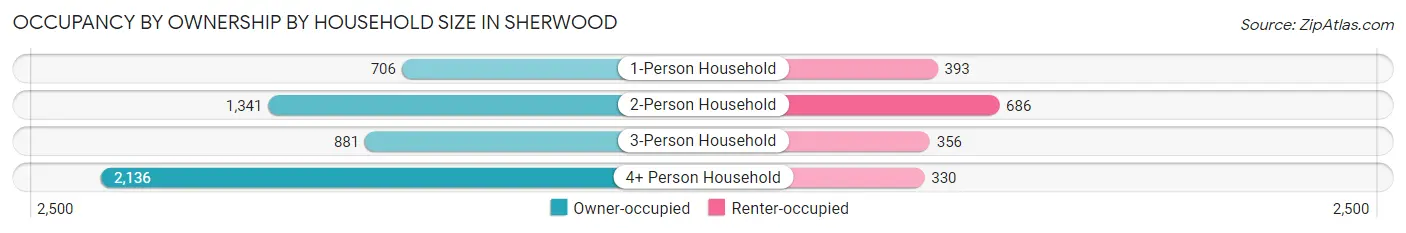
| Household Size | Owner-occupied | Renter-occupied |
| 1-Person Household | 706 (64.2%) | 393 (35.8%) |
| 2-Person Household | 1,341 (66.2%) | 686 (33.8%) |
| 3-Person Household | 881 (71.2%) | 356 (28.8%) |
| 4+ Person Household | 2,136 (86.6%) | 330 (13.4%) |
| Total Housing Units | 5,064 (74.2%) | 1,765 (25.9%) |
Occupancy by Educational Attainment in Sherwood
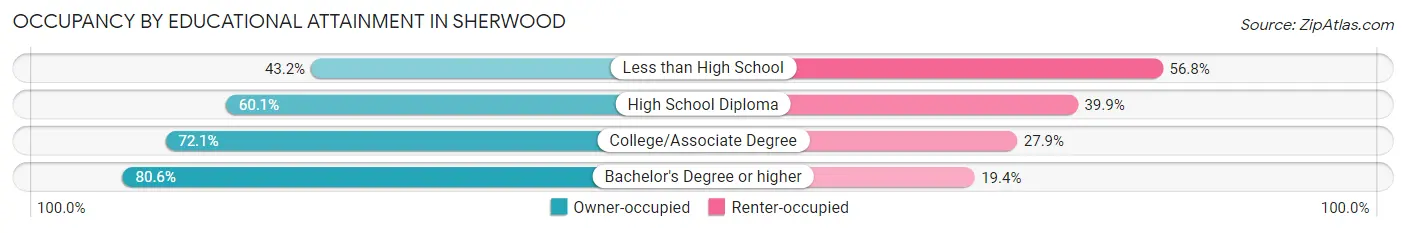
| Household Size | Owner-occupied | Renter-occupied |
| Less than High School | 131 (43.2%) | 172 (56.8%) |
| High School Diploma | 396 (60.1%) | 263 (39.9%) |
| College/Associate Degree | 1,615 (72.1%) | 625 (27.9%) |
| Bachelor's Degree or higher | 2,922 (80.6%) | 705 (19.4%) |
Occupancy by Age of Householder in Sherwood
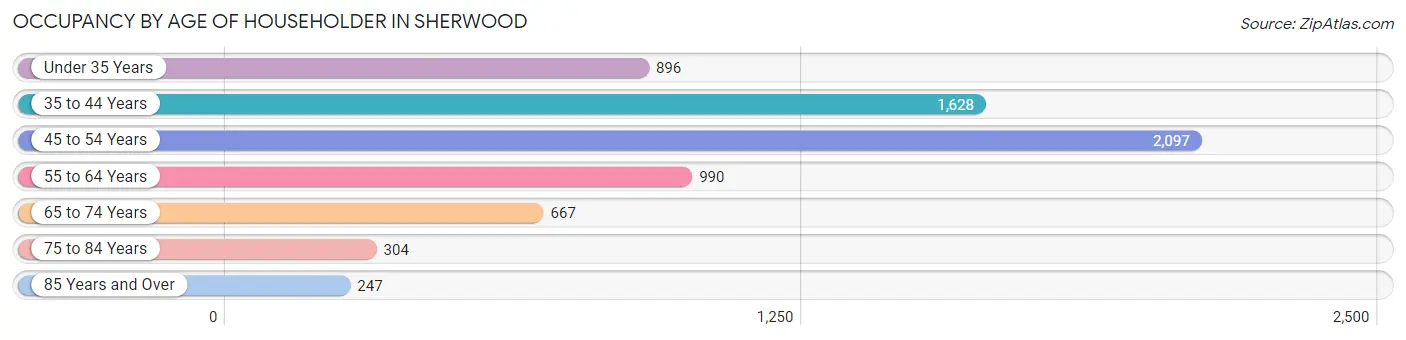
| Age Bracket | # Households | % Households |
| Under 35 Years | 896 | 13.1% |
| 35 to 44 Years | 1,628 | 23.8% |
| 45 to 54 Years | 2,097 | 30.7% |
| 55 to 64 Years | 990 | 14.5% |
| 65 to 74 Years | 667 | 9.8% |
| 75 to 84 Years | 304 | 4.4% |
| 85 Years and Over | 247 | 3.6% |
| Total | 6,829 | 100.0% |
Housing Finances in Sherwood
Median Income by Occupancy in Sherwood
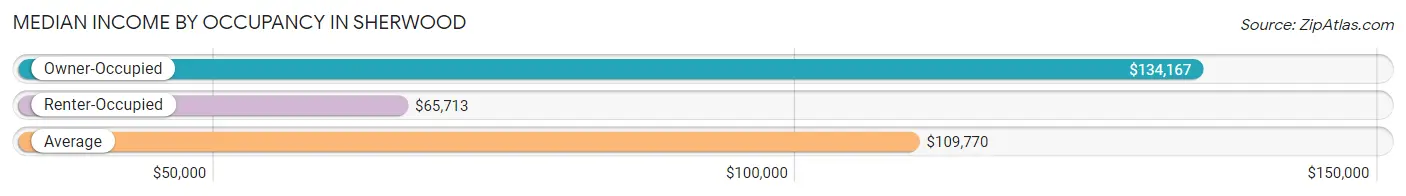
| Occupancy Type | # Households | Median Income |
| Owner-Occupied | 5,064 (74.2%) | $134,167 |
| Renter-Occupied | 1,765 (25.9%) | $65,713 |
| Average | 6,829 (100.0%) | $109,770 |
Occupancy by Householder Income Bracket in Sherwood
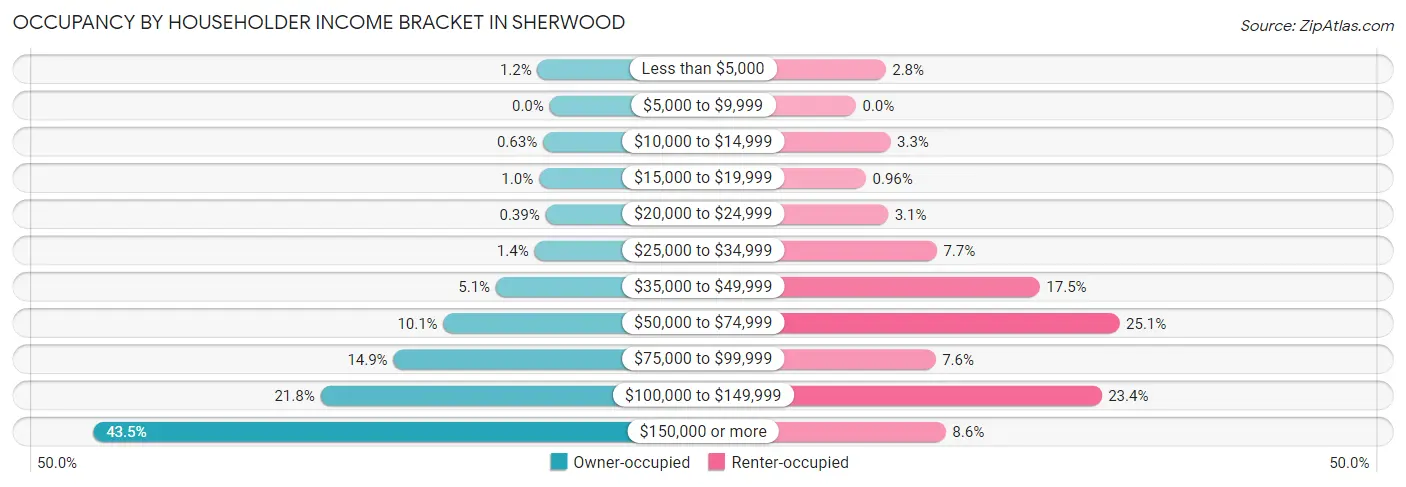
| Income Bracket | Owner-occupied | Renter-occupied |
| Less than $5,000 | 58 (1.1%) | 50 (2.8%) |
| $5,000 to $9,999 | 0 (0.0%) | 0 (0.0%) |
| $10,000 to $14,999 | 32 (0.6%) | 58 (3.3%) |
| $15,000 to $19,999 | 51 (1.0%) | 17 (1.0%) |
| $20,000 to $24,999 | 20 (0.4%) | 54 (3.1%) |
| $25,000 to $34,999 | 73 (1.4%) | 136 (7.7%) |
| $35,000 to $49,999 | 259 (5.1%) | 309 (17.5%) |
| $50,000 to $74,999 | 512 (10.1%) | 443 (25.1%) |
| $75,000 to $99,999 | 753 (14.9%) | 134 (7.6%) |
| $100,000 to $149,999 | 1,105 (21.8%) | 413 (23.4%) |
| $150,000 or more | 2,201 (43.5%) | 151 (8.6%) |
| Total | 5,064 (100.0%) | 1,765 (100.0%) |
Monthly Housing Cost Tiers in Sherwood
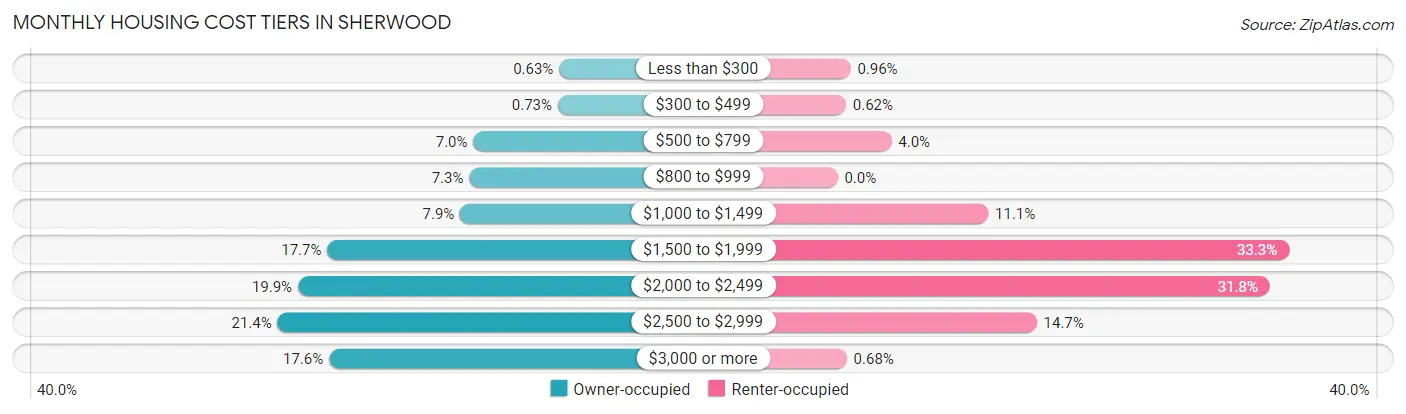
| Monthly Cost | Owner-occupied | Renter-occupied |
| Less than $300 | 32 (0.6%) | 17 (1.0%) |
| $300 to $499 | 37 (0.7%) | 11 (0.6%) |
| $500 to $799 | 352 (7.0%) | 70 (4.0%) |
| $800 to $999 | 367 (7.2%) | 0 (0.0%) |
| $1,000 to $1,499 | 401 (7.9%) | 196 (11.1%) |
| $1,500 to $1,999 | 897 (17.7%) | 587 (33.3%) |
| $2,000 to $2,499 | 1,006 (19.9%) | 562 (31.8%) |
| $2,500 to $2,999 | 1,082 (21.4%) | 259 (14.7%) |
| $3,000 or more | 890 (17.6%) | 12 (0.7%) |
| Total | 5,064 (100.0%) | 1,765 (100.0%) |
Physical Housing Characteristics in Sherwood
Housing Structures in Sherwood
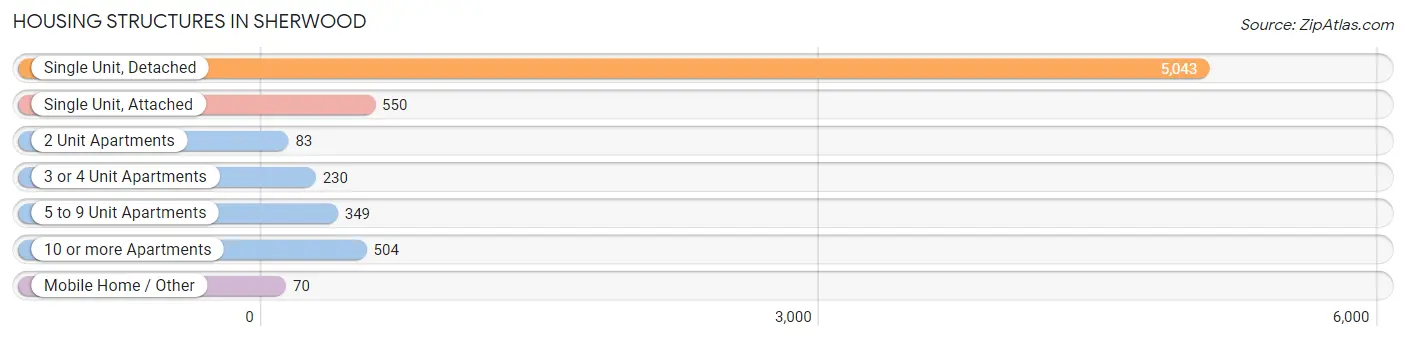
| Structure Type | # Housing Units | % Housing Units |
| Single Unit, Detached | 5,043 | 73.9% |
| Single Unit, Attached | 550 | 8.1% |
| 2 Unit Apartments | 83 | 1.2% |
| 3 or 4 Unit Apartments | 230 | 3.4% |
| 5 to 9 Unit Apartments | 349 | 5.1% |
| 10 or more Apartments | 504 | 7.4% |
| Mobile Home / Other | 70 | 1.0% |
| Total | 6,829 | 100.0% |
Housing Structures by Occupancy in Sherwood
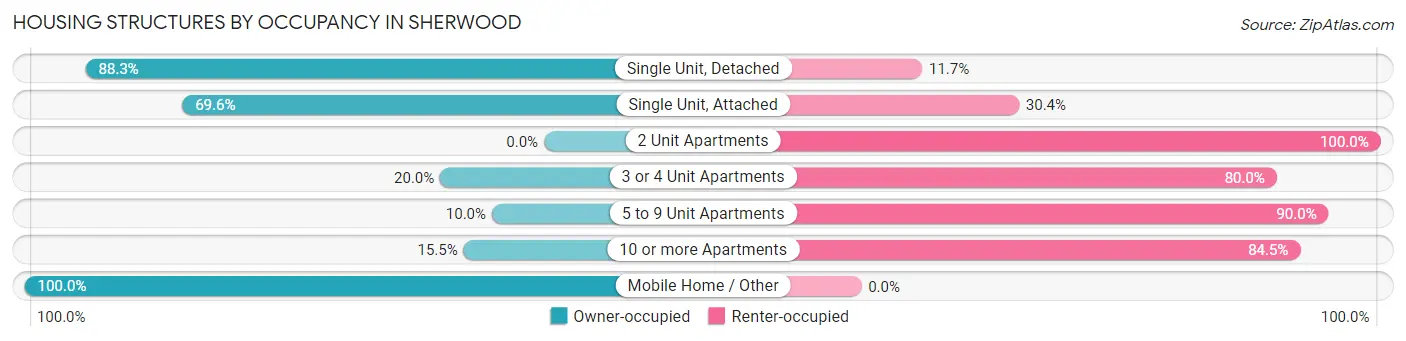
| Structure Type | Owner-occupied | Renter-occupied |
| Single Unit, Detached | 4,452 (88.3%) | 591 (11.7%) |
| Single Unit, Attached | 383 (69.6%) | 167 (30.4%) |
| 2 Unit Apartments | 0 (0.0%) | 83 (100.0%) |
| 3 or 4 Unit Apartments | 46 (20.0%) | 184 (80.0%) |
| 5 to 9 Unit Apartments | 35 (10.0%) | 314 (90.0%) |
| 10 or more Apartments | 78 (15.5%) | 426 (84.5%) |
| Mobile Home / Other | 70 (100.0%) | 0 (0.0%) |
| Total | 5,064 (74.2%) | 1,765 (25.9%) |
Housing Structures by Number of Rooms in Sherwood
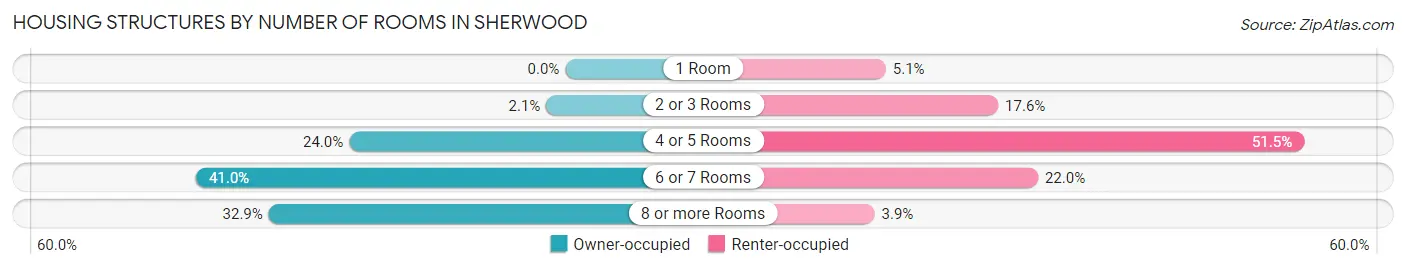
| Number of Rooms | Owner-occupied | Renter-occupied |
| 1 Room | 0 (0.0%) | 90 (5.1%) |
| 2 or 3 Rooms | 107 (2.1%) | 310 (17.6%) |
| 4 or 5 Rooms | 1,215 (24.0%) | 909 (51.5%) |
| 6 or 7 Rooms | 2,075 (41.0%) | 388 (22.0%) |
| 8 or more Rooms | 1,667 (32.9%) | 68 (3.8%) |
| Total | 5,064 (100.0%) | 1,765 (100.0%) |
Housing Structure by Heating Type in Sherwood
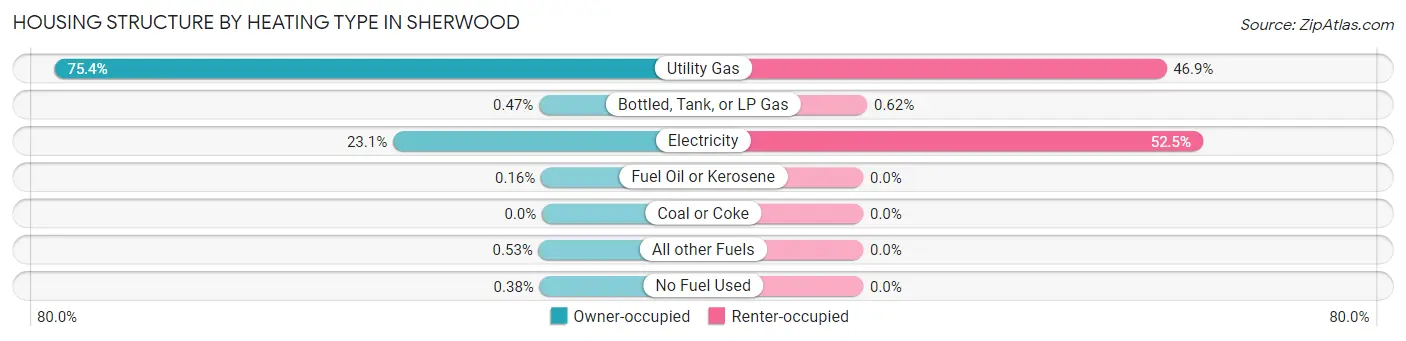
| Heating Type | Owner-occupied | Renter-occupied |
| Utility Gas | 3,819 (75.4%) | 827 (46.9%) |
| Bottled, Tank, or LP Gas | 24 (0.5%) | 11 (0.6%) |
| Electricity | 1,167 (23.1%) | 927 (52.5%) |
| Fuel Oil or Kerosene | 8 (0.2%) | 0 (0.0%) |
| Coal or Coke | 0 (0.0%) | 0 (0.0%) |
| All other Fuels | 27 (0.5%) | 0 (0.0%) |
| No Fuel Used | 19 (0.4%) | 0 (0.0%) |
| Total | 5,064 (100.0%) | 1,765 (100.0%) |
Household Vehicle Usage in Sherwood
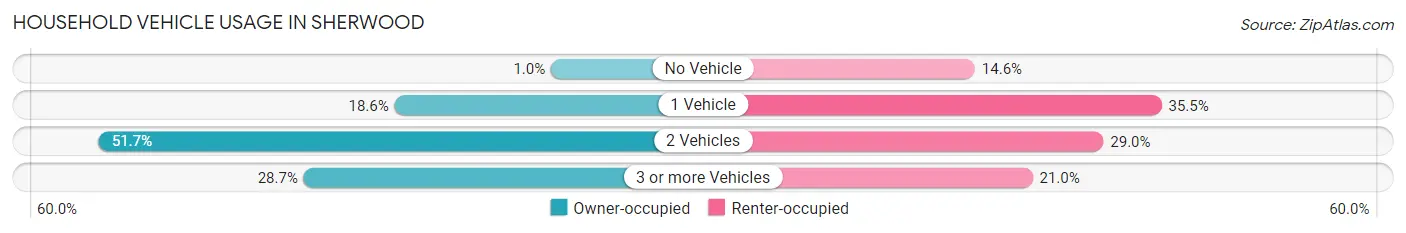
| Vehicles per Household | Owner-occupied | Renter-occupied |
| No Vehicle | 52 (1.0%) | 257 (14.6%) |
| 1 Vehicle | 940 (18.6%) | 626 (35.5%) |
| 2 Vehicles | 2,617 (51.7%) | 511 (28.9%) |
| 3 or more Vehicles | 1,455 (28.7%) | 371 (21.0%) |
| Total | 5,064 (100.0%) | 1,765 (100.0%) |
Real Estate & Mortgages in Sherwood
Real Estate and Mortgage Overview in Sherwood
| Characteristic | Without Mortgage | With Mortgage |
| Housing Units | 864 | 4,200 |
| Median Property Value | $532,800 | $518,200 |
| Median Household Income | $94,028 | $1,940 |
| Monthly Housing Costs | $819 | $890 |
| Real Estate Taxes | $4,994 | $38 |
Property Value by Mortgage Status in Sherwood
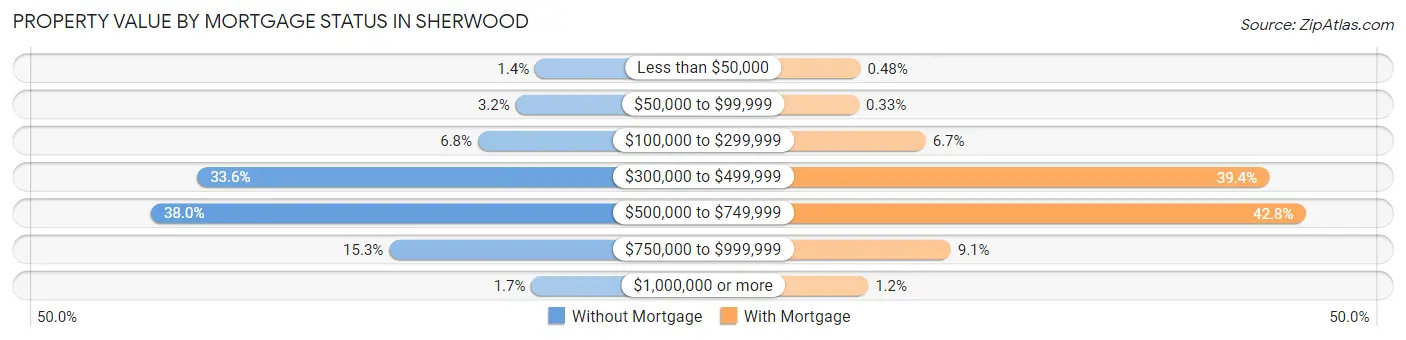
| Property Value | Without Mortgage | With Mortgage |
| Less than $50,000 | 12 (1.4%) | 20 (0.5%) |
| $50,000 to $99,999 | 28 (3.2%) | 14 (0.3%) |
| $100,000 to $299,999 | 59 (6.8%) | 281 (6.7%) |
| $300,000 to $499,999 | 290 (33.6%) | 1,654 (39.4%) |
| $500,000 to $749,999 | 328 (38.0%) | 1,799 (42.8%) |
| $750,000 to $999,999 | 132 (15.3%) | 381 (9.1%) |
| $1,000,000 or more | 15 (1.7%) | 51 (1.2%) |
| Total | 864 (100.0%) | 4,200 (100.0%) |
Household Income by Mortgage Status in Sherwood
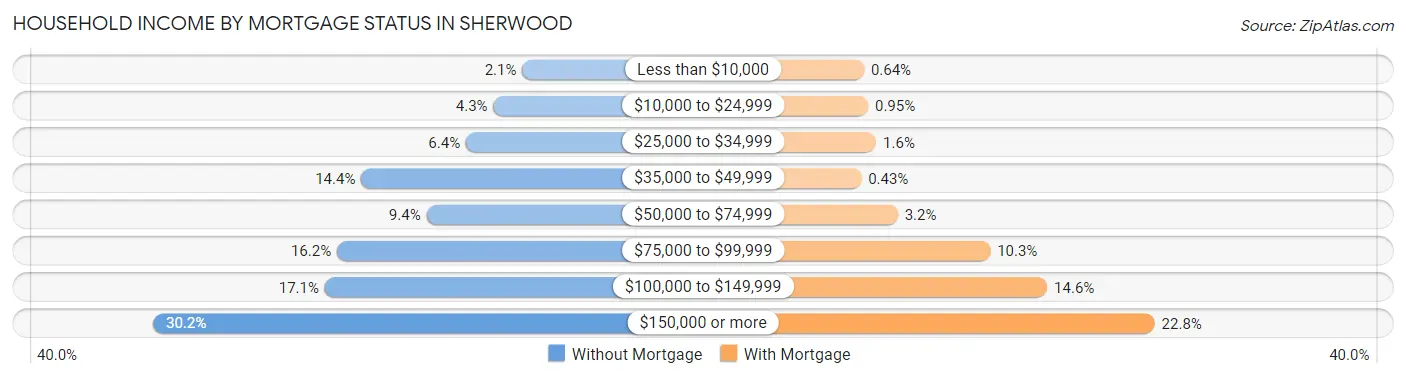
| Household Income | Without Mortgage | With Mortgage |
| Less than $10,000 | 18 (2.1%) | 27 (0.6%) |
| $10,000 to $24,999 | 37 (4.3%) | 40 (0.9%) |
| $25,000 to $34,999 | 55 (6.4%) | 66 (1.6%) |
| $35,000 to $49,999 | 124 (14.3%) | 18 (0.4%) |
| $50,000 to $74,999 | 81 (9.4%) | 135 (3.2%) |
| $75,000 to $99,999 | 140 (16.2%) | 431 (10.3%) |
| $100,000 to $149,999 | 148 (17.1%) | 613 (14.6%) |
| $150,000 or more | 261 (30.2%) | 957 (22.8%) |
| Total | 864 (100.0%) | 4,200 (100.0%) |
Property Value to Household Income Ratio in Sherwood
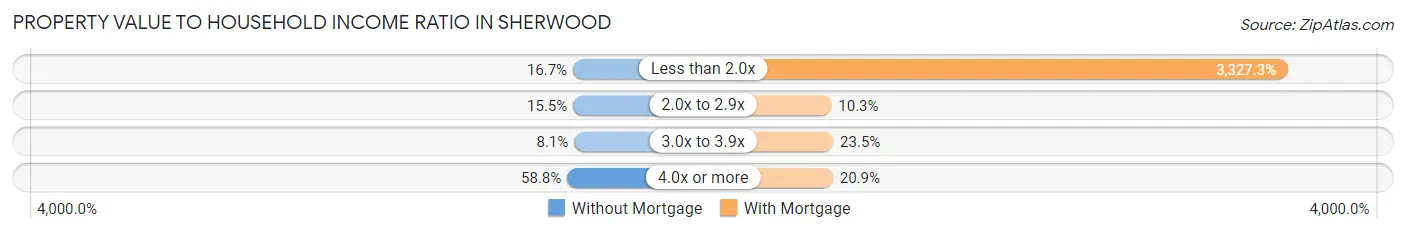
| Value-to-Income Ratio | Without Mortgage | With Mortgage |
| Less than 2.0x | 144 (16.7%) | 139,746 (3,327.3%) |
| 2.0x to 2.9x | 134 (15.5%) | 431 (10.3%) |
| 3.0x to 3.9x | 70 (8.1%) | 987 (23.5%) |
| 4.0x or more | 508 (58.8%) | 879 (20.9%) |
| Total | 864 (100.0%) | 4,200 (100.0%) |
Real Estate Taxes by Mortgage Status in Sherwood
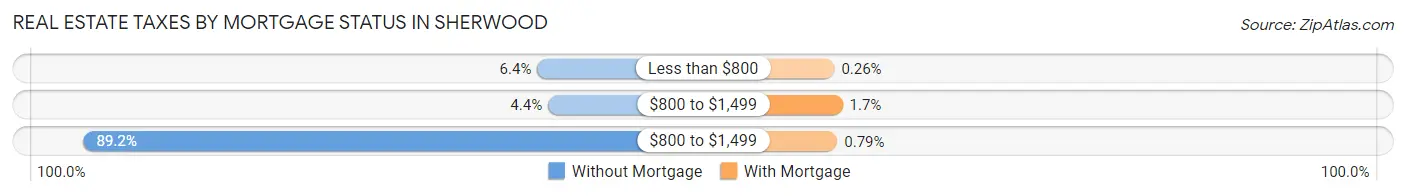
| Property Taxes | Without Mortgage | With Mortgage |
| Less than $800 | 55 (6.4%) | 11 (0.3%) |
| $800 to $1,499 | 38 (4.4%) | 73 (1.7%) |
| $800 to $1,499 | 771 (89.2%) | 33 (0.8%) |
| Total | 864 (100.0%) | 4,200 (100.0%) |
Health & Disability in Sherwood
Health Insurance Coverage by Age in Sherwood
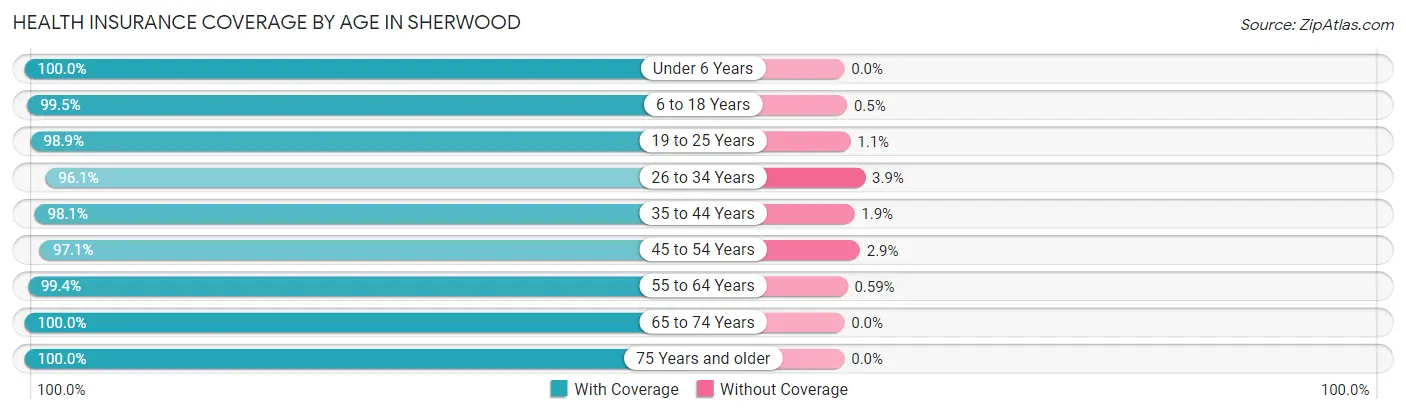
| Age Bracket | With Coverage | Without Coverage |
| Under 6 Years | 1,335 (100.0%) | 0 (0.0%) |
| 6 to 18 Years | 4,927 (99.5%) | 25 (0.5%) |
| 19 to 25 Years | 1,317 (98.9%) | 15 (1.1%) |
| 26 to 34 Years | 1,860 (96.1%) | 75 (3.9%) |
| 35 to 44 Years | 3,141 (98.1%) | 60 (1.9%) |
| 45 to 54 Years | 3,462 (97.1%) | 103 (2.9%) |
| 55 to 64 Years | 1,852 (99.4%) | 11 (0.6%) |
| 65 to 74 Years | 1,167 (100.0%) | 0 (0.0%) |
| 75 Years and older | 889 (100.0%) | 0 (0.0%) |
| Total | 19,950 (98.6%) | 289 (1.4%) |
Health Insurance Coverage by Citizenship Status in Sherwood
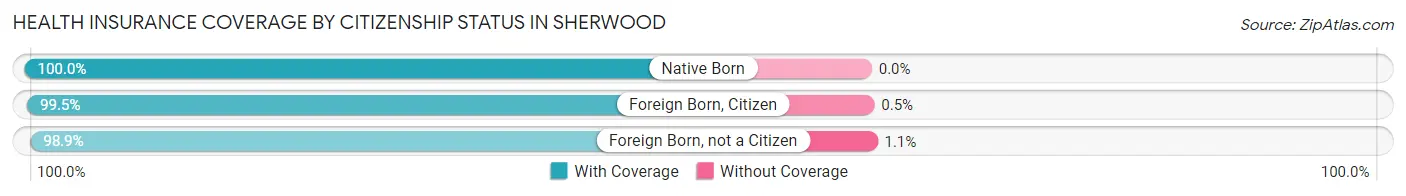
| Citizenship Status | With Coverage | Without Coverage |
| Native Born | 1,335 (100.0%) | 0 (0.0%) |
| Foreign Born, Citizen | 4,927 (99.5%) | 25 (0.5%) |
| Foreign Born, not a Citizen | 1,317 (98.9%) | 15 (1.1%) |
Health Insurance Coverage by Household Income in Sherwood
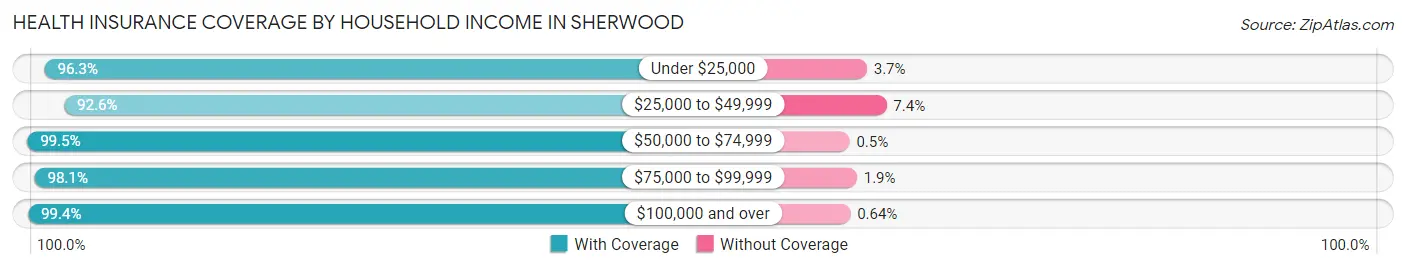
| Household Income | With Coverage | Without Coverage |
| Under $25,000 | 644 (96.3%) | 25 (3.7%) |
| $25,000 to $49,999 | 1,472 (92.6%) | 118 (7.4%) |
| $50,000 to $74,999 | 2,001 (99.5%) | 10 (0.5%) |
| $75,000 to $99,999 | 2,462 (98.1%) | 47 (1.9%) |
| $100,000 and over | 13,305 (99.4%) | 86 (0.6%) |
Public vs Private Health Insurance Coverage by Age in Sherwood
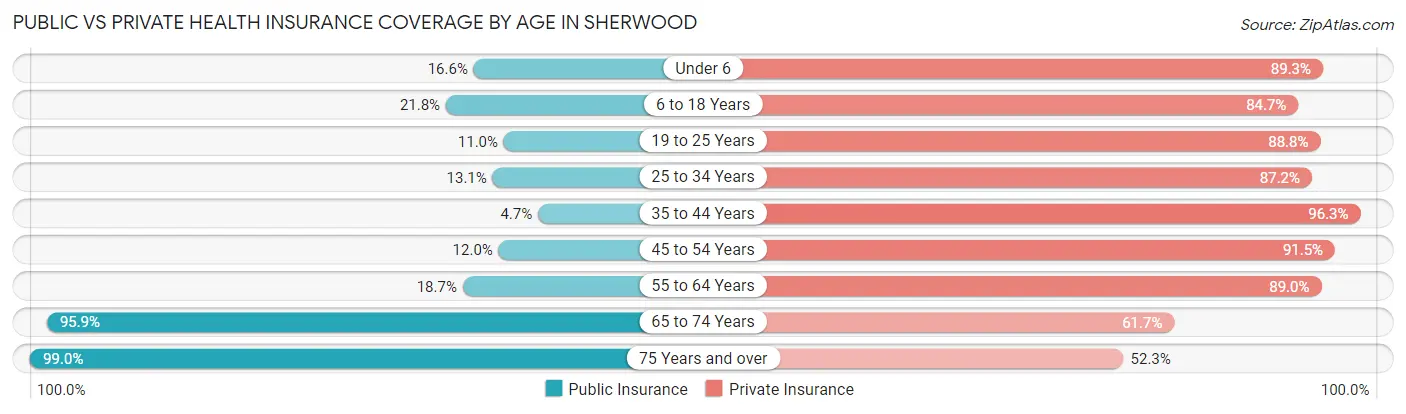
| Age Bracket | Public Insurance | Private Insurance |
| Under 6 | 222 (16.6%) | 1,192 (89.3%) |
| 6 to 18 Years | 1,079 (21.8%) | 4,195 (84.7%) |
| 19 to 25 Years | 147 (11.0%) | 1,183 (88.8%) |
| 25 to 34 Years | 254 (13.1%) | 1,688 (87.2%) |
| 35 to 44 Years | 150 (4.7%) | 3,081 (96.3%) |
| 45 to 54 Years | 428 (12.0%) | 3,263 (91.5%) |
| 55 to 64 Years | 348 (18.7%) | 1,658 (89.0%) |
| 65 to 74 Years | 1,119 (95.9%) | 720 (61.7%) |
| 75 Years and over | 880 (99.0%) | 465 (52.3%) |
| Total | 4,627 (22.9%) | 17,445 (86.2%) |
Disability Status by Sex by Age in Sherwood
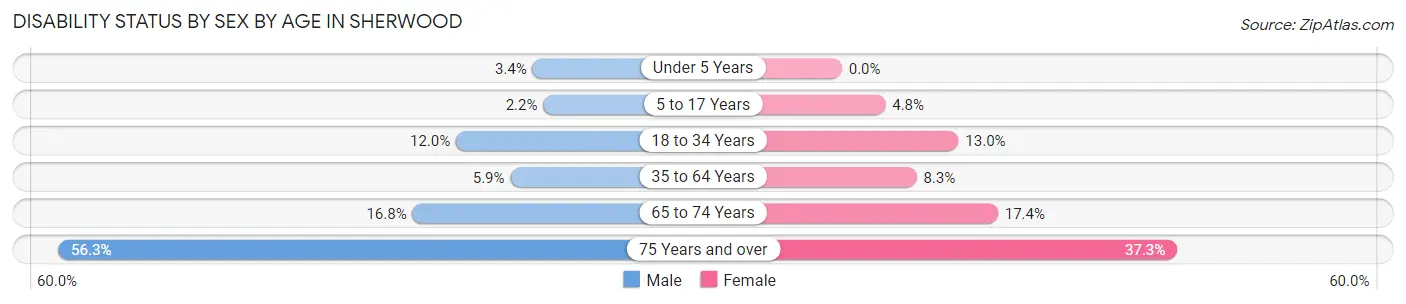
| Age Bracket | Male | Female |
| Under 5 Years | 17 (3.4%) | 0 (0.0%) |
| 5 to 17 Years | 53 (2.2%) | 124 (4.8%) |
| 18 to 34 Years | 233 (11.9%) | 226 (13.0%) |
| 35 to 64 Years | 244 (5.9%) | 374 (8.3%) |
| 65 to 74 Years | 109 (16.8%) | 90 (17.4%) |
| 75 Years and over | 238 (56.3%) | 174 (37.3%) |
Disability Class by Sex by Age in Sherwood
Disability Class: Hearing Difficulty
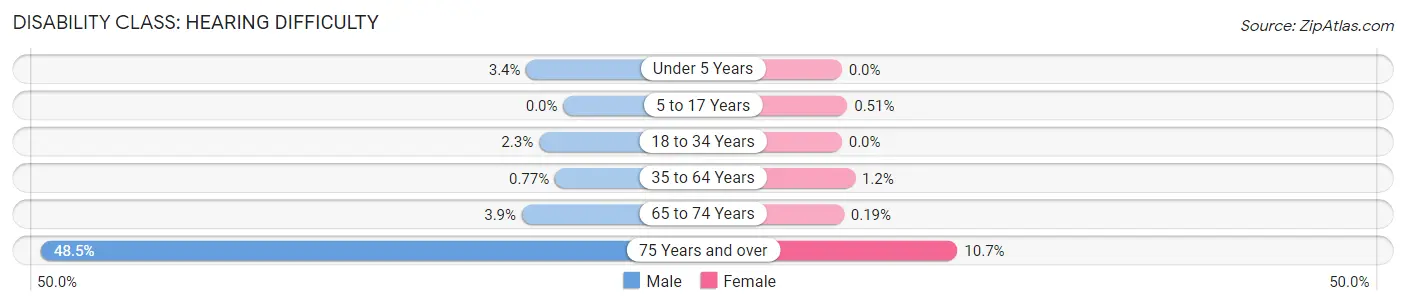
| Age Bracket | Male | Female |
| Under 5 Years | 17 (3.4%) | 0 (0.0%) |
| 5 to 17 Years | 0 (0.0%) | 13 (0.5%) |
| 18 to 34 Years | 44 (2.3%) | 0 (0.0%) |
| 35 to 64 Years | 32 (0.8%) | 55 (1.2%) |
| 65 to 74 Years | 25 (3.8%) | 1 (0.2%) |
| 75 Years and over | 205 (48.5%) | 50 (10.7%) |
Disability Class: Vision Difficulty
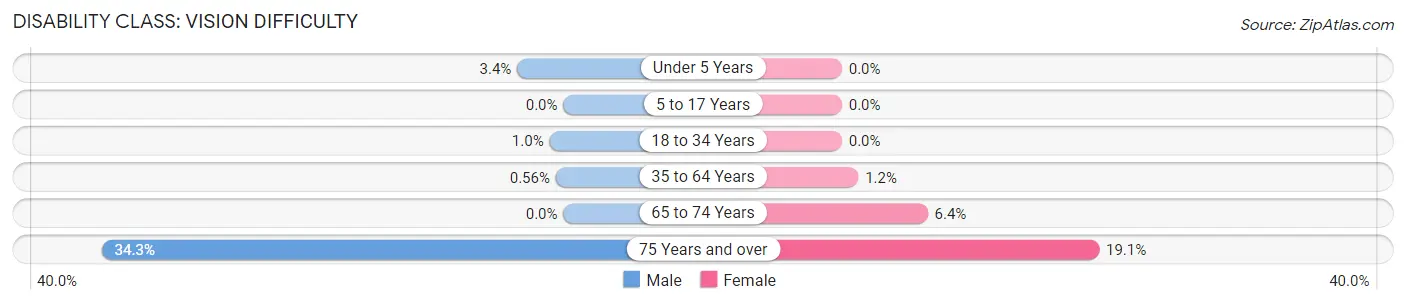
| Age Bracket | Male | Female |
| Under 5 Years | 17 (3.4%) | 0 (0.0%) |
| 5 to 17 Years | 0 (0.0%) | 0 (0.0%) |
| 18 to 34 Years | 20 (1.0%) | 0 (0.0%) |
| 35 to 64 Years | 23 (0.6%) | 55 (1.2%) |
| 65 to 74 Years | 0 (0.0%) | 33 (6.4%) |
| 75 Years and over | 145 (34.3%) | 89 (19.1%) |
Disability Class: Cognitive Difficulty
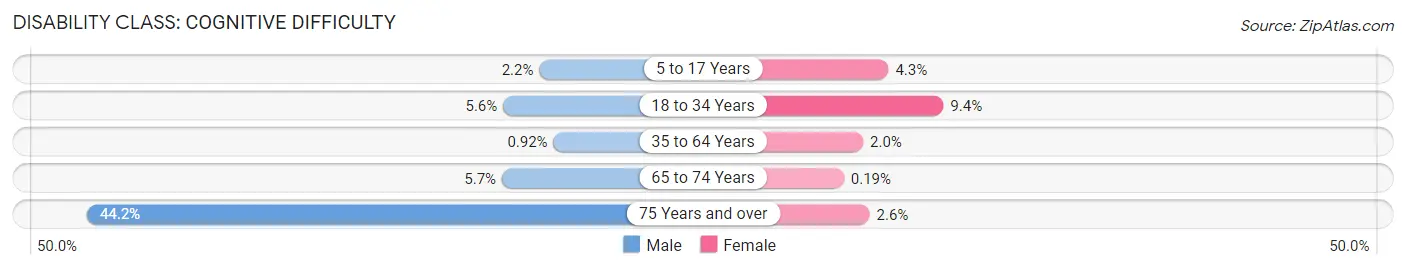
| Age Bracket | Male | Female |
| 5 to 17 Years | 53 (2.2%) | 111 (4.3%) |
| 18 to 34 Years | 109 (5.6%) | 164 (9.4%) |
| 35 to 64 Years | 38 (0.9%) | 89 (2.0%) |
| 65 to 74 Years | 37 (5.7%) | 1 (0.2%) |
| 75 Years and over | 187 (44.2%) | 12 (2.6%) |
Disability Class: Ambulatory Difficulty
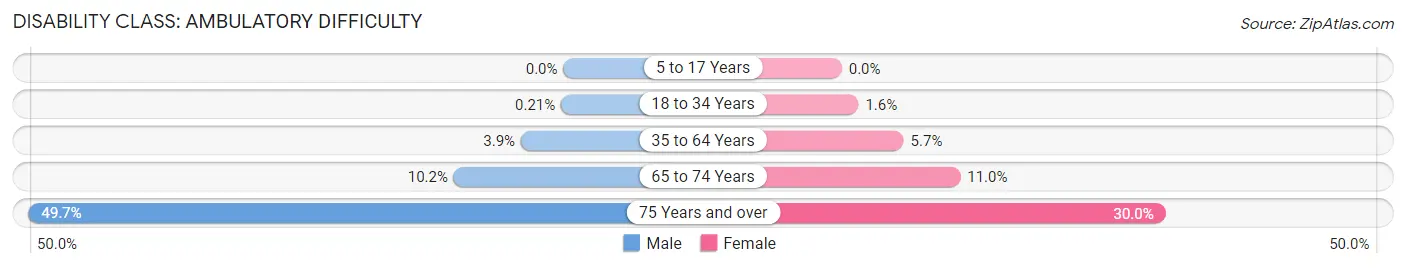
| Age Bracket | Male | Female |
| 5 to 17 Years | 0 (0.0%) | 0 (0.0%) |
| 18 to 34 Years | 4 (0.2%) | 27 (1.5%) |
| 35 to 64 Years | 163 (3.9%) | 258 (5.7%) |
| 65 to 74 Years | 66 (10.2%) | 57 (11.0%) |
| 75 Years and over | 210 (49.6%) | 140 (30.0%) |
Disability Class: Self-Care Difficulty
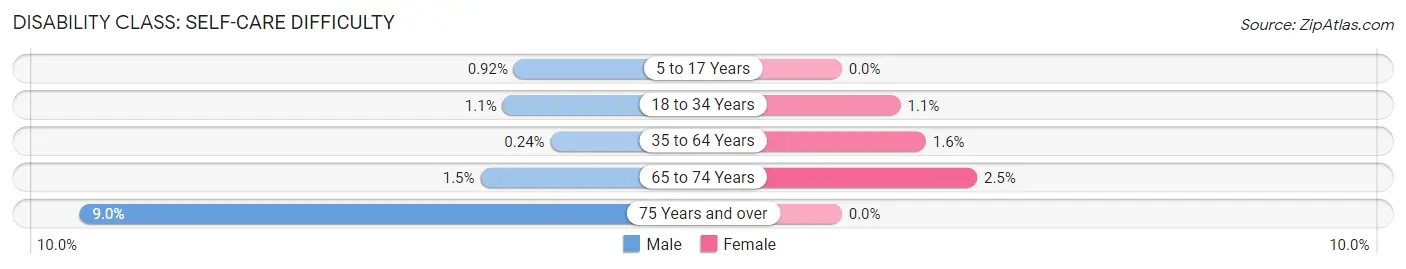
| Age Bracket | Male | Female |
| 5 to 17 Years | 22 (0.9%) | 0 (0.0%) |
| 18 to 34 Years | 22 (1.1%) | 19 (1.1%) |
| 35 to 64 Years | 10 (0.2%) | 70 (1.6%) |
| 65 to 74 Years | 10 (1.5%) | 13 (2.5%) |
| 75 Years and over | 38 (9.0%) | 0 (0.0%) |
Technology Access in Sherwood
Computing Device Access in Sherwood
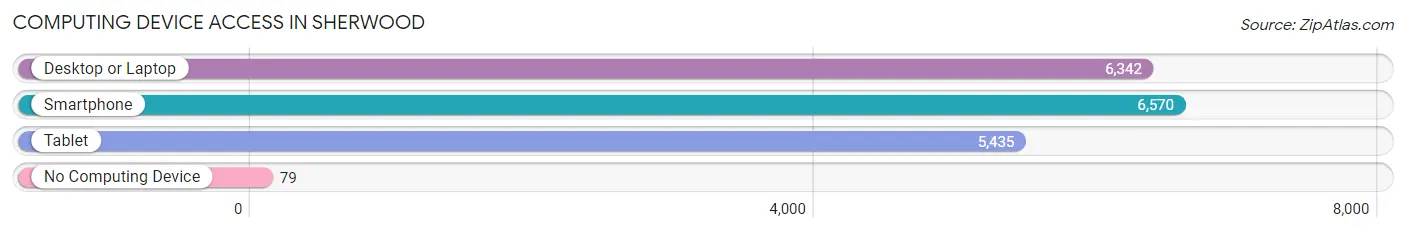
| Device Type | # Households | % Households |
| Desktop or Laptop | 6,342 | 92.9% |
| Smartphone | 6,570 | 96.2% |
| Tablet | 5,435 | 79.6% |
| No Computing Device | 79 | 1.2% |
| Total | 6,829 | 100.0% |
Internet Access in Sherwood
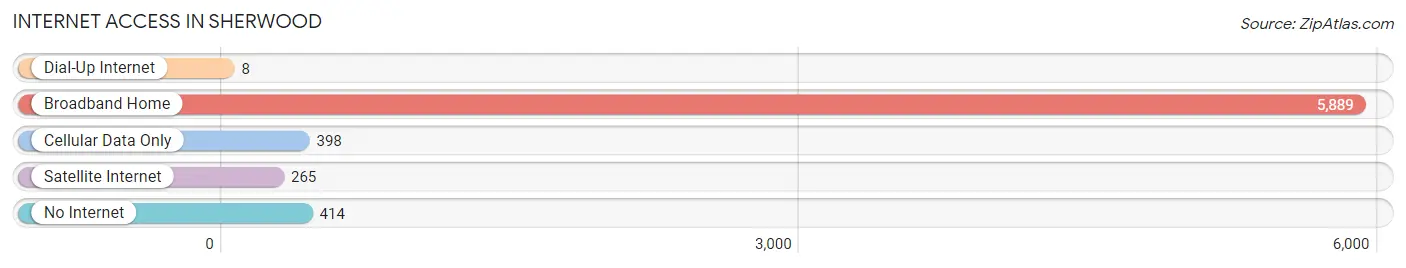
| Internet Type | # Households | % Households |
| Dial-Up Internet | 8 | 0.1% |
| Broadband Home | 5,889 | 86.2% |
| Cellular Data Only | 398 | 5.8% |
| Satellite Internet | 265 | 3.9% |
| No Internet | 414 | 6.1% |
| Total | 6,829 | 100.0% |
Sherwood Summary
Sherwood, Oregon is a city located in Washington County, Oregon, United States. It is located approximately 20 miles southwest of Portland, Oregon. The city was incorporated in 1893 and has a population of approximately 19,000 people.
Geography
Sherwood is located in the Tualatin Valley, which is part of the Willamette Valley. The city is situated on the Tualatin River, which is a tributary of the Willamette River. The city is surrounded by rolling hills and is located in the foothills of the Coast Range. The city has a total area of 8.2 square miles, of which 8.1 square miles is land and 0.1 square miles is water.
Climate
Sherwood has a mild climate with warm summers and cool winters. The average temperature in the summer is around 75 degrees Fahrenheit and the average temperature in the winter is around 40 degrees Fahrenheit. The city receives an average of 37 inches of precipitation per year, with most of it falling in the winter months.
Demographics
As of the 2010 census, the population of Sherwood was 18,194. The racial makeup of the city was 87.3% White, 1.3% African American, 0.7% Native American, 4.2% Asian, 0.2% Pacific Islander, 2.7% from other races, and 3.8% from two or more races. Hispanic or Latino of any race were 6.3% of the population.
Economy
Sherwood is home to a variety of businesses, including manufacturing, retail, and service industries. The city is home to several large employers, including Intel, Nike, and Tektronix. The city also has a thriving agricultural industry, with many local farms producing fruits, vegetables, and dairy products.
The city is also home to several wineries, breweries, and distilleries, as well as a variety of restaurants and shops. The city is also home to several parks and recreational areas, including the Tualatin River National Wildlife Refuge.
History
The area that is now Sherwood was first settled in the early 1800s by pioneers from the Oregon Trail. The city was originally known as Smockville, after the Smock family who were among the first settlers. The city was renamed Sherwood in 1893, after the Sherwood family who had moved to the area in the late 1800s.
The city was officially incorporated in 1893 and has since grown to become a thriving community. The city has a rich history and is home to several historic sites, including the Sherwood Historical Society Museum and the Sherwood Pioneer Cemetery.
Conclusion
Sherwood, Oregon is a city located in Washington County, Oregon, United States. It is located approximately 20 miles southwest of Portland, Oregon. The city was incorporated in 1893 and has a population of approximately 19,000 people. The city is situated on the Tualatin River and is surrounded by rolling hills and is located in the foothills of the Coast Range. The city has a mild climate with warm summers and cool winters. The city is home to a variety of businesses, including manufacturing, retail, and service industries. The city also has a thriving agricultural industry, with many local farms producing fruits, vegetables, and dairy products. The city is also home to several wineries, breweries, and distilleries, as well as a variety of restaurants and shops. The city has a rich history and is home to several historic sites, including the Sherwood Historical Society Museum and the Sherwood Pioneer Cemetery.
Common Questions
What is Per Capita Income in Sherwood?
Per Capita income in Sherwood is $47,030.
What is the Median Family Income in Sherwood?
Median Family Income in Sherwood is $126,723.
What is the Median Household income in Sherwood?
Median Household Income in Sherwood is $109,770.
What is Income or Wage Gap in Sherwood?
Income or Wage Gap in Sherwood is 42.5%.
Women in Sherwood earn 57.5 cents for every dollar earned by a man.
What is Family Income Deficit in Sherwood?
Family Income Deficit in Sherwood is $15,722.
Families that are below poverty line in Sherwood earn $15,722 less on average than the poverty threshold level.
What is Inequality or Gini Index in Sherwood?
Inequality or Gini Index in Sherwood is 0.38.
What is the Total Population of Sherwood?
Total Population of Sherwood is 20,286.
What is the Total Male Population of Sherwood?
Total Male Population of Sherwood is 10,079.
What is the Total Female Population of Sherwood?
Total Female Population of Sherwood is 10,207.
What is the Ratio of Males per 100 Females in Sherwood?
There are 98.75 Males per 100 Females in Sherwood.
What is the Ratio of Females per 100 Males in Sherwood?
There are 101.27 Females per 100 Males in Sherwood.
What is the Median Population Age in Sherwood?
Median Population Age in Sherwood is 36.4 Years.
What is the Average Family Size in Sherwood
Average Family Size in Sherwood is 3.4 People.
What is the Average Household Size in Sherwood
Average Household Size in Sherwood is 3.0 People.
How Large is the Labor Force in Sherwood?
There are 10,431 People in the Labor Forcein in Sherwood.
What is the Percentage of People in the Labor Force in Sherwood?
68.5% of People are in the Labor Force in Sherwood.
What is the Unemployment Rate in Sherwood?
Unemployment Rate in Sherwood is 2.9%.