St Paul, OR Map & Demographics
St Paul Map
St Paul Overview
$43,473
PER CAPITA INCOME
$120,000
AVG FAMILY INCOME
$109,250
AVG HOUSEHOLD INCOME
65.0%
WAGE / INCOME GAP [ % ]
35.0¢/ $1
WAGE / INCOME GAP [ $ ]
0.35
INEQUALITY / GINI INDEX
401
TOTAL POPULATION
190
MALE POPULATION
211
FEMALE POPULATION
90.05
MALES / 100 FEMALES
111.05
FEMALES / 100 MALES
43.1
MEDIAN AGE
3.4
AVG FAMILY SIZE
2.9
AVG HOUSEHOLD SIZE
217
LABOR FORCE [ PEOPLE ]
66.8%
PERCENT IN LABOR FORCE
0.5%
UNEMPLOYMENT RATE
Income in St Paul
Income Overview in St Paul
Per Capita Income in St Paul is $43,473, while median incomes of families and households are $120,000 and $109,250 respectively.
| Characteristic | Number | Measure |
| Per Capita Income | 401 | $43,473 |
| Median Family Income | 102 | $120,000 |
| Mean Family Income | 102 | $133,576 |
| Median Household Income | 137 | $109,250 |
| Mean Household Income | 137 | $120,801 |
| Income Deficit | 102 | $0 |
| Wage / Income Gap (%) | 401 | 65.01% |
| Wage / Income Gap ($) | 401 | 34.99¢ per $1 |
| Gini / Inequality Index | 401 | 0.35 |
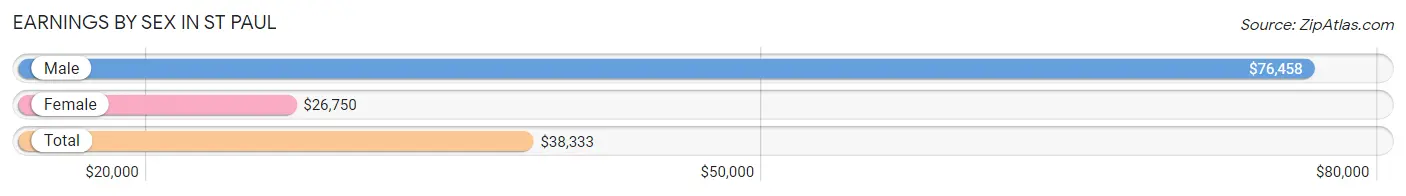
Earnings by Sex in St Paul
Average Earnings in St Paul are $38,333, $76,458 for men and $26,750 for women, a difference of 65.0%.
| Sex | Number | Average Earnings |
| Male | 115 (51.3%) | $76,458 |
| Female | 109 (48.7%) | $26,750 |
| Total | 224 (100.0%) | $38,333 |
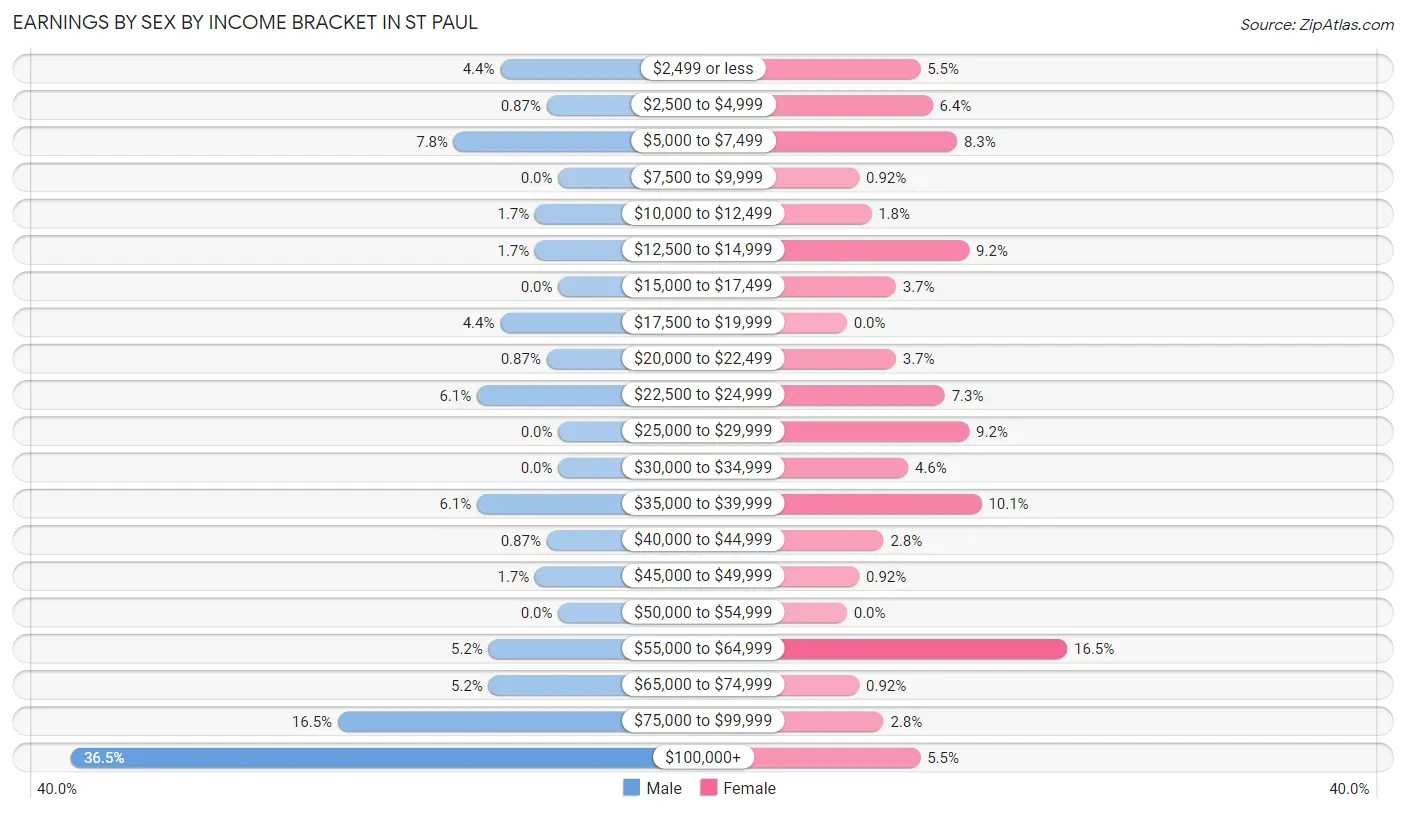
Earnings by Sex by Income Bracket in St Paul
The most common earnings brackets in St Paul are $100,000+ for men (42 | 36.5%) and $55,000 to $64,999 for women (18 | 16.5%).
| Income | Male | Female |
| $2,499 or less | 5 (4.3%) | 6 (5.5%) |
| $2,500 to $4,999 | 1 (0.9%) | 7 (6.4%) |
| $5,000 to $7,499 | 9 (7.8%) | 9 (8.3%) |
| $7,500 to $9,999 | 0 (0.0%) | 1 (0.9%) |
| $10,000 to $12,499 | 2 (1.7%) | 2 (1.8%) |
| $12,500 to $14,999 | 2 (1.7%) | 10 (9.2%) |
| $15,000 to $17,499 | 0 (0.0%) | 4 (3.7%) |
| $17,500 to $19,999 | 5 (4.3%) | 0 (0.0%) |
| $20,000 to $22,499 | 1 (0.9%) | 4 (3.7%) |
| $22,500 to $24,999 | 7 (6.1%) | 8 (7.3%) |
| $25,000 to $29,999 | 0 (0.0%) | 10 (9.2%) |
| $30,000 to $34,999 | 0 (0.0%) | 5 (4.6%) |
| $35,000 to $39,999 | 7 (6.1%) | 11 (10.1%) |
| $40,000 to $44,999 | 1 (0.9%) | 3 (2.8%) |
| $45,000 to $49,999 | 2 (1.7%) | 1 (0.9%) |
| $50,000 to $54,999 | 0 (0.0%) | 0 (0.0%) |
| $55,000 to $64,999 | 6 (5.2%) | 18 (16.5%) |
| $65,000 to $74,999 | 6 (5.2%) | 1 (0.9%) |
| $75,000 to $99,999 | 19 (16.5%) | 3 (2.8%) |
| $100,000+ | 42 (36.5%) | 6 (5.5%) |
| Total | 115 (100.0%) | 109 (100.0%) |
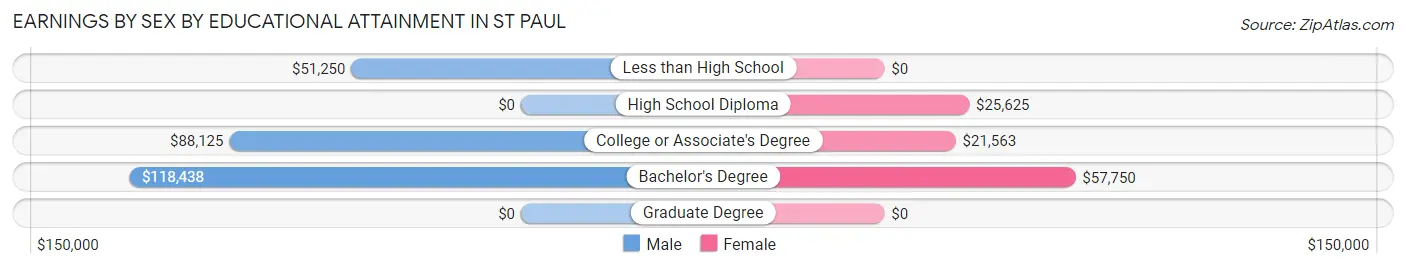
Earnings by Sex by Educational Attainment in St Paul
Average earnings in St Paul are $82,500 for men and $31,250 for women, a difference of 62.1%. Men with an educational attainment of bachelor's degree enjoy the highest average annual earnings of $118,438, while those with less than high school education earn the least with $51,250. Women with an educational attainment of bachelor's degree earn the most with the average annual earnings of $57,750, while those with college or associate's degree education have the smallest earnings of $21,563.
| Educational Attainment | Male Income | Female Income |
| Less than High School | $51,250 | $0 |
| High School Diploma | - | - |
| College or Associate's Degree | $88,125 | $21,563 |
| Bachelor's Degree | $118,438 | $57,750 |
| Graduate Degree | - | - |
| Total | $82,500 | $31,250 |
Family Income in St Paul
Family Income Brackets in St Paul
According to the St Paul family income data, there are 30 families falling into the $100,000 to $149,999 income range, which is the most common income bracket and makes up 29.4% of all families.
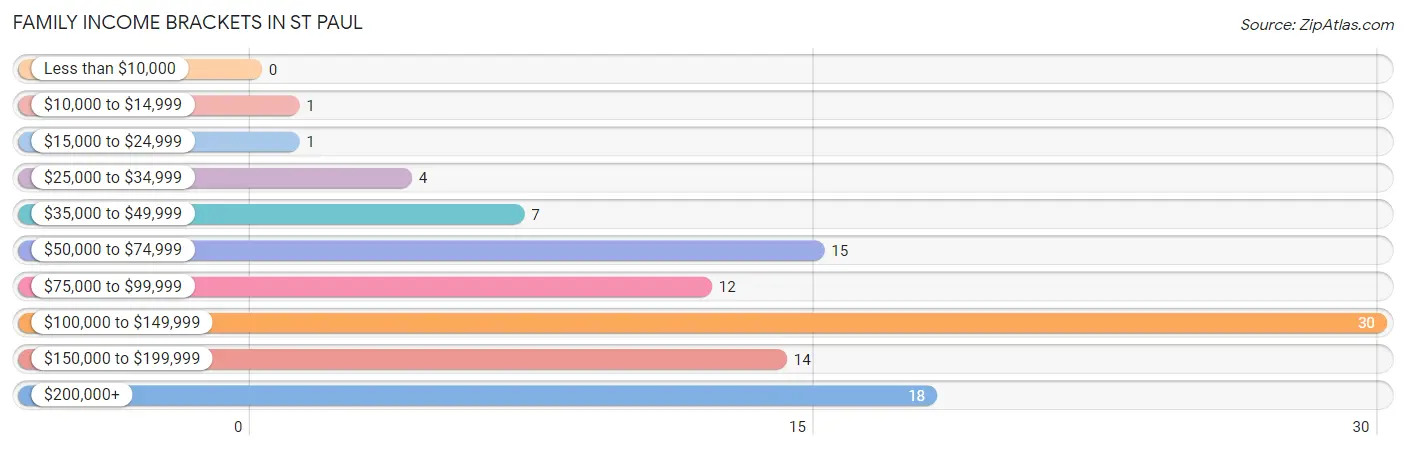
| Income Bracket | # Families | % Families |
| Less than $10,000 | 0 | 0.0% |
| $10,000 to $14,999 | 1 | 1.0% |
| $15,000 to $24,999 | 1 | 1.0% |
| $25,000 to $34,999 | 4 | 3.9% |
| $35,000 to $49,999 | 7 | 6.9% |
| $50,000 to $74,999 | 15 | 14.7% |
| $75,000 to $99,999 | 12 | 11.8% |
| $100,000 to $149,999 | 30 | 29.4% |
| $150,000 to $199,999 | 14 | 13.7% |
| $200,000+ | 18 | 17.6% |
Family Income by Famaliy Size in St Paul
5-person families (12 | 11.8%) account for the highest median family income in St Paul with $194,375 per family, while 3-person families (16 | 15.7%) have the highest median income of $47,083 per family member.
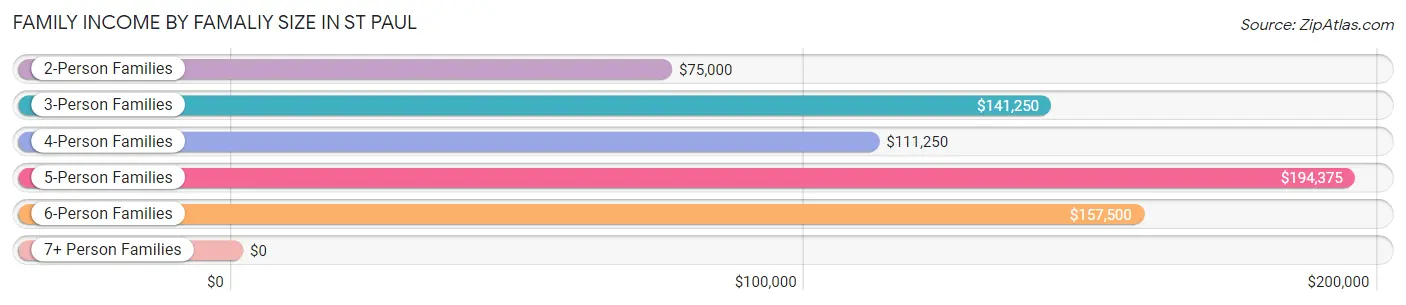
| Income Bracket | # Families | Median Income |
| 2-Person Families | 46 (45.1%) | $75,000 |
| 3-Person Families | 16 (15.7%) | $141,250 |
| 4-Person Families | 20 (19.6%) | $111,250 |
| 5-Person Families | 12 (11.8%) | $194,375 |
| 6-Person Families | 8 (7.8%) | $157,500 |
| 7+ Person Families | 0 (0.0%) | $0 |
| Total | 102 (100.0%) | $120,000 |
Family Income by Number of Earners in St Paul
The median family income in St Paul is $120,000, with families comprising 3+ earners (21) having the highest median family income of $193,281, while families with no earners (20) have the lowest median family income of $61,667, accounting for 20.6% and 19.6% of families, respectively.
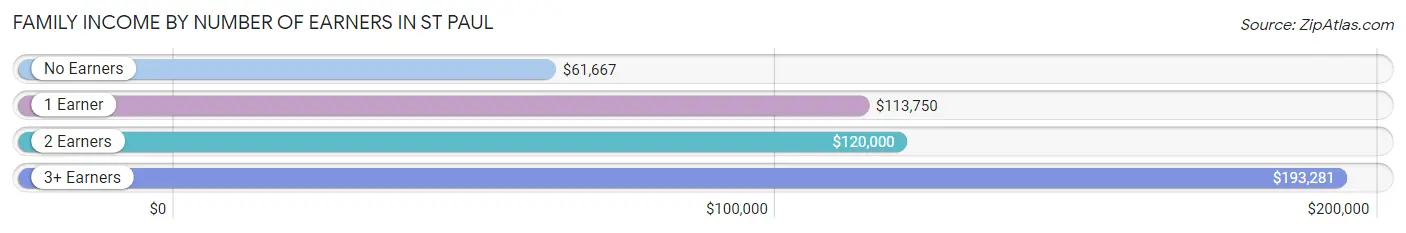
| Number of Earners | # Families | Median Income |
| No Earners | 20 (19.6%) | $61,667 |
| 1 Earner | 15 (14.7%) | $113,750 |
| 2 Earners | 46 (45.1%) | $120,000 |
| 3+ Earners | 21 (20.6%) | $193,281 |
| Total | 102 (100.0%) | $120,000 |
Household Income in St Paul
Household Income Brackets in St Paul
With 36 households falling in the category, the $100,000 to $149,999 income range is the most frequent in St Paul, accounting for 26.3% of all households. In contrast, only 1 households (0.7%) fall into the $10,000 to $14,999 income bracket, making it the least populous group.
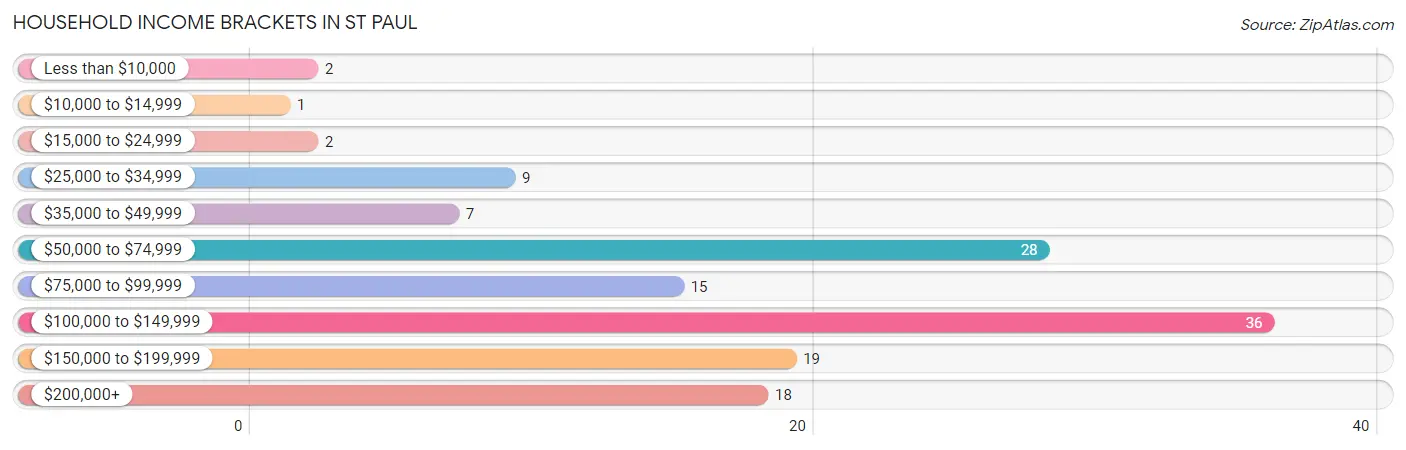
| Income Bracket | # Households | % Households |
| Less than $10,000 | 2 | 1.5% |
| $10,000 to $14,999 | 1 | 0.7% |
| $15,000 to $24,999 | 2 | 1.5% |
| $25,000 to $34,999 | 9 | 6.6% |
| $35,000 to $49,999 | 7 | 5.1% |
| $50,000 to $74,999 | 28 | 20.4% |
| $75,000 to $99,999 | 15 | 10.9% |
| $100,000 to $149,999 | 36 | 26.3% |
| $150,000 to $199,999 | 19 | 13.9% |
| $200,000+ | 18 | 13.1% |
Household Income by Householder Age in St Paul
The median household income in St Paul is $109,250, with the highest median household income of $123,750 found in the 45 to 64 years age bracket for the primary householder. A total of 56 households (40.9%) fall into this category. Meanwhile, the 15 to 24 years age bracket for the primary householder has the lowest median household income of $0, with 1 households (0.7%) in this group.
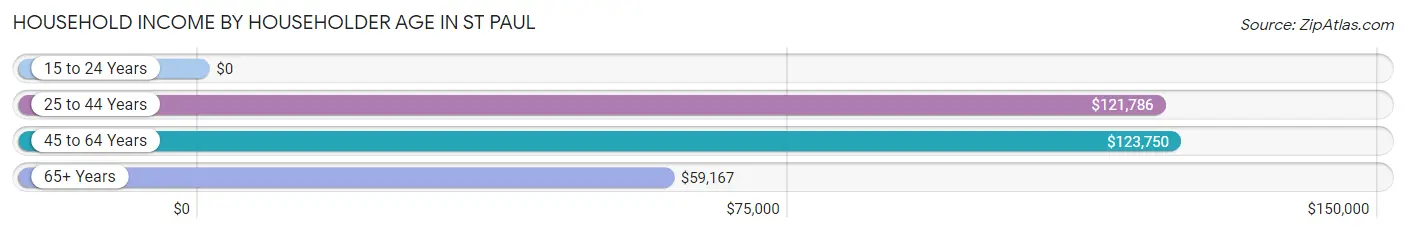
| Income Bracket | # Households | Median Income |
| 15 to 24 Years | 1 (0.7%) | $0 |
| 25 to 44 Years | 42 (30.7%) | $121,786 |
| 45 to 64 Years | 56 (40.9%) | $123,750 |
| 65+ Years | 38 (27.7%) | $59,167 |
| Total | 137 (100.0%) | $109,250 |
Poverty in St Paul
Income Below Poverty by Sex and Age in St Paul
With 8.4% poverty level for males and 3.8% for females among the residents of St Paul, 25 to 34 year old males and 16 and 17 year old females are the most vulnerable to poverty, with 8 males (21.6%) and 3 females (75.0%) in their respective age groups living below the poverty level.
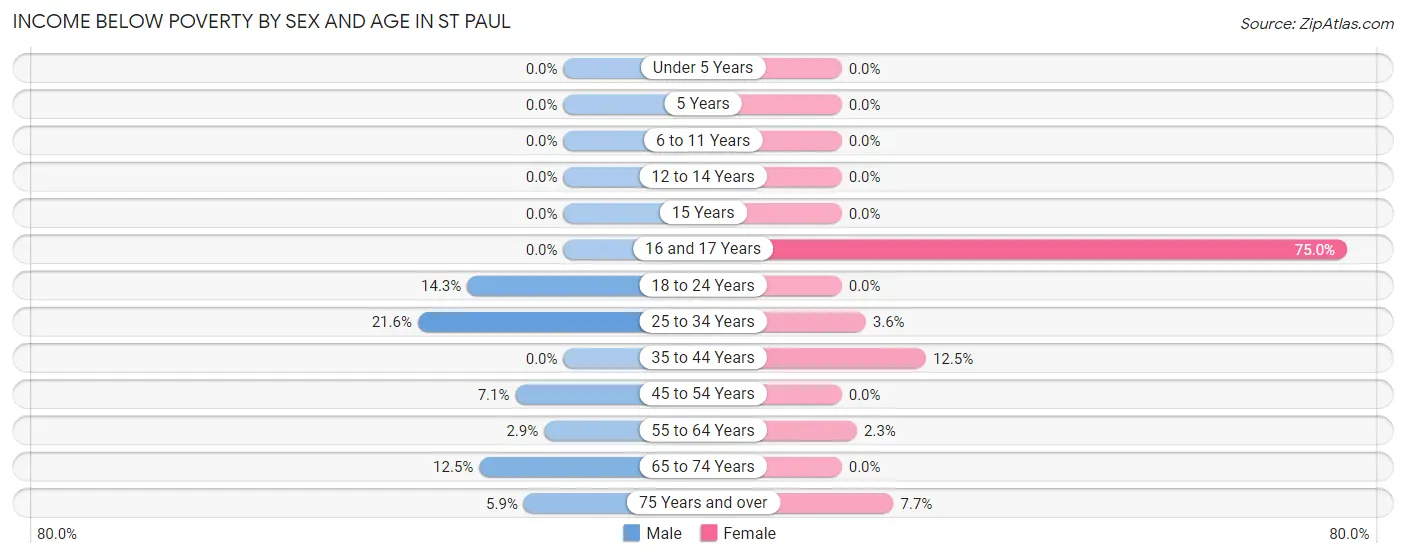
| Age Bracket | Male | Female |
| Under 5 Years | 0 (0.0%) | 0 (0.0%) |
| 5 Years | 0 (0.0%) | 0 (0.0%) |
| 6 to 11 Years | 0 (0.0%) | 0 (0.0%) |
| 12 to 14 Years | 0 (0.0%) | 0 (0.0%) |
| 15 Years | 0 (0.0%) | 0 (0.0%) |
| 16 and 17 Years | 0 (0.0%) | 3 (75.0%) |
| 18 to 24 Years | 2 (14.3%) | 0 (0.0%) |
| 25 to 34 Years | 8 (21.6%) | 1 (3.6%) |
| 35 to 44 Years | 0 (0.0%) | 2 (12.5%) |
| 45 to 54 Years | 2 (7.1%) | 0 (0.0%) |
| 55 to 64 Years | 1 (2.9%) | 1 (2.3%) |
| 65 to 74 Years | 2 (12.5%) | 0 (0.0%) |
| 75 Years and over | 1 (5.9%) | 1 (7.7%) |
| Total | 16 (8.4%) | 8 (3.8%) |
Income Above Poverty by Sex and Age in St Paul
According to the poverty statistics in St Paul, males aged under 5 years and females aged under 5 years are the age groups that are most secure financially, with 100.0% of males and 100.0% of females in these age groups living above the poverty line.
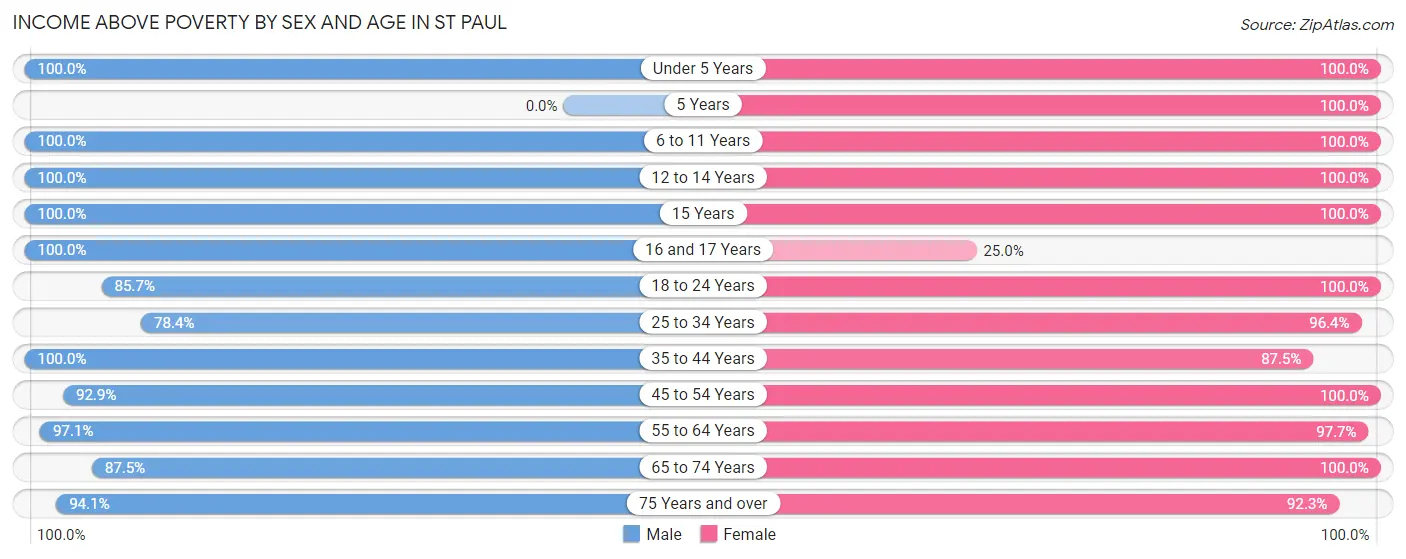
| Age Bracket | Male | Female |
| Under 5 Years | 9 (100.0%) | 5 (100.0%) |
| 5 Years | 0 (0.0%) | 8 (100.0%) |
| 6 to 11 Years | 9 (100.0%) | 31 (100.0%) |
| 12 to 14 Years | 6 (100.0%) | 1 (100.0%) |
| 15 Years | 3 (100.0%) | 4 (100.0%) |
| 16 and 17 Years | 5 (100.0%) | 1 (25.0%) |
| 18 to 24 Years | 12 (85.7%) | 16 (100.0%) |
| 25 to 34 Years | 29 (78.4%) | 27 (96.4%) |
| 35 to 44 Years | 11 (100.0%) | 14 (87.5%) |
| 45 to 54 Years | 26 (92.9%) | 19 (100.0%) |
| 55 to 64 Years | 34 (97.1%) | 43 (97.7%) |
| 65 to 74 Years | 14 (87.5%) | 22 (100.0%) |
| 75 Years and over | 16 (94.1%) | 12 (92.3%) |
| Total | 174 (91.6%) | 203 (96.2%) |
Income Below Poverty Among Married-Couple Families in St Paul
The poverty statistics for married-couple families in St Paul show that 3.1% or 3 of the total 98 families live below the poverty line. Families with 1 or 2 children have the highest poverty rate of 6.2%, comprising of 2 families. On the other hand, families with 3 or 4 children have the lowest poverty rate of 0.0%, which includes 0 families.
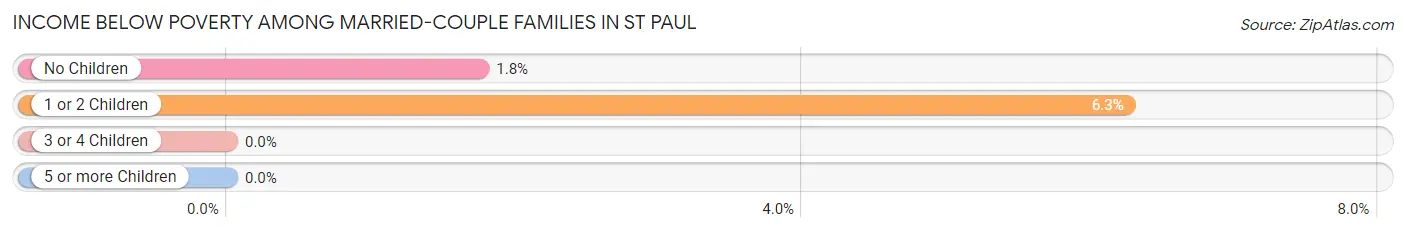
| Children | Above Poverty | Below Poverty |
| No Children | 56 (98.3%) | 1 (1.8%) |
| 1 or 2 Children | 30 (93.8%) | 2 (6.2%) |
| 3 or 4 Children | 9 (100.0%) | 0 (0.0%) |
| 5 or more Children | 0 (0.0%) | 0 (0.0%) |
| Total | 95 (96.9%) | 3 (3.1%) |
Income Below Poverty Among Single-Parent Households in St Paul
| Children | Single Father | Single Mother |
| No Children | 0 (0.0%) | 0 (0.0%) |
| 1 or 2 Children | 0 (0.0%) | 0 (0.0%) |
| 3 or 4 Children | 0 (0.0%) | 0 (0.0%) |
| 5 or more Children | 0 (0.0%) | 0 (0.0%) |
| Total | 0 (0.0%) | 0 (0.0%) |
Income Below Poverty Among Married-Couple vs Single-Parent Households in St Paul
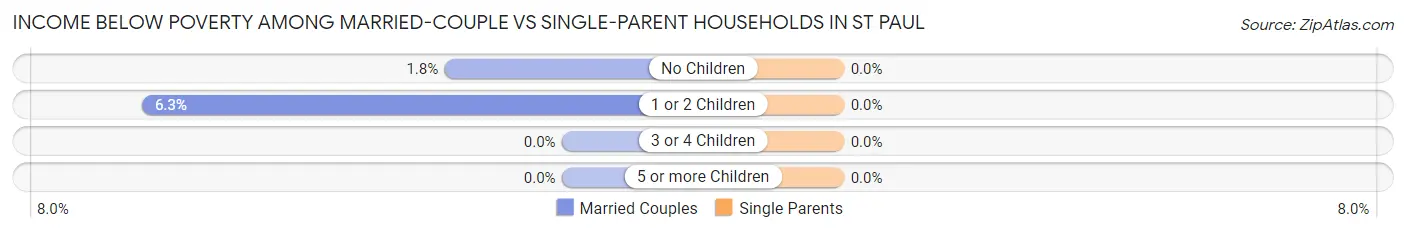
| Children | Married-Couple Families | Single-Parent Households |
| No Children | 1 (1.8%) | 0 (0.0%) |
| 1 or 2 Children | 2 (6.2%) | 0 (0.0%) |
| 3 or 4 Children | 0 (0.0%) | 0 (0.0%) |
| 5 or more Children | 0 (0.0%) | 0 (0.0%) |
| Total | 3 (3.1%) | 0 (0.0%) |
Race in St Paul
The most populous races in St Paul are White / Caucasian (341 | 85.0%), Hispanic or Latino (78 | 19.5%), and Two or more Races (38 | 9.5%).

| Race | # Population | % Population |
| Asian | 2 | 0.5% |
| Black / African American | 0 | 0.0% |
| Hawaiian / Pacific | 0 | 0.0% |
| Hispanic or Latino | 78 | 19.5% |
| Native / Alaskan | 0 | 0.0% |
| White / Caucasian | 341 | 85.0% |
| Two or more Races | 38 | 9.5% |
| Some other Race | 20 | 5.0% |
| Total | 401 | 100.0% |
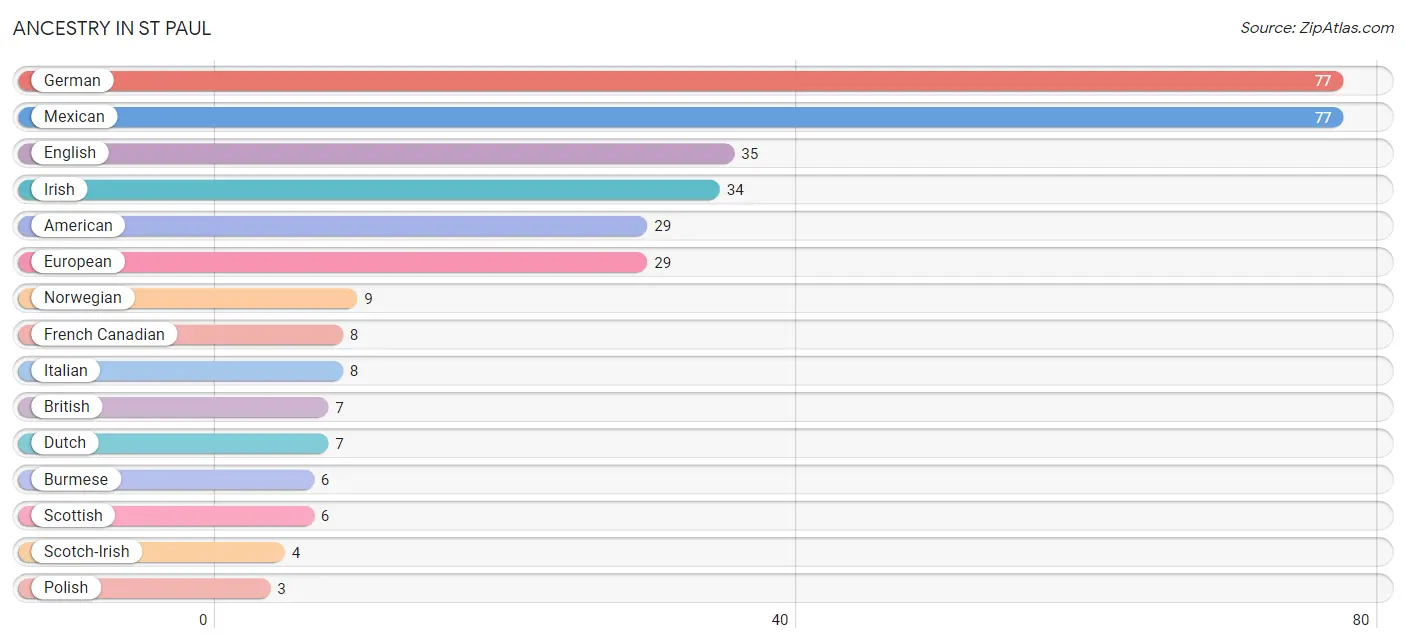
Ancestry in St Paul
The most populous ancestries reported in St Paul are German (77 | 19.2%), Mexican (77 | 19.2%), English (35 | 8.7%), Irish (34 | 8.5%), and American (29 | 7.2%), together accounting for 62.8% of all St Paul residents.
| Ancestry | # Population | % Population |
| American | 29 | 7.2% |
| Belgian | 2 | 0.5% |
| Bhutanese | 1 | 0.3% |
| Brazilian | 1 | 0.3% |
| British | 7 | 1.8% |
| Burmese | 6 | 1.5% |
| Delaware | 2 | 0.5% |
| Dutch | 7 | 1.8% |
| English | 35 | 8.7% |
| European | 29 | 7.2% |
| Finnish | 2 | 0.5% |
| French | 1 | 0.3% |
| French Canadian | 8 | 2.0% |
| German | 77 | 19.2% |
| Irish | 34 | 8.5% |
| Italian | 8 | 2.0% |
| Mexican | 77 | 19.2% |
| Norwegian | 9 | 2.2% |
| Polish | 3 | 0.7% |
| Puerto Rican | 1 | 0.3% |
| Scotch-Irish | 4 | 1.0% |
| Scottish | 6 | 1.5% |
| Swiss | 2 | 0.5% | View All 23 Rows |
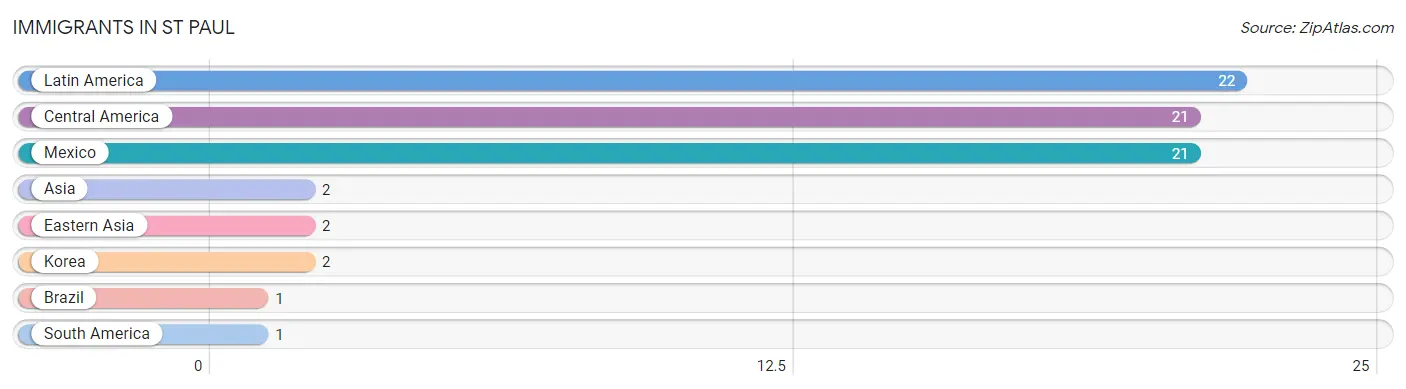
Immigrants in St Paul
The most numerous immigrant groups reported in St Paul came from Latin America (22 | 5.5%), Central America (21 | 5.2%), Mexico (21 | 5.2%), Asia (2 | 0.5%), and Eastern Asia (2 | 0.5%), together accounting for 17.0% of all St Paul residents.
| Immigration Origin | # Population | % Population |
| Asia | 2 | 0.5% |
| Brazil | 1 | 0.3% |
| Central America | 21 | 5.2% |
| Eastern Asia | 2 | 0.5% |
| Korea | 2 | 0.5% |
| Latin America | 22 | 5.5% |
| Mexico | 21 | 5.2% |
| South America | 1 | 0.3% | View All 8 Rows |
Sex and Age in St Paul
Sex and Age in St Paul
The most populous age groups in St Paul are 30 to 34 Years (19 | 10.0%) for men and 55 to 59 Years (32 | 15.2%) for women.
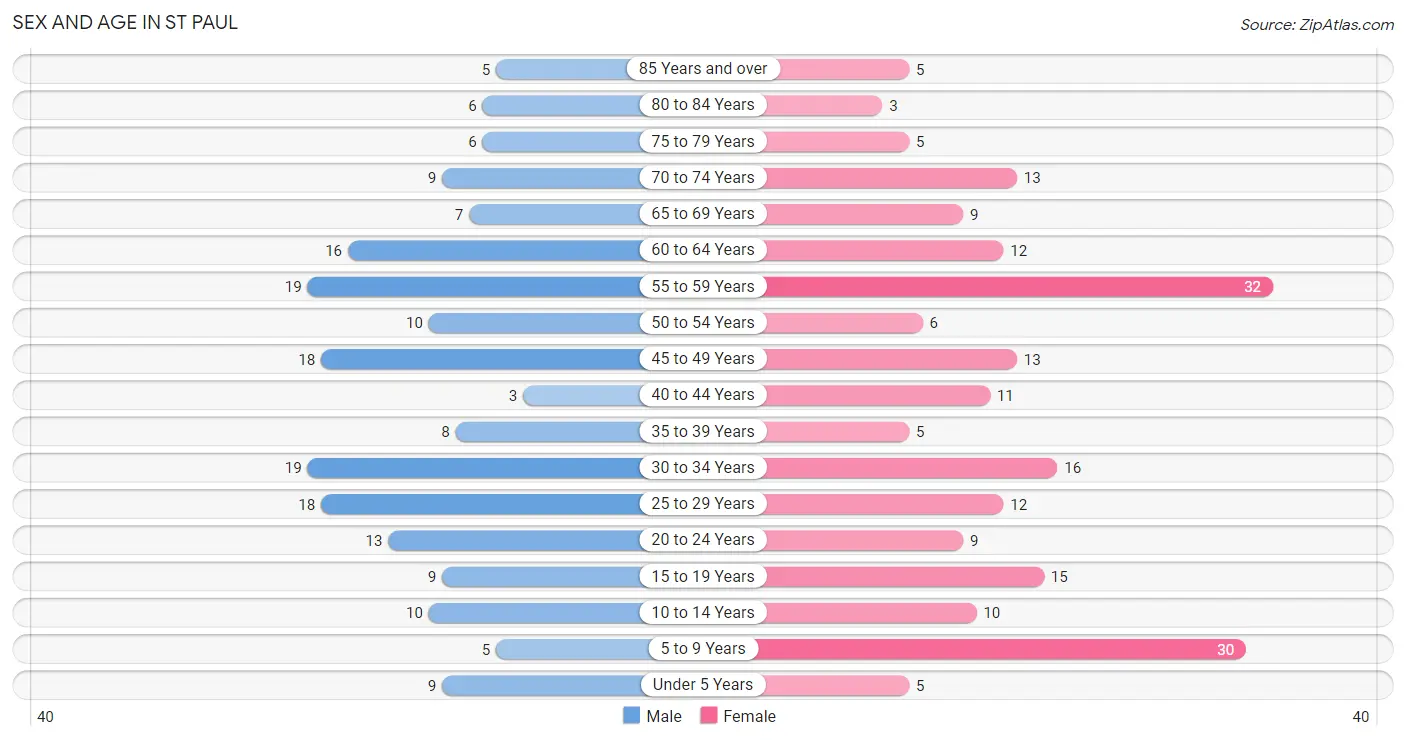
| Age Bracket | Male | Female |
| Under 5 Years | 9 (4.7%) | 5 (2.4%) |
| 5 to 9 Years | 5 (2.6%) | 30 (14.2%) |
| 10 to 14 Years | 10 (5.3%) | 10 (4.7%) |
| 15 to 19 Years | 9 (4.7%) | 15 (7.1%) |
| 20 to 24 Years | 13 (6.8%) | 9 (4.3%) |
| 25 to 29 Years | 18 (9.5%) | 12 (5.7%) |
| 30 to 34 Years | 19 (10.0%) | 16 (7.6%) |
| 35 to 39 Years | 8 (4.2%) | 5 (2.4%) |
| 40 to 44 Years | 3 (1.6%) | 11 (5.2%) |
| 45 to 49 Years | 18 (9.5%) | 13 (6.2%) |
| 50 to 54 Years | 10 (5.3%) | 6 (2.8%) |
| 55 to 59 Years | 19 (10.0%) | 32 (15.2%) |
| 60 to 64 Years | 16 (8.4%) | 12 (5.7%) |
| 65 to 69 Years | 7 (3.7%) | 9 (4.3%) |
| 70 to 74 Years | 9 (4.7%) | 13 (6.2%) |
| 75 to 79 Years | 6 (3.2%) | 5 (2.4%) |
| 80 to 84 Years | 6 (3.2%) | 3 (1.4%) |
| 85 Years and over | 5 (2.6%) | 5 (2.4%) |
| Total | 190 (100.0%) | 211 (100.0%) |
Families and Households in St Paul
Median Family Size in St Paul
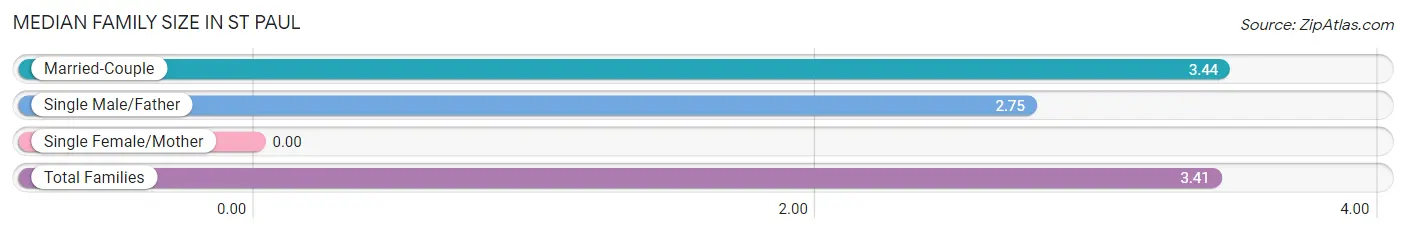
| Family Type | # Families | Family Size |
| Married-Couple | 98 (96.1%) | 3.44 |
| Single Male/Father | 4 (3.9%) | 2.75 |
| Single Female/Mother | 0 (0.0%) | - |
| Total Families | 102 (100.0%) | 3.41 |
Median Household Size in St Paul
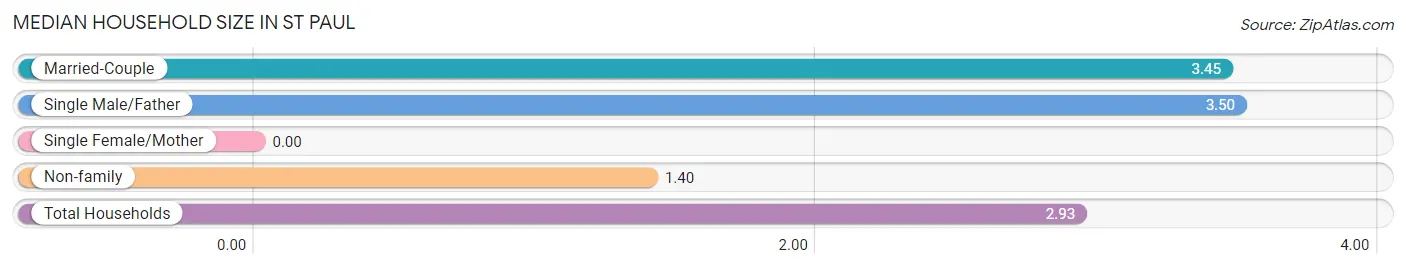
| Household Type | # Households | Household Size |
| Married-Couple | 98 (71.5%) | 3.45 |
| Single Male/Father | 4 (2.9%) | 3.50 |
| Single Female/Mother | 0 (0.0%) | - |
| Non-family | 35 (25.6%) | 1.40 |
| Total Households | 137 (100.0%) | 2.93 |
Household Size by Marriage Status in St Paul
Out of a total of 137 households in St Paul, 102 (74.5%) are family households, while 35 (25.6%) are nonfamily households. The most numerous type of family households are 2-person households, comprising 44, and the most common type of nonfamily households are 1-person households, comprising 26.
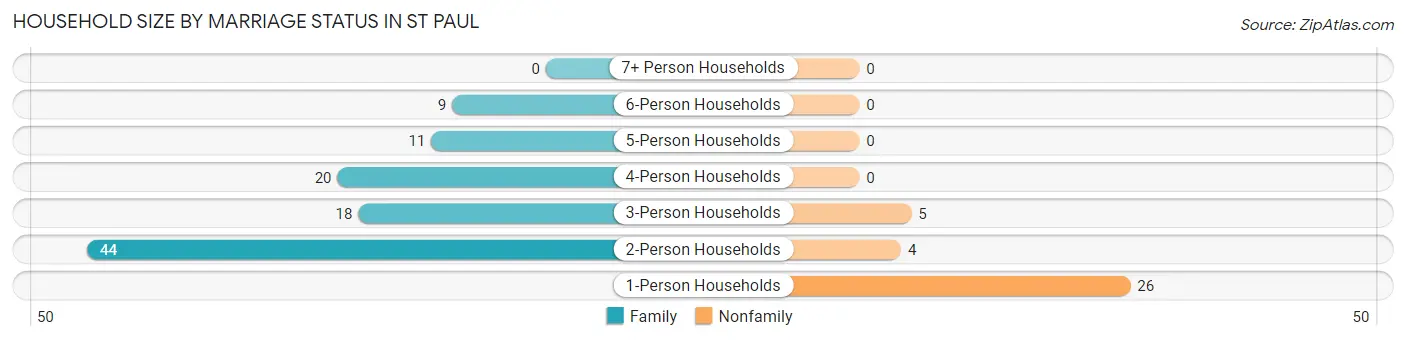
| Household Size | Family Households | Nonfamily Households |
| 1-Person Households | - | 26 (19.0%) |
| 2-Person Households | 44 (32.1%) | 4 (2.9%) |
| 3-Person Households | 18 (13.1%) | 5 (3.6%) |
| 4-Person Households | 20 (14.6%) | 0 (0.0%) |
| 5-Person Households | 11 (8.0%) | 0 (0.0%) |
| 6-Person Households | 9 (6.6%) | 0 (0.0%) |
| 7+ Person Households | 0 (0.0%) | 0 (0.0%) |
| Total | 102 (74.5%) | 35 (25.6%) |
Female Fertility in St Paul
Fertility by Age in St Paul
Average fertility rate in St Paul is 24.0 births per 1,000 women. Women in the age bracket of 20 to 34 years have the highest fertility rate with 54.0 births per 1,000 women. Women in the age bracket of 20 to 34 years acount for 100.0% of all women with births.
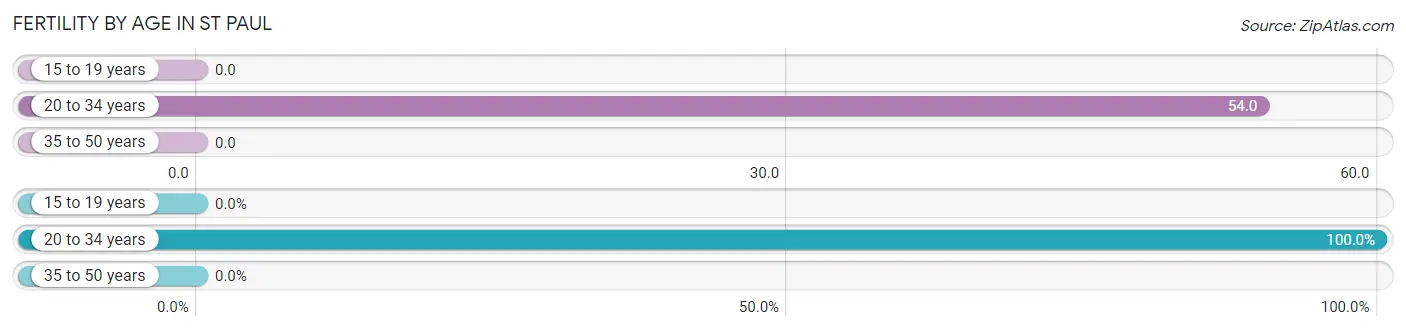
| Age Bracket | Women with Births | Births / 1,000 Women |
| 15 to 19 years | 0 (0.0%) | 0.0 |
| 20 to 34 years | 2 (100.0%) | 54.0 |
| 35 to 50 years | 0 (0.0%) | 0.0 |
| Total | 2 (100.0%) | 24.0 |
Fertility by Age by Marriage Status in St Paul
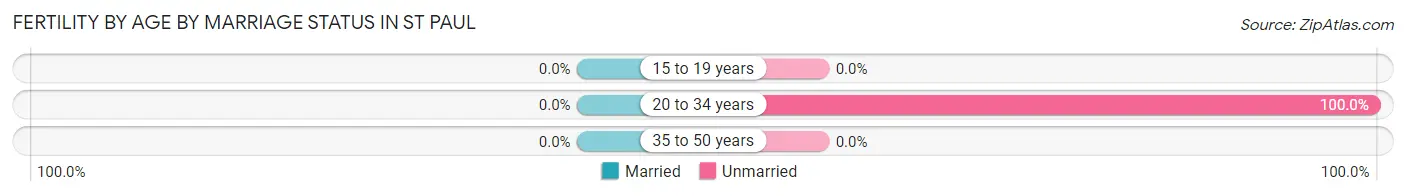
| Age Bracket | Married | Unmarried |
| 15 to 19 years | 0 (0.0%) | 0 (0.0%) |
| 20 to 34 years | 0 (0.0%) | 2 (100.0%) |
| 35 to 50 years | 0 (0.0%) | 0 (0.0%) |
| Total | 0 (0.0%) | 2 (100.0%) |
Fertility by Education in St Paul
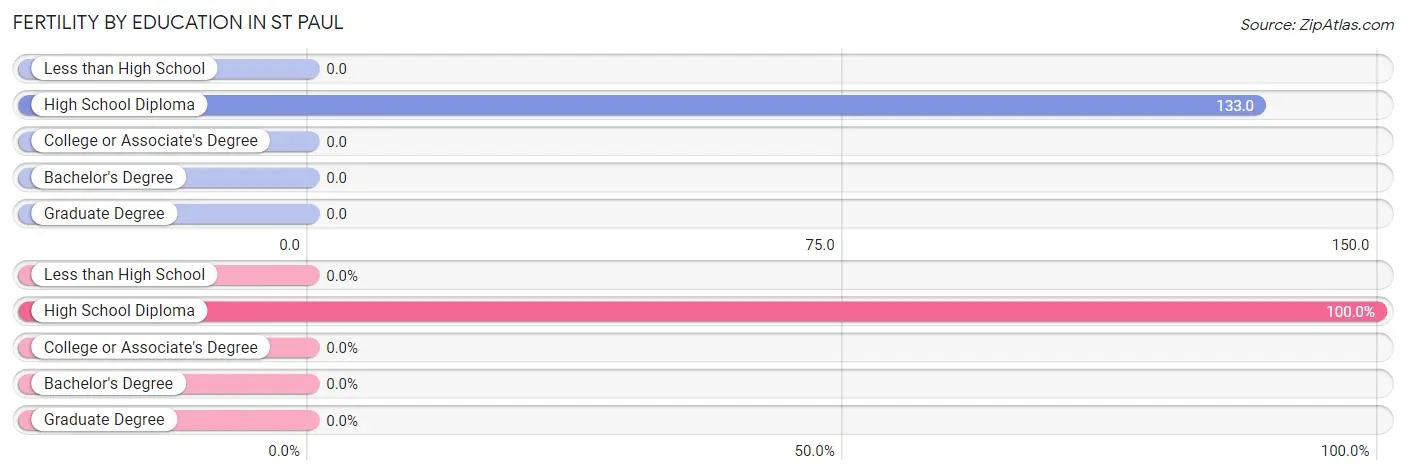
| Educational Attainment | Women with Births | Births / 1,000 Women |
| Less than High School | 0 (0.0%) | 0.0 |
| High School Diploma | 2 (100.0%) | 133.0 |
| College or Associate's Degree | 0 (0.0%) | 0.0 |
| Bachelor's Degree | 0 (0.0%) | 0.0 |
| Graduate Degree | 0 (0.0%) | 0.0 |
| Total | 2 (100.0%) | 24.0 |
Fertility by Education by Marriage Status in St Paul
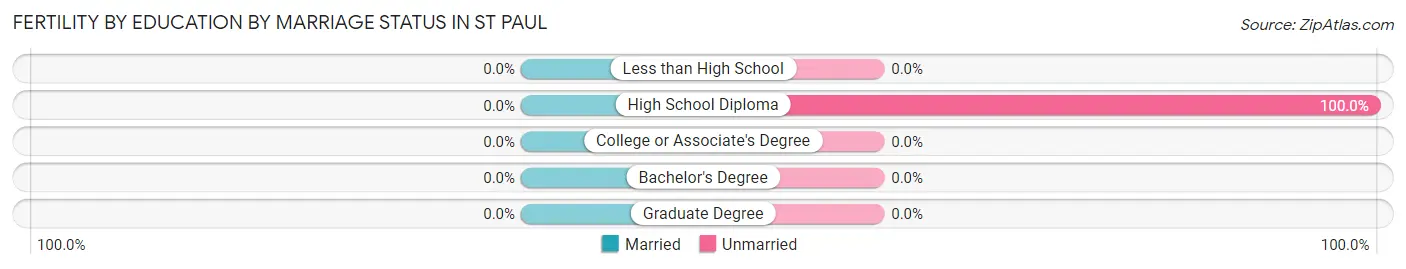
| Educational Attainment | Married | Unmarried |
| Less than High School | 0 (0.0%) | 0 (0.0%) |
| High School Diploma | 0 (0.0%) | 2 (100.0%) |
| College or Associate's Degree | 0 (0.0%) | 0 (0.0%) |
| Bachelor's Degree | 0 (0.0%) | 0 (0.0%) |
| Graduate Degree | 0 (0.0%) | 0 (0.0%) |
| Total | 0 (0.0%) | 2 (100.0%) |
Employment Characteristics in St Paul
Employment by Class of Employer in St Paul
Among the 204 employed individuals in St Paul, private company employees (135 | 66.2%), local government employees (23 | 11.3%), and not-for-profit organizations (20 | 9.8%) make up the most common classes of employment.
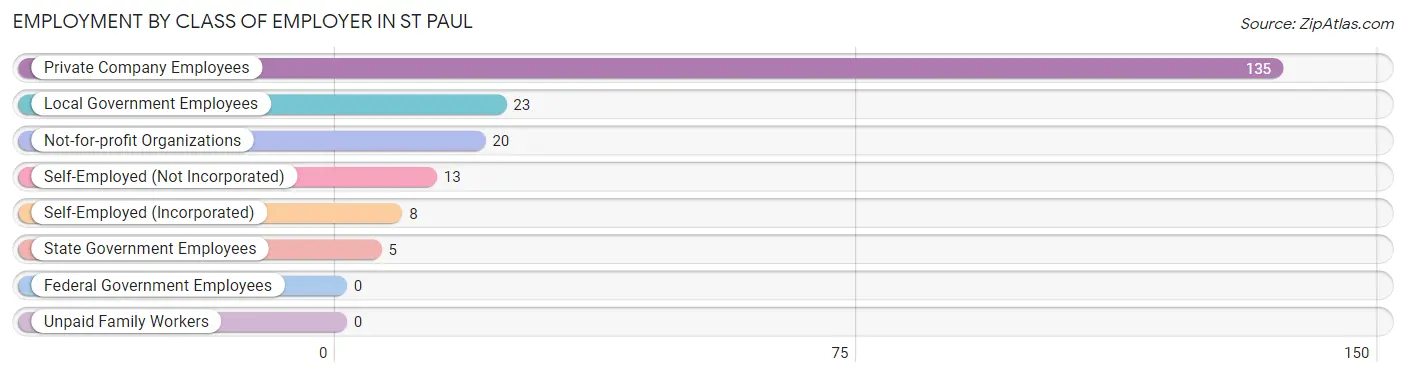
| Employer Class | # Employees | % Employees |
| Private Company Employees | 135 | 66.2% |
| Self-Employed (Incorporated) | 8 | 3.9% |
| Self-Employed (Not Incorporated) | 13 | 6.4% |
| Not-for-profit Organizations | 20 | 9.8% |
| Local Government Employees | 23 | 11.3% |
| State Government Employees | 5 | 2.5% |
| Federal Government Employees | 0 | 0.0% |
| Unpaid Family Workers | 0 | 0.0% |
| Total | 204 | 100.0% |
Employment Status by Age in St Paul
According to the labor force statistics for St Paul, out of the total population over 16 years of age (325), 66.8% or 217 individuals are in the labor force, with 0.5% or 1 of them unemployed. The age group with the highest labor force participation rate is 35 to 44 years, with 96.3% or 26 individuals in the labor force. Within the labor force, the 60 to 64 years age range has the highest percentage of unemployed individuals, with 5.3% or 1 of them being unemployed.
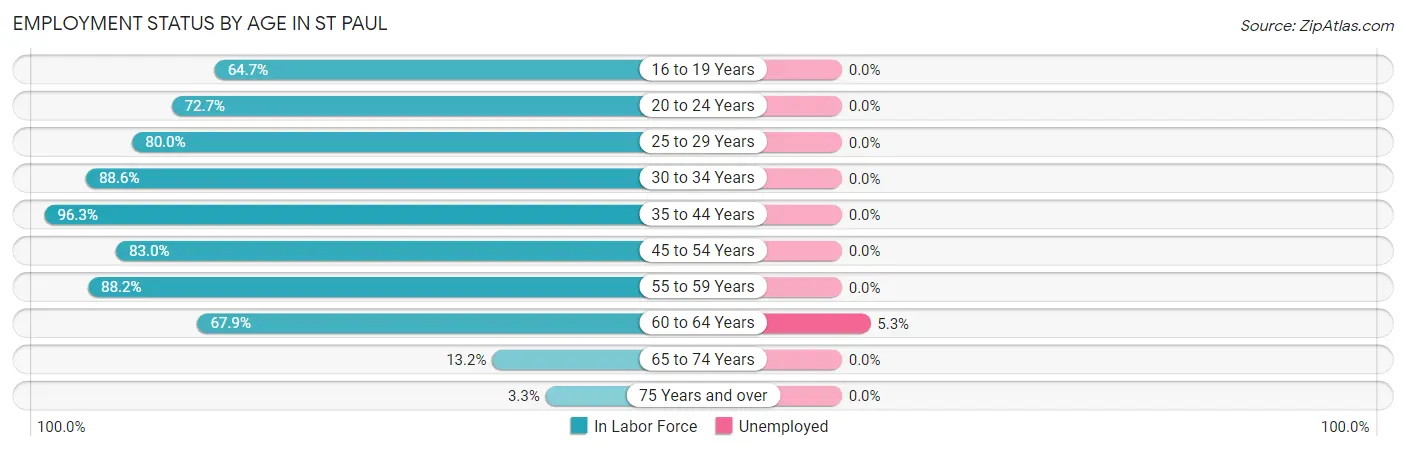
| Age Bracket | In Labor Force | Unemployed |
| 16 to 19 Years | 11 (64.7%) | 0 (0.0%) |
| 20 to 24 Years | 16 (72.7%) | 0 (0.0%) |
| 25 to 29 Years | 24 (80.0%) | 0 (0.0%) |
| 30 to 34 Years | 31 (88.6%) | 0 (0.0%) |
| 35 to 44 Years | 26 (96.3%) | 0 (0.0%) |
| 45 to 54 Years | 39 (83.0%) | 0 (0.0%) |
| 55 to 59 Years | 45 (88.2%) | 0 (0.0%) |
| 60 to 64 Years | 19 (67.9%) | 1 (5.3%) |
| 65 to 74 Years | 5 (13.2%) | 0 (0.0%) |
| 75 Years and over | 1 (3.3%) | 0 (0.0%) |
| Total | 217 (66.8%) | 1 (0.5%) |
Employment Status by Educational Attainment in St Paul
According to labor force statistics for St Paul, 84.4% of individuals (184) out of the total population between 25 and 64 years of age (218) are in the labor force, with 0.5% or 1 of them being unemployed. The group with the highest labor force participation rate are those with the educational attainment of less than high school, with 100.0% or 4 individuals in the labor force. Within the labor force, individuals with college / associate degree education have the highest percentage of unemployment, with 1.6% or 1 of them being unemployed.
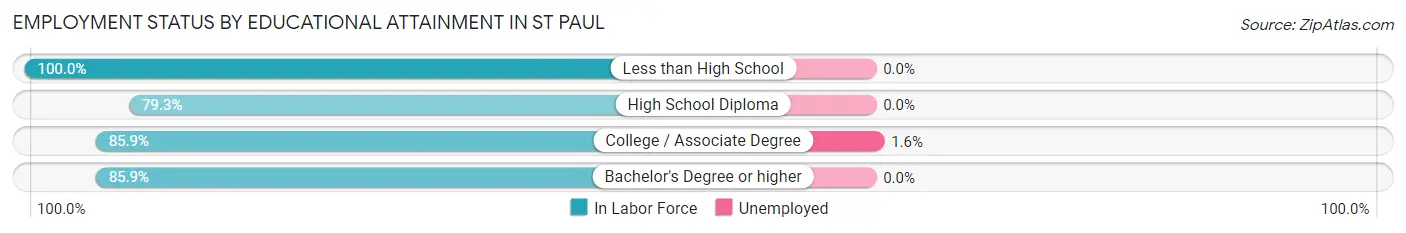
| Educational Attainment | In Labor Force | Unemployed |
| Less than High School | 4 (100.0%) | 0 (0.0%) |
| High School Diploma | 46 (79.3%) | 0 (0.0%) |
| College / Associate Degree | 61 (85.9%) | 1 (1.6%) |
| Bachelor's Degree or higher | 73 (85.9%) | 0 (0.0%) |
| Total | 184 (84.4%) | 1 (0.5%) |
Employment Occupations by Sex in St Paul
Management, Business, Science and Arts Occupations
The most common Management, Business, Science and Arts occupations in St Paul are Management (28 | 13.0%), Community & Social Service (18 | 8.3%), Education Instruction & Library (16 | 7.4%), Business & Financial (9 | 4.2%), and Health Diagnosing & Treating (5 | 2.3%).
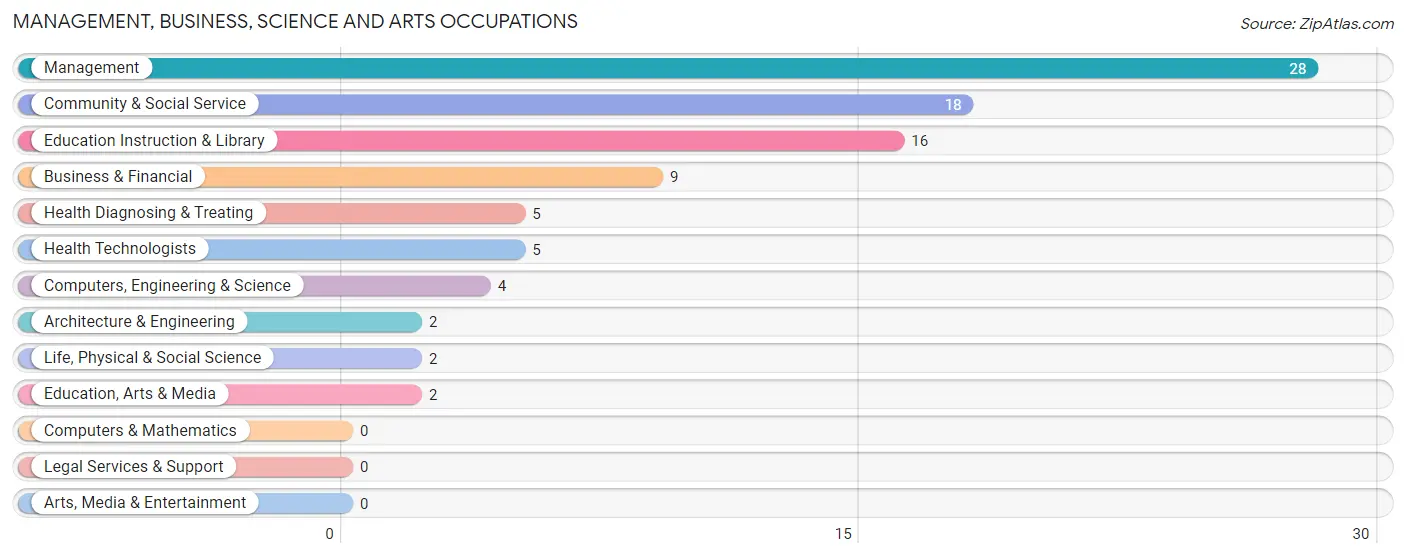
Management, Business, Science and Arts Occupations by Sex
Within the Management, Business, Science and Arts occupations in St Paul, the most male-oriented occupations are Architecture & Engineering (100.0%), Business & Financial (88.9%), and Management (75.0%), while the most female-oriented occupations are Education, Arts & Media (100.0%), Health Diagnosing & Treating (100.0%), and Health Technologists (100.0%).
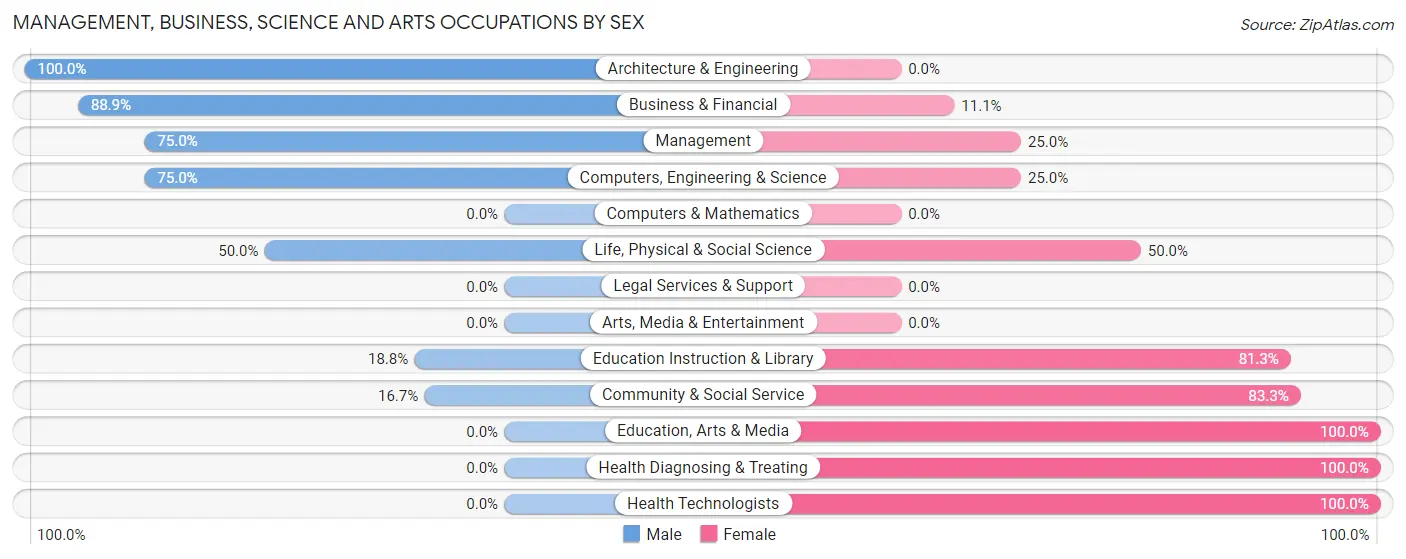
| Occupation | Male | Female |
| Management | 21 (75.0%) | 7 (25.0%) |
| Business & Financial | 8 (88.9%) | 1 (11.1%) |
| Computers, Engineering & Science | 3 (75.0%) | 1 (25.0%) |
| Computers & Mathematics | 0 (0.0%) | 0 (0.0%) |
| Architecture & Engineering | 2 (100.0%) | 0 (0.0%) |
| Life, Physical & Social Science | 1 (50.0%) | 1 (50.0%) |
| Community & Social Service | 3 (16.7%) | 15 (83.3%) |
| Education, Arts & Media | 0 (0.0%) | 2 (100.0%) |
| Legal Services & Support | 0 (0.0%) | 0 (0.0%) |
| Education Instruction & Library | 3 (18.8%) | 13 (81.2%) |
| Arts, Media & Entertainment | 0 (0.0%) | 0 (0.0%) |
| Health Diagnosing & Treating | 0 (0.0%) | 5 (100.0%) |
| Health Technologists | 0 (0.0%) | 5 (100.0%) |
| Total (Category) | 35 (54.7%) | 29 (45.3%) |
| Total (Overall) | 111 (51.4%) | 105 (48.6%) |
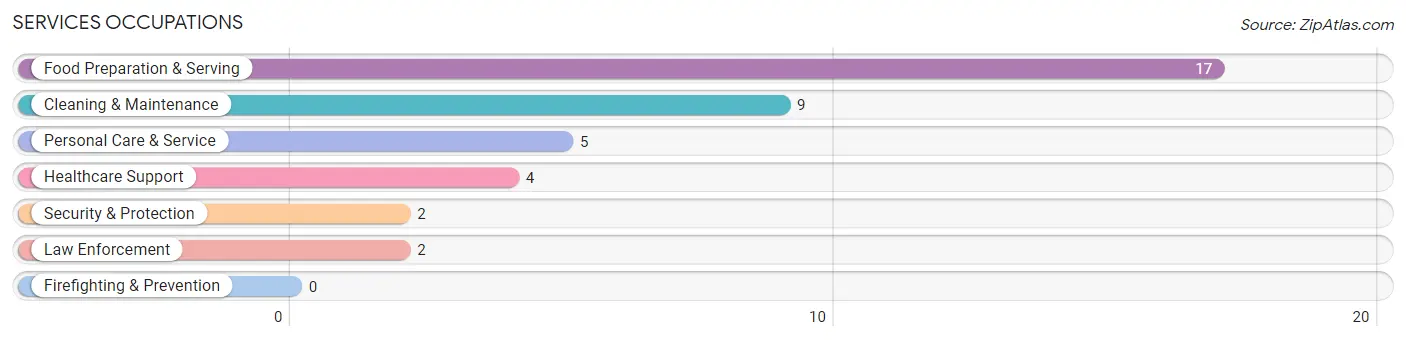
Services Occupations
The most common Services occupations in St Paul are Food Preparation & Serving (17 | 7.9%), Cleaning & Maintenance (9 | 4.2%), Personal Care & Service (5 | 2.3%), Healthcare Support (4 | 1.8%), and Security & Protection (2 | 0.9%).
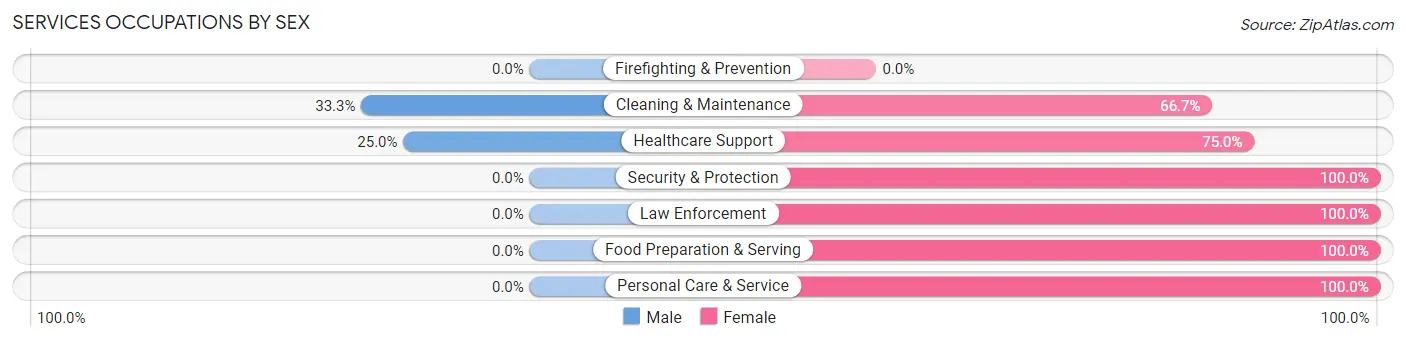
Services Occupations by Sex
Within the Services occupations in St Paul, the most male-oriented occupations are Cleaning & Maintenance (33.3%), and Healthcare Support (25.0%), while the most female-oriented occupations are Security & Protection (100.0%), Law Enforcement (100.0%), and Food Preparation & Serving (100.0%).
| Occupation | Male | Female |
| Healthcare Support | 1 (25.0%) | 3 (75.0%) |
| Security & Protection | 0 (0.0%) | 2 (100.0%) |
| Firefighting & Prevention | 0 (0.0%) | 0 (0.0%) |
| Law Enforcement | 0 (0.0%) | 2 (100.0%) |
| Food Preparation & Serving | 0 (0.0%) | 17 (100.0%) |
| Cleaning & Maintenance | 3 (33.3%) | 6 (66.7%) |
| Personal Care & Service | 0 (0.0%) | 5 (100.0%) |
| Total (Category) | 4 (10.8%) | 33 (89.2%) |
| Total (Overall) | 111 (51.4%) | 105 (48.6%) |
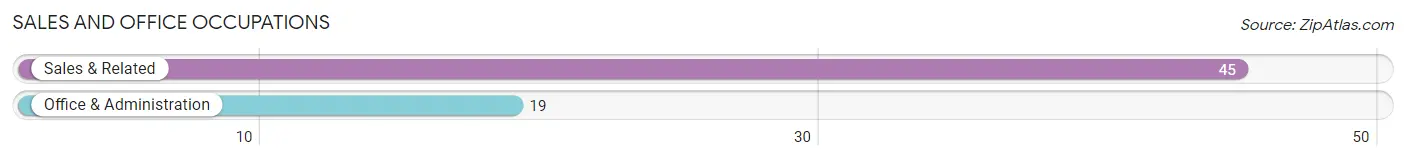
Sales and Office Occupations
The most common Sales and Office occupations in St Paul are Sales & Related (45 | 20.8%), and Office & Administration (19 | 8.8%).
Sales and Office Occupations by Sex
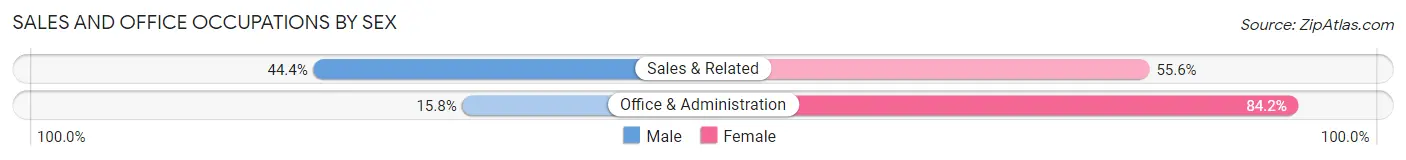
| Occupation | Male | Female |
| Sales & Related | 20 (44.4%) | 25 (55.6%) |
| Office & Administration | 3 (15.8%) | 16 (84.2%) |
| Total (Category) | 23 (35.9%) | 41 (64.1%) |
| Total (Overall) | 111 (51.4%) | 105 (48.6%) |
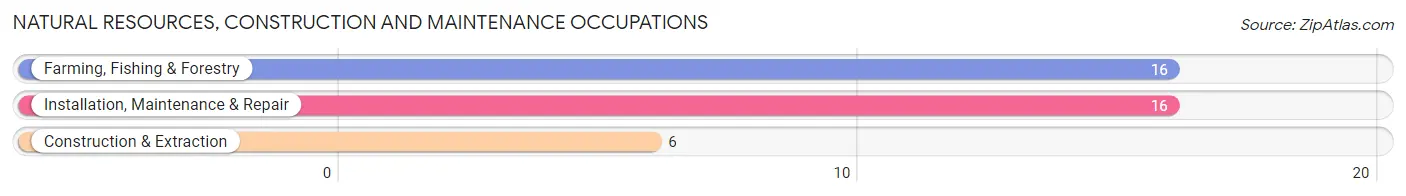
Natural Resources, Construction and Maintenance Occupations
The most common Natural Resources, Construction and Maintenance occupations in St Paul are Farming, Fishing & Forestry (16 | 7.4%), Installation, Maintenance & Repair (16 | 7.4%), and Construction & Extraction (6 | 2.8%).
Natural Resources, Construction and Maintenance Occupations by Sex
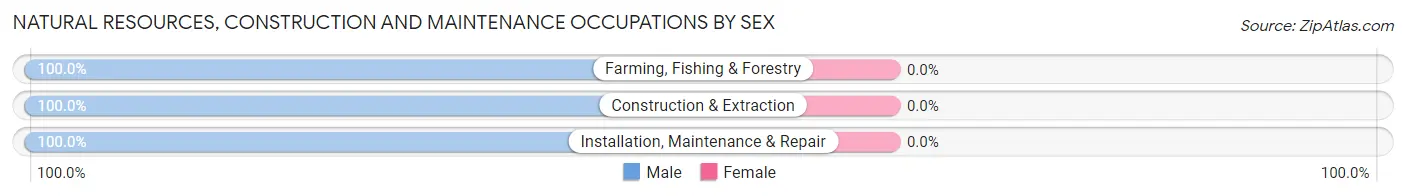
| Occupation | Male | Female |
| Farming, Fishing & Forestry | 16 (100.0%) | 0 (0.0%) |
| Construction & Extraction | 6 (100.0%) | 0 (0.0%) |
| Installation, Maintenance & Repair | 16 (100.0%) | 0 (0.0%) |
| Total (Category) | 38 (100.0%) | 0 (0.0%) |
| Total (Overall) | 111 (51.4%) | 105 (48.6%) |
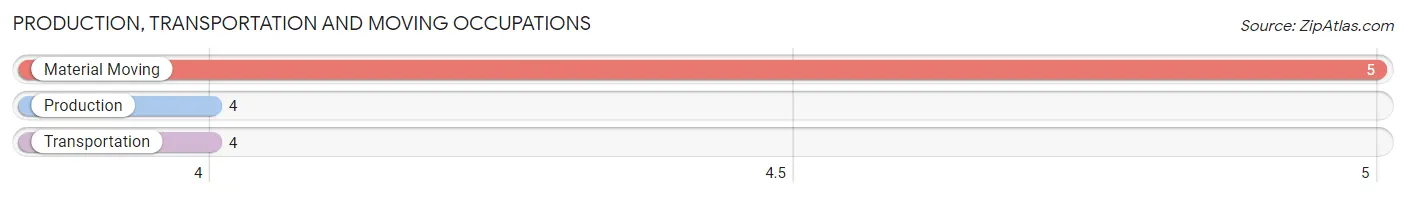
Production, Transportation and Moving Occupations
The most common Production, Transportation and Moving occupations in St Paul are Material Moving (5 | 2.3%), Production (4 | 1.8%), and Transportation (4 | 1.8%).
Production, Transportation and Moving Occupations by Sex
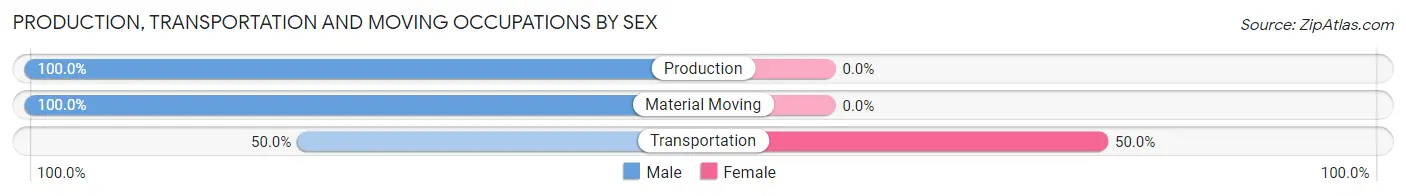
| Occupation | Male | Female |
| Production | 4 (100.0%) | 0 (0.0%) |
| Transportation | 2 (50.0%) | 2 (50.0%) |
| Material Moving | 5 (100.0%) | 0 (0.0%) |
| Total (Category) | 11 (84.6%) | 2 (15.4%) |
| Total (Overall) | 111 (51.4%) | 105 (48.6%) |
Employment Industries by Sex in St Paul
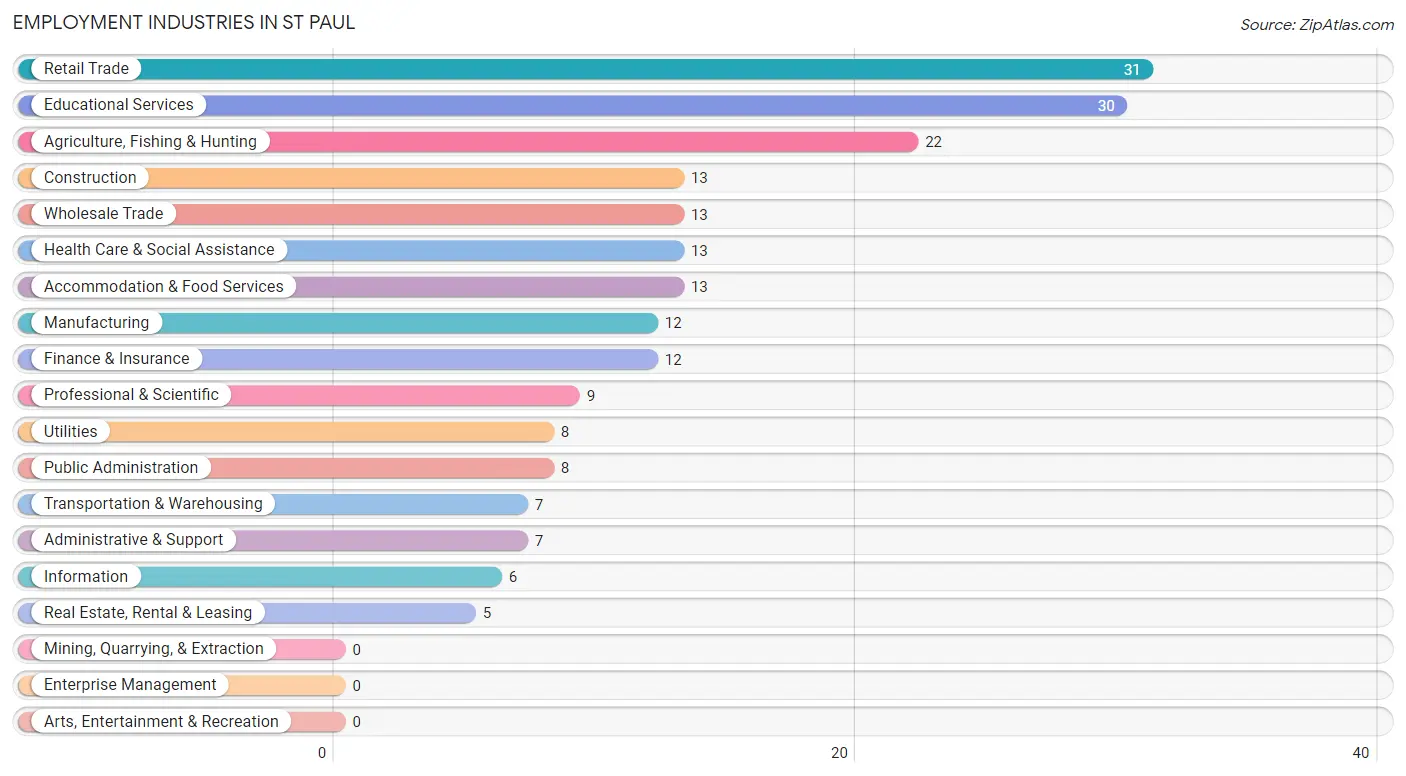
Employment Industries in St Paul
The major employment industries in St Paul include Retail Trade (31 | 14.3%), Educational Services (30 | 13.9%), Agriculture, Fishing & Hunting (22 | 10.2%), Construction (13 | 6.0%), and Wholesale Trade (13 | 6.0%).
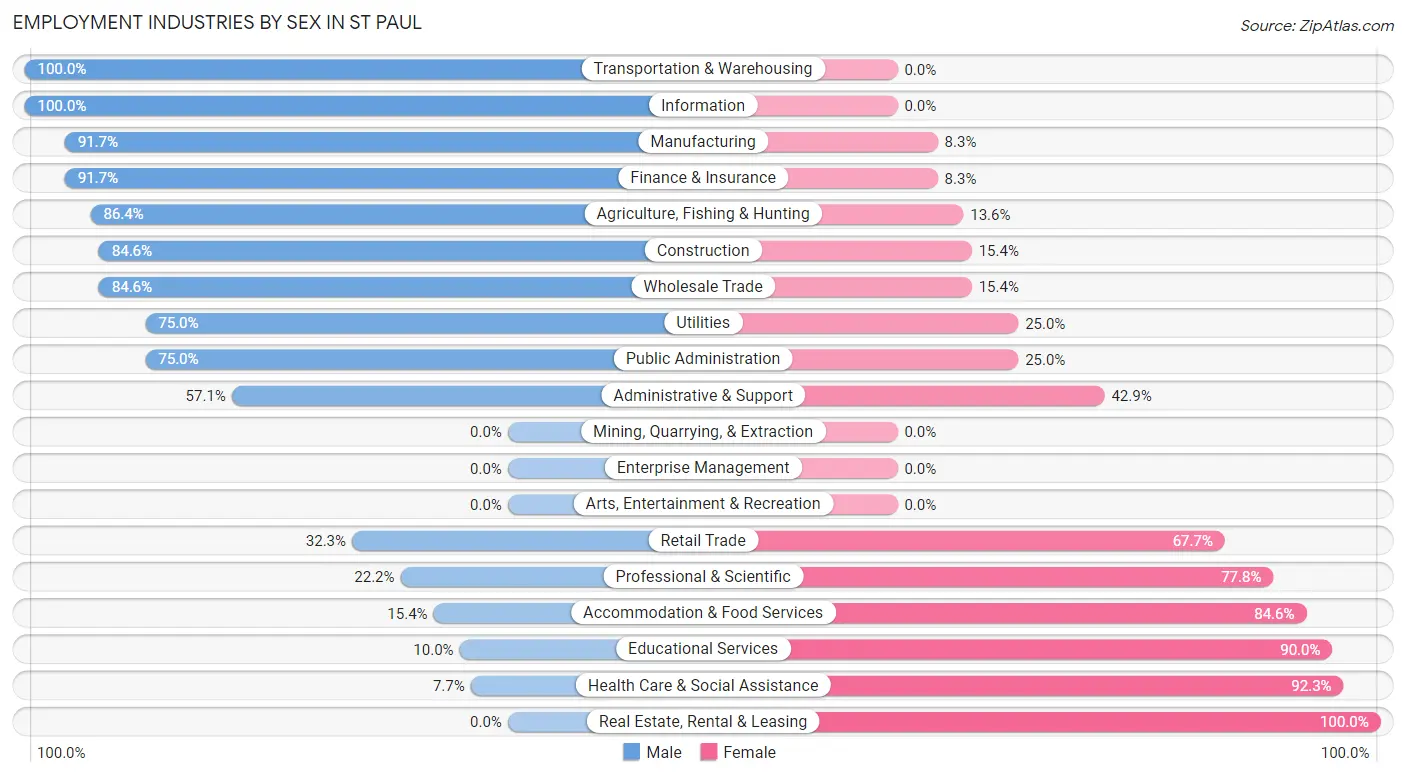
Employment Industries by Sex in St Paul
The St Paul industries that see more men than women are Transportation & Warehousing (100.0%), Information (100.0%), and Manufacturing (91.7%), whereas the industries that tend to have a higher number of women are Real Estate, Rental & Leasing (100.0%), Health Care & Social Assistance (92.3%), and Educational Services (90.0%).
| Industry | Male | Female |
| Agriculture, Fishing & Hunting | 19 (86.4%) | 3 (13.6%) |
| Mining, Quarrying, & Extraction | 0 (0.0%) | 0 (0.0%) |
| Construction | 11 (84.6%) | 2 (15.4%) |
| Manufacturing | 11 (91.7%) | 1 (8.3%) |
| Wholesale Trade | 11 (84.6%) | 2 (15.4%) |
| Retail Trade | 10 (32.3%) | 21 (67.7%) |
| Transportation & Warehousing | 7 (100.0%) | 0 (0.0%) |
| Utilities | 6 (75.0%) | 2 (25.0%) |
| Information | 6 (100.0%) | 0 (0.0%) |
| Finance & Insurance | 11 (91.7%) | 1 (8.3%) |
| Real Estate, Rental & Leasing | 0 (0.0%) | 5 (100.0%) |
| Professional & Scientific | 2 (22.2%) | 7 (77.8%) |
| Enterprise Management | 0 (0.0%) | 0 (0.0%) |
| Administrative & Support | 4 (57.1%) | 3 (42.9%) |
| Educational Services | 3 (10.0%) | 27 (90.0%) |
| Health Care & Social Assistance | 1 (7.7%) | 12 (92.3%) |
| Arts, Entertainment & Recreation | 0 (0.0%) | 0 (0.0%) |
| Accommodation & Food Services | 2 (15.4%) | 11 (84.6%) |
| Public Administration | 6 (75.0%) | 2 (25.0%) |
| Total | 111 (51.4%) | 105 (48.6%) |
Education in St Paul
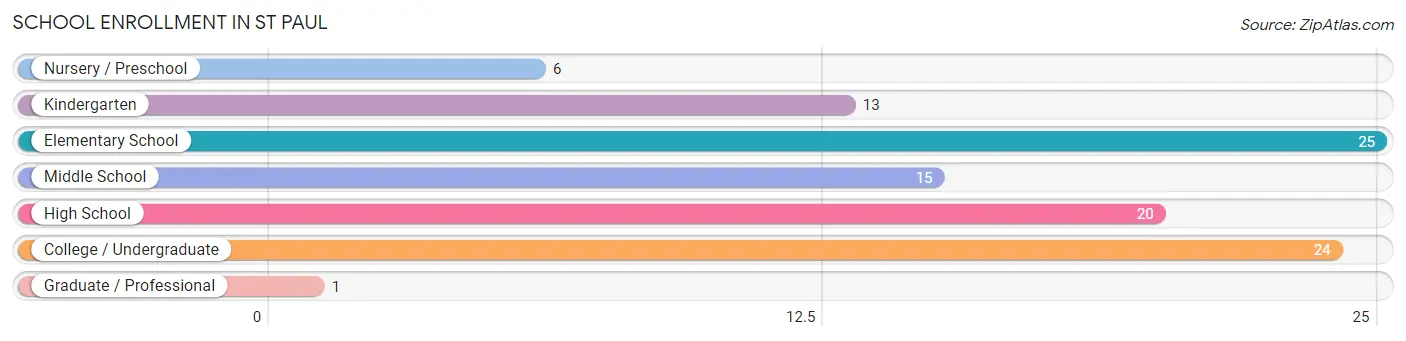
School Enrollment in St Paul
The most common levels of schooling among the 104 students in St Paul are elementary school (25 | 24.0%), college / undergraduate (24 | 23.1%), and high school (20 | 19.2%).
| School Level | # Students | % Students |
| Nursery / Preschool | 6 | 5.8% |
| Kindergarten | 13 | 12.5% |
| Elementary School | 25 | 24.0% |
| Middle School | 15 | 14.4% |
| High School | 20 | 19.2% |
| College / Undergraduate | 24 | 23.1% |
| Graduate / Professional | 1 | 1.0% |
| Total | 104 | 100.0% |
School Enrollment by Age by Funding Source in St Paul
Out of a total of 104 students who are enrolled in schools in St Paul, 38 (36.5%) attend a private institution, while the remaining 66 (63.5%) are enrolled in public schools. The age group of 3 to 4 year olds has the highest likelihood of being enrolled in private schools, with 6 (100.0% in the age bracket) enrolled. Conversely, the age group of 15 to 17 year olds has the lowest likelihood of being enrolled in a private school, with 16 (100.0% in the age bracket) attending a public institution.
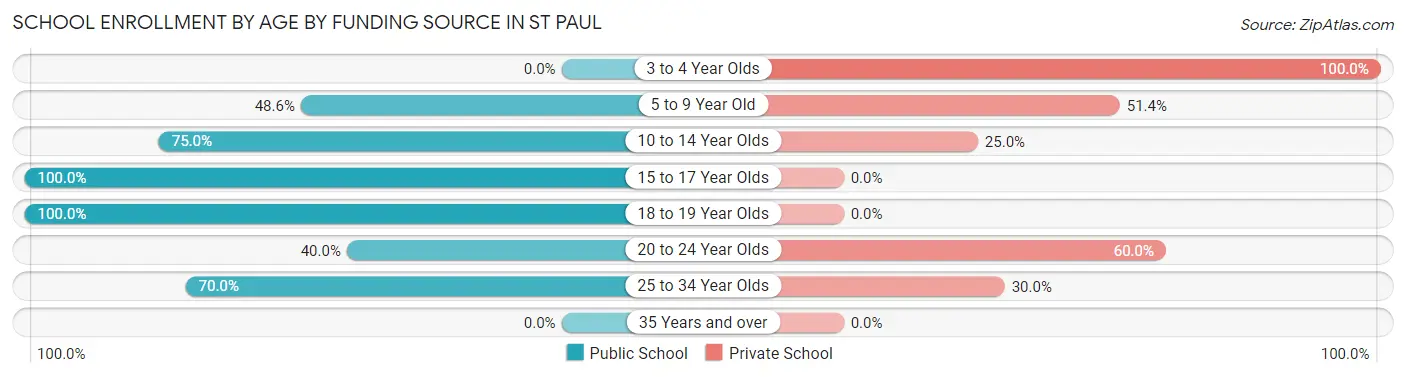
| Age Bracket | Public School | Private School |
| 3 to 4 Year Olds | 0 (0.0%) | 6 (100.0%) |
| 5 to 9 Year Old | 17 (48.6%) | 18 (51.4%) |
| 10 to 14 Year Olds | 15 (75.0%) | 5 (25.0%) |
| 15 to 17 Year Olds | 16 (100.0%) | 0 (0.0%) |
| 18 to 19 Year Olds | 7 (100.0%) | 0 (0.0%) |
| 20 to 24 Year Olds | 4 (40.0%) | 6 (60.0%) |
| 25 to 34 Year Olds | 7 (70.0%) | 3 (30.0%) |
| 35 Years and over | 0 (0.0%) | 0 (0.0%) |
| Total | 66 (63.5%) | 38 (36.5%) |
Educational Attainment by Field of Study in St Paul
Arts & humanities (16 | 14.8%), business (13 | 12.0%), bio, nature & agricultural (11 | 10.2%), physical & health sciences (9 | 8.3%), and psychology (9 | 8.3%) are the most common fields of study among 108 individuals in St Paul who have obtained a bachelor's degree or higher.
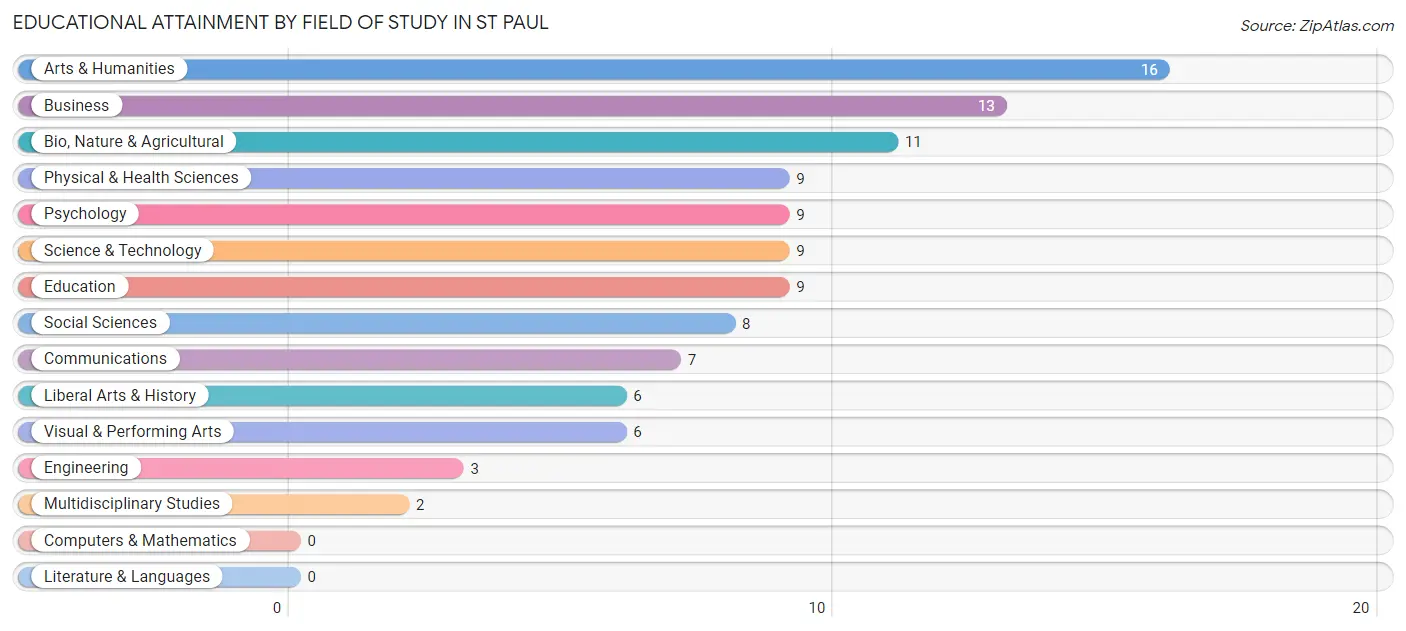
| Field of Study | # Graduates | % Graduates |
| Computers & Mathematics | 0 | 0.0% |
| Bio, Nature & Agricultural | 11 | 10.2% |
| Physical & Health Sciences | 9 | 8.3% |
| Psychology | 9 | 8.3% |
| Social Sciences | 8 | 7.4% |
| Engineering | 3 | 2.8% |
| Multidisciplinary Studies | 2 | 1.8% |
| Science & Technology | 9 | 8.3% |
| Business | 13 | 12.0% |
| Education | 9 | 8.3% |
| Literature & Languages | 0 | 0.0% |
| Liberal Arts & History | 6 | 5.6% |
| Visual & Performing Arts | 6 | 5.6% |
| Communications | 7 | 6.5% |
| Arts & Humanities | 16 | 14.8% |
| Total | 108 | 100.0% |
Transportation & Commute in St Paul
Vehicle Availability by Sex in St Paul
The most prevalent vehicle ownership categories in St Paul are males with 2 vehicles (39, accounting for 37.1%) and females with 2 vehicles (29, making up 39.4%).
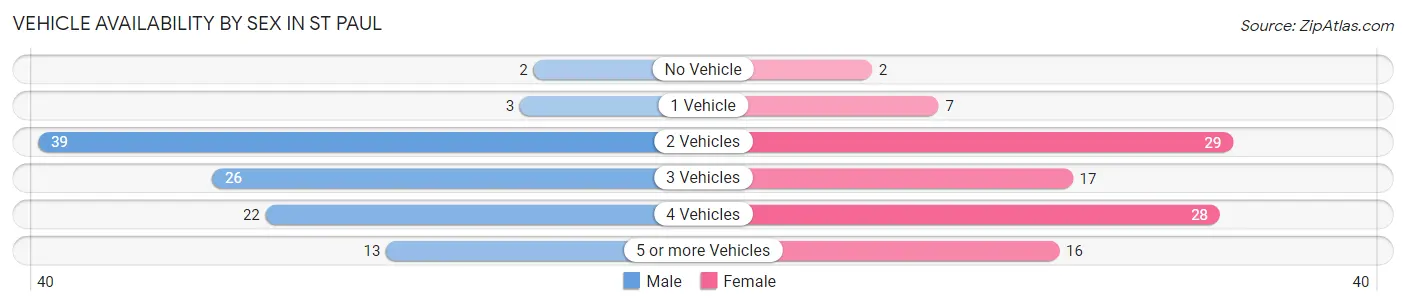
| Vehicles Available | Male | Female |
| No Vehicle | 2 (1.9%) | 2 (2.0%) |
| 1 Vehicle | 3 (2.9%) | 7 (7.1%) |
| 2 Vehicles | 39 (37.1%) | 29 (29.3%) |
| 3 Vehicles | 26 (24.8%) | 17 (17.2%) |
| 4 Vehicles | 22 (20.9%) | 28 (28.3%) |
| 5 or more Vehicles | 13 (12.4%) | 16 (16.2%) |
| Total | 105 (100.0%) | 99 (100.0%) |
Commute Time in St Paul
The most frequently occuring commute durations in St Paul are less than 5 minutes (33 commuters, 17.6%), 15 to 19 minutes (25 commuters, 13.4%), and 5 to 9 minutes (23 commuters, 12.3%).
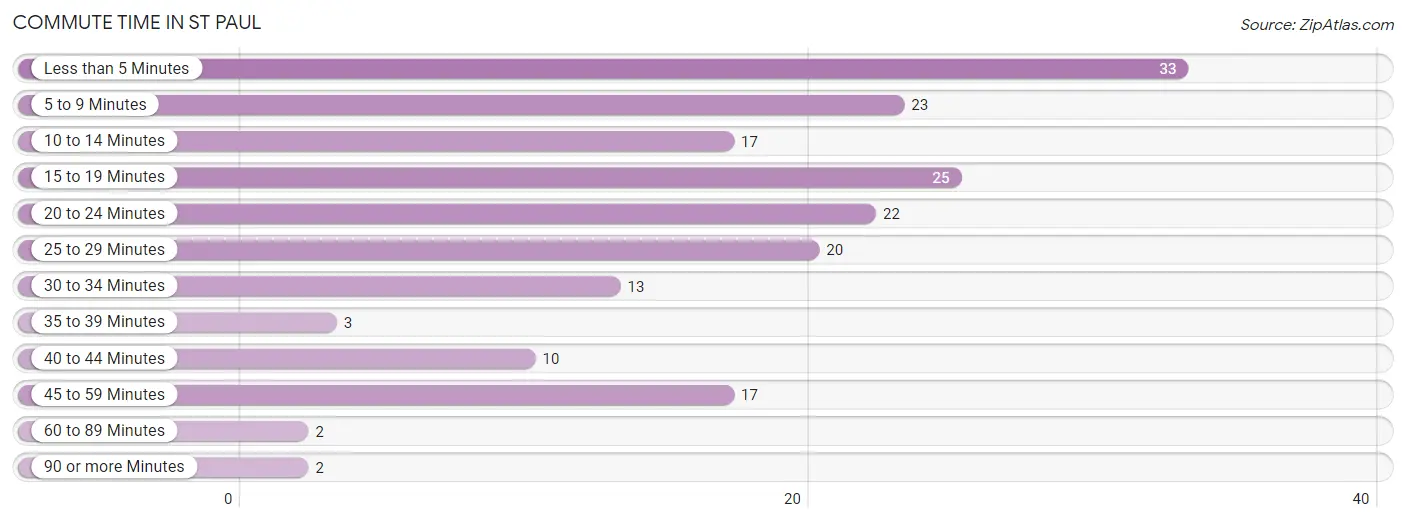
| Commute Time | # Commuters | % Commuters |
| Less than 5 Minutes | 33 | 17.6% |
| 5 to 9 Minutes | 23 | 12.3% |
| 10 to 14 Minutes | 17 | 9.1% |
| 15 to 19 Minutes | 25 | 13.4% |
| 20 to 24 Minutes | 22 | 11.8% |
| 25 to 29 Minutes | 20 | 10.7% |
| 30 to 34 Minutes | 13 | 7.0% |
| 35 to 39 Minutes | 3 | 1.6% |
| 40 to 44 Minutes | 10 | 5.3% |
| 45 to 59 Minutes | 17 | 9.1% |
| 60 to 89 Minutes | 2 | 1.1% |
| 90 or more Minutes | 2 | 1.1% |
Commute Time by Sex in St Paul
The most common commute times in St Paul are 10 to 14 minutes (16 commuters, 16.5%) for males and less than 5 minutes (26 commuters, 28.9%) for females.
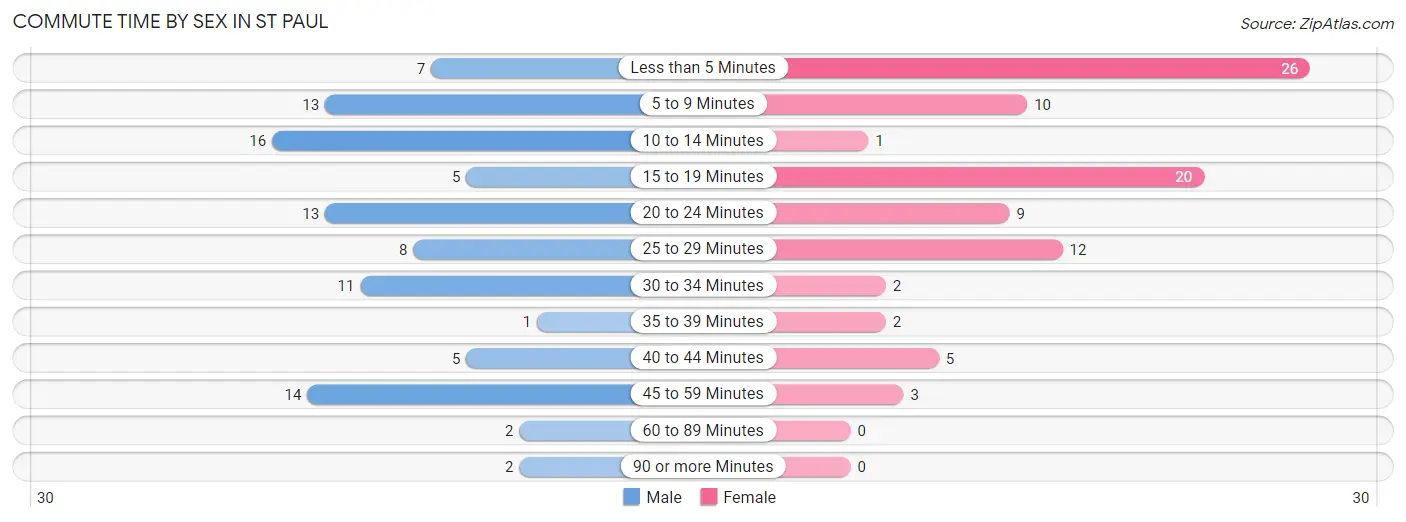
| Commute Time | Male | Female |
| Less than 5 Minutes | 7 (7.2%) | 26 (28.9%) |
| 5 to 9 Minutes | 13 (13.4%) | 10 (11.1%) |
| 10 to 14 Minutes | 16 (16.5%) | 1 (1.1%) |
| 15 to 19 Minutes | 5 (5.1%) | 20 (22.2%) |
| 20 to 24 Minutes | 13 (13.4%) | 9 (10.0%) |
| 25 to 29 Minutes | 8 (8.3%) | 12 (13.3%) |
| 30 to 34 Minutes | 11 (11.3%) | 2 (2.2%) |
| 35 to 39 Minutes | 1 (1.0%) | 2 (2.2%) |
| 40 to 44 Minutes | 5 (5.1%) | 5 (5.6%) |
| 45 to 59 Minutes | 14 (14.4%) | 3 (3.3%) |
| 60 to 89 Minutes | 2 (2.1%) | 0 (0.0%) |
| 90 or more Minutes | 2 (2.1%) | 0 (0.0%) |
Time of Departure to Work by Sex in St Paul
The most frequent times of departure to work in St Paul are 6:30 AM to 6:59 AM (21, 21.6%) for males and 7:00 AM to 7:29 AM (32, 35.6%) for females.
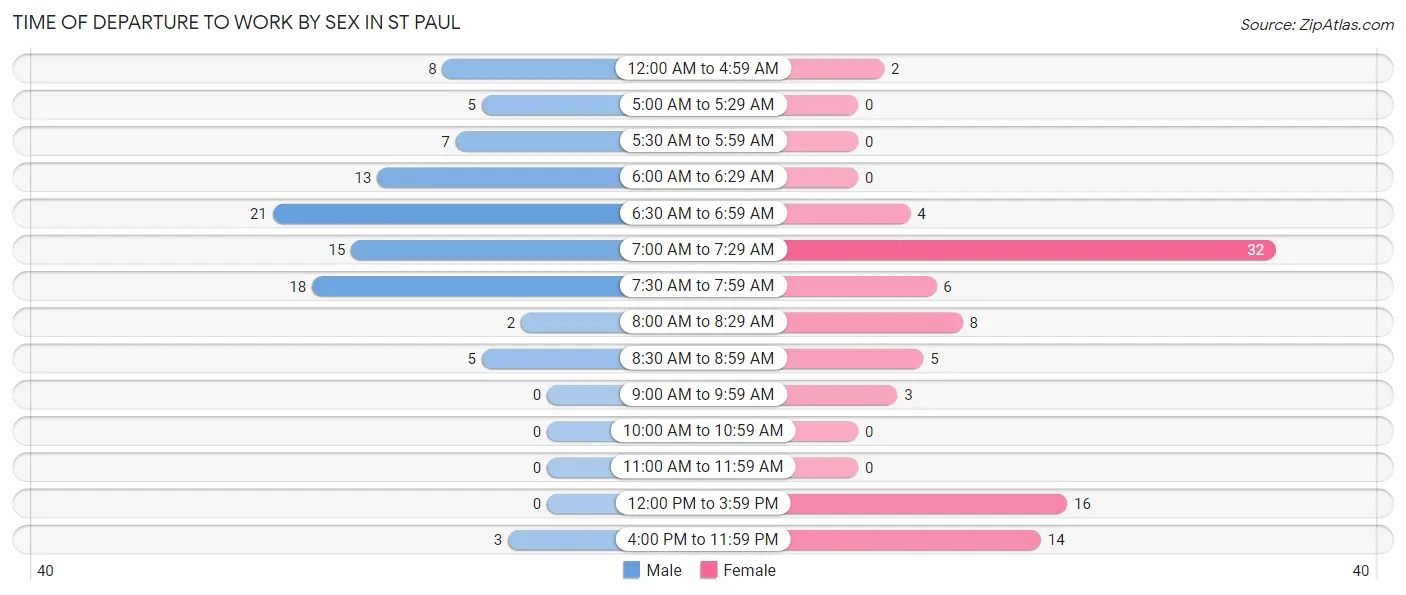
| Time of Departure | Male | Female |
| 12:00 AM to 4:59 AM | 8 (8.3%) | 2 (2.2%) |
| 5:00 AM to 5:29 AM | 5 (5.1%) | 0 (0.0%) |
| 5:30 AM to 5:59 AM | 7 (7.2%) | 0 (0.0%) |
| 6:00 AM to 6:29 AM | 13 (13.4%) | 0 (0.0%) |
| 6:30 AM to 6:59 AM | 21 (21.6%) | 4 (4.4%) |
| 7:00 AM to 7:29 AM | 15 (15.5%) | 32 (35.6%) |
| 7:30 AM to 7:59 AM | 18 (18.6%) | 6 (6.7%) |
| 8:00 AM to 8:29 AM | 2 (2.1%) | 8 (8.9%) |
| 8:30 AM to 8:59 AM | 5 (5.1%) | 5 (5.6%) |
| 9:00 AM to 9:59 AM | 0 (0.0%) | 3 (3.3%) |
| 10:00 AM to 10:59 AM | 0 (0.0%) | 0 (0.0%) |
| 11:00 AM to 11:59 AM | 0 (0.0%) | 0 (0.0%) |
| 12:00 PM to 3:59 PM | 0 (0.0%) | 16 (17.8%) |
| 4:00 PM to 11:59 PM | 3 (3.1%) | 14 (15.6%) |
| Total | 97 (100.0%) | 90 (100.0%) |
Housing Occupancy in St Paul
Occupancy by Ownership in St Paul
Of the total 137 dwellings in St Paul, owner-occupied units account for 114 (83.2%), while renter-occupied units make up 23 (16.8%).
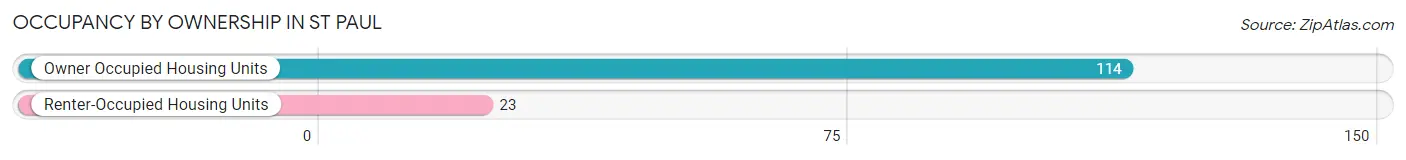
| Occupancy | # Housing Units | % Housing Units |
| Owner Occupied Housing Units | 114 | 83.2% |
| Renter-Occupied Housing Units | 23 | 16.8% |
| Total Occupied Housing Units | 137 | 100.0% |
Occupancy by Household Size in St Paul
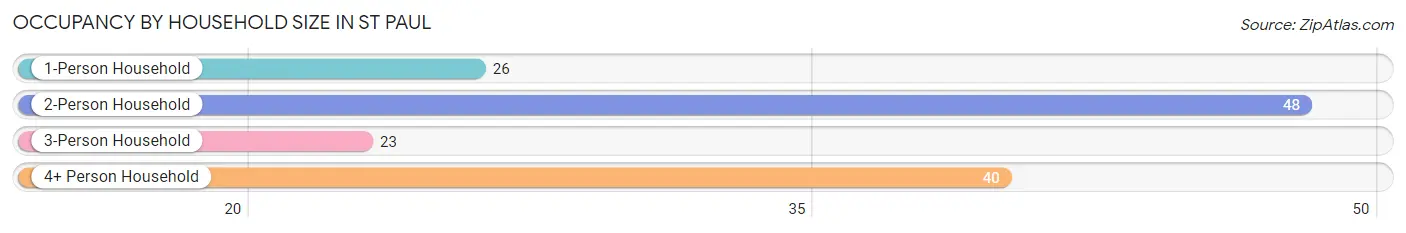
| Household Size | # Housing Units | % Housing Units |
| 1-Person Household | 26 | 19.0% |
| 2-Person Household | 48 | 35.0% |
| 3-Person Household | 23 | 16.8% |
| 4+ Person Household | 40 | 29.2% |
| Total Housing Units | 137 | 100.0% |
Occupancy by Ownership by Household Size in St Paul
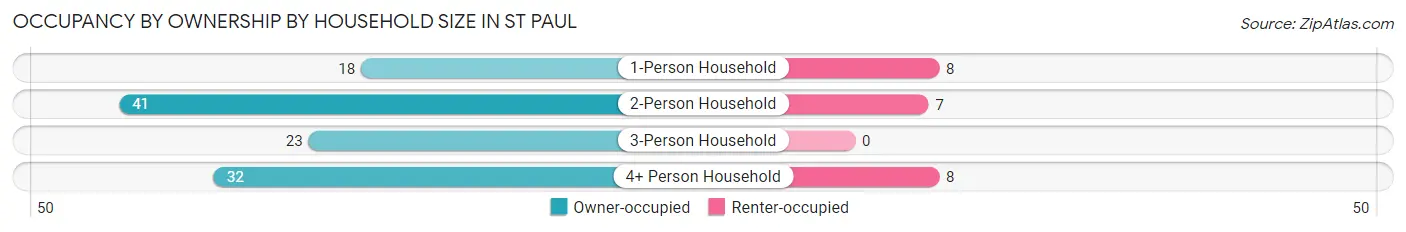
| Household Size | Owner-occupied | Renter-occupied |
| 1-Person Household | 18 (69.2%) | 8 (30.8%) |
| 2-Person Household | 41 (85.4%) | 7 (14.6%) |
| 3-Person Household | 23 (100.0%) | 0 (0.0%) |
| 4+ Person Household | 32 (80.0%) | 8 (20.0%) |
| Total Housing Units | 114 (83.2%) | 23 (16.8%) |
Occupancy by Educational Attainment in St Paul
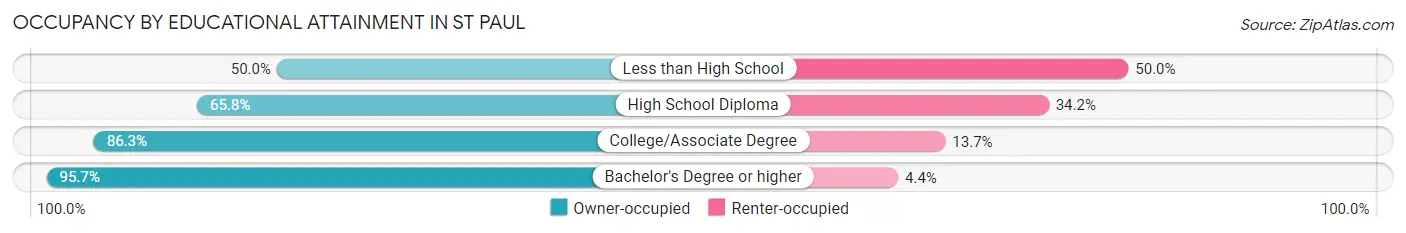
| Household Size | Owner-occupied | Renter-occupied |
| Less than High School | 1 (50.0%) | 1 (50.0%) |
| High School Diploma | 25 (65.8%) | 13 (34.2%) |
| College/Associate Degree | 44 (86.3%) | 7 (13.7%) |
| Bachelor's Degree or higher | 44 (95.7%) | 2 (4.3%) |
Occupancy by Age of Householder in St Paul
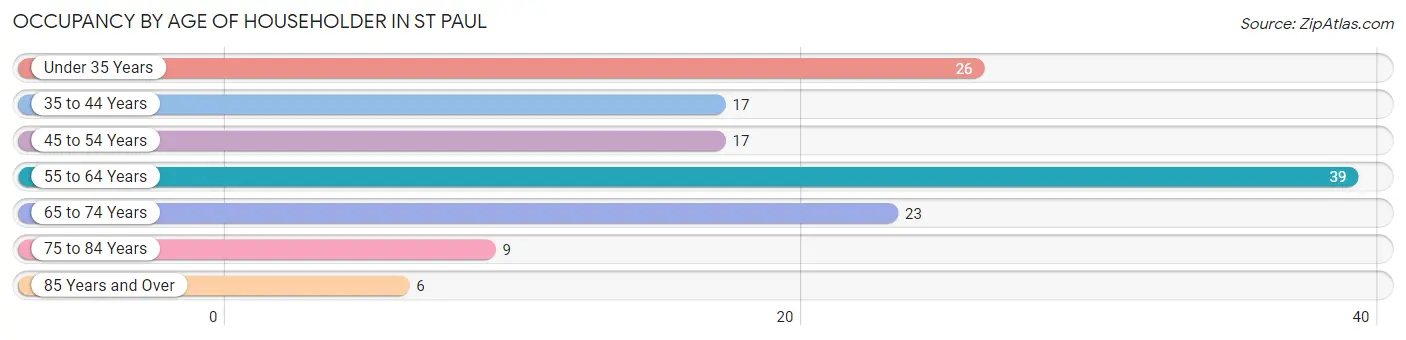
| Age Bracket | # Households | % Households |
| Under 35 Years | 26 | 19.0% |
| 35 to 44 Years | 17 | 12.4% |
| 45 to 54 Years | 17 | 12.4% |
| 55 to 64 Years | 39 | 28.5% |
| 65 to 74 Years | 23 | 16.8% |
| 75 to 84 Years | 9 | 6.6% |
| 85 Years and Over | 6 | 4.4% |
| Total | 137 | 100.0% |
Housing Finances in St Paul
Median Income by Occupancy in St Paul
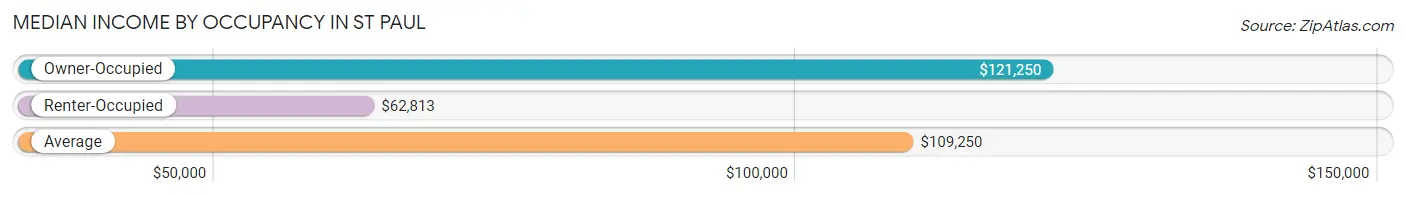
| Occupancy Type | # Households | Median Income |
| Owner-Occupied | 114 (83.2%) | $121,250 |
| Renter-Occupied | 23 (16.8%) | $62,813 |
| Average | 137 (100.0%) | $109,250 |
Occupancy by Householder Income Bracket in St Paul
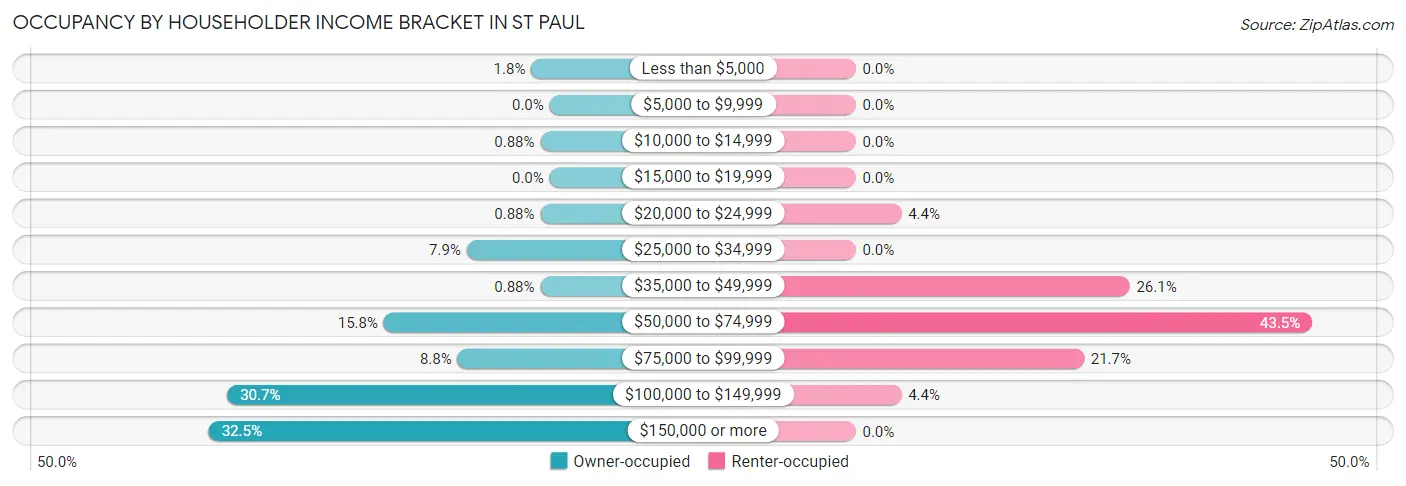
| Income Bracket | Owner-occupied | Renter-occupied |
| Less than $5,000 | 2 (1.8%) | 0 (0.0%) |
| $5,000 to $9,999 | 0 (0.0%) | 0 (0.0%) |
| $10,000 to $14,999 | 1 (0.9%) | 0 (0.0%) |
| $15,000 to $19,999 | 0 (0.0%) | 0 (0.0%) |
| $20,000 to $24,999 | 1 (0.9%) | 1 (4.3%) |
| $25,000 to $34,999 | 9 (7.9%) | 0 (0.0%) |
| $35,000 to $49,999 | 1 (0.9%) | 6 (26.1%) |
| $50,000 to $74,999 | 18 (15.8%) | 10 (43.5%) |
| $75,000 to $99,999 | 10 (8.8%) | 5 (21.7%) |
| $100,000 to $149,999 | 35 (30.7%) | 1 (4.3%) |
| $150,000 or more | 37 (32.5%) | 0 (0.0%) |
| Total | 114 (100.0%) | 23 (100.0%) |
Monthly Housing Cost Tiers in St Paul
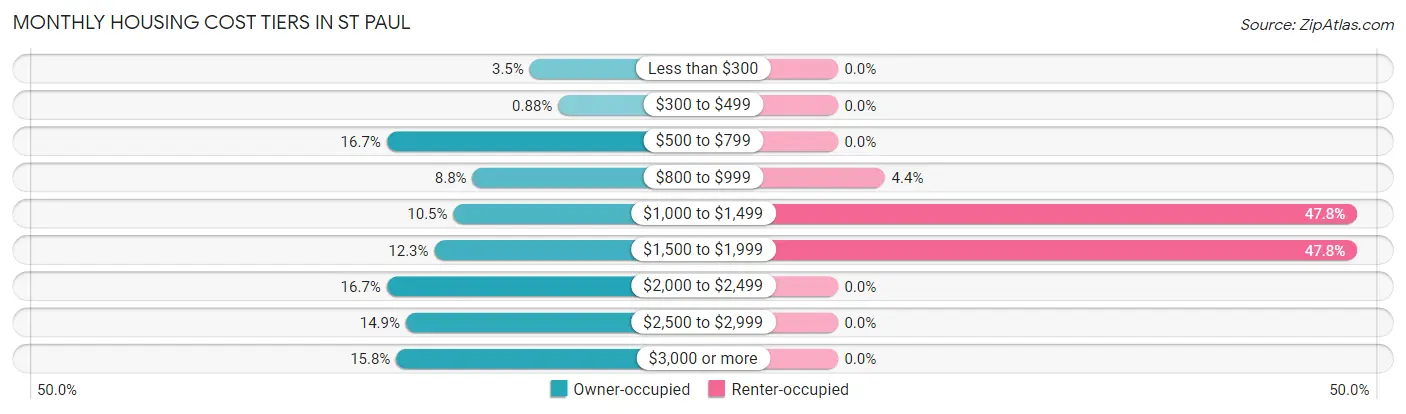
| Monthly Cost | Owner-occupied | Renter-occupied |
| Less than $300 | 4 (3.5%) | 0 (0.0%) |
| $300 to $499 | 1 (0.9%) | 0 (0.0%) |
| $500 to $799 | 19 (16.7%) | 0 (0.0%) |
| $800 to $999 | 10 (8.8%) | 1 (4.3%) |
| $1,000 to $1,499 | 12 (10.5%) | 11 (47.8%) |
| $1,500 to $1,999 | 14 (12.3%) | 11 (47.8%) |
| $2,000 to $2,499 | 19 (16.7%) | 0 (0.0%) |
| $2,500 to $2,999 | 17 (14.9%) | 0 (0.0%) |
| $3,000 or more | 18 (15.8%) | 0 (0.0%) |
| Total | 114 (100.0%) | 23 (100.0%) |
Physical Housing Characteristics in St Paul
Housing Structures in St Paul
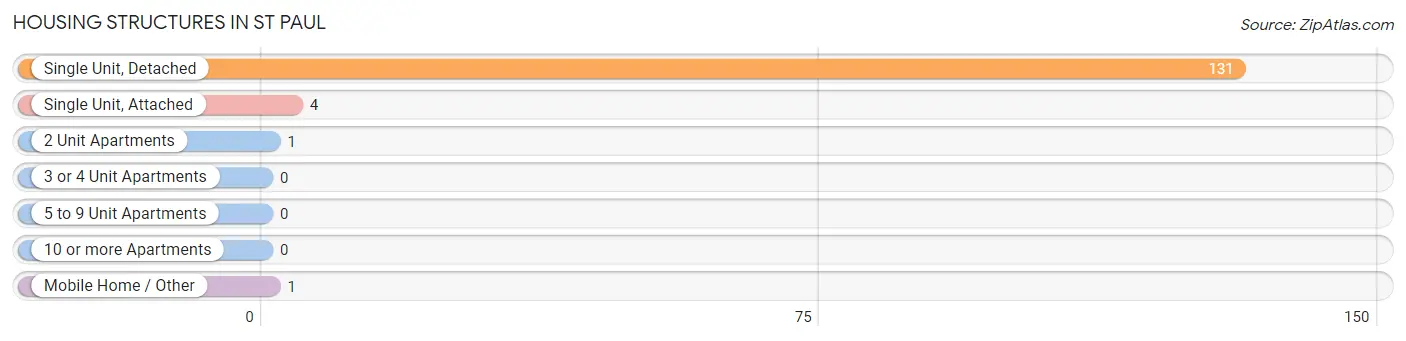
| Structure Type | # Housing Units | % Housing Units |
| Single Unit, Detached | 131 | 95.6% |
| Single Unit, Attached | 4 | 2.9% |
| 2 Unit Apartments | 1 | 0.7% |
| 3 or 4 Unit Apartments | 0 | 0.0% |
| 5 to 9 Unit Apartments | 0 | 0.0% |
| 10 or more Apartments | 0 | 0.0% |
| Mobile Home / Other | 1 | 0.7% |
| Total | 137 | 100.0% |
Housing Structures by Occupancy in St Paul
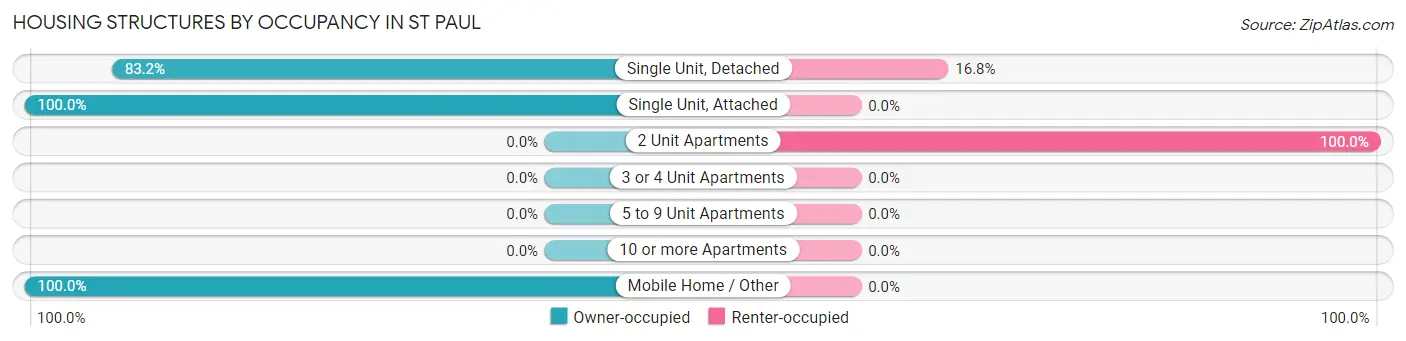
| Structure Type | Owner-occupied | Renter-occupied |
| Single Unit, Detached | 109 (83.2%) | 22 (16.8%) |
| Single Unit, Attached | 4 (100.0%) | 0 (0.0%) |
| 2 Unit Apartments | 0 (0.0%) | 1 (100.0%) |
| 3 or 4 Unit Apartments | 0 (0.0%) | 0 (0.0%) |
| 5 to 9 Unit Apartments | 0 (0.0%) | 0 (0.0%) |
| 10 or more Apartments | 0 (0.0%) | 0 (0.0%) |
| Mobile Home / Other | 1 (100.0%) | 0 (0.0%) |
| Total | 114 (83.2%) | 23 (16.8%) |
Housing Structures by Number of Rooms in St Paul
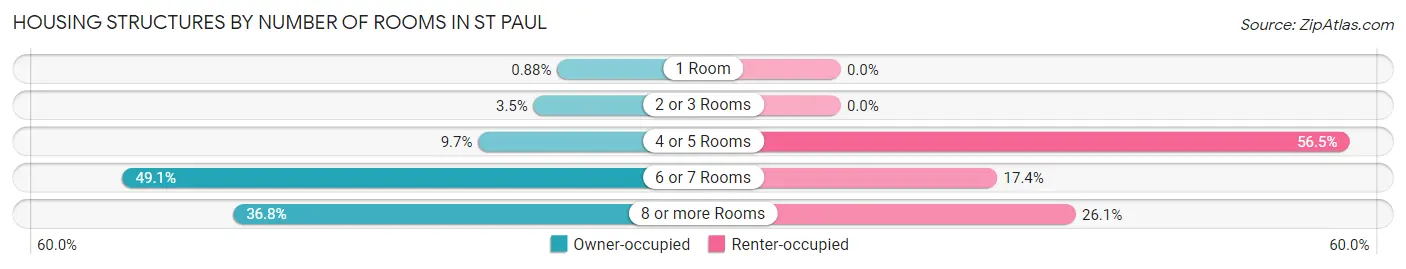
| Number of Rooms | Owner-occupied | Renter-occupied |
| 1 Room | 1 (0.9%) | 0 (0.0%) |
| 2 or 3 Rooms | 4 (3.5%) | 0 (0.0%) |
| 4 or 5 Rooms | 11 (9.7%) | 13 (56.5%) |
| 6 or 7 Rooms | 56 (49.1%) | 4 (17.4%) |
| 8 or more Rooms | 42 (36.8%) | 6 (26.1%) |
| Total | 114 (100.0%) | 23 (100.0%) |
Housing Structure by Heating Type in St Paul
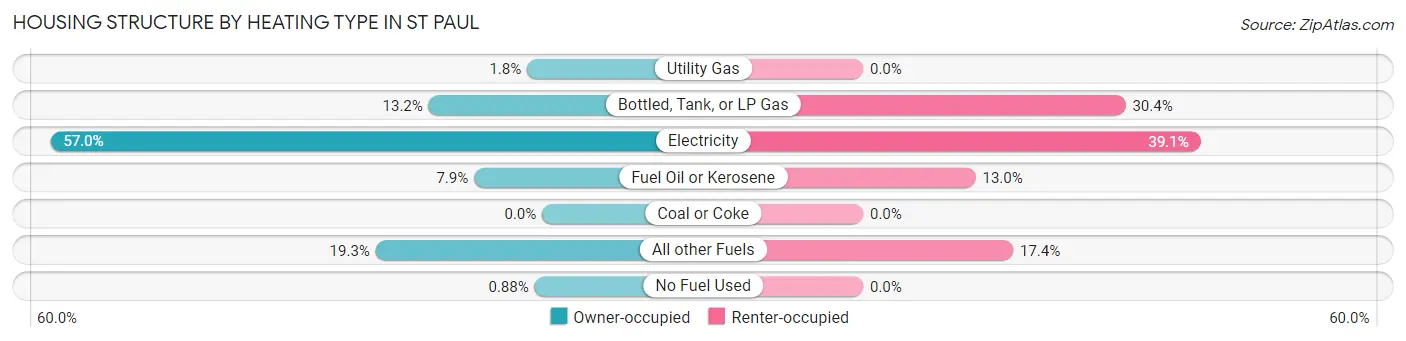
| Heating Type | Owner-occupied | Renter-occupied |
| Utility Gas | 2 (1.8%) | 0 (0.0%) |
| Bottled, Tank, or LP Gas | 15 (13.2%) | 7 (30.4%) |
| Electricity | 65 (57.0%) | 9 (39.1%) |
| Fuel Oil or Kerosene | 9 (7.9%) | 3 (13.0%) |
| Coal or Coke | 0 (0.0%) | 0 (0.0%) |
| All other Fuels | 22 (19.3%) | 4 (17.4%) |
| No Fuel Used | 1 (0.9%) | 0 (0.0%) |
| Total | 114 (100.0%) | 23 (100.0%) |
Household Vehicle Usage in St Paul
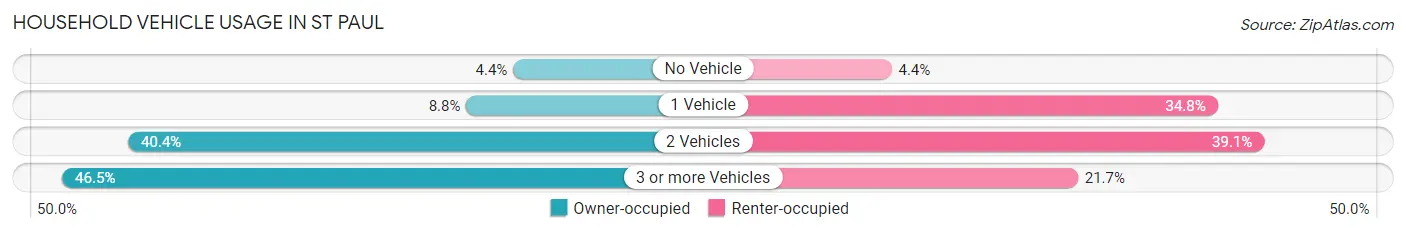
| Vehicles per Household | Owner-occupied | Renter-occupied |
| No Vehicle | 5 (4.4%) | 1 (4.3%) |
| 1 Vehicle | 10 (8.8%) | 8 (34.8%) |
| 2 Vehicles | 46 (40.4%) | 9 (39.1%) |
| 3 or more Vehicles | 53 (46.5%) | 5 (21.7%) |
| Total | 114 (100.0%) | 23 (100.0%) |
Real Estate & Mortgages in St Paul
Real Estate and Mortgage Overview in St Paul
| Characteristic | Without Mortgage | With Mortgage |
| Housing Units | 43 | 71 |
| Median Property Value | $492,900 | $460,900 |
| Median Household Income | $63,125 | $24 |
| Monthly Housing Costs | $750 | $18 |
| Real Estate Taxes | $3,864 | $1 |
Property Value by Mortgage Status in St Paul
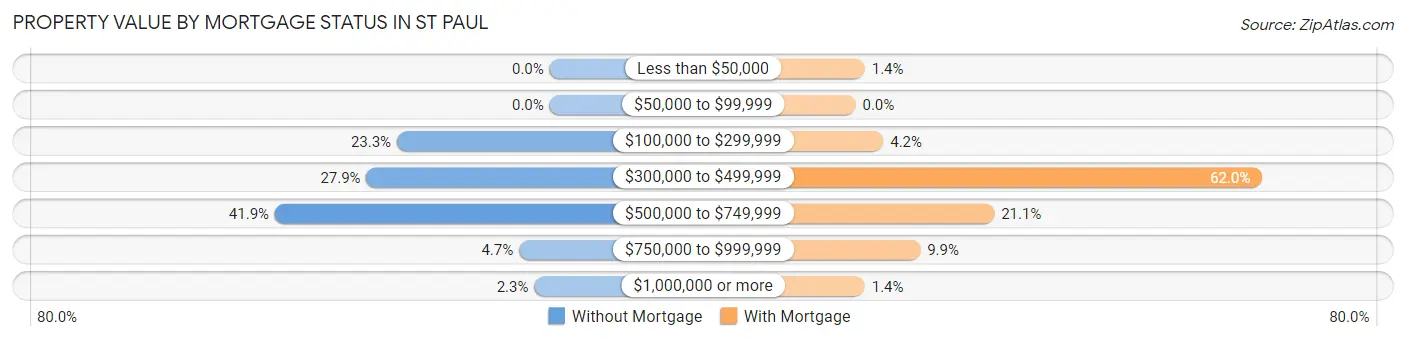
| Property Value | Without Mortgage | With Mortgage |
| Less than $50,000 | 0 (0.0%) | 1 (1.4%) |
| $50,000 to $99,999 | 0 (0.0%) | 0 (0.0%) |
| $100,000 to $299,999 | 10 (23.3%) | 3 (4.2%) |
| $300,000 to $499,999 | 12 (27.9%) | 44 (62.0%) |
| $500,000 to $749,999 | 18 (41.9%) | 15 (21.1%) |
| $750,000 to $999,999 | 2 (4.6%) | 7 (9.9%) |
| $1,000,000 or more | 1 (2.3%) | 1 (1.4%) |
| Total | 43 (100.0%) | 71 (100.0%) |
Household Income by Mortgage Status in St Paul
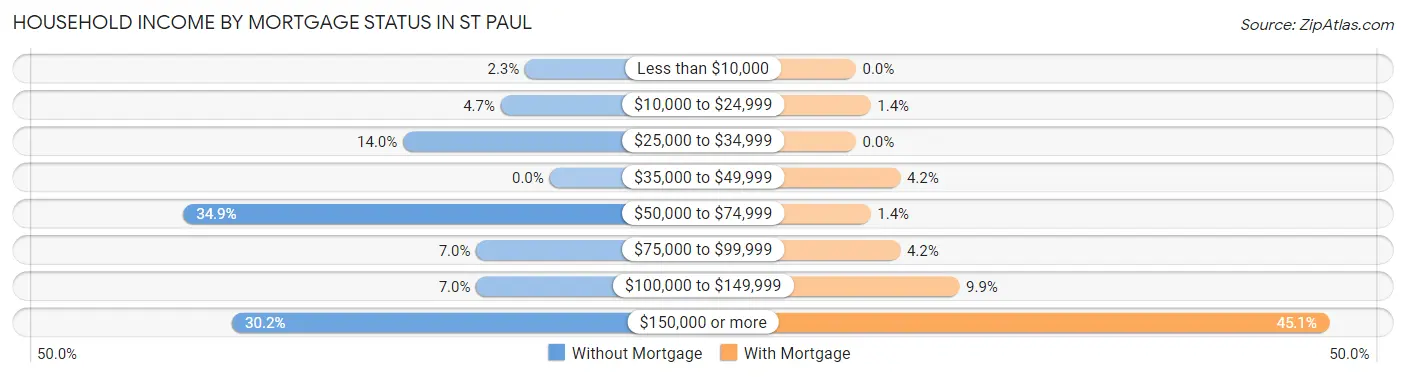
| Household Income | Without Mortgage | With Mortgage |
| Less than $10,000 | 1 (2.3%) | 0 (0.0%) |
| $10,000 to $24,999 | 2 (4.6%) | 1 (1.4%) |
| $25,000 to $34,999 | 6 (14.0%) | 0 (0.0%) |
| $35,000 to $49,999 | 0 (0.0%) | 3 (4.2%) |
| $50,000 to $74,999 | 15 (34.9%) | 1 (1.4%) |
| $75,000 to $99,999 | 3 (7.0%) | 3 (4.2%) |
| $100,000 to $149,999 | 3 (7.0%) | 7 (9.9%) |
| $150,000 or more | 13 (30.2%) | 32 (45.1%) |
| Total | 43 (100.0%) | 71 (100.0%) |
Property Value to Household Income Ratio in St Paul
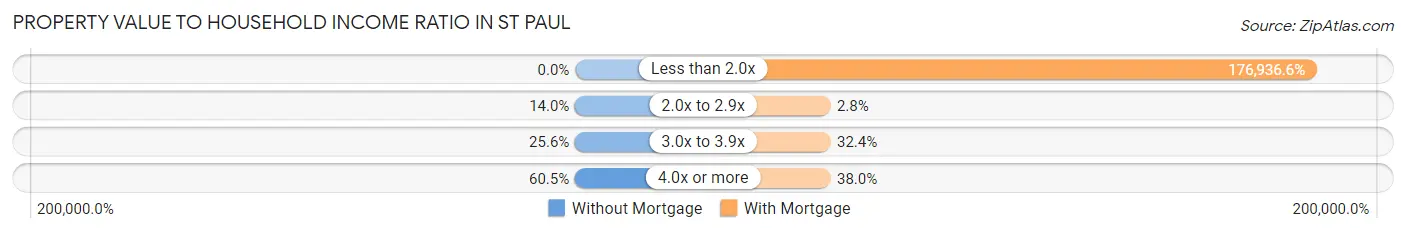
| Value-to-Income Ratio | Without Mortgage | With Mortgage |
| Less than 2.0x | 0 (0.0%) | 125,625 (176,936.6%) |
| 2.0x to 2.9x | 6 (14.0%) | 2 (2.8%) |
| 3.0x to 3.9x | 11 (25.6%) | 23 (32.4%) |
| 4.0x or more | 26 (60.5%) | 27 (38.0%) |
| Total | 43 (100.0%) | 71 (100.0%) |
Real Estate Taxes by Mortgage Status in St Paul
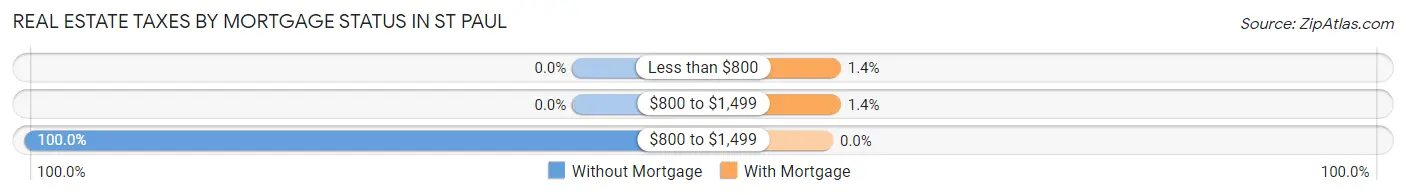
| Property Taxes | Without Mortgage | With Mortgage |
| Less than $800 | 0 (0.0%) | 1 (1.4%) |
| $800 to $1,499 | 0 (0.0%) | 1 (1.4%) |
| $800 to $1,499 | 43 (100.0%) | 0 (0.0%) |
| Total | 43 (100.0%) | 71 (100.0%) |
Health & Disability in St Paul
Health Insurance Coverage by Age in St Paul
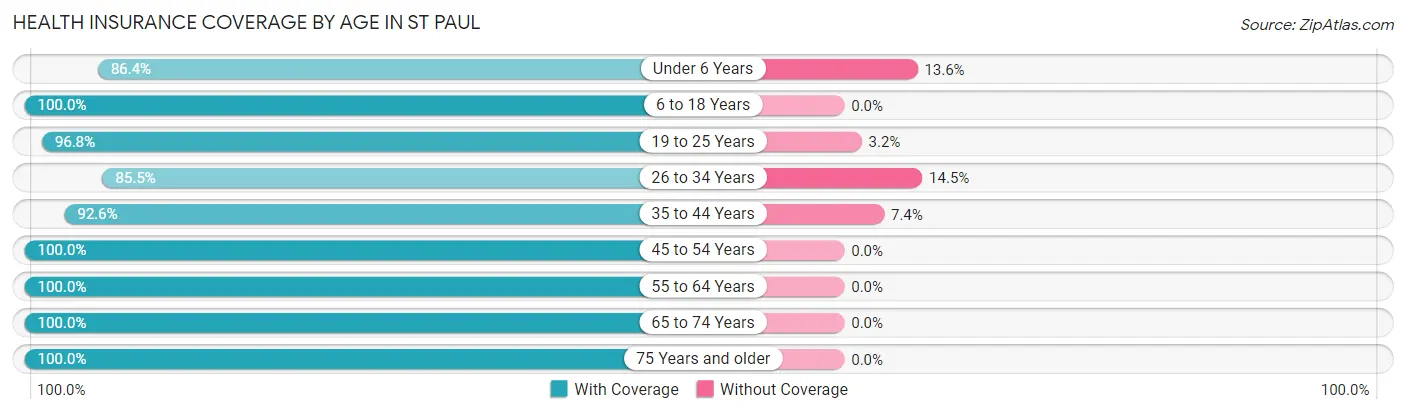
| Age Bracket | With Coverage | Without Coverage |
| Under 6 Years | 19 (86.4%) | 3 (13.6%) |
| 6 to 18 Years | 65 (100.0%) | 0 (0.0%) |
| 19 to 25 Years | 30 (96.8%) | 1 (3.2%) |
| 26 to 34 Years | 53 (85.5%) | 9 (14.5%) |
| 35 to 44 Years | 25 (92.6%) | 2 (7.4%) |
| 45 to 54 Years | 47 (100.0%) | 0 (0.0%) |
| 55 to 64 Years | 79 (100.0%) | 0 (0.0%) |
| 65 to 74 Years | 38 (100.0%) | 0 (0.0%) |
| 75 Years and older | 30 (100.0%) | 0 (0.0%) |
| Total | 386 (96.3%) | 15 (3.7%) |
Health Insurance Coverage by Citizenship Status in St Paul
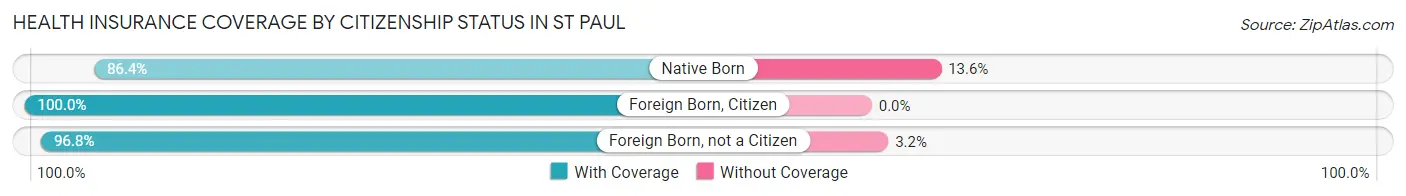
| Citizenship Status | With Coverage | Without Coverage |
| Native Born | 19 (86.4%) | 3 (13.6%) |
| Foreign Born, Citizen | 65 (100.0%) | 0 (0.0%) |
| Foreign Born, not a Citizen | 30 (96.8%) | 1 (3.2%) |
Health Insurance Coverage by Household Income in St Paul
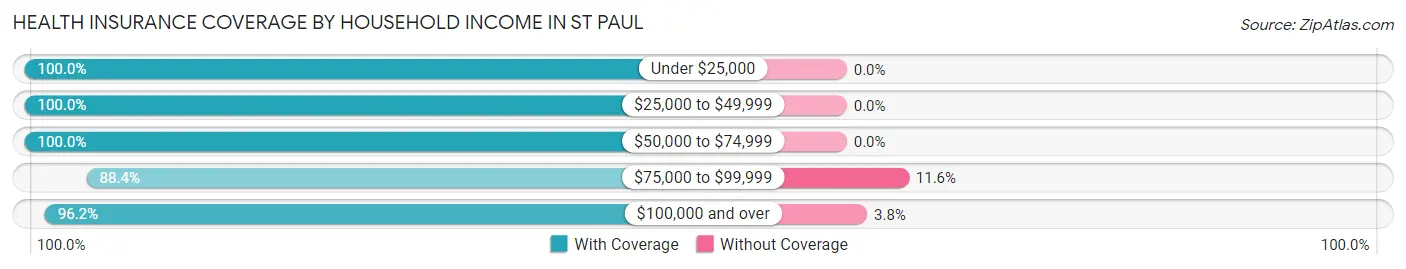
| Household Income | With Coverage | Without Coverage |
| Under $25,000 | 6 (100.0%) | 0 (0.0%) |
| $25,000 to $49,999 | 38 (100.0%) | 0 (0.0%) |
| $50,000 to $74,999 | 51 (100.0%) | 0 (0.0%) |
| $75,000 to $99,999 | 38 (88.4%) | 5 (11.6%) |
| $100,000 and over | 253 (96.2%) | 10 (3.8%) |
Public vs Private Health Insurance Coverage by Age in St Paul
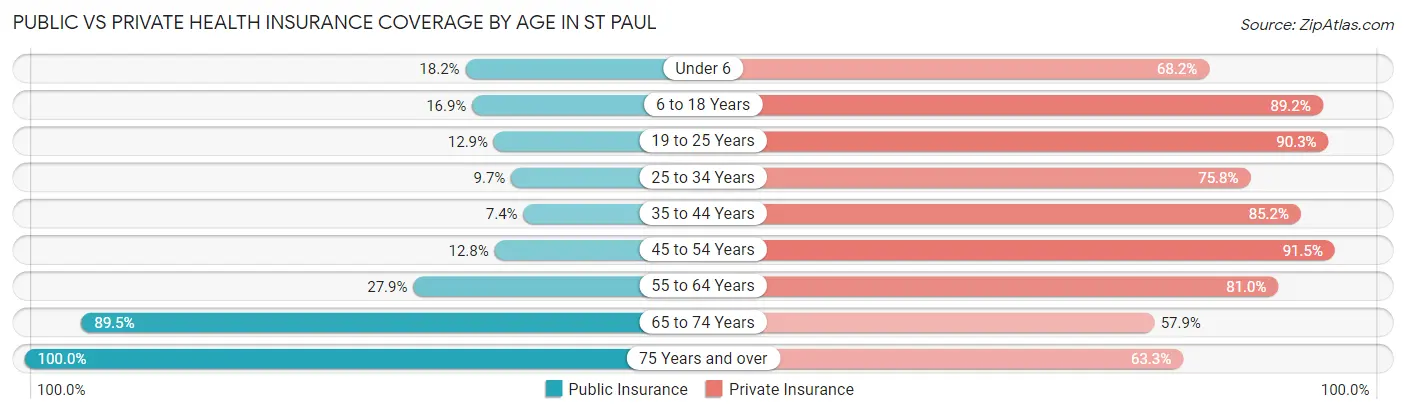
| Age Bracket | Public Insurance | Private Insurance |
| Under 6 | 4 (18.2%) | 15 (68.2%) |
| 6 to 18 Years | 11 (16.9%) | 58 (89.2%) |
| 19 to 25 Years | 4 (12.9%) | 28 (90.3%) |
| 25 to 34 Years | 6 (9.7%) | 47 (75.8%) |
| 35 to 44 Years | 2 (7.4%) | 23 (85.2%) |
| 45 to 54 Years | 6 (12.8%) | 43 (91.5%) |
| 55 to 64 Years | 22 (27.9%) | 64 (81.0%) |
| 65 to 74 Years | 34 (89.5%) | 22 (57.9%) |
| 75 Years and over | 30 (100.0%) | 19 (63.3%) |
| Total | 119 (29.7%) | 319 (79.5%) |
Disability Status by Sex by Age in St Paul
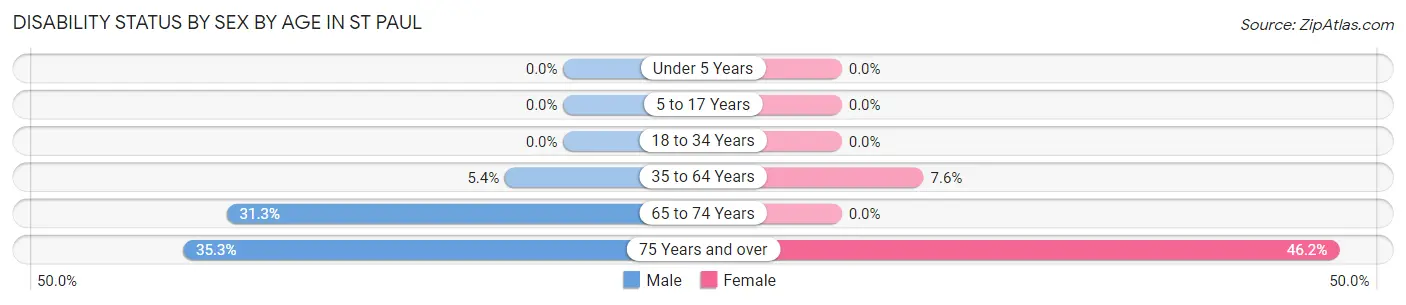
| Age Bracket | Male | Female |
| Under 5 Years | 0 (0.0%) | 0 (0.0%) |
| 5 to 17 Years | 0 (0.0%) | 0 (0.0%) |
| 18 to 34 Years | 0 (0.0%) | 0 (0.0%) |
| 35 to 64 Years | 4 (5.4%) | 6 (7.6%) |
| 65 to 74 Years | 5 (31.2%) | 0 (0.0%) |
| 75 Years and over | 6 (35.3%) | 6 (46.2%) |
Disability Class by Sex by Age in St Paul
Disability Class: Hearing Difficulty
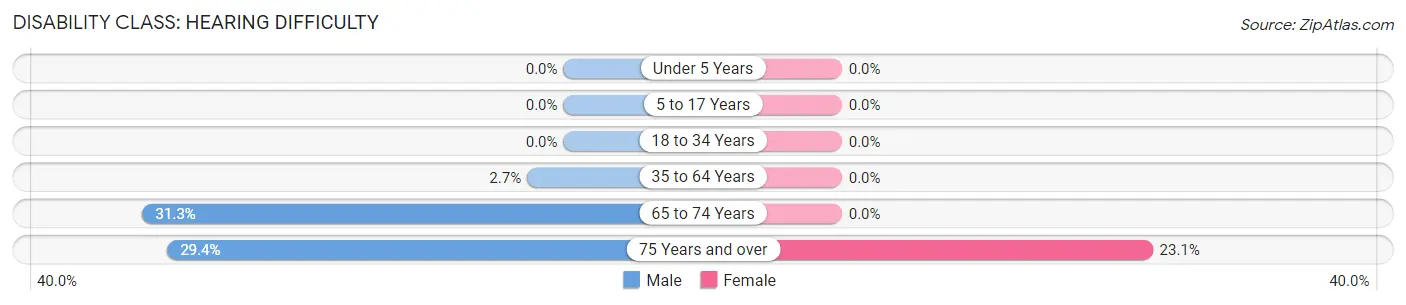
| Age Bracket | Male | Female |
| Under 5 Years | 0 (0.0%) | 0 (0.0%) |
| 5 to 17 Years | 0 (0.0%) | 0 (0.0%) |
| 18 to 34 Years | 0 (0.0%) | 0 (0.0%) |
| 35 to 64 Years | 2 (2.7%) | 0 (0.0%) |
| 65 to 74 Years | 5 (31.2%) | 0 (0.0%) |
| 75 Years and over | 5 (29.4%) | 3 (23.1%) |
Disability Class: Vision Difficulty
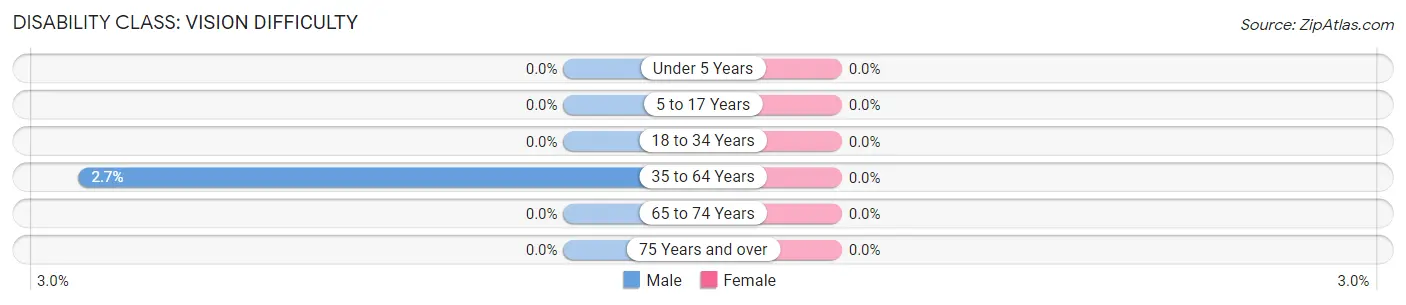
| Age Bracket | Male | Female |
| Under 5 Years | 0 (0.0%) | 0 (0.0%) |
| 5 to 17 Years | 0 (0.0%) | 0 (0.0%) |
| 18 to 34 Years | 0 (0.0%) | 0 (0.0%) |
| 35 to 64 Years | 2 (2.7%) | 0 (0.0%) |
| 65 to 74 Years | 0 (0.0%) | 0 (0.0%) |
| 75 Years and over | 0 (0.0%) | 0 (0.0%) |
Disability Class: Cognitive Difficulty
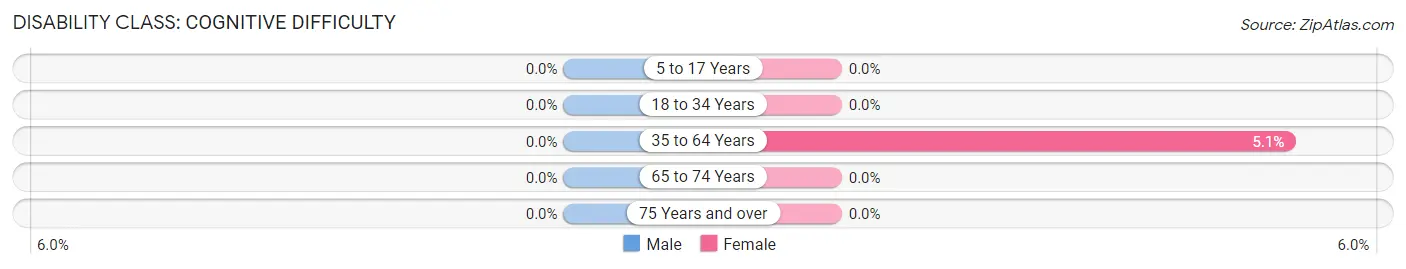
| Age Bracket | Male | Female |
| 5 to 17 Years | 0 (0.0%) | 0 (0.0%) |
| 18 to 34 Years | 0 (0.0%) | 0 (0.0%) |
| 35 to 64 Years | 0 (0.0%) | 4 (5.1%) |
| 65 to 74 Years | 0 (0.0%) | 0 (0.0%) |
| 75 Years and over | 0 (0.0%) | 0 (0.0%) |
Disability Class: Ambulatory Difficulty
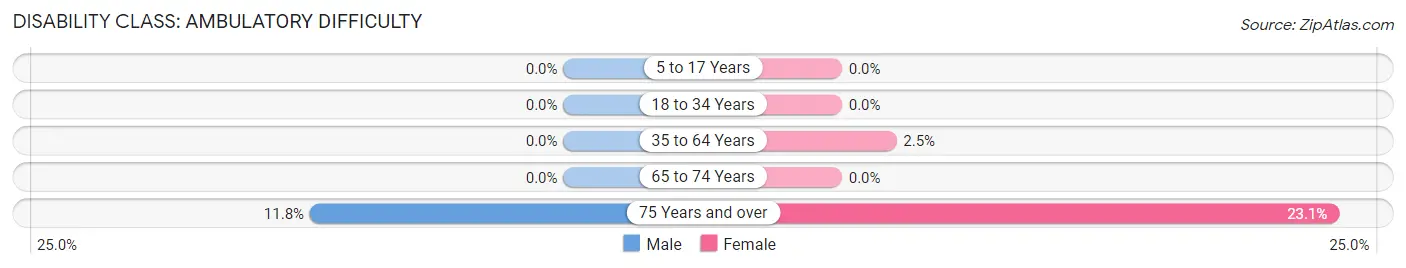
| Age Bracket | Male | Female |
| 5 to 17 Years | 0 (0.0%) | 0 (0.0%) |
| 18 to 34 Years | 0 (0.0%) | 0 (0.0%) |
| 35 to 64 Years | 0 (0.0%) | 2 (2.5%) |
| 65 to 74 Years | 0 (0.0%) | 0 (0.0%) |
| 75 Years and over | 2 (11.8%) | 3 (23.1%) |
Disability Class: Self-Care Difficulty
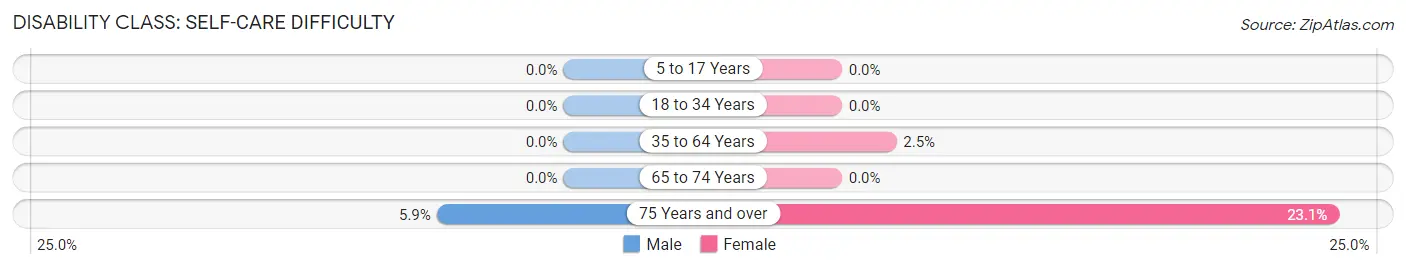
| Age Bracket | Male | Female |
| 5 to 17 Years | 0 (0.0%) | 0 (0.0%) |
| 18 to 34 Years | 0 (0.0%) | 0 (0.0%) |
| 35 to 64 Years | 0 (0.0%) | 2 (2.5%) |
| 65 to 74 Years | 0 (0.0%) | 0 (0.0%) |
| 75 Years and over | 1 (5.9%) | 3 (23.1%) |
Technology Access in St Paul
Computing Device Access in St Paul
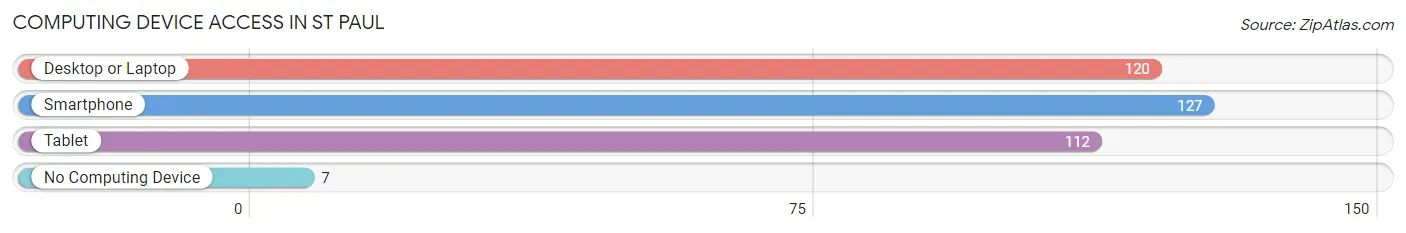
| Device Type | # Households | % Households |
| Desktop or Laptop | 120 | 87.6% |
| Smartphone | 127 | 92.7% |
| Tablet | 112 | 81.8% |
| No Computing Device | 7 | 5.1% |
| Total | 137 | 100.0% |
Internet Access in St Paul
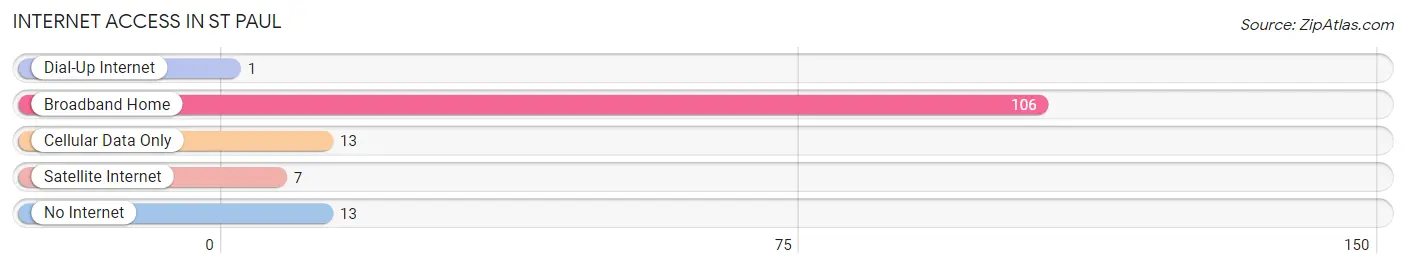
| Internet Type | # Households | % Households |
| Dial-Up Internet | 1 | 0.7% |
| Broadband Home | 106 | 77.4% |
| Cellular Data Only | 13 | 9.5% |
| Satellite Internet | 7 | 5.1% |
| No Internet | 13 | 9.5% |
| Total | 137 | 100.0% |
St Paul Summary
St Paul is a small city located in Marion County, Oregon, United States. It is situated on the banks of the Willamette River, about 25 miles south of Portland. The city has a population of approximately 1,500 people and is part of the Salem Metropolitan Statistical Area.
History
St Paul was founded in 1845 by a group of settlers from the Willamette Valley. The settlers were led by William H. Gray, who named the town after his hometown of St. Paul, Minnesota. The town was originally a farming community, but it soon became a center for logging and lumbering. In 1851, the first sawmill was built in St Paul, and the town quickly became a hub for the lumber industry.
In 1853, the Oregon and California Railroad was built through St Paul, connecting the town to the rest of the state. This allowed the lumber industry to expand, and the town grew rapidly. By the late 1800s, St Paul had become a thriving community with a population of over 1,000 people.
Geography
St Paul is located in the Willamette Valley, about 25 miles south of Portland. The city is situated on the banks of the Willamette River, and is surrounded by rolling hills and lush forests. The city has a total area of 1.3 square miles, all of which is land.
The climate in St Paul is mild and temperate, with warm summers and cool winters. The average annual temperature is around 50 degrees Fahrenheit, and the average annual precipitation is around 40 inches.
Economy
St Paul’s economy is largely based on the lumber industry. The city is home to several sawmills and lumber yards, and the surrounding forests provide a steady supply of timber. The city also has a thriving agricultural sector, with many local farms producing fruits, vegetables, and livestock.
In addition to the lumber and agricultural industries, St Paul also has a growing tourism sector. The city is home to several historic sites, including the St Paul Pioneer Cemetery and the St Paul Historic District. The city also has several parks and recreational areas, including the Willamette River Trail and the St Paul City Park.
Demographics
As of the 2010 census, St Paul had a population of 1,500 people. The racial makeup of the city was 94.7% White, 0.7% African American, 0.7% Native American, 0.7% Asian, 0.3% Pacific Islander, and 2.7% from other races. The median household income was $41,250, and the median family income was $50,000.
St Paul is a small, close-knit community with a strong sense of identity. The city is home to several churches, and the local school district is highly rated. The city is also home to several small businesses, including restaurants, shops, and galleries.
Common Questions
What is Per Capita Income in St Paul?
Per Capita income in St Paul is $43,473.
What is the Median Family Income in St Paul?
Median Family Income in St Paul is $120,000.
What is the Median Household income in St Paul?
Median Household Income in St Paul is $109,250.
What is Income or Wage Gap in St Paul?
Income or Wage Gap in St Paul is 65.0%.
Women in St Paul earn 35.0 cents for every dollar earned by a man.
What is Inequality or Gini Index in St Paul?
Inequality or Gini Index in St Paul is 0.35.
What is the Total Population of St Paul?
Total Population of St Paul is 401.
What is the Total Male Population of St Paul?
Total Male Population of St Paul is 190.
What is the Total Female Population of St Paul?
Total Female Population of St Paul is 211.
What is the Ratio of Males per 100 Females in St Paul?
There are 90.05 Males per 100 Females in St Paul.
What is the Ratio of Females per 100 Males in St Paul?
There are 111.05 Females per 100 Males in St Paul.
What is the Median Population Age in St Paul?
Median Population Age in St Paul is 43.1 Years.
What is the Average Family Size in St Paul
Average Family Size in St Paul is 3.4 People.
What is the Average Household Size in St Paul
Average Household Size in St Paul is 2.9 People.
How Large is the Labor Force in St Paul?
There are 217 People in the Labor Forcein in St Paul.
What is the Percentage of People in the Labor Force in St Paul?
66.8% of People are in the Labor Force in St Paul.
What is the Unemployment Rate in St Paul?
Unemployment Rate in St Paul is 0.5%.