Three Rivers, OR Map & Demographics
Three Rivers Map
Three Rivers Overview
$41,619
PER CAPITA INCOME
$98,320
AVG FAMILY INCOME
$75,313
AVG HOUSEHOLD INCOME
20.5%
WAGE / INCOME GAP [ % ]
79.5¢/ $1
WAGE / INCOME GAP [ $ ]
0.39
INEQUALITY / GINI INDEX
3,762
TOTAL POPULATION
2,123
MALE POPULATION
1,639
FEMALE POPULATION
129.53
MALES / 100 FEMALES
77.20
FEMALES / 100 MALES
51.0
MEDIAN AGE
2.5
AVG FAMILY SIZE
2.2
AVG HOUSEHOLD SIZE
1,991
LABOR FORCE [ PEOPLE ]
58.8%
PERCENT IN LABOR FORCE
8.2%
UNEMPLOYMENT RATE
Income in Three Rivers
Income Overview in Three Rivers
Per Capita Income in Three Rivers is $41,619, while median incomes of families and households are $98,320 and $75,313 respectively.
| Characteristic | Number | Measure |
| Per Capita Income | 3,762 | $41,619 |
| Median Family Income | 1,069 | $98,320 |
| Mean Family Income | 1,069 | $114,401 |
| Median Household Income | 1,707 | $75,313 |
| Mean Household Income | 1,707 | $92,114 |
| Income Deficit | 1,069 | $0 |
| Wage / Income Gap (%) | 3,762 | 20.49% |
| Wage / Income Gap ($) | 3,762 | 79.51¢ per $1 |
| Gini / Inequality Index | 3,762 | 0.39 |
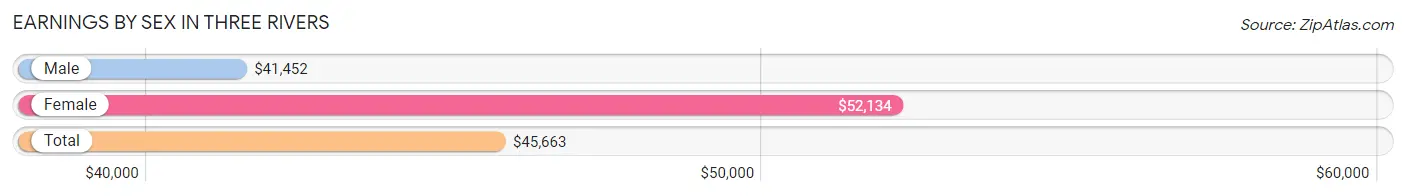
Earnings by Sex in Three Rivers
Average Earnings in Three Rivers are $45,663, $41,452 for men and $52,134 for women, a difference of 20.5%.
| Sex | Number | Average Earnings |
| Male | 1,184 (56.9%) | $41,452 |
| Female | 896 (43.1%) | $52,134 |
| Total | 2,080 (100.0%) | $45,663 |
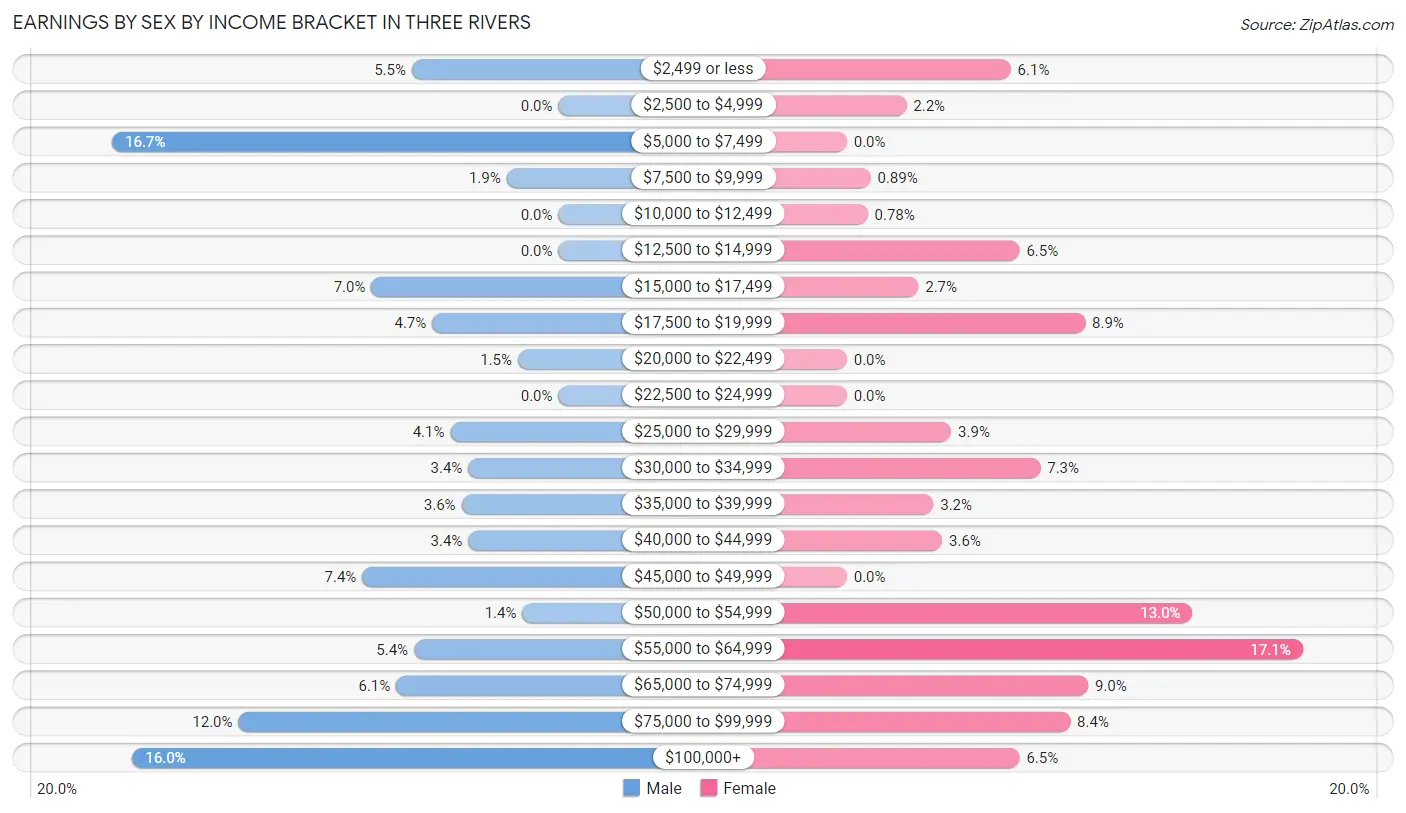
Earnings by Sex by Income Bracket in Three Rivers
The most common earnings brackets in Three Rivers are $5,000 to $7,499 for men (198 | 16.7%) and $55,000 to $64,999 for women (153 | 17.1%).
| Income | Male | Female |
| $2,499 or less | 65 (5.5%) | 55 (6.1%) |
| $2,500 to $4,999 | 0 (0.0%) | 20 (2.2%) |
| $5,000 to $7,499 | 198 (16.7%) | 0 (0.0%) |
| $7,500 to $9,999 | 23 (1.9%) | 8 (0.9%) |
| $10,000 to $12,499 | 0 (0.0%) | 7 (0.8%) |
| $12,500 to $14,999 | 0 (0.0%) | 58 (6.5%) |
| $15,000 to $17,499 | 83 (7.0%) | 24 (2.7%) |
| $17,500 to $19,999 | 56 (4.7%) | 80 (8.9%) |
| $20,000 to $22,499 | 18 (1.5%) | 0 (0.0%) |
| $22,500 to $24,999 | 0 (0.0%) | 0 (0.0%) |
| $25,000 to $29,999 | 48 (4.1%) | 35 (3.9%) |
| $30,000 to $34,999 | 40 (3.4%) | 65 (7.2%) |
| $35,000 to $39,999 | 43 (3.6%) | 29 (3.2%) |
| $40,000 to $44,999 | 40 (3.4%) | 32 (3.6%) |
| $45,000 to $49,999 | 87 (7.3%) | 0 (0.0%) |
| $50,000 to $54,999 | 16 (1.3%) | 116 (13.0%) |
| $55,000 to $64,999 | 64 (5.4%) | 153 (17.1%) |
| $65,000 to $74,999 | 72 (6.1%) | 81 (9.0%) |
| $75,000 to $99,999 | 142 (12.0%) | 75 (8.4%) |
| $100,000+ | 189 (16.0%) | 58 (6.5%) |
| Total | 1,184 (100.0%) | 896 (100.0%) |
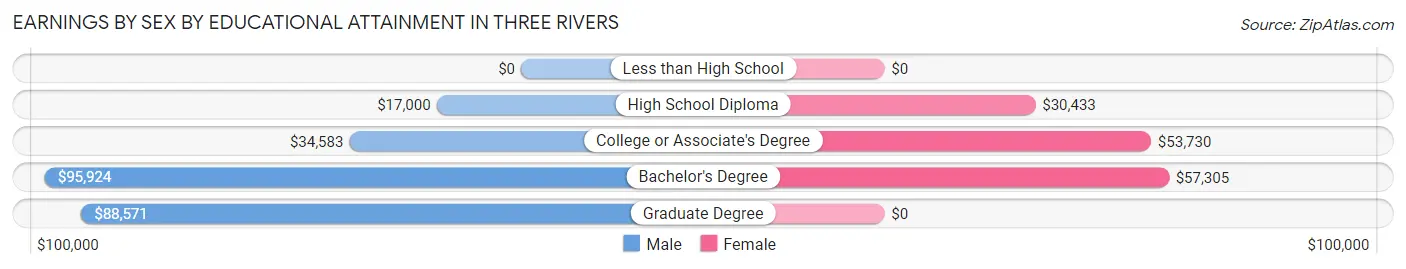
Earnings by Sex by Educational Attainment in Three Rivers
Average earnings in Three Rivers are $45,816 for men and $53,200 for women, a difference of 13.9%. Men with an educational attainment of bachelor's degree enjoy the highest average annual earnings of $95,924, while those with high school diploma education earn the least with $17,000. Women with an educational attainment of bachelor's degree earn the most with the average annual earnings of $57,305, while those with high school diploma education have the smallest earnings of $30,433.
| Educational Attainment | Male Income | Female Income |
| Less than High School | - | - |
| High School Diploma | $17,000 | $30,433 |
| College or Associate's Degree | $34,583 | $53,730 |
| Bachelor's Degree | $95,924 | $57,305 |
| Graduate Degree | $88,571 | $0 |
| Total | $45,816 | $53,200 |
Family Income in Three Rivers
Family Income Brackets in Three Rivers
According to the Three Rivers family income data, there are 231 families falling into the $100,000 to $149,999 income range, which is the most common income bracket and makes up 21.6% of all families.
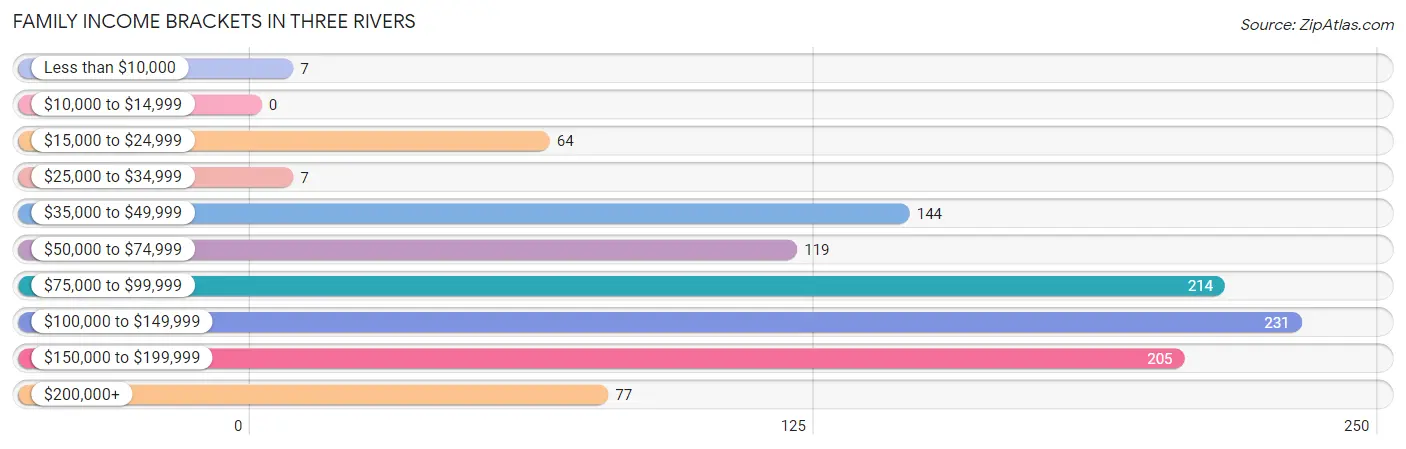
| Income Bracket | # Families | % Families |
| Less than $10,000 | 7 | 0.7% |
| $10,000 to $14,999 | 0 | 0.0% |
| $15,000 to $24,999 | 64 | 6.0% |
| $25,000 to $34,999 | 7 | 0.7% |
| $35,000 to $49,999 | 144 | 13.5% |
| $50,000 to $74,999 | 119 | 11.1% |
| $75,000 to $99,999 | 214 | 20.0% |
| $100,000 to $149,999 | 231 | 21.6% |
| $150,000 to $199,999 | 205 | 19.2% |
| $200,000+ | 77 | 7.2% |
Family Income by Famaliy Size in Three Rivers
3-person families (299 | 28.0%) account for the highest median family income in Three Rivers with $170,804 per family, while 3-person families (299 | 28.0%) have the highest median income of $56,935 per family member.
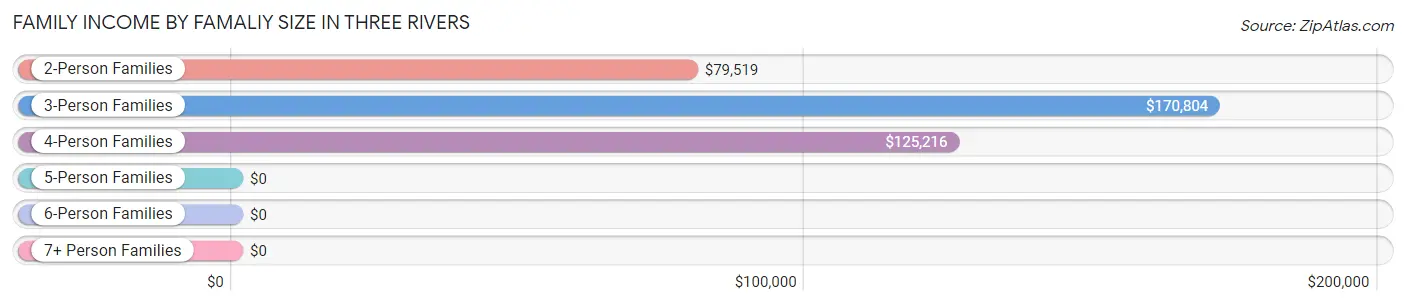
| Income Bracket | # Families | Median Income |
| 2-Person Families | 645 (60.3%) | $79,519 |
| 3-Person Families | 299 (28.0%) | $170,804 |
| 4-Person Families | 89 (8.3%) | $125,216 |
| 5-Person Families | 26 (2.4%) | $0 |
| 6-Person Families | 10 (0.9%) | $0 |
| 7+ Person Families | 0 (0.0%) | $0 |
| Total | 1,069 (100.0%) | $98,320 |
Family Income by Number of Earners in Three Rivers
The median family income in Three Rivers is $98,320, with families comprising 2 earners (440) having the highest median family income of $169,167, while families with no earners (277) have the lowest median family income of $68,229, accounting for 41.2% and 25.9% of families, respectively.
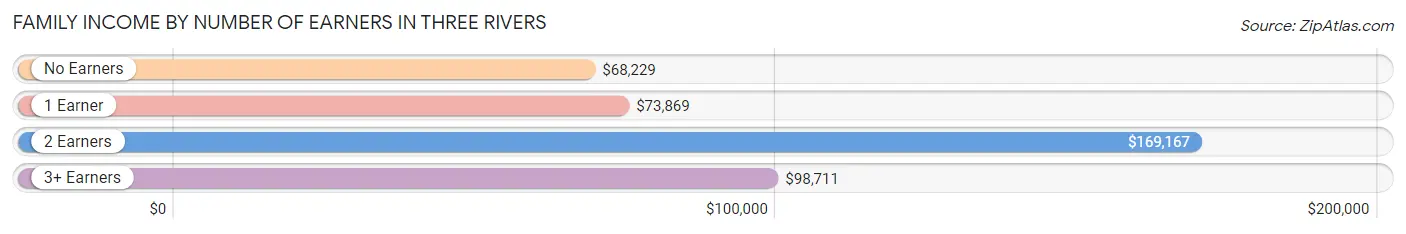
| Number of Earners | # Families | Median Income |
| No Earners | 277 (25.9%) | $68,229 |
| 1 Earner | 251 (23.5%) | $73,869 |
| 2 Earners | 440 (41.2%) | $169,167 |
| 3+ Earners | 101 (9.5%) | $98,711 |
| Total | 1,069 (100.0%) | $98,320 |
Household Income in Three Rivers
Household Income Brackets in Three Rivers
With 321 households falling in the category, the $50,000 to $74,999 income range is the most frequent in Three Rivers, accounting for 18.8% of all households. In contrast, only 14 households (0.8%) fall into the $10,000 to $14,999 income bracket, making it the least populous group.
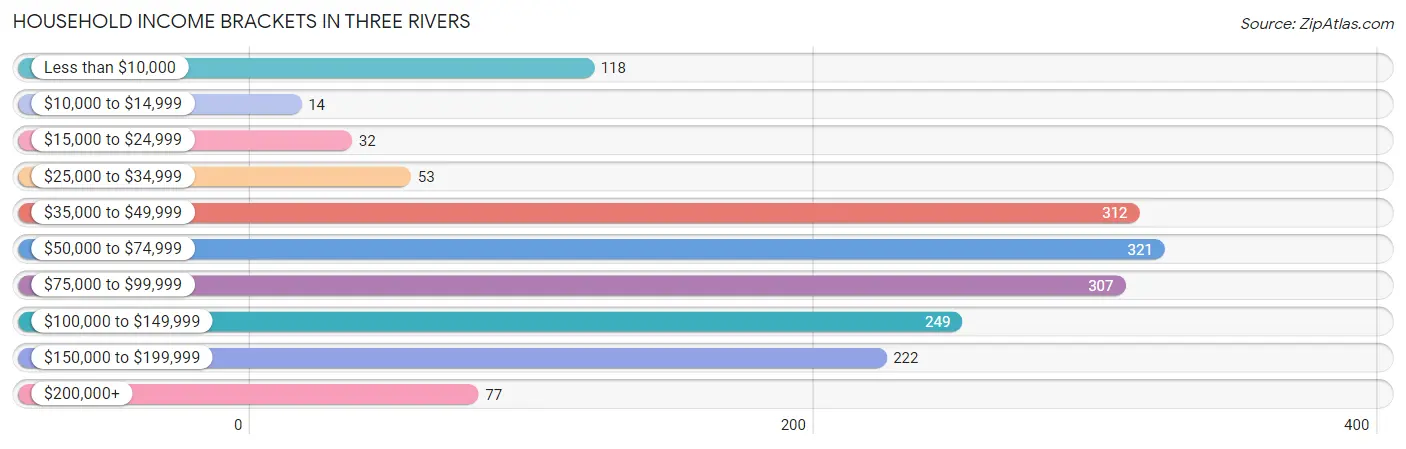
| Income Bracket | # Households | % Households |
| Less than $10,000 | 118 | 6.9% |
| $10,000 to $14,999 | 14 | 0.8% |
| $15,000 to $24,999 | 32 | 1.9% |
| $25,000 to $34,999 | 53 | 3.1% |
| $35,000 to $49,999 | 312 | 18.3% |
| $50,000 to $74,999 | 321 | 18.8% |
| $75,000 to $99,999 | 307 | 18.0% |
| $100,000 to $149,999 | 249 | 14.6% |
| $150,000 to $199,999 | 222 | 13.0% |
| $200,000+ | 77 | 4.5% |
Household Income by Householder Age in Three Rivers
The median household income in Three Rivers is $75,313, with the highest median household income of $101,364 found in the 25 to 44 years age bracket for the primary householder. A total of 496 households (29.1%) fall into this category.
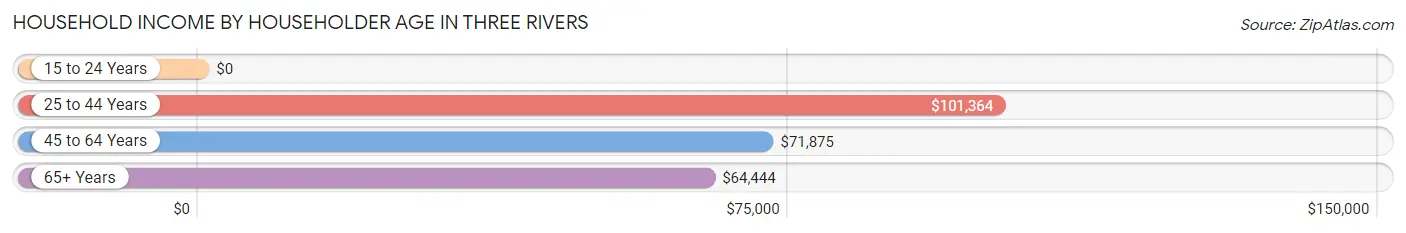
| Income Bracket | # Households | Median Income |
| 15 to 24 Years | 0 (0.0%) | $0 |
| 25 to 44 Years | 496 (29.1%) | $101,364 |
| 45 to 64 Years | 581 (34.0%) | $71,875 |
| 65+ Years | 630 (36.9%) | $64,444 |
| Total | 1,707 (100.0%) | $75,313 |
Poverty in Three Rivers
Income Below Poverty by Sex and Age in Three Rivers
With 5.7% poverty level for males and 3.9% for females among the residents of Three Rivers, 55 to 64 year old males and 55 to 64 year old females are the most vulnerable to poverty, with 111 males (27.2%) and 45 females (14.0%) in their respective age groups living below the poverty level.

| Age Bracket | Male | Female |
| Under 5 Years | 0 (0.0%) | 0 (0.0%) |
| 5 Years | 0 (0.0%) | 0 (0.0%) |
| 6 to 11 Years | 0 (0.0%) | 0 (0.0%) |
| 12 to 14 Years | 0 (0.0%) | 0 (0.0%) |
| 15 Years | 0 (0.0%) | 0 (0.0%) |
| 16 and 17 Years | 0 (0.0%) | 0 (0.0%) |
| 18 to 24 Years | 0 (0.0%) | 0 (0.0%) |
| 25 to 34 Years | 0 (0.0%) | 0 (0.0%) |
| 35 to 44 Years | 7 (3.0%) | 8 (2.7%) |
| 45 to 54 Years | 0 (0.0%) | 0 (0.0%) |
| 55 to 64 Years | 111 (27.2%) | 45 (14.0%) |
| 65 to 74 Years | 0 (0.0%) | 3 (0.7%) |
| 75 Years and over | 0 (0.0%) | 7 (11.1%) |
| Total | 118 (5.7%) | 63 (3.9%) |
Income Above Poverty by Sex and Age in Three Rivers
According to the poverty statistics in Three Rivers, males aged under 5 years and females aged 5 years are the age groups that are most secure financially, with 100.0% of males and 100.0% of females in these age groups living above the poverty line.
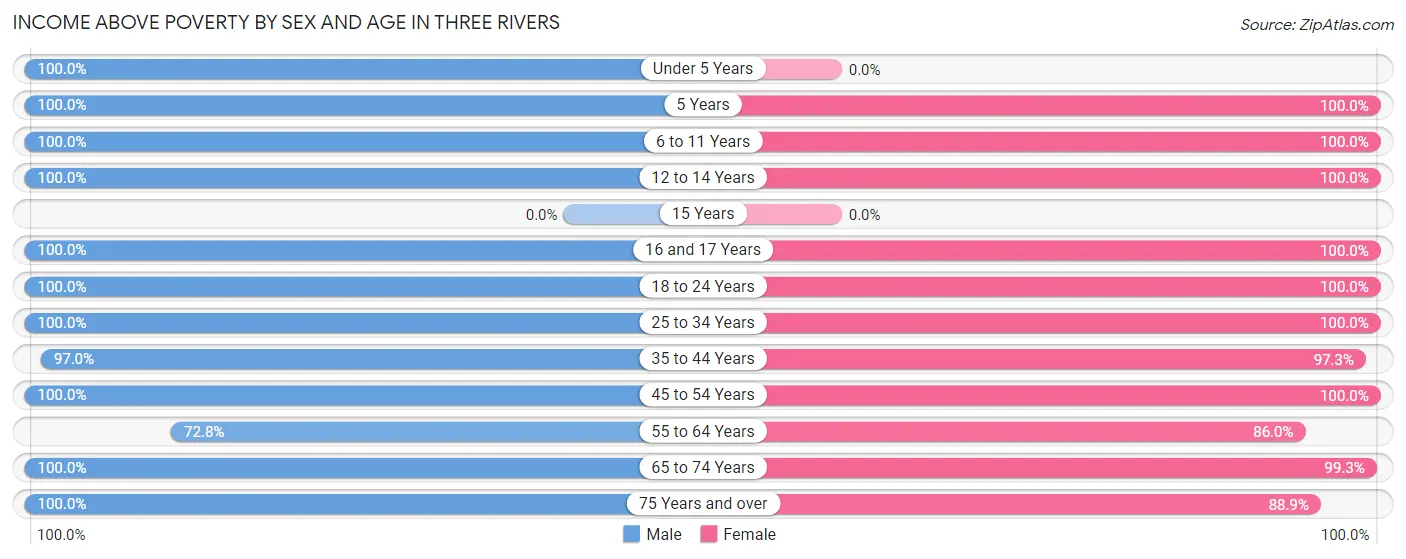
| Age Bracket | Male | Female |
| Under 5 Years | 103 (100.0%) | 0 (0.0%) |
| 5 Years | 11 (100.0%) | 55 (100.0%) |
| 6 to 11 Years | 72 (100.0%) | 20 (100.0%) |
| 12 to 14 Years | 53 (100.0%) | 9 (100.0%) |
| 15 Years | 0 (0.0%) | 0 (0.0%) |
| 16 and 17 Years | 54 (100.0%) | 44 (100.0%) |
| 18 to 24 Years | 61 (100.0%) | 10 (100.0%) |
| 25 to 34 Years | 383 (100.0%) | 255 (100.0%) |
| 35 to 44 Years | 224 (97.0%) | 284 (97.3%) |
| 45 to 54 Years | 144 (100.0%) | 142 (100.0%) |
| 55 to 64 Years | 297 (72.8%) | 277 (86.0%) |
| 65 to 74 Years | 397 (100.0%) | 404 (99.3%) |
| 75 Years and over | 173 (100.0%) | 56 (88.9%) |
| Total | 1,972 (94.4%) | 1,556 (96.1%) |
Income Below Poverty Among Married-Couple Families in Three Rivers
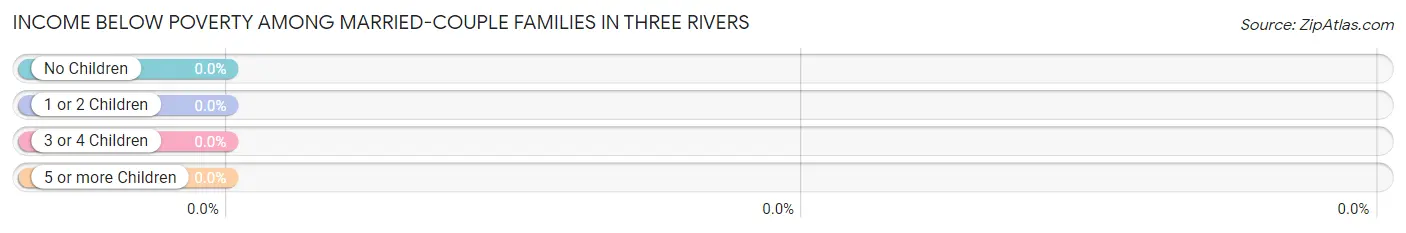
| Children | Above Poverty | Below Poverty |
| No Children | 653 (100.0%) | 0 (0.0%) |
| 1 or 2 Children | 313 (100.0%) | 0 (0.0%) |
| 3 or 4 Children | 10 (100.0%) | 0 (0.0%) |
| 5 or more Children | 0 (0.0%) | 0 (0.0%) |
| Total | 976 (100.0%) | 0 (0.0%) |
Income Below Poverty Among Single-Parent Households in Three Rivers
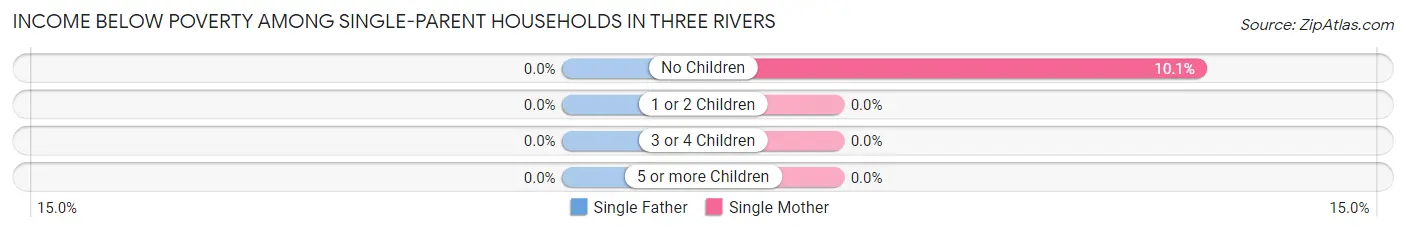
| Children | Single Father | Single Mother |
| No Children | 0 (0.0%) | 7 (10.1%) |
| 1 or 2 Children | 0 (0.0%) | 0 (0.0%) |
| 3 or 4 Children | 0 (0.0%) | 0 (0.0%) |
| 5 or more Children | 0 (0.0%) | 0 (0.0%) |
| Total | 0 (0.0%) | 7 (7.5%) |
Income Below Poverty Among Married-Couple vs Single-Parent Households in Three Rivers
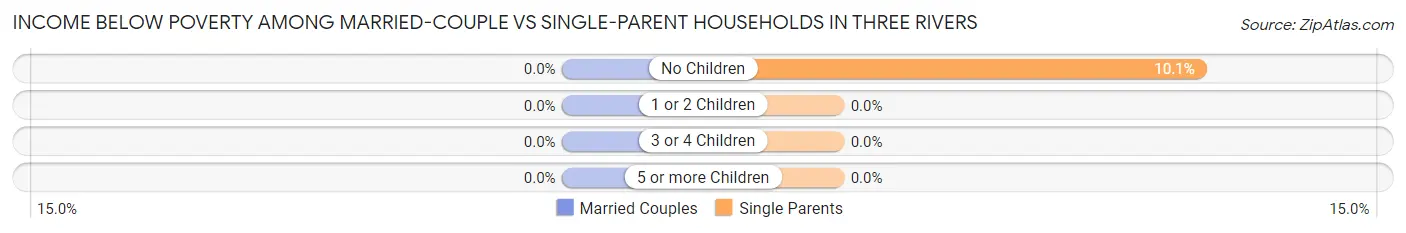
| Children | Married-Couple Families | Single-Parent Households |
| No Children | 0 (0.0%) | 7 (10.1%) |
| 1 or 2 Children | 0 (0.0%) | 0 (0.0%) |
| 3 or 4 Children | 0 (0.0%) | 0 (0.0%) |
| 5 or more Children | 0 (0.0%) | 0 (0.0%) |
| Total | 0 (0.0%) | 7 (7.5%) |
Race in Three Rivers
The most populous races in Three Rivers are White / Caucasian (3,364 | 89.4%), Hispanic or Latino (172 | 4.6%), and Some other Race (158 | 4.2%).
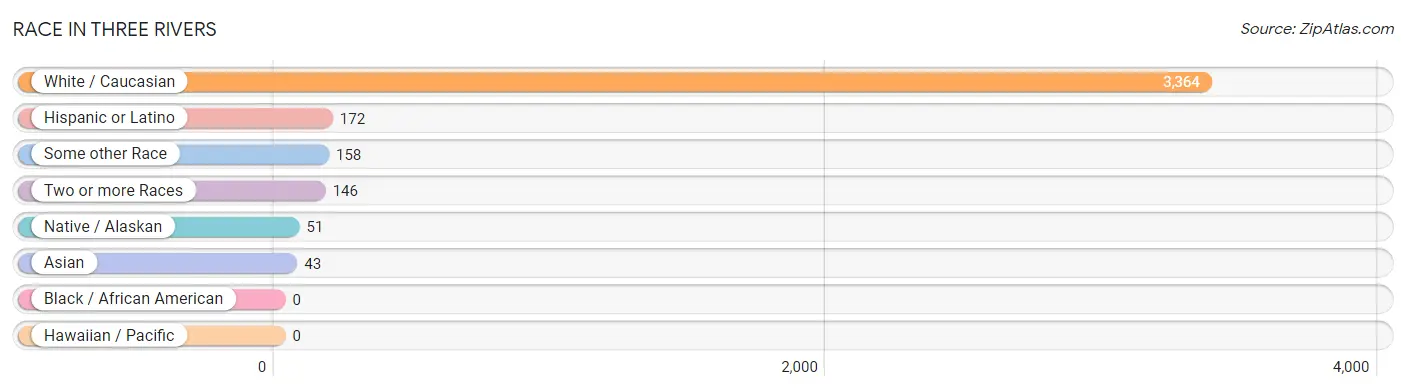
| Race | # Population | % Population |
| Asian | 43 | 1.1% |
| Black / African American | 0 | 0.0% |
| Hawaiian / Pacific | 0 | 0.0% |
| Hispanic or Latino | 172 | 4.6% |
| Native / Alaskan | 51 | 1.4% |
| White / Caucasian | 3,364 | 89.4% |
| Two or more Races | 146 | 3.9% |
| Some other Race | 158 | 4.2% |
| Total | 3,762 | 100.0% |
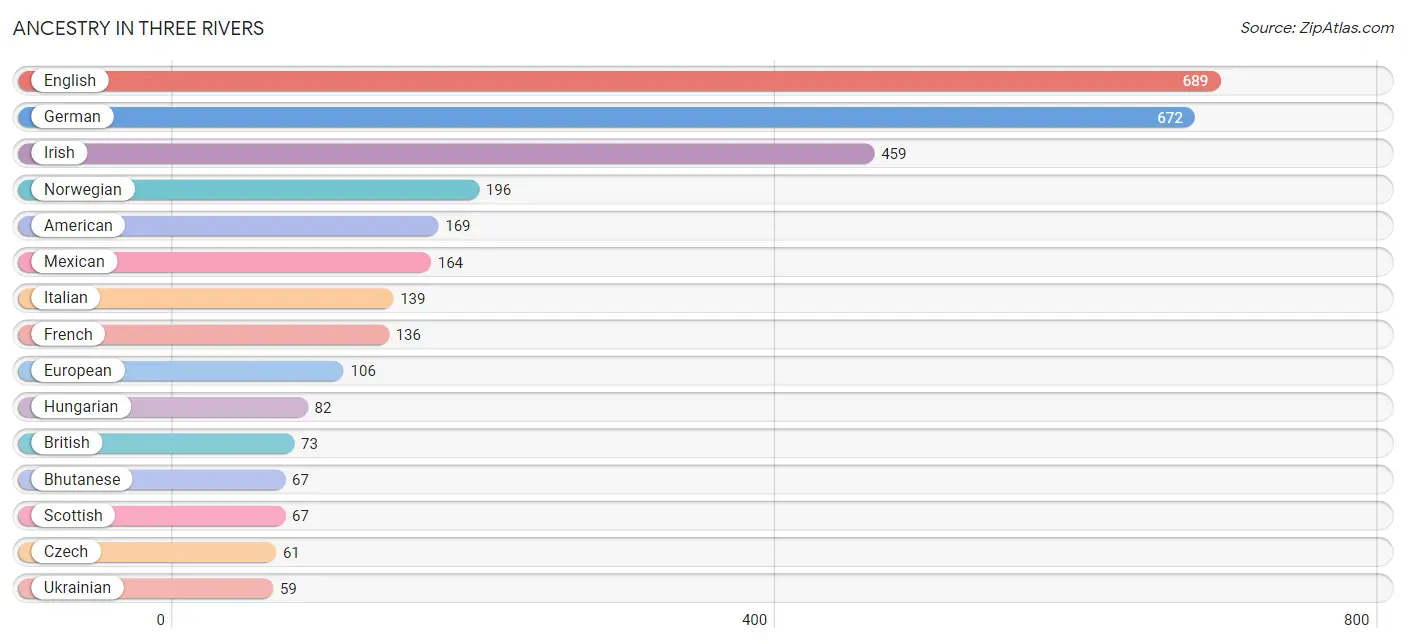
Ancestry in Three Rivers
The most populous ancestries reported in Three Rivers are English (689 | 18.3%), German (672 | 17.9%), Irish (459 | 12.2%), Norwegian (196 | 5.2%), and American (169 | 4.5%), together accounting for 58.1% of all Three Rivers residents.
| Ancestry | # Population | % Population |
| Alsatian | 7 | 0.2% |
| American | 169 | 4.5% |
| Austrian | 14 | 0.4% |
| Basque | 8 | 0.2% |
| Bhutanese | 67 | 1.8% |
| British | 73 | 1.9% |
| Burmese | 46 | 1.2% |
| Cherokee | 17 | 0.4% |
| Czech | 61 | 1.6% |
| Czechoslovakian | 9 | 0.2% |
| Danish | 9 | 0.2% |
| Dutch | 18 | 0.5% |
| Eastern European | 26 | 0.7% |
| English | 689 | 18.3% |
| European | 106 | 2.8% |
| Finnish | 12 | 0.3% |
| French | 136 | 3.6% |
| German | 672 | 17.9% |
| Greek | 13 | 0.4% |
| Hungarian | 82 | 2.2% |
| Irish | 459 | 12.2% |
| Italian | 139 | 3.7% |
| Korean | 43 | 1.1% |
| Lumbee | 13 | 0.4% |
| Mexican | 164 | 4.4% |
| Norwegian | 196 | 5.2% |
| Polish | 5 | 0.1% |
| Portuguese | 44 | 1.2% |
| Puget Sound Salish | 38 | 1.0% |
| Russian | 10 | 0.3% |
| Scandinavian | 23 | 0.6% |
| Scotch-Irish | 17 | 0.4% |
| Scottish | 67 | 1.8% |
| Spanish | 8 | 0.2% |
| Swedish | 21 | 0.6% |
| Swiss | 29 | 0.8% |
| Ukrainian | 59 | 1.6% |
| Welsh | 48 | 1.3% | View All 38 Rows |
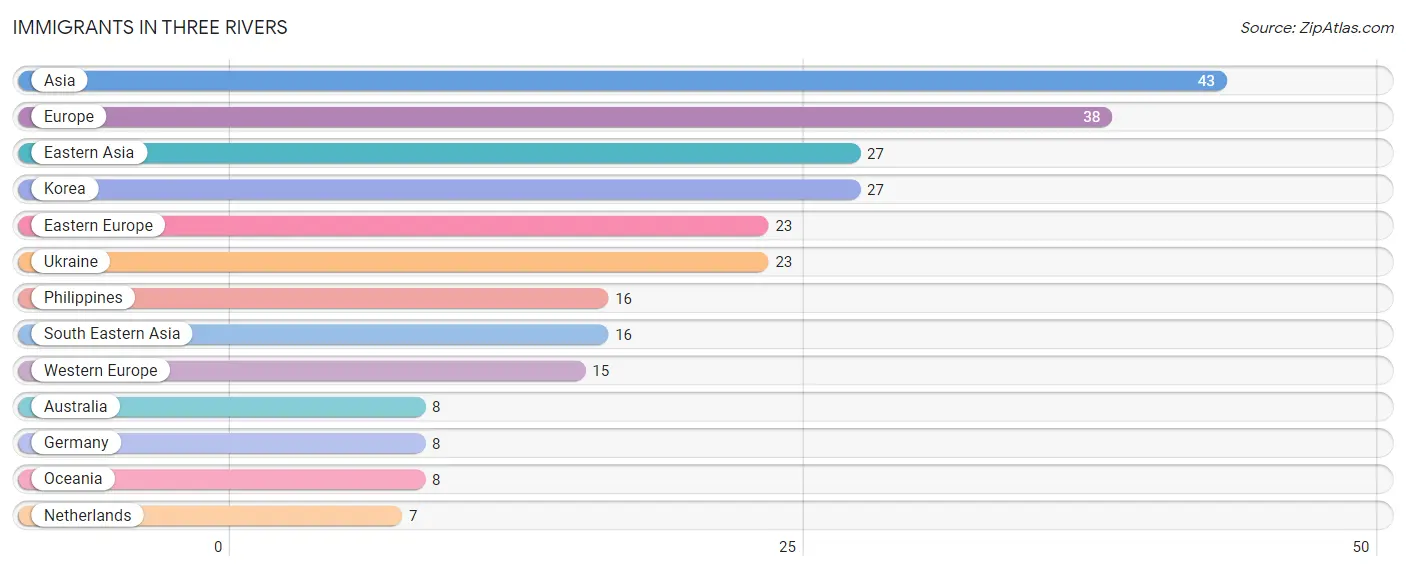
Immigrants in Three Rivers
The most numerous immigrant groups reported in Three Rivers came from Asia (43 | 1.1%), Europe (38 | 1.0%), Eastern Asia (27 | 0.7%), Korea (27 | 0.7%), and Eastern Europe (23 | 0.6%), together accounting for 4.2% of all Three Rivers residents.
| Immigration Origin | # Population | % Population |
| Asia | 43 | 1.1% |
| Australia | 8 | 0.2% |
| Eastern Asia | 27 | 0.7% |
| Eastern Europe | 23 | 0.6% |
| Europe | 38 | 1.0% |
| Germany | 8 | 0.2% |
| Korea | 27 | 0.7% |
| Netherlands | 7 | 0.2% |
| Oceania | 8 | 0.2% |
| Philippines | 16 | 0.4% |
| South Eastern Asia | 16 | 0.4% |
| Ukraine | 23 | 0.6% |
| Western Europe | 15 | 0.4% | View All 13 Rows |
Sex and Age in Three Rivers
Sex and Age in Three Rivers
The most populous age groups in Three Rivers are 60 to 64 Years (277 | 13.1%) for men and 65 to 69 Years (251 | 15.3%) for women.
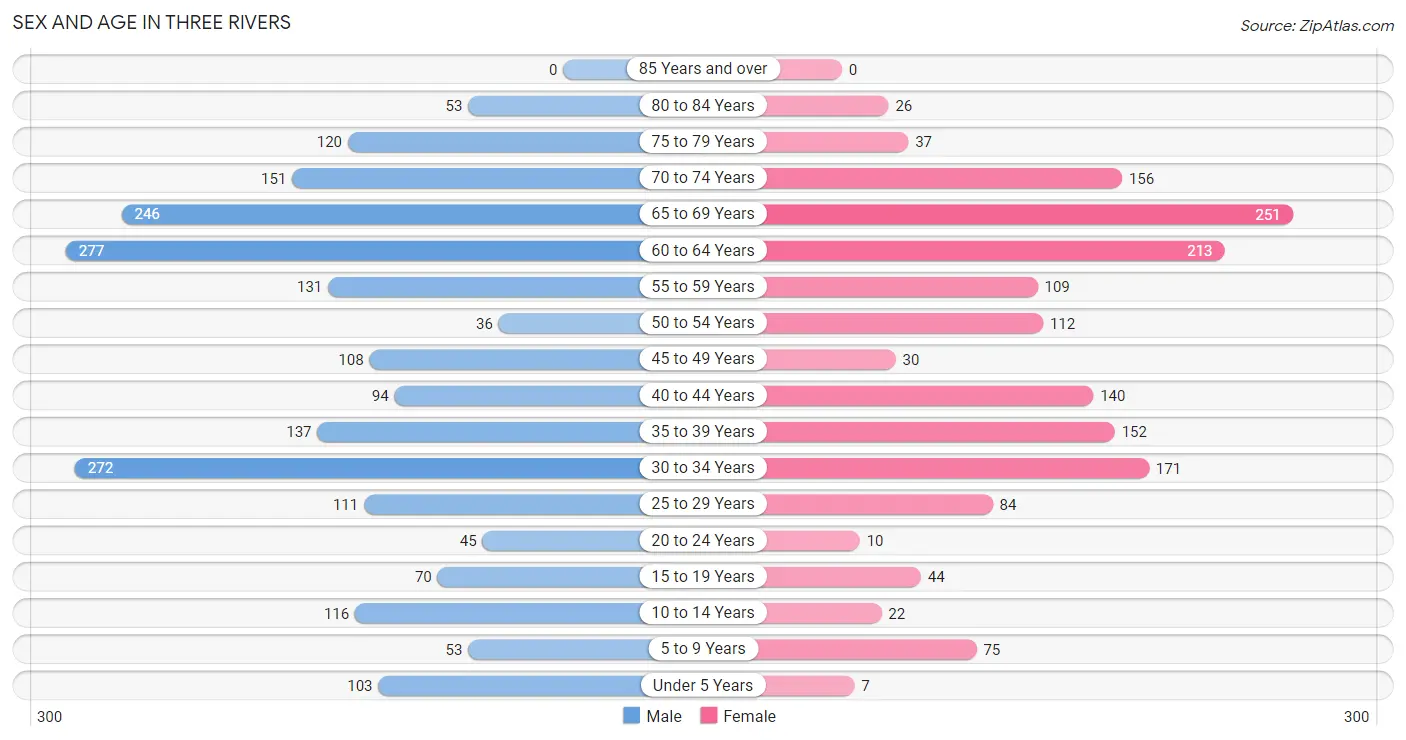
| Age Bracket | Male | Female |
| Under 5 Years | 103 (4.9%) | 7 (0.4%) |
| 5 to 9 Years | 53 (2.5%) | 75 (4.6%) |
| 10 to 14 Years | 116 (5.5%) | 22 (1.3%) |
| 15 to 19 Years | 70 (3.3%) | 44 (2.7%) |
| 20 to 24 Years | 45 (2.1%) | 10 (0.6%) |
| 25 to 29 Years | 111 (5.2%) | 84 (5.1%) |
| 30 to 34 Years | 272 (12.8%) | 171 (10.4%) |
| 35 to 39 Years | 137 (6.5%) | 152 (9.3%) |
| 40 to 44 Years | 94 (4.4%) | 140 (8.5%) |
| 45 to 49 Years | 108 (5.1%) | 30 (1.8%) |
| 50 to 54 Years | 36 (1.7%) | 112 (6.8%) |
| 55 to 59 Years | 131 (6.2%) | 109 (6.7%) |
| 60 to 64 Years | 277 (13.1%) | 213 (13.0%) |
| 65 to 69 Years | 246 (11.6%) | 251 (15.3%) |
| 70 to 74 Years | 151 (7.1%) | 156 (9.5%) |
| 75 to 79 Years | 120 (5.7%) | 37 (2.3%) |
| 80 to 84 Years | 53 (2.5%) | 26 (1.6%) |
| 85 Years and over | 0 (0.0%) | 0 (0.0%) |
| Total | 2,123 (100.0%) | 1,639 (100.0%) |
Families and Households in Three Rivers
Median Family Size in Three Rivers
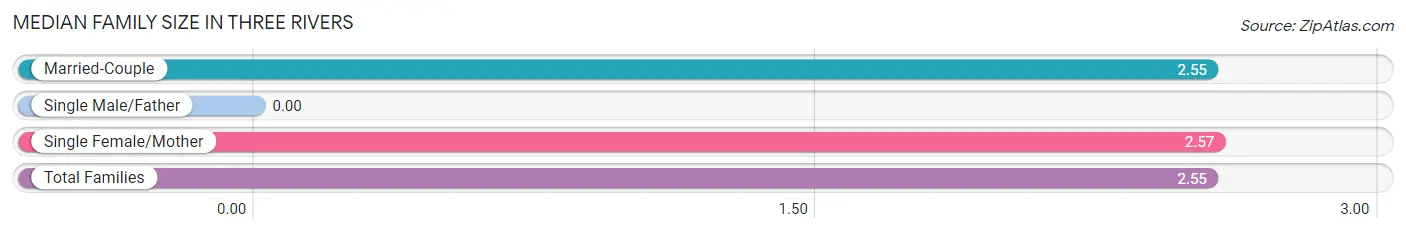
| Family Type | # Families | Family Size |
| Married-Couple | 976 (91.3%) | 2.55 |
| Single Male/Father | 0 (0.0%) | - |
| Single Female/Mother | 93 (8.7%) | 2.57 |
| Total Families | 1,069 (100.0%) | 2.55 |
Median Household Size in Three Rivers
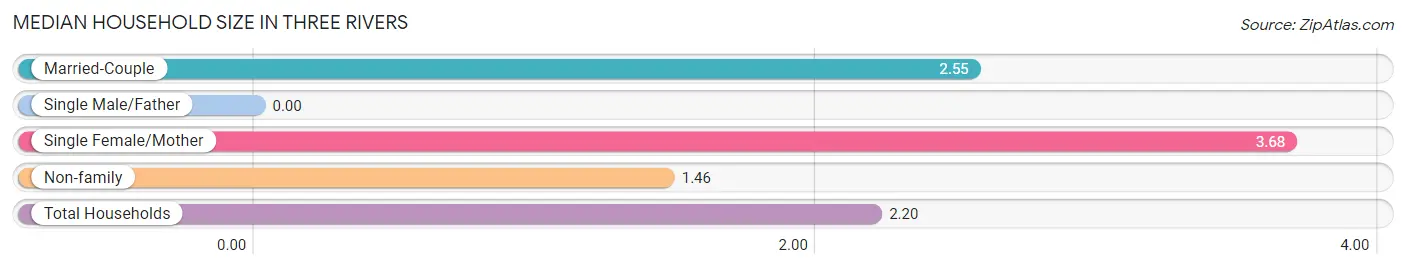
| Household Type | # Households | Household Size |
| Married-Couple | 976 (57.2%) | 2.55 |
| Single Male/Father | 0 (0.0%) | - |
| Single Female/Mother | 93 (5.4%) | 3.68 |
| Non-family | 638 (37.4%) | 1.46 |
| Total Households | 1,707 (100.0%) | 2.20 |
Household Size by Marriage Status in Three Rivers
Out of a total of 1,707 households in Three Rivers, 1,069 (62.6%) are family households, while 638 (37.4%) are nonfamily households. The most numerous type of family households are 2-person households, comprising 587, and the most common type of nonfamily households are 1-person households, comprising 380.
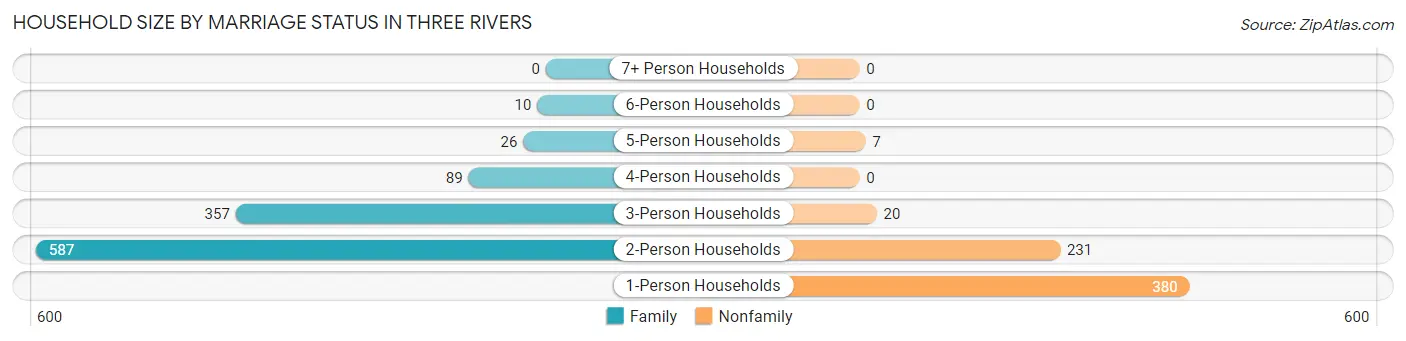
| Household Size | Family Households | Nonfamily Households |
| 1-Person Households | - | 380 (22.3%) |
| 2-Person Households | 587 (34.4%) | 231 (13.5%) |
| 3-Person Households | 357 (20.9%) | 20 (1.2%) |
| 4-Person Households | 89 (5.2%) | 0 (0.0%) |
| 5-Person Households | 26 (1.5%) | 7 (0.4%) |
| 6-Person Households | 10 (0.6%) | 0 (0.0%) |
| 7+ Person Households | 0 (0.0%) | 0 (0.0%) |
| Total | 1,069 (62.6%) | 638 (37.4%) |
Female Fertility in Three Rivers
Fertility by Age in Three Rivers
Average fertility rate in Three Rivers is 12.0 births per 1,000 women. Women in the age bracket of 35 to 50 years have the highest fertility rate with 22.0 births per 1,000 women. Women in the age bracket of 35 to 50 years acount for 100.0% of all women with births.
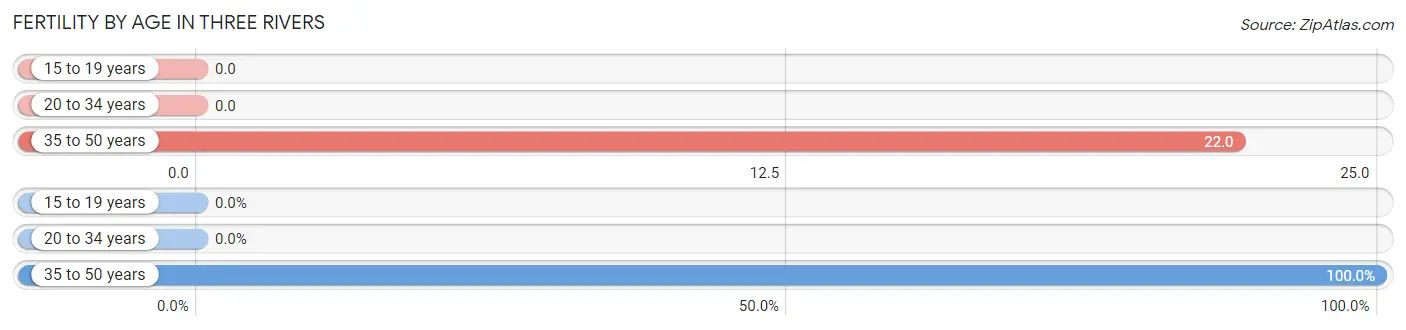
| Age Bracket | Women with Births | Births / 1,000 Women |
| 15 to 19 years | 0 (0.0%) | 0.0 |
| 20 to 34 years | 0 (0.0%) | 0.0 |
| 35 to 50 years | 8 (100.0%) | 22.0 |
| Total | 8 (100.0%) | 12.0 |
Fertility by Age by Marriage Status in Three Rivers
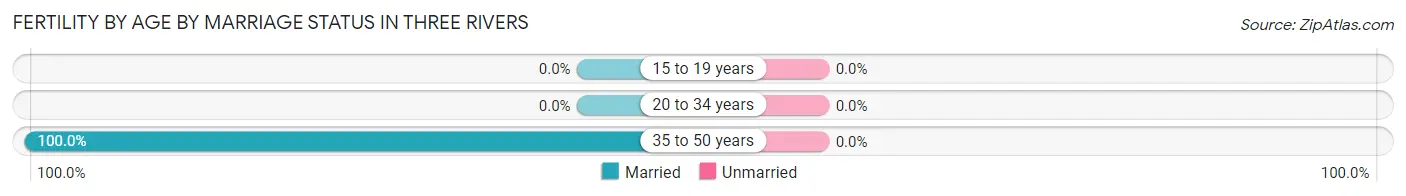
| Age Bracket | Married | Unmarried |
| 15 to 19 years | 0 (0.0%) | 0 (0.0%) |
| 20 to 34 years | 0 (0.0%) | 0 (0.0%) |
| 35 to 50 years | 8 (100.0%) | 0 (0.0%) |
| Total | 8 (100.0%) | 0 (0.0%) |
Fertility by Education in Three Rivers
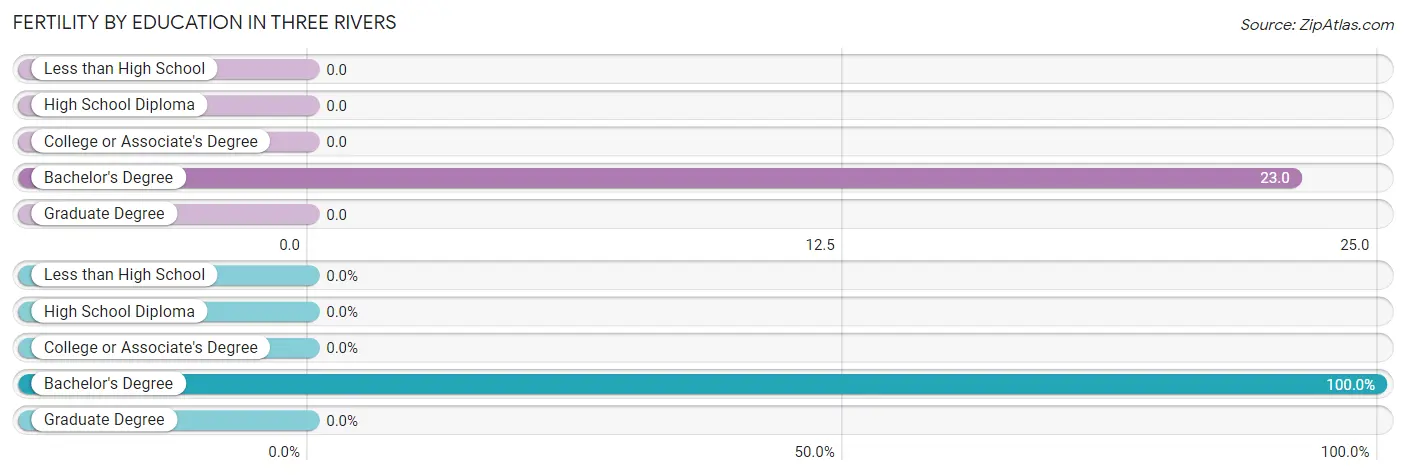
| Educational Attainment | Women with Births | Births / 1,000 Women |
| Less than High School | 0 (0.0%) | 0.0 |
| High School Diploma | 0 (0.0%) | 0.0 |
| College or Associate's Degree | 0 (0.0%) | 0.0 |
| Bachelor's Degree | 8 (100.0%) | 23.0 |
| Graduate Degree | 0 (0.0%) | 0.0 |
| Total | 8 (100.0%) | 12.0 |
Fertility by Education by Marriage Status in Three Rivers
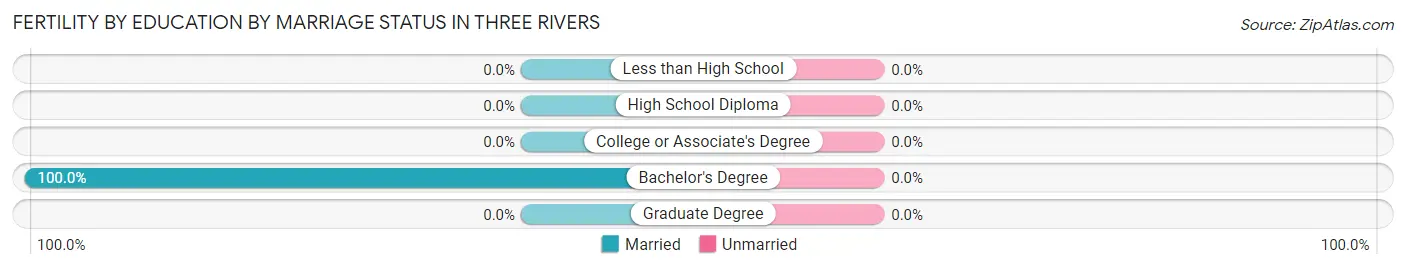
| Educational Attainment | Married | Unmarried |
| Less than High School | 0 (0.0%) | 0 (0.0%) |
| High School Diploma | 0 (0.0%) | 0 (0.0%) |
| College or Associate's Degree | 0 (0.0%) | 0 (0.0%) |
| Bachelor's Degree | 8 (100.0%) | 0 (0.0%) |
| Graduate Degree | 0 (0.0%) | 0 (0.0%) |
| Total | 8 (100.0%) | 0 (0.0%) |
Employment Characteristics in Three Rivers
Employment by Class of Employer in Three Rivers
Among the 1,800 employed individuals in Three Rivers, private company employees (1,078 | 59.9%), not-for-profit organizations (360 | 20.0%), and self-employed (not incorporated) (224 | 12.4%) make up the most common classes of employment.
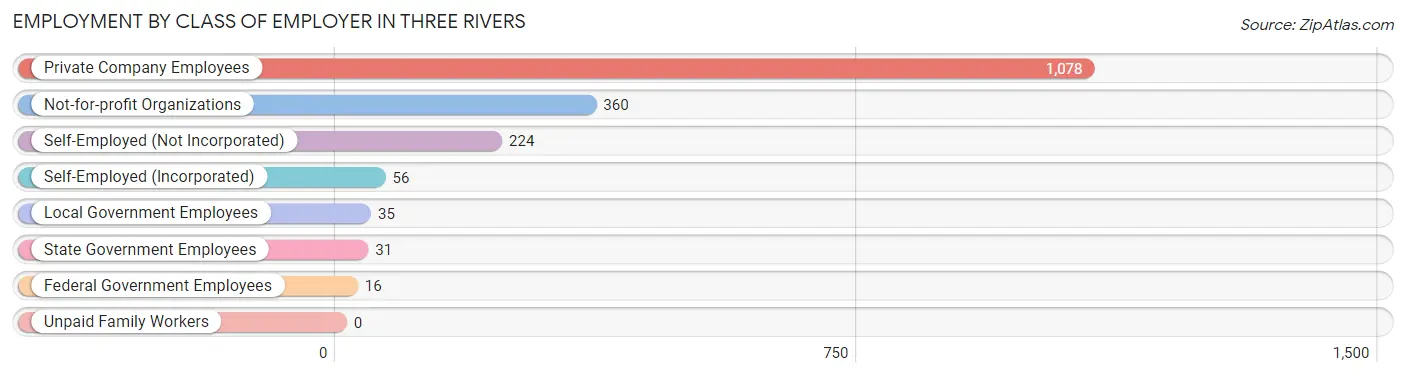
| Employer Class | # Employees | % Employees |
| Private Company Employees | 1,078 | 59.9% |
| Self-Employed (Incorporated) | 56 | 3.1% |
| Self-Employed (Not Incorporated) | 224 | 12.4% |
| Not-for-profit Organizations | 360 | 20.0% |
| Local Government Employees | 35 | 1.9% |
| State Government Employees | 31 | 1.7% |
| Federal Government Employees | 16 | 0.9% |
| Unpaid Family Workers | 0 | 0.0% |
| Total | 1,800 | 100.0% |
Employment Status by Age in Three Rivers
According to the labor force statistics for Three Rivers, out of the total population over 16 years of age (3,386), 58.8% or 1,991 individuals are in the labor force, with 8.2% or 163 of them unemployed. The age group with the highest labor force participation rate is 20 to 24 years, with 100.0% or 55 individuals in the labor force. Within the labor force, the 20 to 24 years age range has the highest percentage of unemployed individuals, with 81.8% or 45 of them being unemployed.
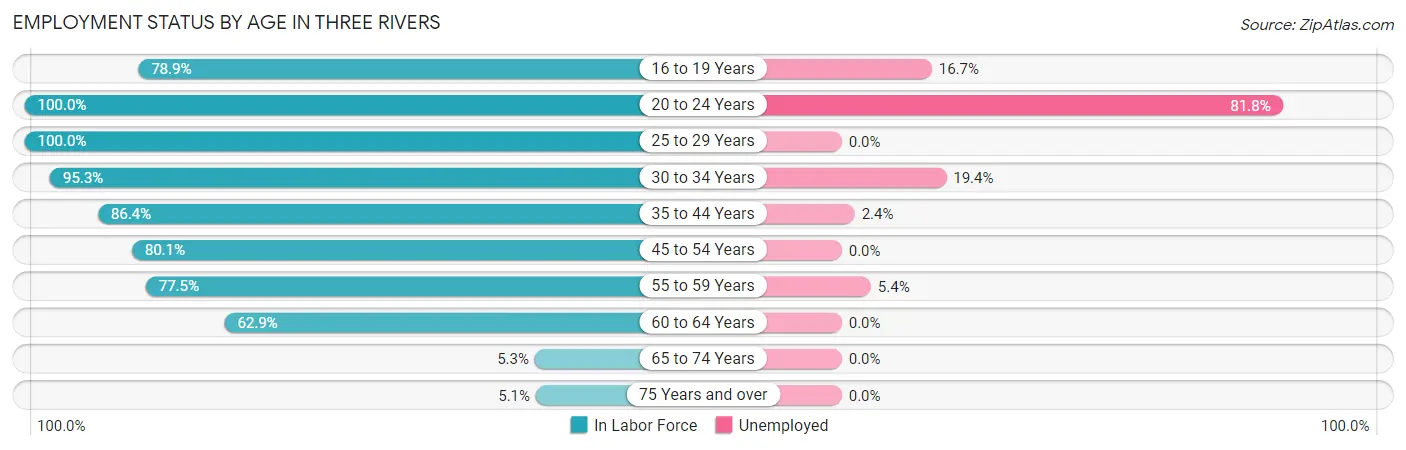
| Age Bracket | In Labor Force | Unemployed |
| 16 to 19 Years | 90 (78.9%) | 15 (16.7%) |
| 20 to 24 Years | 55 (100.0%) | 45 (81.8%) |
| 25 to 29 Years | 195 (100.0%) | 0 (0.0%) |
| 30 to 34 Years | 422 (95.3%) | 82 (19.4%) |
| 35 to 44 Years | 452 (86.4%) | 11 (2.4%) |
| 45 to 54 Years | 229 (80.1%) | 0 (0.0%) |
| 55 to 59 Years | 186 (77.5%) | 10 (5.4%) |
| 60 to 64 Years | 308 (62.9%) | 0 (0.0%) |
| 65 to 74 Years | 43 (5.3%) | 0 (0.0%) |
| 75 Years and over | 12 (5.1%) | 0 (0.0%) |
| Total | 1,991 (58.8%) | 163 (8.2%) |
Employment Status by Educational Attainment in Three Rivers
According to labor force statistics for Three Rivers, 82.3% of individuals (1,792) out of the total population between 25 and 64 years of age (2,177) are in the labor force, with 5.7% or 102 of them being unemployed. The group with the highest labor force participation rate are those with the educational attainment of bachelor's degree or higher, with 85.3% or 759 individuals in the labor force. Within the labor force, individuals with high school diploma education have the highest percentage of unemployment, with 21.7% or 82 of them being unemployed.
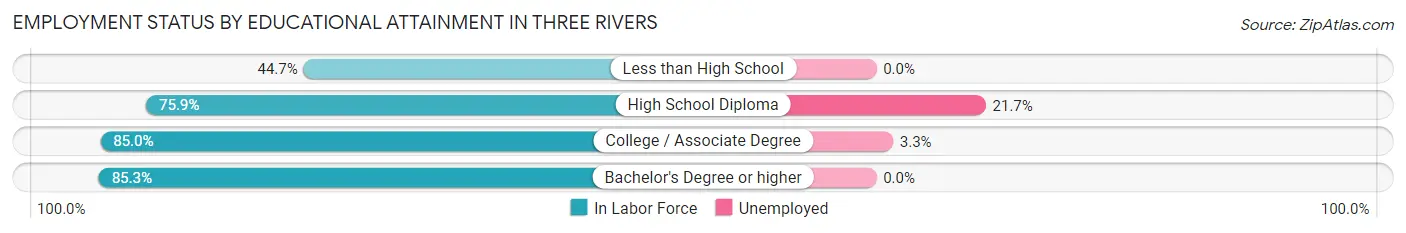
| Educational Attainment | In Labor Force | Unemployed |
| Less than High School | 17 (44.7%) | 0 (0.0%) |
| High School Diploma | 378 (75.9%) | 108 (21.7%) |
| College / Associate Degree | 638 (85.0%) | 25 (3.3%) |
| Bachelor's Degree or higher | 759 (85.3%) | 0 (0.0%) |
| Total | 1,792 (82.3%) | 124 (5.7%) |
Employment Occupations by Sex in Three Rivers
Management, Business, Science and Arts Occupations
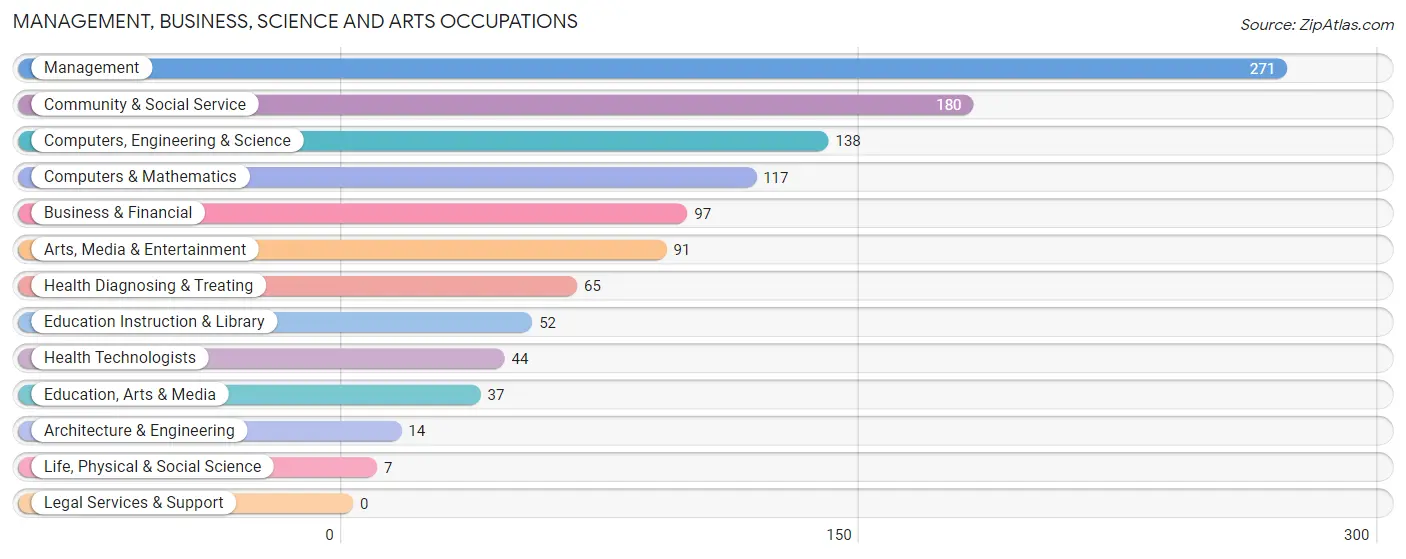
The most common Management, Business, Science and Arts occupations in Three Rivers are Management (271 | 14.8%), Community & Social Service (180 | 9.8%), Computers, Engineering & Science (138 | 7.5%), Computers & Mathematics (117 | 6.4%), and Business & Financial (97 | 5.3%).
Management, Business, Science and Arts Occupations by Sex
Within the Management, Business, Science and Arts occupations in Three Rivers, the most male-oriented occupations are Architecture & Engineering (100.0%), Life, Physical & Social Science (100.0%), and Computers, Engineering & Science (79.0%), while the most female-oriented occupations are Education Instruction & Library (100.0%), Arts, Media & Entertainment (100.0%), and Health Diagnosing & Treating (92.3%).
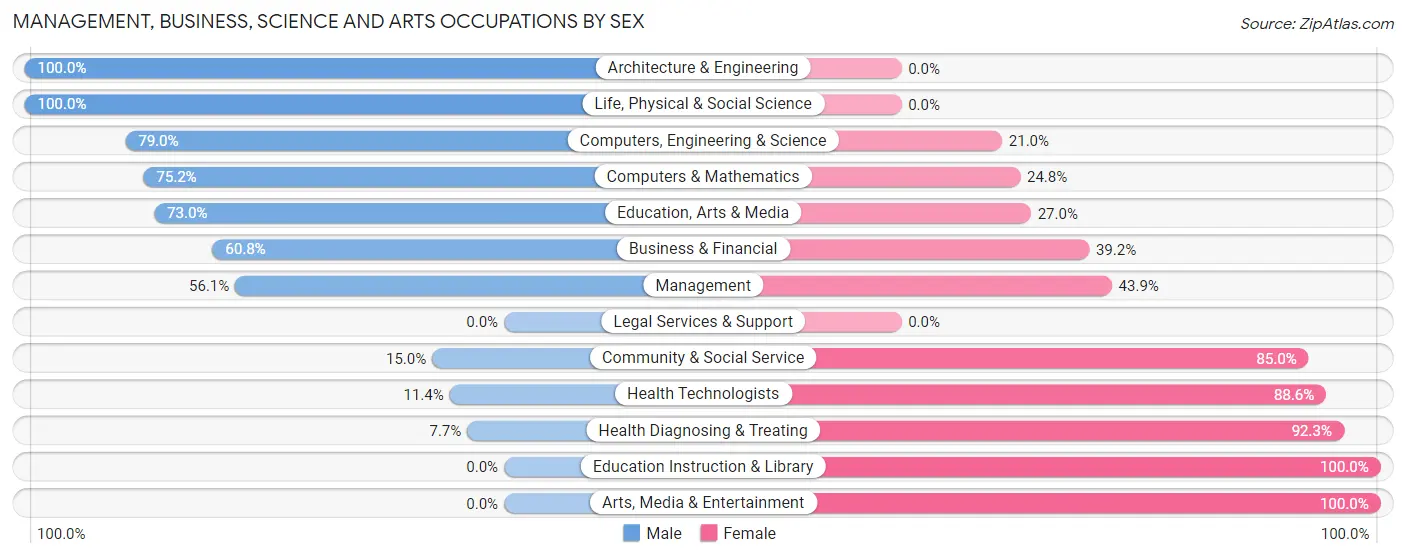
| Occupation | Male | Female |
| Management | 152 (56.1%) | 119 (43.9%) |
| Business & Financial | 59 (60.8%) | 38 (39.2%) |
| Computers, Engineering & Science | 109 (79.0%) | 29 (21.0%) |
| Computers & Mathematics | 88 (75.2%) | 29 (24.8%) |
| Architecture & Engineering | 14 (100.0%) | 0 (0.0%) |
| Life, Physical & Social Science | 7 (100.0%) | 0 (0.0%) |
| Community & Social Service | 27 (15.0%) | 153 (85.0%) |
| Education, Arts & Media | 27 (73.0%) | 10 (27.0%) |
| Legal Services & Support | 0 (0.0%) | 0 (0.0%) |
| Education Instruction & Library | 0 (0.0%) | 52 (100.0%) |
| Arts, Media & Entertainment | 0 (0.0%) | 91 (100.0%) |
| Health Diagnosing & Treating | 5 (7.7%) | 60 (92.3%) |
| Health Technologists | 5 (11.4%) | 39 (88.6%) |
| Total (Category) | 352 (46.9%) | 399 (53.1%) |
| Total (Overall) | 1,024 (56.0%) | 805 (44.0%) |
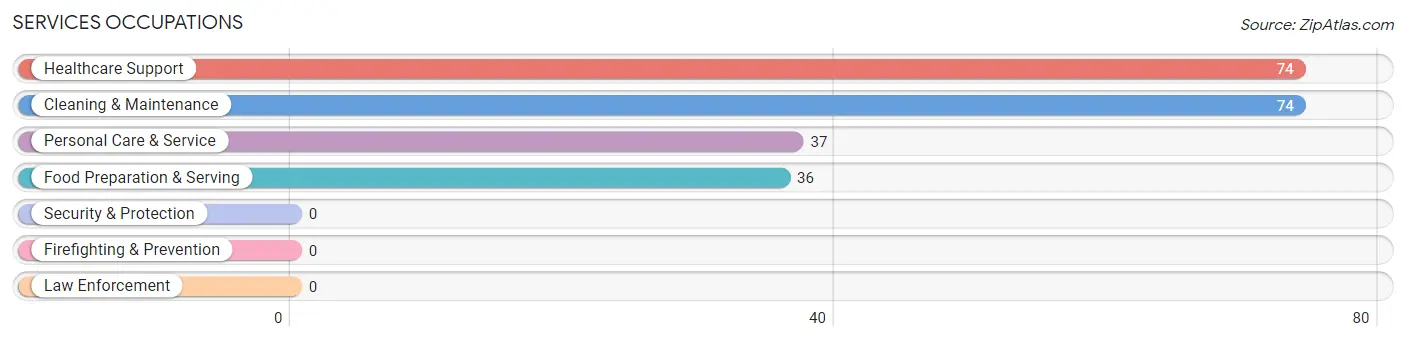
Services Occupations
The most common Services occupations in Three Rivers are Healthcare Support (74 | 4.1%), Cleaning & Maintenance (74 | 4.1%), Personal Care & Service (37 | 2.0%), and Food Preparation & Serving (36 | 2.0%).
Services Occupations by Sex
Within the Services occupations in Three Rivers, the most male-oriented occupations are Personal Care & Service (100.0%), Food Preparation & Serving (80.6%), and Cleaning & Maintenance (78.4%), while the most female-oriented occupations are Healthcare Support (47.3%), Cleaning & Maintenance (21.6%), and Food Preparation & Serving (19.4%).
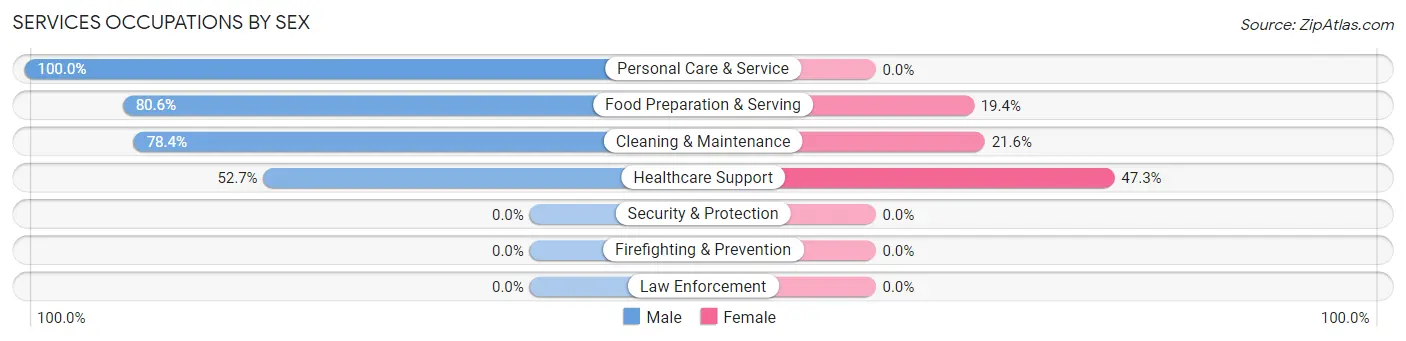
| Occupation | Male | Female |
| Healthcare Support | 39 (52.7%) | 35 (47.3%) |
| Security & Protection | 0 (0.0%) | 0 (0.0%) |
| Firefighting & Prevention | 0 (0.0%) | 0 (0.0%) |
| Law Enforcement | 0 (0.0%) | 0 (0.0%) |
| Food Preparation & Serving | 29 (80.6%) | 7 (19.4%) |
| Cleaning & Maintenance | 58 (78.4%) | 16 (21.6%) |
| Personal Care & Service | 37 (100.0%) | 0 (0.0%) |
| Total (Category) | 163 (73.8%) | 58 (26.2%) |
| Total (Overall) | 1,024 (56.0%) | 805 (44.0%) |
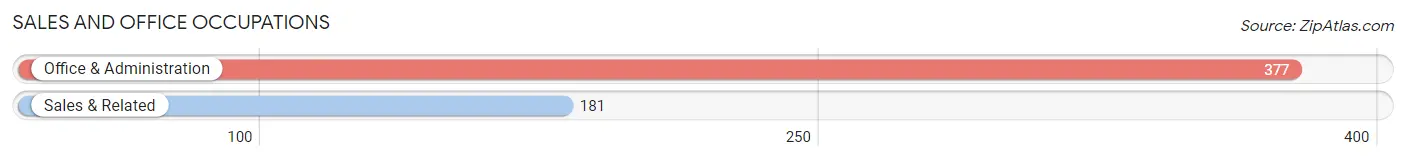
Sales and Office Occupations
The most common Sales and Office occupations in Three Rivers are Office & Administration (377 | 20.6%), and Sales & Related (181 | 9.9%).
Sales and Office Occupations by Sex
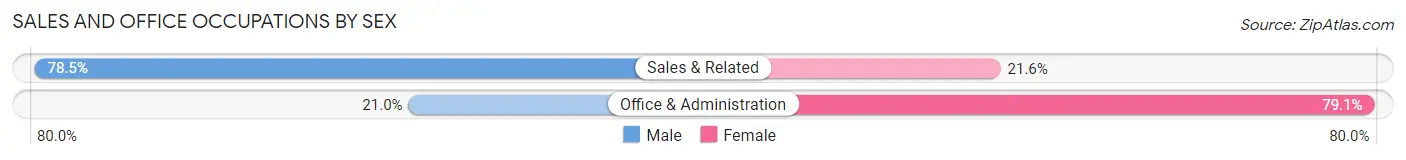
| Occupation | Male | Female |
| Sales & Related | 142 (78.4%) | 39 (21.5%) |
| Office & Administration | 79 (20.9%) | 298 (79.0%) |
| Total (Category) | 221 (39.6%) | 337 (60.4%) |
| Total (Overall) | 1,024 (56.0%) | 805 (44.0%) |
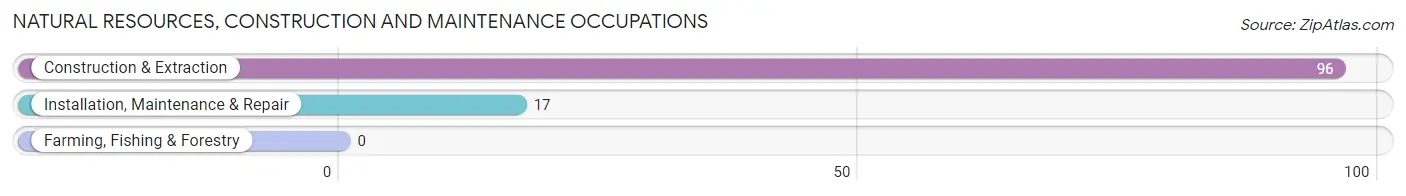
Natural Resources, Construction and Maintenance Occupations
The most common Natural Resources, Construction and Maintenance occupations in Three Rivers are Construction & Extraction (96 | 5.2%), and Installation, Maintenance & Repair (17 | 0.9%).
Natural Resources, Construction and Maintenance Occupations by Sex
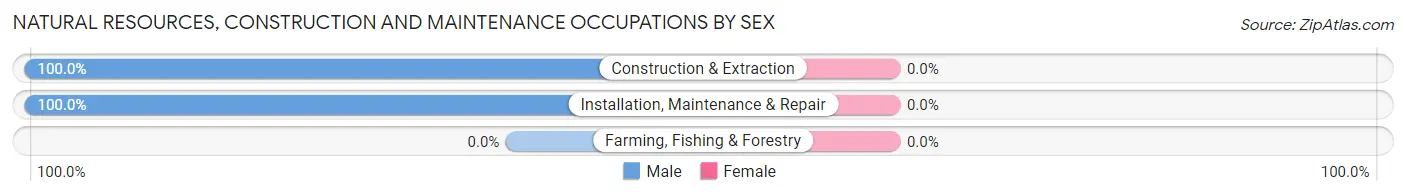
| Occupation | Male | Female |
| Farming, Fishing & Forestry | 0 (0.0%) | 0 (0.0%) |
| Construction & Extraction | 96 (100.0%) | 0 (0.0%) |
| Installation, Maintenance & Repair | 17 (100.0%) | 0 (0.0%) |
| Total (Category) | 113 (100.0%) | 0 (0.0%) |
| Total (Overall) | 1,024 (56.0%) | 805 (44.0%) |
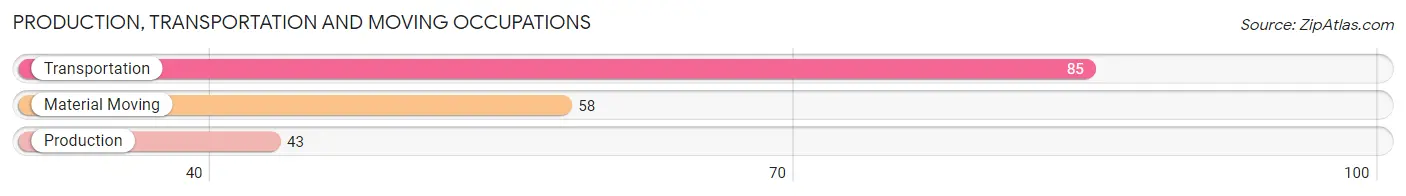
Production, Transportation and Moving Occupations
The most common Production, Transportation and Moving occupations in Three Rivers are Transportation (85 | 4.6%), Material Moving (58 | 3.2%), and Production (43 | 2.4%).
Production, Transportation and Moving Occupations by Sex
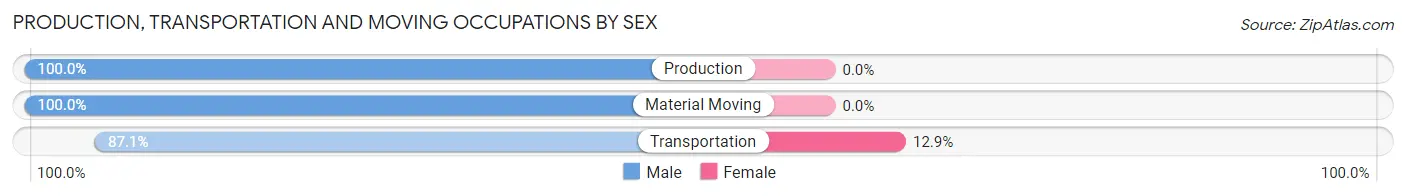
| Occupation | Male | Female |
| Production | 43 (100.0%) | 0 (0.0%) |
| Transportation | 74 (87.1%) | 11 (12.9%) |
| Material Moving | 58 (100.0%) | 0 (0.0%) |
| Total (Category) | 175 (94.1%) | 11 (5.9%) |
| Total (Overall) | 1,024 (56.0%) | 805 (44.0%) |
Employment Industries by Sex in Three Rivers
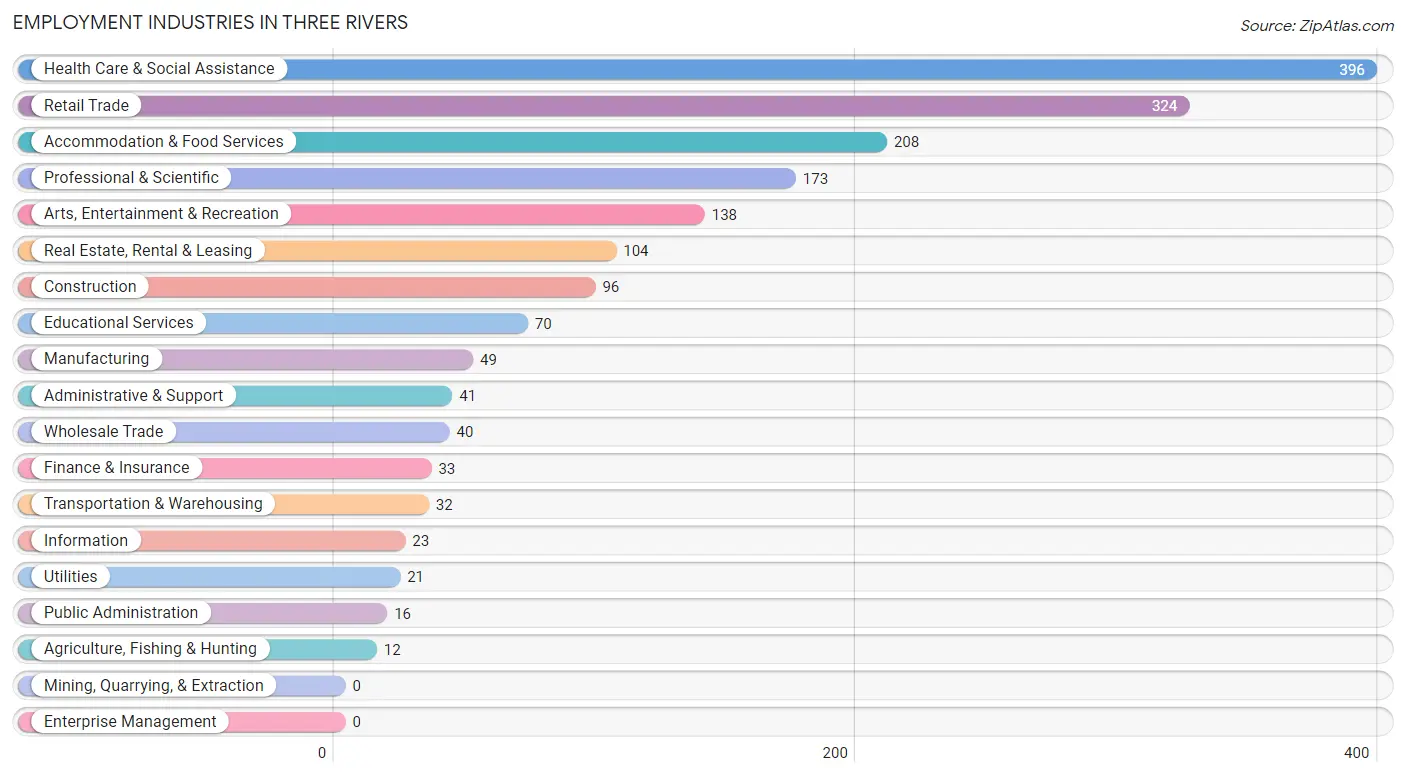
Employment Industries in Three Rivers
The major employment industries in Three Rivers include Health Care & Social Assistance (396 | 21.6%), Retail Trade (324 | 17.7%), Accommodation & Food Services (208 | 11.4%), Professional & Scientific (173 | 9.5%), and Arts, Entertainment & Recreation (138 | 7.5%).
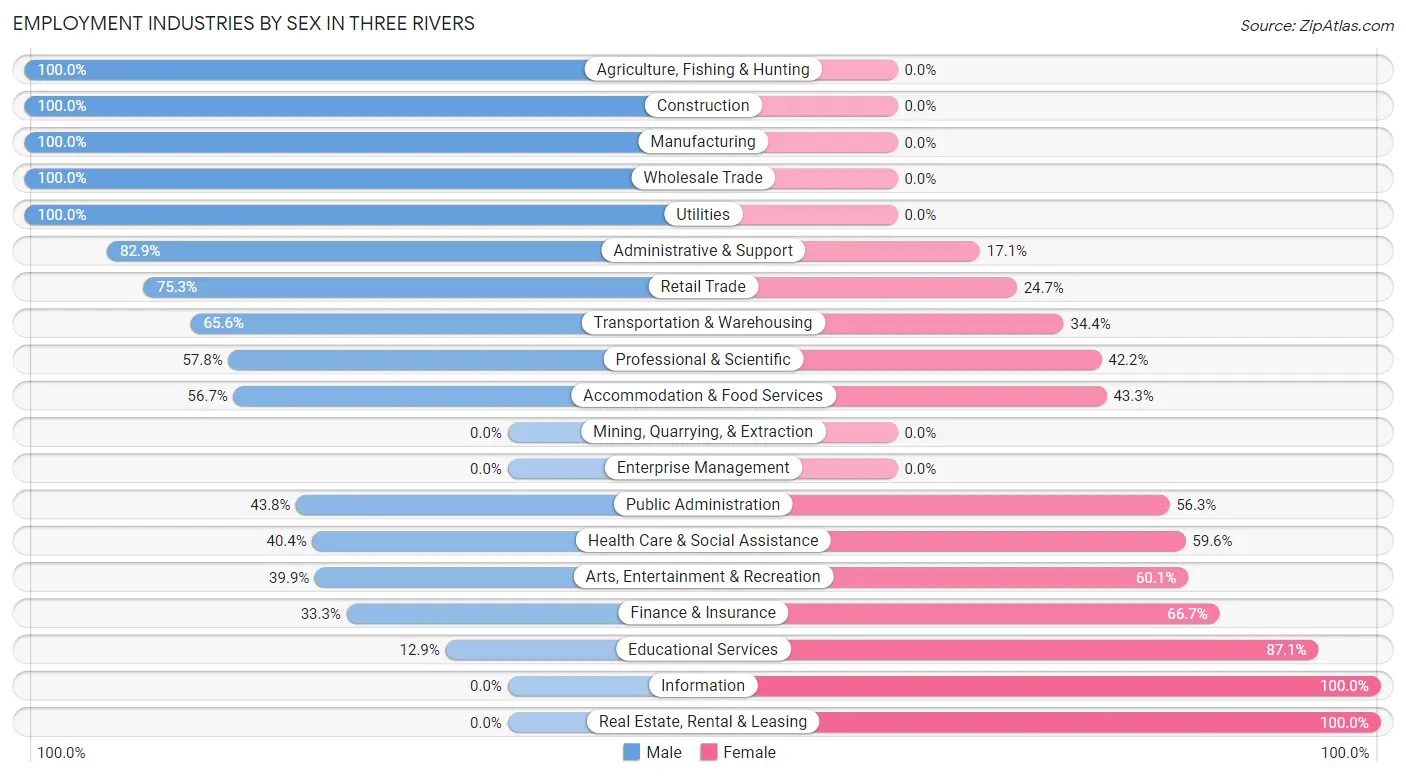
Employment Industries by Sex in Three Rivers
The Three Rivers industries that see more men than women are Agriculture, Fishing & Hunting (100.0%), Construction (100.0%), and Manufacturing (100.0%), whereas the industries that tend to have a higher number of women are Information (100.0%), Real Estate, Rental & Leasing (100.0%), and Educational Services (87.1%).
| Industry | Male | Female |
| Agriculture, Fishing & Hunting | 12 (100.0%) | 0 (0.0%) |
| Mining, Quarrying, & Extraction | 0 (0.0%) | 0 (0.0%) |
| Construction | 96 (100.0%) | 0 (0.0%) |
| Manufacturing | 49 (100.0%) | 0 (0.0%) |
| Wholesale Trade | 40 (100.0%) | 0 (0.0%) |
| Retail Trade | 244 (75.3%) | 80 (24.7%) |
| Transportation & Warehousing | 21 (65.6%) | 11 (34.4%) |
| Utilities | 21 (100.0%) | 0 (0.0%) |
| Information | 0 (0.0%) | 23 (100.0%) |
| Finance & Insurance | 11 (33.3%) | 22 (66.7%) |
| Real Estate, Rental & Leasing | 0 (0.0%) | 104 (100.0%) |
| Professional & Scientific | 100 (57.8%) | 73 (42.2%) |
| Enterprise Management | 0 (0.0%) | 0 (0.0%) |
| Administrative & Support | 34 (82.9%) | 7 (17.1%) |
| Educational Services | 9 (12.9%) | 61 (87.1%) |
| Health Care & Social Assistance | 160 (40.4%) | 236 (59.6%) |
| Arts, Entertainment & Recreation | 55 (39.9%) | 83 (60.1%) |
| Accommodation & Food Services | 118 (56.7%) | 90 (43.3%) |
| Public Administration | 7 (43.8%) | 9 (56.2%) |
| Total | 1,024 (56.0%) | 805 (44.0%) |
Education in Three Rivers
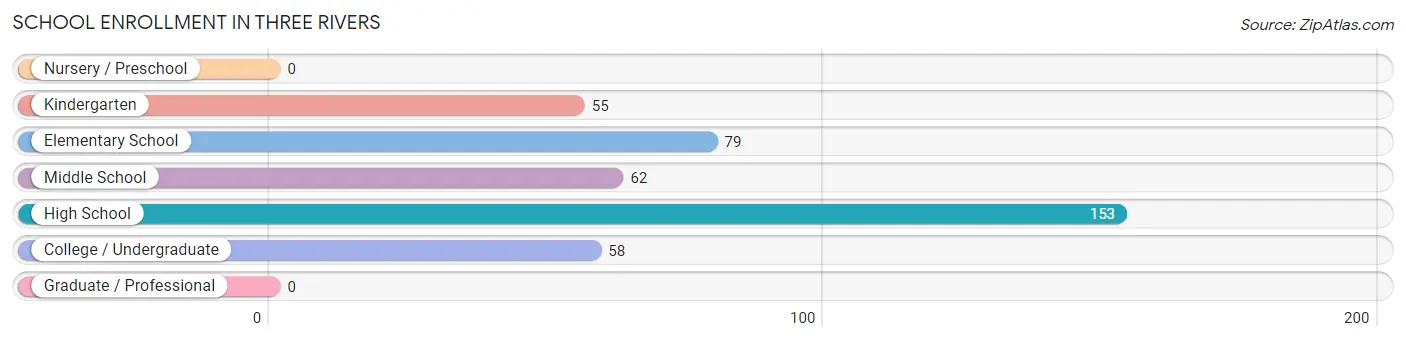
School Enrollment in Three Rivers
The most common levels of schooling among the 407 students in Three Rivers are high school (153 | 37.6%), elementary school (79 | 19.4%), and middle school (62 | 15.2%).
| School Level | # Students | % Students |
| Nursery / Preschool | 0 | 0.0% |
| Kindergarten | 55 | 13.5% |
| Elementary School | 79 | 19.4% |
| Middle School | 62 | 15.2% |
| High School | 153 | 37.6% |
| College / Undergraduate | 58 | 14.2% |
| Graduate / Professional | 0 | 0.0% |
| Total | 407 | 100.0% |
School Enrollment by Age by Funding Source in Three Rivers
Out of a total of 407 students who are enrolled in schools in Three Rivers, 36 (8.8%) attend a private institution, while the remaining 371 (91.2%) are enrolled in public schools. The age group of 5 to 9 year old has the highest likelihood of being enrolled in private schools, with 36 (33.0% in the age bracket) enrolled. Conversely, the age group of 10 to 14 year olds has the lowest likelihood of being enrolled in a private school, with 138 (100.0% in the age bracket) attending a public institution.
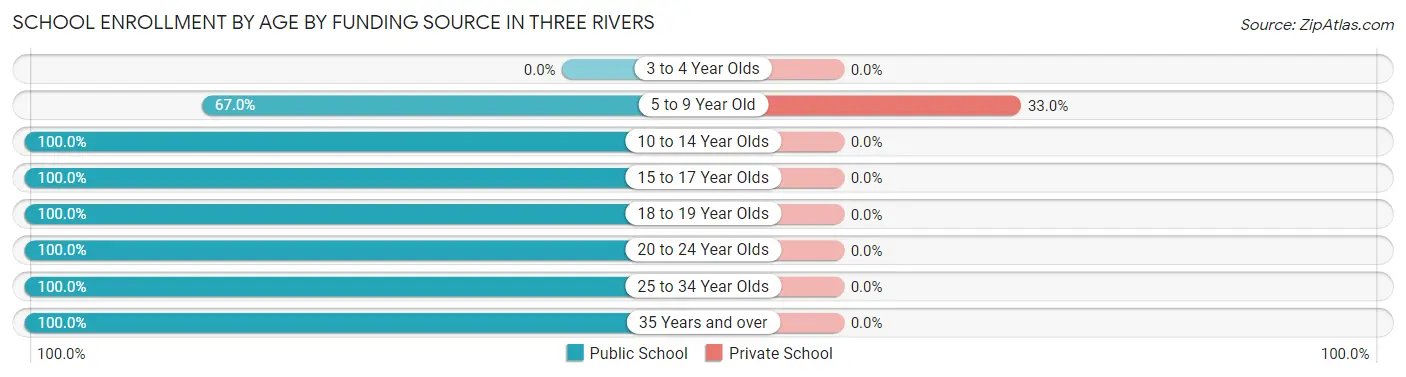
| Age Bracket | Public School | Private School |
| 3 to 4 Year Olds | 0 (0.0%) | 0 (0.0%) |
| 5 to 9 Year Old | 73 (67.0%) | 36 (33.0%) |
| 10 to 14 Year Olds | 138 (100.0%) | 0 (0.0%) |
| 15 to 17 Year Olds | 90 (100.0%) | 0 (0.0%) |
| 18 to 19 Year Olds | 12 (100.0%) | 0 (0.0%) |
| 20 to 24 Year Olds | 10 (100.0%) | 0 (0.0%) |
| 25 to 34 Year Olds | 23 (100.0%) | 0 (0.0%) |
| 35 Years and over | 25 (100.0%) | 0 (0.0%) |
| Total | 371 (91.2%) | 36 (8.8%) |
Educational Attainment by Field of Study in Three Rivers
Business (357 | 26.1%), social sciences (157 | 11.5%), psychology (145 | 10.6%), engineering (130 | 9.5%), and science & technology (101 | 7.4%) are the most common fields of study among 1,370 individuals in Three Rivers who have obtained a bachelor's degree or higher.
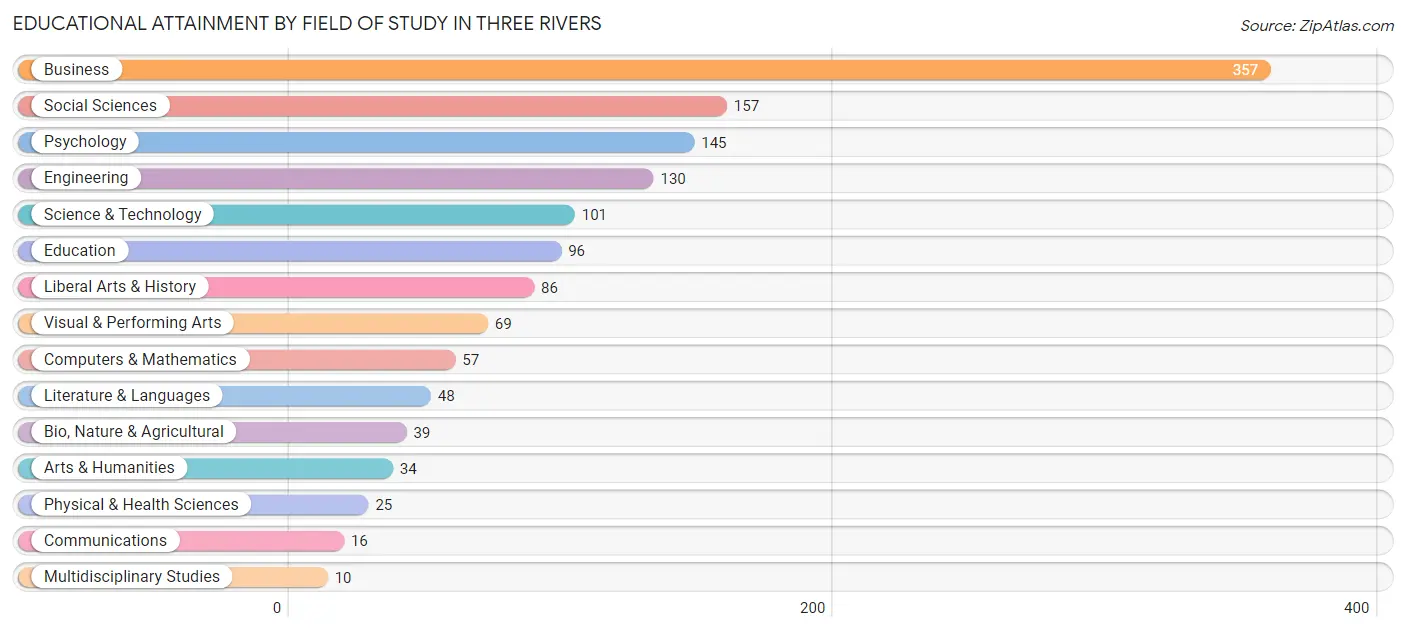
| Field of Study | # Graduates | % Graduates |
| Computers & Mathematics | 57 | 4.2% |
| Bio, Nature & Agricultural | 39 | 2.9% |
| Physical & Health Sciences | 25 | 1.8% |
| Psychology | 145 | 10.6% |
| Social Sciences | 157 | 11.5% |
| Engineering | 130 | 9.5% |
| Multidisciplinary Studies | 10 | 0.7% |
| Science & Technology | 101 | 7.4% |
| Business | 357 | 26.1% |
| Education | 96 | 7.0% |
| Literature & Languages | 48 | 3.5% |
| Liberal Arts & History | 86 | 6.3% |
| Visual & Performing Arts | 69 | 5.0% |
| Communications | 16 | 1.2% |
| Arts & Humanities | 34 | 2.5% |
| Total | 1,370 | 100.0% |
Transportation & Commute in Three Rivers
Vehicle Availability by Sex in Three Rivers
The most prevalent vehicle ownership categories in Three Rivers are males with 2 vehicles (447, accounting for 43.6%) and females with 2 vehicles (360, making up 57.6%).
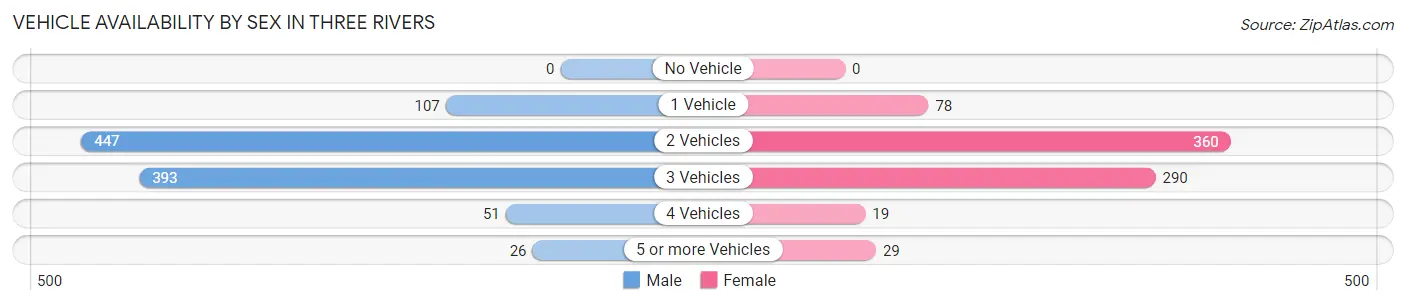
| Vehicles Available | Male | Female |
| No Vehicle | 0 (0.0%) | 0 (0.0%) |
| 1 Vehicle | 107 (10.4%) | 78 (10.1%) |
| 2 Vehicles | 447 (43.6%) | 360 (46.4%) |
| 3 Vehicles | 393 (38.4%) | 290 (37.4%) |
| 4 Vehicles | 51 (5.0%) | 19 (2.5%) |
| 5 or more Vehicles | 26 (2.5%) | 29 (3.7%) |
| Total | 1,024 (100.0%) | 776 (100.0%) |
Commute Time in Three Rivers
The most frequently occuring commute durations in Three Rivers are 30 to 34 minutes (396 commuters, 27.2%), 5 to 9 minutes (243 commuters, 16.7%), and 10 to 14 minutes (197 commuters, 13.6%).
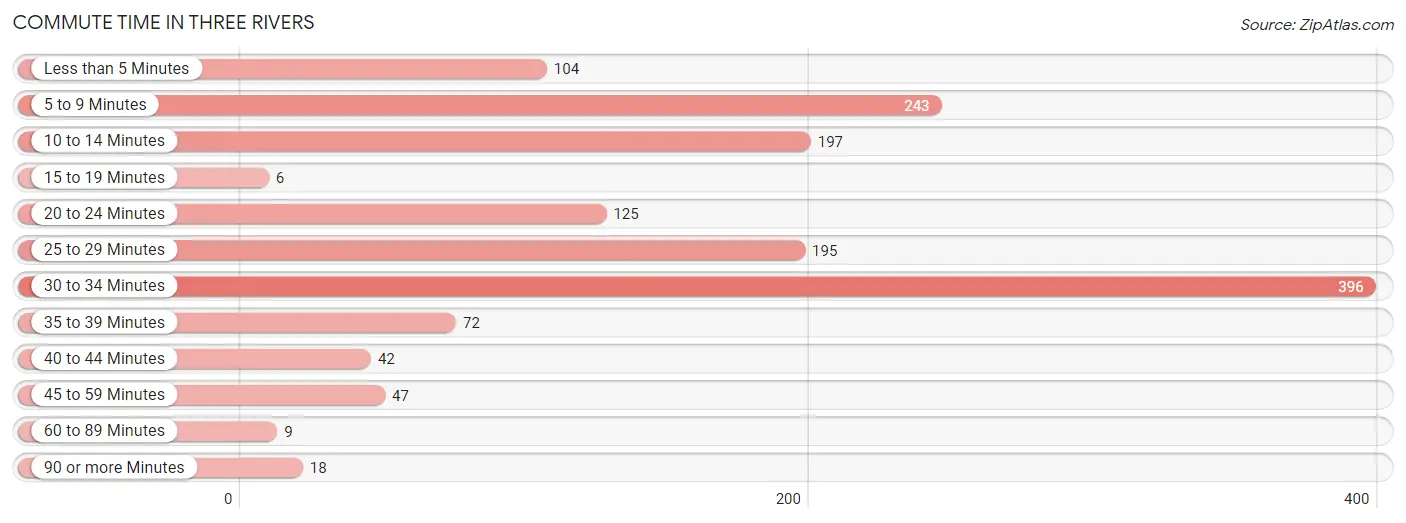
| Commute Time | # Commuters | % Commuters |
| Less than 5 Minutes | 104 | 7.1% |
| 5 to 9 Minutes | 243 | 16.7% |
| 10 to 14 Minutes | 197 | 13.6% |
| 15 to 19 Minutes | 6 | 0.4% |
| 20 to 24 Minutes | 125 | 8.6% |
| 25 to 29 Minutes | 195 | 13.4% |
| 30 to 34 Minutes | 396 | 27.2% |
| 35 to 39 Minutes | 72 | 5.0% |
| 40 to 44 Minutes | 42 | 2.9% |
| 45 to 59 Minutes | 47 | 3.2% |
| 60 to 89 Minutes | 9 | 0.6% |
| 90 or more Minutes | 18 | 1.2% |
Commute Time by Sex in Three Rivers
The most common commute times in Three Rivers are 30 to 34 minutes (240 commuters, 26.7%) for males and 30 to 34 minutes (156 commuters, 28.2%) for females.
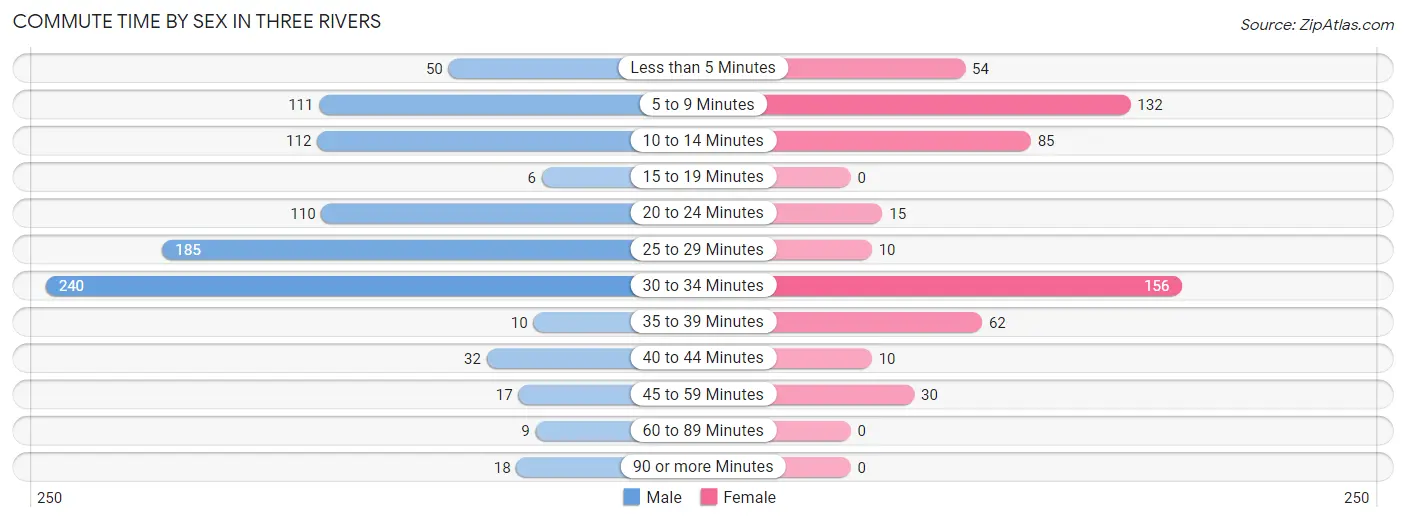
| Commute Time | Male | Female |
| Less than 5 Minutes | 50 (5.6%) | 54 (9.8%) |
| 5 to 9 Minutes | 111 (12.3%) | 132 (23.8%) |
| 10 to 14 Minutes | 112 (12.4%) | 85 (15.3%) |
| 15 to 19 Minutes | 6 (0.7%) | 0 (0.0%) |
| 20 to 24 Minutes | 110 (12.2%) | 15 (2.7%) |
| 25 to 29 Minutes | 185 (20.6%) | 10 (1.8%) |
| 30 to 34 Minutes | 240 (26.7%) | 156 (28.2%) |
| 35 to 39 Minutes | 10 (1.1%) | 62 (11.2%) |
| 40 to 44 Minutes | 32 (3.6%) | 10 (1.8%) |
| 45 to 59 Minutes | 17 (1.9%) | 30 (5.4%) |
| 60 to 89 Minutes | 9 (1.0%) | 0 (0.0%) |
| 90 or more Minutes | 18 (2.0%) | 0 (0.0%) |
Time of Departure to Work by Sex in Three Rivers
The most frequent times of departure to work in Three Rivers are 8:00 AM to 8:29 AM (203, 22.6%) for males and 7:00 AM to 7:29 AM (289, 52.2%) for females.
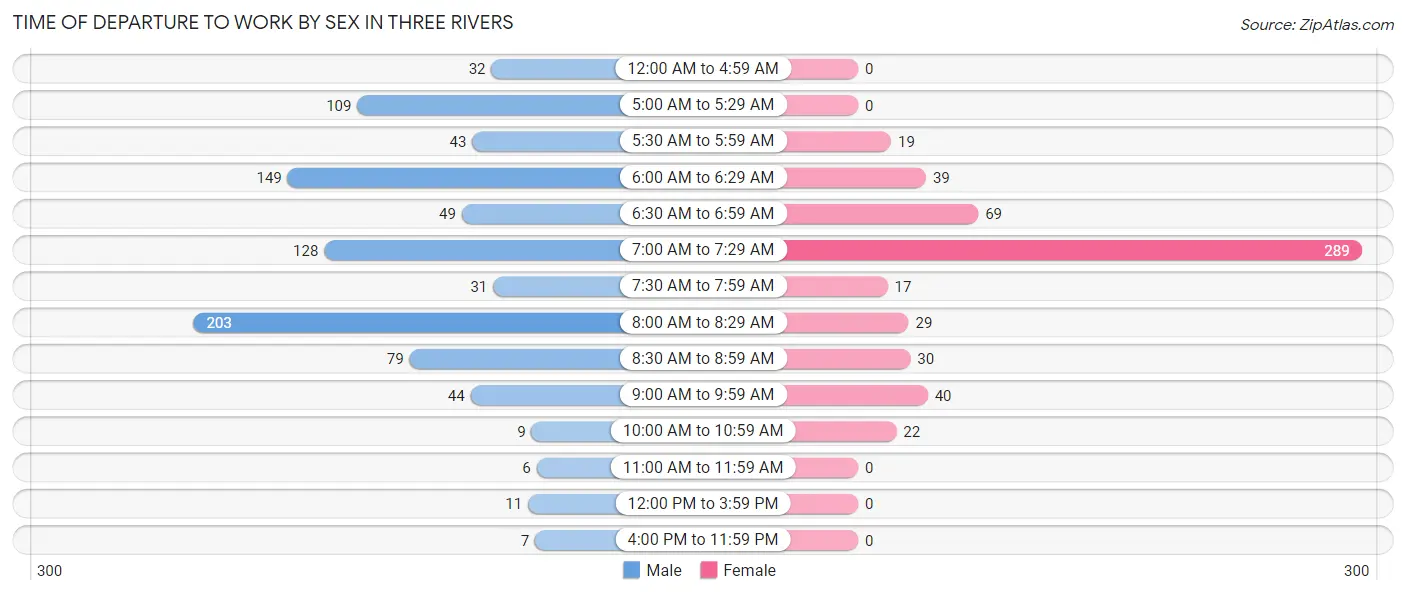
| Time of Departure | Male | Female |
| 12:00 AM to 4:59 AM | 32 (3.6%) | 0 (0.0%) |
| 5:00 AM to 5:29 AM | 109 (12.1%) | 0 (0.0%) |
| 5:30 AM to 5:59 AM | 43 (4.8%) | 19 (3.4%) |
| 6:00 AM to 6:29 AM | 149 (16.6%) | 39 (7.0%) |
| 6:30 AM to 6:59 AM | 49 (5.4%) | 69 (12.4%) |
| 7:00 AM to 7:29 AM | 128 (14.2%) | 289 (52.2%) |
| 7:30 AM to 7:59 AM | 31 (3.4%) | 17 (3.1%) |
| 8:00 AM to 8:29 AM | 203 (22.6%) | 29 (5.2%) |
| 8:30 AM to 8:59 AM | 79 (8.8%) | 30 (5.4%) |
| 9:00 AM to 9:59 AM | 44 (4.9%) | 40 (7.2%) |
| 10:00 AM to 10:59 AM | 9 (1.0%) | 22 (4.0%) |
| 11:00 AM to 11:59 AM | 6 (0.7%) | 0 (0.0%) |
| 12:00 PM to 3:59 PM | 11 (1.2%) | 0 (0.0%) |
| 4:00 PM to 11:59 PM | 7 (0.8%) | 0 (0.0%) |
| Total | 900 (100.0%) | 554 (100.0%) |
Housing Occupancy in Three Rivers
Occupancy by Ownership in Three Rivers
Of the total 1,707 dwellings in Three Rivers, owner-occupied units account for 1,499 (87.8%), while renter-occupied units make up 208 (12.2%).
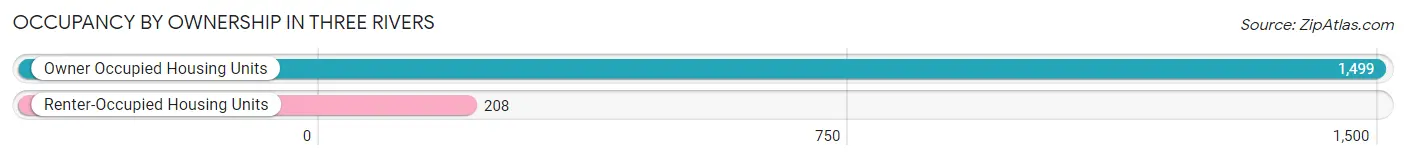
| Occupancy | # Housing Units | % Housing Units |
| Owner Occupied Housing Units | 1,499 | 87.8% |
| Renter-Occupied Housing Units | 208 | 12.2% |
| Total Occupied Housing Units | 1,707 | 100.0% |
Occupancy by Household Size in Three Rivers
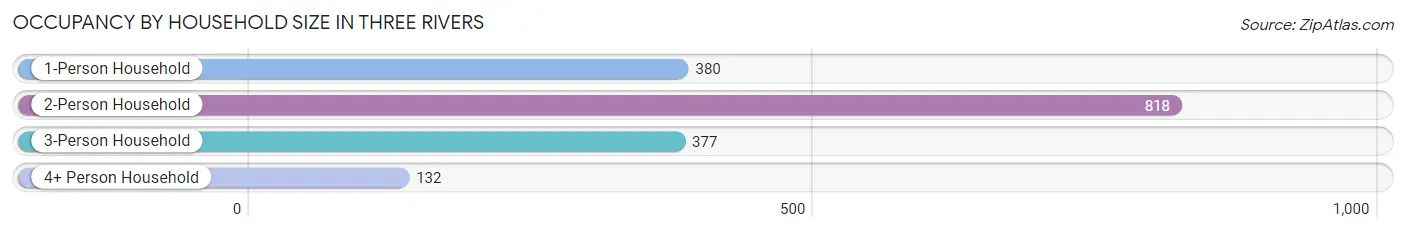
| Household Size | # Housing Units | % Housing Units |
| 1-Person Household | 380 | 22.3% |
| 2-Person Household | 818 | 47.9% |
| 3-Person Household | 377 | 22.1% |
| 4+ Person Household | 132 | 7.7% |
| Total Housing Units | 1,707 | 100.0% |
Occupancy by Ownership by Household Size in Three Rivers
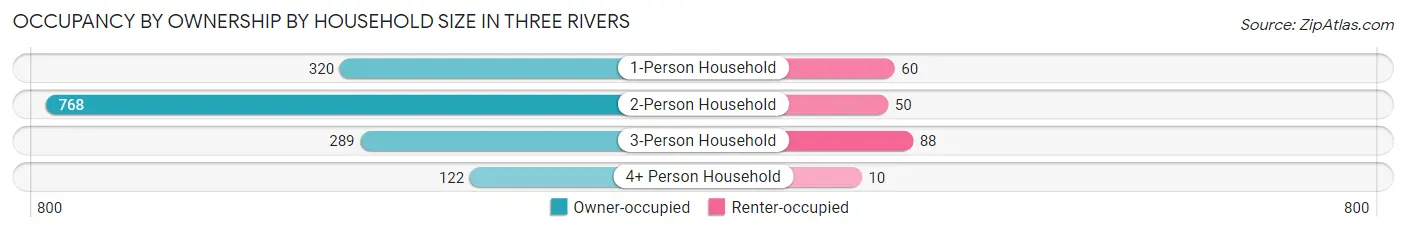
| Household Size | Owner-occupied | Renter-occupied |
| 1-Person Household | 320 (84.2%) | 60 (15.8%) |
| 2-Person Household | 768 (93.9%) | 50 (6.1%) |
| 3-Person Household | 289 (76.7%) | 88 (23.3%) |
| 4+ Person Household | 122 (92.4%) | 10 (7.6%) |
| Total Housing Units | 1,499 (87.8%) | 208 (12.2%) |
Occupancy by Educational Attainment in Three Rivers
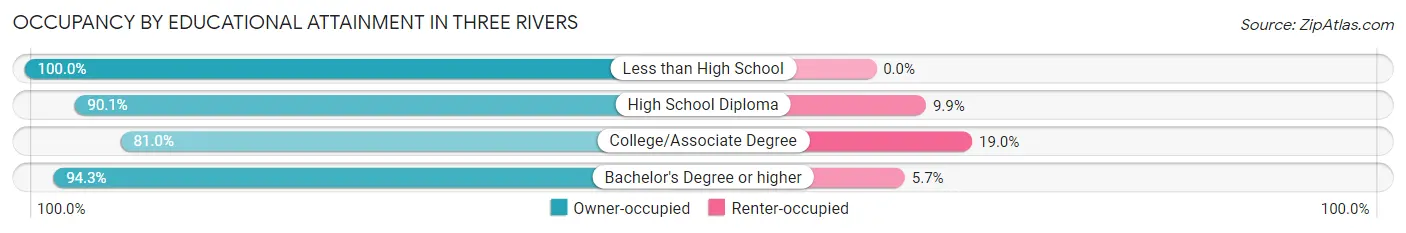
| Household Size | Owner-occupied | Renter-occupied |
| Less than High School | 21 (100.0%) | 0 (0.0%) |
| High School Diploma | 301 (90.1%) | 33 (9.9%) |
| College/Associate Degree | 596 (81.0%) | 140 (19.0%) |
| Bachelor's Degree or higher | 581 (94.3%) | 35 (5.7%) |
Occupancy by Age of Householder in Three Rivers
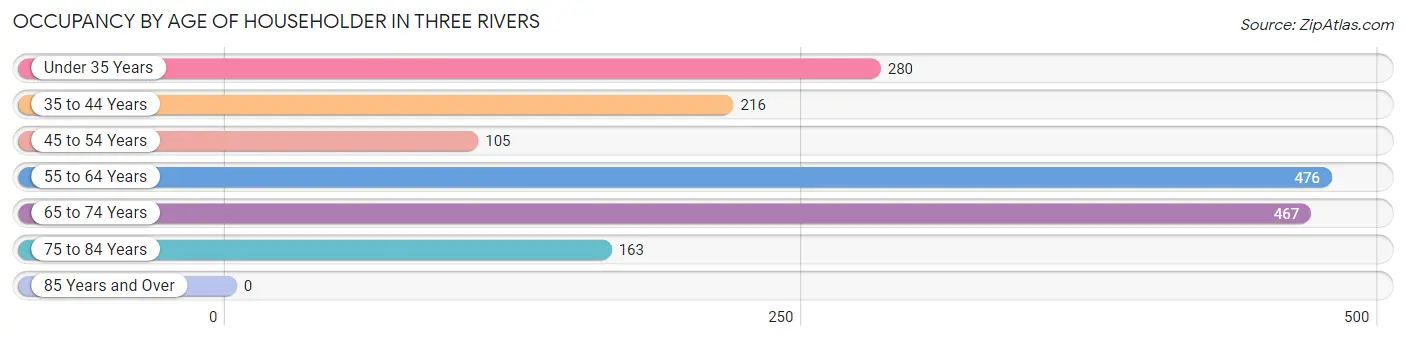
| Age Bracket | # Households | % Households |
| Under 35 Years | 280 | 16.4% |
| 35 to 44 Years | 216 | 12.7% |
| 45 to 54 Years | 105 | 6.1% |
| 55 to 64 Years | 476 | 27.9% |
| 65 to 74 Years | 467 | 27.4% |
| 75 to 84 Years | 163 | 9.6% |
| 85 Years and Over | 0 | 0.0% |
| Total | 1,707 | 100.0% |
Housing Finances in Three Rivers
Median Income by Occupancy in Three Rivers
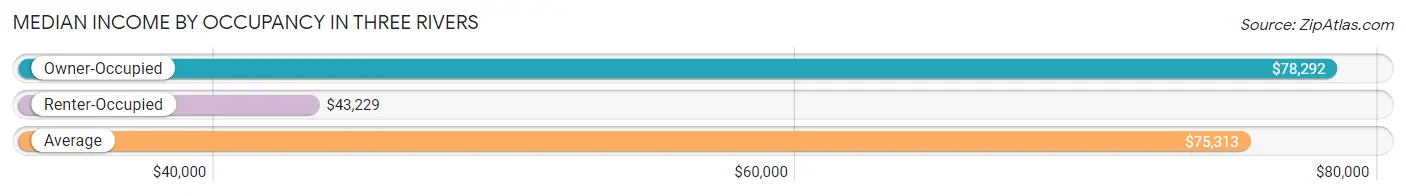
| Occupancy Type | # Households | Median Income |
| Owner-Occupied | 1,499 (87.8%) | $78,292 |
| Renter-Occupied | 208 (12.2%) | $43,229 |
| Average | 1,707 (100.0%) | $75,313 |
Occupancy by Householder Income Bracket in Three Rivers
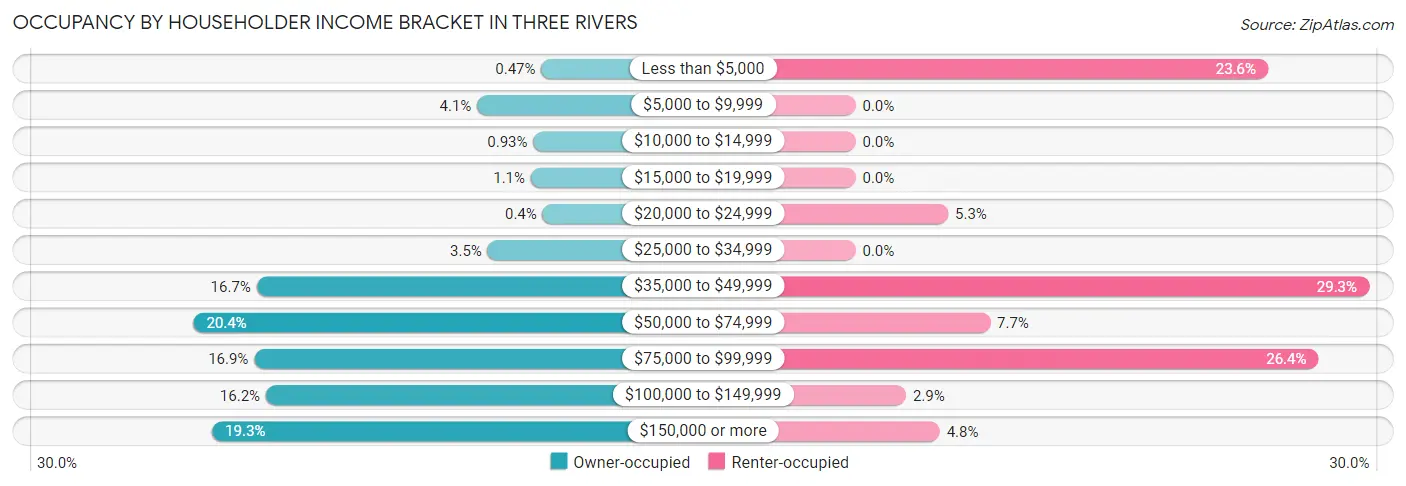
| Income Bracket | Owner-occupied | Renter-occupied |
| Less than $5,000 | 7 (0.5%) | 49 (23.6%) |
| $5,000 to $9,999 | 62 (4.1%) | 0 (0.0%) |
| $10,000 to $14,999 | 14 (0.9%) | 0 (0.0%) |
| $15,000 to $19,999 | 16 (1.1%) | 0 (0.0%) |
| $20,000 to $24,999 | 6 (0.4%) | 11 (5.3%) |
| $25,000 to $34,999 | 53 (3.5%) | 0 (0.0%) |
| $35,000 to $49,999 | 251 (16.7%) | 61 (29.3%) |
| $50,000 to $74,999 | 305 (20.3%) | 16 (7.7%) |
| $75,000 to $99,999 | 253 (16.9%) | 55 (26.4%) |
| $100,000 to $149,999 | 243 (16.2%) | 6 (2.9%) |
| $150,000 or more | 289 (19.3%) | 10 (4.8%) |
| Total | 1,499 (100.0%) | 208 (100.0%) |
Monthly Housing Cost Tiers in Three Rivers
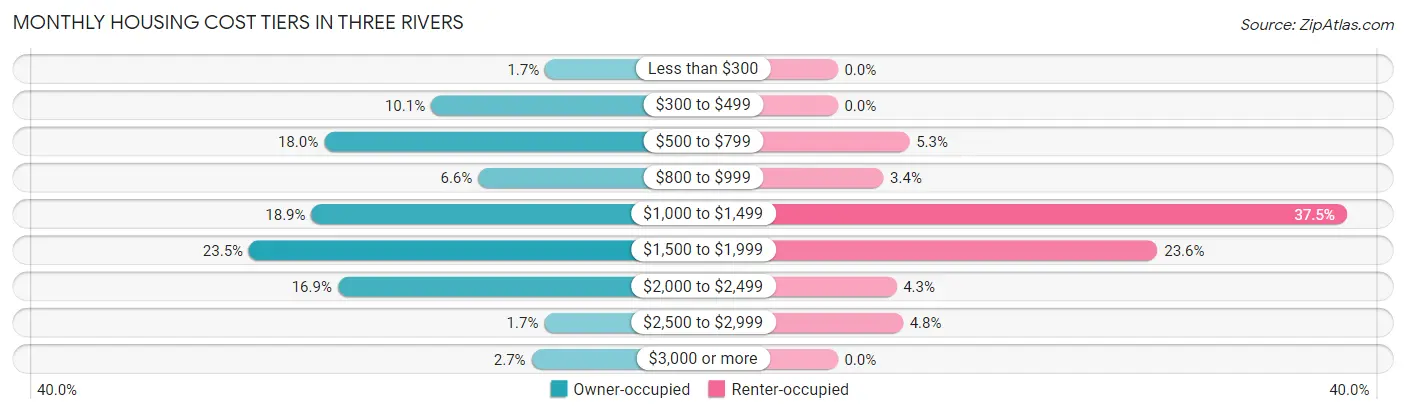
| Monthly Cost | Owner-occupied | Renter-occupied |
| Less than $300 | 25 (1.7%) | 0 (0.0%) |
| $300 to $499 | 151 (10.1%) | 0 (0.0%) |
| $500 to $799 | 269 (17.9%) | 11 (5.3%) |
| $800 to $999 | 99 (6.6%) | 7 (3.4%) |
| $1,000 to $1,499 | 283 (18.9%) | 78 (37.5%) |
| $1,500 to $1,999 | 352 (23.5%) | 49 (23.6%) |
| $2,000 to $2,499 | 254 (16.9%) | 9 (4.3%) |
| $2,500 to $2,999 | 26 (1.7%) | 10 (4.8%) |
| $3,000 or more | 40 (2.7%) | 0 (0.0%) |
| Total | 1,499 (100.0%) | 208 (100.0%) |
Physical Housing Characteristics in Three Rivers
Housing Structures in Three Rivers
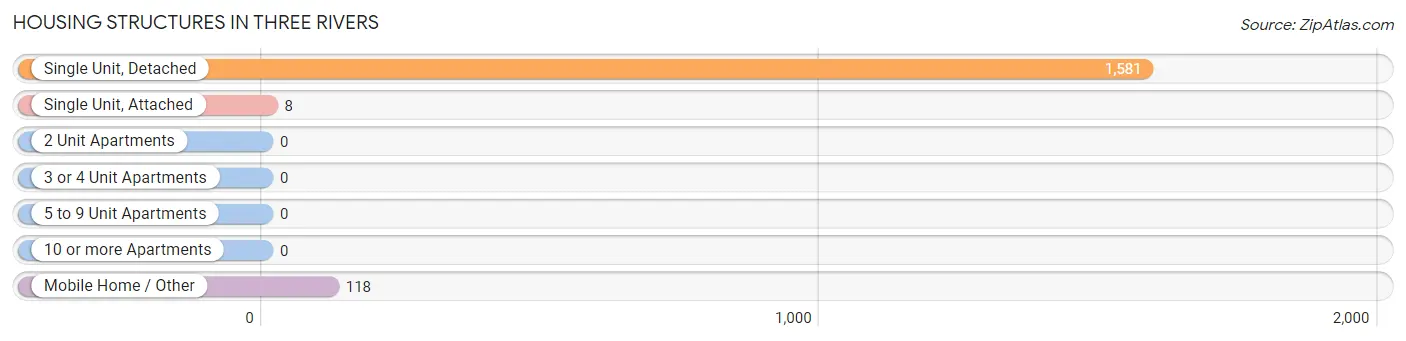
| Structure Type | # Housing Units | % Housing Units |
| Single Unit, Detached | 1,581 | 92.6% |
| Single Unit, Attached | 8 | 0.5% |
| 2 Unit Apartments | 0 | 0.0% |
| 3 or 4 Unit Apartments | 0 | 0.0% |
| 5 to 9 Unit Apartments | 0 | 0.0% |
| 10 or more Apartments | 0 | 0.0% |
| Mobile Home / Other | 118 | 6.9% |
| Total | 1,707 | 100.0% |
Housing Structures by Occupancy in Three Rivers
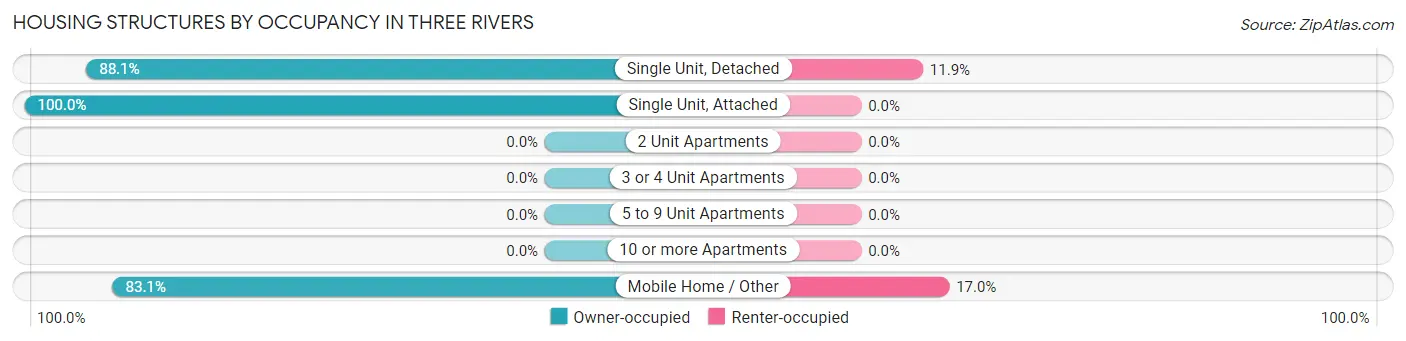
| Structure Type | Owner-occupied | Renter-occupied |
| Single Unit, Detached | 1,393 (88.1%) | 188 (11.9%) |
| Single Unit, Attached | 8 (100.0%) | 0 (0.0%) |
| 2 Unit Apartments | 0 (0.0%) | 0 (0.0%) |
| 3 or 4 Unit Apartments | 0 (0.0%) | 0 (0.0%) |
| 5 to 9 Unit Apartments | 0 (0.0%) | 0 (0.0%) |
| 10 or more Apartments | 0 (0.0%) | 0 (0.0%) |
| Mobile Home / Other | 98 (83.1%) | 20 (17.0%) |
| Total | 1,499 (87.8%) | 208 (12.2%) |
Housing Structures by Number of Rooms in Three Rivers
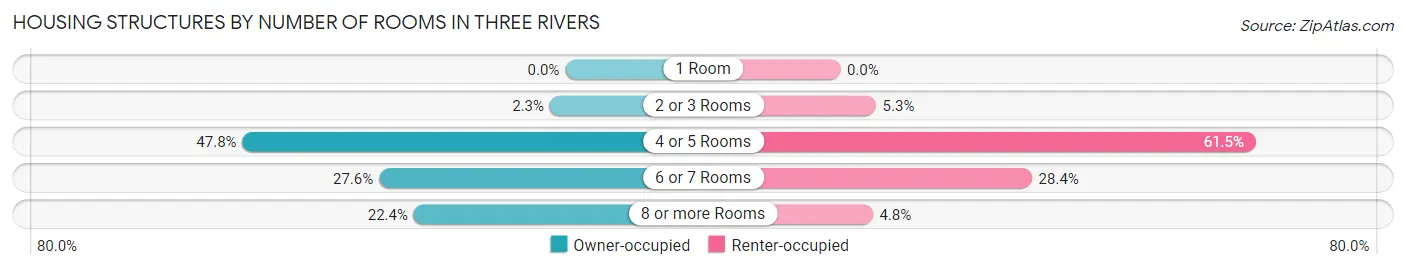
| Number of Rooms | Owner-occupied | Renter-occupied |
| 1 Room | 0 (0.0%) | 0 (0.0%) |
| 2 or 3 Rooms | 34 (2.3%) | 11 (5.3%) |
| 4 or 5 Rooms | 716 (47.8%) | 128 (61.5%) |
| 6 or 7 Rooms | 413 (27.6%) | 59 (28.4%) |
| 8 or more Rooms | 336 (22.4%) | 10 (4.8%) |
| Total | 1,499 (100.0%) | 208 (100.0%) |
Housing Structure by Heating Type in Three Rivers
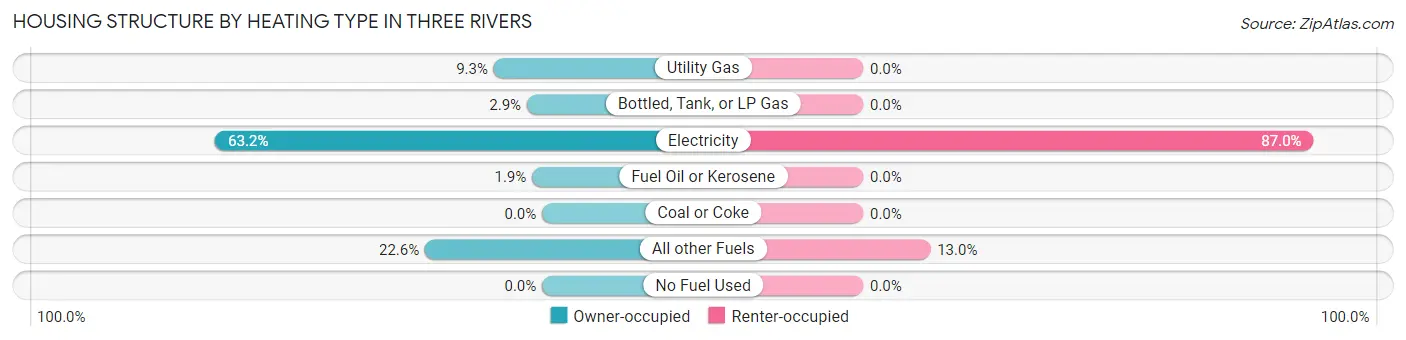
| Heating Type | Owner-occupied | Renter-occupied |
| Utility Gas | 140 (9.3%) | 0 (0.0%) |
| Bottled, Tank, or LP Gas | 44 (2.9%) | 0 (0.0%) |
| Electricity | 947 (63.2%) | 181 (87.0%) |
| Fuel Oil or Kerosene | 29 (1.9%) | 0 (0.0%) |
| Coal or Coke | 0 (0.0%) | 0 (0.0%) |
| All other Fuels | 339 (22.6%) | 27 (13.0%) |
| No Fuel Used | 0 (0.0%) | 0 (0.0%) |
| Total | 1,499 (100.0%) | 208 (100.0%) |
Household Vehicle Usage in Three Rivers
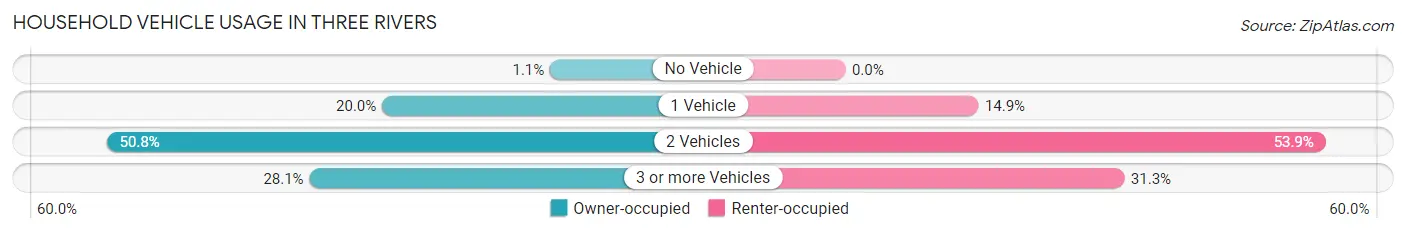
| Vehicles per Household | Owner-occupied | Renter-occupied |
| No Vehicle | 17 (1.1%) | 0 (0.0%) |
| 1 Vehicle | 299 (20.0%) | 31 (14.9%) |
| 2 Vehicles | 762 (50.8%) | 112 (53.8%) |
| 3 or more Vehicles | 421 (28.1%) | 65 (31.2%) |
| Total | 1,499 (100.0%) | 208 (100.0%) |
Real Estate & Mortgages in Three Rivers
Real Estate and Mortgage Overview in Three Rivers
| Characteristic | Without Mortgage | With Mortgage |
| Housing Units | 536 | 963 |
| Median Property Value | $498,400 | $376,800 |
| Median Household Income | $65,222 | $223 |
| Monthly Housing Costs | $618 | $40 |
| Real Estate Taxes | $3,738 | $13 |
Property Value by Mortgage Status in Three Rivers
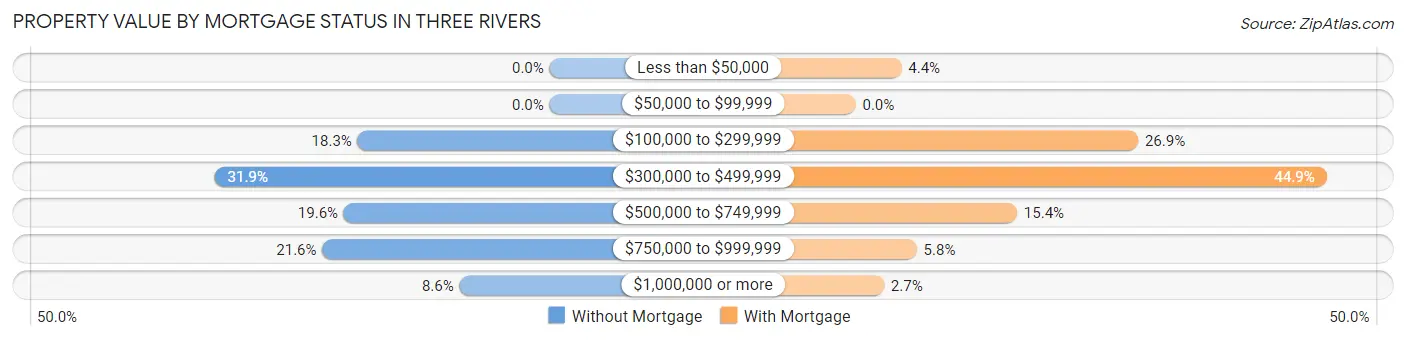
| Property Value | Without Mortgage | With Mortgage |
| Less than $50,000 | 0 (0.0%) | 42 (4.4%) |
| $50,000 to $99,999 | 0 (0.0%) | 0 (0.0%) |
| $100,000 to $299,999 | 98 (18.3%) | 259 (26.9%) |
| $300,000 to $499,999 | 171 (31.9%) | 432 (44.9%) |
| $500,000 to $749,999 | 105 (19.6%) | 148 (15.4%) |
| $750,000 to $999,999 | 116 (21.6%) | 56 (5.8%) |
| $1,000,000 or more | 46 (8.6%) | 26 (2.7%) |
| Total | 536 (100.0%) | 963 (100.0%) |
Household Income by Mortgage Status in Three Rivers
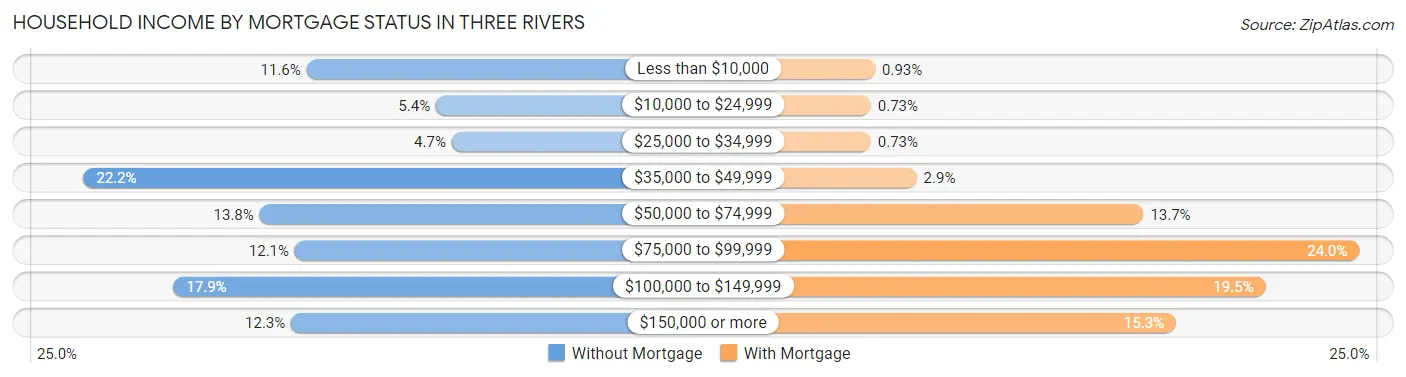
| Household Income | Without Mortgage | With Mortgage |
| Less than $10,000 | 62 (11.6%) | 9 (0.9%) |
| $10,000 to $24,999 | 29 (5.4%) | 7 (0.7%) |
| $25,000 to $34,999 | 25 (4.7%) | 7 (0.7%) |
| $35,000 to $49,999 | 119 (22.2%) | 28 (2.9%) |
| $50,000 to $74,999 | 74 (13.8%) | 132 (13.7%) |
| $75,000 to $99,999 | 65 (12.1%) | 231 (24.0%) |
| $100,000 to $149,999 | 96 (17.9%) | 188 (19.5%) |
| $150,000 or more | 66 (12.3%) | 147 (15.3%) |
| Total | 536 (100.0%) | 963 (100.0%) |
Property Value to Household Income Ratio in Three Rivers
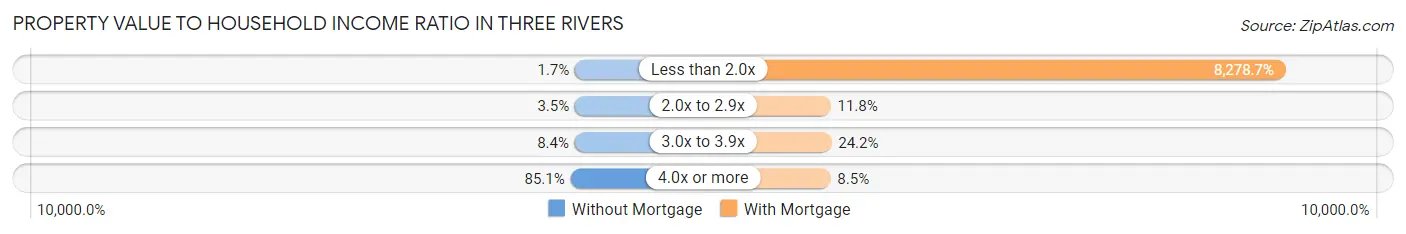
| Value-to-Income Ratio | Without Mortgage | With Mortgage |
| Less than 2.0x | 9 (1.7%) | 79,724 (8,278.7%) |
| 2.0x to 2.9x | 19 (3.5%) | 114 (11.8%) |
| 3.0x to 3.9x | 45 (8.4%) | 233 (24.2%) |
| 4.0x or more | 456 (85.1%) | 82 (8.5%) |
| Total | 536 (100.0%) | 963 (100.0%) |
Real Estate Taxes by Mortgage Status in Three Rivers
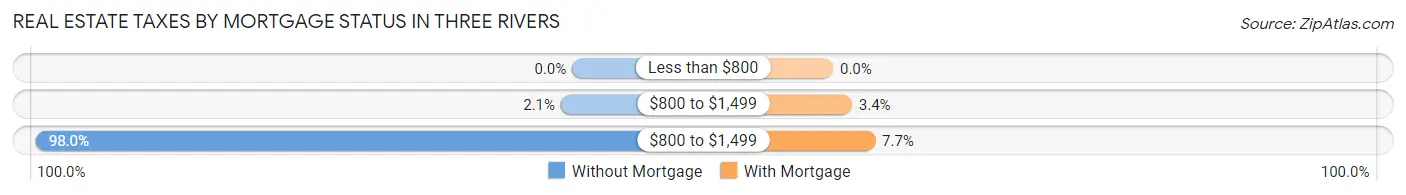
| Property Taxes | Without Mortgage | With Mortgage |
| Less than $800 | 0 (0.0%) | 0 (0.0%) |
| $800 to $1,499 | 11 (2.1%) | 33 (3.4%) |
| $800 to $1,499 | 525 (98.0%) | 74 (7.7%) |
| Total | 536 (100.0%) | 963 (100.0%) |
Health & Disability in Three Rivers
Health Insurance Coverage by Age in Three Rivers
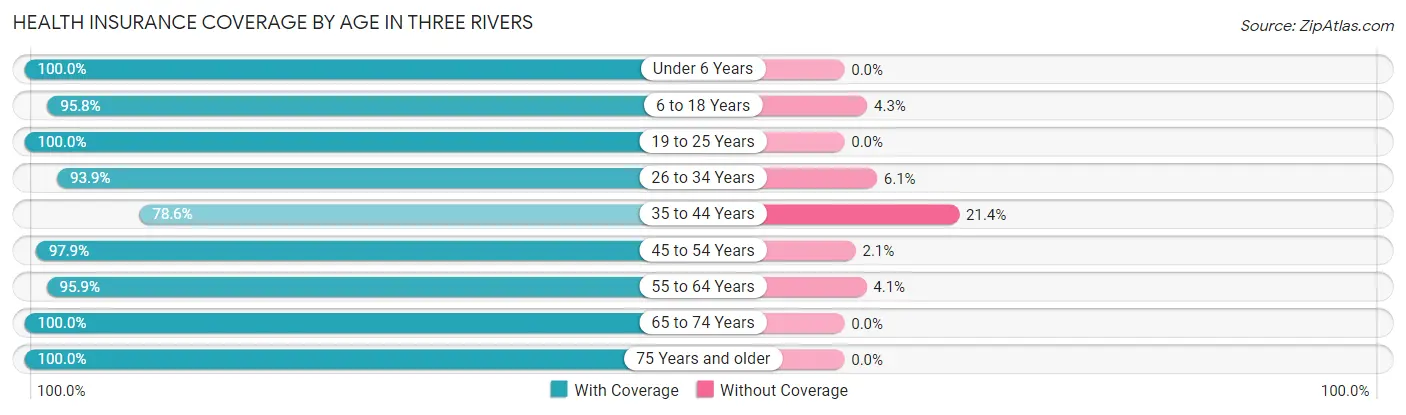
| Age Bracket | With Coverage | Without Coverage |
| Under 6 Years | 184 (100.0%) | 0 (0.0%) |
| 6 to 18 Years | 293 (95.8%) | 13 (4.3%) |
| 19 to 25 Years | 83 (100.0%) | 0 (0.0%) |
| 26 to 34 Years | 573 (93.9%) | 37 (6.1%) |
| 35 to 44 Years | 411 (78.6%) | 112 (21.4%) |
| 45 to 54 Years | 280 (97.9%) | 6 (2.1%) |
| 55 to 64 Years | 700 (95.9%) | 30 (4.1%) |
| 65 to 74 Years | 804 (100.0%) | 0 (0.0%) |
| 75 Years and older | 236 (100.0%) | 0 (0.0%) |
| Total | 3,564 (94.7%) | 198 (5.3%) |
Health Insurance Coverage by Citizenship Status in Three Rivers
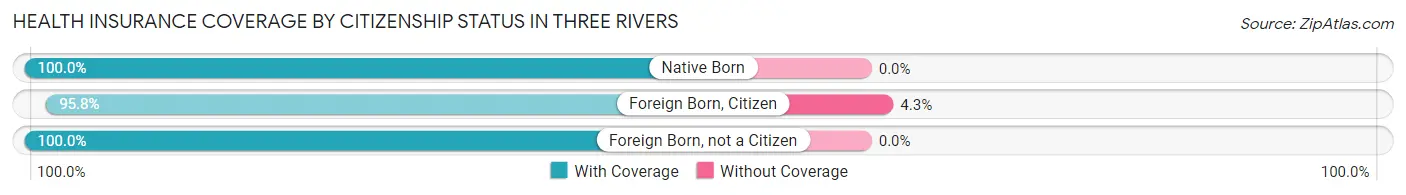
| Citizenship Status | With Coverage | Without Coverage |
| Native Born | 184 (100.0%) | 0 (0.0%) |
| Foreign Born, Citizen | 293 (95.8%) | 13 (4.3%) |
| Foreign Born, not a Citizen | 83 (100.0%) | 0 (0.0%) |
Health Insurance Coverage by Household Income in Three Rivers
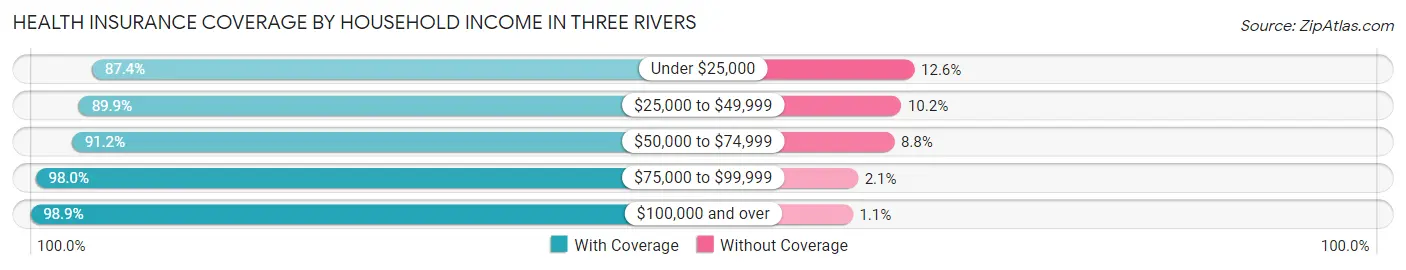
| Household Income | With Coverage | Without Coverage |
| Under $25,000 | 194 (87.4%) | 28 (12.6%) |
| $25,000 to $49,999 | 708 (89.8%) | 80 (10.2%) |
| $50,000 to $74,999 | 639 (91.2%) | 62 (8.8%) |
| $75,000 to $99,999 | 620 (98.0%) | 13 (2.1%) |
| $100,000 and over | 1,403 (98.9%) | 15 (1.1%) |
Public vs Private Health Insurance Coverage by Age in Three Rivers
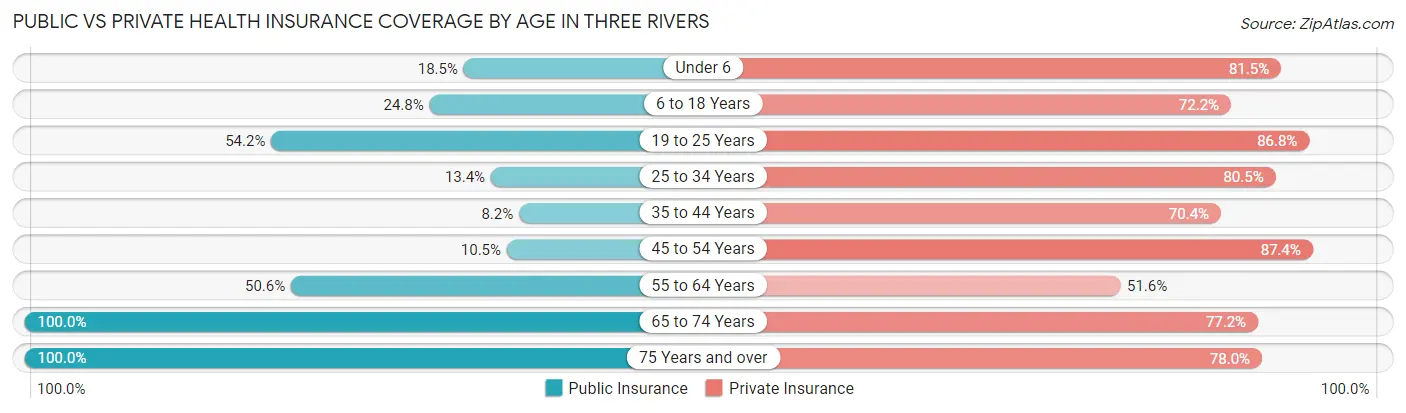
| Age Bracket | Public Insurance | Private Insurance |
| Under 6 | 34 (18.5%) | 150 (81.5%) |
| 6 to 18 Years | 76 (24.8%) | 221 (72.2%) |
| 19 to 25 Years | 45 (54.2%) | 72 (86.8%) |
| 25 to 34 Years | 82 (13.4%) | 491 (80.5%) |
| 35 to 44 Years | 43 (8.2%) | 368 (70.4%) |
| 45 to 54 Years | 30 (10.5%) | 250 (87.4%) |
| 55 to 64 Years | 369 (50.5%) | 377 (51.6%) |
| 65 to 74 Years | 804 (100.0%) | 621 (77.2%) |
| 75 Years and over | 236 (100.0%) | 184 (78.0%) |
| Total | 1,719 (45.7%) | 2,734 (72.7%) |
Disability Status by Sex by Age in Three Rivers
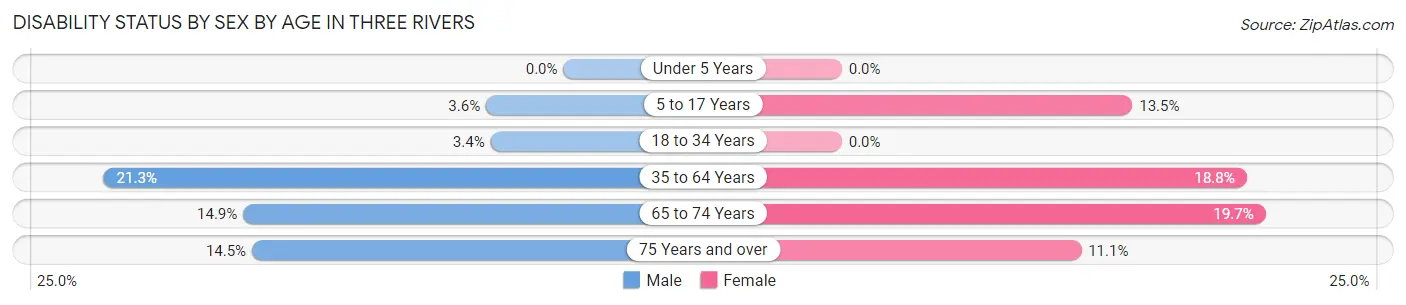
| Age Bracket | Male | Female |
| Under 5 Years | 0 (0.0%) | 0 (0.0%) |
| 5 to 17 Years | 8 (3.6%) | 19 (13.5%) |
| 18 to 34 Years | 15 (3.4%) | 0 (0.0%) |
| 35 to 64 Years | 167 (21.3%) | 142 (18.8%) |
| 65 to 74 Years | 59 (14.9%) | 80 (19.7%) |
| 75 Years and over | 25 (14.4%) | 7 (11.1%) |
Disability Class by Sex by Age in Three Rivers
Disability Class: Hearing Difficulty
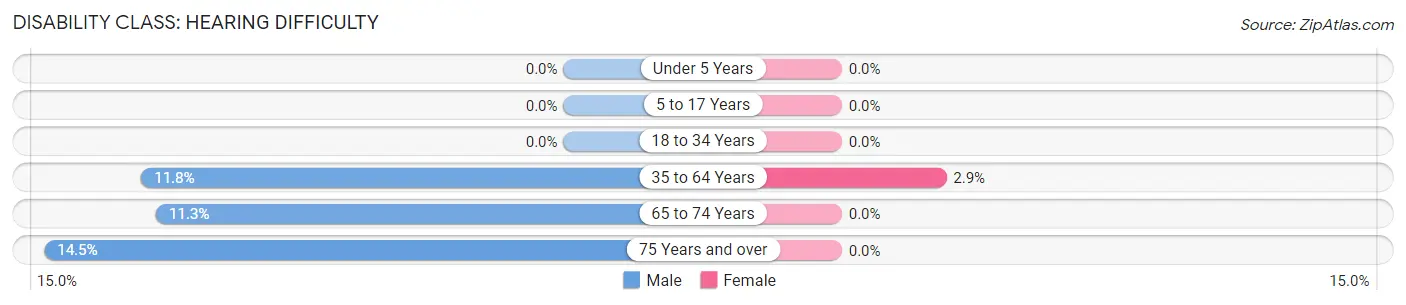
| Age Bracket | Male | Female |
| Under 5 Years | 0 (0.0%) | 0 (0.0%) |
| 5 to 17 Years | 0 (0.0%) | 0 (0.0%) |
| 18 to 34 Years | 0 (0.0%) | 0 (0.0%) |
| 35 to 64 Years | 92 (11.7%) | 22 (2.9%) |
| 65 to 74 Years | 45 (11.3%) | 0 (0.0%) |
| 75 Years and over | 25 (14.4%) | 0 (0.0%) |
Disability Class: Vision Difficulty
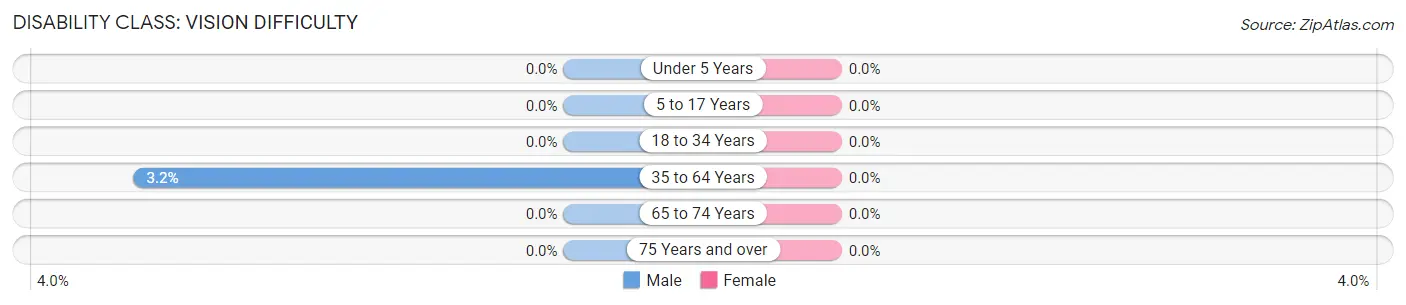
| Age Bracket | Male | Female |
| Under 5 Years | 0 (0.0%) | 0 (0.0%) |
| 5 to 17 Years | 0 (0.0%) | 0 (0.0%) |
| 18 to 34 Years | 0 (0.0%) | 0 (0.0%) |
| 35 to 64 Years | 25 (3.2%) | 0 (0.0%) |
| 65 to 74 Years | 0 (0.0%) | 0 (0.0%) |
| 75 Years and over | 0 (0.0%) | 0 (0.0%) |
Disability Class: Cognitive Difficulty
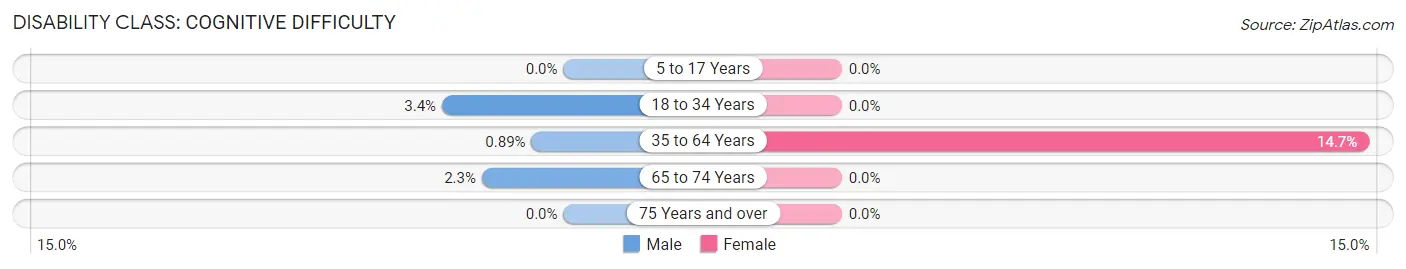
| Age Bracket | Male | Female |
| 5 to 17 Years | 0 (0.0%) | 0 (0.0%) |
| 18 to 34 Years | 15 (3.4%) | 0 (0.0%) |
| 35 to 64 Years | 7 (0.9%) | 111 (14.7%) |
| 65 to 74 Years | 9 (2.3%) | 0 (0.0%) |
| 75 Years and over | 0 (0.0%) | 0 (0.0%) |
Disability Class: Ambulatory Difficulty
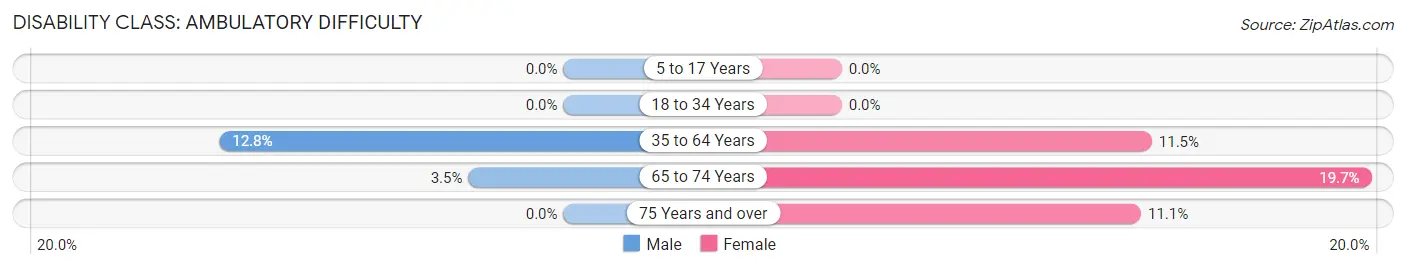
| Age Bracket | Male | Female |
| 5 to 17 Years | 0 (0.0%) | 0 (0.0%) |
| 18 to 34 Years | 0 (0.0%) | 0 (0.0%) |
| 35 to 64 Years | 100 (12.8%) | 87 (11.5%) |
| 65 to 74 Years | 14 (3.5%) | 80 (19.7%) |
| 75 Years and over | 0 (0.0%) | 7 (11.1%) |
Disability Class: Self-Care Difficulty
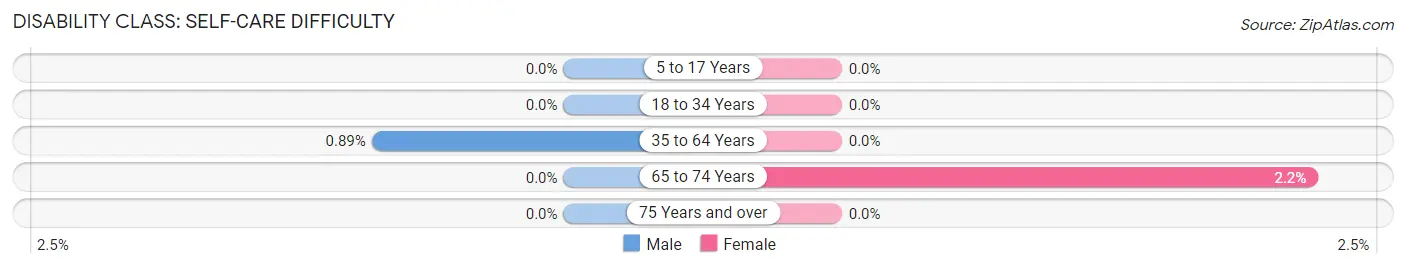
| Age Bracket | Male | Female |
| 5 to 17 Years | 0 (0.0%) | 0 (0.0%) |
| 18 to 34 Years | 0 (0.0%) | 0 (0.0%) |
| 35 to 64 Years | 7 (0.9%) | 0 (0.0%) |
| 65 to 74 Years | 0 (0.0%) | 9 (2.2%) |
| 75 Years and over | 0 (0.0%) | 0 (0.0%) |
Technology Access in Three Rivers
Computing Device Access in Three Rivers
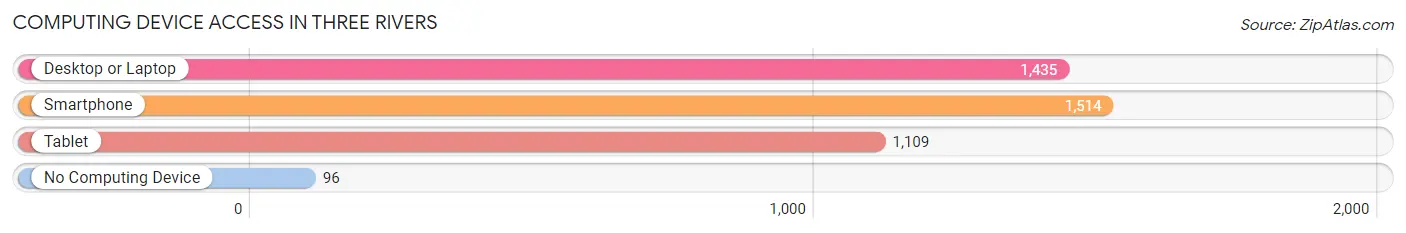
| Device Type | # Households | % Households |
| Desktop or Laptop | 1,435 | 84.1% |
| Smartphone | 1,514 | 88.7% |
| Tablet | 1,109 | 65.0% |
| No Computing Device | 96 | 5.6% |
| Total | 1,707 | 100.0% |
Internet Access in Three Rivers
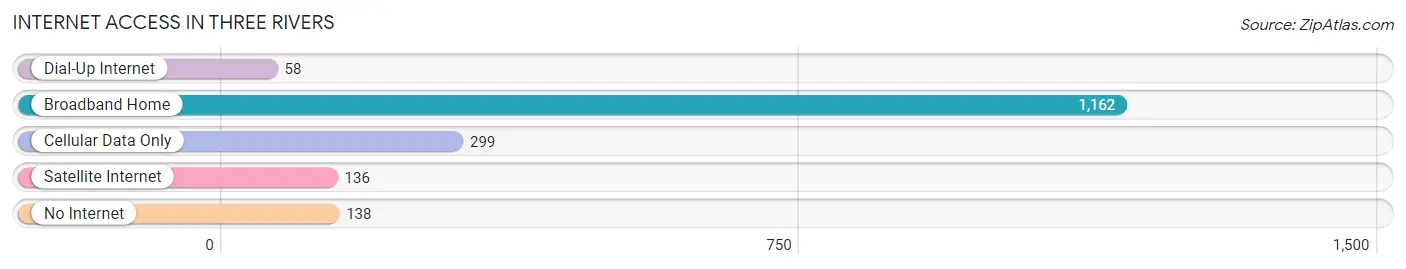
| Internet Type | # Households | % Households |
| Dial-Up Internet | 58 | 3.4% |
| Broadband Home | 1,162 | 68.1% |
| Cellular Data Only | 299 | 17.5% |
| Satellite Internet | 136 | 8.0% |
| No Internet | 138 | 8.1% |
| Total | 1,707 | 100.0% |
Three Rivers Summary
Three Rivers is a small unincorporated community located in the Umpqua Valley of Douglas County, Oregon. It is situated along the North Umpqua River, approximately 20 miles east of Roseburg. The community is named for the three rivers that converge in the area: the North Umpqua, the South Umpqua, and the Little River.
History
The area around Three Rivers has been inhabited by Native Americans for thousands of years. The first European settlers arrived in the area in the mid-1800s, and the community of Three Rivers was established in 1853. The first post office was established in 1854, and the town was officially incorporated in 1887.
The town was originally a logging and lumber town, and the local economy was heavily dependent on the timber industry. In the early 1900s, the town was home to several sawmills and lumber mills. The timber industry declined in the mid-1900s, and the town’s economy shifted to tourism and recreation.
Geography
Three Rivers is located in the Umpqua Valley of Douglas County, Oregon. It is situated along the North Umpqua River, approximately 20 miles east of Roseburg. The town is surrounded by the Umpqua National Forest, and is close to several recreational areas, including Toketee Lake, Lemolo Lake, and Diamond Lake.
The climate in Three Rivers is mild and temperate, with warm summers and cool winters. The average annual temperature is around 50°F, and the average annual precipitation is around 40 inches.
Economy
The economy of Three Rivers is largely based on tourism and recreation. The town is home to several campgrounds, resorts, and other recreational facilities. The local economy is also supported by the timber industry, as well as by small businesses and retail stores.
Demographics
As of the 2010 census, the population of Three Rivers was 1,093. The racial makeup of the town was 94.3% White, 0.7% Native American, 0.3% Asian, 0.2% African American, and 4.5% from other races. The median household income was $37,500, and the median family income was $41,250.
Conclusion
Three Rivers is a small unincorporated community located in the Umpqua Valley of Douglas County, Oregon. It is situated along the North Umpqua River, and is surrounded by the Umpqua National Forest. The town’s economy is largely based on tourism and recreation, as well as on the timber industry. The population of Three Rivers was 1,093 as of the 2010 census.
Common Questions
What is Per Capita Income in Three Rivers?
Per Capita income in Three Rivers is $41,619.
What is the Median Family Income in Three Rivers?
Median Family Income in Three Rivers is $98,320.
What is the Median Household income in Three Rivers?
Median Household Income in Three Rivers is $75,313.
What is Income or Wage Gap in Three Rivers?
Income or Wage Gap in Three Rivers is 20.5%.
Women in Three Rivers earn 79.5 cents for every dollar earned by a man.
What is Inequality or Gini Index in Three Rivers?
Inequality or Gini Index in Three Rivers is 0.39.
What is the Total Population of Three Rivers?
Total Population of Three Rivers is 3,762.
What is the Total Male Population of Three Rivers?
Total Male Population of Three Rivers is 2,123.
What is the Total Female Population of Three Rivers?
Total Female Population of Three Rivers is 1,639.
What is the Ratio of Males per 100 Females in Three Rivers?
There are 129.53 Males per 100 Females in Three Rivers.
What is the Ratio of Females per 100 Males in Three Rivers?
There are 77.20 Females per 100 Males in Three Rivers.
What is the Median Population Age in Three Rivers?
Median Population Age in Three Rivers is 51.0 Years.
What is the Average Family Size in Three Rivers
Average Family Size in Three Rivers is 2.5 People.
What is the Average Household Size in Three Rivers
Average Household Size in Three Rivers is 2.2 People.
How Large is the Labor Force in Three Rivers?
There are 1,991 People in the Labor Forcein in Three Rivers.
What is the Percentage of People in the Labor Force in Three Rivers?
58.8% of People are in the Labor Force in Three Rivers.
What is the Unemployment Rate in Three Rivers?
Unemployment Rate in Three Rivers is 8.2%.