Rockcreek, OR Map & Demographics
Rockcreek Map
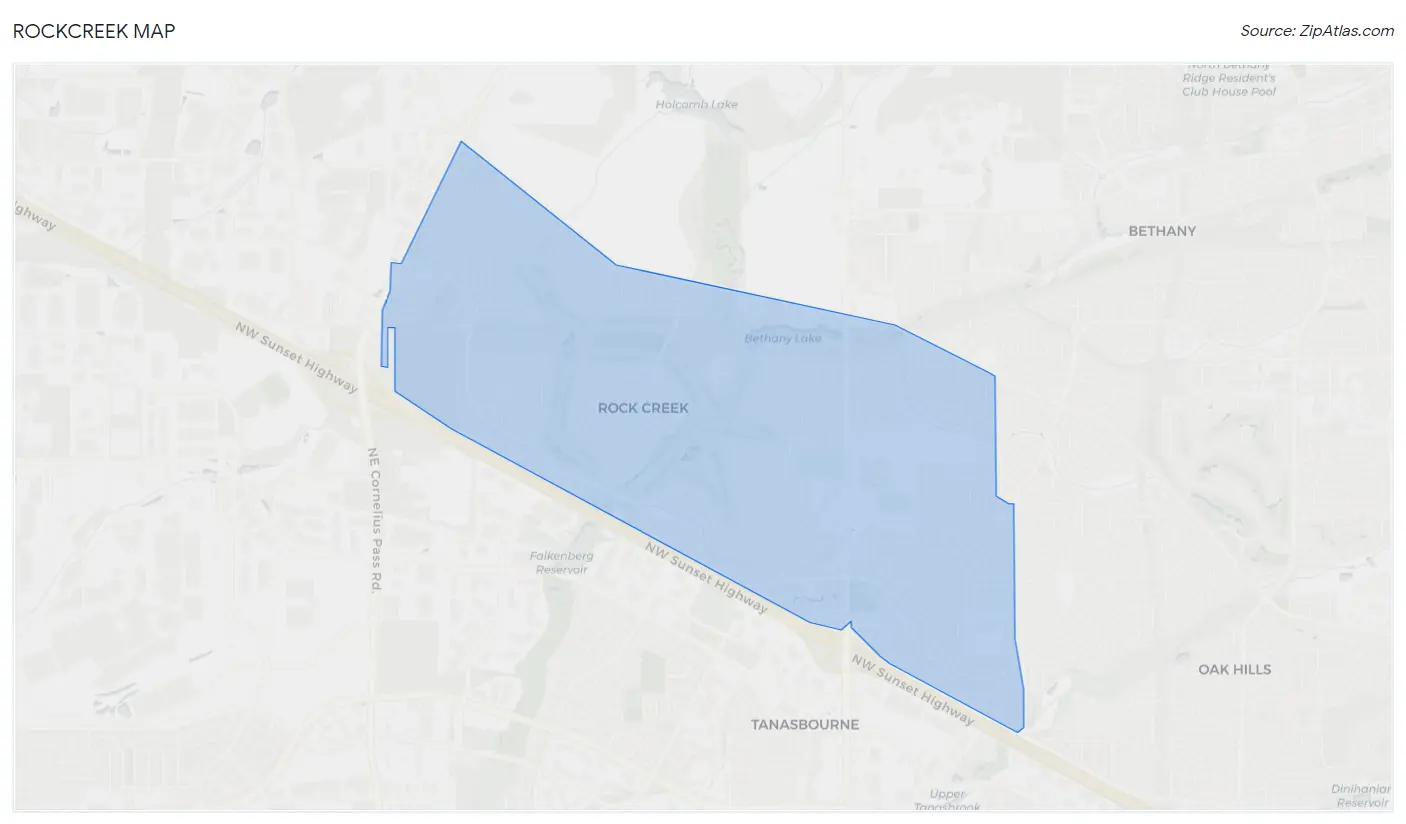
Rockcreek Overview
$49,916
PER CAPITA INCOME
$115,099
AVG FAMILY INCOME
$98,822
AVG HOUSEHOLD INCOME
5.3%
WAGE / INCOME GAP [ % ]
94.7¢/ $1
WAGE / INCOME GAP [ $ ]
0.38
INEQUALITY / GINI INDEX
9,923
TOTAL POPULATION
5,110
MALE POPULATION
4,813
FEMALE POPULATION
106.17
MALES / 100 FEMALES
94.19
FEMALES / 100 MALES
38.6
MEDIAN AGE
2.8
AVG FAMILY SIZE
2.6
AVG HOUSEHOLD SIZE
5,769
LABOR FORCE [ PEOPLE ]
69.2%
PERCENT IN LABOR FORCE
4.4%
UNEMPLOYMENT RATE
Income in Rockcreek
Income Overview in Rockcreek
Per Capita Income in Rockcreek is $49,916, while median incomes of families and households are $115,099 and $98,822 respectively.
| Characteristic | Number | Measure |
| Per Capita Income | 9,923 | $49,916 |
| Median Family Income | 2,796 | $115,099 |
| Mean Family Income | 2,796 | $135,130 |
| Median Household Income | 3,801 | $98,822 |
| Mean Household Income | 3,801 | $126,871 |
| Income Deficit | 2,796 | $0 |
| Wage / Income Gap (%) | 9,923 | 5.25% |
| Wage / Income Gap ($) | 9,923 | 94.75¢ per $1 |
| Gini / Inequality Index | 9,923 | 0.38 |
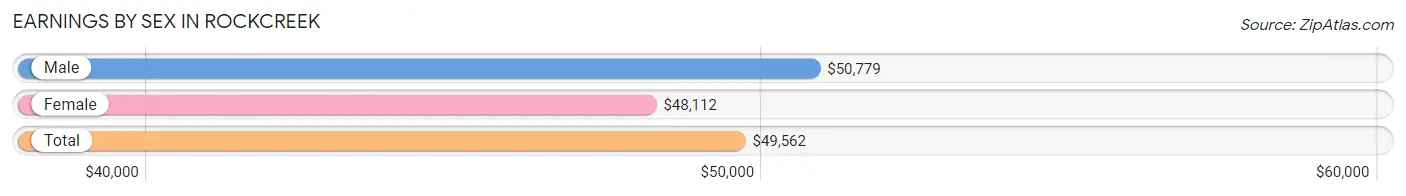
Earnings by Sex in Rockcreek
Average Earnings in Rockcreek are $49,562, $50,779 for men and $48,112 for women, a difference of 5.2%.
| Sex | Number | Average Earnings |
| Male | 3,479 (57.8%) | $50,779 |
| Female | 2,536 (42.2%) | $48,112 |
| Total | 6,015 (100.0%) | $49,562 |
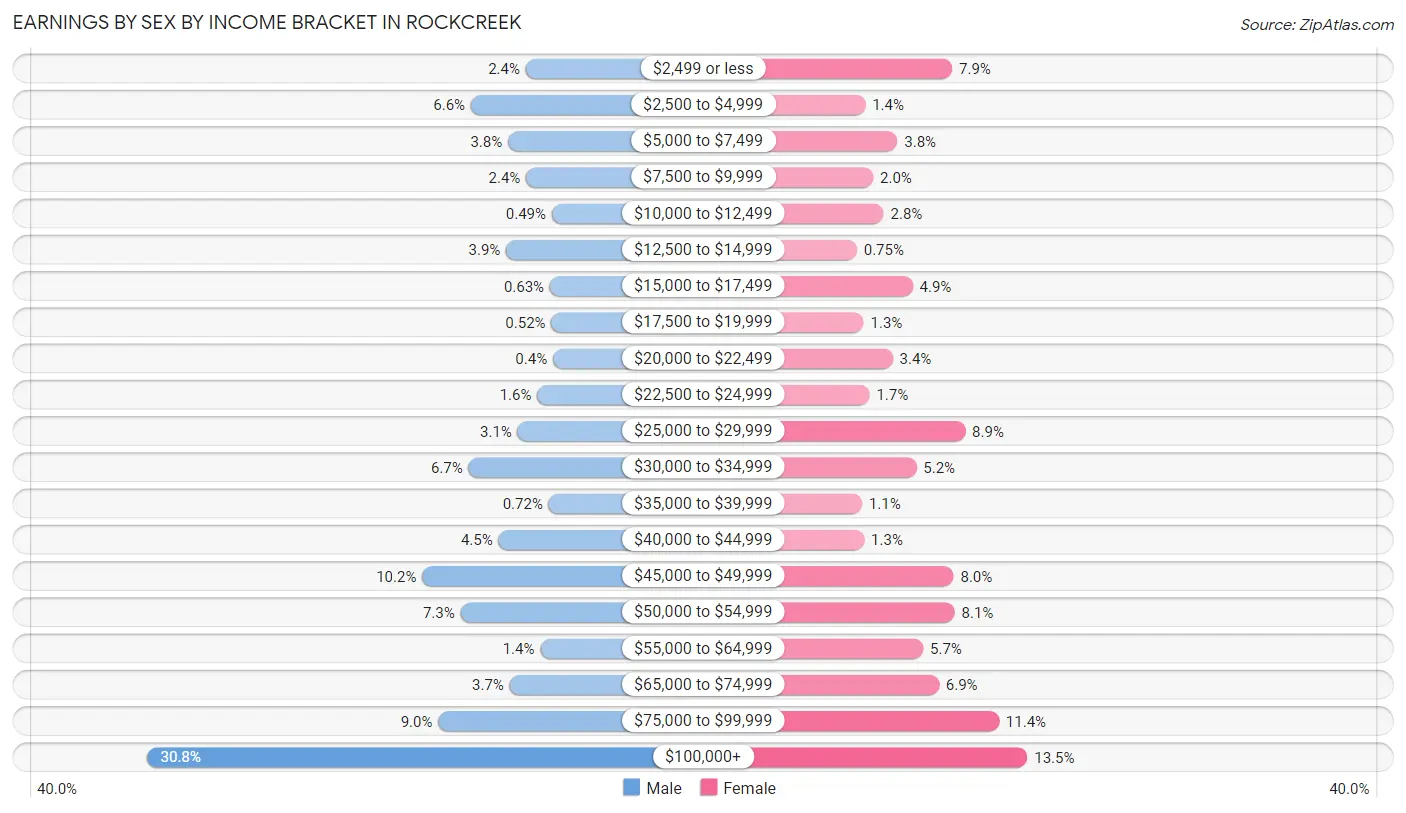
Earnings by Sex by Income Bracket in Rockcreek
The most common earnings brackets in Rockcreek are $100,000+ for men (1,071 | 30.8%) and $100,000+ for women (343 | 13.5%).
| Income | Male | Female |
| $2,499 or less | 85 (2.4%) | 200 (7.9%) |
| $2,500 to $4,999 | 228 (6.6%) | 35 (1.4%) |
| $5,000 to $7,499 | 131 (3.8%) | 96 (3.8%) |
| $7,500 to $9,999 | 84 (2.4%) | 50 (2.0%) |
| $10,000 to $12,499 | 17 (0.5%) | 70 (2.8%) |
| $12,500 to $14,999 | 136 (3.9%) | 19 (0.7%) |
| $15,000 to $17,499 | 22 (0.6%) | 125 (4.9%) |
| $17,500 to $19,999 | 18 (0.5%) | 32 (1.3%) |
| $20,000 to $22,499 | 14 (0.4%) | 87 (3.4%) |
| $22,500 to $24,999 | 55 (1.6%) | 43 (1.7%) |
| $25,000 to $29,999 | 106 (3.0%) | 225 (8.9%) |
| $30,000 to $34,999 | 234 (6.7%) | 132 (5.2%) |
| $35,000 to $39,999 | 25 (0.7%) | 29 (1.1%) |
| $40,000 to $44,999 | 156 (4.5%) | 33 (1.3%) |
| $45,000 to $49,999 | 355 (10.2%) | 203 (8.0%) |
| $50,000 to $54,999 | 255 (7.3%) | 205 (8.1%) |
| $55,000 to $64,999 | 47 (1.3%) | 145 (5.7%) |
| $65,000 to $74,999 | 127 (3.6%) | 175 (6.9%) |
| $75,000 to $99,999 | 313 (9.0%) | 289 (11.4%) |
| $100,000+ | 1,071 (30.8%) | 343 (13.5%) |
| Total | 3,479 (100.0%) | 2,536 (100.0%) |
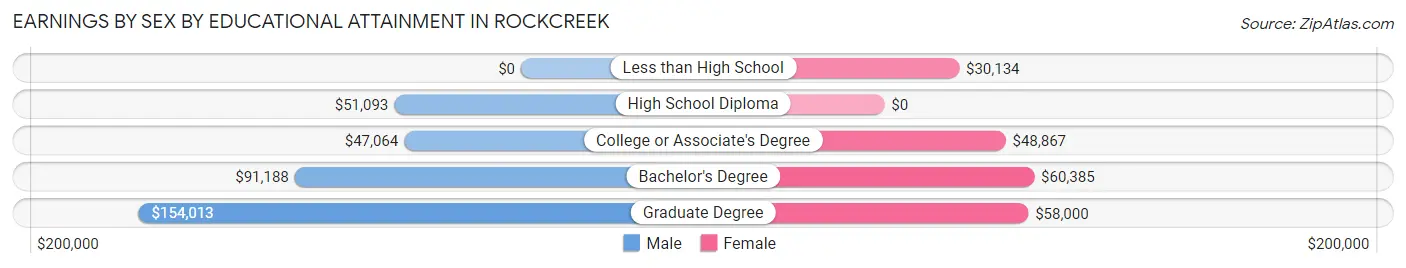
Earnings by Sex by Educational Attainment in Rockcreek
Average earnings in Rockcreek are $75,429 for men and $50,770 for women, a difference of 32.7%. Men with an educational attainment of graduate degree enjoy the highest average annual earnings of $154,013, while those with college or associate's degree education earn the least with $47,064. Women with an educational attainment of bachelor's degree earn the most with the average annual earnings of $60,385, while those with less than high school education have the smallest earnings of $30,134.
| Educational Attainment | Male Income | Female Income |
| Less than High School | - | - |
| High School Diploma | $51,093 | $0 |
| College or Associate's Degree | $47,064 | $48,867 |
| Bachelor's Degree | $91,188 | $60,385 |
| Graduate Degree | $154,013 | $58,000 |
| Total | $75,429 | $50,770 |
Family Income in Rockcreek
Family Income Brackets in Rockcreek
According to the Rockcreek family income data, there are 615 families falling into the $200,000+ income range, which is the most common income bracket and makes up 22.0% of all families. Conversely, the $10,000 to $14,999 income bracket is the least frequent group with only 17 families (0.6%) belonging to this category.
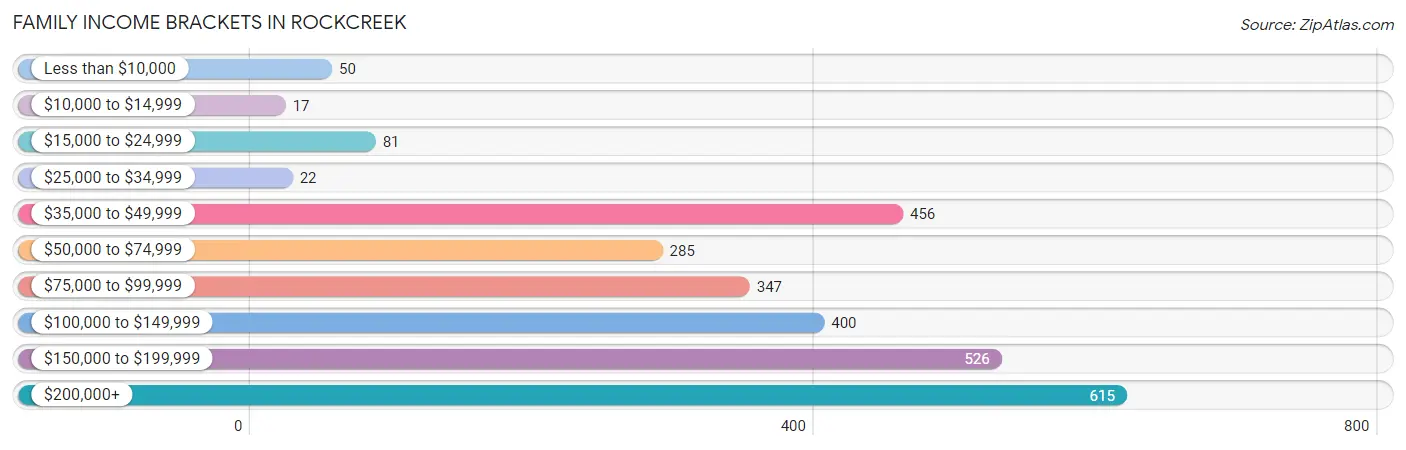
| Income Bracket | # Families | % Families |
| Less than $10,000 | 50 | 1.8% |
| $10,000 to $14,999 | 17 | 0.6% |
| $15,000 to $24,999 | 81 | 2.9% |
| $25,000 to $34,999 | 22 | 0.8% |
| $35,000 to $49,999 | 456 | 16.3% |
| $50,000 to $74,999 | 285 | 10.2% |
| $75,000 to $99,999 | 347 | 12.4% |
| $100,000 to $149,999 | 400 | 14.3% |
| $150,000 to $199,999 | 526 | 18.8% |
| $200,000+ | 615 | 22.0% |
Family Income by Famaliy Size in Rockcreek
5-person families (109 | 3.9%) account for the highest median family income in Rockcreek with $239,625 per family, while 4-person families (571 | 20.4%) have the highest median income of $50,203 per family member.
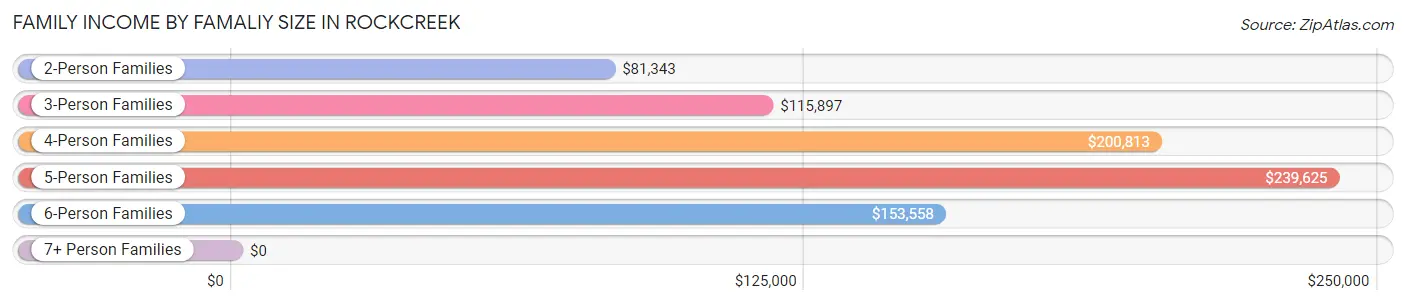
| Income Bracket | # Families | Median Income |
| 2-Person Families | 1,519 (54.3%) | $81,343 |
| 3-Person Families | 562 (20.1%) | $115,897 |
| 4-Person Families | 571 (20.4%) | $200,813 |
| 5-Person Families | 109 (3.9%) | $239,625 |
| 6-Person Families | 35 (1.3%) | $153,558 |
| 7+ Person Families | 0 (0.0%) | $0 |
| Total | 2,796 (100.0%) | $115,099 |
Family Income by Number of Earners in Rockcreek
The median family income in Rockcreek is $115,099, with families comprising 3+ earners (260) having the highest median family income of $200,635, while families with no earners (328) have the lowest median family income of $72,431, accounting for 9.3% and 11.7% of families, respectively.
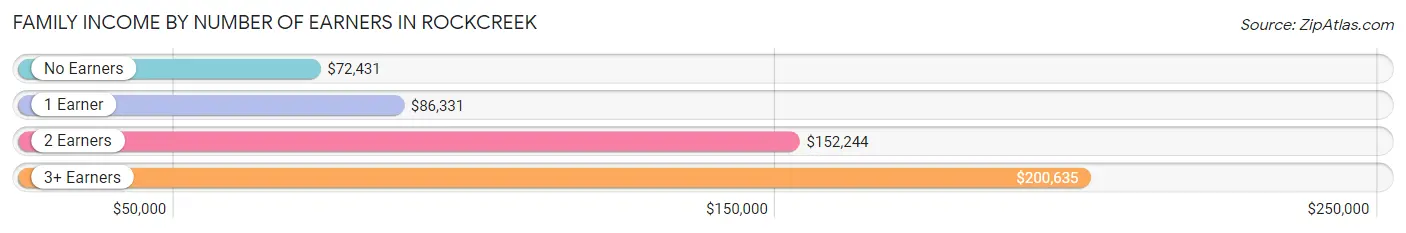
| Number of Earners | # Families | Median Income |
| No Earners | 328 (11.7%) | $72,431 |
| 1 Earner | 1,099 (39.3%) | $86,331 |
| 2 Earners | 1,109 (39.7%) | $152,244 |
| 3+ Earners | 260 (9.3%) | $200,635 |
| Total | 2,796 (100.0%) | $115,099 |
Household Income in Rockcreek
Household Income Brackets in Rockcreek
With 726 households falling in the category, the $200,000+ income range is the most frequent in Rockcreek, accounting for 19.1% of all households. In contrast, only 15 households (0.4%) fall into the $10,000 to $14,999 income bracket, making it the least populous group.
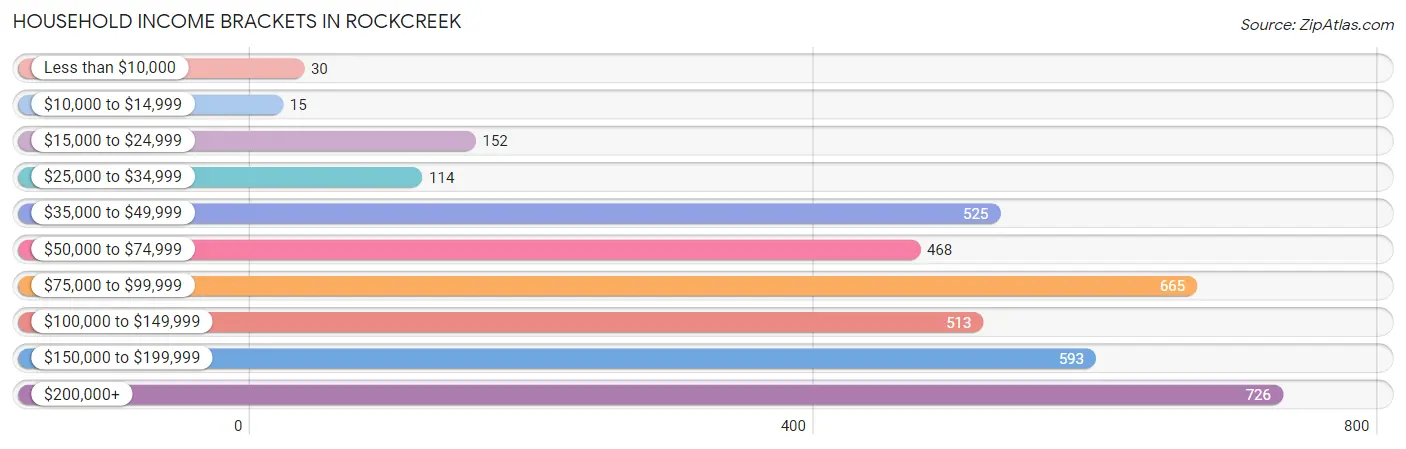
| Income Bracket | # Households | % Households |
| Less than $10,000 | 30 | 0.8% |
| $10,000 to $14,999 | 15 | 0.4% |
| $15,000 to $24,999 | 152 | 4.0% |
| $25,000 to $34,999 | 114 | 3.0% |
| $35,000 to $49,999 | 525 | 13.8% |
| $50,000 to $74,999 | 468 | 12.3% |
| $75,000 to $99,999 | 665 | 17.5% |
| $100,000 to $149,999 | 513 | 13.5% |
| $150,000 to $199,999 | 593 | 15.6% |
| $200,000+ | 726 | 19.1% |
Household Income by Householder Age in Rockcreek
The median household income in Rockcreek is $98,822, with the highest median household income of $120,179 found in the 25 to 44 years age bracket for the primary householder. A total of 1,152 households (30.3%) fall into this category. Meanwhile, the 15 to 24 years age bracket for the primary householder has the lowest median household income of $46,862, with 266 households (7.0%) in this group.
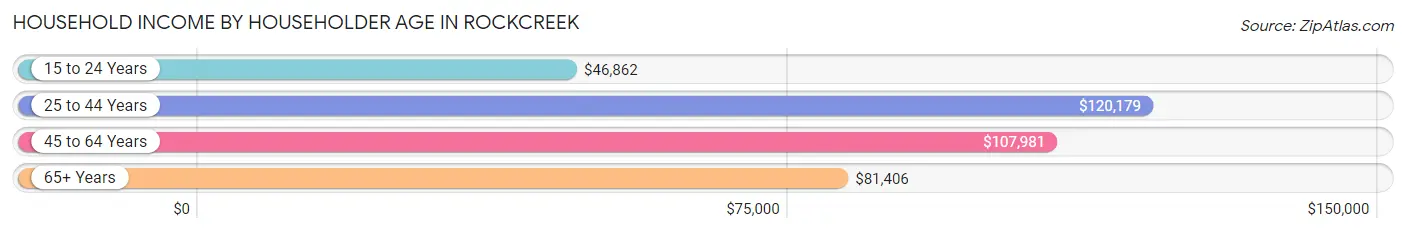
| Income Bracket | # Households | Median Income |
| 15 to 24 Years | 266 (7.0%) | $46,862 |
| 25 to 44 Years | 1,152 (30.3%) | $120,179 |
| 45 to 64 Years | 1,459 (38.4%) | $107,981 |
| 65+ Years | 924 (24.3%) | $81,406 |
| Total | 3,801 (100.0%) | $98,822 |
Poverty in Rockcreek
Income Below Poverty by Sex and Age in Rockcreek
With 7.5% poverty level for males and 3.6% for females among the residents of Rockcreek, 18 to 24 year old males and 45 to 54 year old females are the most vulnerable to poverty, with 192 males (23.4%) and 64 females (8.9%) in their respective age groups living below the poverty level.
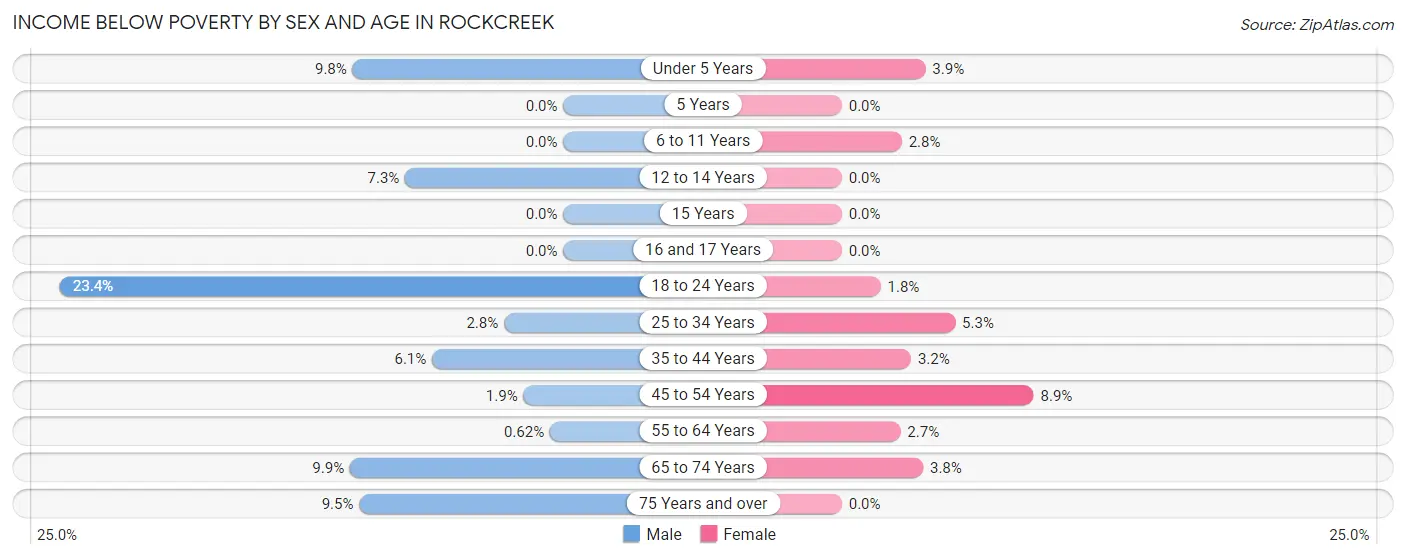
| Age Bracket | Male | Female |
| Under 5 Years | 27 (9.8%) | 8 (3.9%) |
| 5 Years | 0 (0.0%) | 0 (0.0%) |
| 6 to 11 Years | 0 (0.0%) | 12 (2.8%) |
| 12 to 14 Years | 13 (7.3%) | 0 (0.0%) |
| 15 Years | 0 (0.0%) | 0 (0.0%) |
| 16 and 17 Years | 0 (0.0%) | 0 (0.0%) |
| 18 to 24 Years | 192 (23.4%) | 7 (1.8%) |
| 25 to 34 Years | 21 (2.8%) | 31 (5.3%) |
| 35 to 44 Years | 45 (6.1%) | 18 (3.2%) |
| 45 to 54 Years | 13 (1.8%) | 64 (8.9%) |
| 55 to 64 Years | 3 (0.6%) | 17 (2.7%) |
| 65 to 74 Years | 50 (9.9%) | 17 (3.8%) |
| 75 Years and over | 18 (9.5%) | 0 (0.0%) |
| Total | 382 (7.5%) | 174 (3.6%) |
Income Above Poverty by Sex and Age in Rockcreek
According to the poverty statistics in Rockcreek, males aged 5 years and females aged 5 years are the age groups that are most secure financially, with 100.0% of males and 100.0% of females in these age groups living above the poverty line.
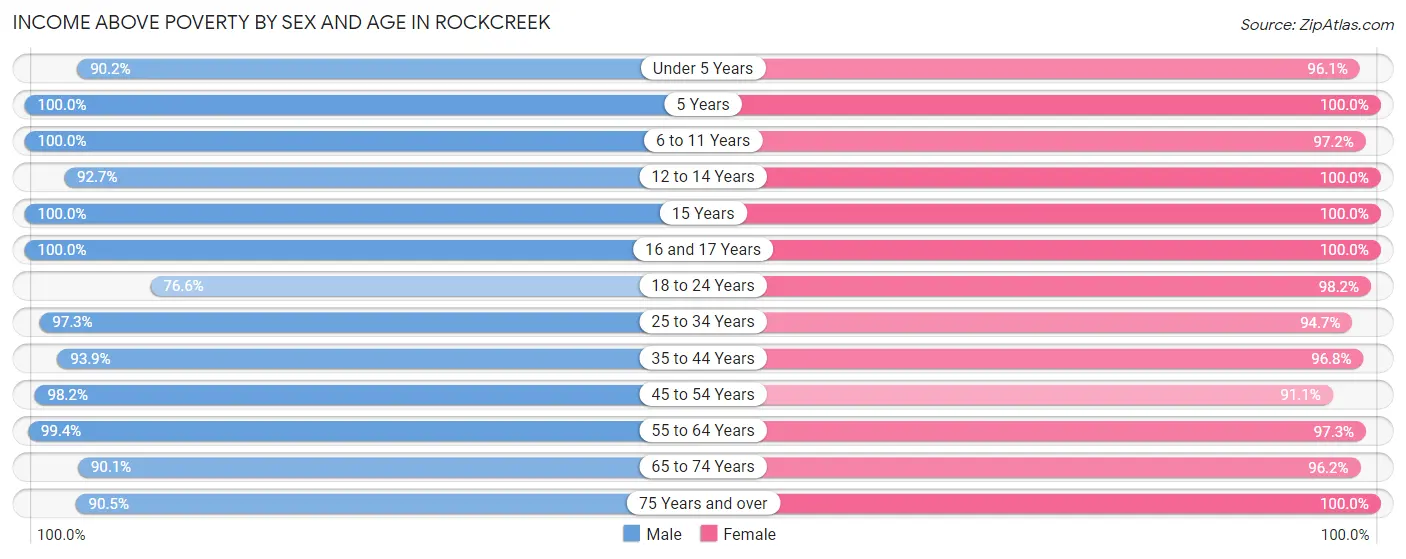
| Age Bracket | Male | Female |
| Under 5 Years | 249 (90.2%) | 198 (96.1%) |
| 5 Years | 46 (100.0%) | 59 (100.0%) |
| 6 to 11 Years | 184 (100.0%) | 419 (97.2%) |
| 12 to 14 Years | 164 (92.7%) | 87 (100.0%) |
| 15 Years | 18 (100.0%) | 102 (100.0%) |
| 16 and 17 Years | 205 (100.0%) | 147 (100.0%) |
| 18 to 24 Years | 630 (76.6%) | 382 (98.2%) |
| 25 to 34 Years | 742 (97.3%) | 558 (94.7%) |
| 35 to 44 Years | 694 (93.9%) | 543 (96.8%) |
| 45 to 54 Years | 690 (98.2%) | 655 (91.1%) |
| 55 to 64 Years | 479 (99.4%) | 608 (97.3%) |
| 65 to 74 Years | 455 (90.1%) | 434 (96.2%) |
| 75 Years and over | 172 (90.5%) | 447 (100.0%) |
| Total | 4,728 (92.5%) | 4,639 (96.4%) |
Income Below Poverty Among Married-Couple Families in Rockcreek
The poverty statistics for married-couple families in Rockcreek show that 1.4% or 30 of the total 2,146 families live below the poverty line. Families with 1 or 2 children have the highest poverty rate of 1.7%, comprising of 13 families. On the other hand, families with 3 or 4 children have the lowest poverty rate of 0.0%, which includes 0 families.
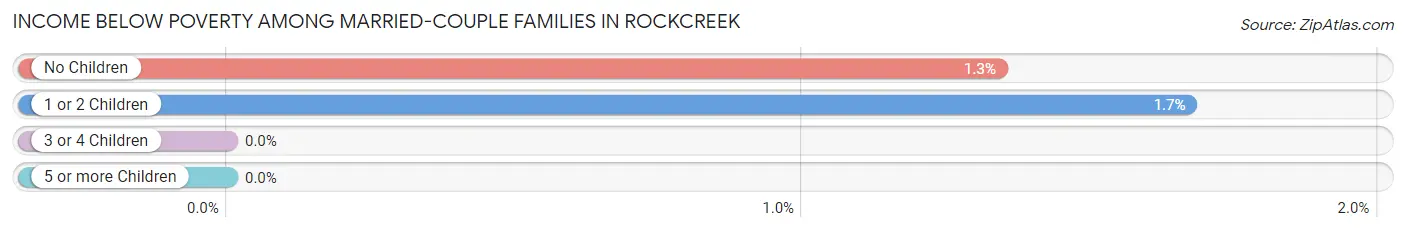
| Children | Above Poverty | Below Poverty |
| No Children | 1,248 (98.7%) | 17 (1.3%) |
| 1 or 2 Children | 764 (98.3%) | 13 (1.7%) |
| 3 or 4 Children | 104 (100.0%) | 0 (0.0%) |
| 5 or more Children | 0 (0.0%) | 0 (0.0%) |
| Total | 2,116 (98.6%) | 30 (1.4%) |
Income Below Poverty Among Single-Parent Households in Rockcreek
According to the poverty data in Rockcreek, 16.8% or 25 single-father households and 15.2% or 76 single-mother households are living below the poverty line. Among single-father households, those with 1 or 2 children have the highest poverty rate, with 25 households (18.7%) experiencing poverty. Likewise, among single-mother households, those with no children have the highest poverty rate, with 69 households (25.2%) falling below the poverty line.
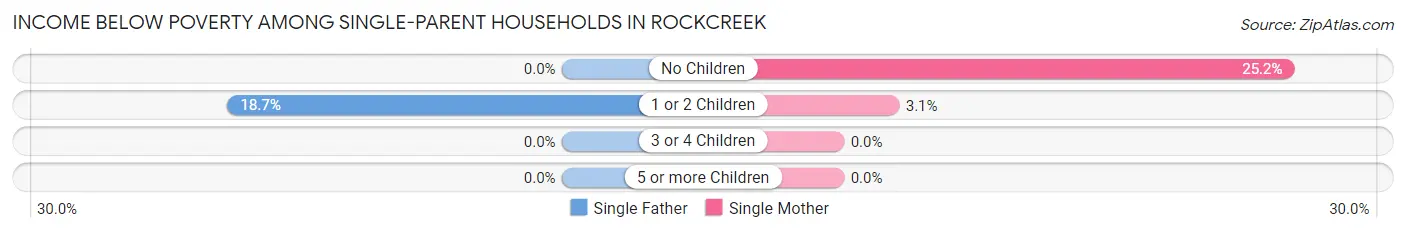
| Children | Single Father | Single Mother |
| No Children | 0 (0.0%) | 69 (25.2%) |
| 1 or 2 Children | 25 (18.7%) | 7 (3.1%) |
| 3 or 4 Children | 0 (0.0%) | 0 (0.0%) |
| 5 or more Children | 0 (0.0%) | 0 (0.0%) |
| Total | 25 (16.8%) | 76 (15.2%) |
Income Below Poverty Among Married-Couple vs Single-Parent Households in Rockcreek
The poverty data for Rockcreek shows that 30 of the married-couple family households (1.4%) and 101 of the single-parent households (15.5%) are living below the poverty level. Within the married-couple family households, those with 1 or 2 children have the highest poverty rate, with 13 households (1.7%) falling below the poverty line. Among the single-parent households, those with no children have the highest poverty rate, with 69 household (23.9%) living below poverty.
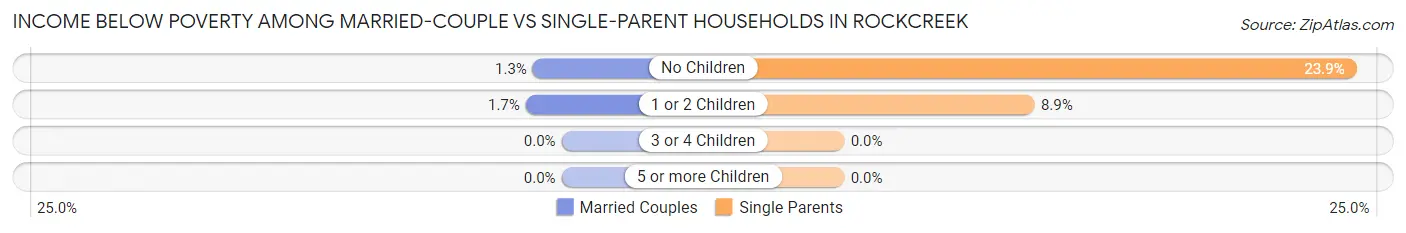
| Children | Married-Couple Families | Single-Parent Households |
| No Children | 17 (1.3%) | 69 (23.9%) |
| 1 or 2 Children | 13 (1.7%) | 32 (8.9%) |
| 3 or 4 Children | 0 (0.0%) | 0 (0.0%) |
| 5 or more Children | 0 (0.0%) | 0 (0.0%) |
| Total | 30 (1.4%) | 101 (15.5%) |
Race in Rockcreek
The most populous races in Rockcreek are White / Caucasian (7,594 | 76.5%), Asian (1,108 | 11.2%), and Two or more Races (1,046 | 10.5%).
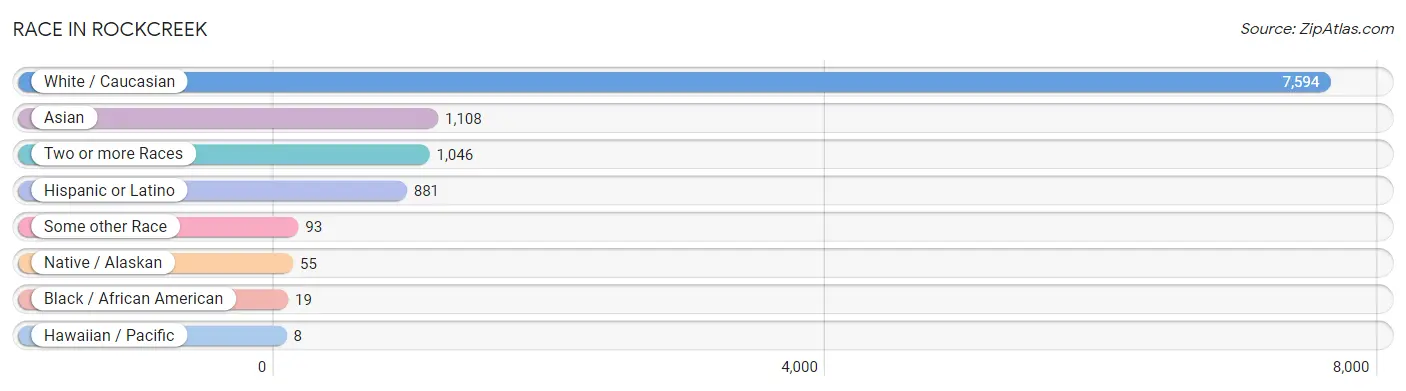
| Race | # Population | % Population |
| Asian | 1,108 | 11.2% |
| Black / African American | 19 | 0.2% |
| Hawaiian / Pacific | 8 | 0.1% |
| Hispanic or Latino | 881 | 8.9% |
| Native / Alaskan | 55 | 0.5% |
| White / Caucasian | 7,594 | 76.5% |
| Two or more Races | 1,046 | 10.5% |
| Some other Race | 93 | 0.9% |
| Total | 9,923 | 100.0% |
Ancestry in Rockcreek
The most populous ancestries reported in Rockcreek are English (1,678 | 16.9%), German (1,651 | 16.6%), Irish (1,227 | 12.4%), Mexican (593 | 6.0%), and European (414 | 4.2%), together accounting for 56.1% of all Rockcreek residents.
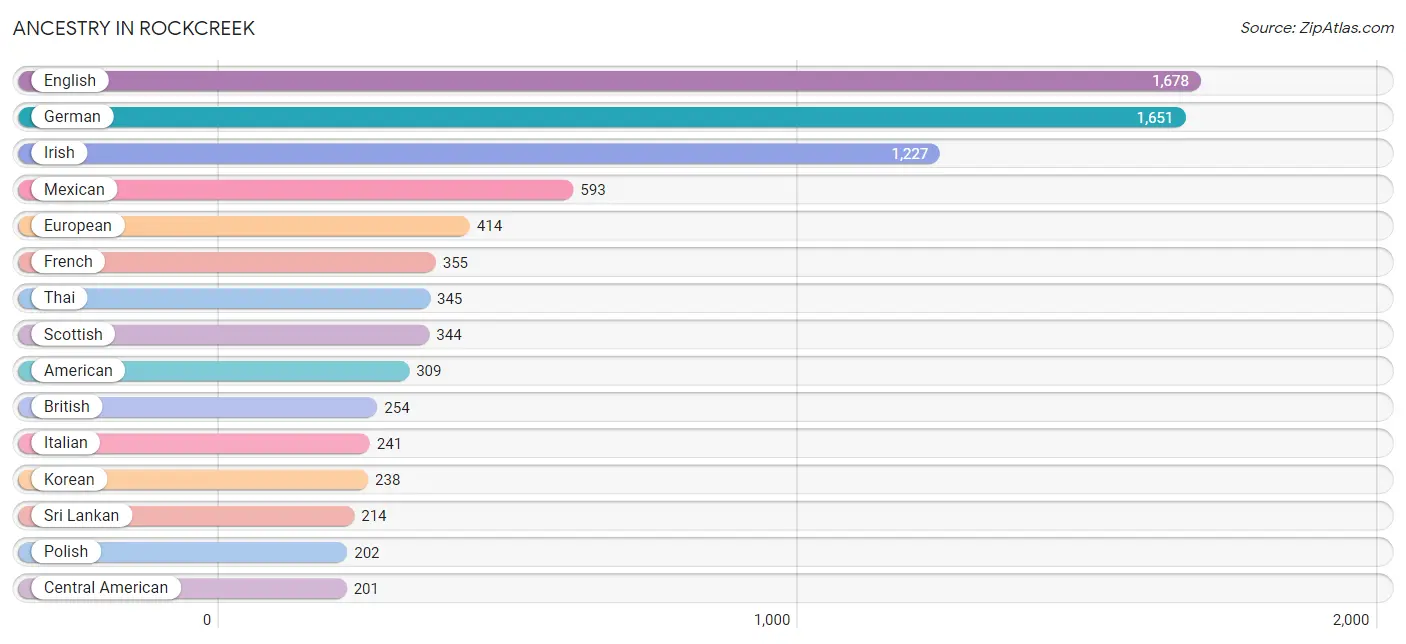
| Ancestry | # Population | % Population |
| Alsatian | 16 | 0.2% |
| American | 309 | 3.1% |
| Apache | 7 | 0.1% |
| Arab | 46 | 0.5% |
| Austrian | 63 | 0.6% |
| Bangladeshi | 72 | 0.7% |
| Belgian | 33 | 0.3% |
| Bhutanese | 87 | 0.9% |
| British | 254 | 2.6% |
| Burmese | 119 | 1.2% |
| Canadian | 140 | 1.4% |
| Central American | 201 | 2.0% |
| Cherokee | 13 | 0.1% |
| Chippewa | 14 | 0.1% |
| Colombian | 9 | 0.1% |
| Costa Rican | 56 | 0.6% |
| Croatian | 104 | 1.1% |
| Czech | 29 | 0.3% |
| Czechoslovakian | 52 | 0.5% |
| Danish | 83 | 0.8% |
| Dutch | 187 | 1.9% |
| Egyptian | 36 | 0.4% |
| English | 1,678 | 16.9% |
| European | 414 | 4.2% |
| Finnish | 142 | 1.4% |
| French | 355 | 3.6% |
| French Canadian | 95 | 1.0% |
| German | 1,651 | 16.6% |
| Guatemalan | 77 | 0.8% |
| Hungarian | 43 | 0.4% |
| Indian (Asian) | 159 | 1.6% |
| Iranian | 20 | 0.2% |
| Irish | 1,227 | 12.4% |
| Italian | 241 | 2.4% |
| Korean | 238 | 2.4% |
| Lebanese | 10 | 0.1% |
| Mexican | 593 | 6.0% |
| Native Hawaiian | 37 | 0.4% |
| Northern European | 108 | 1.1% |
| Norwegian | 161 | 1.6% |
| Panamanian | 23 | 0.2% |
| Peruvian | 75 | 0.8% |
| Polish | 202 | 2.0% |
| Portuguese | 13 | 0.1% |
| Puerto Rican | 3 | 0.0% |
| Russian | 74 | 0.7% |
| Samoan | 25 | 0.3% |
| Scandinavian | 66 | 0.7% |
| Scotch-Irish | 94 | 0.9% |
| Scottish | 344 | 3.5% |
| Serbian | 32 | 0.3% |
| Slovak | 31 | 0.3% |
| South American | 84 | 0.9% |
| Sri Lankan | 214 | 2.2% |
| Swedish | 143 | 1.4% |
| Swiss | 9 | 0.1% |
| Thai | 345 | 3.5% |
| Tlingit-Haida | 33 | 0.3% |
| Ukrainian | 147 | 1.5% |
| Vietnamese | 71 | 0.7% |
| Welsh | 191 | 1.9% | View All 61 Rows |
Immigrants in Rockcreek
The most numerous immigrant groups reported in Rockcreek came from Asia (623 | 6.3%), Europe (293 | 2.9%), South Central Asia (259 | 2.6%), India (226 | 2.3%), and Canada (210 | 2.1%), together accounting for 16.2% of all Rockcreek residents.

| Immigration Origin | # Population | % Population |
| Africa | 19 | 0.2% |
| Asia | 623 | 6.3% |
| Bangladesh | 24 | 0.2% |
| Bosnia and Herzegovina | 11 | 0.1% |
| Canada | 210 | 2.1% |
| Central America | 158 | 1.6% |
| China | 74 | 0.7% |
| Colombia | 9 | 0.1% |
| Eastern Asia | 163 | 1.6% |
| Eastern Europe | 41 | 0.4% |
| Egypt | 19 | 0.2% |
| England | 70 | 0.7% |
| Europe | 293 | 2.9% |
| Germany | 36 | 0.4% |
| Guatemala | 61 | 0.6% |
| India | 226 | 2.3% |
| Iran | 9 | 0.1% |
| Ireland | 12 | 0.1% |
| Italy | 9 | 0.1% |
| Japan | 28 | 0.3% |
| Korea | 61 | 0.6% |
| Latin America | 192 | 1.9% |
| Lebanon | 10 | 0.1% |
| Mexico | 97 | 1.0% |
| Northern Africa | 19 | 0.2% |
| Northern Europe | 207 | 2.1% |
| Oceania | 26 | 0.3% |
| Peru | 25 | 0.3% |
| Philippines | 37 | 0.4% |
| Russia | 11 | 0.1% |
| Scotland | 20 | 0.2% |
| Serbia | 11 | 0.1% |
| South America | 34 | 0.3% |
| South Central Asia | 259 | 2.6% |
| South Eastern Asia | 191 | 1.9% |
| Southern Europe | 9 | 0.1% |
| Taiwan | 27 | 0.3% |
| Ukraine | 8 | 0.1% |
| Vietnam | 154 | 1.5% |
| Western Asia | 10 | 0.1% |
| Western Europe | 36 | 0.4% | View All 41 Rows |
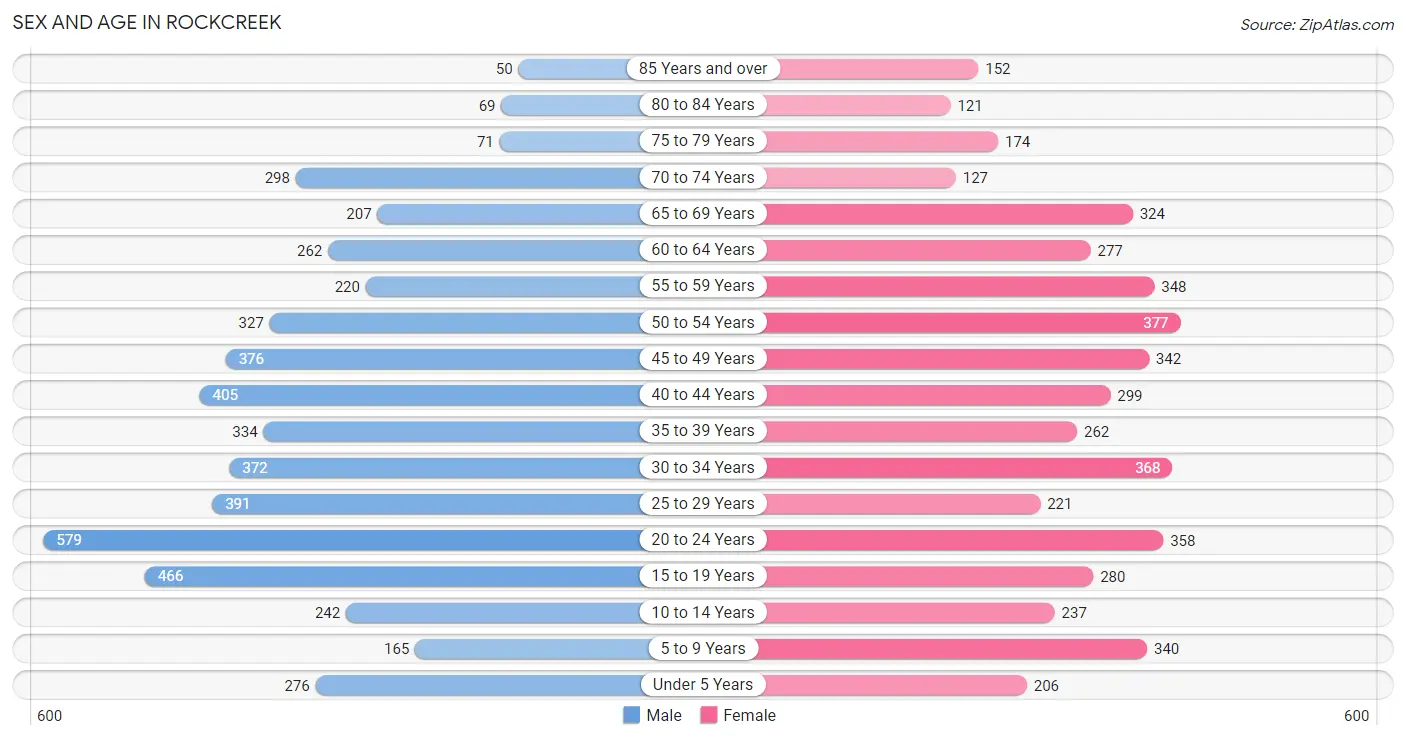
Sex and Age in Rockcreek
Sex and Age in Rockcreek
The most populous age groups in Rockcreek are 20 to 24 Years (579 | 11.3%) for men and 50 to 54 Years (377 | 7.8%) for women.
| Age Bracket | Male | Female |
| Under 5 Years | 276 (5.4%) | 206 (4.3%) |
| 5 to 9 Years | 165 (3.2%) | 340 (7.1%) |
| 10 to 14 Years | 242 (4.7%) | 237 (4.9%) |
| 15 to 19 Years | 466 (9.1%) | 280 (5.8%) |
| 20 to 24 Years | 579 (11.3%) | 358 (7.4%) |
| 25 to 29 Years | 391 (7.6%) | 221 (4.6%) |
| 30 to 34 Years | 372 (7.3%) | 368 (7.6%) |
| 35 to 39 Years | 334 (6.5%) | 262 (5.4%) |
| 40 to 44 Years | 405 (7.9%) | 299 (6.2%) |
| 45 to 49 Years | 376 (7.4%) | 342 (7.1%) |
| 50 to 54 Years | 327 (6.4%) | 377 (7.8%) |
| 55 to 59 Years | 220 (4.3%) | 348 (7.2%) |
| 60 to 64 Years | 262 (5.1%) | 277 (5.8%) |
| 65 to 69 Years | 207 (4.1%) | 324 (6.7%) |
| 70 to 74 Years | 298 (5.8%) | 127 (2.6%) |
| 75 to 79 Years | 71 (1.4%) | 174 (3.6%) |
| 80 to 84 Years | 69 (1.3%) | 121 (2.5%) |
| 85 Years and over | 50 (1.0%) | 152 (3.2%) |
| Total | 5,110 (100.0%) | 4,813 (100.0%) |
Families and Households in Rockcreek
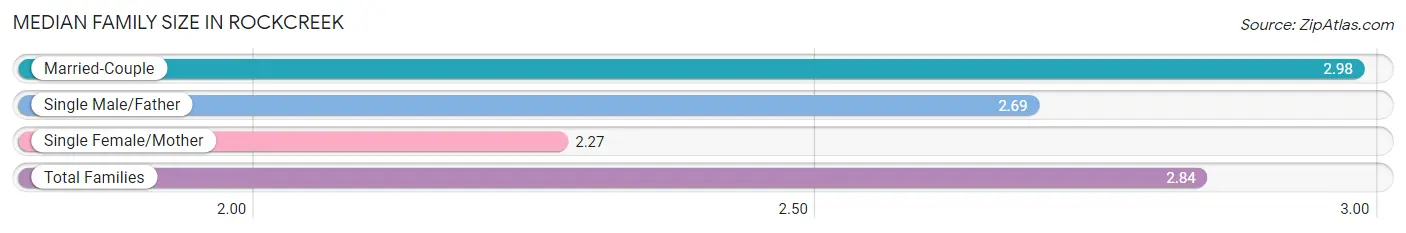
Median Family Size in Rockcreek
The median family size in Rockcreek is 2.84 persons per family, with married-couple families (2,146 | 76.7%) accounting for the largest median family size of 2.98 persons per family. On the other hand, single female/mother families (501 | 17.9%) represent the smallest median family size with 2.27 persons per family.
| Family Type | # Families | Family Size |
| Married-Couple | 2,146 (76.7%) | 2.98 |
| Single Male/Father | 149 (5.3%) | 2.69 |
| Single Female/Mother | 501 (17.9%) | 2.27 |
| Total Families | 2,796 (100.0%) | 2.84 |
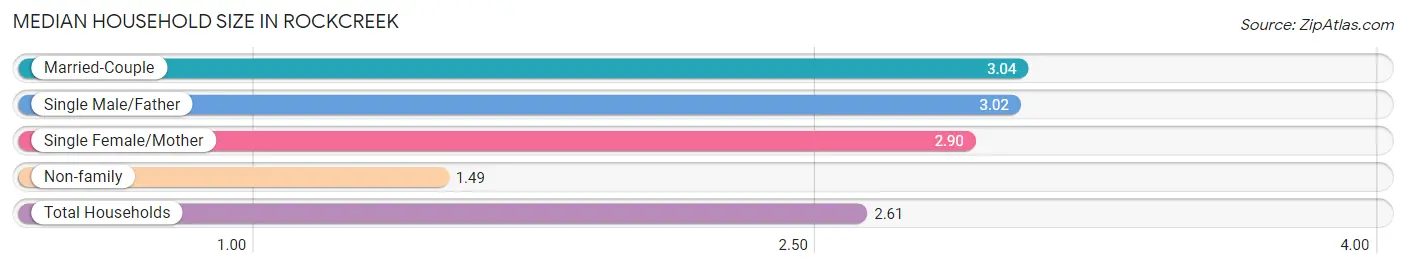
Median Household Size in Rockcreek
The median household size in Rockcreek is 2.61 persons per household, with married-couple households (2,146 | 56.5%) accounting for the largest median household size of 3.04 persons per household. non-family households (1,005 | 26.4%) represent the smallest median household size with 1.49 persons per household.
| Household Type | # Households | Household Size |
| Married-Couple | 2,146 (56.5%) | 3.04 |
| Single Male/Father | 149 (3.9%) | 3.02 |
| Single Female/Mother | 501 (13.2%) | 2.90 |
| Non-family | 1,005 (26.4%) | 1.49 |
| Total Households | 3,801 (100.0%) | 2.61 |
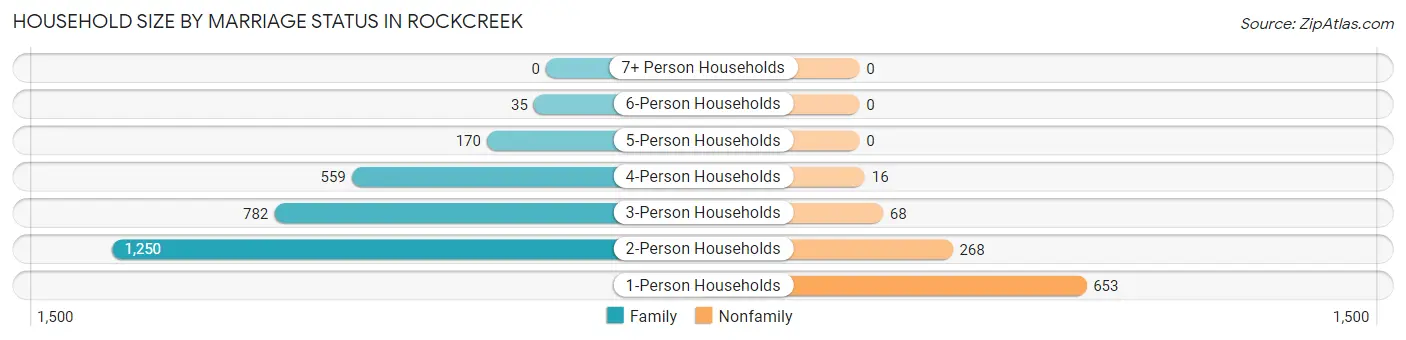
Household Size by Marriage Status in Rockcreek
Out of a total of 3,801 households in Rockcreek, 2,796 (73.6%) are family households, while 1,005 (26.4%) are nonfamily households. The most numerous type of family households are 2-person households, comprising 1,250, and the most common type of nonfamily households are 1-person households, comprising 653.
| Household Size | Family Households | Nonfamily Households |
| 1-Person Households | - | 653 (17.2%) |
| 2-Person Households | 1,250 (32.9%) | 268 (7.0%) |
| 3-Person Households | 782 (20.6%) | 68 (1.8%) |
| 4-Person Households | 559 (14.7%) | 16 (0.4%) |
| 5-Person Households | 170 (4.5%) | 0 (0.0%) |
| 6-Person Households | 35 (0.9%) | 0 (0.0%) |
| 7+ Person Households | 0 (0.0%) | 0 (0.0%) |
| Total | 2,796 (73.6%) | 1,005 (26.4%) |
Female Fertility in Rockcreek
Fertility by Age in Rockcreek
Average fertility rate in Rockcreek is 38.0 births per 1,000 women. Women in the age bracket of 20 to 34 years have the highest fertility rate with 49.0 births per 1,000 women. Women in the age bracket of 20 to 34 years acount for 54.8% of all women with births.
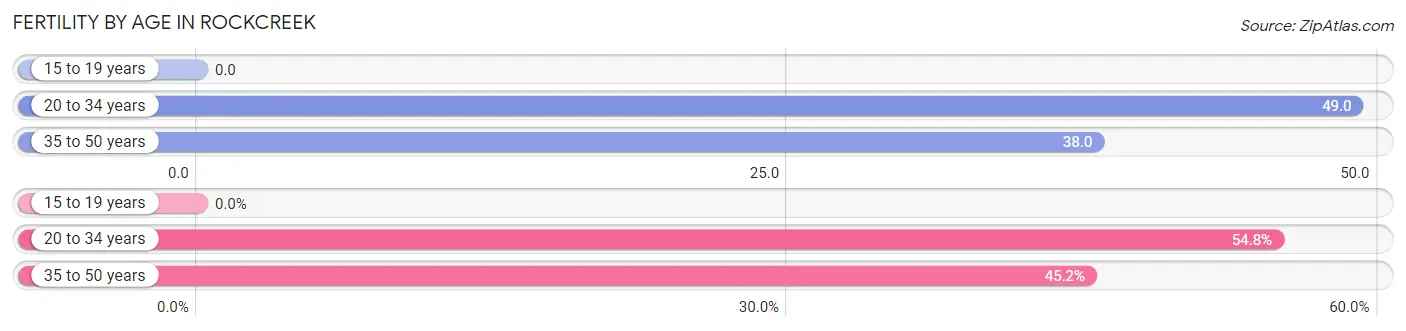
| Age Bracket | Women with Births | Births / 1,000 Women |
| 15 to 19 years | 0 (0.0%) | 0.0 |
| 20 to 34 years | 46 (54.8%) | 49.0 |
| 35 to 50 years | 38 (45.2%) | 38.0 |
| Total | 84 (100.0%) | 38.0 |
Fertility by Age by Marriage Status in Rockcreek
86.9% of women with births (84) in Rockcreek are married. The highest percentage of unmarried women with births falls into 20 to 34 years age bracket with 23.9% of them unmarried at the time of birth, while the lowest percentage of unmarried women with births belong to 35 to 50 years age bracket with 0.0% of them unmarried.
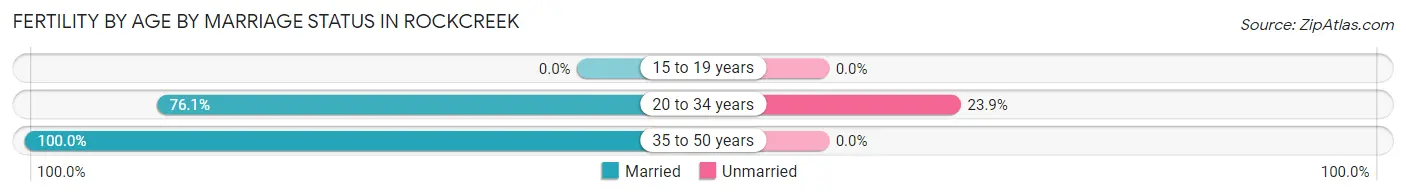
| Age Bracket | Married | Unmarried |
| 15 to 19 years | 0 (0.0%) | 0 (0.0%) |
| 20 to 34 years | 35 (76.1%) | 11 (23.9%) |
| 35 to 50 years | 38 (100.0%) | 0 (0.0%) |
| Total | 73 (86.9%) | 11 (13.1%) |
Fertility by Education in Rockcreek
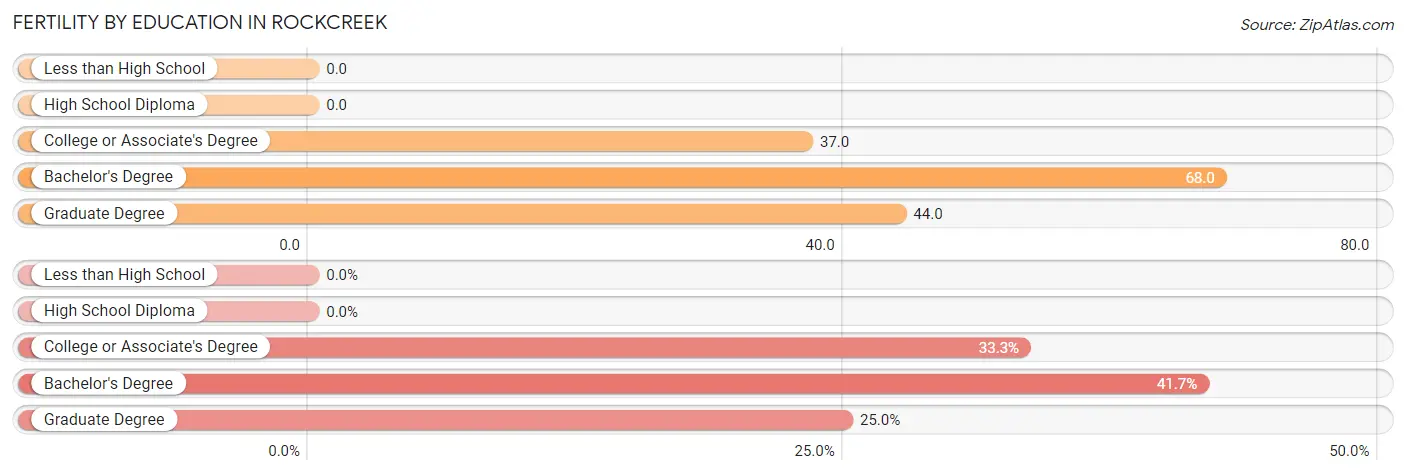
| Educational Attainment | Women with Births | Births / 1,000 Women |
| Less than High School | 0 (0.0%) | 0.0 |
| High School Diploma | 0 (0.0%) | 0.0 |
| College or Associate's Degree | 28 (33.3%) | 37.0 |
| Bachelor's Degree | 35 (41.7%) | 68.0 |
| Graduate Degree | 21 (25.0%) | 44.0 |
| Total | 84 (100.0%) | 38.0 |
Fertility by Education by Marriage Status in Rockcreek
13.1% of women with births in Rockcreek are unmarried. Women with the educational attainment of bachelor's degree are most likely to be married with 100.0% of them married at childbirth, while women with the educational attainment of college or associate's degree are least likely to be married with 39.3% of them unmarried at childbirth.
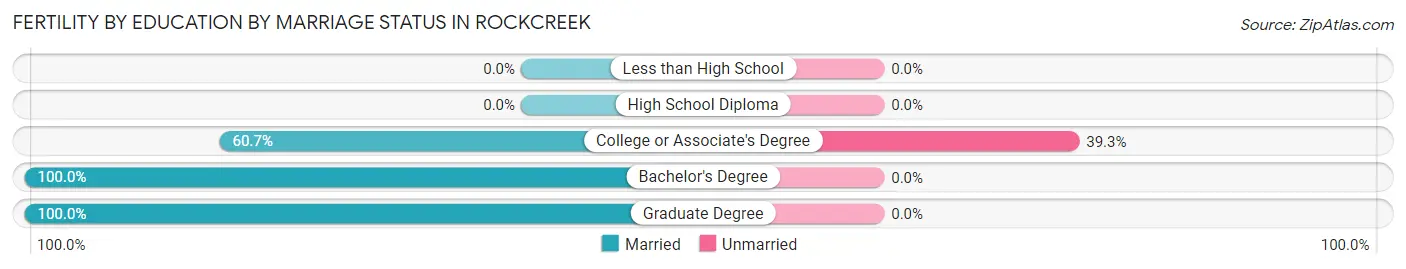
| Educational Attainment | Married | Unmarried |
| Less than High School | 0 (0.0%) | 0 (0.0%) |
| High School Diploma | 0 (0.0%) | 0 (0.0%) |
| College or Associate's Degree | 17 (60.7%) | 11 (39.3%) |
| Bachelor's Degree | 35 (100.0%) | 0 (0.0%) |
| Graduate Degree | 21 (100.0%) | 0 (0.0%) |
| Total | 73 (86.9%) | 11 (13.1%) |
Employment Characteristics in Rockcreek
Employment by Class of Employer in Rockcreek
Among the 5,430 employed individuals in Rockcreek, private company employees (4,128 | 76.0%), self-employed (not incorporated) (438 | 8.1%), and local government employees (289 | 5.3%) make up the most common classes of employment.
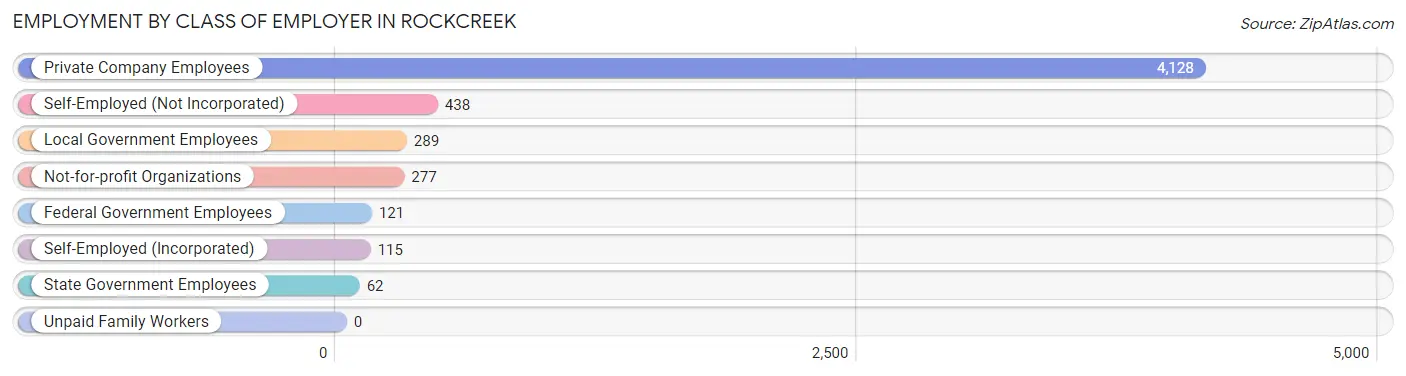
| Employer Class | # Employees | % Employees |
| Private Company Employees | 4,128 | 76.0% |
| Self-Employed (Incorporated) | 115 | 2.1% |
| Self-Employed (Not Incorporated) | 438 | 8.1% |
| Not-for-profit Organizations | 277 | 5.1% |
| Local Government Employees | 289 | 5.3% |
| State Government Employees | 62 | 1.1% |
| Federal Government Employees | 121 | 2.2% |
| Unpaid Family Workers | 0 | 0.0% |
| Total | 5,430 | 100.0% |
Employment Status by Age in Rockcreek
According to the labor force statistics for Rockcreek, out of the total population over 16 years of age (8,337), 69.2% or 5,769 individuals are in the labor force, with 4.4% or 254 of them unemployed. The age group with the highest labor force participation rate is 45 to 54 years, with 92.1% or 1,310 individuals in the labor force. Within the labor force, the 16 to 19 years age range has the highest percentage of unemployed individuals, with 24.8% or 61 of them being unemployed.
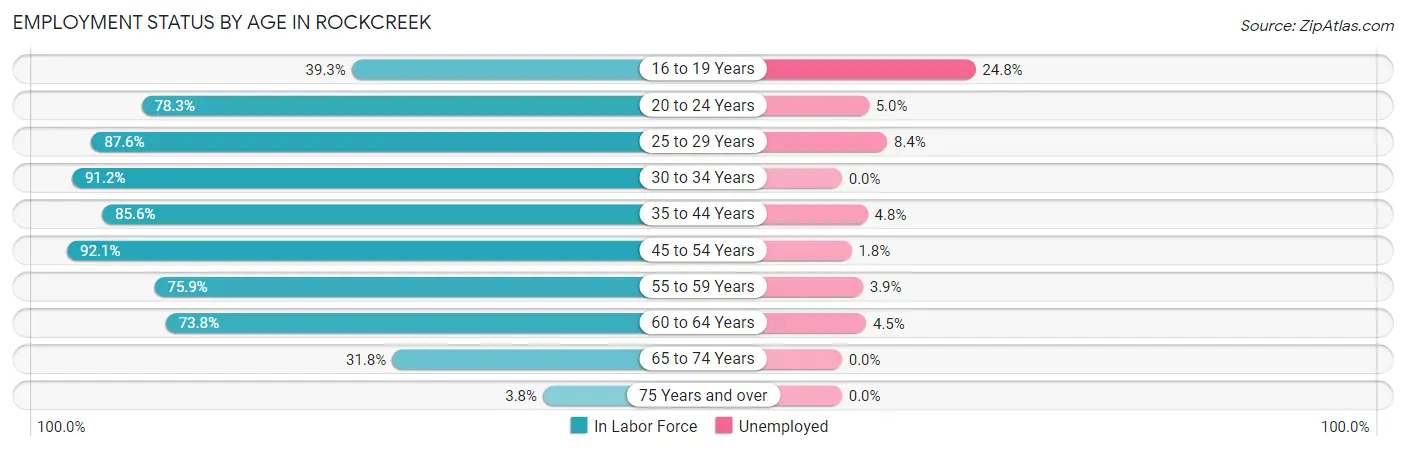
| Age Bracket | In Labor Force | Unemployed |
| 16 to 19 Years | 246 (39.3%) | 61 (24.8%) |
| 20 to 24 Years | 734 (78.3%) | 37 (5.0%) |
| 25 to 29 Years | 536 (87.6%) | 45 (8.4%) |
| 30 to 34 Years | 675 (91.2%) | 0 (0.0%) |
| 35 to 44 Years | 1,113 (85.6%) | 53 (4.8%) |
| 45 to 54 Years | 1,310 (92.1%) | 24 (1.8%) |
| 55 to 59 Years | 431 (75.9%) | 17 (3.9%) |
| 60 to 64 Years | 398 (73.8%) | 18 (4.5%) |
| 65 to 74 Years | 304 (31.8%) | 0 (0.0%) |
| 75 Years and over | 24 (3.8%) | 0 (0.0%) |
| Total | 5,769 (69.2%) | 254 (4.4%) |
Employment Status by Educational Attainment in Rockcreek
According to labor force statistics for Rockcreek, 86.1% of individuals (4,461) out of the total population between 25 and 64 years of age (5,181) are in the labor force, with 3.5% or 156 of them being unemployed. The group with the highest labor force participation rate are those with the educational attainment of less than high school, with 99.3% or 143 individuals in the labor force. Within the labor force, individuals with less than high school education have the highest percentage of unemployment, with 9.1% or 13 of them being unemployed.
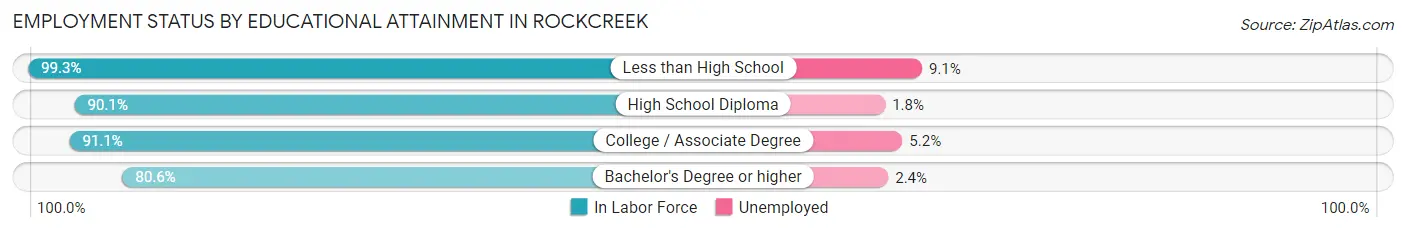
| Educational Attainment | In Labor Force | Unemployed |
| Less than High School | 143 (99.3%) | 13 (9.1%) |
| High School Diploma | 768 (90.1%) | 15 (1.8%) |
| College / Associate Degree | 1,531 (91.1%) | 87 (5.2%) |
| Bachelor's Degree or higher | 2,018 (80.6%) | 60 (2.4%) |
| Total | 4,461 (86.1%) | 181 (3.5%) |
Employment Occupations by Sex in Rockcreek
Management, Business, Science and Arts Occupations
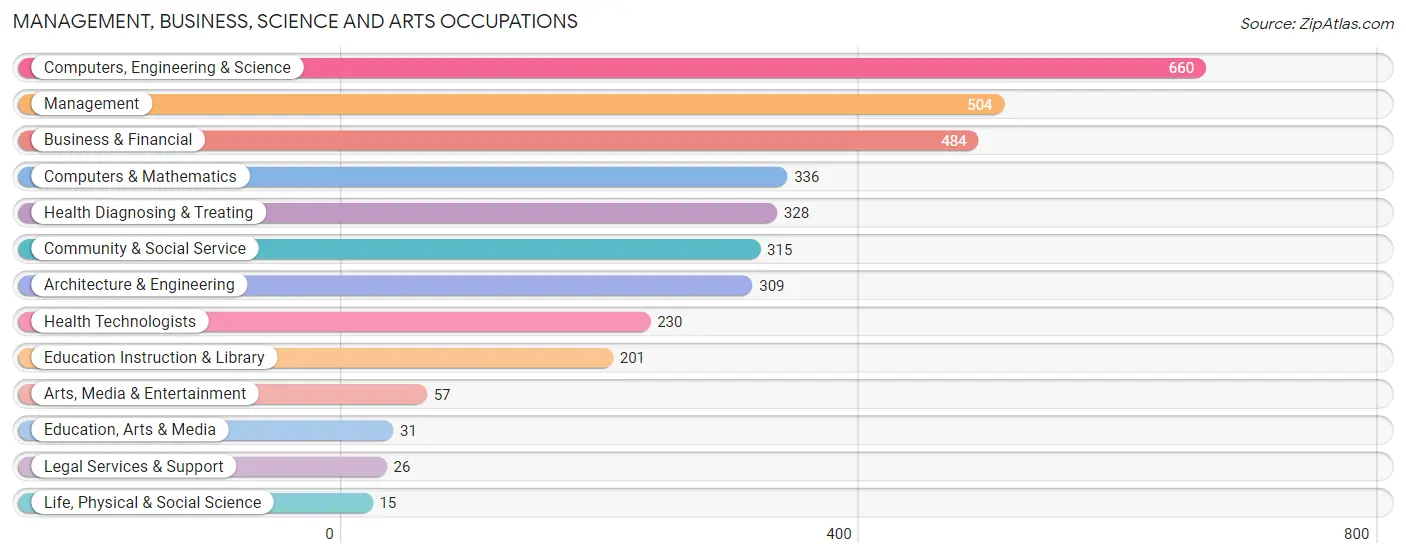
The most common Management, Business, Science and Arts occupations in Rockcreek are Computers, Engineering & Science (660 | 12.0%), Management (504 | 9.1%), Business & Financial (484 | 8.8%), Computers & Mathematics (336 | 6.1%), and Health Diagnosing & Treating (328 | 5.9%).
Management, Business, Science and Arts Occupations by Sex
Within the Management, Business, Science and Arts occupations in Rockcreek, the most male-oriented occupations are Life, Physical & Social Science (100.0%), Architecture & Engineering (88.0%), and Arts, Media & Entertainment (77.2%), while the most female-oriented occupations are Health Technologists (86.5%), Education Instruction & Library (85.6%), and Health Diagnosing & Treating (81.1%).
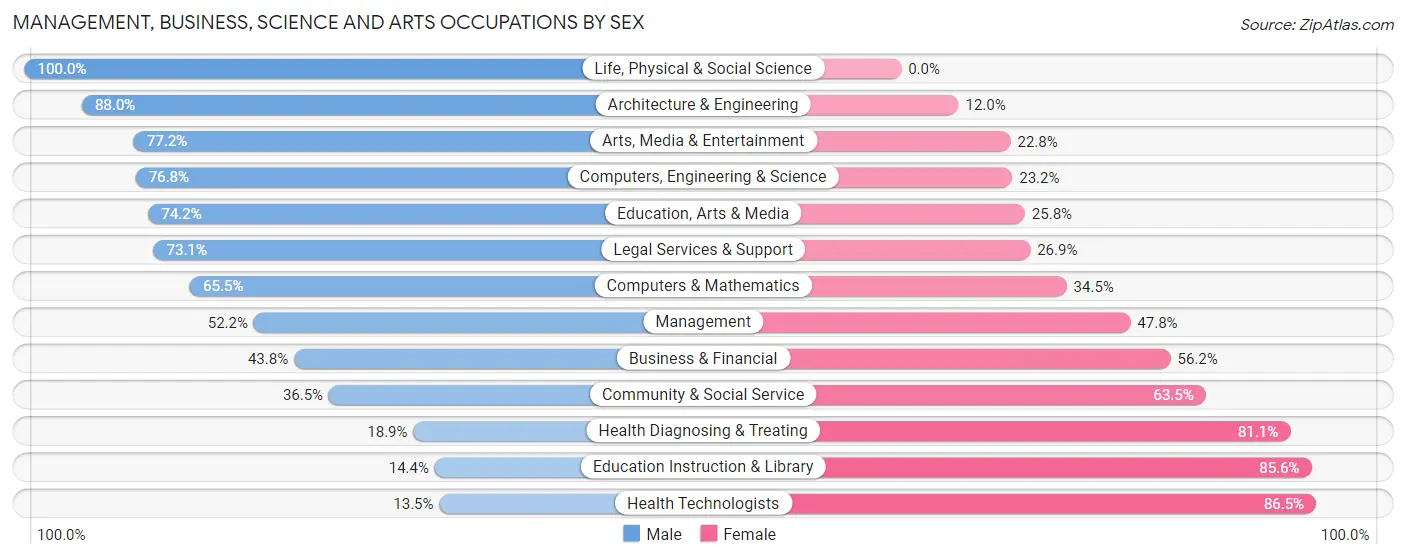
| Occupation | Male | Female |
| Management | 263 (52.2%) | 241 (47.8%) |
| Business & Financial | 212 (43.8%) | 272 (56.2%) |
| Computers, Engineering & Science | 507 (76.8%) | 153 (23.2%) |
| Computers & Mathematics | 220 (65.5%) | 116 (34.5%) |
| Architecture & Engineering | 272 (88.0%) | 37 (12.0%) |
| Life, Physical & Social Science | 15 (100.0%) | 0 (0.0%) |
| Community & Social Service | 115 (36.5%) | 200 (63.5%) |
| Education, Arts & Media | 23 (74.2%) | 8 (25.8%) |
| Legal Services & Support | 19 (73.1%) | 7 (26.9%) |
| Education Instruction & Library | 29 (14.4%) | 172 (85.6%) |
| Arts, Media & Entertainment | 44 (77.2%) | 13 (22.8%) |
| Health Diagnosing & Treating | 62 (18.9%) | 266 (81.1%) |
| Health Technologists | 31 (13.5%) | 199 (86.5%) |
| Total (Category) | 1,159 (50.6%) | 1,132 (49.4%) |
| Total (Overall) | 3,170 (57.5%) | 2,341 (42.5%) |
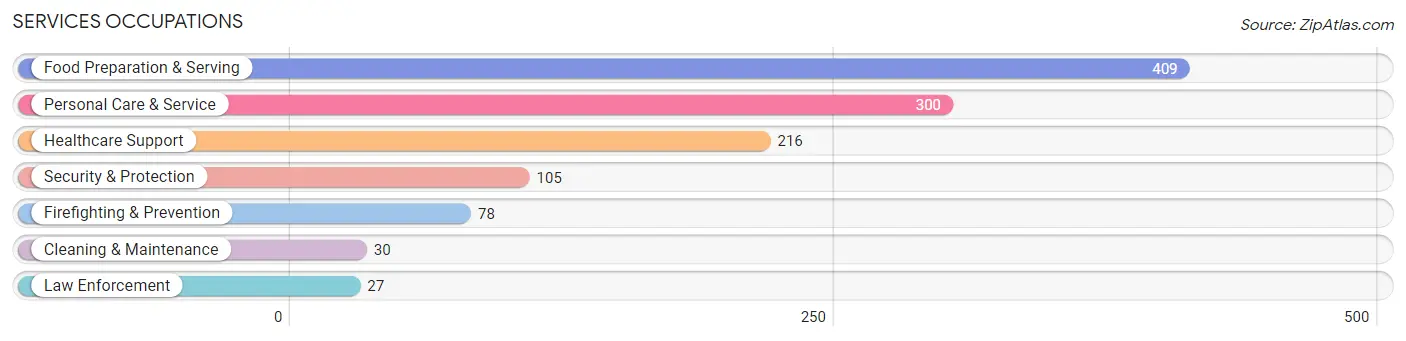
Services Occupations
The most common Services occupations in Rockcreek are Food Preparation & Serving (409 | 7.4%), Personal Care & Service (300 | 5.4%), Healthcare Support (216 | 3.9%), Security & Protection (105 | 1.9%), and Firefighting & Prevention (78 | 1.4%).
Services Occupations by Sex
Within the Services occupations in Rockcreek, the most male-oriented occupations are Security & Protection (100.0%), Firefighting & Prevention (100.0%), and Law Enforcement (100.0%), while the most female-oriented occupations are Healthcare Support (87.5%), Personal Care & Service (63.7%), and Food Preparation & Serving (43.0%).
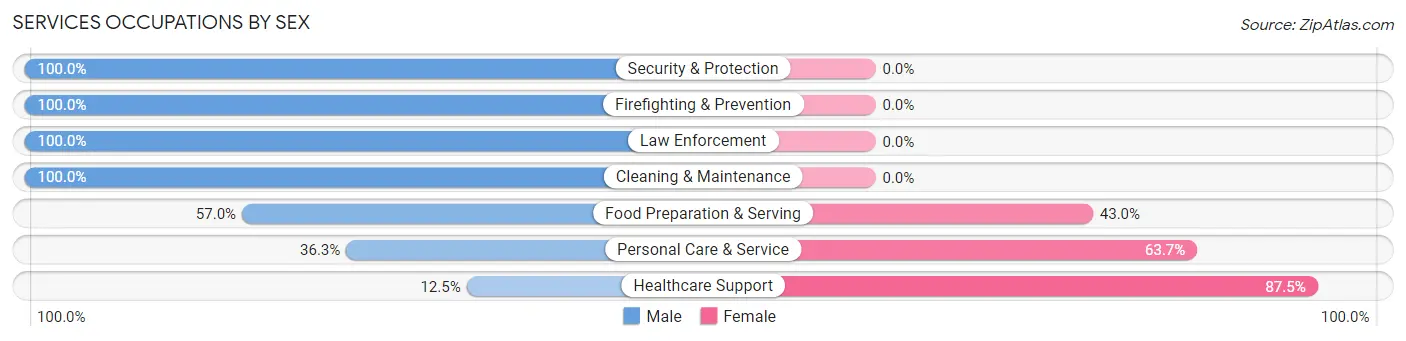
| Occupation | Male | Female |
| Healthcare Support | 27 (12.5%) | 189 (87.5%) |
| Security & Protection | 105 (100.0%) | 0 (0.0%) |
| Firefighting & Prevention | 78 (100.0%) | 0 (0.0%) |
| Law Enforcement | 27 (100.0%) | 0 (0.0%) |
| Food Preparation & Serving | 233 (57.0%) | 176 (43.0%) |
| Cleaning & Maintenance | 30 (100.0%) | 0 (0.0%) |
| Personal Care & Service | 109 (36.3%) | 191 (63.7%) |
| Total (Category) | 504 (47.5%) | 556 (52.4%) |
| Total (Overall) | 3,170 (57.5%) | 2,341 (42.5%) |
Sales and Office Occupations
The most common Sales and Office occupations in Rockcreek are Sales & Related (707 | 12.8%), and Office & Administration (600 | 10.9%).
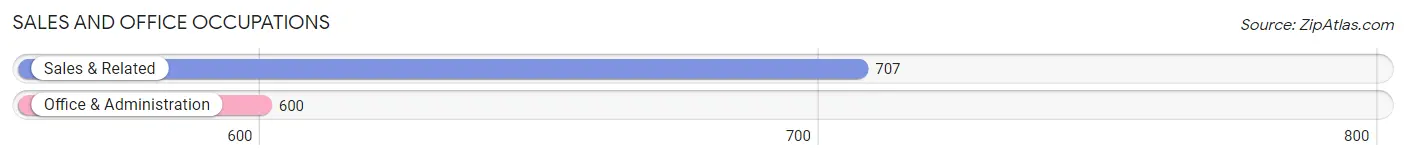
Sales and Office Occupations by Sex
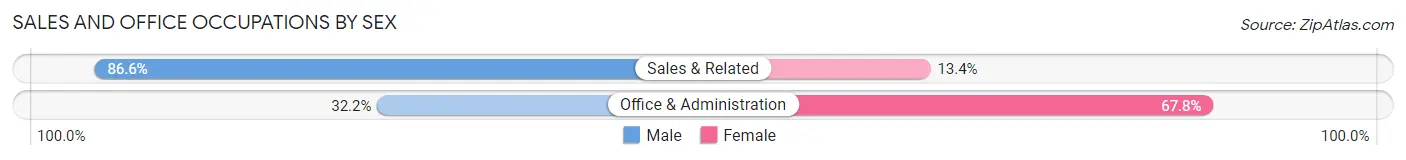
| Occupation | Male | Female |
| Sales & Related | 612 (86.6%) | 95 (13.4%) |
| Office & Administration | 193 (32.2%) | 407 (67.8%) |
| Total (Category) | 805 (61.6%) | 502 (38.4%) |
| Total (Overall) | 3,170 (57.5%) | 2,341 (42.5%) |
Natural Resources, Construction and Maintenance Occupations
The most common Natural Resources, Construction and Maintenance occupations in Rockcreek are Construction & Extraction (240 | 4.3%), and Installation, Maintenance & Repair (162 | 2.9%).
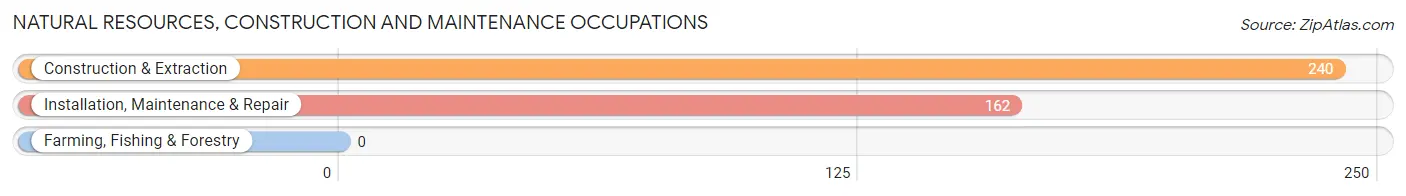
Natural Resources, Construction and Maintenance Occupations by Sex
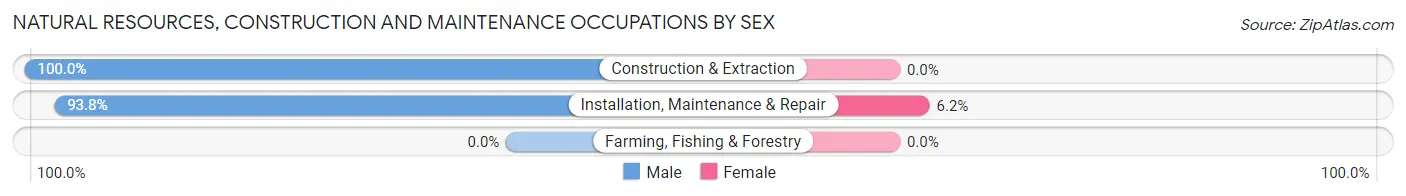
| Occupation | Male | Female |
| Farming, Fishing & Forestry | 0 (0.0%) | 0 (0.0%) |
| Construction & Extraction | 240 (100.0%) | 0 (0.0%) |
| Installation, Maintenance & Repair | 152 (93.8%) | 10 (6.2%) |
| Total (Category) | 392 (97.5%) | 10 (2.5%) |
| Total (Overall) | 3,170 (57.5%) | 2,341 (42.5%) |
Production, Transportation and Moving Occupations
The most common Production, Transportation and Moving occupations in Rockcreek are Material Moving (215 | 3.9%), Production (148 | 2.7%), and Transportation (88 | 1.6%).
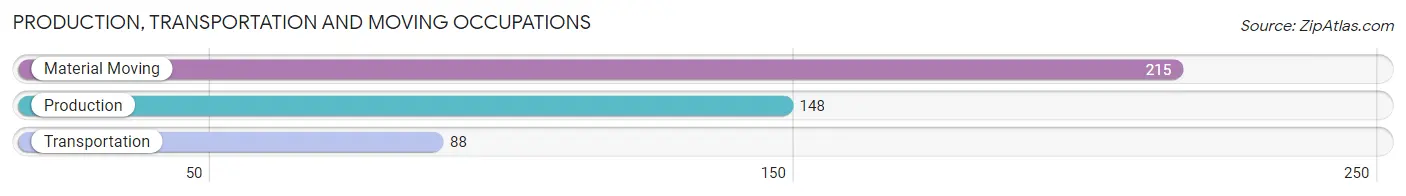
Production, Transportation and Moving Occupations by Sex
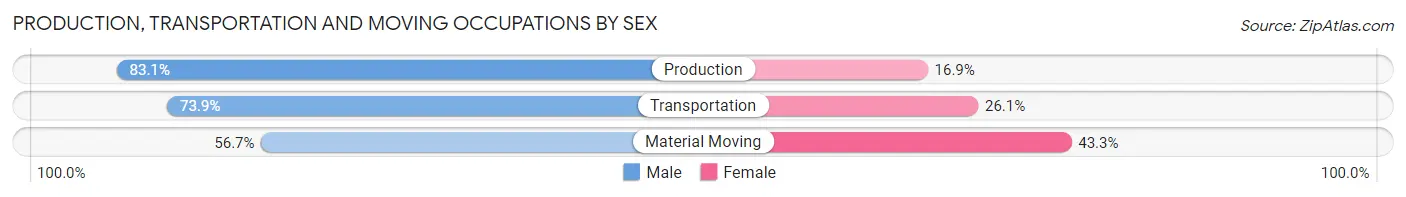
| Occupation | Male | Female |
| Production | 123 (83.1%) | 25 (16.9%) |
| Transportation | 65 (73.9%) | 23 (26.1%) |
| Material Moving | 122 (56.7%) | 93 (43.3%) |
| Total (Category) | 310 (68.7%) | 141 (31.3%) |
| Total (Overall) | 3,170 (57.5%) | 2,341 (42.5%) |
Employment Industries by Sex in Rockcreek
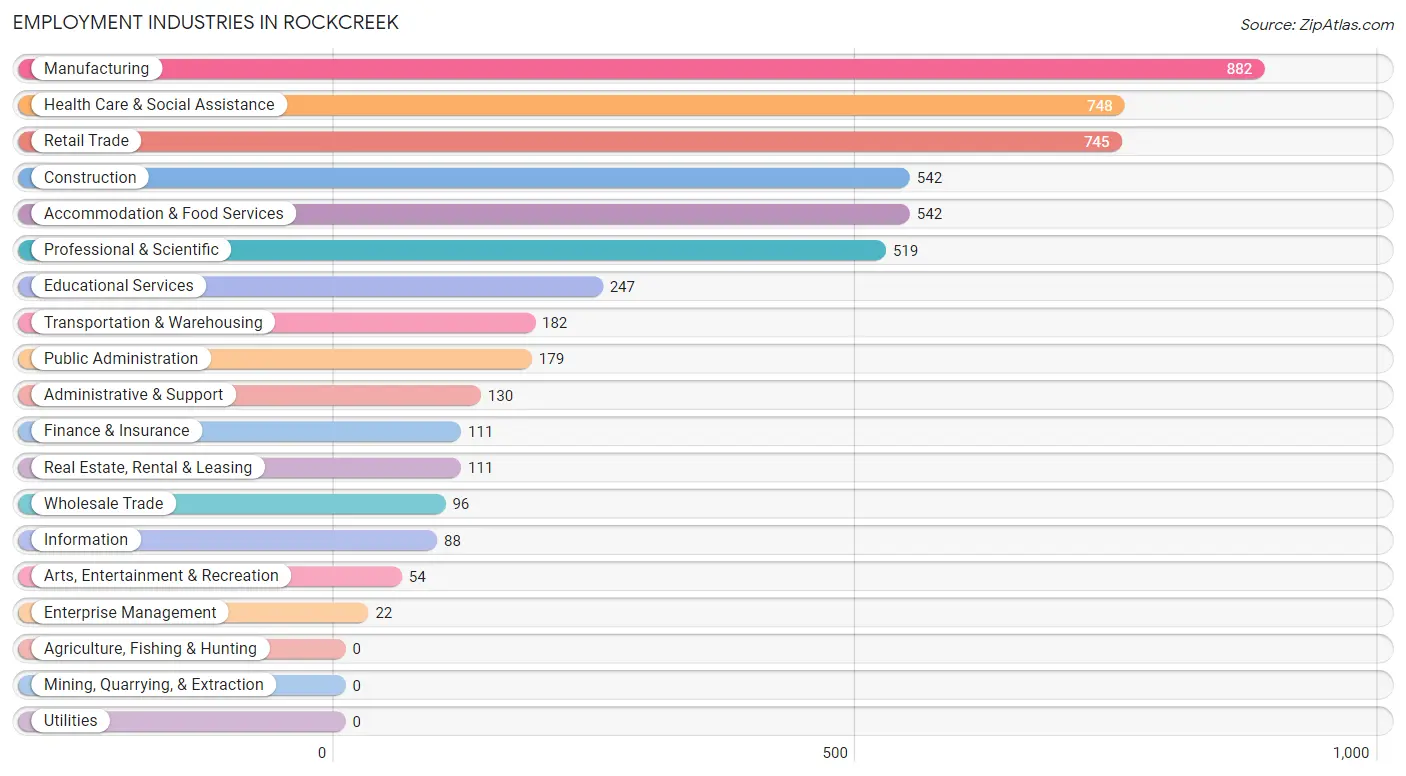
Employment Industries in Rockcreek
The major employment industries in Rockcreek include Manufacturing (882 | 16.0%), Health Care & Social Assistance (748 | 13.6%), Retail Trade (745 | 13.5%), Construction (542 | 9.8%), and Accommodation & Food Services (542 | 9.8%).
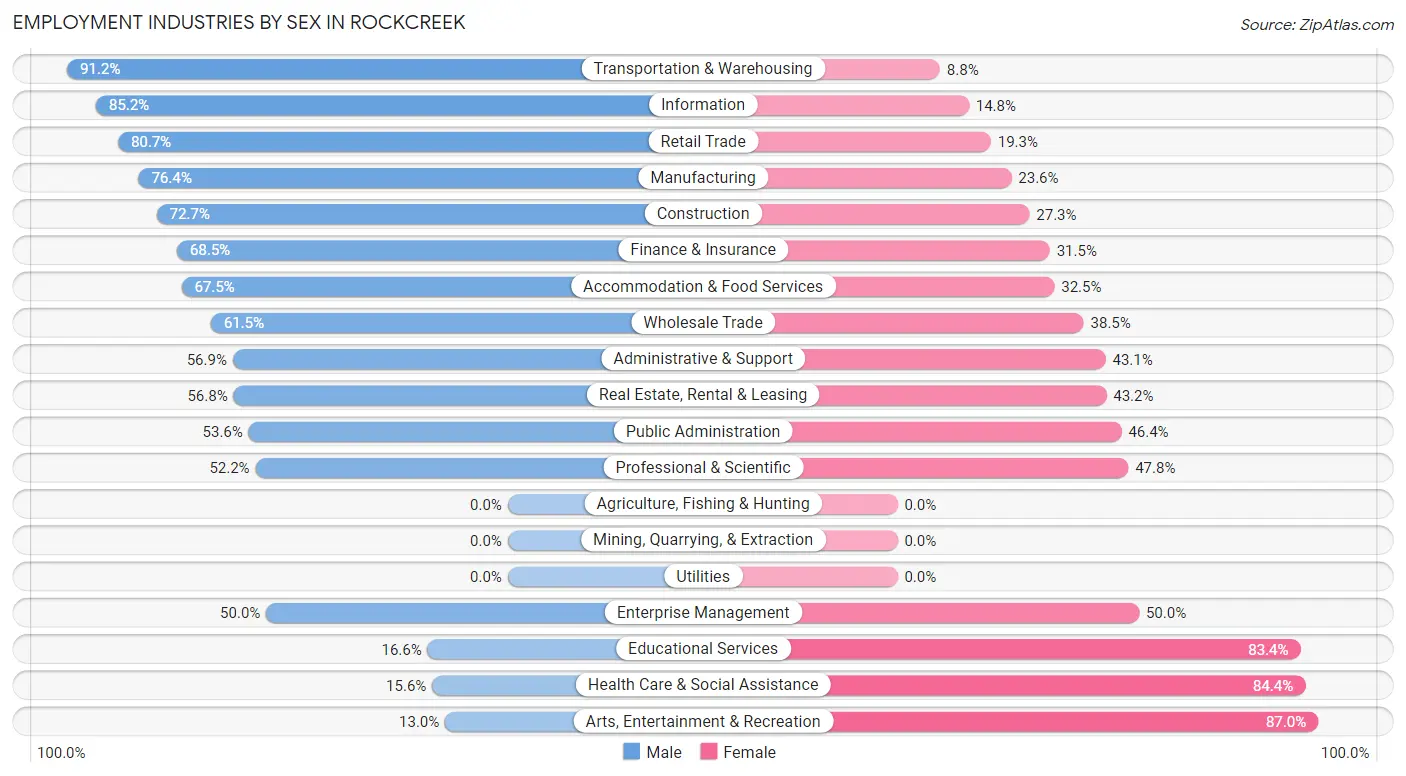
Employment Industries by Sex in Rockcreek
The Rockcreek industries that see more men than women are Transportation & Warehousing (91.2%), Information (85.2%), and Retail Trade (80.7%), whereas the industries that tend to have a higher number of women are Arts, Entertainment & Recreation (87.0%), Health Care & Social Assistance (84.4%), and Educational Services (83.4%).
| Industry | Male | Female |
| Agriculture, Fishing & Hunting | 0 (0.0%) | 0 (0.0%) |
| Mining, Quarrying, & Extraction | 0 (0.0%) | 0 (0.0%) |
| Construction | 394 (72.7%) | 148 (27.3%) |
| Manufacturing | 674 (76.4%) | 208 (23.6%) |
| Wholesale Trade | 59 (61.5%) | 37 (38.5%) |
| Retail Trade | 601 (80.7%) | 144 (19.3%) |
| Transportation & Warehousing | 166 (91.2%) | 16 (8.8%) |
| Utilities | 0 (0.0%) | 0 (0.0%) |
| Information | 75 (85.2%) | 13 (14.8%) |
| Finance & Insurance | 76 (68.5%) | 35 (31.5%) |
| Real Estate, Rental & Leasing | 63 (56.8%) | 48 (43.2%) |
| Professional & Scientific | 271 (52.2%) | 248 (47.8%) |
| Enterprise Management | 11 (50.0%) | 11 (50.0%) |
| Administrative & Support | 74 (56.9%) | 56 (43.1%) |
| Educational Services | 41 (16.6%) | 206 (83.4%) |
| Health Care & Social Assistance | 117 (15.6%) | 631 (84.4%) |
| Arts, Entertainment & Recreation | 7 (13.0%) | 47 (87.0%) |
| Accommodation & Food Services | 366 (67.5%) | 176 (32.5%) |
| Public Administration | 96 (53.6%) | 83 (46.4%) |
| Total | 3,170 (57.5%) | 2,341 (42.5%) |
Education in Rockcreek
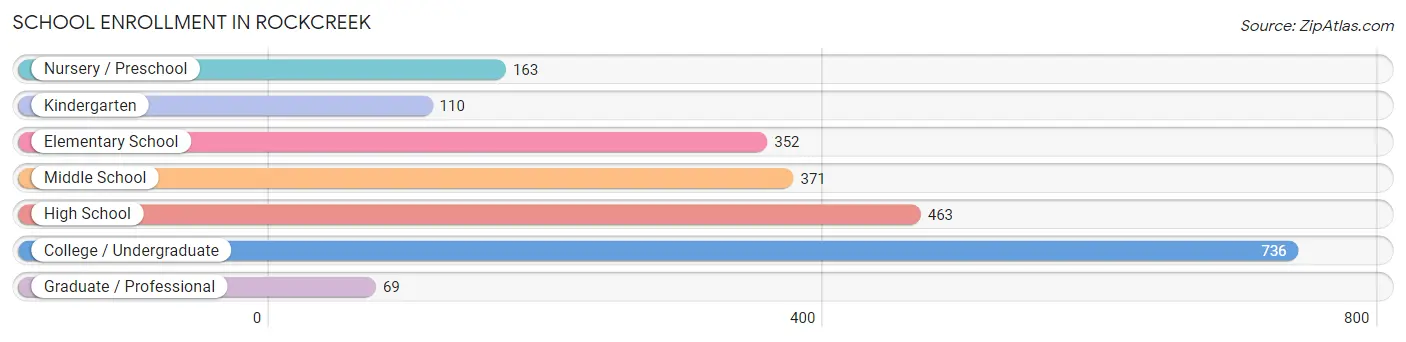
School Enrollment in Rockcreek
The most common levels of schooling among the 2,264 students in Rockcreek are college / undergraduate (736 | 32.5%), high school (463 | 20.4%), and middle school (371 | 16.4%).
| School Level | # Students | % Students |
| Nursery / Preschool | 163 | 7.2% |
| Kindergarten | 110 | 4.9% |
| Elementary School | 352 | 15.5% |
| Middle School | 371 | 16.4% |
| High School | 463 | 20.4% |
| College / Undergraduate | 736 | 32.5% |
| Graduate / Professional | 69 | 3.0% |
| Total | 2,264 | 100.0% |
School Enrollment by Age by Funding Source in Rockcreek
Out of a total of 2,264 students who are enrolled in schools in Rockcreek, 317 (14.0%) attend a private institution, while the remaining 1,947 (86.0%) are enrolled in public schools. The age group of 3 to 4 year olds has the highest likelihood of being enrolled in private schools, with 65 (73.9% in the age bracket) enrolled. Conversely, the age group of 35 years and over has the lowest likelihood of being enrolled in a private school, with 86 (100.0% in the age bracket) attending a public institution.
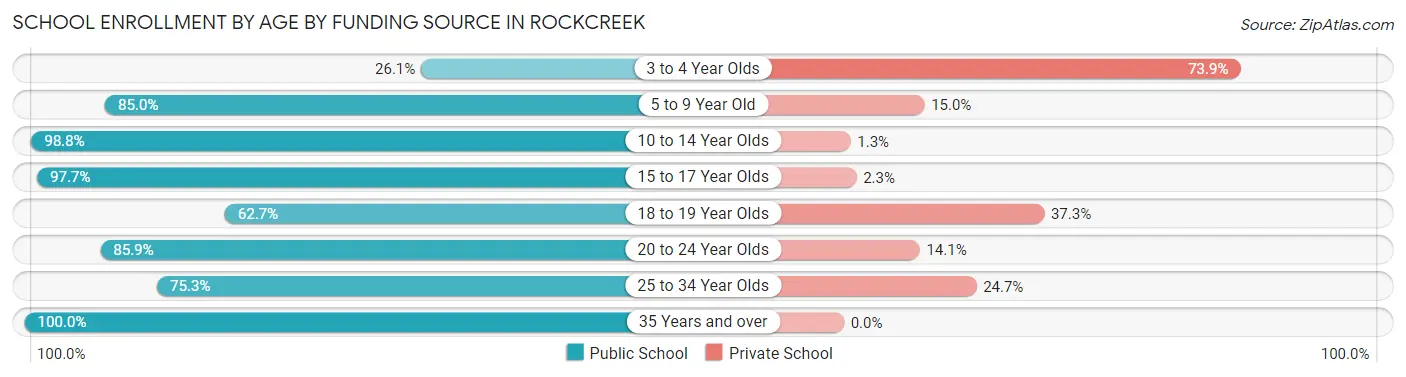
| Age Bracket | Public School | Private School |
| 3 to 4 Year Olds | 23 (26.1%) | 65 (73.9%) |
| 5 to 9 Year Old | 391 (85.0%) | 69 (15.0%) |
| 10 to 14 Year Olds | 473 (98.8%) | 6 (1.3%) |
| 15 to 17 Year Olds | 334 (97.7%) | 8 (2.3%) |
| 18 to 19 Year Olds | 126 (62.7%) | 75 (37.3%) |
| 20 to 24 Year Olds | 456 (85.9%) | 75 (14.1%) |
| 25 to 34 Year Olds | 58 (75.3%) | 19 (24.7%) |
| 35 Years and over | 86 (100.0%) | 0 (0.0%) |
| Total | 1,947 (86.0%) | 317 (14.0%) |
Educational Attainment by Field of Study in Rockcreek
Business (636 | 18.2%), engineering (470 | 13.4%), science & technology (357 | 10.2%), education (357 | 10.2%), and social sciences (291 | 8.3%) are the most common fields of study among 3,502 individuals in Rockcreek who have obtained a bachelor's degree or higher.
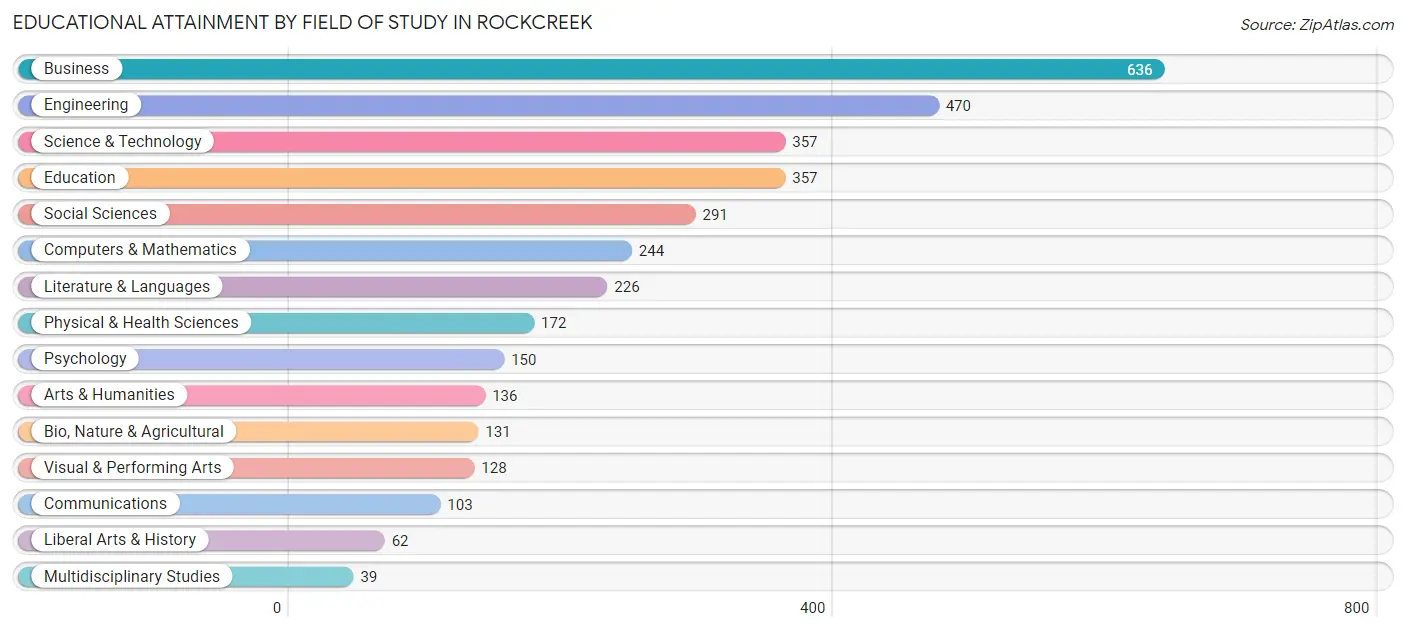
| Field of Study | # Graduates | % Graduates |
| Computers & Mathematics | 244 | 7.0% |
| Bio, Nature & Agricultural | 131 | 3.7% |
| Physical & Health Sciences | 172 | 4.9% |
| Psychology | 150 | 4.3% |
| Social Sciences | 291 | 8.3% |
| Engineering | 470 | 13.4% |
| Multidisciplinary Studies | 39 | 1.1% |
| Science & Technology | 357 | 10.2% |
| Business | 636 | 18.2% |
| Education | 357 | 10.2% |
| Literature & Languages | 226 | 6.5% |
| Liberal Arts & History | 62 | 1.8% |
| Visual & Performing Arts | 128 | 3.7% |
| Communications | 103 | 2.9% |
| Arts & Humanities | 136 | 3.9% |
| Total | 3,502 | 100.0% |
Transportation & Commute in Rockcreek
Vehicle Availability by Sex in Rockcreek
The most prevalent vehicle ownership categories in Rockcreek are males with 2 vehicles (1,237, accounting for 39.1%) and females with 2 vehicles (1,144, making up 54.6%).
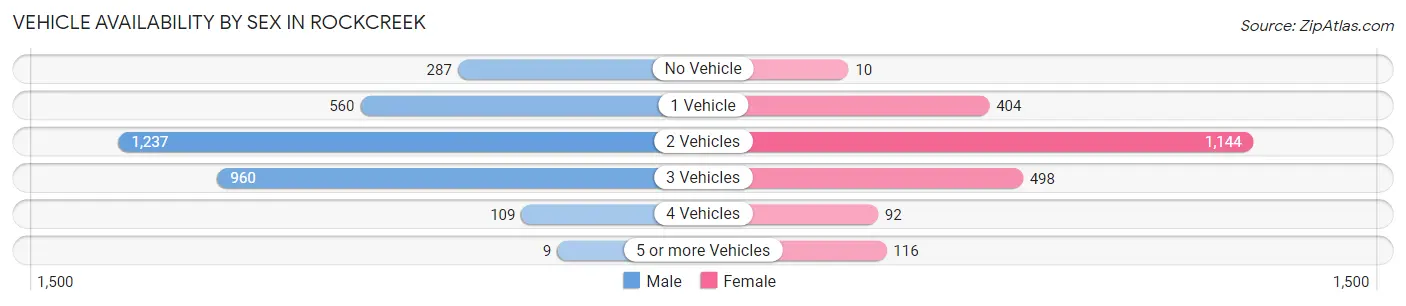
| Vehicles Available | Male | Female |
| No Vehicle | 287 (9.1%) | 10 (0.4%) |
| 1 Vehicle | 560 (17.7%) | 404 (17.8%) |
| 2 Vehicles | 1,237 (39.1%) | 1,144 (50.5%) |
| 3 Vehicles | 960 (30.4%) | 498 (22.0%) |
| 4 Vehicles | 109 (3.5%) | 92 (4.1%) |
| 5 or more Vehicles | 9 (0.3%) | 116 (5.1%) |
| Total | 3,162 (100.0%) | 2,264 (100.0%) |
Commute Time in Rockcreek
The most frequently occuring commute durations in Rockcreek are 15 to 19 minutes (1,024 commuters, 23.0%), 10 to 14 minutes (964 commuters, 21.7%), and 30 to 34 minutes (592 commuters, 13.3%).
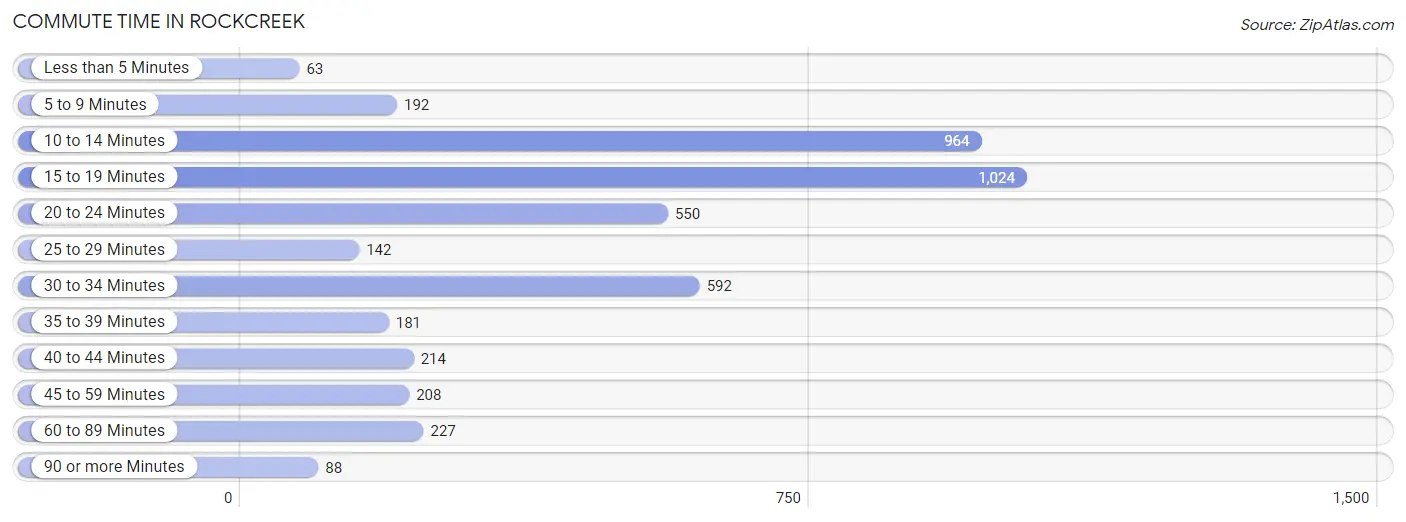
| Commute Time | # Commuters | % Commuters |
| Less than 5 Minutes | 63 | 1.4% |
| 5 to 9 Minutes | 192 | 4.3% |
| 10 to 14 Minutes | 964 | 21.7% |
| 15 to 19 Minutes | 1,024 | 23.0% |
| 20 to 24 Minutes | 550 | 12.4% |
| 25 to 29 Minutes | 142 | 3.2% |
| 30 to 34 Minutes | 592 | 13.3% |
| 35 to 39 Minutes | 181 | 4.1% |
| 40 to 44 Minutes | 214 | 4.8% |
| 45 to 59 Minutes | 208 | 4.7% |
| 60 to 89 Minutes | 227 | 5.1% |
| 90 or more Minutes | 88 | 2.0% |
Commute Time by Sex in Rockcreek
The most common commute times in Rockcreek are 10 to 14 minutes (611 commuters, 23.5%) for males and 15 to 19 minutes (619 commuters, 33.6%) for females.
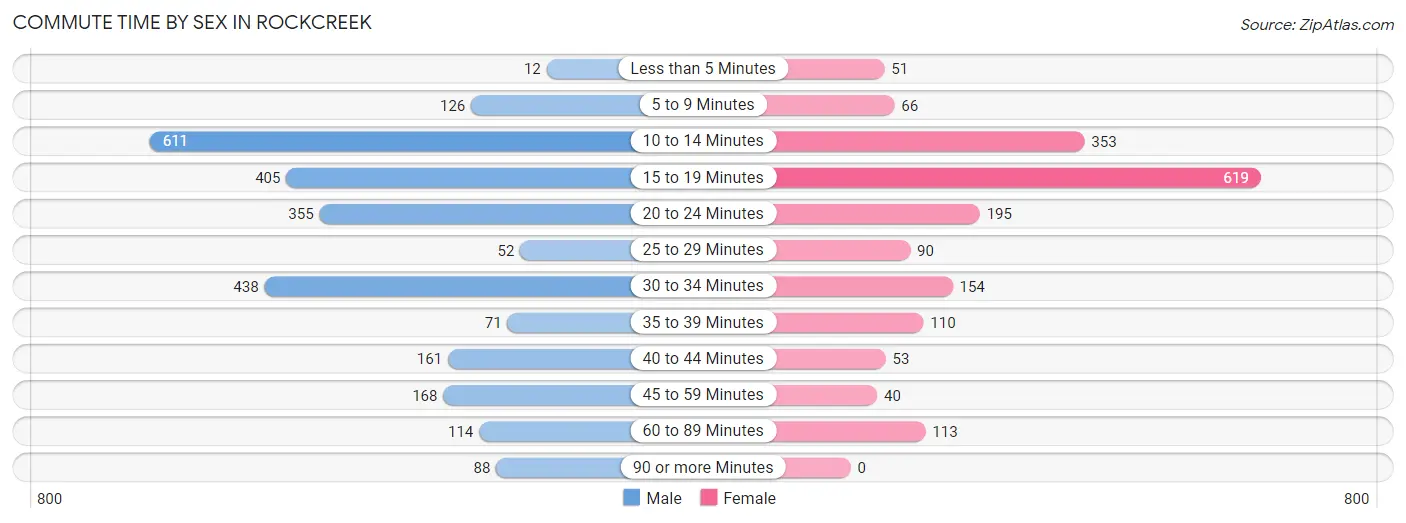
| Commute Time | Male | Female |
| Less than 5 Minutes | 12 (0.5%) | 51 (2.8%) |
| 5 to 9 Minutes | 126 (4.8%) | 66 (3.6%) |
| 10 to 14 Minutes | 611 (23.5%) | 353 (19.1%) |
| 15 to 19 Minutes | 405 (15.6%) | 619 (33.6%) |
| 20 to 24 Minutes | 355 (13.7%) | 195 (10.6%) |
| 25 to 29 Minutes | 52 (2.0%) | 90 (4.9%) |
| 30 to 34 Minutes | 438 (16.8%) | 154 (8.4%) |
| 35 to 39 Minutes | 71 (2.7%) | 110 (6.0%) |
| 40 to 44 Minutes | 161 (6.2%) | 53 (2.9%) |
| 45 to 59 Minutes | 168 (6.5%) | 40 (2.2%) |
| 60 to 89 Minutes | 114 (4.4%) | 113 (6.1%) |
| 90 or more Minutes | 88 (3.4%) | 0 (0.0%) |
Time of Departure to Work by Sex in Rockcreek
The most frequent times of departure to work in Rockcreek are 7:00 AM to 7:29 AM (585, 22.5%) for males and 9:00 AM to 9:59 AM (309, 16.8%) for females.
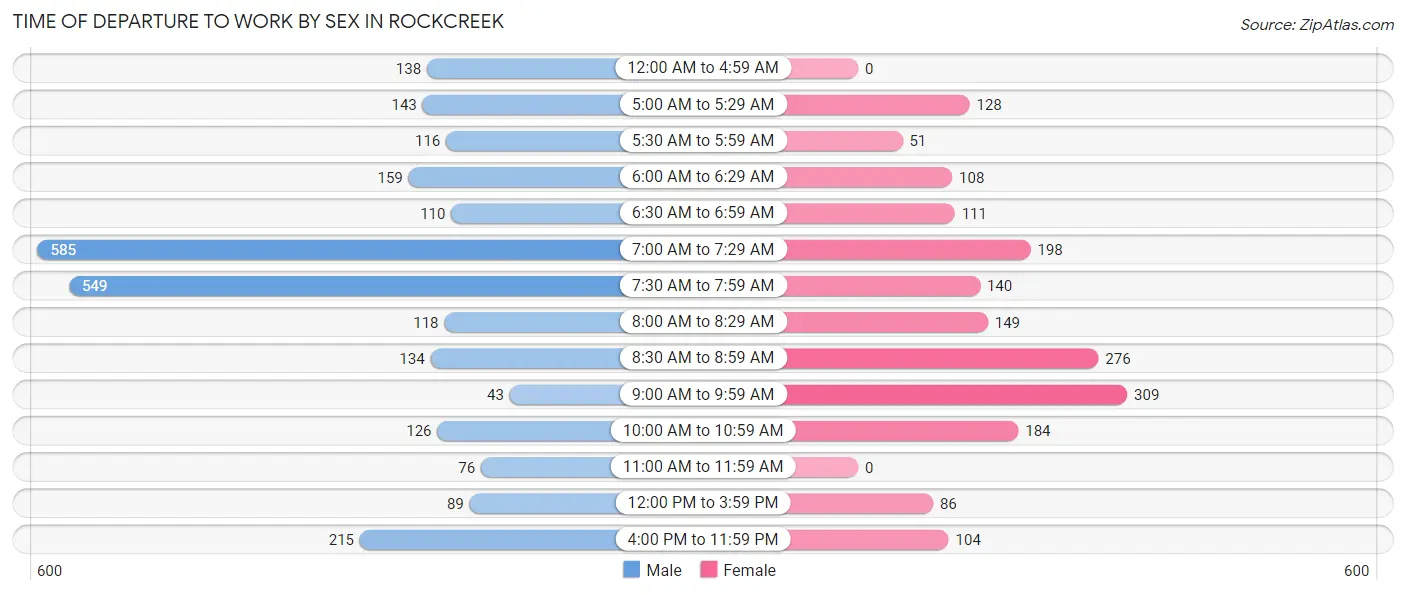
| Time of Departure | Male | Female |
| 12:00 AM to 4:59 AM | 138 (5.3%) | 0 (0.0%) |
| 5:00 AM to 5:29 AM | 143 (5.5%) | 128 (6.9%) |
| 5:30 AM to 5:59 AM | 116 (4.5%) | 51 (2.8%) |
| 6:00 AM to 6:29 AM | 159 (6.1%) | 108 (5.9%) |
| 6:30 AM to 6:59 AM | 110 (4.2%) | 111 (6.0%) |
| 7:00 AM to 7:29 AM | 585 (22.5%) | 198 (10.7%) |
| 7:30 AM to 7:59 AM | 549 (21.1%) | 140 (7.6%) |
| 8:00 AM to 8:29 AM | 118 (4.5%) | 149 (8.1%) |
| 8:30 AM to 8:59 AM | 134 (5.1%) | 276 (15.0%) |
| 9:00 AM to 9:59 AM | 43 (1.7%) | 309 (16.8%) |
| 10:00 AM to 10:59 AM | 126 (4.8%) | 184 (10.0%) |
| 11:00 AM to 11:59 AM | 76 (2.9%) | 0 (0.0%) |
| 12:00 PM to 3:59 PM | 89 (3.4%) | 86 (4.7%) |
| 4:00 PM to 11:59 PM | 215 (8.3%) | 104 (5.6%) |
| Total | 2,601 (100.0%) | 1,844 (100.0%) |
Housing Occupancy in Rockcreek
Occupancy by Ownership in Rockcreek
Of the total 3,801 dwellings in Rockcreek, owner-occupied units account for 2,393 (63.0%), while renter-occupied units make up 1,408 (37.0%).
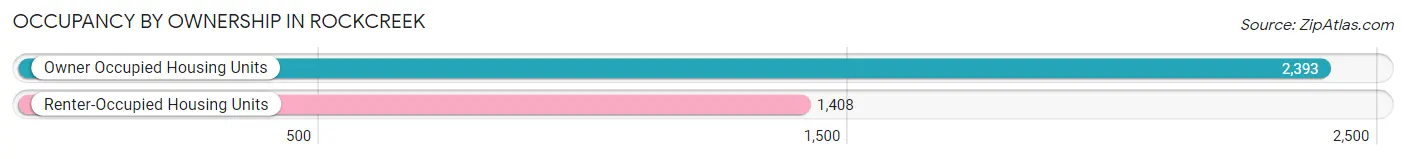
| Occupancy | # Housing Units | % Housing Units |
| Owner Occupied Housing Units | 2,393 | 63.0% |
| Renter-Occupied Housing Units | 1,408 | 37.0% |
| Total Occupied Housing Units | 3,801 | 100.0% |
Occupancy by Household Size in Rockcreek
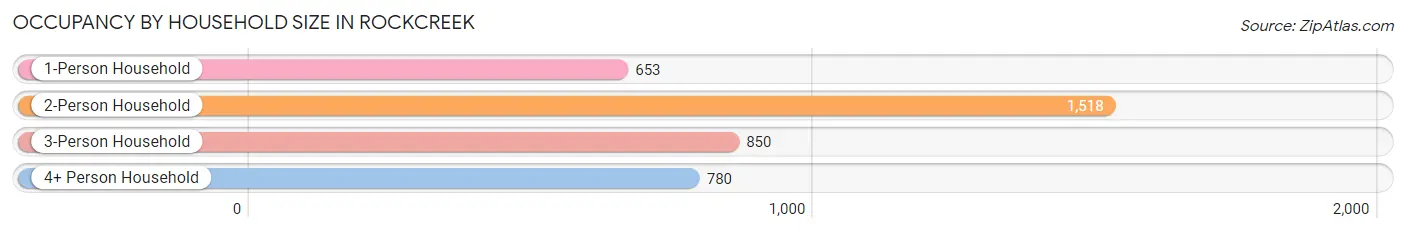
| Household Size | # Housing Units | % Housing Units |
| 1-Person Household | 653 | 17.2% |
| 2-Person Household | 1,518 | 39.9% |
| 3-Person Household | 850 | 22.4% |
| 4+ Person Household | 780 | 20.5% |
| Total Housing Units | 3,801 | 100.0% |
Occupancy by Ownership by Household Size in Rockcreek
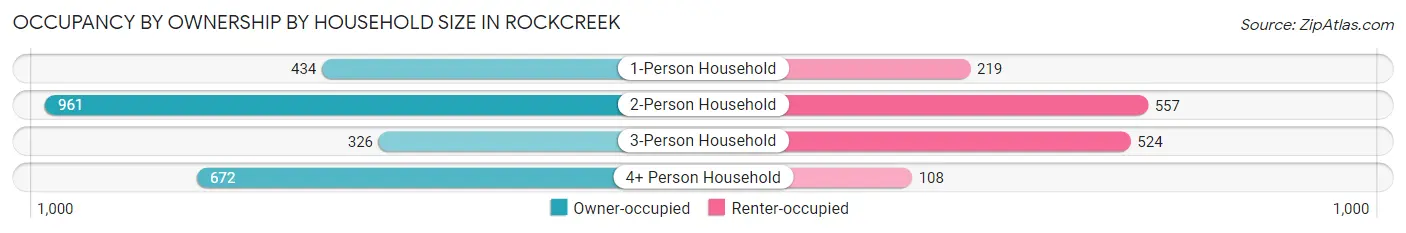
| Household Size | Owner-occupied | Renter-occupied |
| 1-Person Household | 434 (66.5%) | 219 (33.5%) |
| 2-Person Household | 961 (63.3%) | 557 (36.7%) |
| 3-Person Household | 326 (38.4%) | 524 (61.7%) |
| 4+ Person Household | 672 (86.2%) | 108 (13.9%) |
| Total Housing Units | 2,393 (63.0%) | 1,408 (37.0%) |
Occupancy by Educational Attainment in Rockcreek
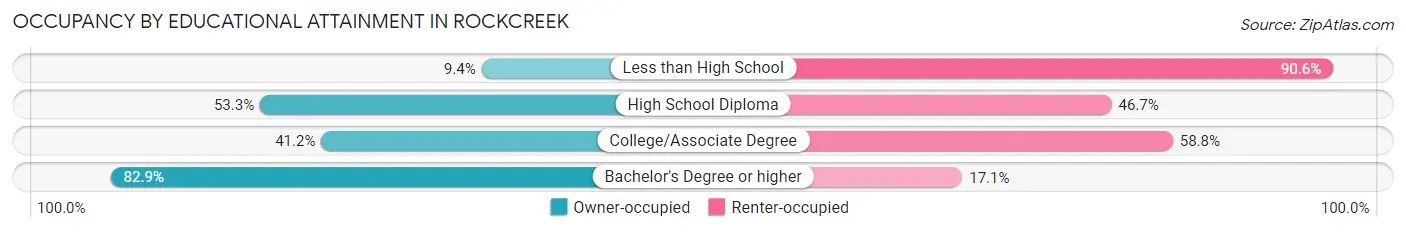
| Household Size | Owner-occupied | Renter-occupied |
| Less than High School | 8 (9.4%) | 77 (90.6%) |
| High School Diploma | 240 (53.3%) | 210 (46.7%) |
| College/Associate Degree | 556 (41.2%) | 794 (58.8%) |
| Bachelor's Degree or higher | 1,589 (82.9%) | 327 (17.1%) |
Occupancy by Age of Householder in Rockcreek
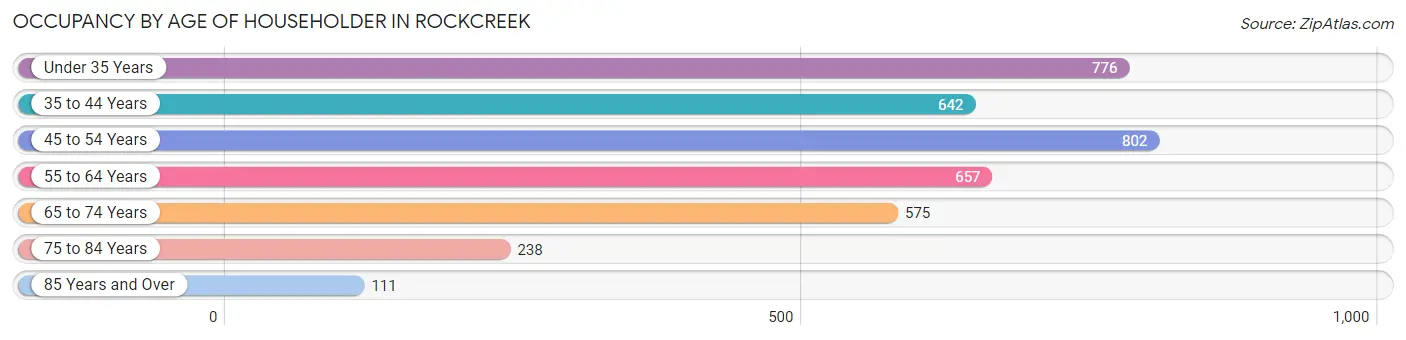
| Age Bracket | # Households | % Households |
| Under 35 Years | 776 | 20.4% |
| 35 to 44 Years | 642 | 16.9% |
| 45 to 54 Years | 802 | 21.1% |
| 55 to 64 Years | 657 | 17.3% |
| 65 to 74 Years | 575 | 15.1% |
| 75 to 84 Years | 238 | 6.3% |
| 85 Years and Over | 111 | 2.9% |
| Total | 3,801 | 100.0% |
Housing Finances in Rockcreek
Median Income by Occupancy in Rockcreek
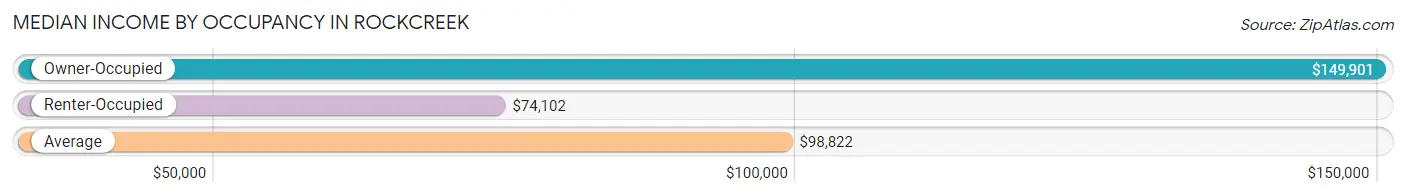
| Occupancy Type | # Households | Median Income |
| Owner-Occupied | 2,393 (63.0%) | $149,901 |
| Renter-Occupied | 1,408 (37.0%) | $74,102 |
| Average | 3,801 (100.0%) | $98,822 |
Occupancy by Householder Income Bracket in Rockcreek
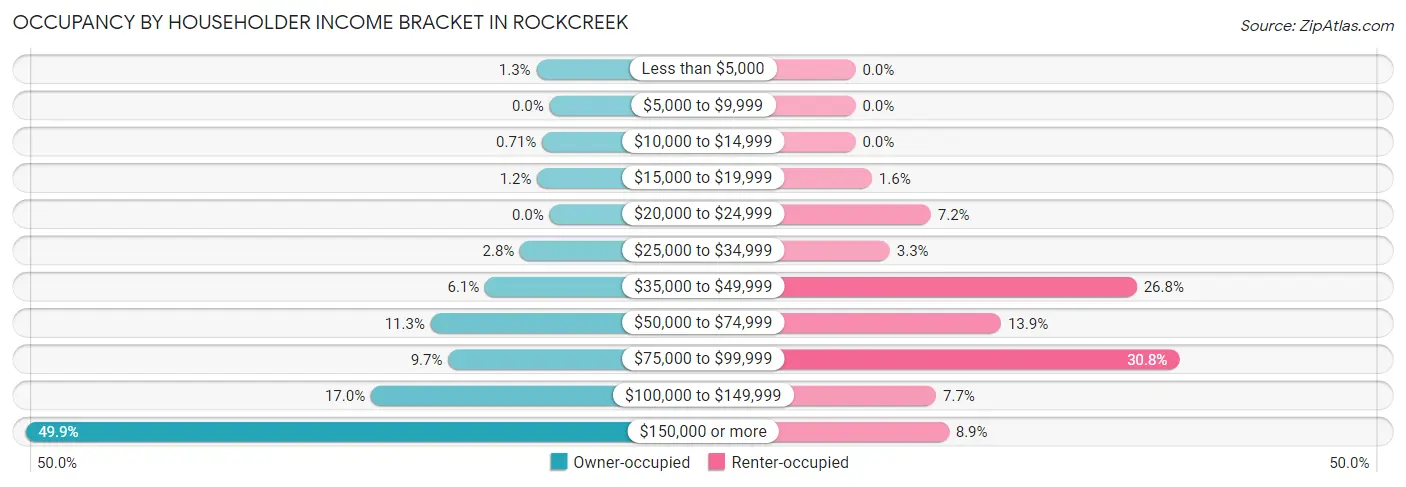
| Income Bracket | Owner-occupied | Renter-occupied |
| Less than $5,000 | 30 (1.3%) | 0 (0.0%) |
| $5,000 to $9,999 | 0 (0.0%) | 0 (0.0%) |
| $10,000 to $14,999 | 17 (0.7%) | 0 (0.0%) |
| $15,000 to $19,999 | 28 (1.2%) | 22 (1.6%) |
| $20,000 to $24,999 | 0 (0.0%) | 101 (7.2%) |
| $25,000 to $34,999 | 67 (2.8%) | 46 (3.3%) |
| $35,000 to $49,999 | 147 (6.1%) | 377 (26.8%) |
| $50,000 to $74,999 | 271 (11.3%) | 195 (13.9%) |
| $75,000 to $99,999 | 231 (9.7%) | 434 (30.8%) |
| $100,000 to $149,999 | 407 (17.0%) | 108 (7.7%) |
| $150,000 or more | 1,195 (49.9%) | 125 (8.9%) |
| Total | 2,393 (100.0%) | 1,408 (100.0%) |
Monthly Housing Cost Tiers in Rockcreek
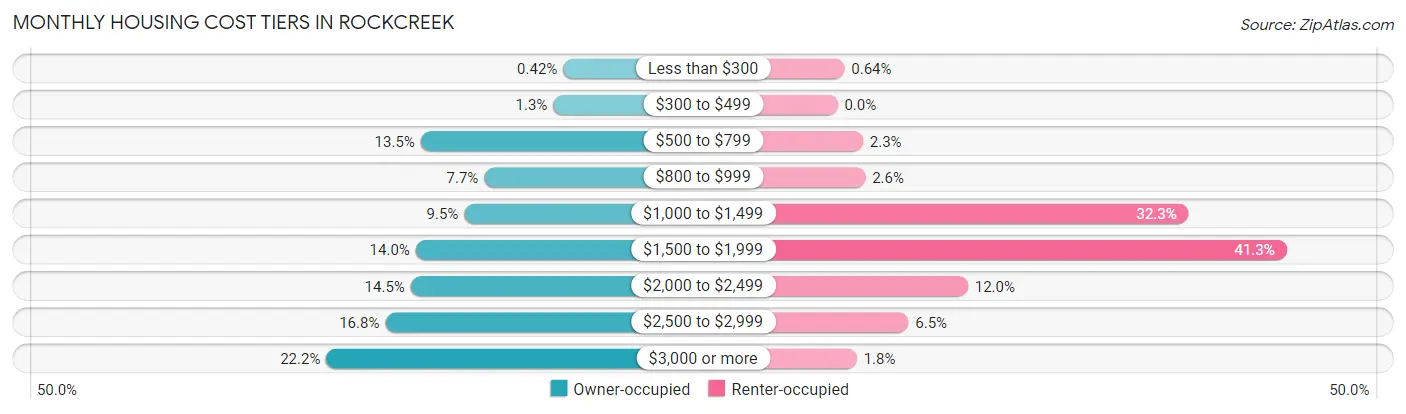
| Monthly Cost | Owner-occupied | Renter-occupied |
| Less than $300 | 10 (0.4%) | 9 (0.6%) |
| $300 to $499 | 32 (1.3%) | 0 (0.0%) |
| $500 to $799 | 324 (13.5%) | 33 (2.3%) |
| $800 to $999 | 184 (7.7%) | 36 (2.6%) |
| $1,000 to $1,499 | 228 (9.5%) | 455 (32.3%) |
| $1,500 to $1,999 | 335 (14.0%) | 582 (41.3%) |
| $2,000 to $2,499 | 346 (14.5%) | 169 (12.0%) |
| $2,500 to $2,999 | 402 (16.8%) | 92 (6.5%) |
| $3,000 or more | 532 (22.2%) | 25 (1.8%) |
| Total | 2,393 (100.0%) | 1,408 (100.0%) |
Physical Housing Characteristics in Rockcreek
Housing Structures in Rockcreek
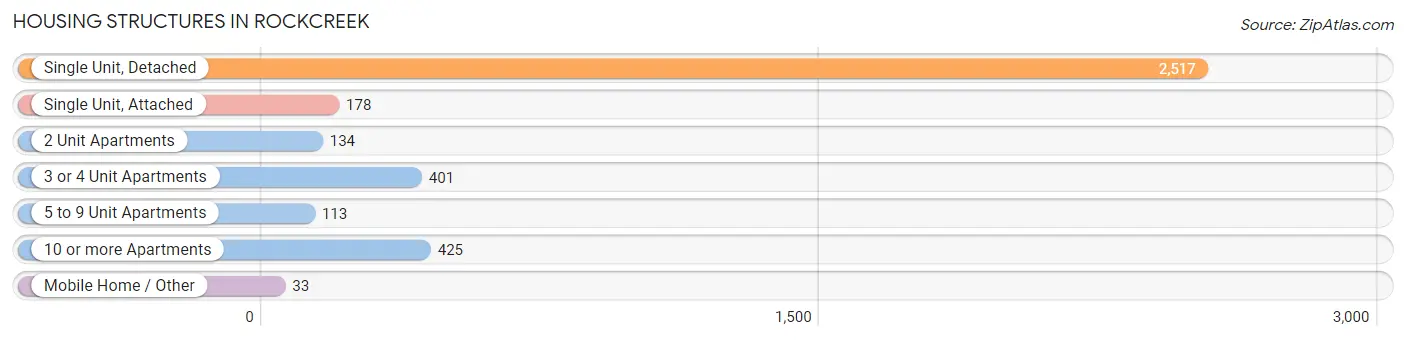
| Structure Type | # Housing Units | % Housing Units |
| Single Unit, Detached | 2,517 | 66.2% |
| Single Unit, Attached | 178 | 4.7% |
| 2 Unit Apartments | 134 | 3.5% |
| 3 or 4 Unit Apartments | 401 | 10.5% |
| 5 to 9 Unit Apartments | 113 | 3.0% |
| 10 or more Apartments | 425 | 11.2% |
| Mobile Home / Other | 33 | 0.9% |
| Total | 3,801 | 100.0% |
Housing Structures by Occupancy in Rockcreek
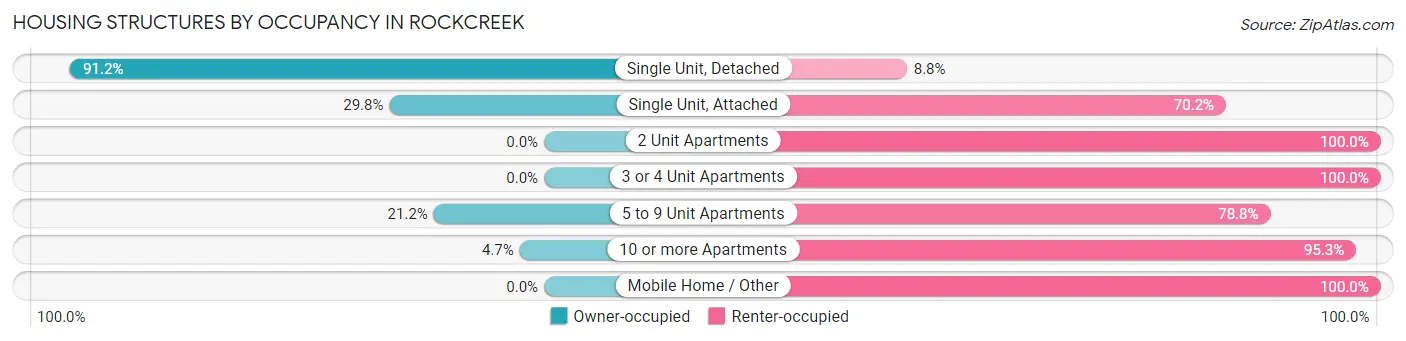
| Structure Type | Owner-occupied | Renter-occupied |
| Single Unit, Detached | 2,296 (91.2%) | 221 (8.8%) |
| Single Unit, Attached | 53 (29.8%) | 125 (70.2%) |
| 2 Unit Apartments | 0 (0.0%) | 134 (100.0%) |
| 3 or 4 Unit Apartments | 0 (0.0%) | 401 (100.0%) |
| 5 to 9 Unit Apartments | 24 (21.2%) | 89 (78.8%) |
| 10 or more Apartments | 20 (4.7%) | 405 (95.3%) |
| Mobile Home / Other | 0 (0.0%) | 33 (100.0%) |
| Total | 2,393 (63.0%) | 1,408 (37.0%) |
Housing Structures by Number of Rooms in Rockcreek
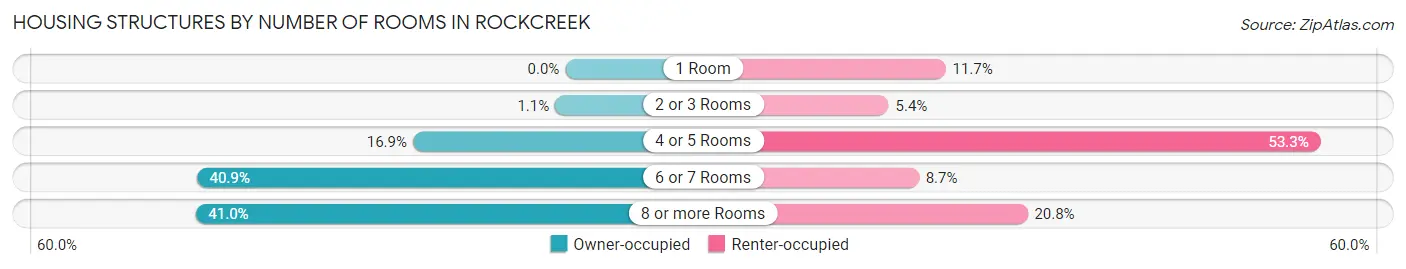
| Number of Rooms | Owner-occupied | Renter-occupied |
| 1 Room | 0 (0.0%) | 165 (11.7%) |
| 2 or 3 Rooms | 27 (1.1%) | 76 (5.4%) |
| 4 or 5 Rooms | 405 (16.9%) | 751 (53.3%) |
| 6 or 7 Rooms | 979 (40.9%) | 123 (8.7%) |
| 8 or more Rooms | 982 (41.0%) | 293 (20.8%) |
| Total | 2,393 (100.0%) | 1,408 (100.0%) |
Housing Structure by Heating Type in Rockcreek
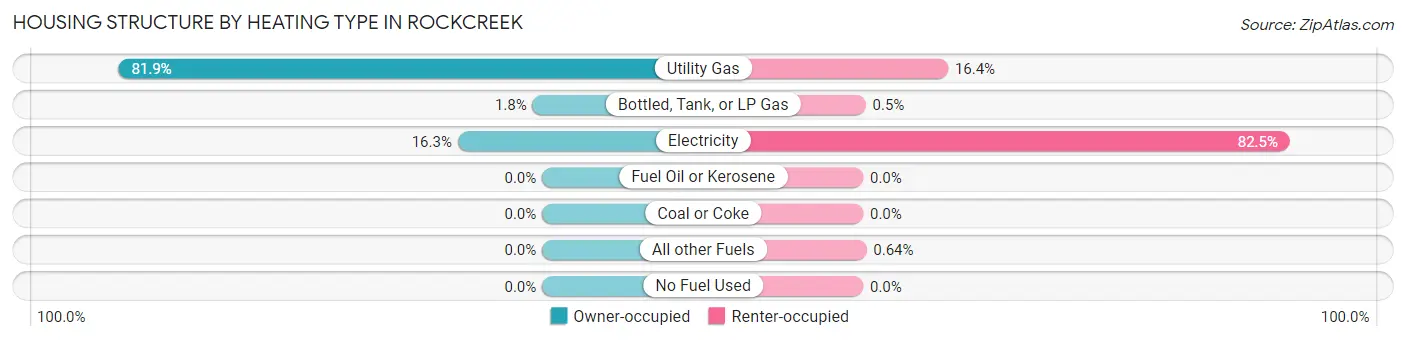
| Heating Type | Owner-occupied | Renter-occupied |
| Utility Gas | 1,959 (81.9%) | 231 (16.4%) |
| Bottled, Tank, or LP Gas | 44 (1.8%) | 7 (0.5%) |
| Electricity | 390 (16.3%) | 1,161 (82.5%) |
| Fuel Oil or Kerosene | 0 (0.0%) | 0 (0.0%) |
| Coal or Coke | 0 (0.0%) | 0 (0.0%) |
| All other Fuels | 0 (0.0%) | 9 (0.6%) |
| No Fuel Used | 0 (0.0%) | 0 (0.0%) |
| Total | 2,393 (100.0%) | 1,408 (100.0%) |
Household Vehicle Usage in Rockcreek
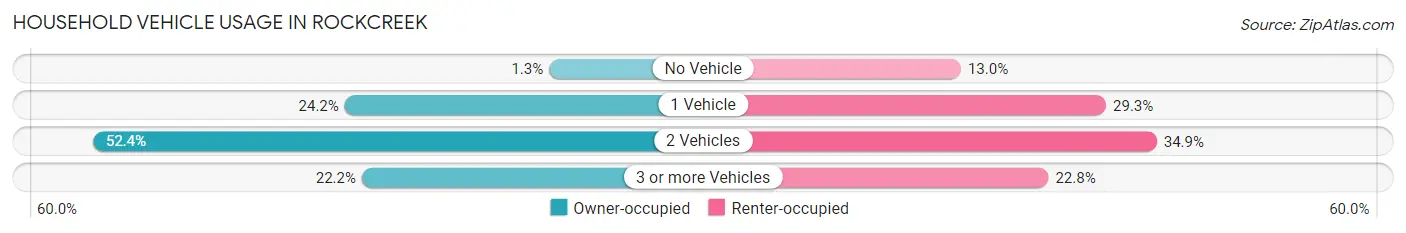
| Vehicles per Household | Owner-occupied | Renter-occupied |
| No Vehicle | 30 (1.3%) | 183 (13.0%) |
| 1 Vehicle | 578 (24.1%) | 412 (29.3%) |
| 2 Vehicles | 1,253 (52.4%) | 492 (34.9%) |
| 3 or more Vehicles | 532 (22.2%) | 321 (22.8%) |
| Total | 2,393 (100.0%) | 1,408 (100.0%) |
Real Estate & Mortgages in Rockcreek
Real Estate and Mortgage Overview in Rockcreek
| Characteristic | Without Mortgage | With Mortgage |
| Housing Units | 637 | 1,756 |
| Median Property Value | $502,000 | $595,300 |
| Median Household Income | $87,917 | $1,001 |
| Monthly Housing Costs | $776 | $532 |
| Real Estate Taxes | $4,998 | $0 |
Property Value by Mortgage Status in Rockcreek
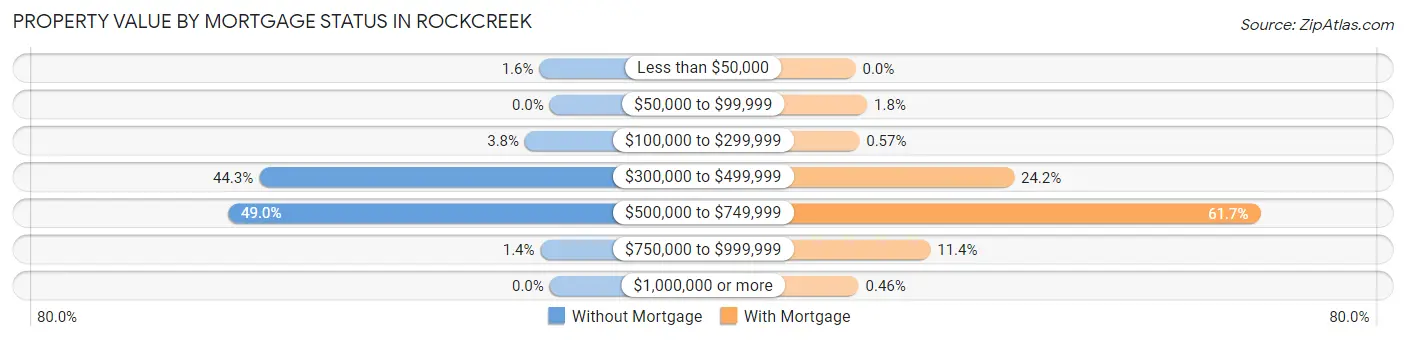
| Property Value | Without Mortgage | With Mortgage |
| Less than $50,000 | 10 (1.6%) | 0 (0.0%) |
| $50,000 to $99,999 | 0 (0.0%) | 31 (1.8%) |
| $100,000 to $299,999 | 24 (3.8%) | 10 (0.6%) |
| $300,000 to $499,999 | 282 (44.3%) | 424 (24.1%) |
| $500,000 to $749,999 | 312 (49.0%) | 1,083 (61.7%) |
| $750,000 to $999,999 | 9 (1.4%) | 200 (11.4%) |
| $1,000,000 or more | 0 (0.0%) | 8 (0.5%) |
| Total | 637 (100.0%) | 1,756 (100.0%) |
Household Income by Mortgage Status in Rockcreek
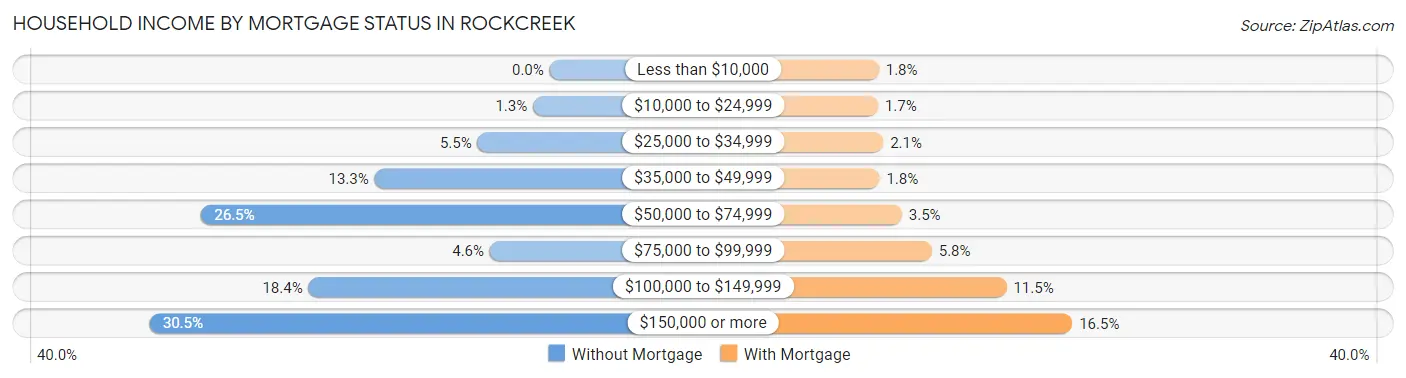
| Household Income | Without Mortgage | With Mortgage |
| Less than $10,000 | 0 (0.0%) | 31 (1.8%) |
| $10,000 to $24,999 | 8 (1.3%) | 30 (1.7%) |
| $25,000 to $34,999 | 35 (5.5%) | 37 (2.1%) |
| $35,000 to $49,999 | 85 (13.3%) | 32 (1.8%) |
| $50,000 to $74,999 | 169 (26.5%) | 62 (3.5%) |
| $75,000 to $99,999 | 29 (4.5%) | 102 (5.8%) |
| $100,000 to $149,999 | 117 (18.4%) | 202 (11.5%) |
| $150,000 or more | 194 (30.5%) | 290 (16.5%) |
| Total | 637 (100.0%) | 1,756 (100.0%) |
Property Value to Household Income Ratio in Rockcreek
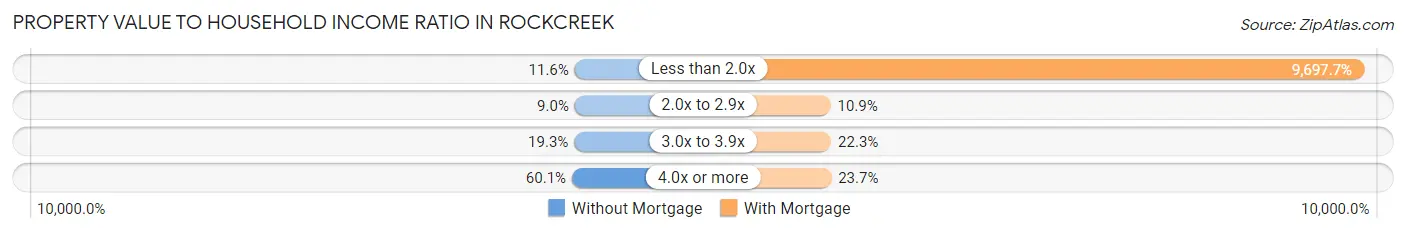
| Value-to-Income Ratio | Without Mortgage | With Mortgage |
| Less than 2.0x | 74 (11.6%) | 170,292 (9,697.7%) |
| 2.0x to 2.9x | 57 (8.9%) | 192 (10.9%) |
| 3.0x to 3.9x | 123 (19.3%) | 391 (22.3%) |
| 4.0x or more | 383 (60.1%) | 416 (23.7%) |
| Total | 637 (100.0%) | 1,756 (100.0%) |
Real Estate Taxes by Mortgage Status in Rockcreek
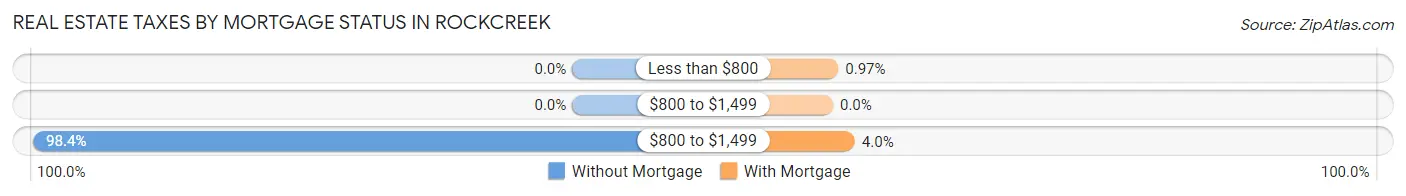
| Property Taxes | Without Mortgage | With Mortgage |
| Less than $800 | 0 (0.0%) | 17 (1.0%) |
| $800 to $1,499 | 0 (0.0%) | 0 (0.0%) |
| $800 to $1,499 | 627 (98.4%) | 70 (4.0%) |
| Total | 637 (100.0%) | 1,756 (100.0%) |
Health & Disability in Rockcreek
Health Insurance Coverage by Age in Rockcreek
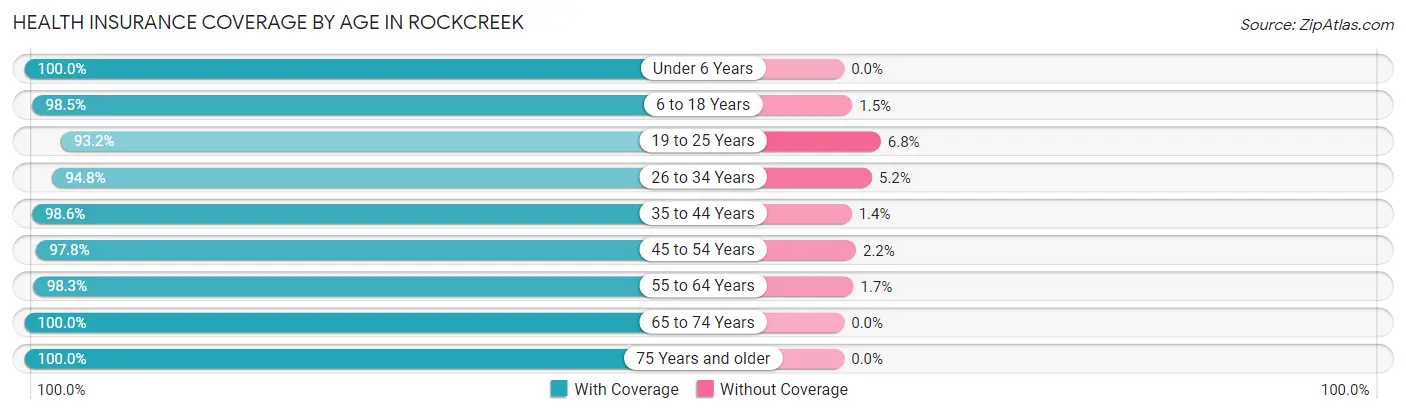
| Age Bracket | With Coverage | Without Coverage |
| Under 6 Years | 587 (100.0%) | 0 (0.0%) |
| 6 to 18 Years | 1,380 (98.5%) | 21 (1.5%) |
| 19 to 25 Years | 1,243 (93.2%) | 91 (6.8%) |
| 26 to 34 Years | 1,118 (94.8%) | 61 (5.2%) |
| 35 to 44 Years | 1,282 (98.6%) | 18 (1.4%) |
| 45 to 54 Years | 1,386 (97.8%) | 31 (2.2%) |
| 55 to 64 Years | 1,088 (98.3%) | 19 (1.7%) |
| 65 to 74 Years | 956 (100.0%) | 0 (0.0%) |
| 75 Years and older | 637 (100.0%) | 0 (0.0%) |
| Total | 9,677 (97.6%) | 241 (2.4%) |
Health Insurance Coverage by Citizenship Status in Rockcreek
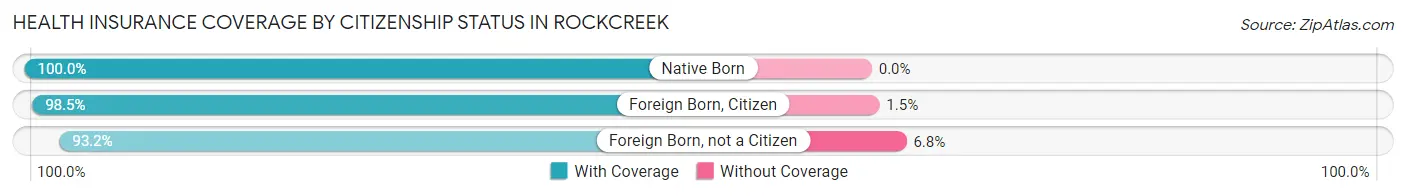
| Citizenship Status | With Coverage | Without Coverage |
| Native Born | 587 (100.0%) | 0 (0.0%) |
| Foreign Born, Citizen | 1,380 (98.5%) | 21 (1.5%) |
| Foreign Born, not a Citizen | 1,243 (93.2%) | 91 (6.8%) |
Health Insurance Coverage by Household Income in Rockcreek
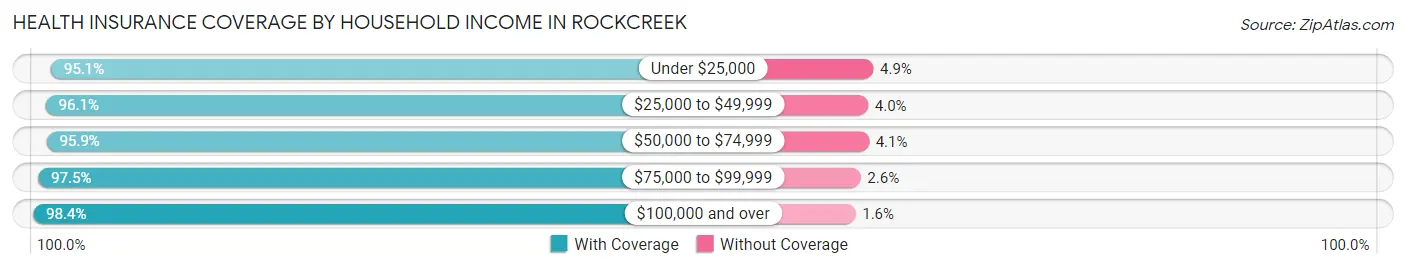
| Household Income | With Coverage | Without Coverage |
| Under $25,000 | 386 (95.1%) | 20 (4.9%) |
| $25,000 to $49,999 | 1,168 (96.1%) | 48 (4.0%) |
| $50,000 to $74,999 | 936 (95.9%) | 40 (4.1%) |
| $75,000 to $99,999 | 1,682 (97.5%) | 44 (2.5%) |
| $100,000 and over | 5,495 (98.4%) | 89 (1.6%) |
Public vs Private Health Insurance Coverage by Age in Rockcreek
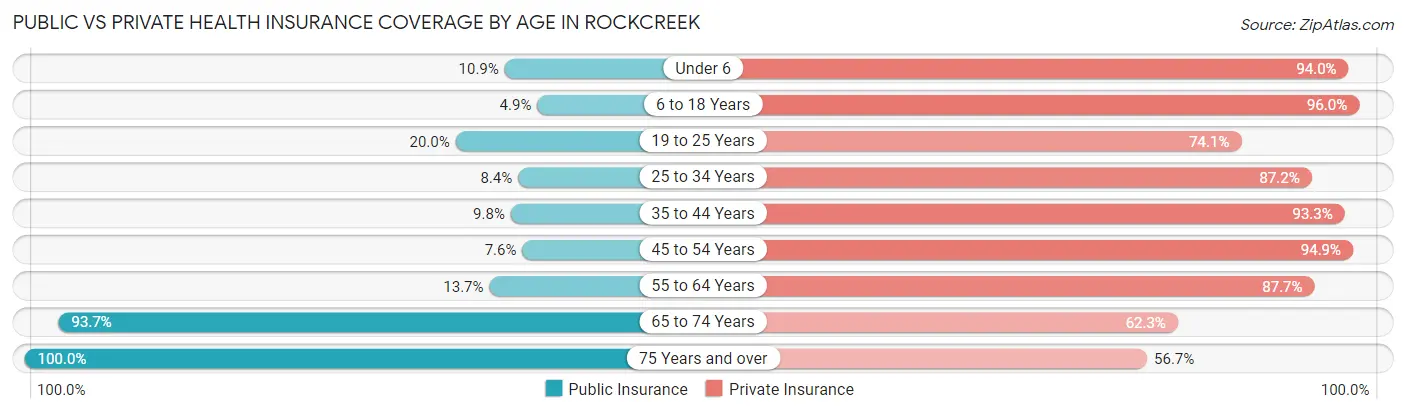
| Age Bracket | Public Insurance | Private Insurance |
| Under 6 | 64 (10.9%) | 552 (94.0%) |
| 6 to 18 Years | 68 (4.9%) | 1,345 (96.0%) |
| 19 to 25 Years | 267 (20.0%) | 989 (74.1%) |
| 25 to 34 Years | 99 (8.4%) | 1,028 (87.2%) |
| 35 to 44 Years | 127 (9.8%) | 1,213 (93.3%) |
| 45 to 54 Years | 108 (7.6%) | 1,344 (94.9%) |
| 55 to 64 Years | 152 (13.7%) | 971 (87.7%) |
| 65 to 74 Years | 896 (93.7%) | 596 (62.3%) |
| 75 Years and over | 637 (100.0%) | 361 (56.7%) |
| Total | 2,418 (24.4%) | 8,399 (84.7%) |
Disability Status by Sex by Age in Rockcreek
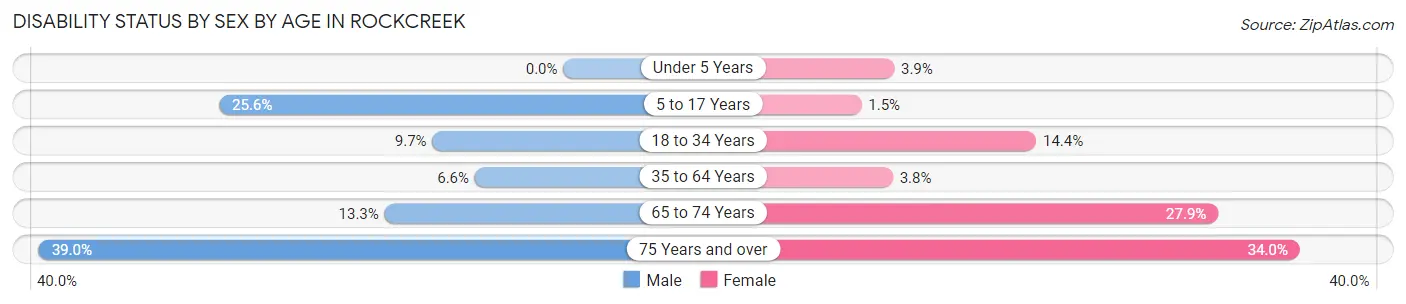
| Age Bracket | Male | Female |
| Under 5 Years | 0 (0.0%) | 8 (3.9%) |
| 5 to 17 Years | 161 (25.6%) | 12 (1.5%) |
| 18 to 34 Years | 154 (9.7%) | 141 (14.4%) |
| 35 to 64 Years | 126 (6.6%) | 72 (3.8%) |
| 65 to 74 Years | 67 (13.3%) | 126 (27.9%) |
| 75 Years and over | 74 (39.0%) | 152 (34.0%) |
Disability Class by Sex by Age in Rockcreek
Disability Class: Hearing Difficulty
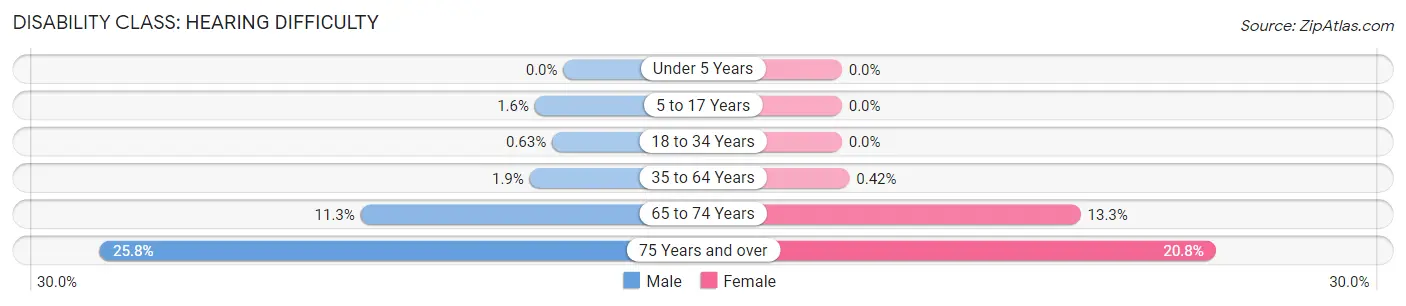
| Age Bracket | Male | Female |
| Under 5 Years | 0 (0.0%) | 0 (0.0%) |
| 5 to 17 Years | 10 (1.6%) | 0 (0.0%) |
| 18 to 34 Years | 10 (0.6%) | 0 (0.0%) |
| 35 to 64 Years | 36 (1.9%) | 8 (0.4%) |
| 65 to 74 Years | 57 (11.3%) | 60 (13.3%) |
| 75 Years and over | 49 (25.8%) | 93 (20.8%) |
Disability Class: Vision Difficulty
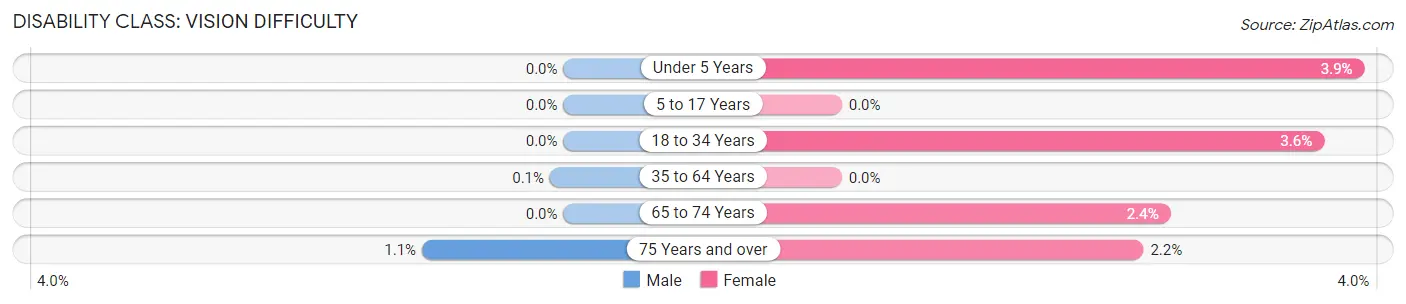
| Age Bracket | Male | Female |
| Under 5 Years | 0 (0.0%) | 8 (3.9%) |
| 5 to 17 Years | 0 (0.0%) | 0 (0.0%) |
| 18 to 34 Years | 0 (0.0%) | 35 (3.6%) |
| 35 to 64 Years | 2 (0.1%) | 0 (0.0%) |
| 65 to 74 Years | 0 (0.0%) | 11 (2.4%) |
| 75 Years and over | 2 (1.1%) | 10 (2.2%) |
Disability Class: Cognitive Difficulty
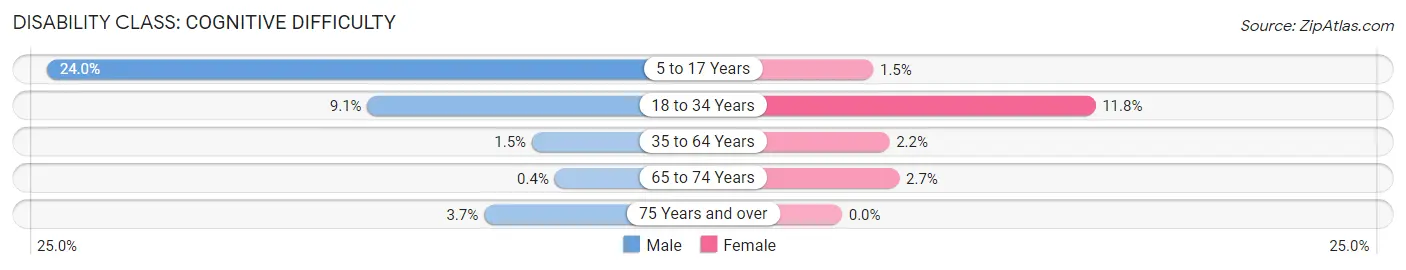
| Age Bracket | Male | Female |
| 5 to 17 Years | 151 (24.0%) | 12 (1.5%) |
| 18 to 34 Years | 144 (9.1%) | 115 (11.8%) |
| 35 to 64 Years | 28 (1.5%) | 42 (2.2%) |
| 65 to 74 Years | 2 (0.4%) | 12 (2.7%) |
| 75 Years and over | 7 (3.7%) | 0 (0.0%) |
Disability Class: Ambulatory Difficulty
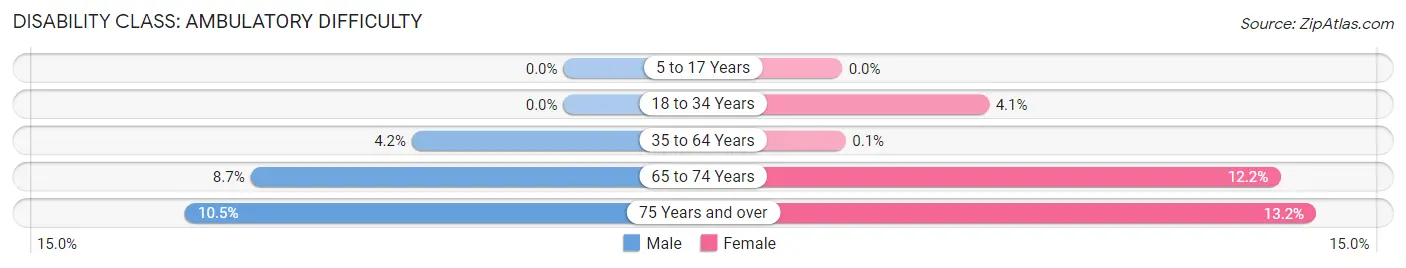
| Age Bracket | Male | Female |
| 5 to 17 Years | 0 (0.0%) | 0 (0.0%) |
| 18 to 34 Years | 0 (0.0%) | 40 (4.1%) |
| 35 to 64 Years | 81 (4.2%) | 2 (0.1%) |
| 65 to 74 Years | 44 (8.7%) | 55 (12.2%) |
| 75 Years and over | 20 (10.5%) | 59 (13.2%) |
Disability Class: Self-Care Difficulty
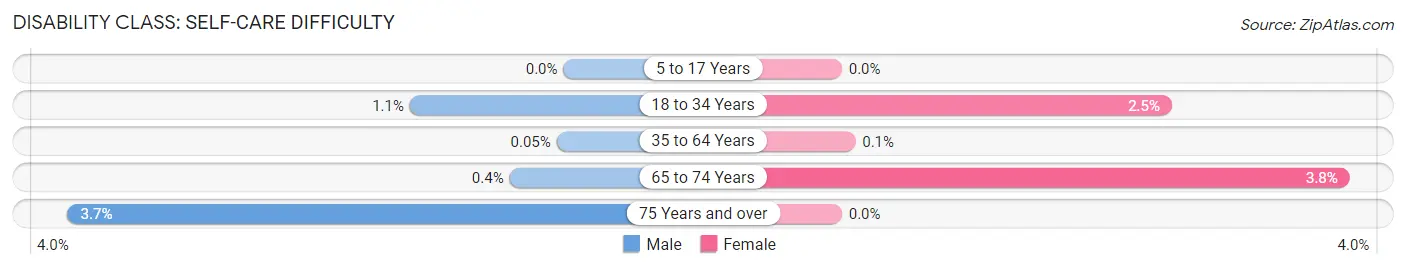
| Age Bracket | Male | Female |
| 5 to 17 Years | 0 (0.0%) | 0 (0.0%) |
| 18 to 34 Years | 18 (1.1%) | 24 (2.5%) |
| 35 to 64 Years | 1 (0.1%) | 2 (0.1%) |
| 65 to 74 Years | 2 (0.4%) | 17 (3.8%) |
| 75 Years and over | 7 (3.7%) | 0 (0.0%) |
Technology Access in Rockcreek
Computing Device Access in Rockcreek
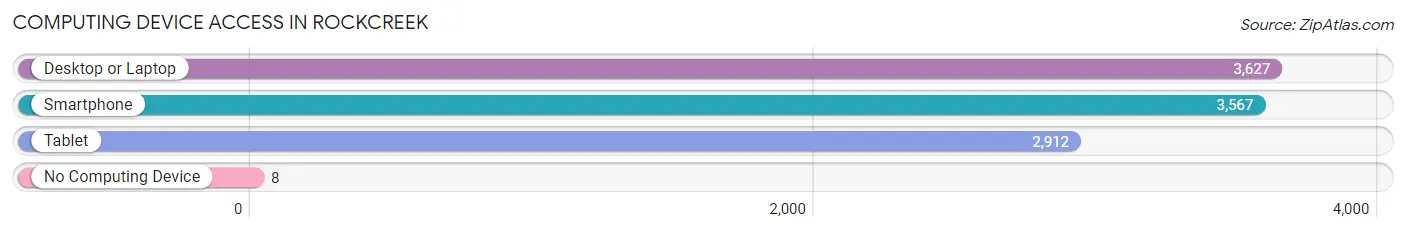
| Device Type | # Households | % Households |
| Desktop or Laptop | 3,627 | 95.4% |
| Smartphone | 3,567 | 93.8% |
| Tablet | 2,912 | 76.6% |
| No Computing Device | 8 | 0.2% |
| Total | 3,801 | 100.0% |
Internet Access in Rockcreek

| Internet Type | # Households | % Households |
| Dial-Up Internet | 0 | 0.0% |
| Broadband Home | 3,455 | 90.9% |
| Cellular Data Only | 137 | 3.6% |
| Satellite Internet | 136 | 3.6% |
| No Internet | 100 | 2.6% |
| Total | 3,801 | 100.0% |
Rockcreek Summary
Rockcreek, Oregon is a small unincorporated community located in the foothills of the Cascade Mountains in Clackamas County, Oregon. The community is situated along the Clackamas River, approximately 25 miles southeast of Portland. The population of Rockcreek was estimated to be 1,845 in 2019.
History
Rockcreek was first settled in the late 1800s by homesteaders who were attracted to the area by its abundant natural resources. The first post office was established in 1887 and the town was officially incorporated in 1891. The town was named after the nearby Rock Creek, which was named for the rocky terrain of the area.
The early settlers of Rockcreek were primarily farmers and loggers, and the town quickly became a hub for the timber industry. The town was also home to several sawmills and a grist mill. In the early 1900s, the town began to grow and develop, with the construction of a school, a church, and a general store.
Geography
Rockcreek is located in the foothills of the Cascade Mountains in Clackamas County, Oregon. The town is situated along the Clackamas River, approximately 25 miles southeast of Portland. The town is surrounded by lush forests and rolling hills, and is home to several small lakes and streams.
The climate in Rockcreek is mild and temperate, with warm summers and cool winters. The average annual temperature is around 50 degrees Fahrenheit, and the average annual precipitation is around 40 inches.
Economy
The economy of Rockcreek is largely based on the timber industry. The town is home to several sawmills and lumber companies, and the surrounding forests provide an abundance of timber for the industry. The town is also home to several small businesses, including restaurants, retail stores, and service providers.
Demographics
As of 2019, the population of Rockcreek was estimated to be 1,845. The population is primarily white (94.3%), with a small percentage of Hispanic (2.2%) and Asian (1.2%) residents. The median household income in Rockcreek is $50,000, and the median home value is $250,000. The town has a low unemployment rate of 3.2%.
Conclusion
Rockcreek, Oregon is a small unincorporated community located in the foothills of the Cascade Mountains in Clackamas County, Oregon. The town is home to a diverse population and is largely supported by the timber industry. The town is surrounded by lush forests and rolling hills, and is home to several small lakes and streams. The economy of Rockcreek is largely based on the timber industry, and the town is home to several small businesses. The population of Rockcreek was estimated to be 1,845 in 2019.
Common Questions
What is Per Capita Income in Rockcreek?
Per Capita income in Rockcreek is $49,916.
What is the Median Family Income in Rockcreek?
Median Family Income in Rockcreek is $115,099.
What is the Median Household income in Rockcreek?
Median Household Income in Rockcreek is $98,822.
What is Income or Wage Gap in Rockcreek?
Income or Wage Gap in Rockcreek is 5.3%.
Women in Rockcreek earn 94.7 cents for every dollar earned by a man.
What is Inequality or Gini Index in Rockcreek?
Inequality or Gini Index in Rockcreek is 0.38.
What is the Total Population of Rockcreek?
Total Population of Rockcreek is 9,923.
What is the Total Male Population of Rockcreek?
Total Male Population of Rockcreek is 5,110.
What is the Total Female Population of Rockcreek?
Total Female Population of Rockcreek is 4,813.
What is the Ratio of Males per 100 Females in Rockcreek?
There are 106.17 Males per 100 Females in Rockcreek.
What is the Ratio of Females per 100 Males in Rockcreek?
There are 94.19 Females per 100 Males in Rockcreek.
What is the Median Population Age in Rockcreek?
Median Population Age in Rockcreek is 38.6 Years.
What is the Average Family Size in Rockcreek
Average Family Size in Rockcreek is 2.8 People.
What is the Average Household Size in Rockcreek
Average Household Size in Rockcreek is 2.6 People.
How Large is the Labor Force in Rockcreek?
There are 5,769 People in the Labor Forcein in Rockcreek.
What is the Percentage of People in the Labor Force in Rockcreek?
69.2% of People are in the Labor Force in Rockcreek.
What is the Unemployment Rate in Rockcreek?
Unemployment Rate in Rockcreek is 4.4%.