Moro, OR Map & Demographics
Moro Map
Moro Overview
$25,913
PER CAPITA INCOME
$73,750
AVG FAMILY INCOME
$57,292
AVG HOUSEHOLD INCOME
51.6%
WAGE / INCOME GAP [ % ]
48.4¢/ $1
WAGE / INCOME GAP [ $ ]
0.36
INEQUALITY / GINI INDEX
365
TOTAL POPULATION
178
MALE POPULATION
187
FEMALE POPULATION
95.19
MALES / 100 FEMALES
105.06
FEMALES / 100 MALES
34.6
MEDIAN AGE
3.5
AVG FAMILY SIZE
2.7
AVG HOUSEHOLD SIZE
157
LABOR FORCE [ PEOPLE ]
62.3%
PERCENT IN LABOR FORCE
2.5%
UNEMPLOYMENT RATE
Moro Zip Codes
Moro Area Codes
Income in Moro
Income Overview in Moro
Per Capita Income in Moro is $25,913, while median incomes of families and households are $73,750 and $57,292 respectively.
| Characteristic | Number | Measure |
| Per Capita Income | 365 | $25,913 |
| Median Family Income | 80 | $73,750 |
| Mean Family Income | 80 | $80,700 |
| Median Household Income | 137 | $57,292 |
| Mean Household Income | 137 | $69,528 |
| Income Deficit | 80 | $0 |
| Wage / Income Gap (%) | 365 | 51.59% |
| Wage / Income Gap ($) | 365 | 48.41¢ per $1 |
| Gini / Inequality Index | 365 | 0.36 |
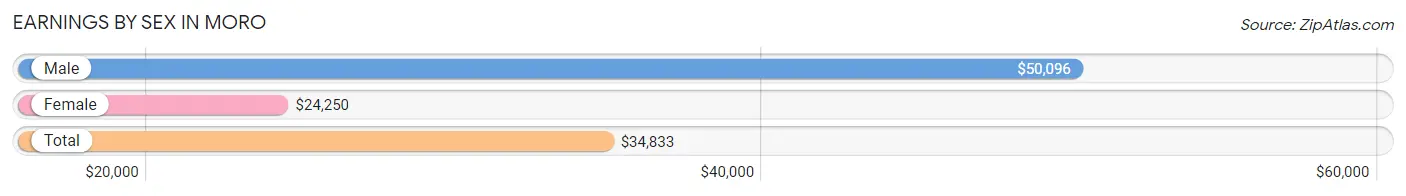
Earnings by Sex in Moro
Average Earnings in Moro are $34,833, $50,096 for men and $24,250 for women, a difference of 51.6%.
| Sex | Number | Average Earnings |
| Male | 93 (54.1%) | $50,096 |
| Female | 79 (45.9%) | $24,250 |
| Total | 172 (100.0%) | $34,833 |
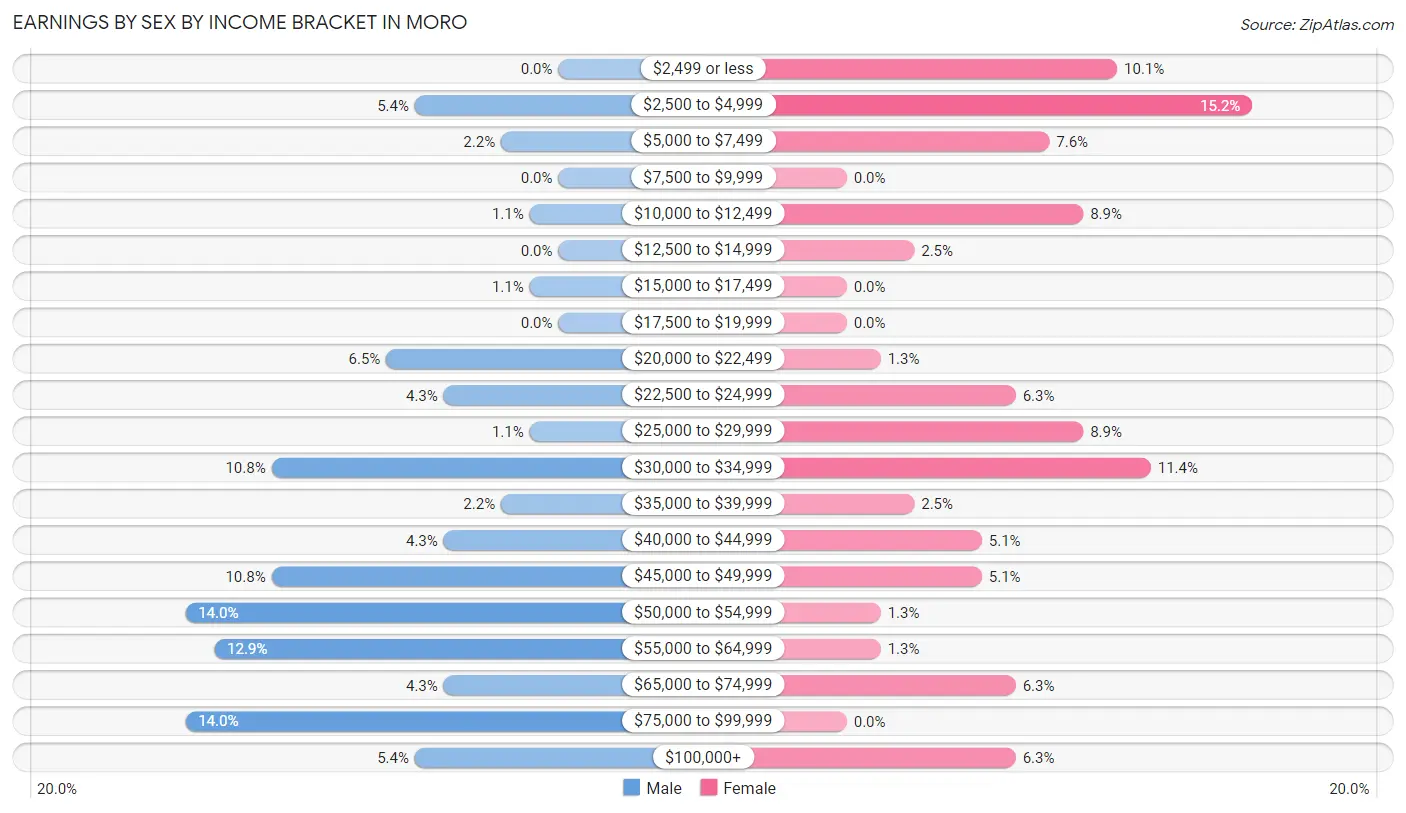
Earnings by Sex by Income Bracket in Moro
The most common earnings brackets in Moro are $50,000 to $54,999 for men (13 | 14.0%) and $2,500 to $4,999 for women (12 | 15.2%).
| Income | Male | Female |
| $2,499 or less | 0 (0.0%) | 8 (10.1%) |
| $2,500 to $4,999 | 5 (5.4%) | 12 (15.2%) |
| $5,000 to $7,499 | 2 (2.1%) | 6 (7.6%) |
| $7,500 to $9,999 | 0 (0.0%) | 0 (0.0%) |
| $10,000 to $12,499 | 1 (1.1%) | 7 (8.9%) |
| $12,500 to $14,999 | 0 (0.0%) | 2 (2.5%) |
| $15,000 to $17,499 | 1 (1.1%) | 0 (0.0%) |
| $17,500 to $19,999 | 0 (0.0%) | 0 (0.0%) |
| $20,000 to $22,499 | 6 (6.5%) | 1 (1.3%) |
| $22,500 to $24,999 | 4 (4.3%) | 5 (6.3%) |
| $25,000 to $29,999 | 1 (1.1%) | 7 (8.9%) |
| $30,000 to $34,999 | 10 (10.7%) | 9 (11.4%) |
| $35,000 to $39,999 | 2 (2.1%) | 2 (2.5%) |
| $40,000 to $44,999 | 4 (4.3%) | 4 (5.1%) |
| $45,000 to $49,999 | 10 (10.7%) | 4 (5.1%) |
| $50,000 to $54,999 | 13 (14.0%) | 1 (1.3%) |
| $55,000 to $64,999 | 12 (12.9%) | 1 (1.3%) |
| $65,000 to $74,999 | 4 (4.3%) | 5 (6.3%) |
| $75,000 to $99,999 | 13 (14.0%) | 0 (0.0%) |
| $100,000+ | 5 (5.4%) | 5 (6.3%) |
| Total | 93 (100.0%) | 79 (100.0%) |
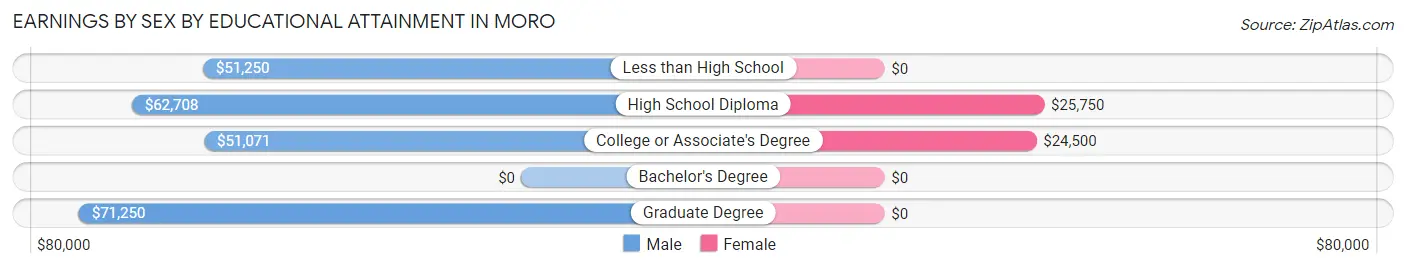
Earnings by Sex by Educational Attainment in Moro
Average earnings in Moro are $51,058 for men and $25,750 for women, a difference of 49.6%. Men with an educational attainment of graduate degree enjoy the highest average annual earnings of $71,250, while those with college or associate's degree education earn the least with $51,071. Women with an educational attainment of high school diploma earn the most with the average annual earnings of $25,750, while those with college or associate's degree education have the smallest earnings of $24,500.
| Educational Attainment | Male Income | Female Income |
| Less than High School | $51,250 | $0 |
| High School Diploma | $62,708 | $25,750 |
| College or Associate's Degree | $51,071 | $24,500 |
| Bachelor's Degree | - | - |
| Graduate Degree | $71,250 | $0 |
| Total | $51,058 | $25,750 |
Family Income in Moro
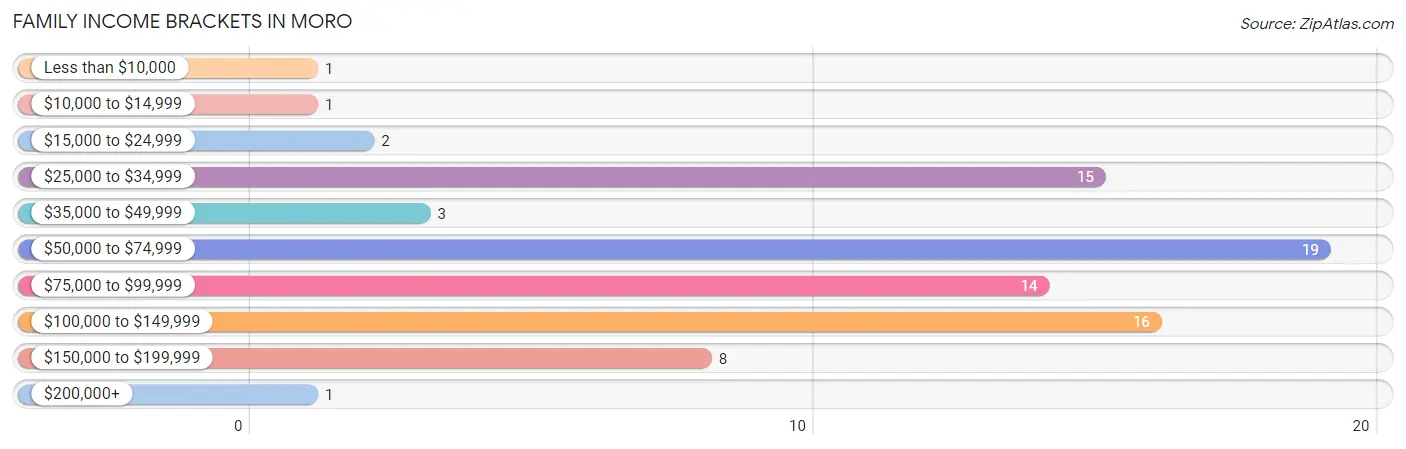
Family Income Brackets in Moro
According to the Moro family income data, there are 19 families falling into the $50,000 to $74,999 income range, which is the most common income bracket and makes up 23.7% of all families. Conversely, the less than $10,000 income bracket is the least frequent group with only 1 families (1.3%) belonging to this category.
| Income Bracket | # Families | % Families |
| Less than $10,000 | 1 | 1.3% |
| $10,000 to $14,999 | 1 | 1.3% |
| $15,000 to $24,999 | 2 | 2.5% |
| $25,000 to $34,999 | 15 | 18.8% |
| $35,000 to $49,999 | 3 | 3.8% |
| $50,000 to $74,999 | 19 | 23.8% |
| $75,000 to $99,999 | 14 | 17.5% |
| $100,000 to $149,999 | 16 | 20.0% |
| $150,000 to $199,999 | 8 | 10.0% |
| $200,000+ | 1 | 1.3% |
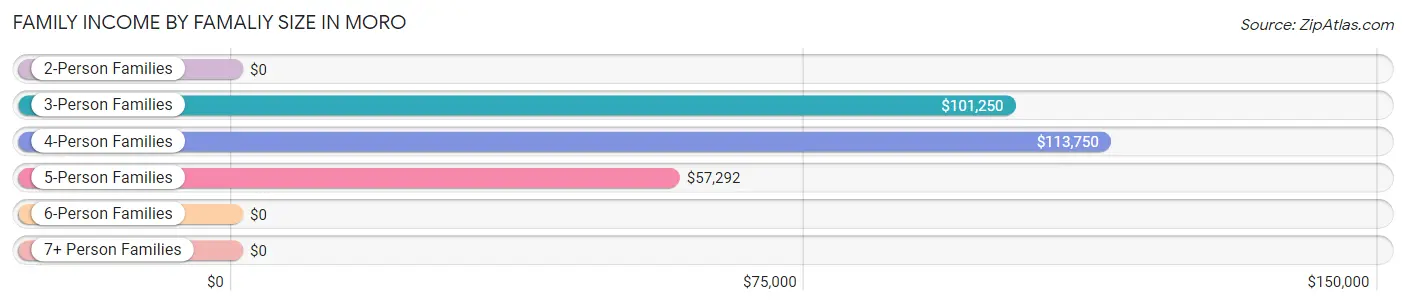
Family Income by Famaliy Size in Moro
4-person families (4 | 5.0%) account for the highest median family income in Moro with $113,750 per family, while 3-person families (25 | 31.2%) have the highest median income of $33,750 per family member.
| Income Bracket | # Families | Median Income |
| 2-Person Families | 28 (35.0%) | $0 |
| 3-Person Families | 25 (31.2%) | $101,250 |
| 4-Person Families | 4 (5.0%) | $113,750 |
| 5-Person Families | 21 (26.3%) | $57,292 |
| 6-Person Families | 0 (0.0%) | $0 |
| 7+ Person Families | 2 (2.5%) | $0 |
| Total | 80 (100.0%) | $73,750 |
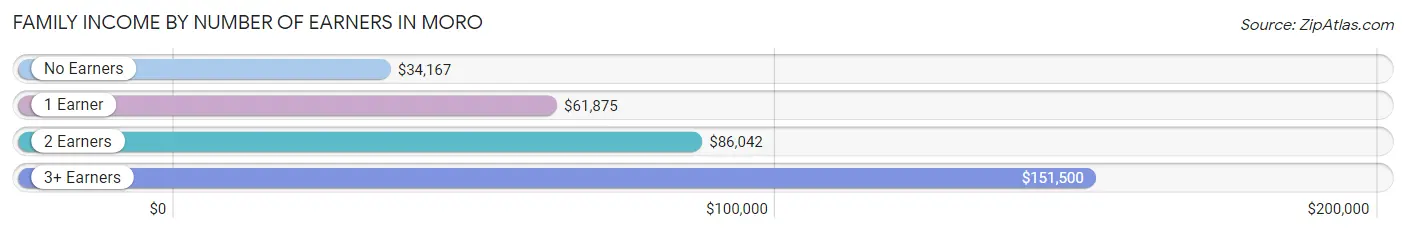
Family Income by Number of Earners in Moro
The median family income in Moro is $73,750, with families comprising 3+ earners (8) having the highest median family income of $151,500, while families with no earners (14) have the lowest median family income of $34,167, accounting for 10.0% and 17.5% of families, respectively.
| Number of Earners | # Families | Median Income |
| No Earners | 14 (17.5%) | $34,167 |
| 1 Earner | 23 (28.7%) | $61,875 |
| 2 Earners | 35 (43.8%) | $86,042 |
| 3+ Earners | 8 (10.0%) | $151,500 |
| Total | 80 (100.0%) | $73,750 |
Household Income in Moro
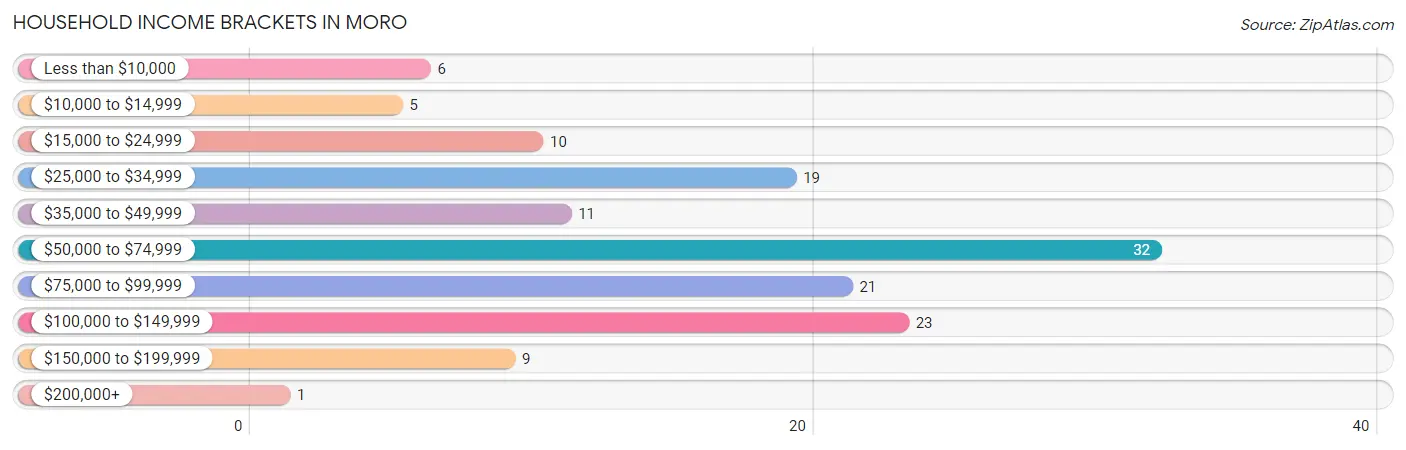
Household Income Brackets in Moro
With 32 households falling in the category, the $50,000 to $74,999 income range is the most frequent in Moro, accounting for 23.4% of all households. In contrast, only 1 households (0.7%) fall into the $200,000+ income bracket, making it the least populous group.
| Income Bracket | # Households | % Households |
| Less than $10,000 | 6 | 4.4% |
| $10,000 to $14,999 | 5 | 3.6% |
| $15,000 to $24,999 | 10 | 7.3% |
| $25,000 to $34,999 | 19 | 13.9% |
| $35,000 to $49,999 | 11 | 8.0% |
| $50,000 to $74,999 | 32 | 23.4% |
| $75,000 to $99,999 | 21 | 15.3% |
| $100,000 to $149,999 | 23 | 16.8% |
| $150,000 to $199,999 | 9 | 6.6% |
| $200,000+ | 1 | 0.7% |
Household Income by Householder Age in Moro
The median household income in Moro is $57,292, with the highest median household income of $78,750 found in the 45 to 64 years age bracket for the primary householder. A total of 45 households (32.9%) fall into this category. Meanwhile, the 15 to 24 years age bracket for the primary householder has the lowest median household income of $0, with 4 households (2.9%) in this group.
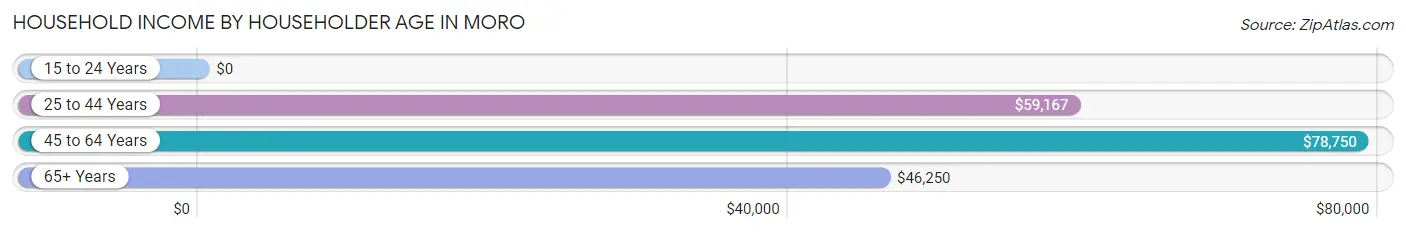
| Income Bracket | # Households | Median Income |
| 15 to 24 Years | 4 (2.9%) | $0 |
| 25 to 44 Years | 44 (32.1%) | $59,167 |
| 45 to 64 Years | 45 (32.9%) | $78,750 |
| 65+ Years | 44 (32.1%) | $46,250 |
| Total | 137 (100.0%) | $57,292 |
Poverty in Moro
Income Below Poverty by Sex and Age in Moro
With 7.9% poverty level for males and 18.9% for females among the residents of Moro, 5 year old males and 5 year old females are the most vulnerable to poverty, with 1 males (50.0%) and 2 females (100.0%) in their respective age groups living below the poverty level.
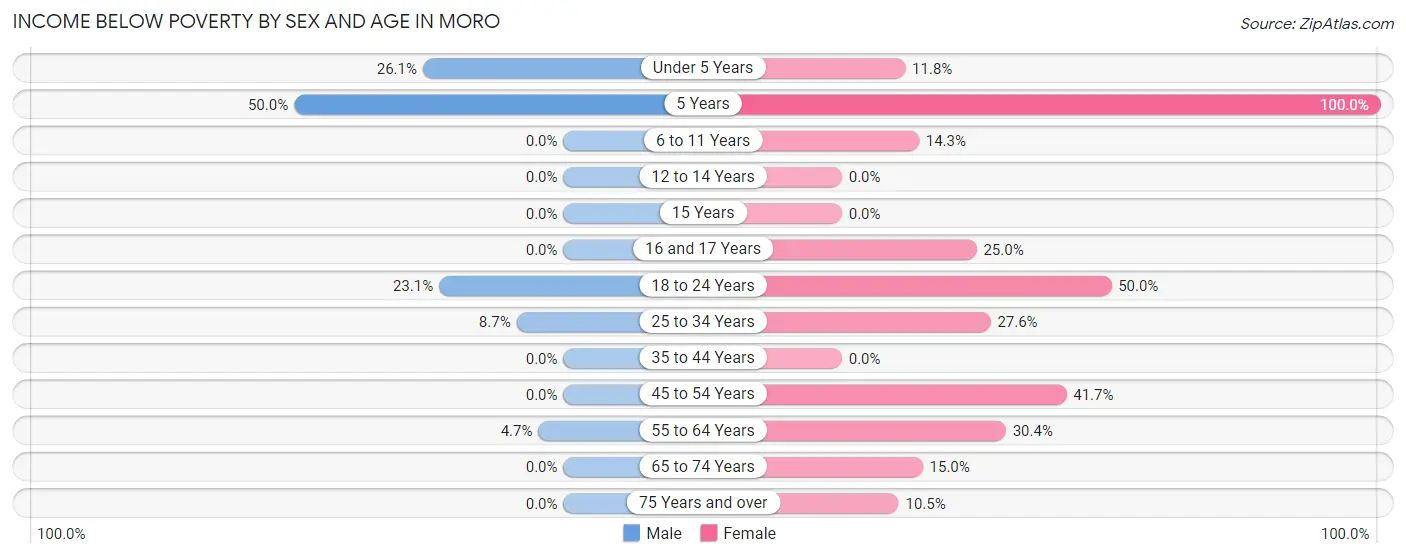
| Age Bracket | Male | Female |
| Under 5 Years | 6 (26.1%) | 2 (11.8%) |
| 5 Years | 1 (50.0%) | 2 (100.0%) |
| 6 to 11 Years | 0 (0.0%) | 2 (14.3%) |
| 12 to 14 Years | 0 (0.0%) | 0 (0.0%) |
| 15 Years | 0 (0.0%) | 0 (0.0%) |
| 16 and 17 Years | 0 (0.0%) | 2 (25.0%) |
| 18 to 24 Years | 3 (23.1%) | 2 (50.0%) |
| 25 to 34 Years | 2 (8.7%) | 8 (27.6%) |
| 35 to 44 Years | 0 (0.0%) | 0 (0.0%) |
| 45 to 54 Years | 0 (0.0%) | 5 (41.7%) |
| 55 to 64 Years | 2 (4.6%) | 7 (30.4%) |
| 65 to 74 Years | 0 (0.0%) | 3 (15.0%) |
| 75 Years and over | 0 (0.0%) | 2 (10.5%) |
| Total | 14 (7.9%) | 35 (18.9%) |
Income Above Poverty by Sex and Age in Moro
According to the poverty statistics in Moro, males aged 6 to 11 years and females aged 12 to 14 years are the age groups that are most secure financially, with 100.0% of males and 100.0% of females in these age groups living above the poverty line.
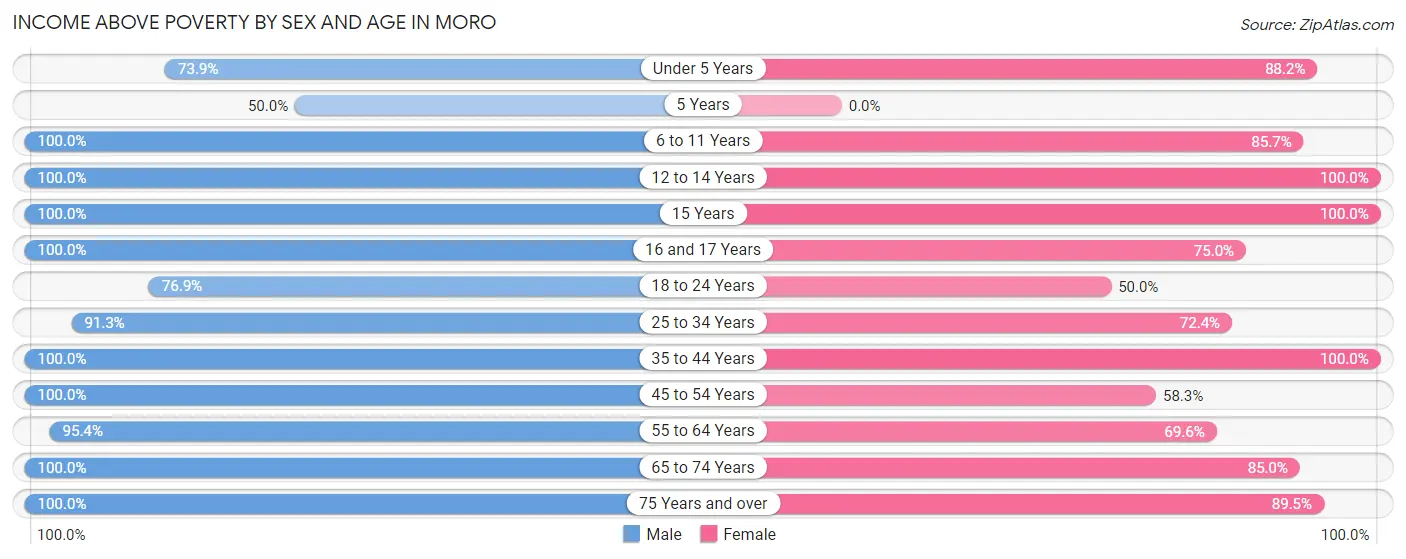
| Age Bracket | Male | Female |
| Under 5 Years | 17 (73.9%) | 15 (88.2%) |
| 5 Years | 1 (50.0%) | 0 (0.0%) |
| 6 to 11 Years | 17 (100.0%) | 12 (85.7%) |
| 12 to 14 Years | 11 (100.0%) | 18 (100.0%) |
| 15 Years | 2 (100.0%) | 5 (100.0%) |
| 16 and 17 Years | 4 (100.0%) | 6 (75.0%) |
| 18 to 24 Years | 10 (76.9%) | 2 (50.0%) |
| 25 to 34 Years | 21 (91.3%) | 21 (72.4%) |
| 35 to 44 Years | 18 (100.0%) | 14 (100.0%) |
| 45 to 54 Years | 5 (100.0%) | 7 (58.3%) |
| 55 to 64 Years | 41 (95.4%) | 16 (69.6%) |
| 65 to 74 Years | 8 (100.0%) | 17 (85.0%) |
| 75 Years and over | 9 (100.0%) | 17 (89.5%) |
| Total | 164 (92.1%) | 150 (81.1%) |
Income Below Poverty Among Married-Couple Families in Moro
The poverty statistics for married-couple families in Moro show that 4.5% or 3 of the total 66 families live below the poverty line. Families with 3 or 4 children have the highest poverty rate of 8.7%, comprising of 2 families. On the other hand, families with 1 or 2 children have the lowest poverty rate of 0.0%, which includes 0 families.
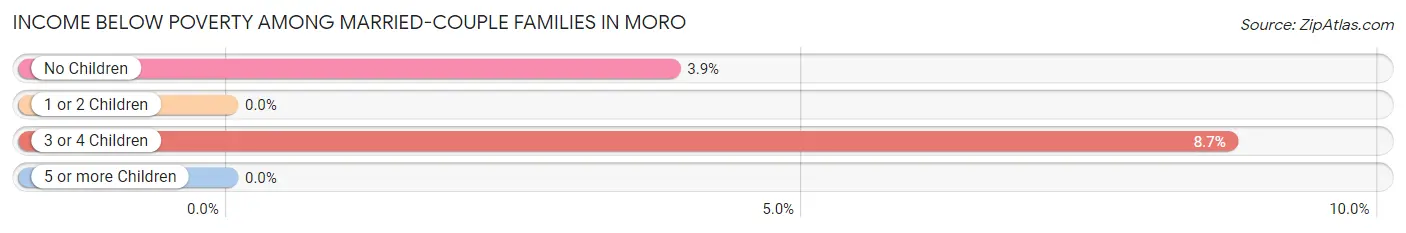
| Children | Above Poverty | Below Poverty |
| No Children | 25 (96.2%) | 1 (3.8%) |
| 1 or 2 Children | 17 (100.0%) | 0 (0.0%) |
| 3 or 4 Children | 21 (91.3%) | 2 (8.7%) |
| 5 or more Children | 0 (0.0%) | 0 (0.0%) |
| Total | 63 (95.5%) | 3 (4.5%) |
Income Below Poverty Among Single-Parent Households in Moro
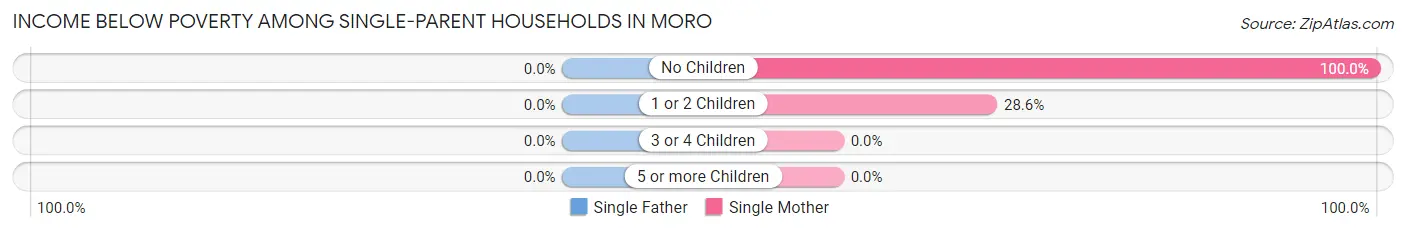
| Children | Single Father | Single Mother |
| No Children | 0 (0.0%) | 1 (100.0%) |
| 1 or 2 Children | 0 (0.0%) | 2 (28.6%) |
| 3 or 4 Children | 0 (0.0%) | 0 (0.0%) |
| 5 or more Children | 0 (0.0%) | 0 (0.0%) |
| Total | 0 (0.0%) | 3 (37.5%) |
Income Below Poverty Among Married-Couple vs Single-Parent Households in Moro
The poverty data for Moro shows that 3 of the married-couple family households (4.5%) and 3 of the single-parent households (21.4%) are living below the poverty level. Within the married-couple family households, those with 3 or 4 children have the highest poverty rate, with 2 households (8.7%) falling below the poverty line. Among the single-parent households, those with no children have the highest poverty rate, with 1 household (100.0%) living below poverty.
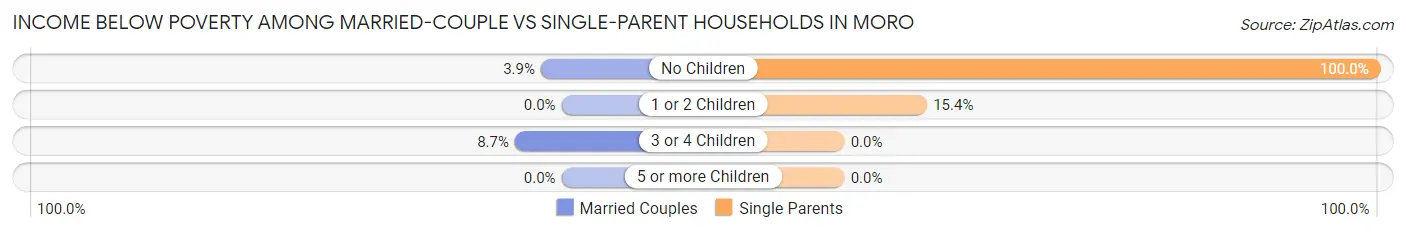
| Children | Married-Couple Families | Single-Parent Households |
| No Children | 1 (3.8%) | 1 (100.0%) |
| 1 or 2 Children | 0 (0.0%) | 2 (15.4%) |
| 3 or 4 Children | 2 (8.7%) | 0 (0.0%) |
| 5 or more Children | 0 (0.0%) | 0 (0.0%) |
| Total | 3 (4.5%) | 3 (21.4%) |
Race in Moro
The most populous races in Moro are White / Caucasian (315 | 86.3%), Two or more Races (33 | 9.0%), and Native / Alaskan (8 | 2.2%).
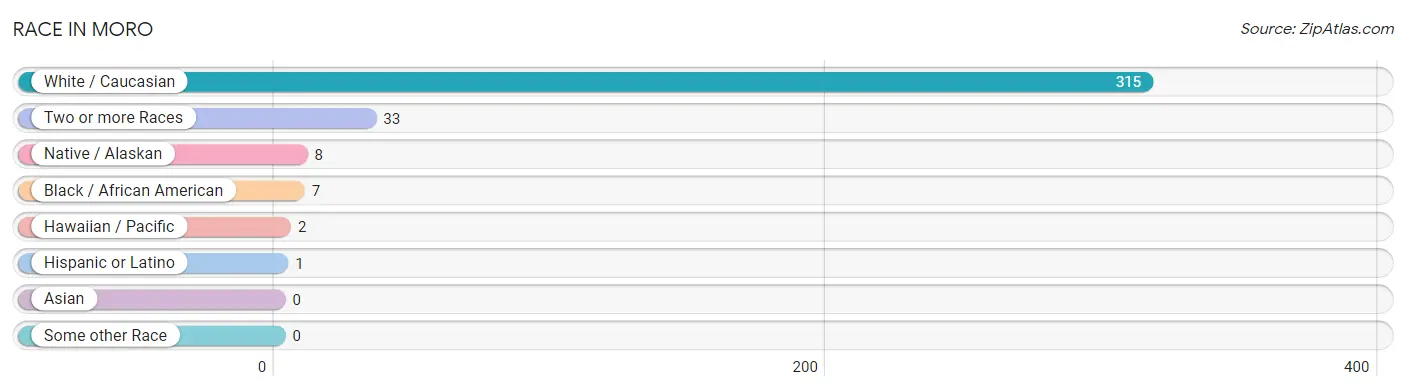
| Race | # Population | % Population |
| Asian | 0 | 0.0% |
| Black / African American | 7 | 1.9% |
| Hawaiian / Pacific | 2 | 0.5% |
| Hispanic or Latino | 1 | 0.3% |
| Native / Alaskan | 8 | 2.2% |
| White / Caucasian | 315 | 86.3% |
| Two or more Races | 33 | 9.0% |
| Some other Race | 0 | 0.0% |
| Total | 365 | 100.0% |
Ancestry in Moro
The most populous ancestries reported in Moro are German (97 | 26.6%), English (59 | 16.2%), Irish (57 | 15.6%), Danish (25 | 6.9%), and American (20 | 5.5%), together accounting for 70.7% of all Moro residents.
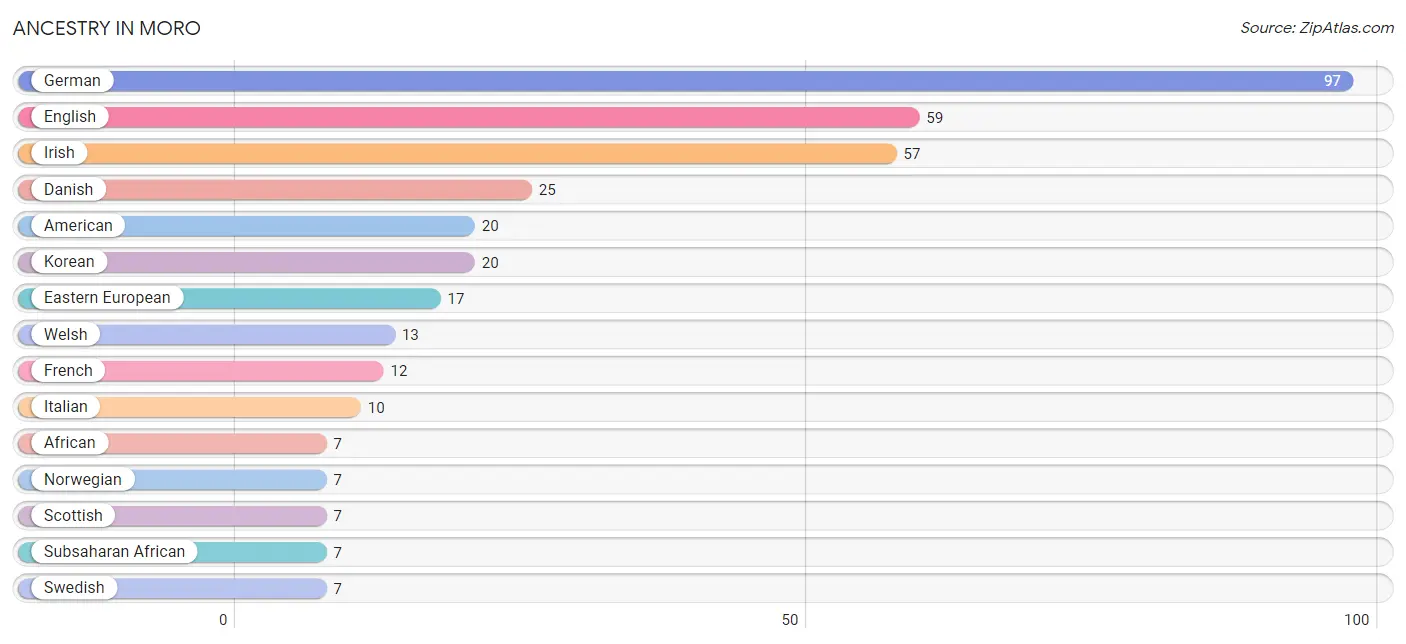
| Ancestry | # Population | % Population |
| African | 7 | 1.9% |
| American | 20 | 5.5% |
| Australian | 3 | 0.8% |
| British | 3 | 0.8% |
| Cherokee | 3 | 0.8% |
| Danish | 25 | 6.9% |
| Dutch | 2 | 0.5% |
| Eastern European | 17 | 4.7% |
| English | 59 | 16.2% |
| European | 2 | 0.5% |
| French | 12 | 3.3% |
| French Canadian | 1 | 0.3% |
| German | 97 | 26.6% |
| Irish | 57 | 15.6% |
| Italian | 10 | 2.7% |
| Korean | 20 | 5.5% |
| Lithuanian | 2 | 0.5% |
| Mexican | 1 | 0.3% |
| Native Hawaiian | 6 | 1.6% |
| Norwegian | 7 | 1.9% |
| Polish | 5 | 1.4% |
| Russian | 3 | 0.8% |
| Samoan | 1 | 0.3% |
| Scotch-Irish | 2 | 0.5% |
| Scottish | 7 | 1.9% |
| Subsaharan African | 7 | 1.9% |
| Swedish | 7 | 1.9% |
| Swiss | 1 | 0.3% |
| Welsh | 13 | 3.6% | View All 29 Rows |
Immigrants in Moro
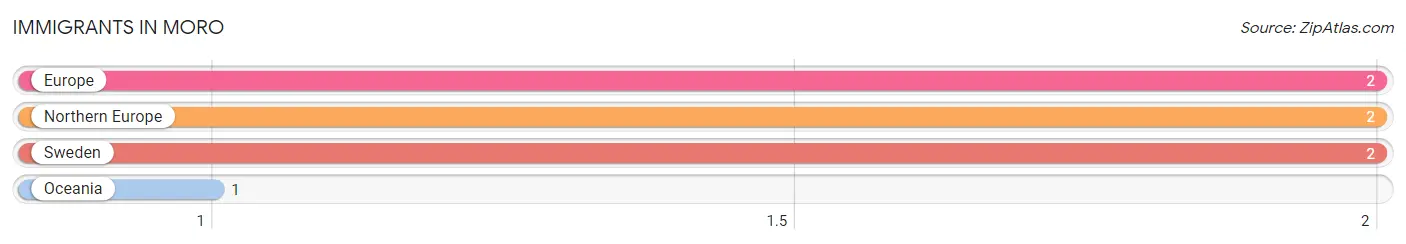
The most numerous immigrant groups reported in Moro came from Europe (2 | 0.5%), Northern Europe (2 | 0.5%), Sweden (2 | 0.5%), and Oceania (1 | 0.3%), together accounting for 1.9% of all Moro residents.
| Immigration Origin | # Population | % Population |
| Europe | 2 | 0.5% |
| Northern Europe | 2 | 0.5% |
| Oceania | 1 | 0.3% |
| Sweden | 2 | 0.5% | View All 4 Rows |
Sex and Age in Moro
Sex and Age in Moro
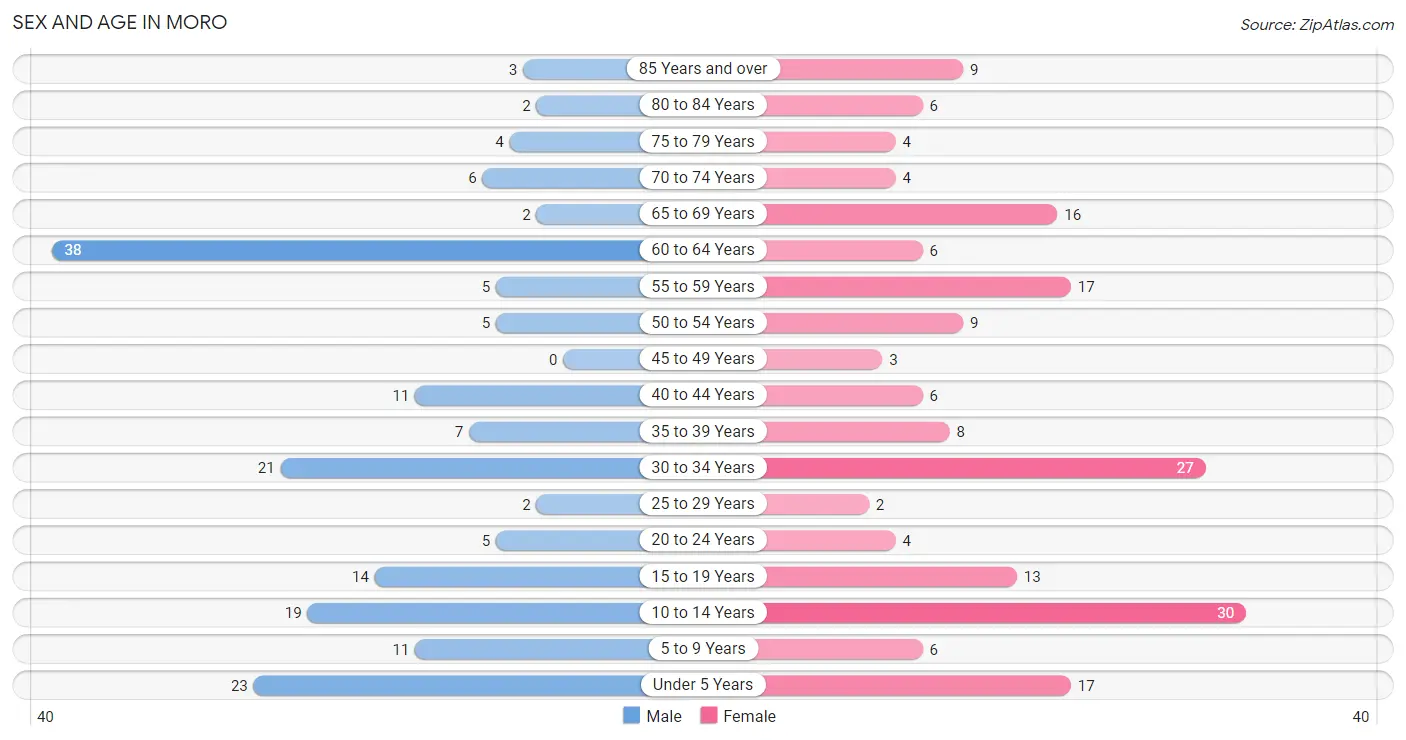
The most populous age groups in Moro are 60 to 64 Years (38 | 21.3%) for men and 10 to 14 Years (30 | 16.0%) for women.
| Age Bracket | Male | Female |
| Under 5 Years | 23 (12.9%) | 17 (9.1%) |
| 5 to 9 Years | 11 (6.2%) | 6 (3.2%) |
| 10 to 14 Years | 19 (10.7%) | 30 (16.0%) |
| 15 to 19 Years | 14 (7.9%) | 13 (7.0%) |
| 20 to 24 Years | 5 (2.8%) | 4 (2.1%) |
| 25 to 29 Years | 2 (1.1%) | 2 (1.1%) |
| 30 to 34 Years | 21 (11.8%) | 27 (14.4%) |
| 35 to 39 Years | 7 (3.9%) | 8 (4.3%) |
| 40 to 44 Years | 11 (6.2%) | 6 (3.2%) |
| 45 to 49 Years | 0 (0.0%) | 3 (1.6%) |
| 50 to 54 Years | 5 (2.8%) | 9 (4.8%) |
| 55 to 59 Years | 5 (2.8%) | 17 (9.1%) |
| 60 to 64 Years | 38 (21.3%) | 6 (3.2%) |
| 65 to 69 Years | 2 (1.1%) | 16 (8.6%) |
| 70 to 74 Years | 6 (3.4%) | 4 (2.1%) |
| 75 to 79 Years | 4 (2.2%) | 4 (2.1%) |
| 80 to 84 Years | 2 (1.1%) | 6 (3.2%) |
| 85 Years and over | 3 (1.7%) | 9 (4.8%) |
| Total | 178 (100.0%) | 187 (100.0%) |
Families and Households in Moro
Median Family Size in Moro
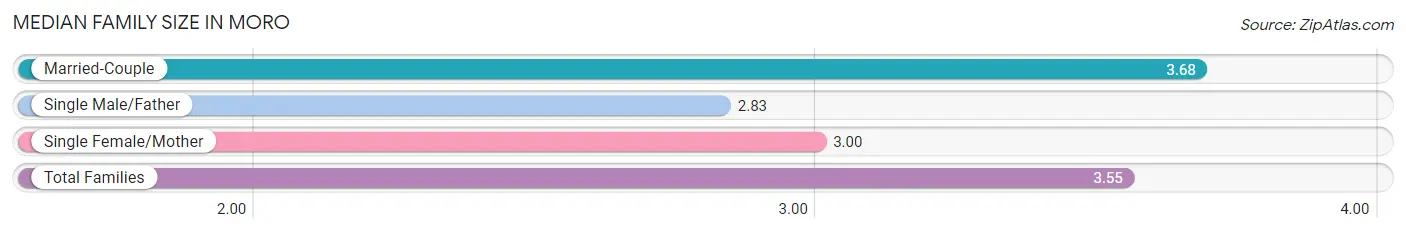
The median family size in Moro is 3.55 persons per family, with married-couple families (66 | 82.5%) accounting for the largest median family size of 3.68 persons per family. On the other hand, single male/father families (6 | 7.5%) represent the smallest median family size with 2.83 persons per family.
| Family Type | # Families | Family Size |
| Married-Couple | 66 (82.5%) | 3.68 |
| Single Male/Father | 6 (7.5%) | 2.83 |
| Single Female/Mother | 8 (10.0%) | 3.00 |
| Total Families | 80 (100.0%) | 3.55 |
Median Household Size in Moro
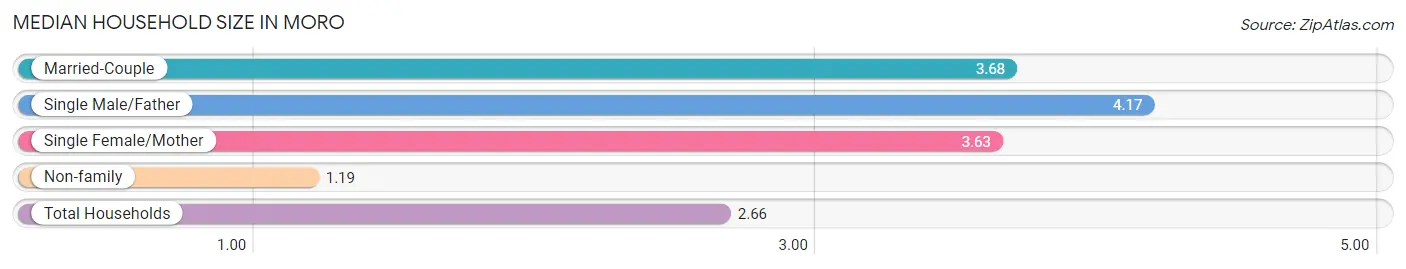
The median household size in Moro is 2.66 persons per household, with single male/father households (6 | 4.4%) accounting for the largest median household size of 4.17 persons per household. non-family households (57 | 41.6%) represent the smallest median household size with 1.19 persons per household.
| Household Type | # Households | Household Size |
| Married-Couple | 66 (48.2%) | 3.68 |
| Single Male/Father | 6 (4.4%) | 4.17 |
| Single Female/Mother | 8 (5.8%) | 3.63 |
| Non-family | 57 (41.6%) | 1.19 |
| Total Households | 137 (100.0%) | 2.66 |
Household Size by Marriage Status in Moro
Out of a total of 137 households in Moro, 80 (58.4%) are family households, while 57 (41.6%) are nonfamily households. The most numerous type of family households are 3-person households, comprising 26, and the most common type of nonfamily households are 1-person households, comprising 49.
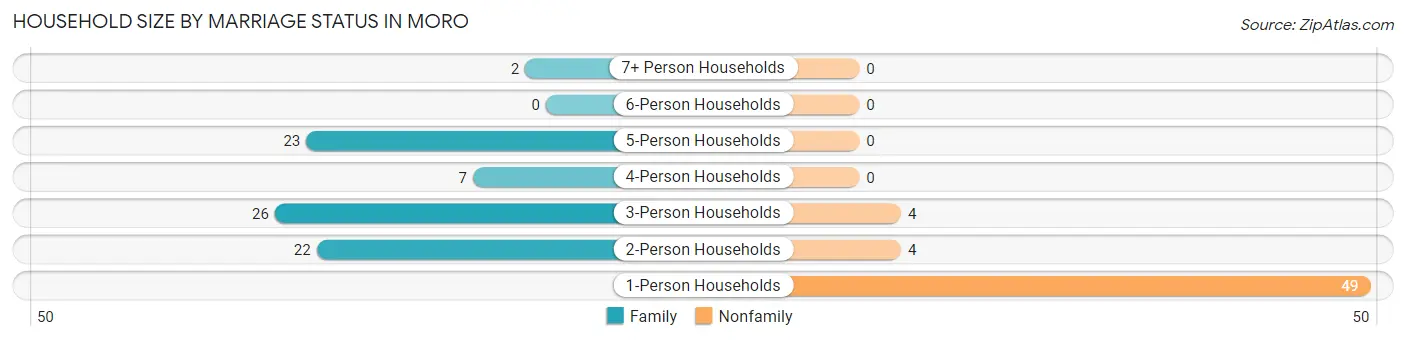
| Household Size | Family Households | Nonfamily Households |
| 1-Person Households | - | 49 (35.8%) |
| 2-Person Households | 22 (16.1%) | 4 (2.9%) |
| 3-Person Households | 26 (19.0%) | 4 (2.9%) |
| 4-Person Households | 7 (5.1%) | 0 (0.0%) |
| 5-Person Households | 23 (16.8%) | 0 (0.0%) |
| 6-Person Households | 0 (0.0%) | 0 (0.0%) |
| 7+ Person Households | 2 (1.5%) | 0 (0.0%) |
| Total | 80 (58.4%) | 57 (41.6%) |
Female Fertility in Moro
Fertility by Age in Moro
Average fertility rate in Moro is 190.0 births per 1,000 women. Women in the age bracket of 20 to 34 years have the highest fertility rate with 364.0 births per 1,000 women. Women in the age bracket of 20 to 34 years acount for 100.0% of all women with births.
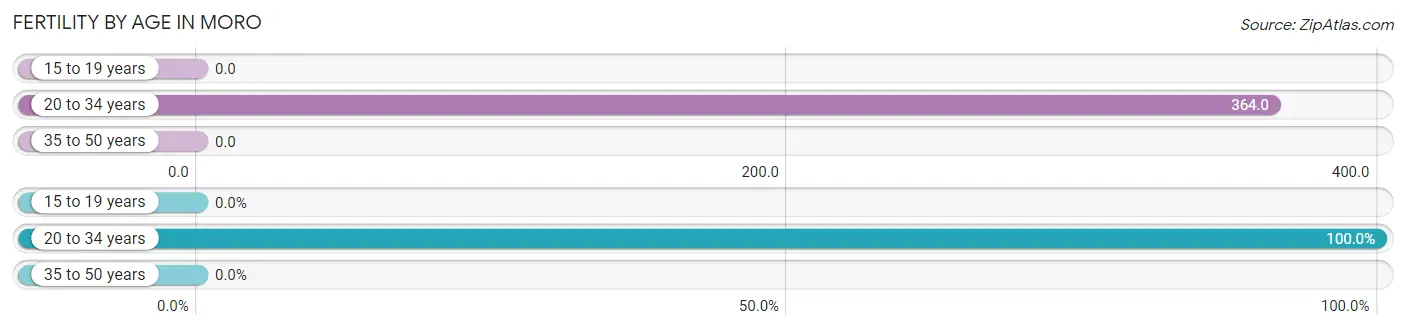
| Age Bracket | Women with Births | Births / 1,000 Women |
| 15 to 19 years | 0 (0.0%) | 0.0 |
| 20 to 34 years | 12 (100.0%) | 364.0 |
| 35 to 50 years | 0 (0.0%) | 0.0 |
| Total | 12 (100.0%) | 190.0 |
Fertility by Age by Marriage Status in Moro
91.7% of women with births (12) in Moro are married. The highest percentage of unmarried women with births falls into 20 to 34 years age bracket with 8.3% of them unmarried at the time of birth, while the lowest percentage of unmarried women with births belong to 20 to 34 years age bracket with 8.3% of them unmarried.
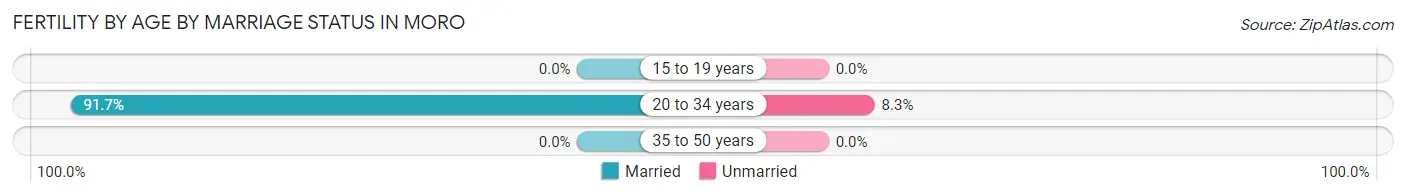
| Age Bracket | Married | Unmarried |
| 15 to 19 years | 0 (0.0%) | 0 (0.0%) |
| 20 to 34 years | 11 (91.7%) | 1 (8.3%) |
| 35 to 50 years | 0 (0.0%) | 0 (0.0%) |
| Total | 11 (91.7%) | 1 (8.3%) |
Fertility by Education in Moro
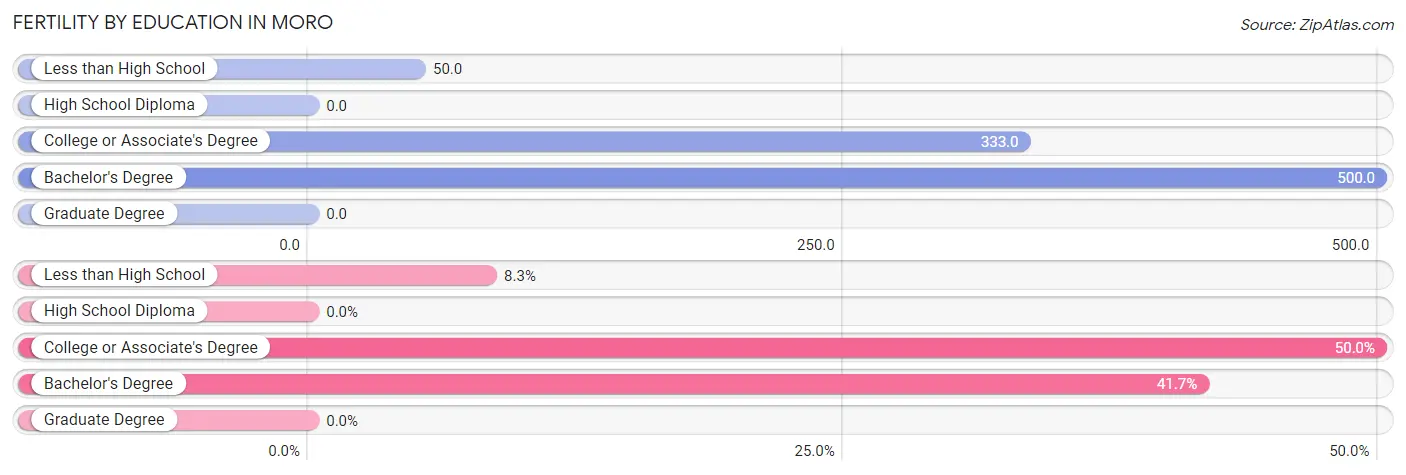
| Educational Attainment | Women with Births | Births / 1,000 Women |
| Less than High School | 1 (8.3%) | 50.0 |
| High School Diploma | 0 (0.0%) | 0.0 |
| College or Associate's Degree | 6 (50.0%) | 333.0 |
| Bachelor's Degree | 5 (41.7%) | 500.0 |
| Graduate Degree | 0 (0.0%) | 0.0 |
| Total | 12 (100.0%) | 190.0 |
Fertility by Education by Marriage Status in Moro
8.3% of women with births in Moro are unmarried. Women with the educational attainment of college or associate's degree are most likely to be married with 100.0% of them married at childbirth, while women with the educational attainment of less than high school are least likely to be married with 100.0% of them unmarried at childbirth.
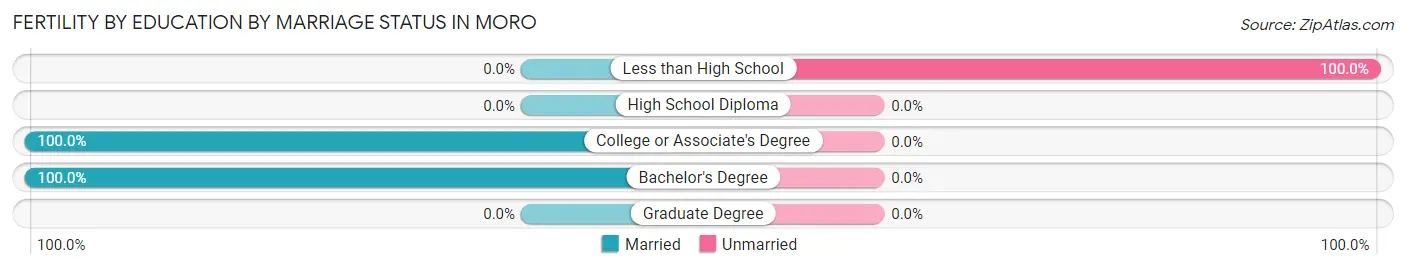
| Educational Attainment | Married | Unmarried |
| Less than High School | 0 (0.0%) | 1 (100.0%) |
| High School Diploma | 0 (0.0%) | 0 (0.0%) |
| College or Associate's Degree | 6 (100.0%) | 0 (0.0%) |
| Bachelor's Degree | 5 (100.0%) | 0 (0.0%) |
| Graduate Degree | 0 (0.0%) | 0 (0.0%) |
| Total | 11 (91.7%) | 1 (8.3%) |
Employment Characteristics in Moro
Employment by Class of Employer in Moro
Among the 150 employed individuals in Moro, private company employees (74 | 49.3%), local government employees (34 | 22.7%), and not-for-profit organizations (16 | 10.7%) make up the most common classes of employment.
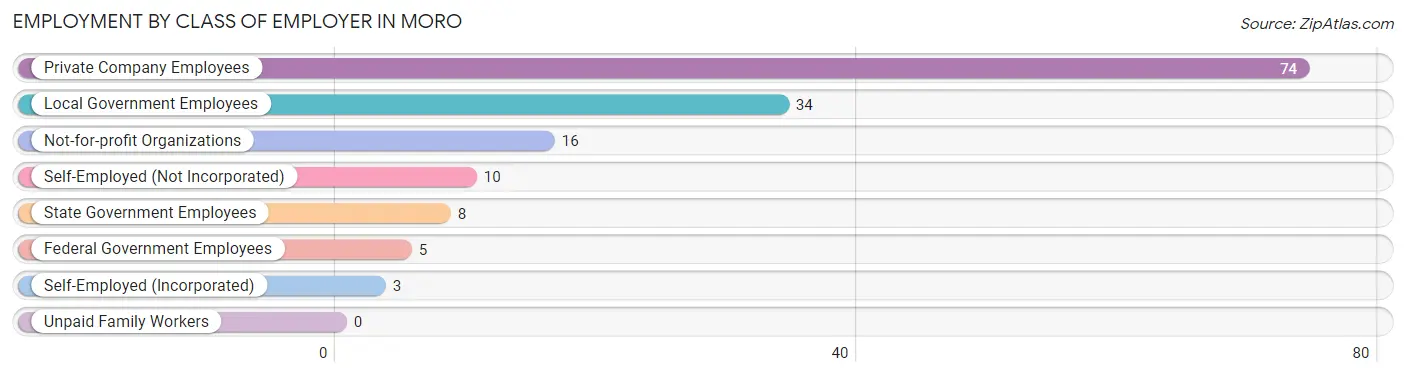
| Employer Class | # Employees | % Employees |
| Private Company Employees | 74 | 49.3% |
| Self-Employed (Incorporated) | 3 | 2.0% |
| Self-Employed (Not Incorporated) | 10 | 6.7% |
| Not-for-profit Organizations | 16 | 10.7% |
| Local Government Employees | 34 | 22.7% |
| State Government Employees | 8 | 5.3% |
| Federal Government Employees | 5 | 3.3% |
| Unpaid Family Workers | 0 | 0.0% |
| Total | 150 | 100.0% |
Employment Status by Age in Moro
According to the labor force statistics for Moro, out of the total population over 16 years of age (252), 62.3% or 157 individuals are in the labor force, with 2.5% or 4 of them unemployed. The age group with the highest labor force participation rate is 20 to 24 years, with 100.0% or 9 individuals in the labor force. Within the labor force, the 25 to 29 years age range has the highest percentage of unemployed individuals, with 50.0% or 2 of them being unemployed.
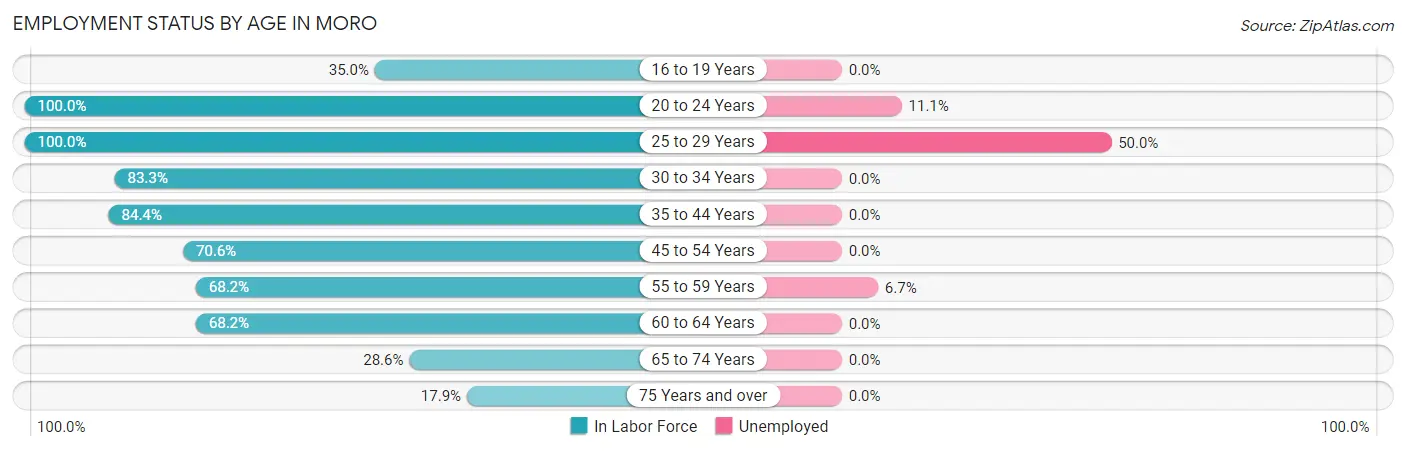
| Age Bracket | In Labor Force | Unemployed |
| 16 to 19 Years | 7 (35.0%) | 0 (0.0%) |
| 20 to 24 Years | 9 (100.0%) | 1 (11.1%) |
| 25 to 29 Years | 4 (100.0%) | 2 (50.0%) |
| 30 to 34 Years | 40 (83.3%) | 0 (0.0%) |
| 35 to 44 Years | 27 (84.4%) | 0 (0.0%) |
| 45 to 54 Years | 12 (70.6%) | 0 (0.0%) |
| 55 to 59 Years | 15 (68.2%) | 1 (6.7%) |
| 60 to 64 Years | 30 (68.2%) | 0 (0.0%) |
| 65 to 74 Years | 8 (28.6%) | 0 (0.0%) |
| 75 Years and over | 5 (17.9%) | 0 (0.0%) |
| Total | 157 (62.3%) | 4 (2.5%) |
Employment Status by Educational Attainment in Moro
According to labor force statistics for Moro, 76.6% of individuals (128) out of the total population between 25 and 64 years of age (167) are in the labor force, with 2.3% or 3 of them being unemployed. The group with the highest labor force participation rate are those with the educational attainment of bachelor's degree or higher, with 89.3% or 25 individuals in the labor force. Within the labor force, individuals with high school diploma education have the highest percentage of unemployment, with 6.4% or 3 of them being unemployed.
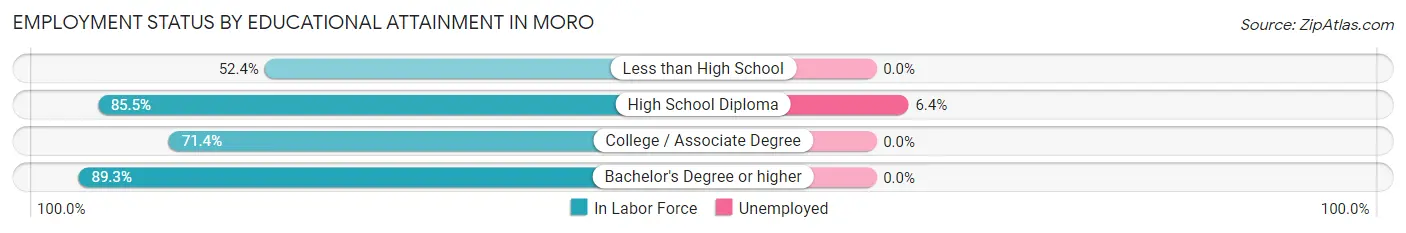
| Educational Attainment | In Labor Force | Unemployed |
| Less than High School | 11 (52.4%) | 0 (0.0%) |
| High School Diploma | 47 (85.5%) | 4 (6.4%) |
| College / Associate Degree | 45 (71.4%) | 0 (0.0%) |
| Bachelor's Degree or higher | 25 (89.3%) | 0 (0.0%) |
| Total | 128 (76.6%) | 4 (2.3%) |
Employment Occupations by Sex in Moro
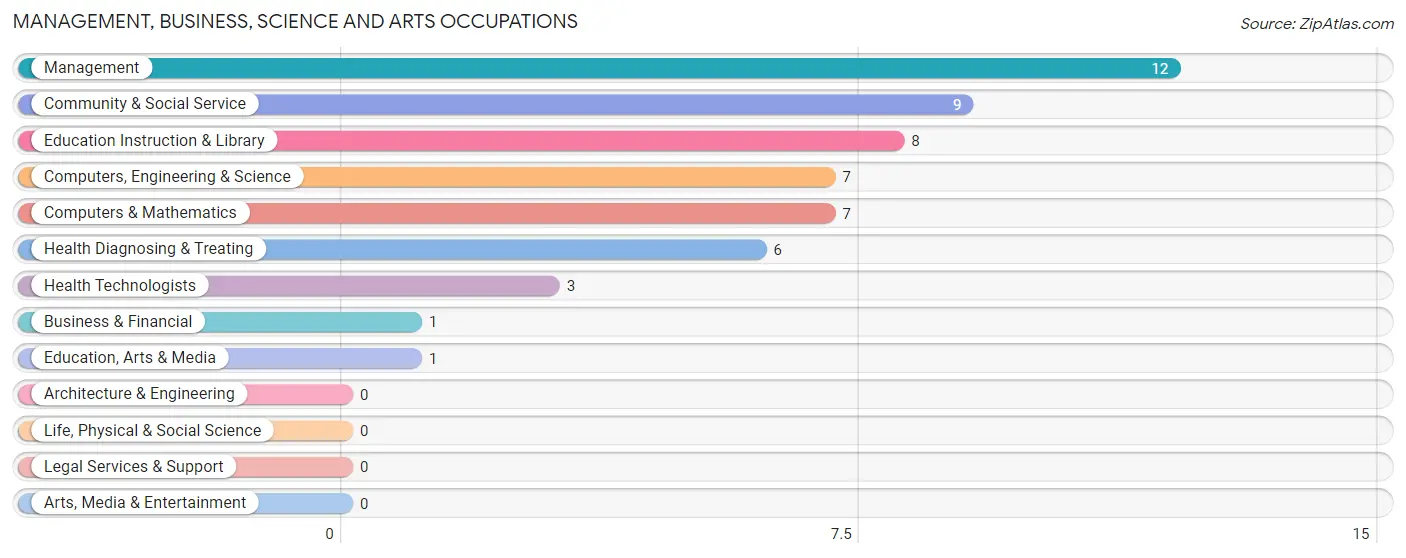
Management, Business, Science and Arts Occupations
The most common Management, Business, Science and Arts occupations in Moro are Management (12 | 7.8%), Community & Social Service (9 | 5.9%), Education Instruction & Library (8 | 5.2%), Computers, Engineering & Science (7 | 4.6%), and Computers & Mathematics (7 | 4.6%).
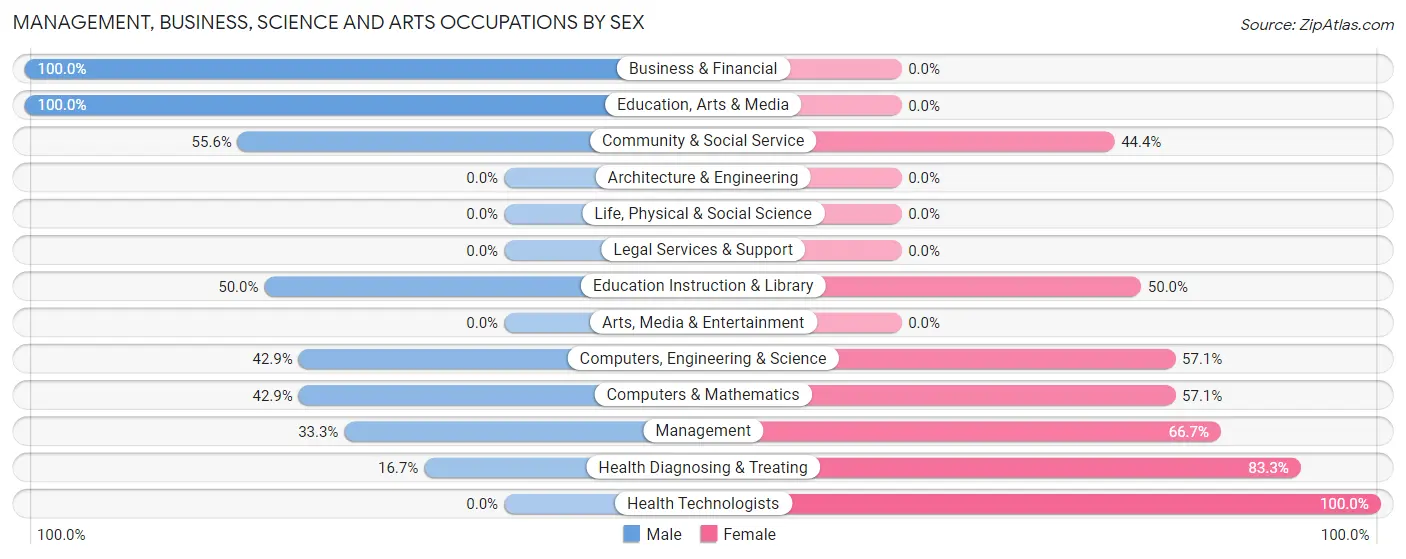
Management, Business, Science and Arts Occupations by Sex
Within the Management, Business, Science and Arts occupations in Moro, the most male-oriented occupations are Business & Financial (100.0%), Education, Arts & Media (100.0%), and Community & Social Service (55.6%), while the most female-oriented occupations are Health Technologists (100.0%), Health Diagnosing & Treating (83.3%), and Management (66.7%).
| Occupation | Male | Female |
| Management | 4 (33.3%) | 8 (66.7%) |
| Business & Financial | 1 (100.0%) | 0 (0.0%) |
| Computers, Engineering & Science | 3 (42.9%) | 4 (57.1%) |
| Computers & Mathematics | 3 (42.9%) | 4 (57.1%) |
| Architecture & Engineering | 0 (0.0%) | 0 (0.0%) |
| Life, Physical & Social Science | 0 (0.0%) | 0 (0.0%) |
| Community & Social Service | 5 (55.6%) | 4 (44.4%) |
| Education, Arts & Media | 1 (100.0%) | 0 (0.0%) |
| Legal Services & Support | 0 (0.0%) | 0 (0.0%) |
| Education Instruction & Library | 4 (50.0%) | 4 (50.0%) |
| Arts, Media & Entertainment | 0 (0.0%) | 0 (0.0%) |
| Health Diagnosing & Treating | 1 (16.7%) | 5 (83.3%) |
| Health Technologists | 0 (0.0%) | 3 (100.0%) |
| Total (Category) | 14 (40.0%) | 21 (60.0%) |
| Total (Overall) | 92 (60.1%) | 61 (39.9%) |
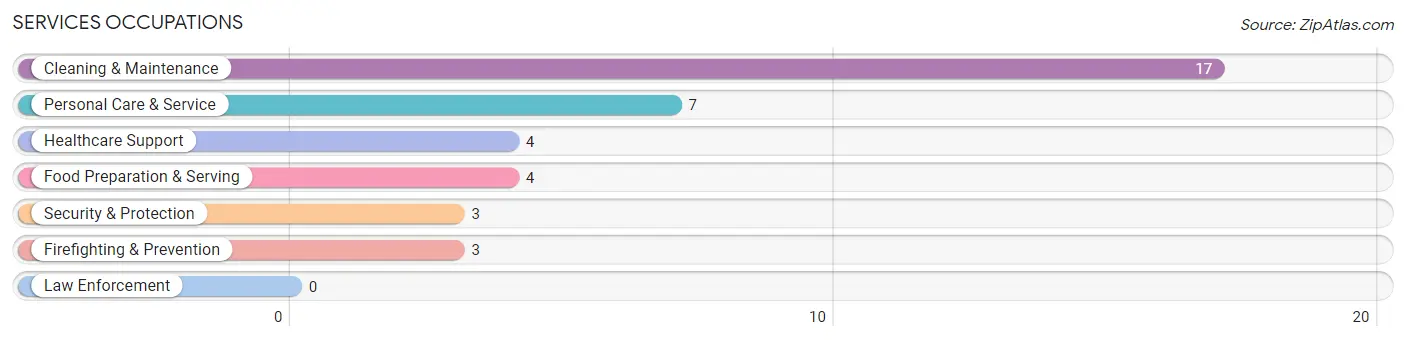
Services Occupations
The most common Services occupations in Moro are Cleaning & Maintenance (17 | 11.1%), Personal Care & Service (7 | 4.6%), Healthcare Support (4 | 2.6%), Food Preparation & Serving (4 | 2.6%), and Security & Protection (3 | 2.0%).
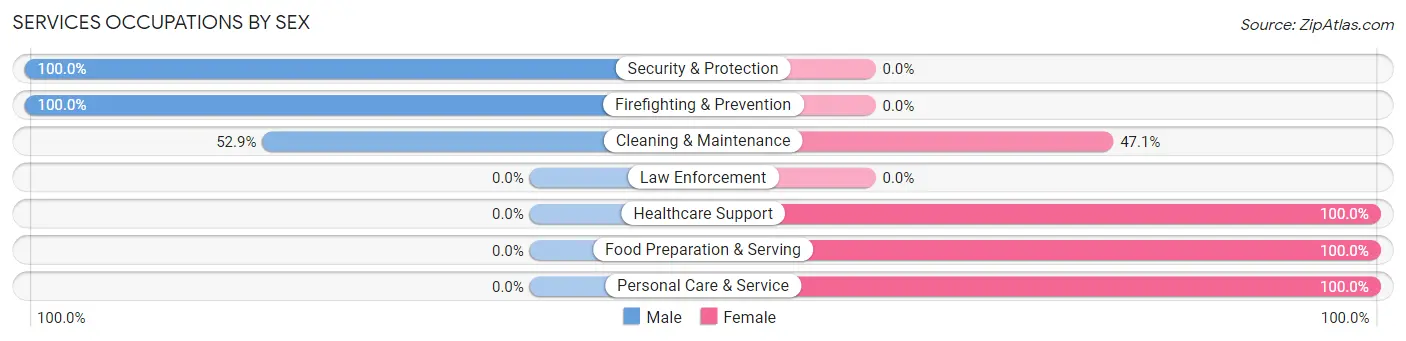
Services Occupations by Sex
Within the Services occupations in Moro, the most male-oriented occupations are Security & Protection (100.0%), Firefighting & Prevention (100.0%), and Cleaning & Maintenance (52.9%), while the most female-oriented occupations are Healthcare Support (100.0%), Food Preparation & Serving (100.0%), and Personal Care & Service (100.0%).
| Occupation | Male | Female |
| Healthcare Support | 0 (0.0%) | 4 (100.0%) |
| Security & Protection | 3 (100.0%) | 0 (0.0%) |
| Firefighting & Prevention | 3 (100.0%) | 0 (0.0%) |
| Law Enforcement | 0 (0.0%) | 0 (0.0%) |
| Food Preparation & Serving | 0 (0.0%) | 4 (100.0%) |
| Cleaning & Maintenance | 9 (52.9%) | 8 (47.1%) |
| Personal Care & Service | 0 (0.0%) | 7 (100.0%) |
| Total (Category) | 12 (34.3%) | 23 (65.7%) |
| Total (Overall) | 92 (60.1%) | 61 (39.9%) |
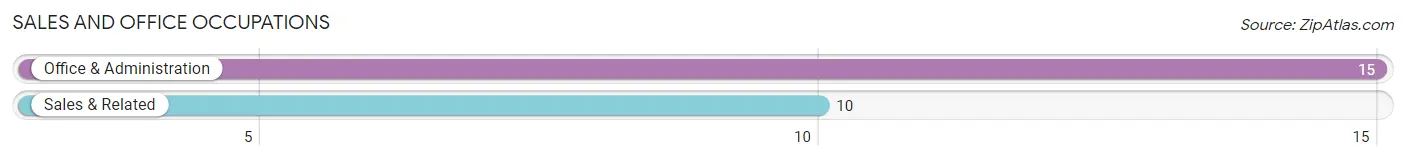
Sales and Office Occupations
The most common Sales and Office occupations in Moro are Office & Administration (15 | 9.8%), and Sales & Related (10 | 6.5%).
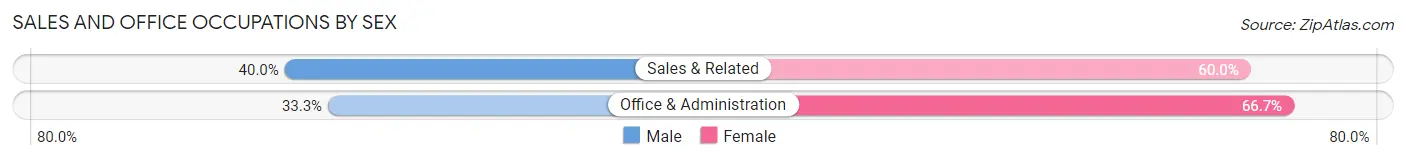
Sales and Office Occupations by Sex
| Occupation | Male | Female |
| Sales & Related | 4 (40.0%) | 6 (60.0%) |
| Office & Administration | 5 (33.3%) | 10 (66.7%) |
| Total (Category) | 9 (36.0%) | 16 (64.0%) |
| Total (Overall) | 92 (60.1%) | 61 (39.9%) |
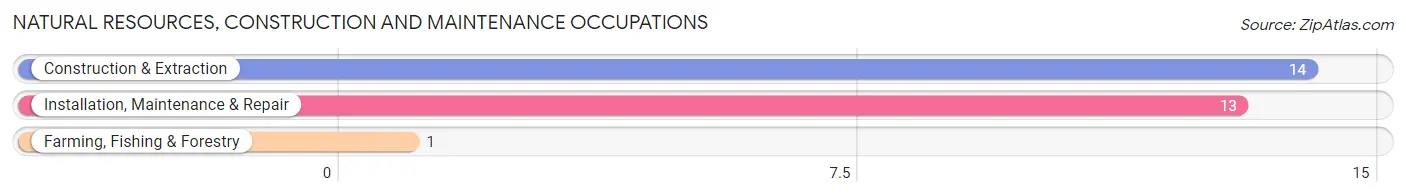
Natural Resources, Construction and Maintenance Occupations
The most common Natural Resources, Construction and Maintenance occupations in Moro are Construction & Extraction (14 | 9.1%), Installation, Maintenance & Repair (13 | 8.5%), and Farming, Fishing & Forestry (1 | 0.6%).
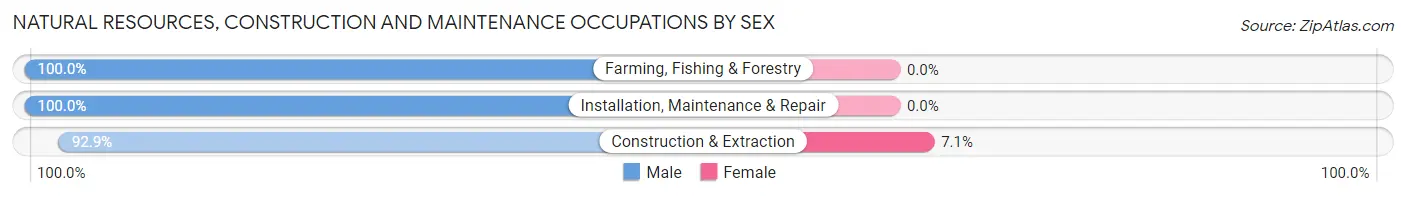
Natural Resources, Construction and Maintenance Occupations by Sex
| Occupation | Male | Female |
| Farming, Fishing & Forestry | 1 (100.0%) | 0 (0.0%) |
| Construction & Extraction | 13 (92.9%) | 1 (7.1%) |
| Installation, Maintenance & Repair | 13 (100.0%) | 0 (0.0%) |
| Total (Category) | 27 (96.4%) | 1 (3.6%) |
| Total (Overall) | 92 (60.1%) | 61 (39.9%) |
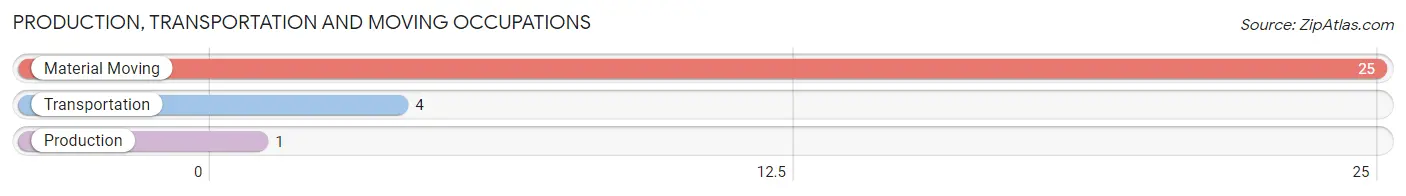
Production, Transportation and Moving Occupations
The most common Production, Transportation and Moving occupations in Moro are Material Moving (25 | 16.3%), Transportation (4 | 2.6%), and Production (1 | 0.6%).
Production, Transportation and Moving Occupations by Sex
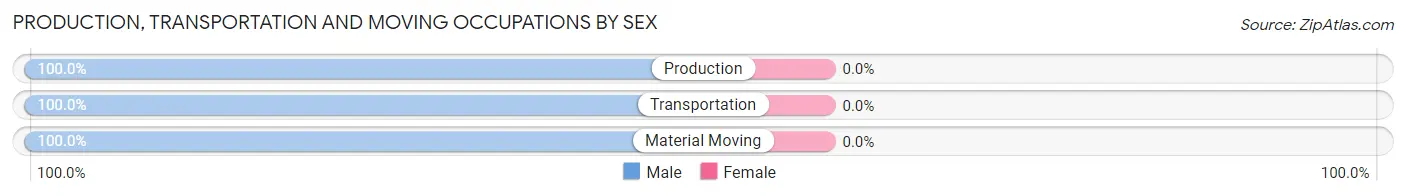
| Occupation | Male | Female |
| Production | 1 (100.0%) | 0 (0.0%) |
| Transportation | 4 (100.0%) | 0 (0.0%) |
| Material Moving | 25 (100.0%) | 0 (0.0%) |
| Total (Category) | 30 (100.0%) | 0 (0.0%) |
| Total (Overall) | 92 (60.1%) | 61 (39.9%) |
Employment Industries by Sex in Moro
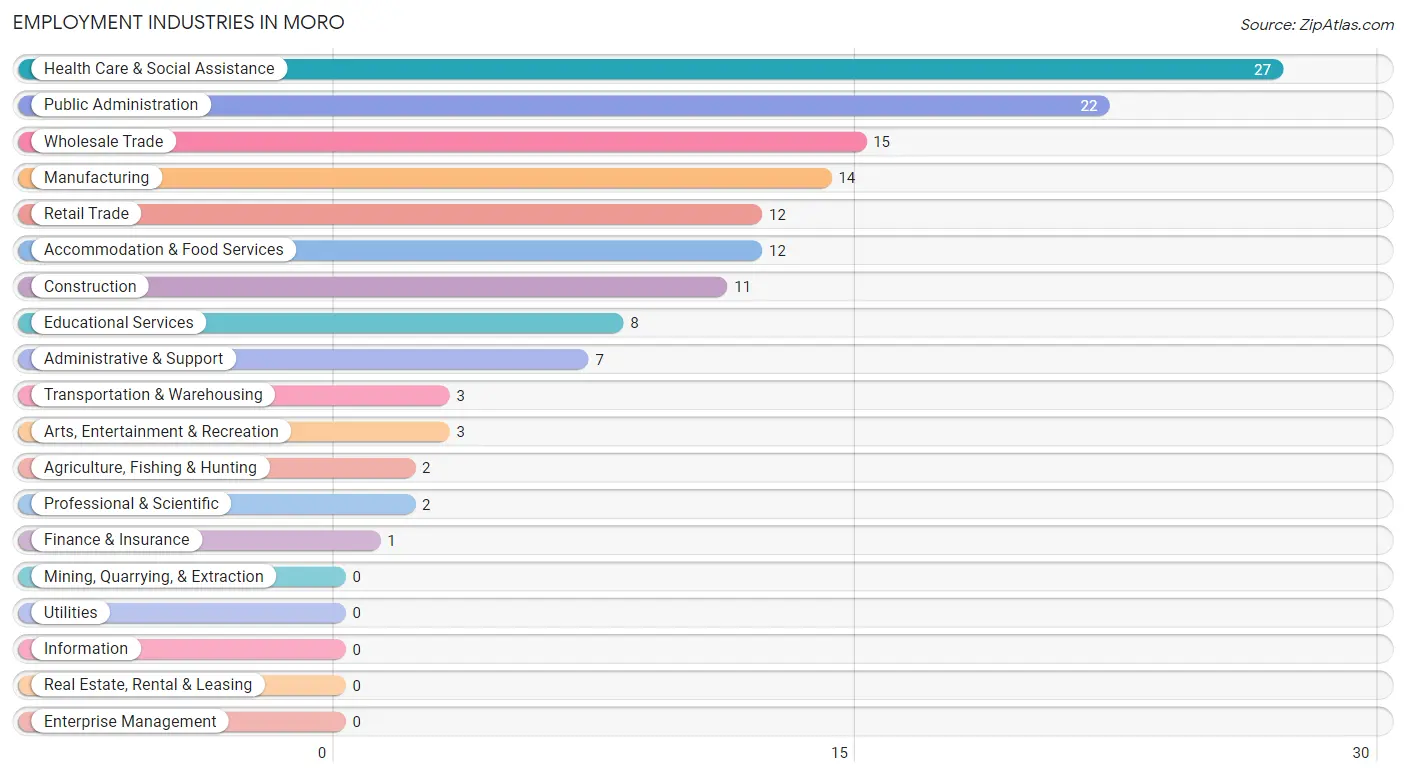
Employment Industries in Moro
The major employment industries in Moro include Health Care & Social Assistance (27 | 17.6%), Public Administration (22 | 14.4%), Wholesale Trade (15 | 9.8%), Manufacturing (14 | 9.1%), and Retail Trade (12 | 7.8%).
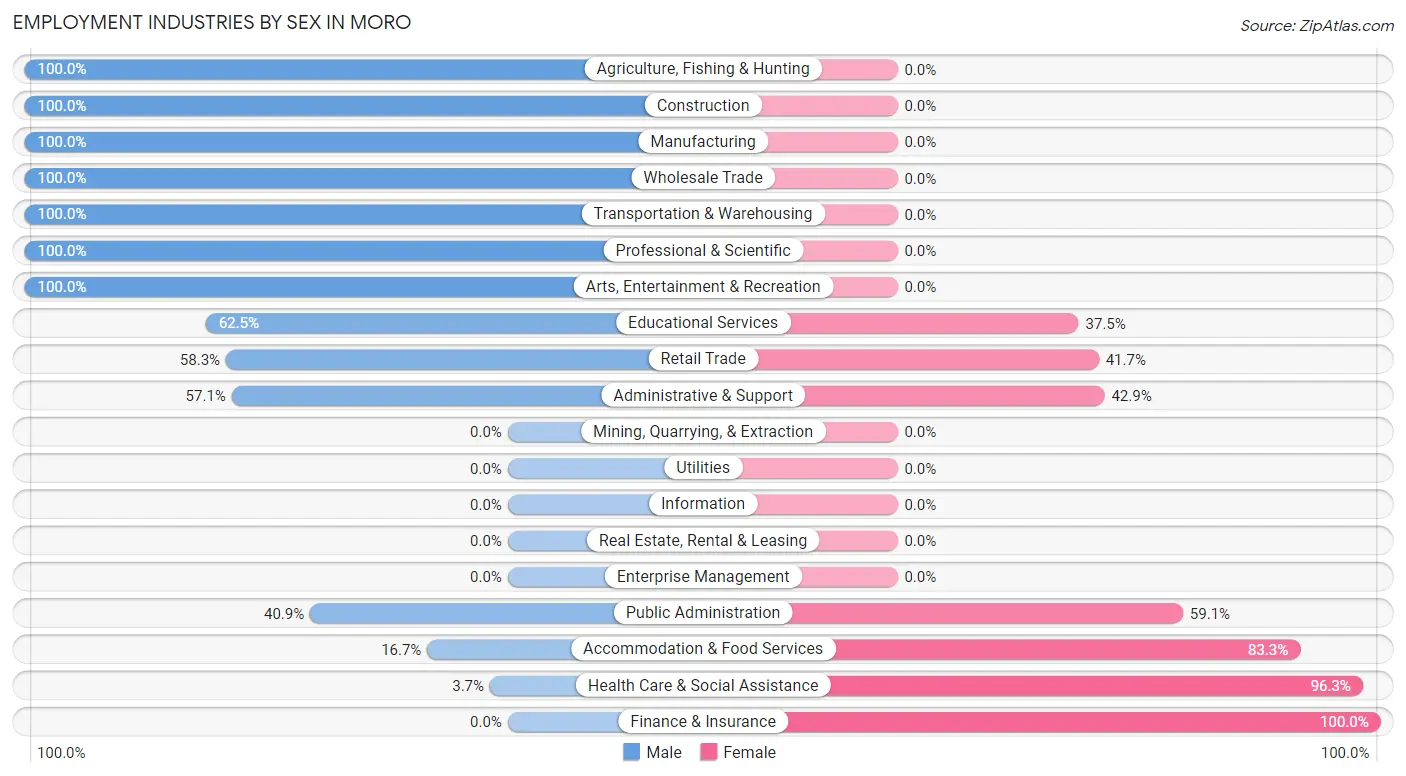
Employment Industries by Sex in Moro
The Moro industries that see more men than women are Agriculture, Fishing & Hunting (100.0%), Construction (100.0%), and Manufacturing (100.0%), whereas the industries that tend to have a higher number of women are Finance & Insurance (100.0%), Health Care & Social Assistance (96.3%), and Accommodation & Food Services (83.3%).
| Industry | Male | Female |
| Agriculture, Fishing & Hunting | 2 (100.0%) | 0 (0.0%) |
| Mining, Quarrying, & Extraction | 0 (0.0%) | 0 (0.0%) |
| Construction | 11 (100.0%) | 0 (0.0%) |
| Manufacturing | 14 (100.0%) | 0 (0.0%) |
| Wholesale Trade | 15 (100.0%) | 0 (0.0%) |
| Retail Trade | 7 (58.3%) | 5 (41.7%) |
| Transportation & Warehousing | 3 (100.0%) | 0 (0.0%) |
| Utilities | 0 (0.0%) | 0 (0.0%) |
| Information | 0 (0.0%) | 0 (0.0%) |
| Finance & Insurance | 0 (0.0%) | 1 (100.0%) |
| Real Estate, Rental & Leasing | 0 (0.0%) | 0 (0.0%) |
| Professional & Scientific | 2 (100.0%) | 0 (0.0%) |
| Enterprise Management | 0 (0.0%) | 0 (0.0%) |
| Administrative & Support | 4 (57.1%) | 3 (42.9%) |
| Educational Services | 5 (62.5%) | 3 (37.5%) |
| Health Care & Social Assistance | 1 (3.7%) | 26 (96.3%) |
| Arts, Entertainment & Recreation | 3 (100.0%) | 0 (0.0%) |
| Accommodation & Food Services | 2 (16.7%) | 10 (83.3%) |
| Public Administration | 9 (40.9%) | 13 (59.1%) |
| Total | 92 (60.1%) | 61 (39.9%) |
Education in Moro
School Enrollment in Moro
The most common levels of schooling among the 95 students in Moro are middle school (35 | 36.8%), high school (27 | 28.4%), and elementary school (14 | 14.7%).
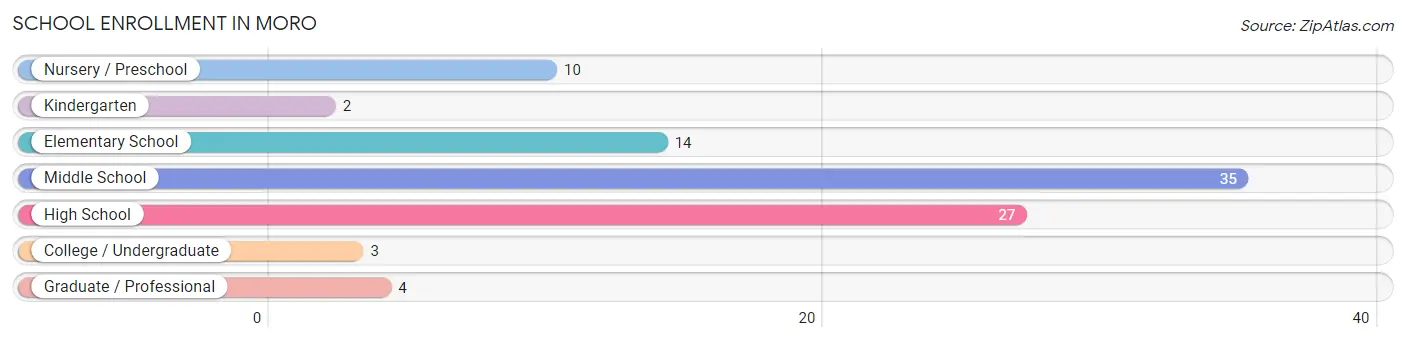
| School Level | # Students | % Students |
| Nursery / Preschool | 10 | 10.5% |
| Kindergarten | 2 | 2.1% |
| Elementary School | 14 | 14.7% |
| Middle School | 35 | 36.8% |
| High School | 27 | 28.4% |
| College / Undergraduate | 3 | 3.2% |
| Graduate / Professional | 4 | 4.2% |
| Total | 95 | 100.0% |
School Enrollment by Age by Funding Source in Moro
Out of a total of 95 students who are enrolled in schools in Moro, 7 (7.4%) attend a private institution, while the remaining 88 (92.6%) are enrolled in public schools. The age group of 3 to 4 year olds has the highest likelihood of being enrolled in private schools, with 4 (57.1% in the age bracket) enrolled. Conversely, the age group of 5 to 9 year old has the lowest likelihood of being enrolled in a private school, with 17 (100.0% in the age bracket) attending a public institution.
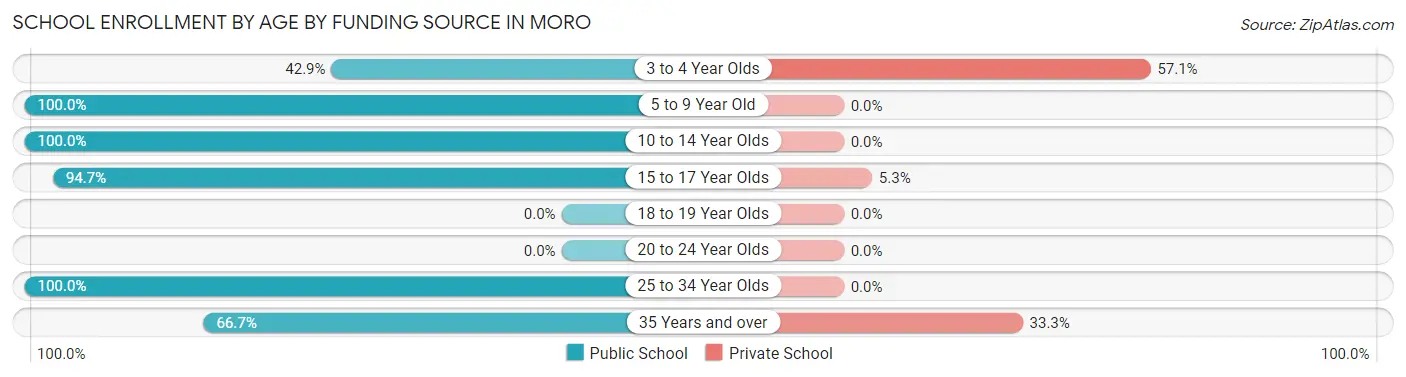
| Age Bracket | Public School | Private School |
| 3 to 4 Year Olds | 3 (42.9%) | 4 (57.1%) |
| 5 to 9 Year Old | 17 (100.0%) | 0 (0.0%) |
| 10 to 14 Year Olds | 45 (100.0%) | 0 (0.0%) |
| 15 to 17 Year Olds | 18 (94.7%) | 1 (5.3%) |
| 18 to 19 Year Olds | 0 (0.0%) | 0 (0.0%) |
| 20 to 24 Year Olds | 0 (0.0%) | 0 (0.0%) |
| 25 to 34 Year Olds | 1 (100.0%) | 0 (0.0%) |
| 35 Years and over | 4 (66.7%) | 2 (33.3%) |
| Total | 88 (92.6%) | 7 (7.4%) |
Educational Attainment by Field of Study in Moro
Education (7 | 18.4%), bio, nature & agricultural (6 | 15.8%), science & technology (5 | 13.2%), communications (5 | 13.2%), and arts & humanities (5 | 13.2%) are the most common fields of study among 38 individuals in Moro who have obtained a bachelor's degree or higher.
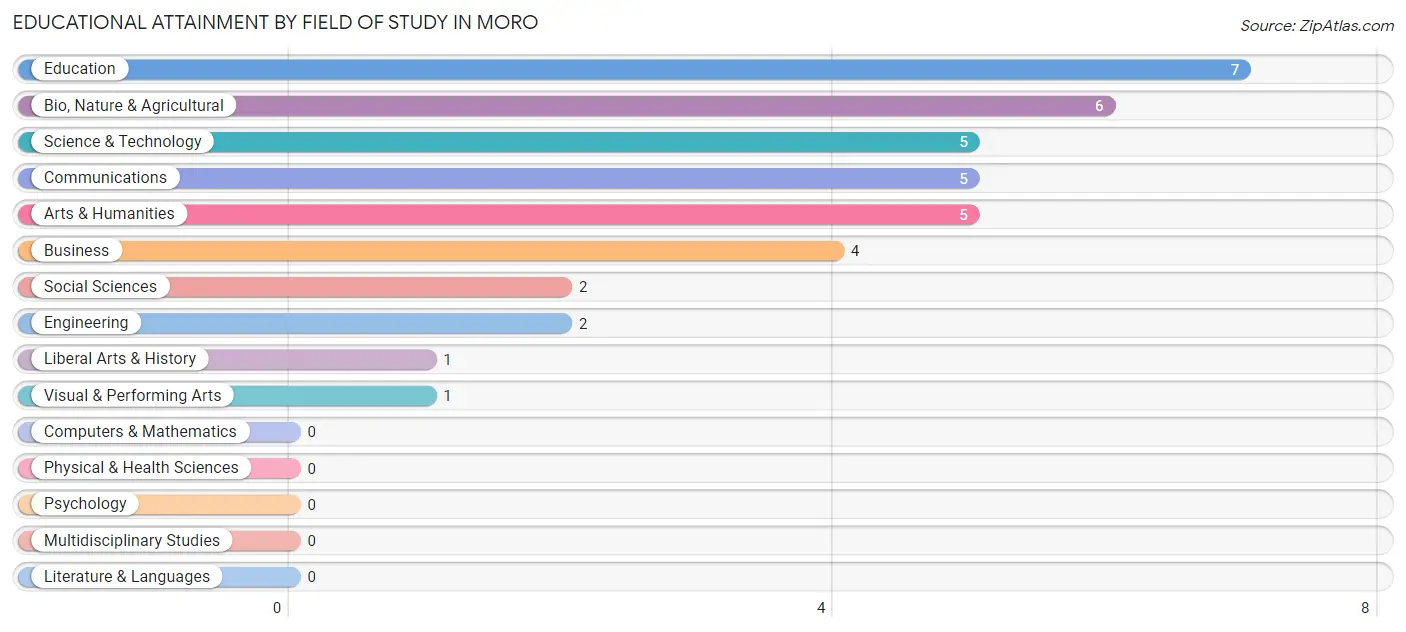
| Field of Study | # Graduates | % Graduates |
| Computers & Mathematics | 0 | 0.0% |
| Bio, Nature & Agricultural | 6 | 15.8% |
| Physical & Health Sciences | 0 | 0.0% |
| Psychology | 0 | 0.0% |
| Social Sciences | 2 | 5.3% |
| Engineering | 2 | 5.3% |
| Multidisciplinary Studies | 0 | 0.0% |
| Science & Technology | 5 | 13.2% |
| Business | 4 | 10.5% |
| Education | 7 | 18.4% |
| Literature & Languages | 0 | 0.0% |
| Liberal Arts & History | 1 | 2.6% |
| Visual & Performing Arts | 1 | 2.6% |
| Communications | 5 | 13.2% |
| Arts & Humanities | 5 | 13.2% |
| Total | 38 | 100.0% |
Transportation & Commute in Moro
Vehicle Availability by Sex in Moro
The most prevalent vehicle ownership categories in Moro are males with 3 vehicles (32, accounting for 35.6%) and females with 3 vehicles (26, making up 53.3%).
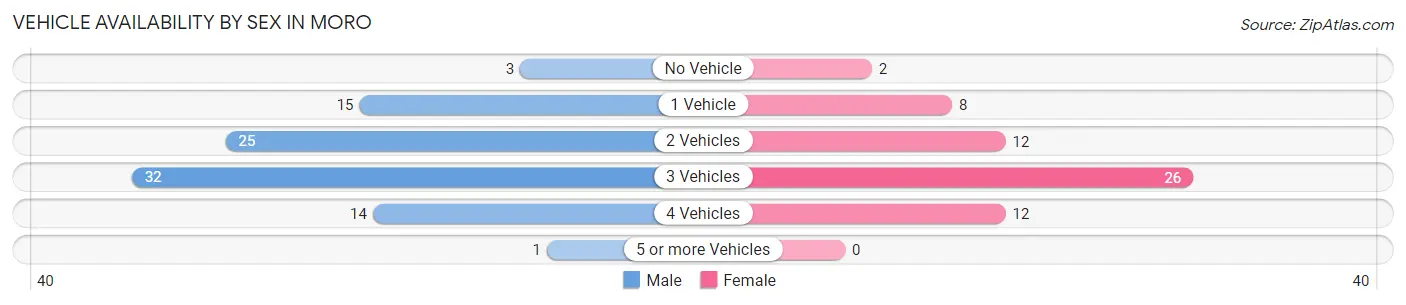
| Vehicles Available | Male | Female |
| No Vehicle | 3 (3.3%) | 2 (3.3%) |
| 1 Vehicle | 15 (16.7%) | 8 (13.3%) |
| 2 Vehicles | 25 (27.8%) | 12 (20.0%) |
| 3 Vehicles | 32 (35.6%) | 26 (43.3%) |
| 4 Vehicles | 14 (15.6%) | 12 (20.0%) |
| 5 or more Vehicles | 1 (1.1%) | 0 (0.0%) |
| Total | 90 (100.0%) | 60 (100.0%) |
Commute Time in Moro
The most frequently occuring commute durations in Moro are 5 to 9 minutes (52 commuters, 39.7%), less than 5 minutes (30 commuters, 22.9%), and 20 to 24 minutes (15 commuters, 11.5%).
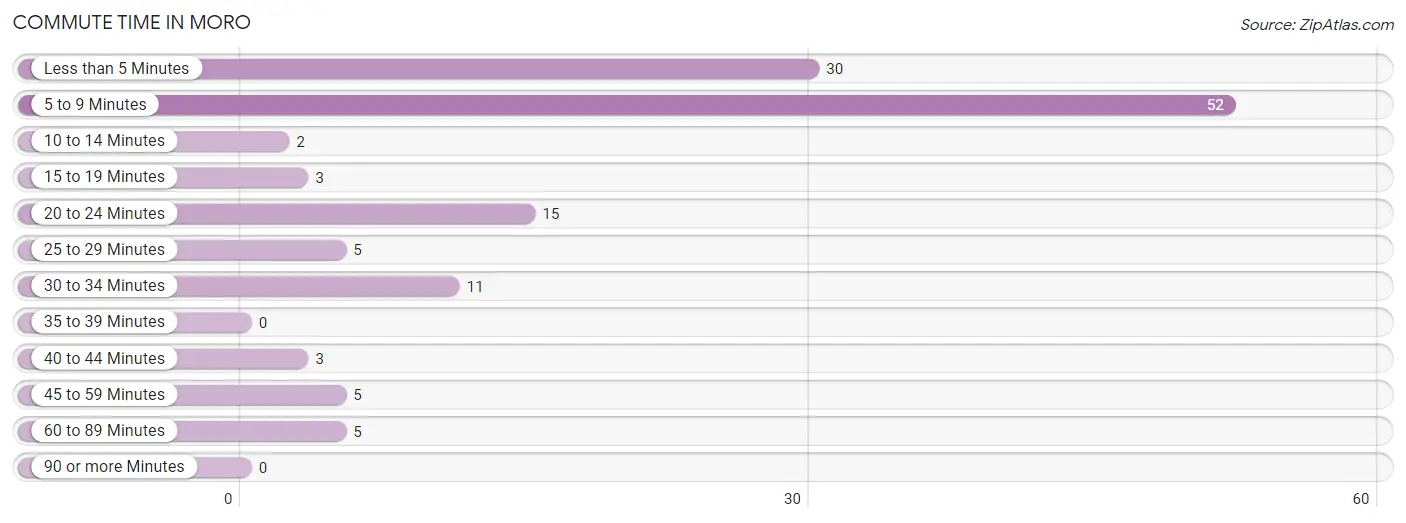
| Commute Time | # Commuters | % Commuters |
| Less than 5 Minutes | 30 | 22.9% |
| 5 to 9 Minutes | 52 | 39.7% |
| 10 to 14 Minutes | 2 | 1.5% |
| 15 to 19 Minutes | 3 | 2.3% |
| 20 to 24 Minutes | 15 | 11.5% |
| 25 to 29 Minutes | 5 | 3.8% |
| 30 to 34 Minutes | 11 | 8.4% |
| 35 to 39 Minutes | 0 | 0.0% |
| 40 to 44 Minutes | 3 | 2.3% |
| 45 to 59 Minutes | 5 | 3.8% |
| 60 to 89 Minutes | 5 | 3.8% |
| 90 or more Minutes | 0 | 0.0% |
Commute Time by Sex in Moro
The most common commute times in Moro are 5 to 9 minutes (44 commuters, 53.0%) for males and less than 5 minutes (16 commuters, 33.3%) for females.
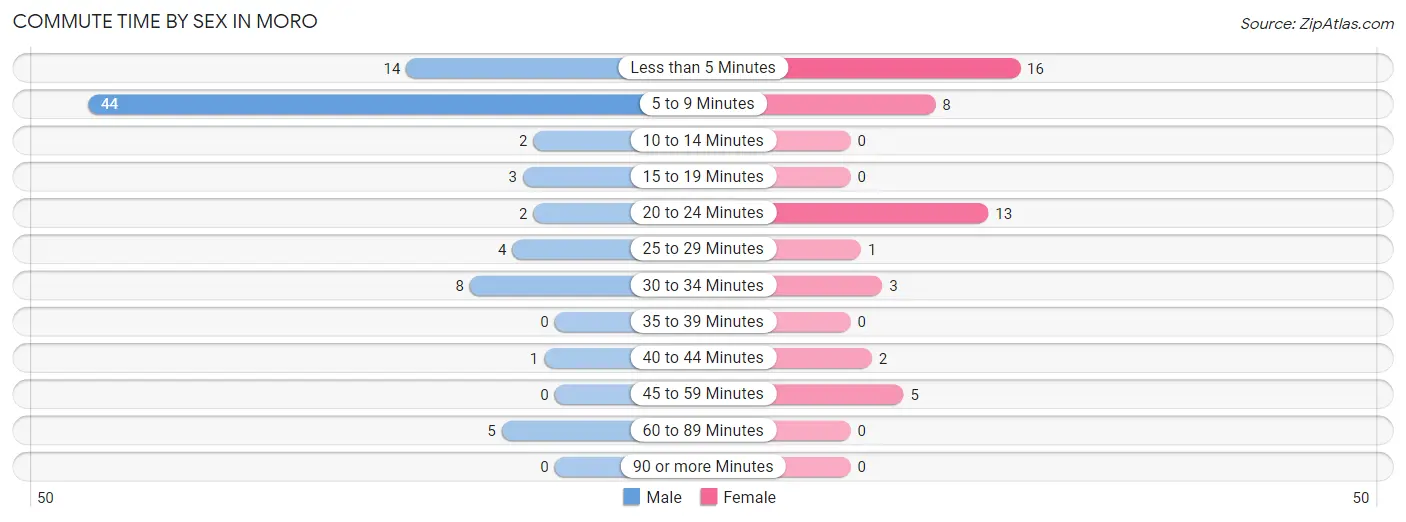
| Commute Time | Male | Female |
| Less than 5 Minutes | 14 (16.9%) | 16 (33.3%) |
| 5 to 9 Minutes | 44 (53.0%) | 8 (16.7%) |
| 10 to 14 Minutes | 2 (2.4%) | 0 (0.0%) |
| 15 to 19 Minutes | 3 (3.6%) | 0 (0.0%) |
| 20 to 24 Minutes | 2 (2.4%) | 13 (27.1%) |
| 25 to 29 Minutes | 4 (4.8%) | 1 (2.1%) |
| 30 to 34 Minutes | 8 (9.6%) | 3 (6.2%) |
| 35 to 39 Minutes | 0 (0.0%) | 0 (0.0%) |
| 40 to 44 Minutes | 1 (1.2%) | 2 (4.2%) |
| 45 to 59 Minutes | 0 (0.0%) | 5 (10.4%) |
| 60 to 89 Minutes | 5 (6.0%) | 0 (0.0%) |
| 90 or more Minutes | 0 (0.0%) | 0 (0.0%) |
Time of Departure to Work by Sex in Moro
The most frequent times of departure to work in Moro are 12:00 PM to 3:59 PM (18, 21.7%) for males and 7:30 AM to 7:59 AM (11, 22.9%) for females.
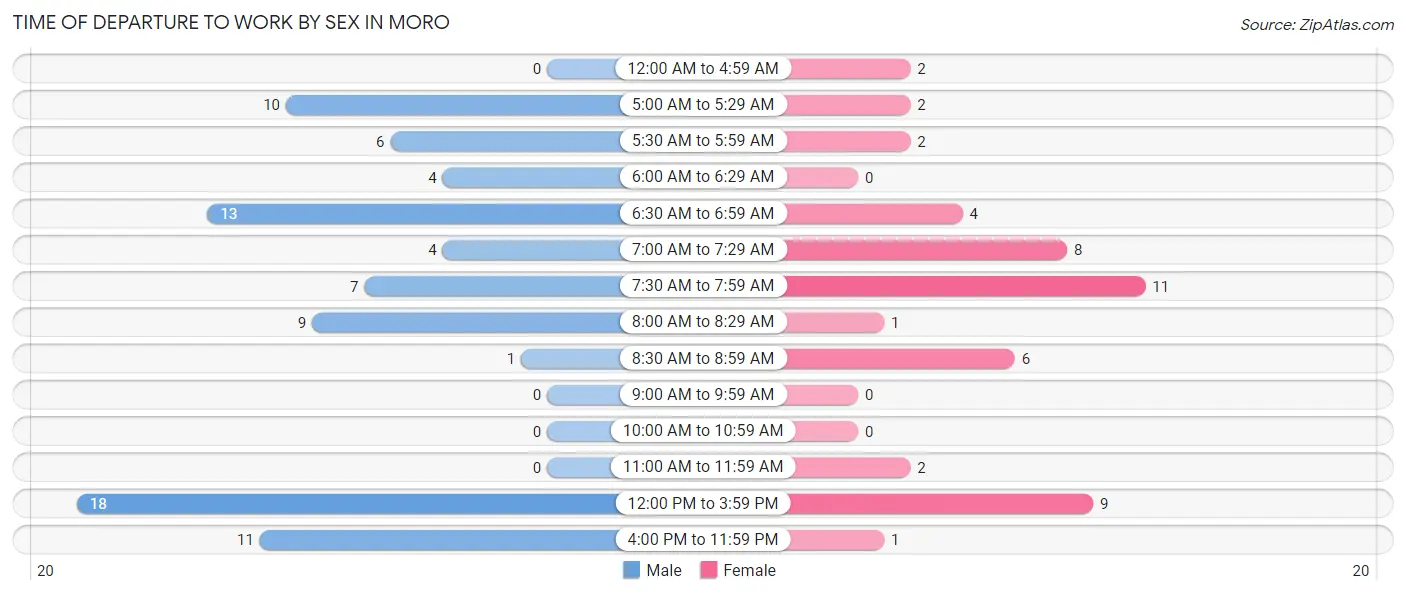
| Time of Departure | Male | Female |
| 12:00 AM to 4:59 AM | 0 (0.0%) | 2 (4.2%) |
| 5:00 AM to 5:29 AM | 10 (12.0%) | 2 (4.2%) |
| 5:30 AM to 5:59 AM | 6 (7.2%) | 2 (4.2%) |
| 6:00 AM to 6:29 AM | 4 (4.8%) | 0 (0.0%) |
| 6:30 AM to 6:59 AM | 13 (15.7%) | 4 (8.3%) |
| 7:00 AM to 7:29 AM | 4 (4.8%) | 8 (16.7%) |
| 7:30 AM to 7:59 AM | 7 (8.4%) | 11 (22.9%) |
| 8:00 AM to 8:29 AM | 9 (10.8%) | 1 (2.1%) |
| 8:30 AM to 8:59 AM | 1 (1.2%) | 6 (12.5%) |
| 9:00 AM to 9:59 AM | 0 (0.0%) | 0 (0.0%) |
| 10:00 AM to 10:59 AM | 0 (0.0%) | 0 (0.0%) |
| 11:00 AM to 11:59 AM | 0 (0.0%) | 2 (4.2%) |
| 12:00 PM to 3:59 PM | 18 (21.7%) | 9 (18.8%) |
| 4:00 PM to 11:59 PM | 11 (13.3%) | 1 (2.1%) |
| Total | 83 (100.0%) | 48 (100.0%) |
Housing Occupancy in Moro
Occupancy by Ownership in Moro
Of the total 137 dwellings in Moro, owner-occupied units account for 79 (57.7%), while renter-occupied units make up 58 (42.3%).
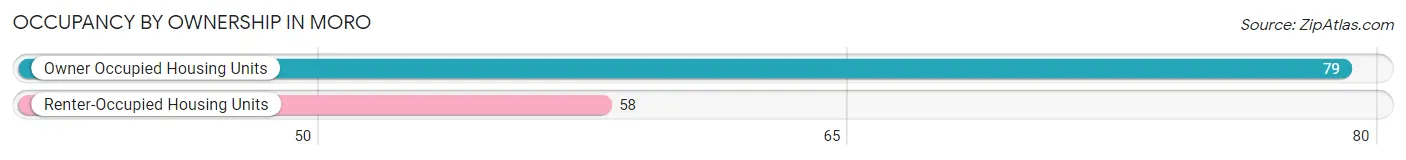
| Occupancy | # Housing Units | % Housing Units |
| Owner Occupied Housing Units | 79 | 57.7% |
| Renter-Occupied Housing Units | 58 | 42.3% |
| Total Occupied Housing Units | 137 | 100.0% |
Occupancy by Household Size in Moro
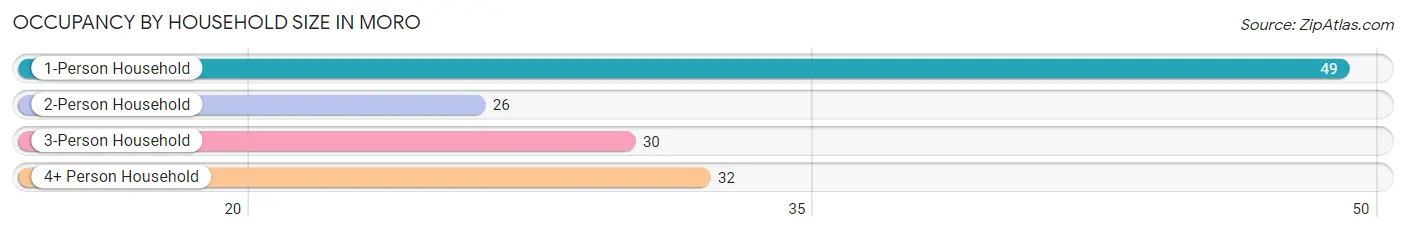
| Household Size | # Housing Units | % Housing Units |
| 1-Person Household | 49 | 35.8% |
| 2-Person Household | 26 | 19.0% |
| 3-Person Household | 30 | 21.9% |
| 4+ Person Household | 32 | 23.4% |
| Total Housing Units | 137 | 100.0% |
Occupancy by Ownership by Household Size in Moro
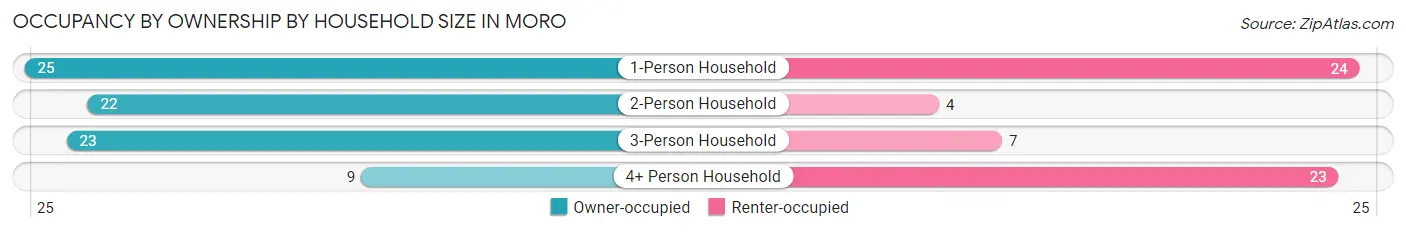
| Household Size | Owner-occupied | Renter-occupied |
| 1-Person Household | 25 (51.0%) | 24 (49.0%) |
| 2-Person Household | 22 (84.6%) | 4 (15.4%) |
| 3-Person Household | 23 (76.7%) | 7 (23.3%) |
| 4+ Person Household | 9 (28.1%) | 23 (71.9%) |
| Total Housing Units | 79 (57.7%) | 58 (42.3%) |
Occupancy by Educational Attainment in Moro
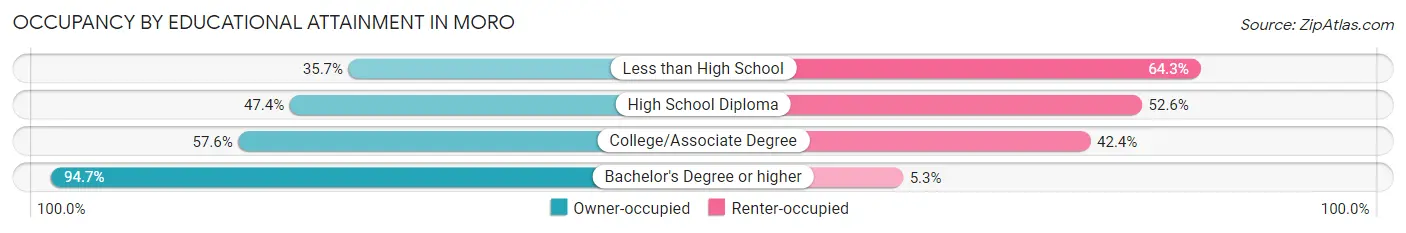
| Household Size | Owner-occupied | Renter-occupied |
| Less than High School | 5 (35.7%) | 9 (64.3%) |
| High School Diploma | 18 (47.4%) | 20 (52.6%) |
| College/Associate Degree | 38 (57.6%) | 28 (42.4%) |
| Bachelor's Degree or higher | 18 (94.7%) | 1 (5.3%) |
Occupancy by Age of Householder in Moro
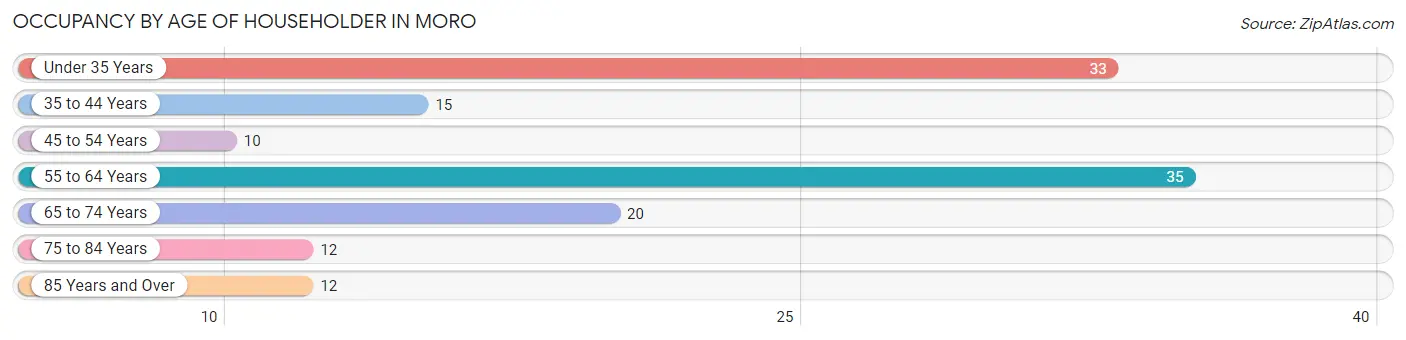
| Age Bracket | # Households | % Households |
| Under 35 Years | 33 | 24.1% |
| 35 to 44 Years | 15 | 11.0% |
| 45 to 54 Years | 10 | 7.3% |
| 55 to 64 Years | 35 | 25.6% |
| 65 to 74 Years | 20 | 14.6% |
| 75 to 84 Years | 12 | 8.8% |
| 85 Years and Over | 12 | 8.8% |
| Total | 137 | 100.0% |
Housing Finances in Moro
Median Income by Occupancy in Moro
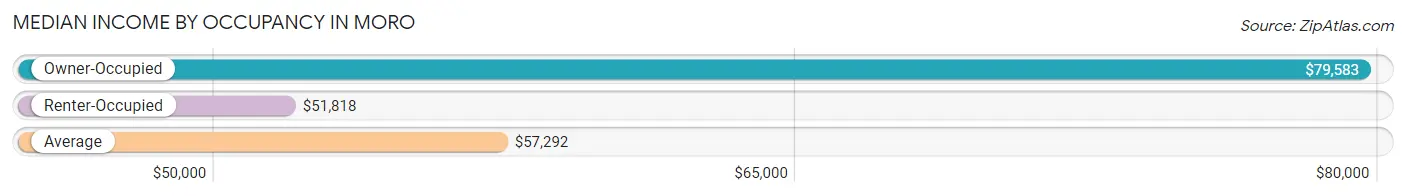
| Occupancy Type | # Households | Median Income |
| Owner-Occupied | 79 (57.7%) | $79,583 |
| Renter-Occupied | 58 (42.3%) | $51,818 |
| Average | 137 (100.0%) | $57,292 |
Occupancy by Householder Income Bracket in Moro
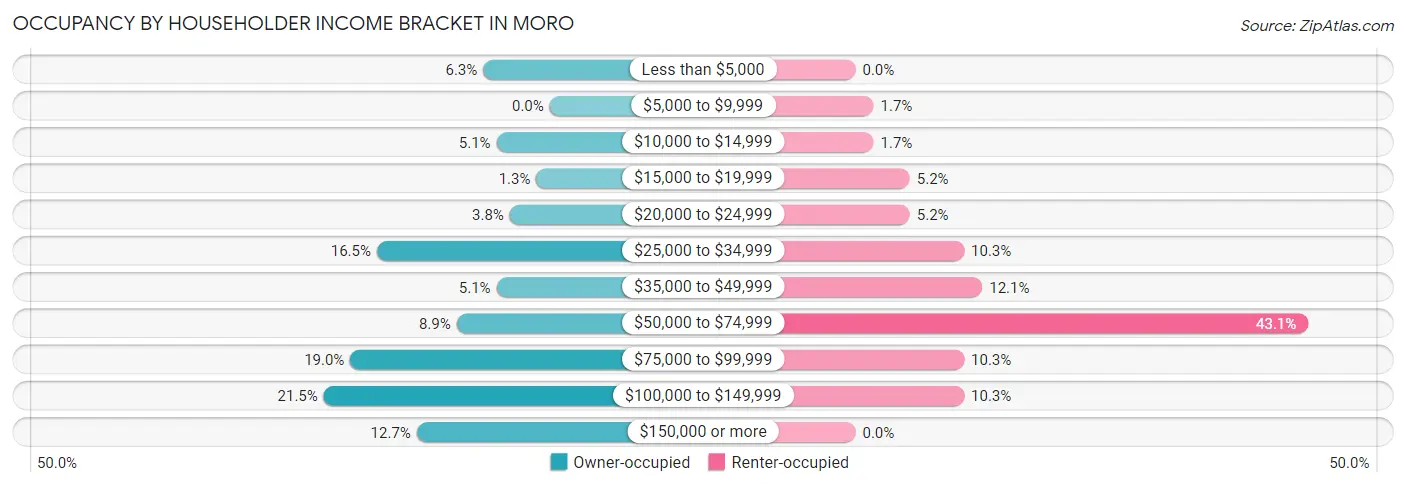
| Income Bracket | Owner-occupied | Renter-occupied |
| Less than $5,000 | 5 (6.3%) | 0 (0.0%) |
| $5,000 to $9,999 | 0 (0.0%) | 1 (1.7%) |
| $10,000 to $14,999 | 4 (5.1%) | 1 (1.7%) |
| $15,000 to $19,999 | 1 (1.3%) | 3 (5.2%) |
| $20,000 to $24,999 | 3 (3.8%) | 3 (5.2%) |
| $25,000 to $34,999 | 13 (16.5%) | 6 (10.3%) |
| $35,000 to $49,999 | 4 (5.1%) | 7 (12.1%) |
| $50,000 to $74,999 | 7 (8.9%) | 25 (43.1%) |
| $75,000 to $99,999 | 15 (19.0%) | 6 (10.3%) |
| $100,000 to $149,999 | 17 (21.5%) | 6 (10.3%) |
| $150,000 or more | 10 (12.7%) | 0 (0.0%) |
| Total | 79 (100.0%) | 58 (100.0%) |
Monthly Housing Cost Tiers in Moro
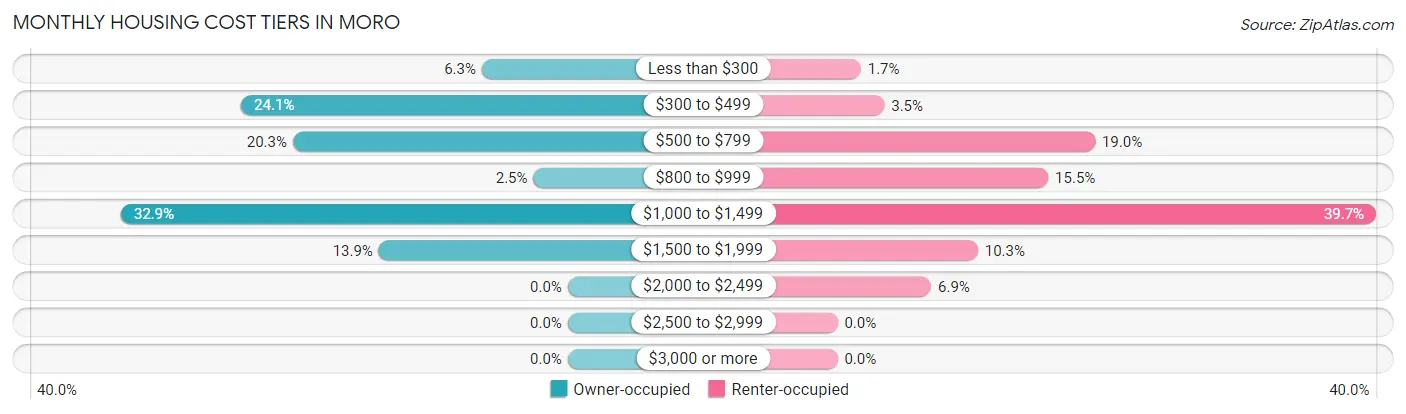
| Monthly Cost | Owner-occupied | Renter-occupied |
| Less than $300 | 5 (6.3%) | 1 (1.7%) |
| $300 to $499 | 19 (24.0%) | 2 (3.5%) |
| $500 to $799 | 16 (20.3%) | 11 (19.0%) |
| $800 to $999 | 2 (2.5%) | 9 (15.5%) |
| $1,000 to $1,499 | 26 (32.9%) | 23 (39.7%) |
| $1,500 to $1,999 | 11 (13.9%) | 6 (10.3%) |
| $2,000 to $2,499 | 0 (0.0%) | 4 (6.9%) |
| $2,500 to $2,999 | 0 (0.0%) | 0 (0.0%) |
| $3,000 or more | 0 (0.0%) | 0 (0.0%) |
| Total | 79 (100.0%) | 58 (100.0%) |
Physical Housing Characteristics in Moro
Housing Structures in Moro
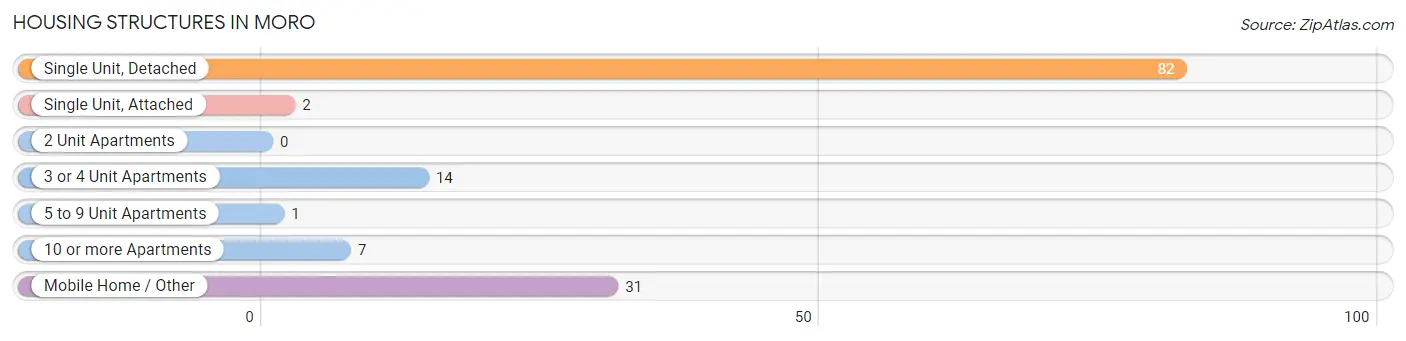
| Structure Type | # Housing Units | % Housing Units |
| Single Unit, Detached | 82 | 59.9% |
| Single Unit, Attached | 2 | 1.5% |
| 2 Unit Apartments | 0 | 0.0% |
| 3 or 4 Unit Apartments | 14 | 10.2% |
| 5 to 9 Unit Apartments | 1 | 0.7% |
| 10 or more Apartments | 7 | 5.1% |
| Mobile Home / Other | 31 | 22.6% |
| Total | 137 | 100.0% |
Housing Structures by Occupancy in Moro
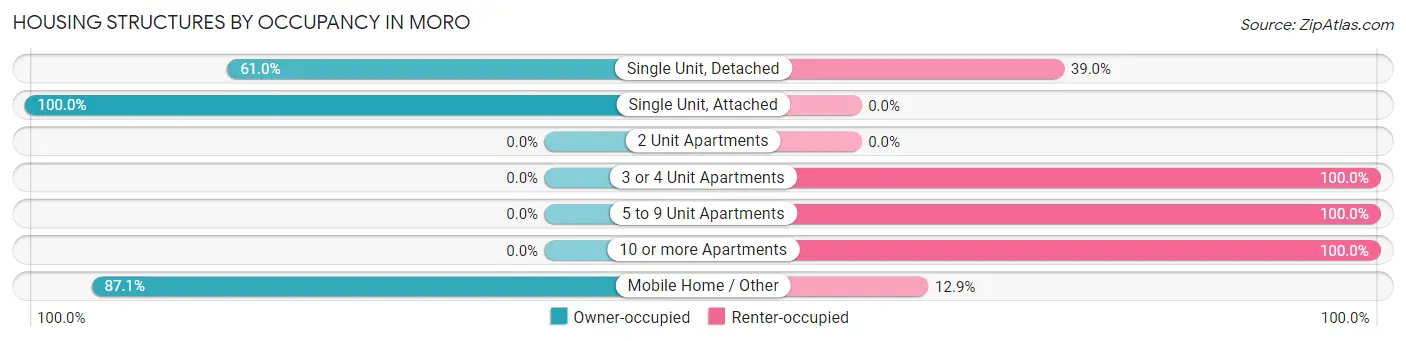
| Structure Type | Owner-occupied | Renter-occupied |
| Single Unit, Detached | 50 (61.0%) | 32 (39.0%) |
| Single Unit, Attached | 2 (100.0%) | 0 (0.0%) |
| 2 Unit Apartments | 0 (0.0%) | 0 (0.0%) |
| 3 or 4 Unit Apartments | 0 (0.0%) | 14 (100.0%) |
| 5 to 9 Unit Apartments | 0 (0.0%) | 1 (100.0%) |
| 10 or more Apartments | 0 (0.0%) | 7 (100.0%) |
| Mobile Home / Other | 27 (87.1%) | 4 (12.9%) |
| Total | 79 (57.7%) | 58 (42.3%) |
Housing Structures by Number of Rooms in Moro
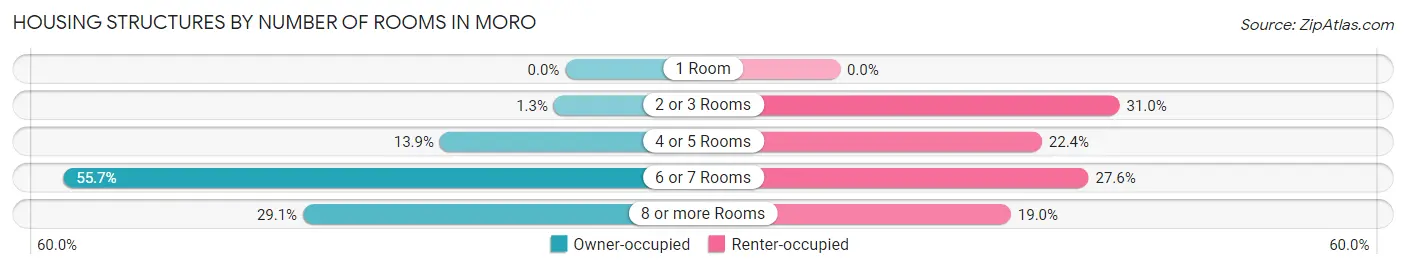
| Number of Rooms | Owner-occupied | Renter-occupied |
| 1 Room | 0 (0.0%) | 0 (0.0%) |
| 2 or 3 Rooms | 1 (1.3%) | 18 (31.0%) |
| 4 or 5 Rooms | 11 (13.9%) | 13 (22.4%) |
| 6 or 7 Rooms | 44 (55.7%) | 16 (27.6%) |
| 8 or more Rooms | 23 (29.1%) | 11 (19.0%) |
| Total | 79 (100.0%) | 58 (100.0%) |
Housing Structure by Heating Type in Moro
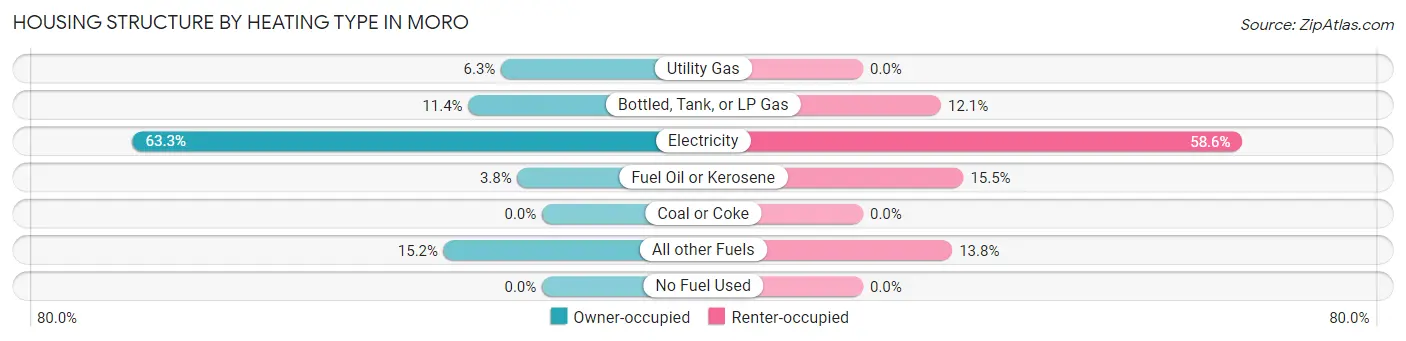
| Heating Type | Owner-occupied | Renter-occupied |
| Utility Gas | 5 (6.3%) | 0 (0.0%) |
| Bottled, Tank, or LP Gas | 9 (11.4%) | 7 (12.1%) |
| Electricity | 50 (63.3%) | 34 (58.6%) |
| Fuel Oil or Kerosene | 3 (3.8%) | 9 (15.5%) |
| Coal or Coke | 0 (0.0%) | 0 (0.0%) |
| All other Fuels | 12 (15.2%) | 8 (13.8%) |
| No Fuel Used | 0 (0.0%) | 0 (0.0%) |
| Total | 79 (100.0%) | 58 (100.0%) |
Household Vehicle Usage in Moro
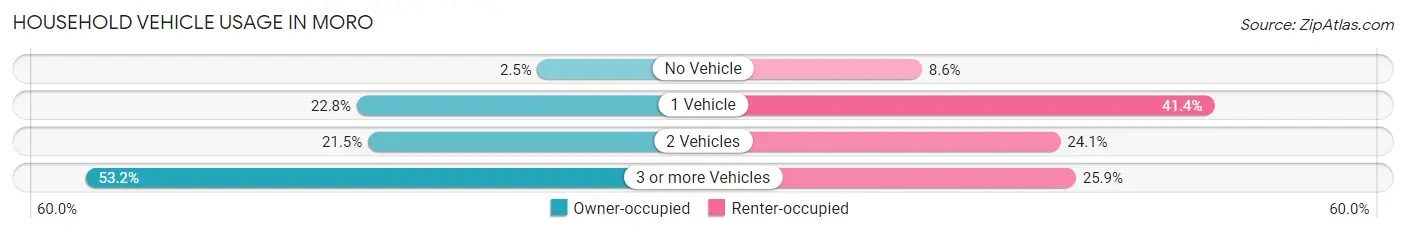
| Vehicles per Household | Owner-occupied | Renter-occupied |
| No Vehicle | 2 (2.5%) | 5 (8.6%) |
| 1 Vehicle | 18 (22.8%) | 24 (41.4%) |
| 2 Vehicles | 17 (21.5%) | 14 (24.1%) |
| 3 or more Vehicles | 42 (53.2%) | 15 (25.9%) |
| Total | 79 (100.0%) | 58 (100.0%) |
Real Estate & Mortgages in Moro
Real Estate and Mortgage Overview in Moro
| Characteristic | Without Mortgage | With Mortgage |
| Housing Units | 38 | 41 |
| Median Property Value | $170,000 | $203,600 |
| Median Household Income | $78,333 | $9 |
| Monthly Housing Costs | $460 | $0 |
| Real Estate Taxes | $1,708 | $1 |
Property Value by Mortgage Status in Moro
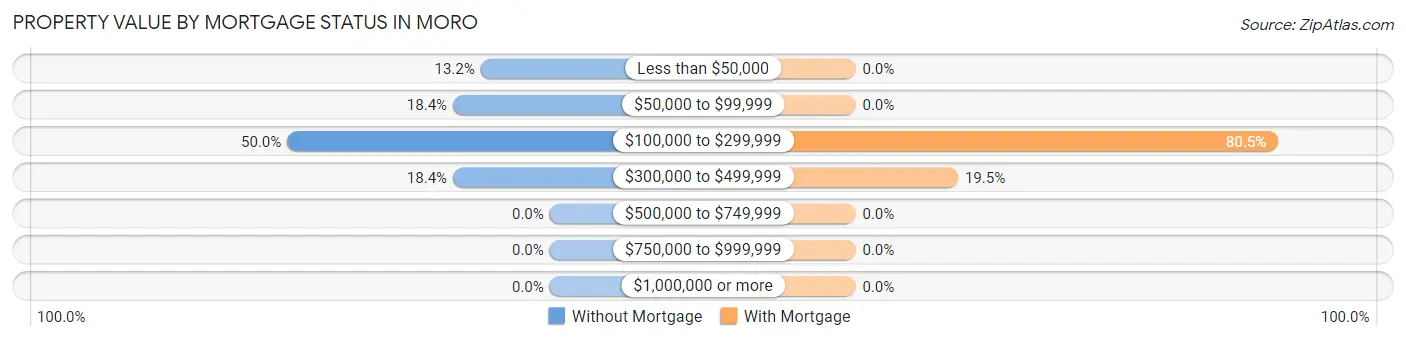
| Property Value | Without Mortgage | With Mortgage |
| Less than $50,000 | 5 (13.2%) | 0 (0.0%) |
| $50,000 to $99,999 | 7 (18.4%) | 0 (0.0%) |
| $100,000 to $299,999 | 19 (50.0%) | 33 (80.5%) |
| $300,000 to $499,999 | 7 (18.4%) | 8 (19.5%) |
| $500,000 to $749,999 | 0 (0.0%) | 0 (0.0%) |
| $750,000 to $999,999 | 0 (0.0%) | 0 (0.0%) |
| $1,000,000 or more | 0 (0.0%) | 0 (0.0%) |
| Total | 38 (100.0%) | 41 (100.0%) |
Household Income by Mortgage Status in Moro
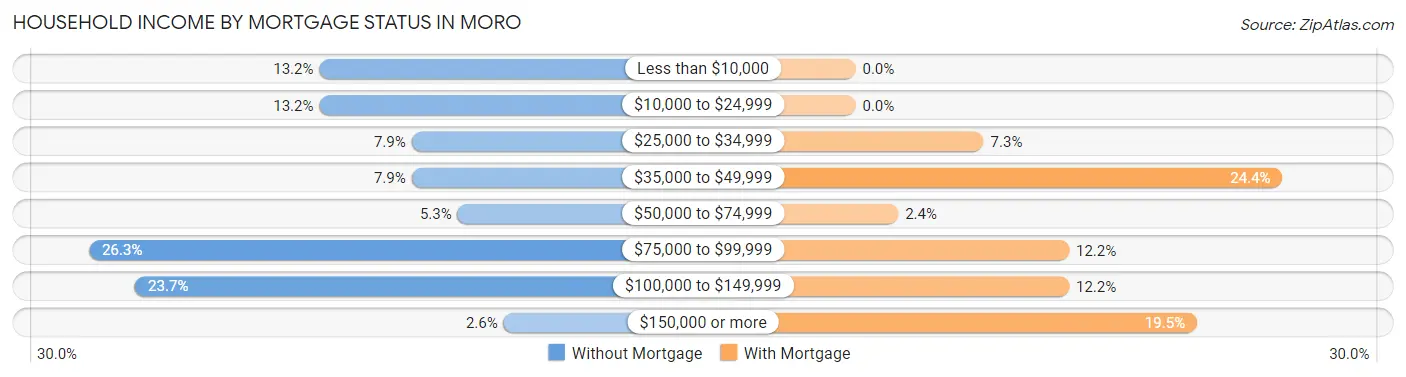
| Household Income | Without Mortgage | With Mortgage |
| Less than $10,000 | 5 (13.2%) | 0 (0.0%) |
| $10,000 to $24,999 | 5 (13.2%) | 0 (0.0%) |
| $25,000 to $34,999 | 3 (7.9%) | 3 (7.3%) |
| $35,000 to $49,999 | 3 (7.9%) | 10 (24.4%) |
| $50,000 to $74,999 | 2 (5.3%) | 1 (2.4%) |
| $75,000 to $99,999 | 10 (26.3%) | 5 (12.2%) |
| $100,000 to $149,999 | 9 (23.7%) | 5 (12.2%) |
| $150,000 or more | 1 (2.6%) | 8 (19.5%) |
| Total | 38 (100.0%) | 41 (100.0%) |
Property Value to Household Income Ratio in Moro
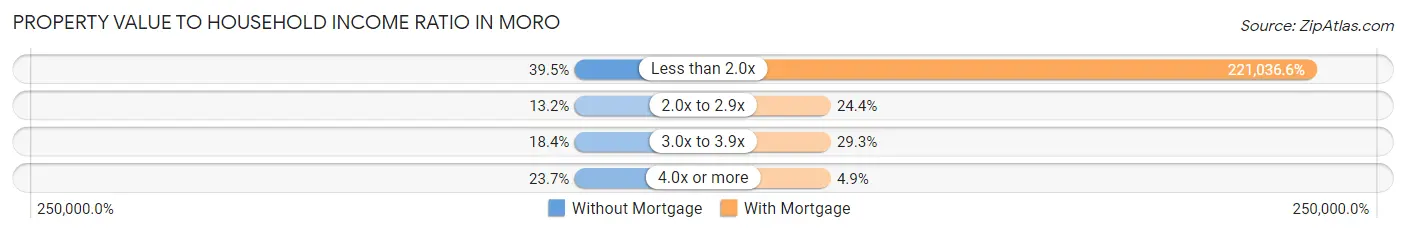
| Value-to-Income Ratio | Without Mortgage | With Mortgage |
| Less than 2.0x | 15 (39.5%) | 90,625 (221,036.6%) |
| 2.0x to 2.9x | 5 (13.2%) | 10 (24.4%) |
| 3.0x to 3.9x | 7 (18.4%) | 12 (29.3%) |
| 4.0x or more | 9 (23.7%) | 2 (4.9%) |
| Total | 38 (100.0%) | 41 (100.0%) |
Real Estate Taxes by Mortgage Status in Moro
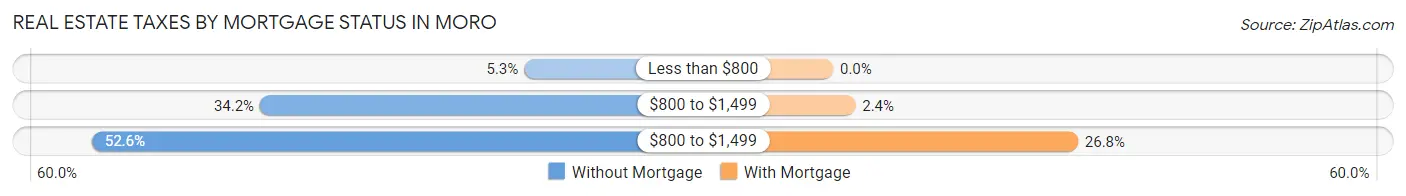
| Property Taxes | Without Mortgage | With Mortgage |
| Less than $800 | 2 (5.3%) | 0 (0.0%) |
| $800 to $1,499 | 13 (34.2%) | 1 (2.4%) |
| $800 to $1,499 | 20 (52.6%) | 11 (26.8%) |
| Total | 38 (100.0%) | 41 (100.0%) |
Health & Disability in Moro
Health Insurance Coverage by Age in Moro
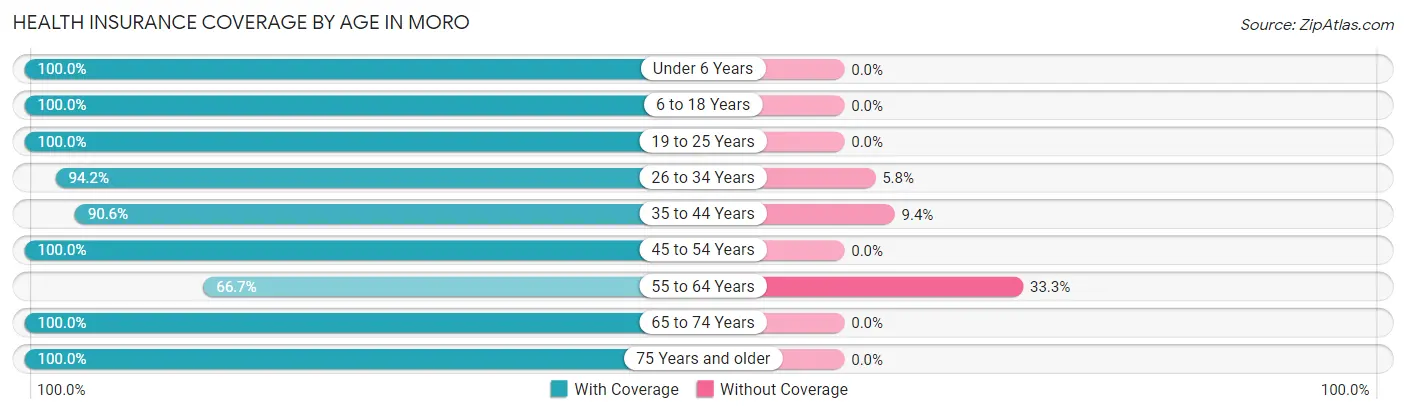
| Age Bracket | With Coverage | Without Coverage |
| Under 6 Years | 44 (100.0%) | 0 (0.0%) |
| 6 to 18 Years | 81 (100.0%) | 0 (0.0%) |
| 19 to 25 Years | 17 (100.0%) | 0 (0.0%) |
| 26 to 34 Years | 49 (94.2%) | 3 (5.8%) |
| 35 to 44 Years | 29 (90.6%) | 3 (9.4%) |
| 45 to 54 Years | 17 (100.0%) | 0 (0.0%) |
| 55 to 64 Years | 44 (66.7%) | 22 (33.3%) |
| 65 to 74 Years | 28 (100.0%) | 0 (0.0%) |
| 75 Years and older | 28 (100.0%) | 0 (0.0%) |
| Total | 337 (92.3%) | 28 (7.7%) |
Health Insurance Coverage by Citizenship Status in Moro
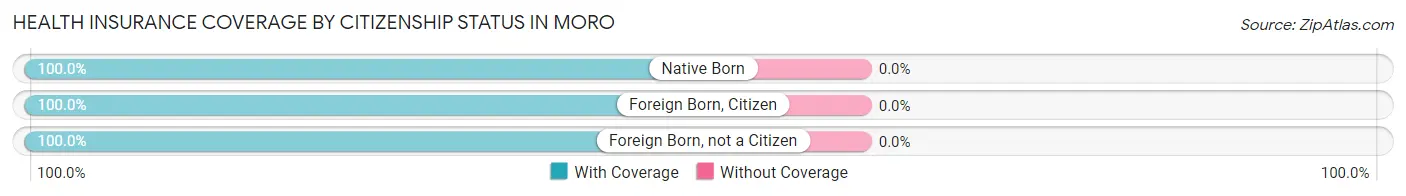
| Citizenship Status | With Coverage | Without Coverage |
| Native Born | 44 (100.0%) | 0 (0.0%) |
| Foreign Born, Citizen | 81 (100.0%) | 0 (0.0%) |
| Foreign Born, not a Citizen | 17 (100.0%) | 0 (0.0%) |
Health Insurance Coverage by Household Income in Moro
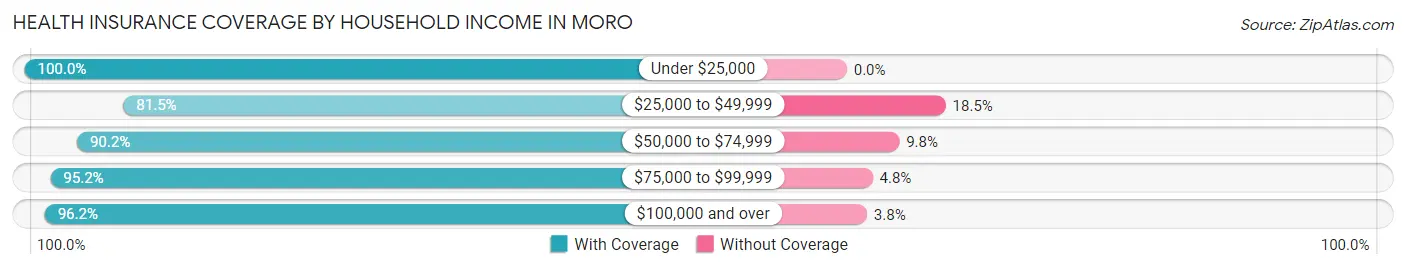
| Household Income | With Coverage | Without Coverage |
| Under $25,000 | 31 (100.0%) | 0 (0.0%) |
| $25,000 to $49,999 | 44 (81.5%) | 10 (18.5%) |
| $50,000 to $74,999 | 101 (90.2%) | 11 (9.8%) |
| $75,000 to $99,999 | 59 (95.2%) | 3 (4.8%) |
| $100,000 and over | 102 (96.2%) | 4 (3.8%) |
Public vs Private Health Insurance Coverage by Age in Moro
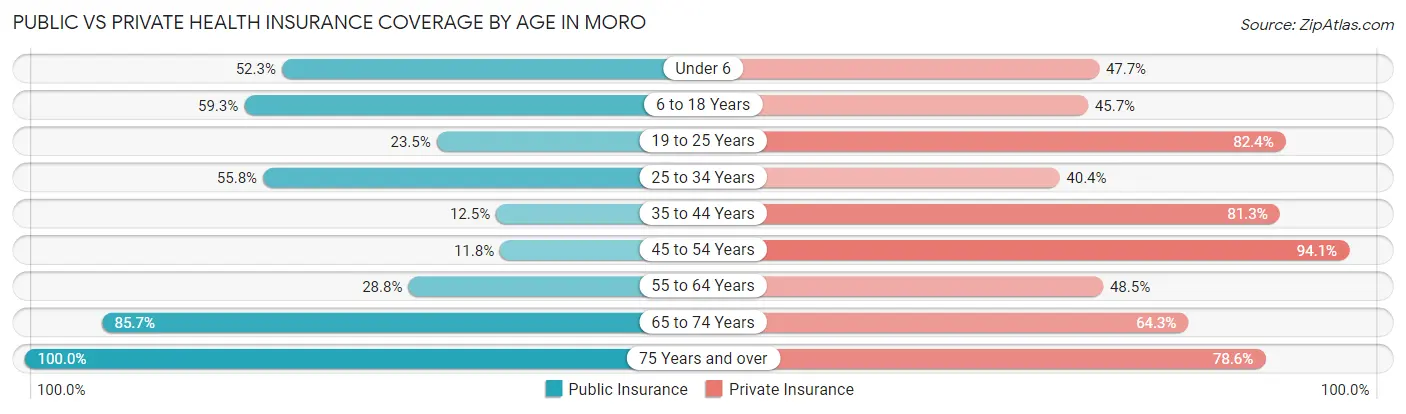
| Age Bracket | Public Insurance | Private Insurance |
| Under 6 | 23 (52.3%) | 21 (47.7%) |
| 6 to 18 Years | 48 (59.3%) | 37 (45.7%) |
| 19 to 25 Years | 4 (23.5%) | 14 (82.4%) |
| 25 to 34 Years | 29 (55.8%) | 21 (40.4%) |
| 35 to 44 Years | 4 (12.5%) | 26 (81.2%) |
| 45 to 54 Years | 2 (11.8%) | 16 (94.1%) |
| 55 to 64 Years | 19 (28.8%) | 32 (48.5%) |
| 65 to 74 Years | 24 (85.7%) | 18 (64.3%) |
| 75 Years and over | 28 (100.0%) | 22 (78.6%) |
| Total | 181 (49.6%) | 207 (56.7%) |
Disability Status by Sex by Age in Moro
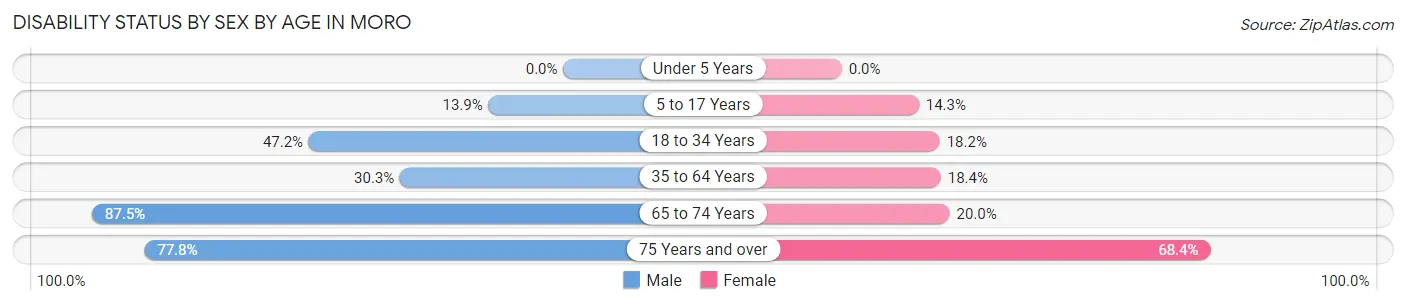
| Age Bracket | Male | Female |
| Under 5 Years | 0 (0.0%) | 0 (0.0%) |
| 5 to 17 Years | 5 (13.9%) | 7 (14.3%) |
| 18 to 34 Years | 17 (47.2%) | 6 (18.2%) |
| 35 to 64 Years | 20 (30.3%) | 9 (18.4%) |
| 65 to 74 Years | 7 (87.5%) | 4 (20.0%) |
| 75 Years and over | 7 (77.8%) | 13 (68.4%) |
Disability Class by Sex by Age in Moro
Disability Class: Hearing Difficulty
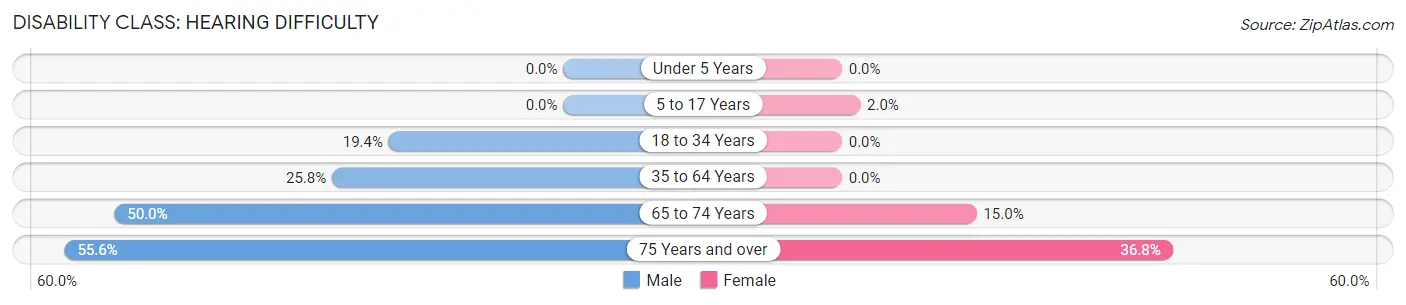
| Age Bracket | Male | Female |
| Under 5 Years | 0 (0.0%) | 0 (0.0%) |
| 5 to 17 Years | 0 (0.0%) | 1 (2.0%) |
| 18 to 34 Years | 7 (19.4%) | 0 (0.0%) |
| 35 to 64 Years | 17 (25.8%) | 0 (0.0%) |
| 65 to 74 Years | 4 (50.0%) | 3 (15.0%) |
| 75 Years and over | 5 (55.6%) | 7 (36.8%) |
Disability Class: Vision Difficulty
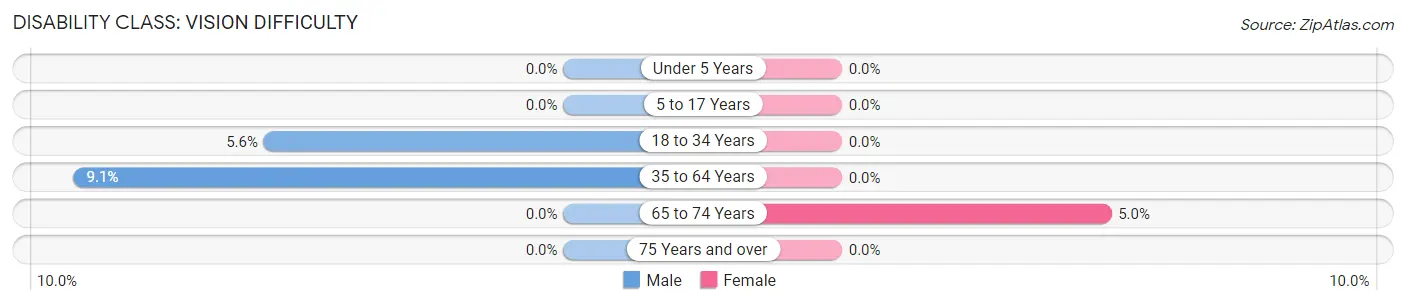
| Age Bracket | Male | Female |
| Under 5 Years | 0 (0.0%) | 0 (0.0%) |
| 5 to 17 Years | 0 (0.0%) | 0 (0.0%) |
| 18 to 34 Years | 2 (5.6%) | 0 (0.0%) |
| 35 to 64 Years | 6 (9.1%) | 0 (0.0%) |
| 65 to 74 Years | 0 (0.0%) | 1 (5.0%) |
| 75 Years and over | 0 (0.0%) | 0 (0.0%) |
Disability Class: Cognitive Difficulty
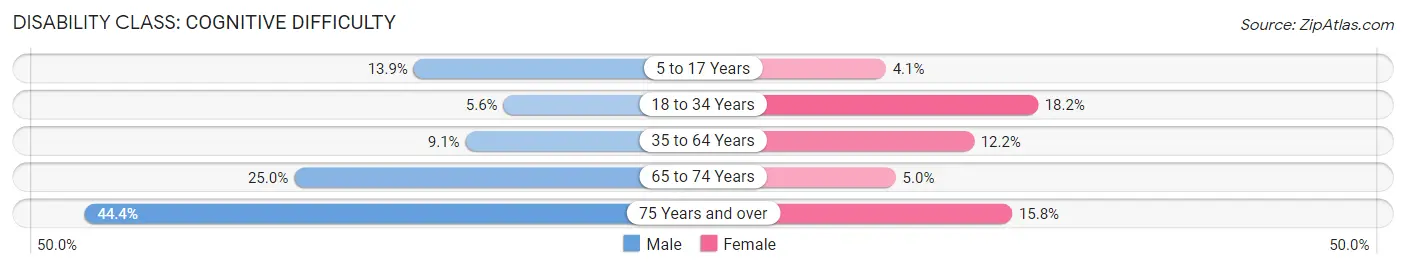
| Age Bracket | Male | Female |
| 5 to 17 Years | 5 (13.9%) | 2 (4.1%) |
| 18 to 34 Years | 2 (5.6%) | 6 (18.2%) |
| 35 to 64 Years | 6 (9.1%) | 6 (12.2%) |
| 65 to 74 Years | 2 (25.0%) | 1 (5.0%) |
| 75 Years and over | 4 (44.4%) | 3 (15.8%) |
Disability Class: Ambulatory Difficulty
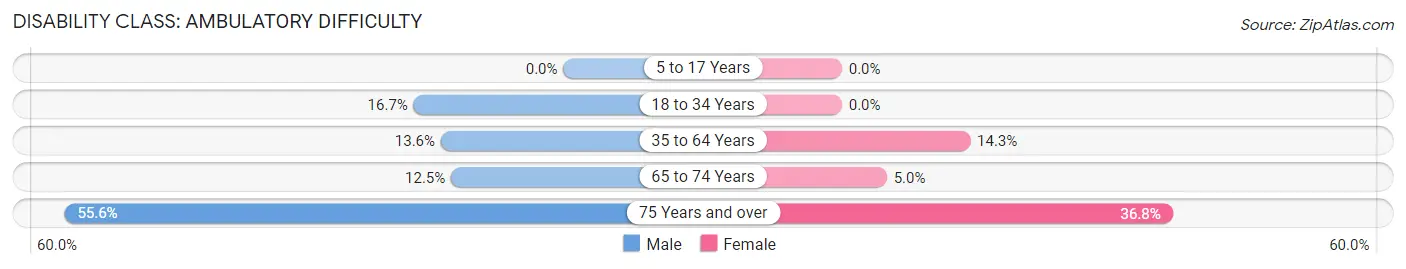
| Age Bracket | Male | Female |
| 5 to 17 Years | 0 (0.0%) | 0 (0.0%) |
| 18 to 34 Years | 6 (16.7%) | 0 (0.0%) |
| 35 to 64 Years | 9 (13.6%) | 7 (14.3%) |
| 65 to 74 Years | 1 (12.5%) | 1 (5.0%) |
| 75 Years and over | 5 (55.6%) | 7 (36.8%) |
Disability Class: Self-Care Difficulty
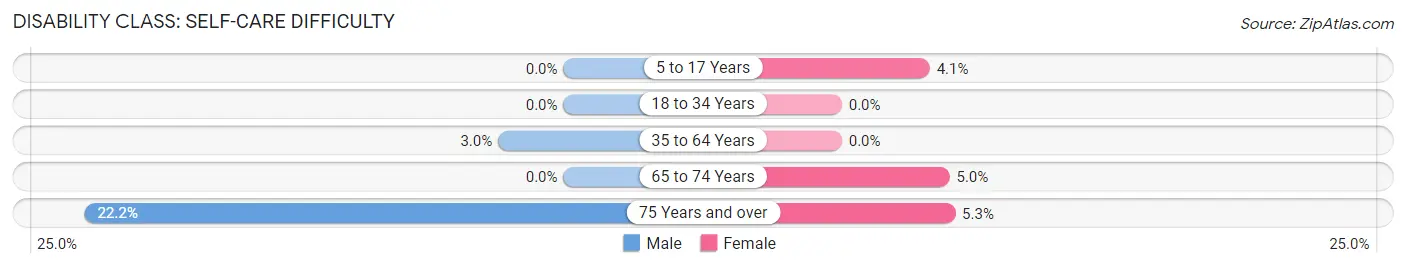
| Age Bracket | Male | Female |
| 5 to 17 Years | 0 (0.0%) | 2 (4.1%) |
| 18 to 34 Years | 0 (0.0%) | 0 (0.0%) |
| 35 to 64 Years | 2 (3.0%) | 0 (0.0%) |
| 65 to 74 Years | 0 (0.0%) | 1 (5.0%) |
| 75 Years and over | 2 (22.2%) | 1 (5.3%) |
Technology Access in Moro
Computing Device Access in Moro
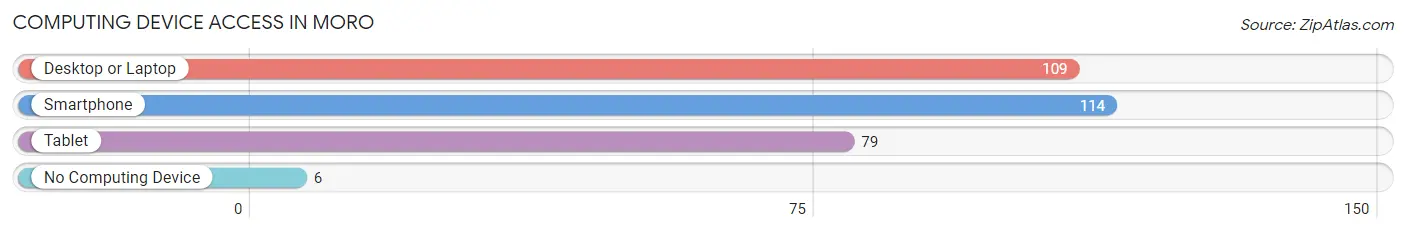
| Device Type | # Households | % Households |
| Desktop or Laptop | 109 | 79.6% |
| Smartphone | 114 | 83.2% |
| Tablet | 79 | 57.7% |
| No Computing Device | 6 | 4.4% |
| Total | 137 | 100.0% |
Internet Access in Moro
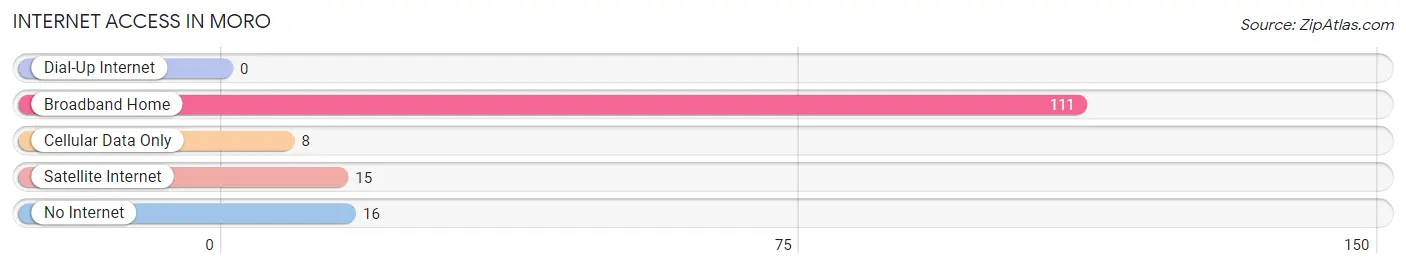
| Internet Type | # Households | % Households |
| Dial-Up Internet | 0 | 0.0% |
| Broadband Home | 111 | 81.0% |
| Cellular Data Only | 8 | 5.8% |
| Satellite Internet | 15 | 11.0% |
| No Internet | 16 | 11.7% |
| Total | 137 | 100.0% |
Moro Summary
Moro is a small city located in the state of Oregon, in the United States. It is situated in the Columbia River Gorge, a region of the Pacific Northwest known for its stunning natural beauty. The city is home to a population of just over 1,000 people, and is the county seat of Sherman County.
History
Moro was founded in 1883 by a group of settlers from the nearby town of Wasco. The settlers were looking for a place to settle and start a new life, and they chose the area around Moro because of its fertile soil and abundant natural resources. The town was named after the nearby Moro Creek, which was named after a Native American chief who lived in the area.
The town quickly grew, and by the early 1900s it had become a bustling center of commerce and industry. The town was home to several businesses, including a flour mill, a sawmill, a creamery, and a blacksmith shop. The town also had a post office, a school, and a hotel.
In the early 1900s, the town was also home to a large population of Chinese immigrants, who had come to the area to work in the local industries. The Chinese immigrants were an important part of the town’s economy, and they helped to build many of the town’s buildings and businesses.
Geography
Moro is located in the Columbia River Gorge, a region of the Pacific Northwest known for its stunning natural beauty. The city is situated on the banks of the Columbia River, and is surrounded by rolling hills and lush forests. The city is also located near several major highways, including Interstate 84 and U.S. Route 97.
The climate in Moro is mild and temperate, with warm summers and cool winters. The average annual temperature is around 50 degrees Fahrenheit, and the average annual precipitation is around 20 inches.
Economy
Moro’s economy is largely based on agriculture and tourism. The city is home to several farms, which produce a variety of crops, including wheat, corn, and hay. The city is also home to several wineries, which produce a variety of wines.
Tourism is also an important part of the city’s economy. The city is home to several attractions, including the Columbia River Gorge National Scenic Area, the Deschutes National Forest, and the John Day Fossil Beds National Monument. The city is also home to several outdoor recreation areas, including the Deschutes River State Recreation Area and the Columbia River Gorge National Scenic Area.
Demographics
As of the 2010 census, the population of Moro was 1,037. The racial makeup of the city was 94.3% White, 0.7% African American, 0.3% Native American, 0.3% Asian, 0.1% Pacific Islander, 0.7% from other races, and 3.6% from two or more races. Hispanic or Latino of any race were 2.2% of the population.
The median household income in Moro was $37,500, and the median family income was $41,250. The per capita income in Moro was $17,845. About 11.2% of families and 14.2% of the population were below the poverty line, including 18.2% of those under age 18 and 8.3% of those age 65 or over.
Moro is a small city with a rich history and a vibrant economy. The city is home to a diverse population, and is a great place to live, work, and visit. With its stunning natural beauty and its many attractions, Moro is a great place to call home.
Common Questions
What is Per Capita Income in Moro?
Per Capita income in Moro is $25,913.
What is the Median Family Income in Moro?
Median Family Income in Moro is $73,750.
What is the Median Household income in Moro?
Median Household Income in Moro is $57,292.
What is Income or Wage Gap in Moro?
Income or Wage Gap in Moro is 51.6%.
Women in Moro earn 48.4 cents for every dollar earned by a man.
What is Inequality or Gini Index in Moro?
Inequality or Gini Index in Moro is 0.36.
What is the Total Population of Moro?
Total Population of Moro is 365.
What is the Total Male Population of Moro?
Total Male Population of Moro is 178.
What is the Total Female Population of Moro?
Total Female Population of Moro is 187.
What is the Ratio of Males per 100 Females in Moro?
There are 95.19 Males per 100 Females in Moro.
What is the Ratio of Females per 100 Males in Moro?
There are 105.06 Females per 100 Males in Moro.
What is the Median Population Age in Moro?
Median Population Age in Moro is 34.6 Years.
What is the Average Family Size in Moro
Average Family Size in Moro is 3.5 People.
What is the Average Household Size in Moro
Average Household Size in Moro is 2.7 People.
How Large is the Labor Force in Moro?
There are 157 People in the Labor Forcein in Moro.
What is the Percentage of People in the Labor Force in Moro?
62.3% of People are in the Labor Force in Moro.
What is the Unemployment Rate in Moro?
Unemployment Rate in Moro is 2.5%.