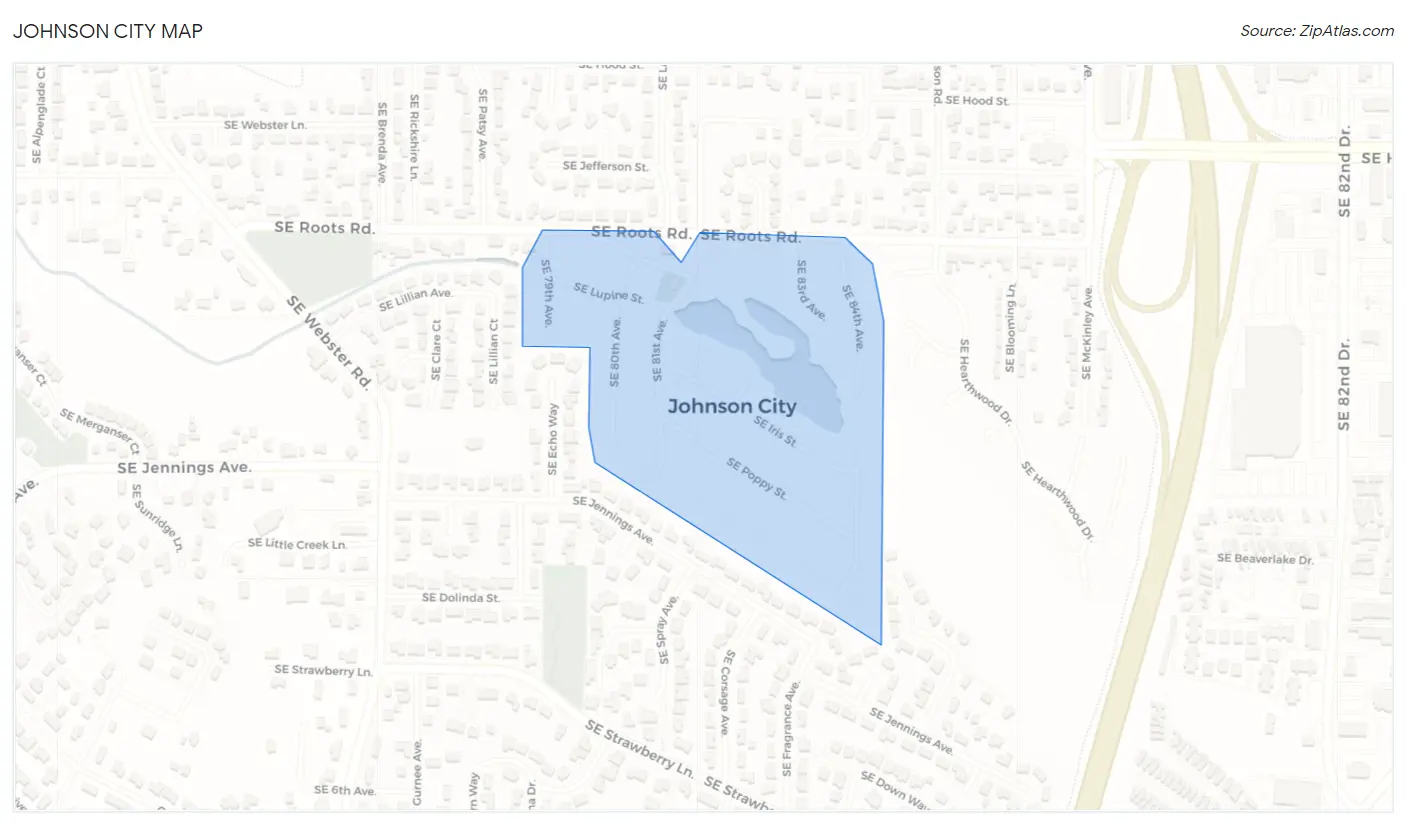
Johnson City, OR Map & Demographics
Johnson City Map
Johnson City Overview
$33,843
PER CAPITA INCOME
$65,500
AVG FAMILY INCOME
$44,091
AVG HOUSEHOLD INCOME
30.8%
WAGE / INCOME GAP [ % ]
69.2¢/ $1
WAGE / INCOME GAP [ $ ]
$16,780
FAMILY INCOME DEFICIT
0.40
INEQUALITY / GINI INDEX
430
TOTAL POPULATION
193
MALE POPULATION
237
FEMALE POPULATION
81.43
MALES / 100 FEMALES
122.80
FEMALES / 100 MALES
54.7
MEDIAN AGE
2.6
AVG FAMILY SIZE
1.8
AVG HOUSEHOLD SIZE
232
LABOR FORCE [ PEOPLE ]
60.9%
PERCENT IN LABOR FORCE
Income in Johnson City
Income Overview in Johnson City
Per Capita Income in Johnson City is $33,843, while median incomes of families and households are $65,500 and $44,091 respectively.
| Characteristic | Number | Measure |
| Per Capita Income | 430 | $33,843 |
| Median Family Income | 110 | $65,500 |
| Mean Family Income | 110 | $64,672 |
| Median Household Income | 244 | $44,091 |
| Mean Household Income | 244 | $59,779 |
| Income Deficit | 110 | $16,780 |
| Wage / Income Gap (%) | 430 | 30.76% |
| Wage / Income Gap ($) | 430 | 69.24¢ per $1 |
| Gini / Inequality Index | 430 | 0.40 |
Earnings by Sex in Johnson City
Average Earnings in Johnson City are $38,281, $42,125 for men and $29,167 for women, a difference of 30.8%.
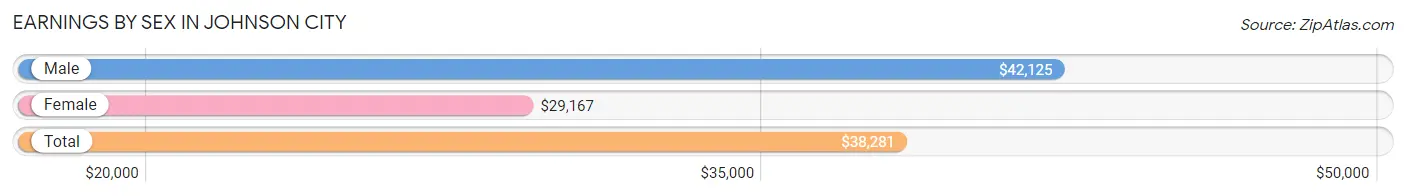
| Sex | Number | Average Earnings |
| Male | 99 (40.7%) | $42,125 |
| Female | 144 (59.3%) | $29,167 |
| Total | 243 (100.0%) | $38,281 |
Earnings by Sex by Income Bracket in Johnson City
The most common earnings brackets in Johnson City are $55,000 to $64,999 for men (20 | 20.2%) and $40,000 to $44,999 for women (27 | 18.8%).
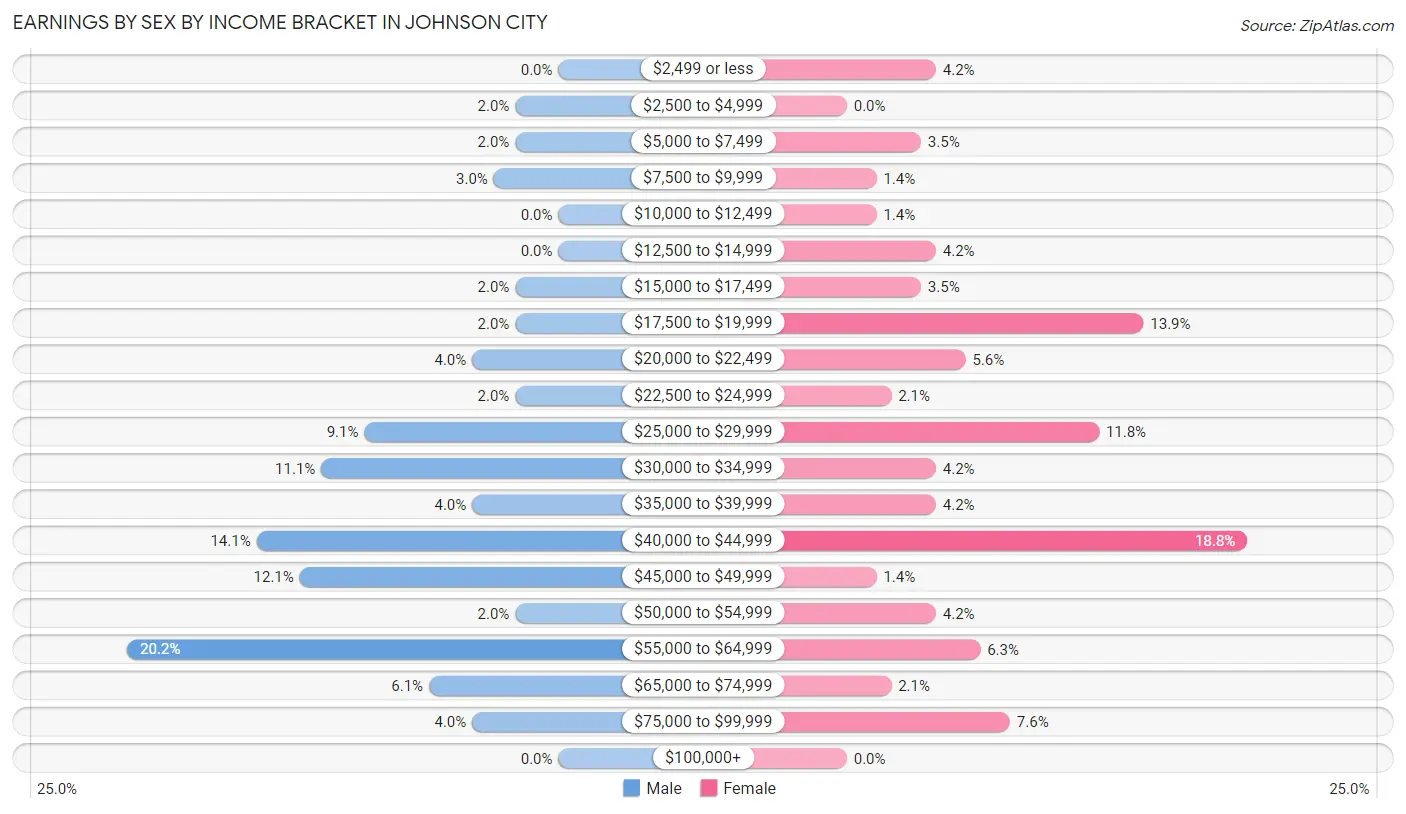
| Income | Male | Female |
| $2,499 or less | 0 (0.0%) | 6 (4.2%) |
| $2,500 to $4,999 | 2 (2.0%) | 0 (0.0%) |
| $5,000 to $7,499 | 2 (2.0%) | 5 (3.5%) |
| $7,500 to $9,999 | 3 (3.0%) | 2 (1.4%) |
| $10,000 to $12,499 | 0 (0.0%) | 2 (1.4%) |
| $12,500 to $14,999 | 0 (0.0%) | 6 (4.2%) |
| $15,000 to $17,499 | 2 (2.0%) | 5 (3.5%) |
| $17,500 to $19,999 | 2 (2.0%) | 20 (13.9%) |
| $20,000 to $22,499 | 4 (4.0%) | 8 (5.6%) |
| $22,500 to $24,999 | 2 (2.0%) | 3 (2.1%) |
| $25,000 to $29,999 | 9 (9.1%) | 17 (11.8%) |
| $30,000 to $34,999 | 11 (11.1%) | 6 (4.2%) |
| $35,000 to $39,999 | 4 (4.0%) | 6 (4.2%) |
| $40,000 to $44,999 | 14 (14.1%) | 27 (18.8%) |
| $45,000 to $49,999 | 12 (12.1%) | 2 (1.4%) |
| $50,000 to $54,999 | 2 (2.0%) | 6 (4.2%) |
| $55,000 to $64,999 | 20 (20.2%) | 9 (6.2%) |
| $65,000 to $74,999 | 6 (6.1%) | 3 (2.1%) |
| $75,000 to $99,999 | 4 (4.0%) | 11 (7.6%) |
| $100,000+ | 0 (0.0%) | 0 (0.0%) |
| Total | 99 (100.0%) | 144 (100.0%) |
Earnings by Sex by Educational Attainment in Johnson City
Average earnings in Johnson City are $45,000 for men and $33,125 for women, a difference of 26.4%. Men with an educational attainment of less than high school enjoy the highest average annual earnings of $46,250, while those with college or associate's degree education earn the least with $41,250. Women with an educational attainment of college or associate's degree earn the most with the average annual earnings of $40,956, while those with bachelor's degree education have the smallest earnings of $26,964.
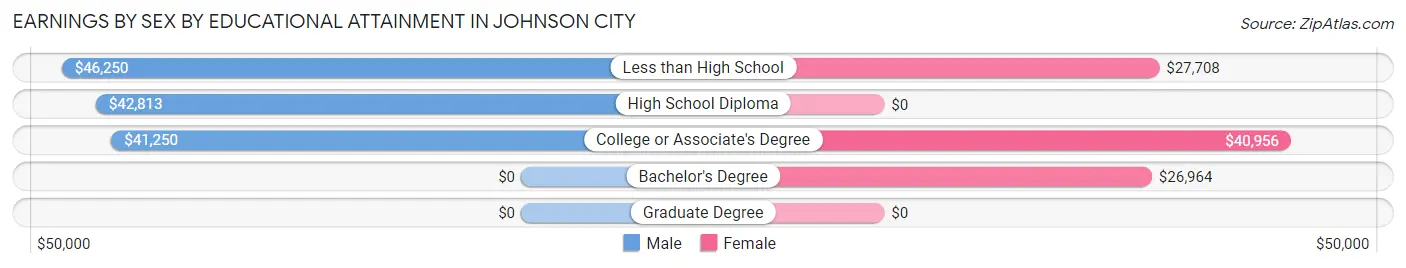
| Educational Attainment | Male Income | Female Income |
| Less than High School | $46,250 | $27,708 |
| High School Diploma | $42,813 | $0 |
| College or Associate's Degree | $41,250 | $40,956 |
| Bachelor's Degree | - | - |
| Graduate Degree | - | - |
| Total | $45,000 | $33,125 |
Family Income in Johnson City
Family Income Brackets in Johnson City
According to the Johnson City family income data, there are 34 families falling into the $50,000 to $74,999 income range, which is the most common income bracket and makes up 30.9% of all families.
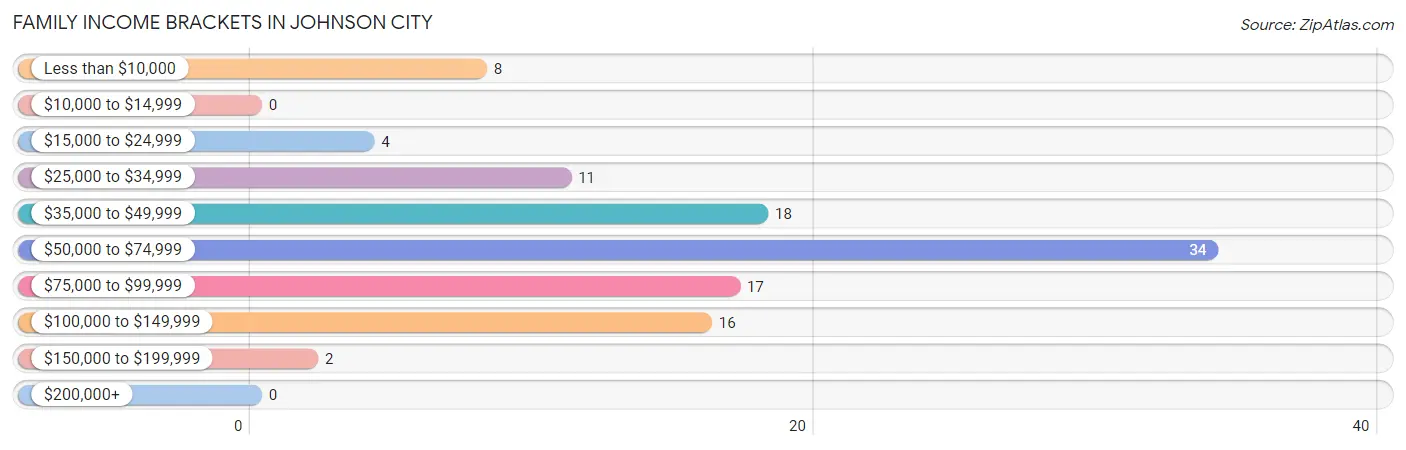
| Income Bracket | # Families | % Families |
| Less than $10,000 | 8 | 7.3% |
| $10,000 to $14,999 | 0 | 0.0% |
| $15,000 to $24,999 | 4 | 3.6% |
| $25,000 to $34,999 | 11 | 10.0% |
| $35,000 to $49,999 | 18 | 16.4% |
| $50,000 to $74,999 | 34 | 30.9% |
| $75,000 to $99,999 | 17 | 15.5% |
| $100,000 to $149,999 | 16 | 14.5% |
| $150,000 to $199,999 | 2 | 1.8% |
| $200,000+ | 0 | 0.0% |
Family Income by Famaliy Size in Johnson City
3-person families (10 | 9.1%) account for the highest median family income in Johnson City with $93,750 per family, while 2-person families (84 | 76.4%) have the highest median income of $31,750 per family member.
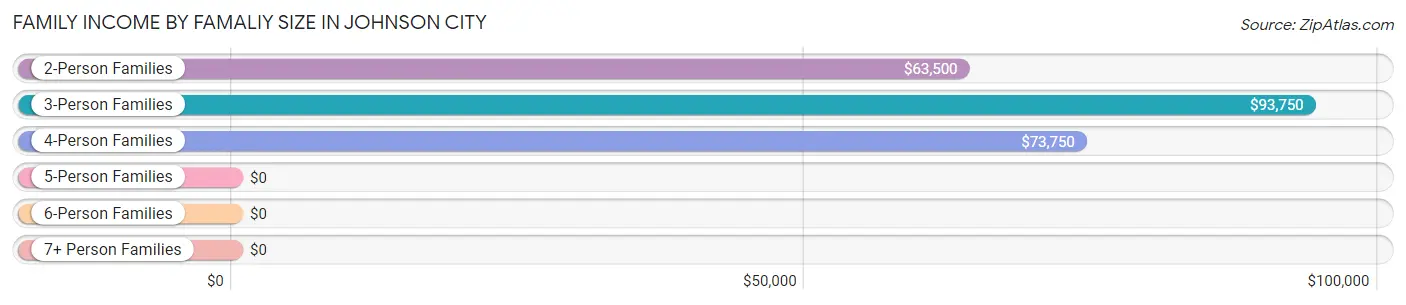
| Income Bracket | # Families | Median Income |
| 2-Person Families | 84 (76.4%) | $63,500 |
| 3-Person Families | 10 (9.1%) | $93,750 |
| 4-Person Families | 11 (10.0%) | $73,750 |
| 5-Person Families | 5 (4.5%) | $0 |
| 6-Person Families | 0 (0.0%) | $0 |
| 7+ Person Families | 0 (0.0%) | $0 |
| Total | 110 (100.0%) | $65,500 |
Family Income by Number of Earners in Johnson City
The median family income in Johnson City is $65,500, with families comprising 3+ earners (6) having the highest median family income of $83,750, while families with no earners (20) have the lowest median family income of $38,750, accounting for 5.4% and 18.2% of families, respectively.
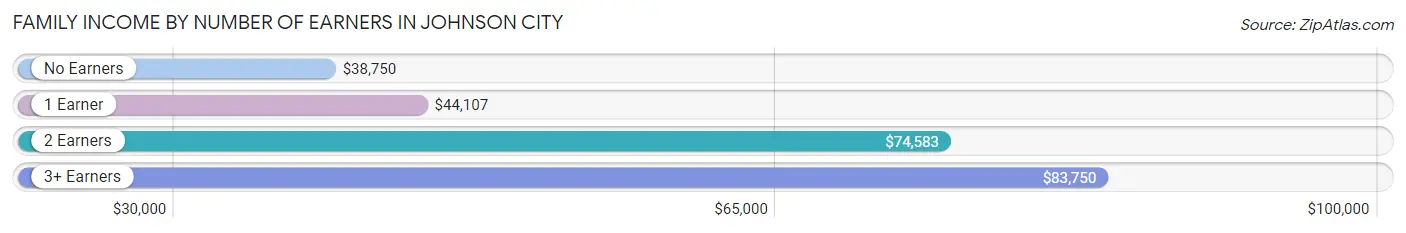
| Number of Earners | # Families | Median Income |
| No Earners | 20 (18.2%) | $38,750 |
| 1 Earner | 41 (37.3%) | $44,107 |
| 2 Earners | 43 (39.1%) | $74,583 |
| 3+ Earners | 6 (5.4%) | $83,750 |
| Total | 110 (100.0%) | $65,500 |
Household Income in Johnson City
Household Income Brackets in Johnson City
With 66 households falling in the category, the $50,000 to $74,999 income range is the most frequent in Johnson City, accounting for 27.1% of all households. In contrast, only 2 households (0.8%) fall into the $150,000 to $199,999 income bracket, making it the least populous group.
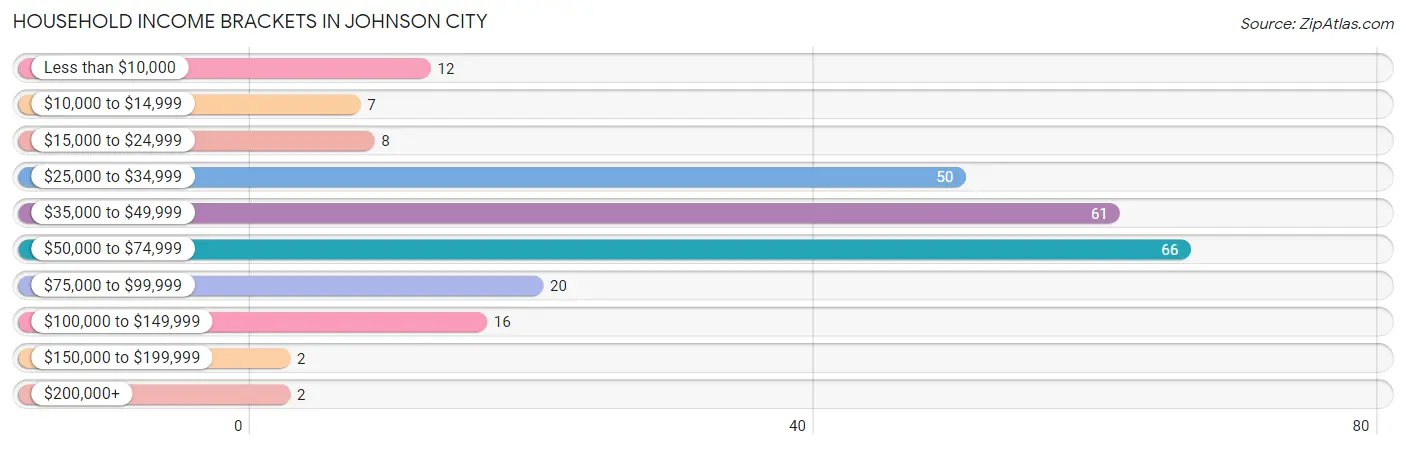
| Income Bracket | # Households | % Households |
| Less than $10,000 | 12 | 4.9% |
| $10,000 to $14,999 | 7 | 2.9% |
| $15,000 to $24,999 | 8 | 3.3% |
| $25,000 to $34,999 | 50 | 20.5% |
| $35,000 to $49,999 | 61 | 25.0% |
| $50,000 to $74,999 | 66 | 27.0% |
| $75,000 to $99,999 | 20 | 8.2% |
| $100,000 to $149,999 | 16 | 6.6% |
| $150,000 to $199,999 | 2 | 0.8% |
| $200,000+ | 2 | 0.8% |
Household Income by Householder Age in Johnson City
The median household income in Johnson City is $44,091, with the highest median household income of $61,786 found in the 25 to 44 years age bracket for the primary householder. A total of 42 households (17.2%) fall into this category.
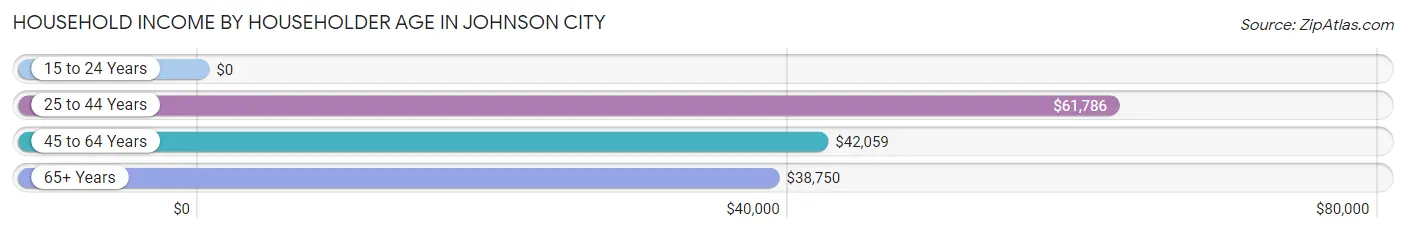
| Income Bracket | # Households | Median Income |
| 15 to 24 Years | 0 (0.0%) | $0 |
| 25 to 44 Years | 42 (17.2%) | $61,786 |
| 45 to 64 Years | 110 (45.1%) | $42,059 |
| 65+ Years | 92 (37.7%) | $38,750 |
| Total | 244 (100.0%) | $44,091 |
Poverty in Johnson City
Income Below Poverty by Sex and Age in Johnson City
With 10.2% poverty level for males and 11.4% for females among the residents of Johnson City, 6 to 11 year old males and 25 to 34 year old females are the most vulnerable to poverty, with 6 males (60.0%) and 4 females (66.7%) in their respective age groups living below the poverty level.
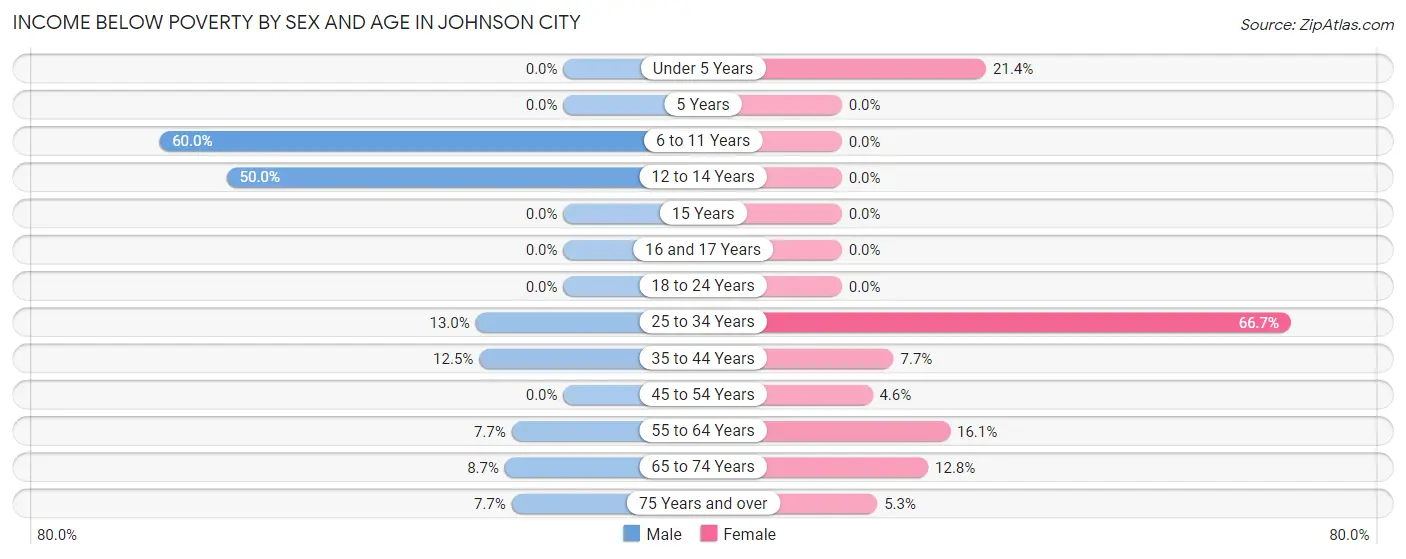
| Age Bracket | Male | Female |
| Under 5 Years | 0 (0.0%) | 3 (21.4%) |
| 5 Years | 0 (0.0%) | 0 (0.0%) |
| 6 to 11 Years | 6 (60.0%) | 0 (0.0%) |
| 12 to 14 Years | 2 (50.0%) | 0 (0.0%) |
| 15 Years | 0 (0.0%) | 0 (0.0%) |
| 16 and 17 Years | 0 (0.0%) | 0 (0.0%) |
| 18 to 24 Years | 0 (0.0%) | 0 (0.0%) |
| 25 to 34 Years | 3 (13.0%) | 4 (66.7%) |
| 35 to 44 Years | 2 (12.5%) | 2 (7.7%) |
| 45 to 54 Years | 0 (0.0%) | 2 (4.5%) |
| 55 to 64 Years | 2 (7.7%) | 9 (16.1%) |
| 65 to 74 Years | 2 (8.7%) | 5 (12.8%) |
| 75 Years and over | 2 (7.7%) | 2 (5.3%) |
| Total | 19 (10.2%) | 27 (11.4%) |
Income Above Poverty by Sex and Age in Johnson City
According to the poverty statistics in Johnson City, males aged under 5 years and females aged 16 and 17 years are the age groups that are most secure financially, with 100.0% of males and 100.0% of females in these age groups living above the poverty line.
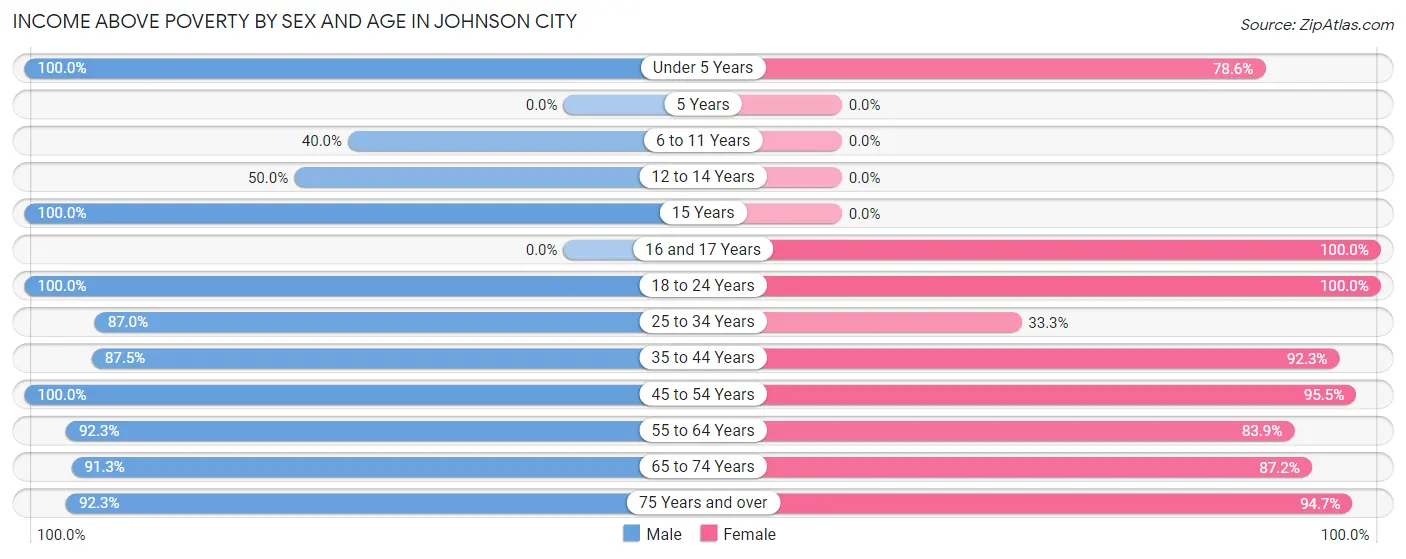
| Age Bracket | Male | Female |
| Under 5 Years | 16 (100.0%) | 11 (78.6%) |
| 5 Years | 0 (0.0%) | 0 (0.0%) |
| 6 to 11 Years | 4 (40.0%) | 0 (0.0%) |
| 12 to 14 Years | 2 (50.0%) | 0 (0.0%) |
| 15 Years | 2 (100.0%) | 0 (0.0%) |
| 16 and 17 Years | 0 (0.0%) | 7 (100.0%) |
| 18 to 24 Years | 11 (100.0%) | 7 (100.0%) |
| 25 to 34 Years | 20 (87.0%) | 2 (33.3%) |
| 35 to 44 Years | 14 (87.5%) | 24 (92.3%) |
| 45 to 54 Years | 29 (100.0%) | 42 (95.5%) |
| 55 to 64 Years | 24 (92.3%) | 47 (83.9%) |
| 65 to 74 Years | 21 (91.3%) | 34 (87.2%) |
| 75 Years and over | 24 (92.3%) | 36 (94.7%) |
| Total | 167 (89.8%) | 210 (88.6%) |
Income Below Poverty Among Married-Couple Families in Johnson City
The poverty statistics for married-couple families in Johnson City show that 11.8% or 10 of the total 85 families live below the poverty line. Families with 3 or 4 children have the highest poverty rate of 100.0%, comprising of 3 families. On the other hand, families with no children have the lowest poverty rate of 7.5%, which includes 5 families.
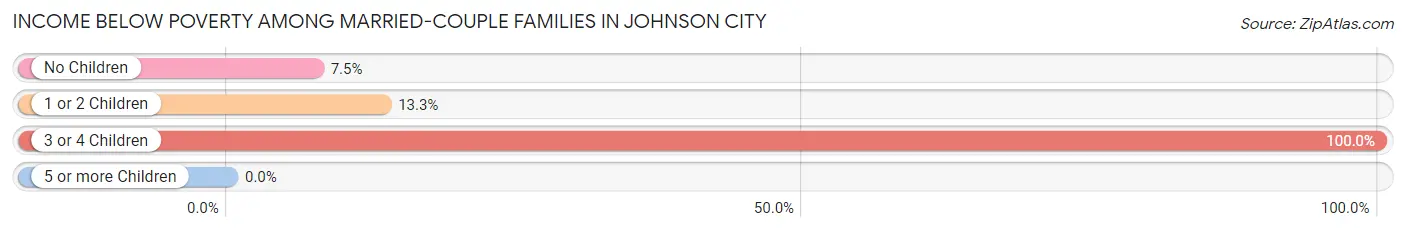
| Children | Above Poverty | Below Poverty |
| No Children | 62 (92.5%) | 5 (7.5%) |
| 1 or 2 Children | 13 (86.7%) | 2 (13.3%) |
| 3 or 4 Children | 0 (0.0%) | 3 (100.0%) |
| 5 or more Children | 0 (0.0%) | 0 (0.0%) |
| Total | 75 (88.2%) | 10 (11.8%) |
Income Below Poverty Among Single-Parent Households in Johnson City
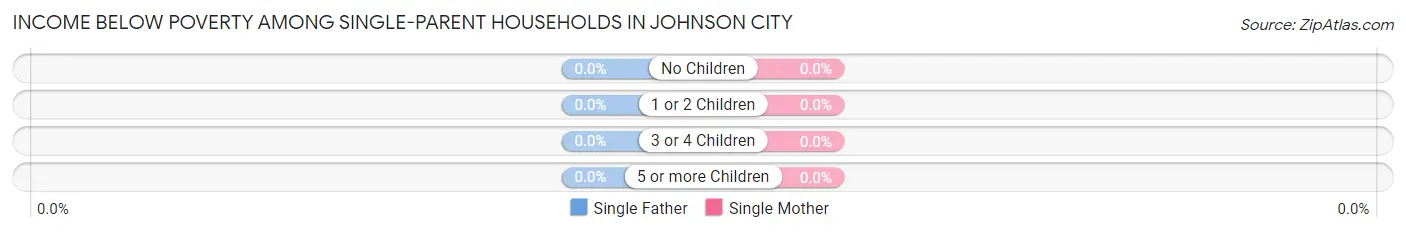
| Children | Single Father | Single Mother |
| No Children | 0 (0.0%) | 0 (0.0%) |
| 1 or 2 Children | 0 (0.0%) | 0 (0.0%) |
| 3 or 4 Children | 0 (0.0%) | 0 (0.0%) |
| 5 or more Children | 0 (0.0%) | 0 (0.0%) |
| Total | 0 (0.0%) | 0 (0.0%) |
Income Below Poverty Among Married-Couple vs Single-Parent Households in Johnson City
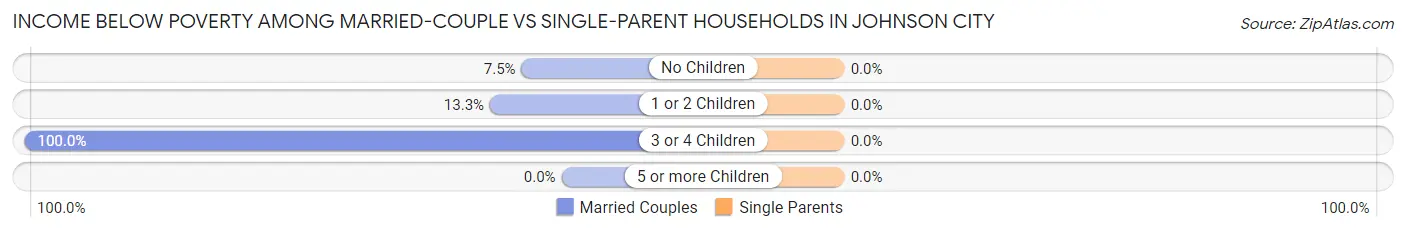
| Children | Married-Couple Families | Single-Parent Households |
| No Children | 5 (7.5%) | 0 (0.0%) |
| 1 or 2 Children | 2 (13.3%) | 0 (0.0%) |
| 3 or 4 Children | 3 (100.0%) | 0 (0.0%) |
| 5 or more Children | 0 (0.0%) | 0 (0.0%) |
| Total | 10 (11.8%) | 0 (0.0%) |
Race in Johnson City
The most populous races in Johnson City are White / Caucasian (357 | 83.0%), Hispanic or Latino (68 | 15.8%), and Two or more Races (38 | 8.8%).
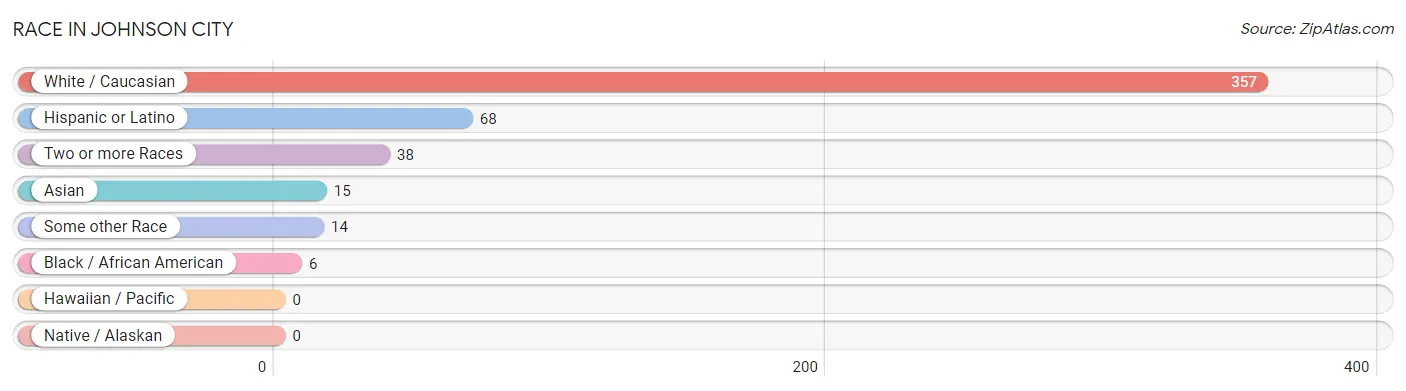
| Race | # Population | % Population |
| Asian | 15 | 3.5% |
| Black / African American | 6 | 1.4% |
| Hawaiian / Pacific | 0 | 0.0% |
| Hispanic or Latino | 68 | 15.8% |
| Native / Alaskan | 0 | 0.0% |
| White / Caucasian | 357 | 83.0% |
| Two or more Races | 38 | 8.8% |
| Some other Race | 14 | 3.3% |
| Total | 430 | 100.0% |
Ancestry in Johnson City
The most populous ancestries reported in Johnson City are German (94 | 21.9%), Mexican (63 | 14.6%), English (58 | 13.5%), Irish (53 | 12.3%), and Norwegian (24 | 5.6%), together accounting for 67.9% of all Johnson City residents.
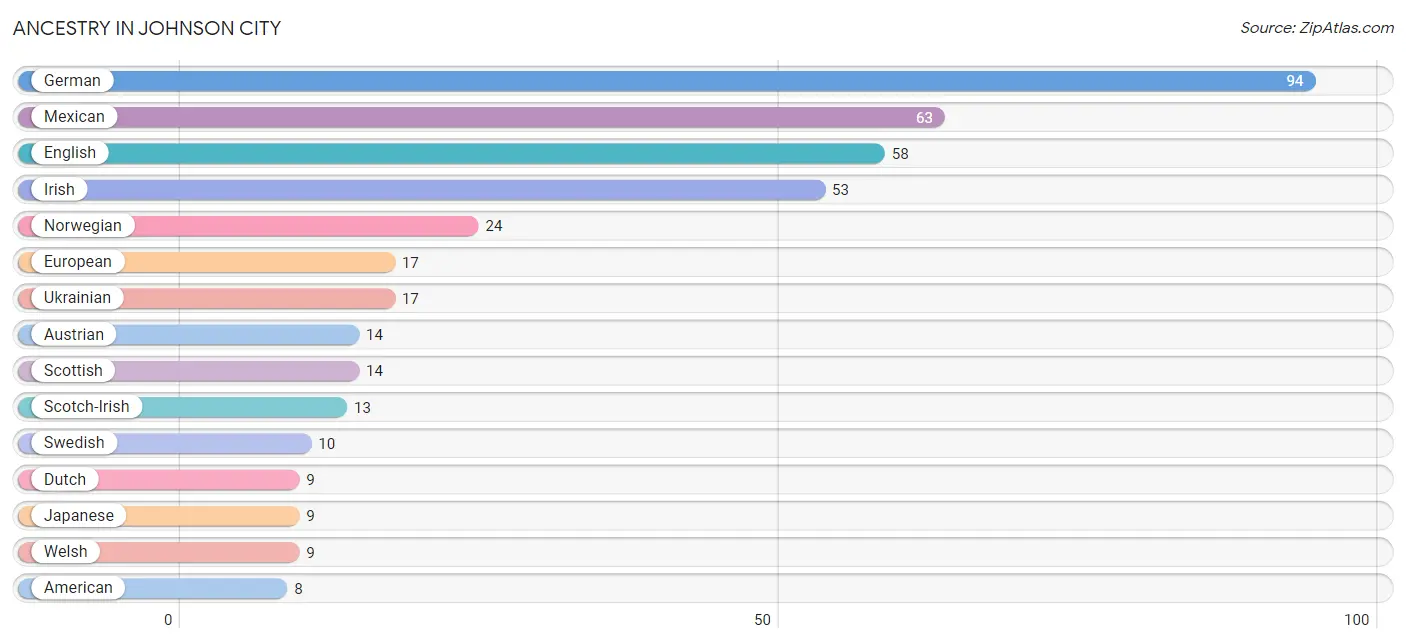
| Ancestry | # Population | % Population |
| American | 8 | 1.9% |
| Austrian | 14 | 3.3% |
| British | 7 | 1.6% |
| Czech | 2 | 0.5% |
| Dutch | 9 | 2.1% |
| English | 58 | 13.5% |
| European | 17 | 4.0% |
| Finnish | 4 | 0.9% |
| French | 4 | 0.9% |
| French Canadian | 7 | 1.6% |
| German | 94 | 21.9% |
| Irish | 53 | 12.3% |
| Italian | 2 | 0.5% |
| Jamaican | 5 | 1.2% |
| Japanese | 9 | 2.1% |
| Mexican | 63 | 14.6% |
| Northern European | 6 | 1.4% |
| Norwegian | 24 | 5.6% |
| Polish | 1 | 0.2% |
| Puerto Rican | 5 | 1.2% |
| Russian | 6 | 1.4% |
| Scandinavian | 4 | 0.9% |
| Scotch-Irish | 13 | 3.0% |
| Scottish | 14 | 3.3% |
| Sri Lankan | 6 | 1.4% |
| Swedish | 10 | 2.3% |
| Swiss | 5 | 1.2% |
| Trinidadian and Tobagonian | 5 | 1.2% |
| Ukrainian | 17 | 4.0% |
| Welsh | 9 | 2.1% | View All 30 Rows |
Immigrants in Johnson City
The most numerous immigrant groups reported in Johnson City came from Eastern Europe (21 | 4.9%), Europe (21 | 4.9%), Latin America (20 | 4.6%), Ukraine (17 | 4.0%), and Central America (15 | 3.5%), together accounting for 21.9% of all Johnson City residents.
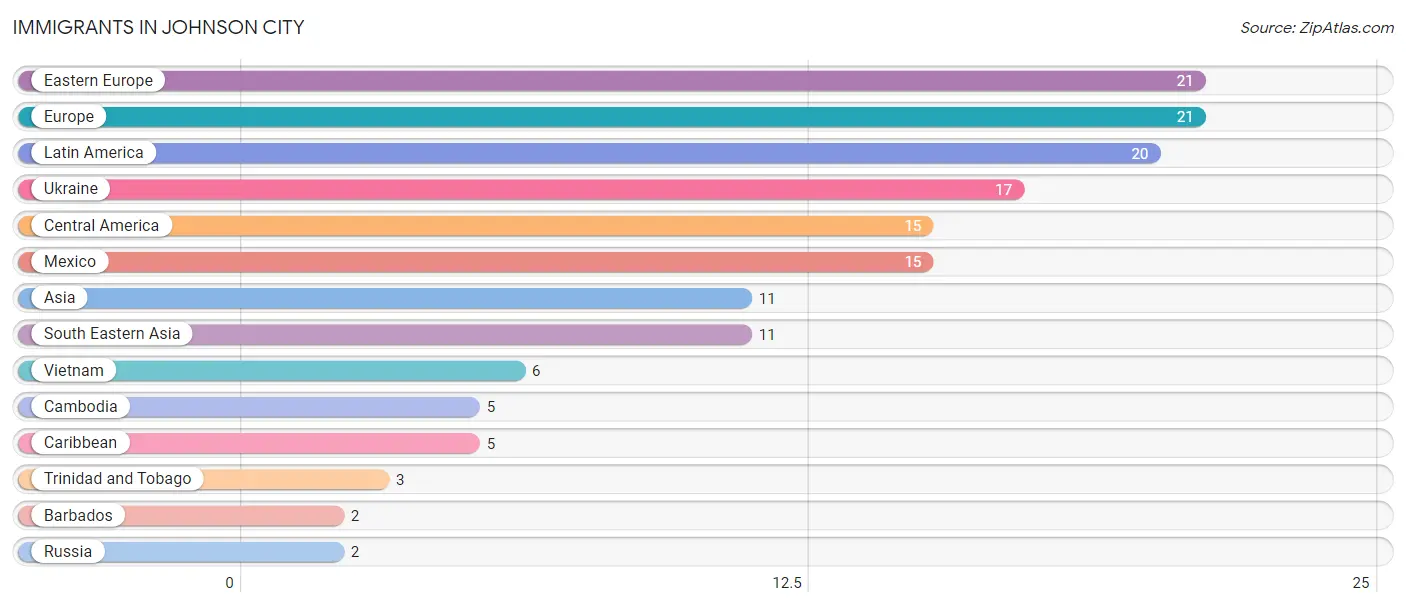
| Immigration Origin | # Population | % Population |
| Asia | 11 | 2.6% |
| Barbados | 2 | 0.5% |
| Cambodia | 5 | 1.2% |
| Caribbean | 5 | 1.2% |
| Central America | 15 | 3.5% |
| Eastern Europe | 21 | 4.9% |
| Europe | 21 | 4.9% |
| Latin America | 20 | 4.6% |
| Mexico | 15 | 3.5% |
| Russia | 2 | 0.5% |
| South Eastern Asia | 11 | 2.6% |
| Trinidad and Tobago | 3 | 0.7% |
| Ukraine | 17 | 4.0% |
| Vietnam | 6 | 1.4% | View All 14 Rows |
Sex and Age in Johnson City
Sex and Age in Johnson City
The most populous age groups in Johnson City are 50 to 54 Years (25 | 13.0%) for men and 50 to 54 Years (38 | 16.0%) for women.
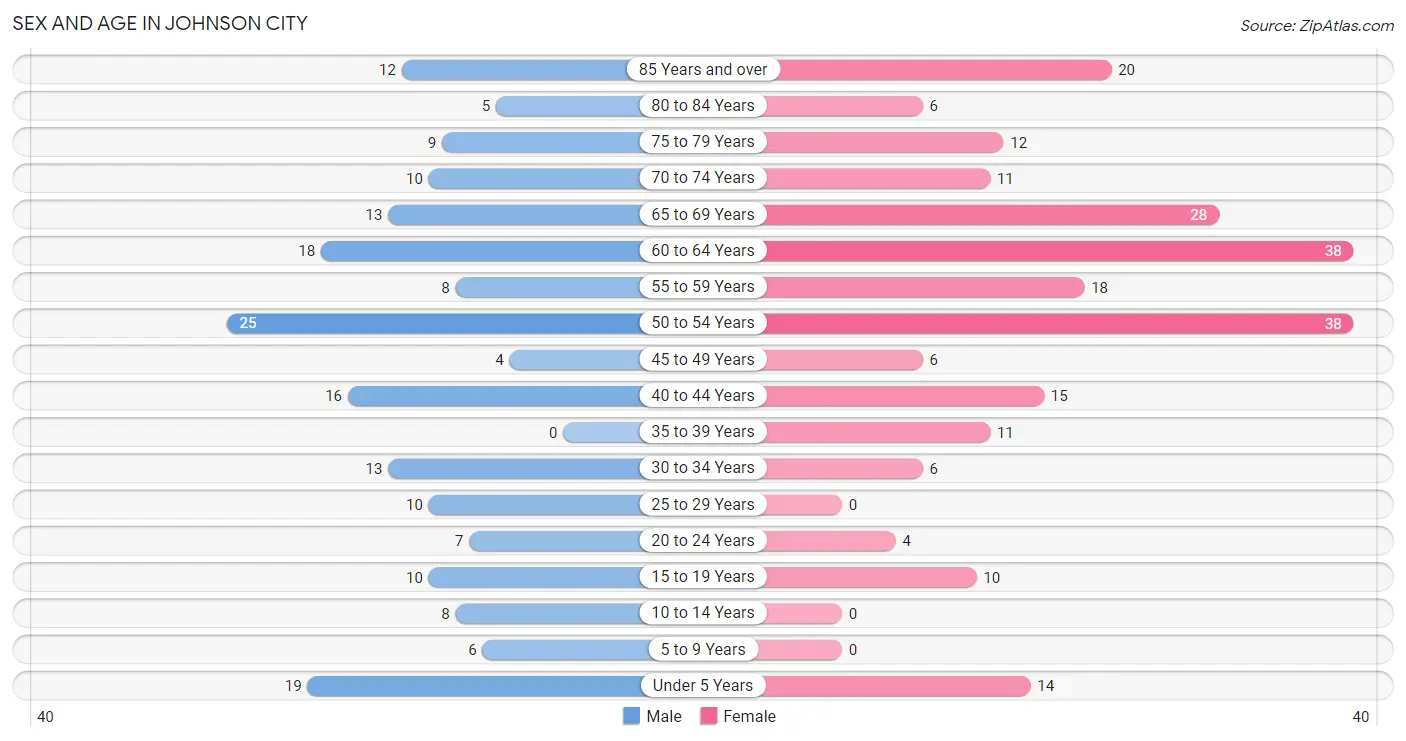
| Age Bracket | Male | Female |
| Under 5 Years | 19 (9.8%) | 14 (5.9%) |
| 5 to 9 Years | 6 (3.1%) | 0 (0.0%) |
| 10 to 14 Years | 8 (4.2%) | 0 (0.0%) |
| 15 to 19 Years | 10 (5.2%) | 10 (4.2%) |
| 20 to 24 Years | 7 (3.6%) | 4 (1.7%) |
| 25 to 29 Years | 10 (5.2%) | 0 (0.0%) |
| 30 to 34 Years | 13 (6.7%) | 6 (2.5%) |
| 35 to 39 Years | 0 (0.0%) | 11 (4.6%) |
| 40 to 44 Years | 16 (8.3%) | 15 (6.3%) |
| 45 to 49 Years | 4 (2.1%) | 6 (2.5%) |
| 50 to 54 Years | 25 (13.0%) | 38 (16.0%) |
| 55 to 59 Years | 8 (4.2%) | 18 (7.6%) |
| 60 to 64 Years | 18 (9.3%) | 38 (16.0%) |
| 65 to 69 Years | 13 (6.7%) | 28 (11.8%) |
| 70 to 74 Years | 10 (5.2%) | 11 (4.6%) |
| 75 to 79 Years | 9 (4.7%) | 12 (5.1%) |
| 80 to 84 Years | 5 (2.6%) | 6 (2.5%) |
| 85 Years and over | 12 (6.2%) | 20 (8.4%) |
| Total | 193 (100.0%) | 237 (100.0%) |
Families and Households in Johnson City
Median Family Size in Johnson City
The median family size in Johnson City is 2.57 persons per family, with married-couple families (85 | 77.3%) accounting for the largest median family size of 2.67 persons per family. On the other hand, single female/mother families (23 | 20.9%) represent the smallest median family size with 2.22 persons per family.
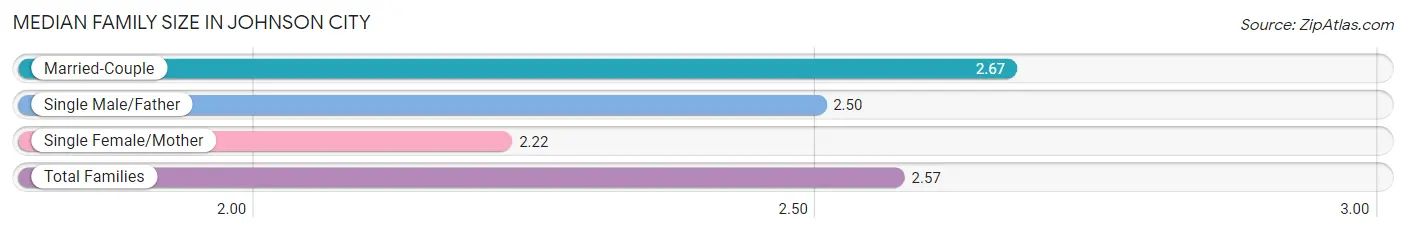
| Family Type | # Families | Family Size |
| Married-Couple | 85 (77.3%) | 2.67 |
| Single Male/Father | 2 (1.8%) | 2.50 |
| Single Female/Mother | 23 (20.9%) | 2.22 |
| Total Families | 110 (100.0%) | 2.57 |
Median Household Size in Johnson City
The median household size in Johnson City is 1.75 persons per household, with married-couple households (85 | 34.8%) accounting for the largest median household size of 2.67 persons per household. non-family households (134 | 54.9%) represent the smallest median household size with 1.07 persons per household.
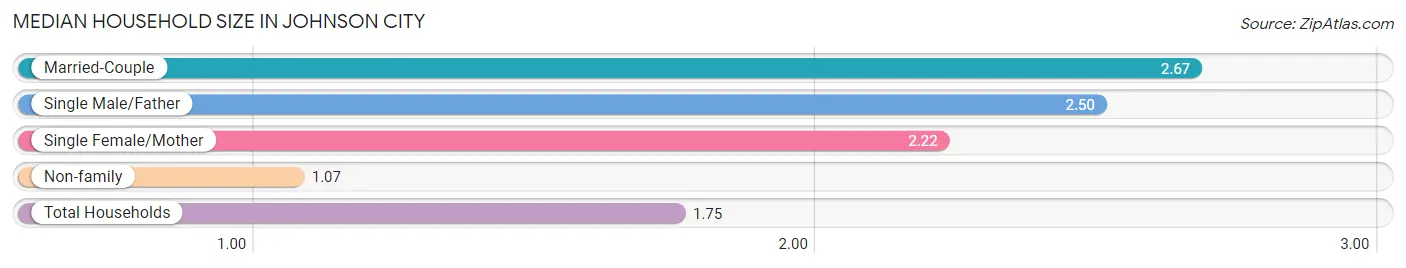
| Household Type | # Households | Household Size |
| Married-Couple | 85 (34.8%) | 2.67 |
| Single Male/Father | 2 (0.8%) | 2.50 |
| Single Female/Mother | 23 (9.4%) | 2.22 |
| Non-family | 134 (54.9%) | 1.07 |
| Total Households | 244 (100.0%) | 1.75 |
Household Size by Marriage Status in Johnson City
Out of a total of 244 households in Johnson City, 110 (45.1%) are family households, while 134 (54.9%) are nonfamily households. The most numerous type of family households are 2-person households, comprising 84, and the most common type of nonfamily households are 1-person households, comprising 124.
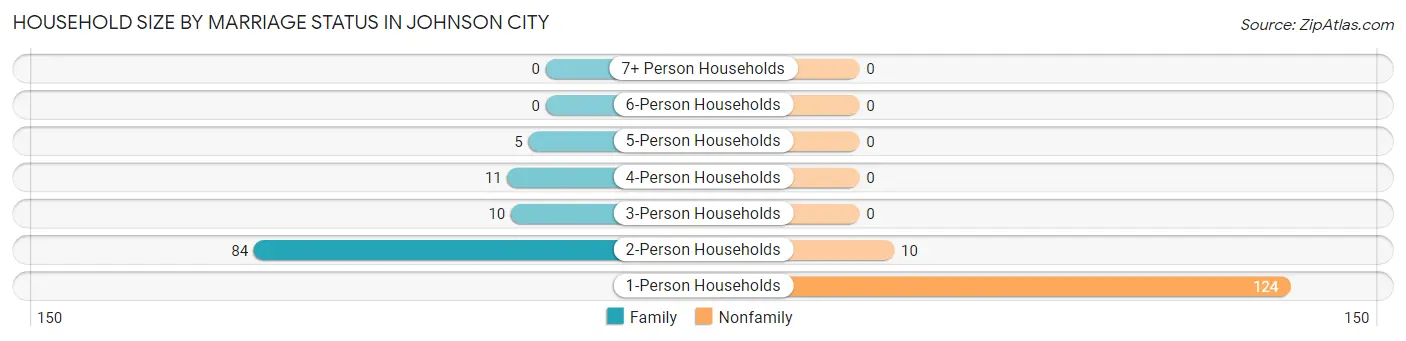
| Household Size | Family Households | Nonfamily Households |
| 1-Person Households | - | 124 (50.8%) |
| 2-Person Households | 84 (34.4%) | 10 (4.1%) |
| 3-Person Households | 10 (4.1%) | 0 (0.0%) |
| 4-Person Households | 11 (4.5%) | 0 (0.0%) |
| 5-Person Households | 5 (2.1%) | 0 (0.0%) |
| 6-Person Households | 0 (0.0%) | 0 (0.0%) |
| 7+ Person Households | 0 (0.0%) | 0 (0.0%) |
| Total | 110 (45.1%) | 134 (54.9%) |
Female Fertility in Johnson City
Fertility by Age in Johnson City
Average fertility rate in Johnson City is 115.0 births per 1,000 women. Women in the age bracket of 20 to 34 years have the highest fertility rate with 400.0 births per 1,000 women. Women in the age bracket of 20 to 34 years acount for 66.7% of all women with births.
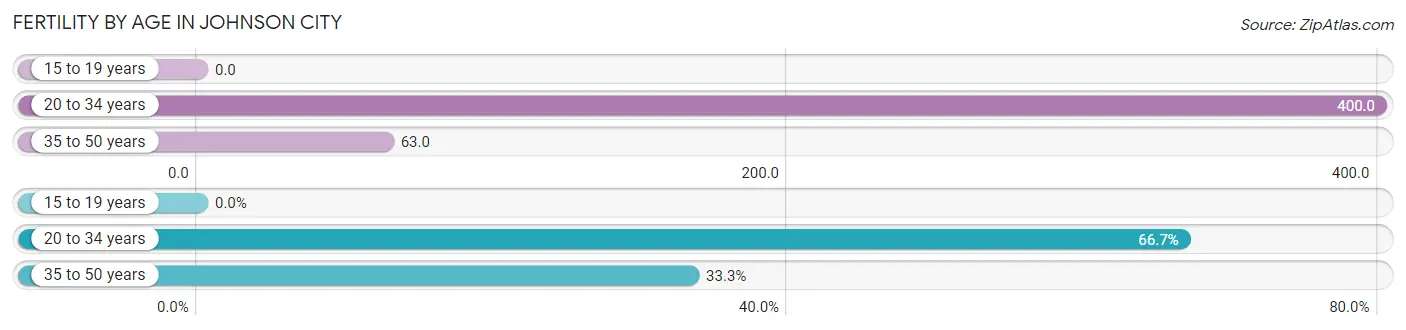
| Age Bracket | Women with Births | Births / 1,000 Women |
| 15 to 19 years | 0 (0.0%) | 0.0 |
| 20 to 34 years | 4 (66.7%) | 400.0 |
| 35 to 50 years | 2 (33.3%) | 63.0 |
| Total | 6 (100.0%) | 115.0 |
Fertility by Age by Marriage Status in Johnson City
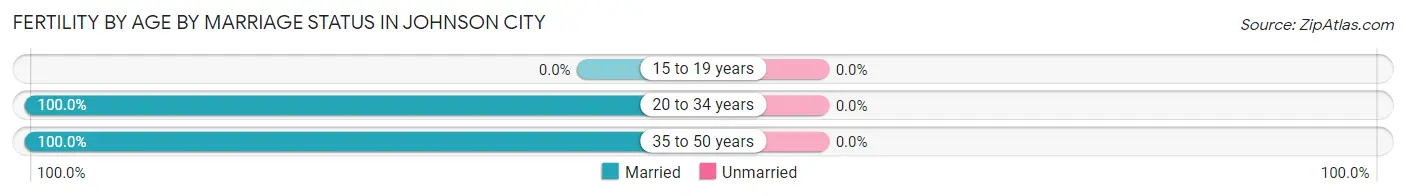
| Age Bracket | Married | Unmarried |
| 15 to 19 years | 0 (0.0%) | 0 (0.0%) |
| 20 to 34 years | 4 (100.0%) | 0 (0.0%) |
| 35 to 50 years | 2 (100.0%) | 0 (0.0%) |
| Total | 6 (100.0%) | 0 (0.0%) |
Fertility by Education in Johnson City
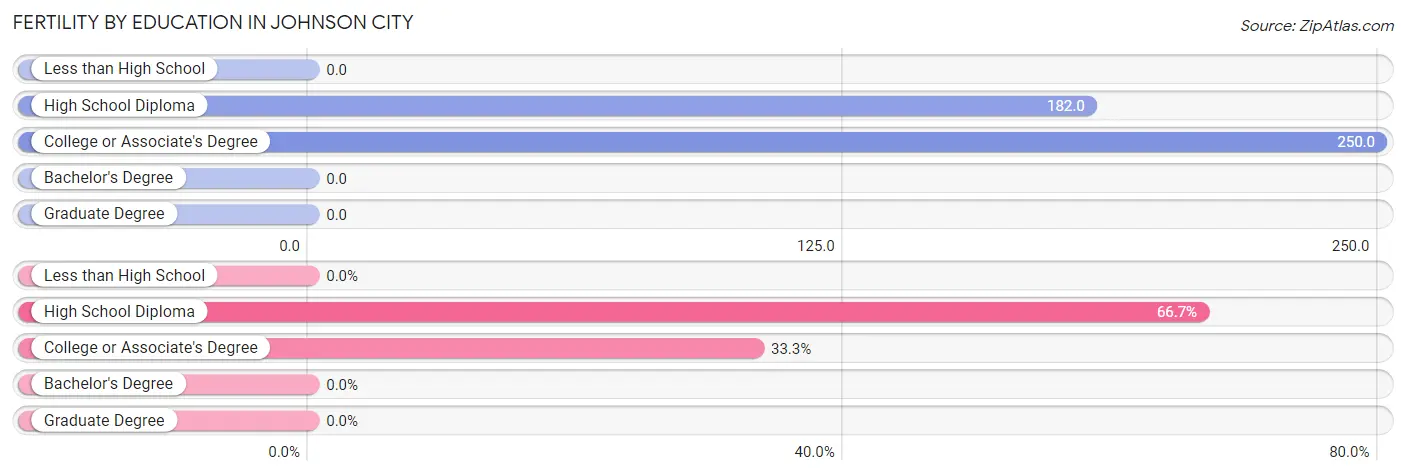
| Educational Attainment | Women with Births | Births / 1,000 Women |
| Less than High School | 0 (0.0%) | 0.0 |
| High School Diploma | 4 (66.7%) | 182.0 |
| College or Associate's Degree | 2 (33.3%) | 250.0 |
| Bachelor's Degree | 0 (0.0%) | 0.0 |
| Graduate Degree | 0 (0.0%) | 0.0 |
| Total | 6 (100.0%) | 115.0 |
Fertility by Education by Marriage Status in Johnson City
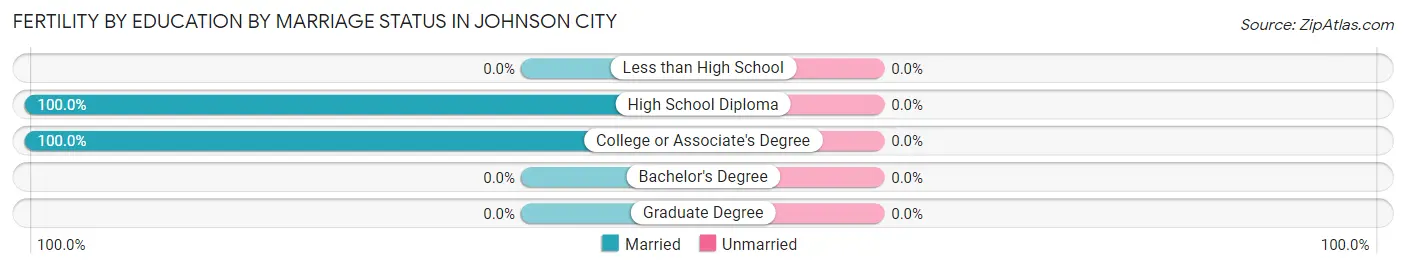
| Educational Attainment | Married | Unmarried |
| Less than High School | 0 (0.0%) | 0 (0.0%) |
| High School Diploma | 4 (100.0%) | 0 (0.0%) |
| College or Associate's Degree | 2 (100.0%) | 0 (0.0%) |
| Bachelor's Degree | 0 (0.0%) | 0 (0.0%) |
| Graduate Degree | 0 (0.0%) | 0 (0.0%) |
| Total | 6 (100.0%) | 0 (0.0%) |
Employment Characteristics in Johnson City
Employment by Class of Employer in Johnson City
Among the 213 employed individuals in Johnson City, private company employees (137 | 64.3%), not-for-profit organizations (32 | 15.0%), and local government employees (20 | 9.4%) make up the most common classes of employment.
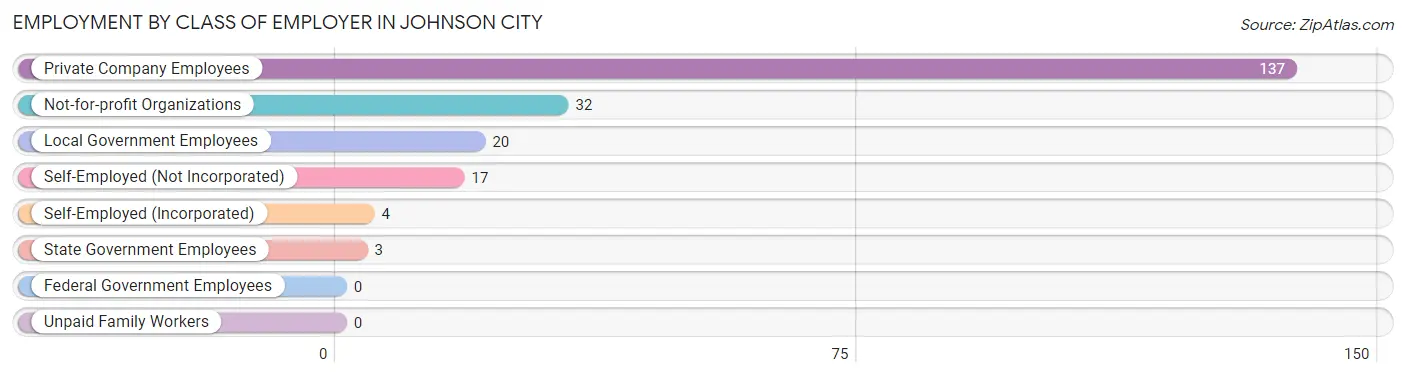
| Employer Class | # Employees | % Employees |
| Private Company Employees | 137 | 64.3% |
| Self-Employed (Incorporated) | 4 | 1.9% |
| Self-Employed (Not Incorporated) | 17 | 8.0% |
| Not-for-profit Organizations | 32 | 15.0% |
| Local Government Employees | 20 | 9.4% |
| State Government Employees | 3 | 1.4% |
| Federal Government Employees | 0 | 0.0% |
| Unpaid Family Workers | 0 | 0.0% |
| Total | 213 | 100.0% |
Employment Status by Age in Johnson City
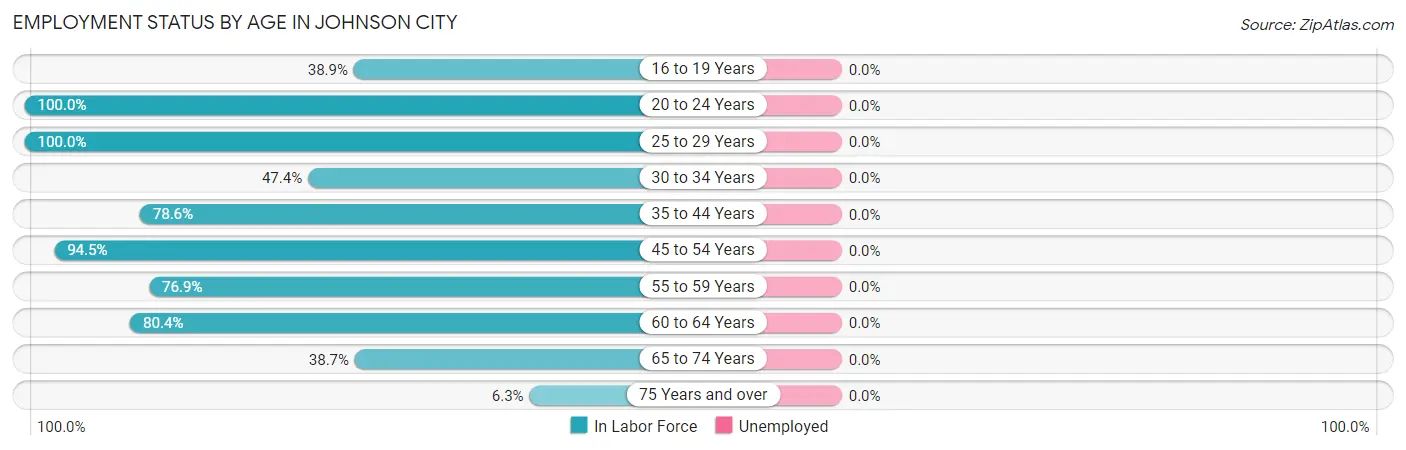
| Age Bracket | In Labor Force | Unemployed |
| 16 to 19 Years | 7 (38.9%) | 0 (0.0%) |
| 20 to 24 Years | 11 (100.0%) | 0 (0.0%) |
| 25 to 29 Years | 10 (100.0%) | 0 (0.0%) |
| 30 to 34 Years | 9 (47.4%) | 0 (0.0%) |
| 35 to 44 Years | 33 (78.6%) | 0 (0.0%) |
| 45 to 54 Years | 69 (94.5%) | 0 (0.0%) |
| 55 to 59 Years | 20 (76.9%) | 0 (0.0%) |
| 60 to 64 Years | 45 (80.4%) | 0 (0.0%) |
| 65 to 74 Years | 24 (38.7%) | 0 (0.0%) |
| 75 Years and over | 4 (6.3%) | 0 (0.0%) |
| Total | 232 (60.9%) | 0 (0.0%) |
Employment Status by Educational Attainment in Johnson City
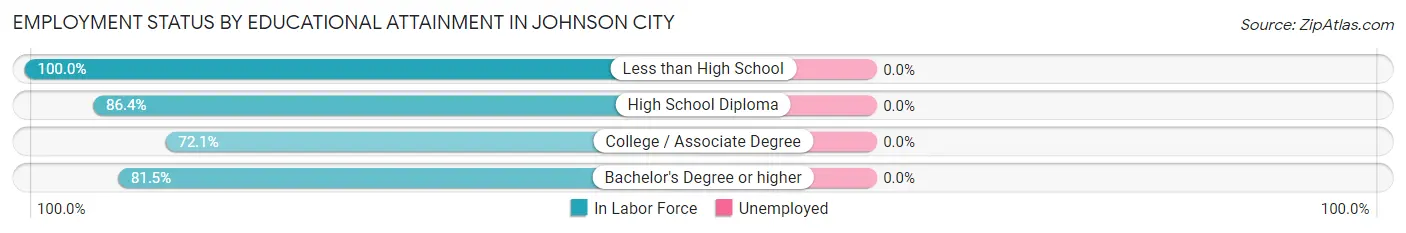
| Educational Attainment | In Labor Force | Unemployed |
| Less than High School | 32 (100.0%) | 0 (0.0%) |
| High School Diploma | 70 (86.4%) | 0 (0.0%) |
| College / Associate Degree | 62 (72.1%) | 0 (0.0%) |
| Bachelor's Degree or higher | 22 (81.5%) | 0 (0.0%) |
| Total | 186 (82.3%) | 0 (0.0%) |
Employment Occupations by Sex in Johnson City
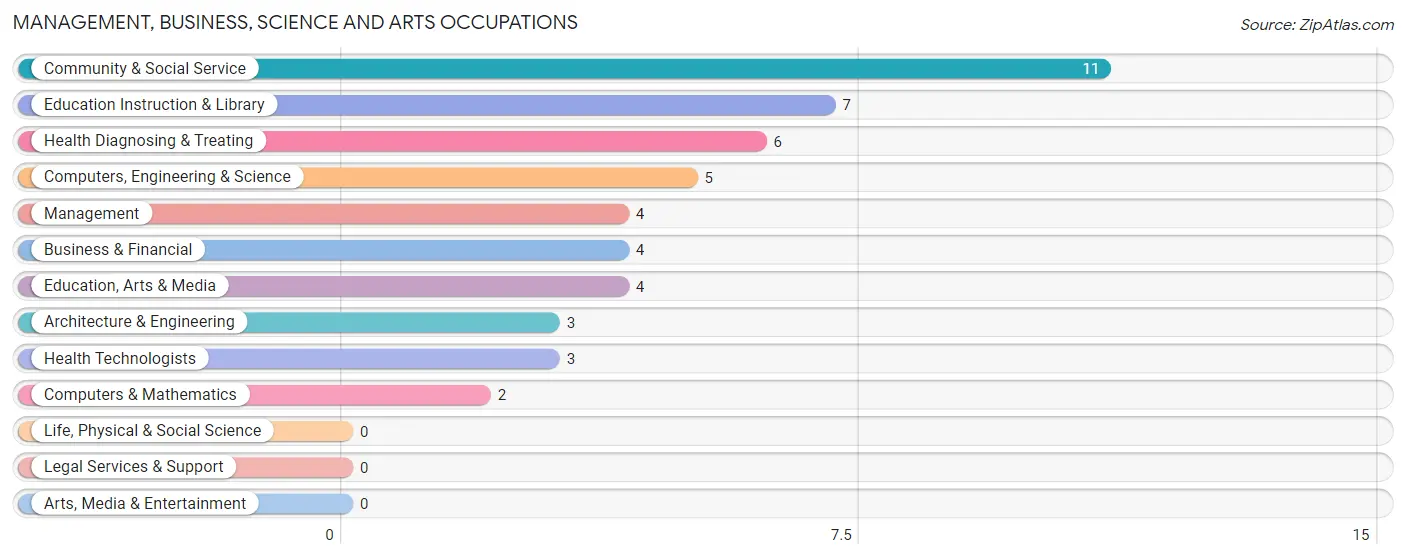
Management, Business, Science and Arts Occupations
The most common Management, Business, Science and Arts occupations in Johnson City are Community & Social Service (11 | 4.7%), Education Instruction & Library (7 | 3.0%), Health Diagnosing & Treating (6 | 2.6%), Computers, Engineering & Science (5 | 2.2%), and Management (4 | 1.7%).
Management, Business, Science and Arts Occupations by Sex
Within the Management, Business, Science and Arts occupations in Johnson City, the most male-oriented occupations are Architecture & Engineering (100.0%), Computers, Engineering & Science (60.0%), and Business & Financial (50.0%), while the most female-oriented occupations are Management (100.0%), Computers & Mathematics (100.0%), and Community & Social Service (100.0%).
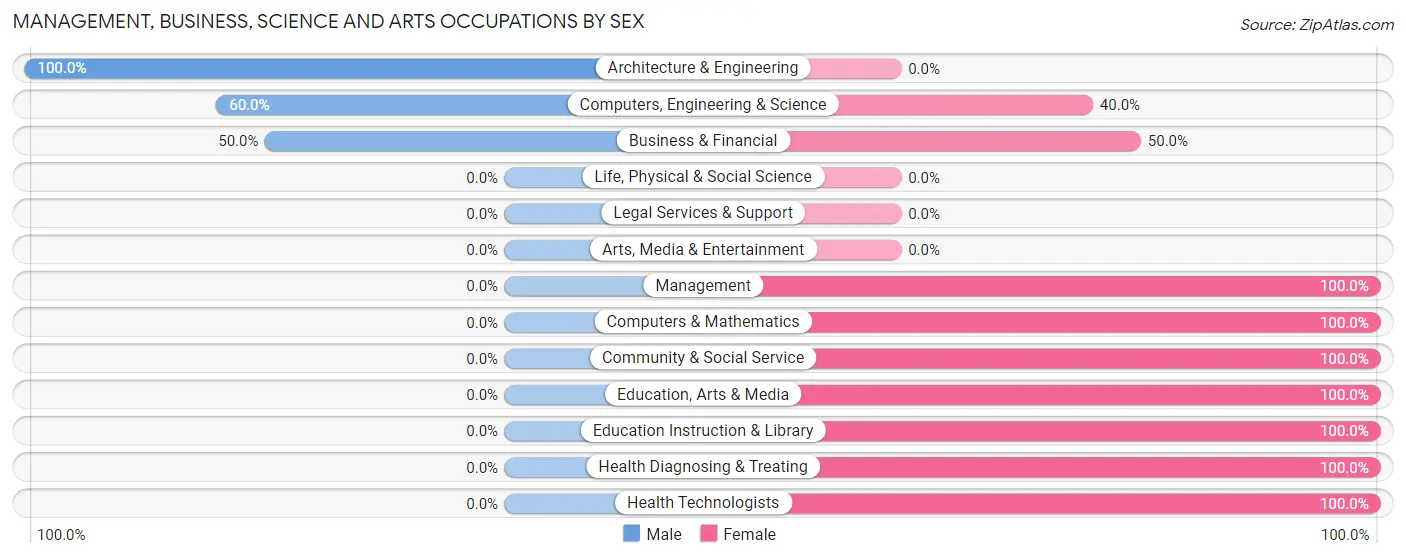
| Occupation | Male | Female |
| Management | 0 (0.0%) | 4 (100.0%) |
| Business & Financial | 2 (50.0%) | 2 (50.0%) |
| Computers, Engineering & Science | 3 (60.0%) | 2 (40.0%) |
| Computers & Mathematics | 0 (0.0%) | 2 (100.0%) |
| Architecture & Engineering | 3 (100.0%) | 0 (0.0%) |
| Life, Physical & Social Science | 0 (0.0%) | 0 (0.0%) |
| Community & Social Service | 0 (0.0%) | 11 (100.0%) |
| Education, Arts & Media | 0 (0.0%) | 4 (100.0%) |
| Legal Services & Support | 0 (0.0%) | 0 (0.0%) |
| Education Instruction & Library | 0 (0.0%) | 7 (100.0%) |
| Arts, Media & Entertainment | 0 (0.0%) | 0 (0.0%) |
| Health Diagnosing & Treating | 0 (0.0%) | 6 (100.0%) |
| Health Technologists | 0 (0.0%) | 3 (100.0%) |
| Total (Category) | 5 (16.7%) | 25 (83.3%) |
| Total (Overall) | 94 (40.5%) | 138 (59.5%) |
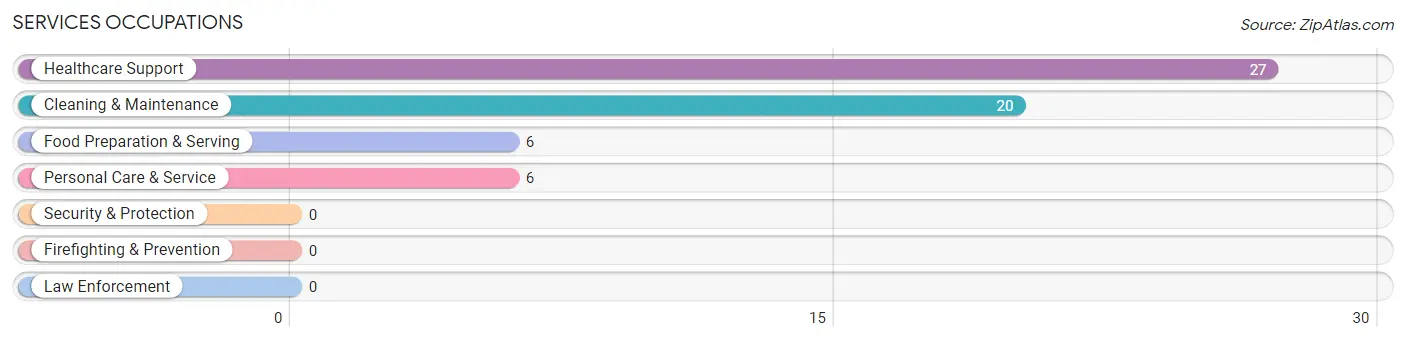
Services Occupations
The most common Services occupations in Johnson City are Healthcare Support (27 | 11.6%), Cleaning & Maintenance (20 | 8.6%), Food Preparation & Serving (6 | 2.6%), and Personal Care & Service (6 | 2.6%).
Services Occupations by Sex
Within the Services occupations in Johnson City, the most male-oriented occupations are Food Preparation & Serving (66.7%), and Cleaning & Maintenance (55.0%), while the most female-oriented occupations are Healthcare Support (100.0%), Personal Care & Service (100.0%), and Cleaning & Maintenance (45.0%).
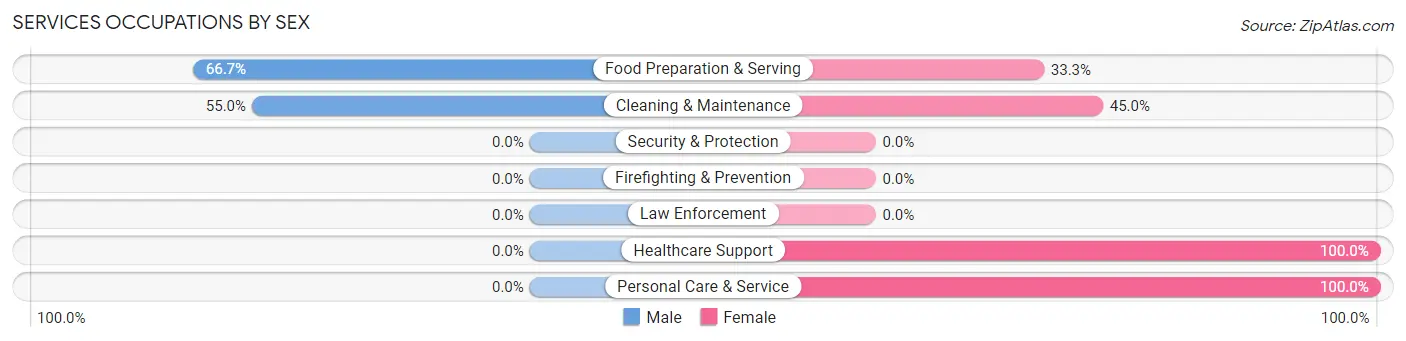
| Occupation | Male | Female |
| Healthcare Support | 0 (0.0%) | 27 (100.0%) |
| Security & Protection | 0 (0.0%) | 0 (0.0%) |
| Firefighting & Prevention | 0 (0.0%) | 0 (0.0%) |
| Law Enforcement | 0 (0.0%) | 0 (0.0%) |
| Food Preparation & Serving | 4 (66.7%) | 2 (33.3%) |
| Cleaning & Maintenance | 11 (55.0%) | 9 (45.0%) |
| Personal Care & Service | 0 (0.0%) | 6 (100.0%) |
| Total (Category) | 15 (25.4%) | 44 (74.6%) |
| Total (Overall) | 94 (40.5%) | 138 (59.5%) |
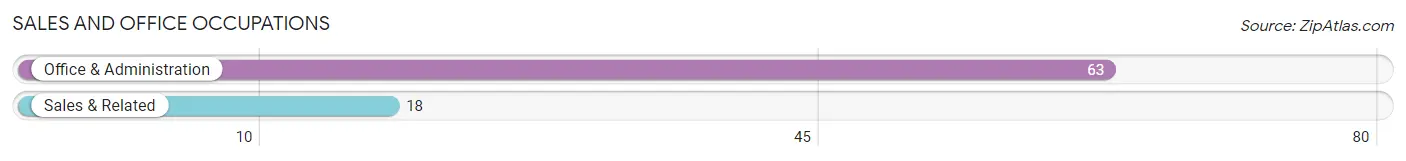
Sales and Office Occupations
The most common Sales and Office occupations in Johnson City are Office & Administration (63 | 27.2%), and Sales & Related (18 | 7.8%).
Sales and Office Occupations by Sex
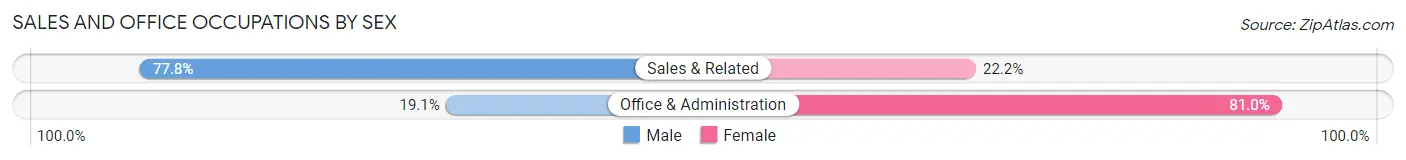
| Occupation | Male | Female |
| Sales & Related | 14 (77.8%) | 4 (22.2%) |
| Office & Administration | 12 (19.1%) | 51 (80.9%) |
| Total (Category) | 26 (32.1%) | 55 (67.9%) |
| Total (Overall) | 94 (40.5%) | 138 (59.5%) |
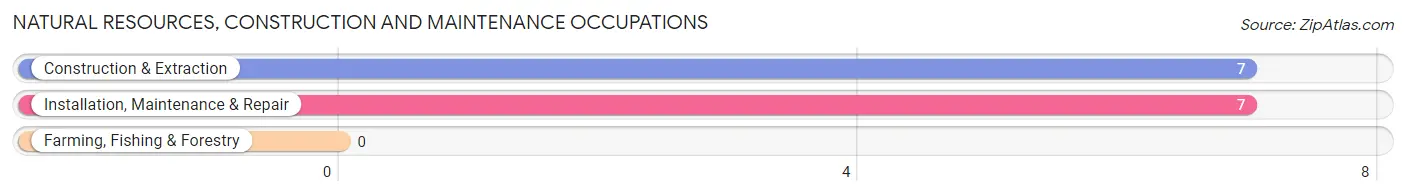
Natural Resources, Construction and Maintenance Occupations
The most common Natural Resources, Construction and Maintenance occupations in Johnson City are Construction & Extraction (7 | 3.0%), and Installation, Maintenance & Repair (7 | 3.0%).
Natural Resources, Construction and Maintenance Occupations by Sex
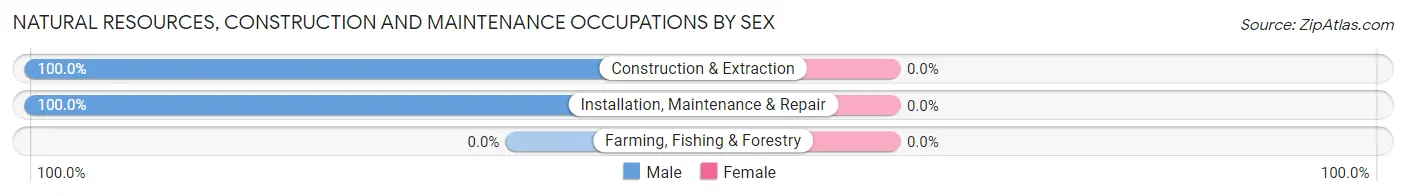
| Occupation | Male | Female |
| Farming, Fishing & Forestry | 0 (0.0%) | 0 (0.0%) |
| Construction & Extraction | 7 (100.0%) | 0 (0.0%) |
| Installation, Maintenance & Repair | 7 (100.0%) | 0 (0.0%) |
| Total (Category) | 14 (100.0%) | 0 (0.0%) |
| Total (Overall) | 94 (40.5%) | 138 (59.5%) |
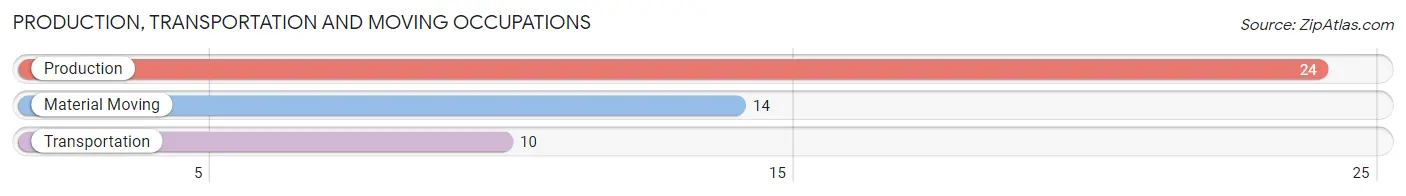
Production, Transportation and Moving Occupations
The most common Production, Transportation and Moving occupations in Johnson City are Production (24 | 10.3%), Material Moving (14 | 6.0%), and Transportation (10 | 4.3%).
Production, Transportation and Moving Occupations by Sex
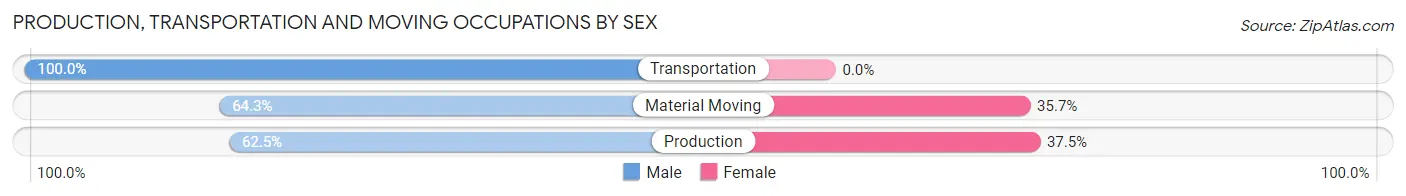
| Occupation | Male | Female |
| Production | 15 (62.5%) | 9 (37.5%) |
| Transportation | 10 (100.0%) | 0 (0.0%) |
| Material Moving | 9 (64.3%) | 5 (35.7%) |
| Total (Category) | 34 (70.8%) | 14 (29.2%) |
| Total (Overall) | 94 (40.5%) | 138 (59.5%) |
Employment Industries by Sex in Johnson City
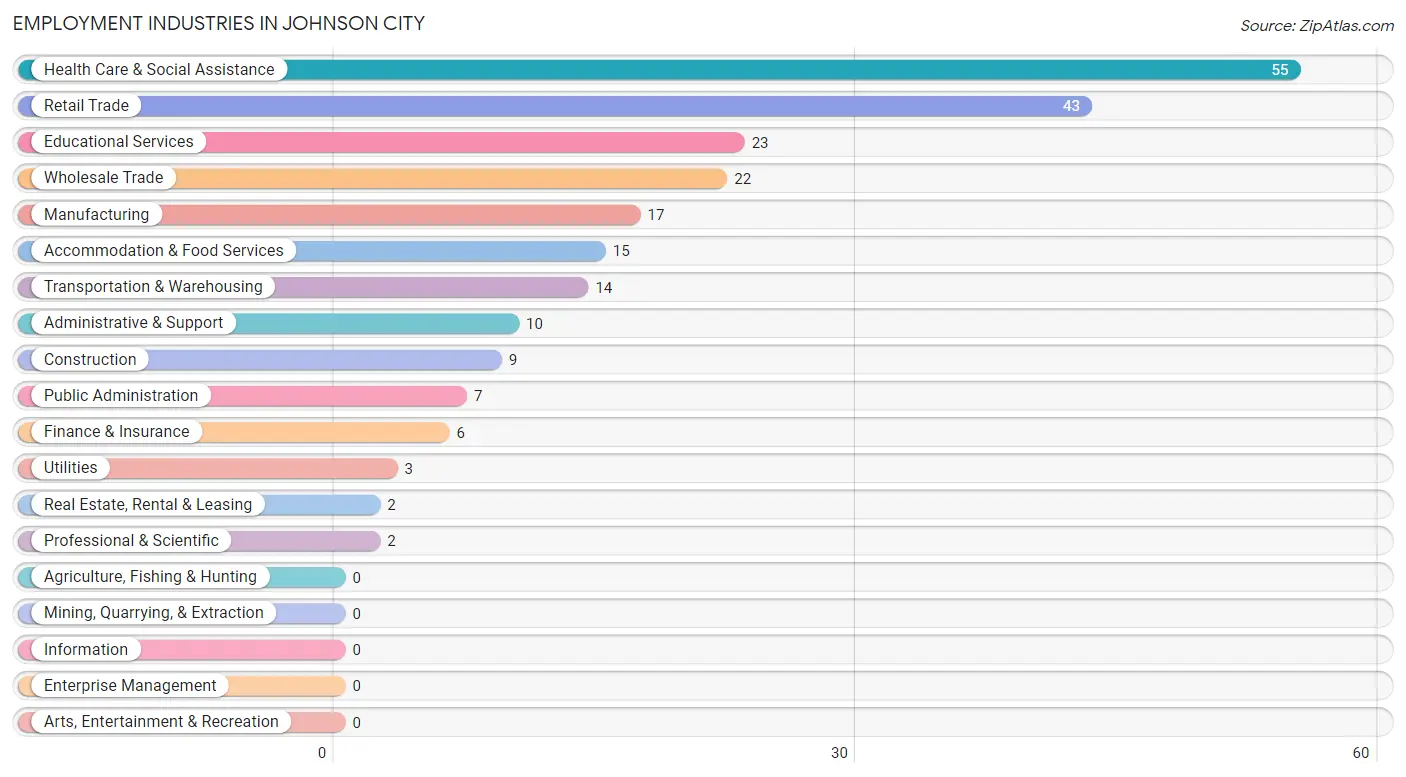
Employment Industries in Johnson City
The major employment industries in Johnson City include Health Care & Social Assistance (55 | 23.7%), Retail Trade (43 | 18.5%), Educational Services (23 | 9.9%), Wholesale Trade (22 | 9.5%), and Manufacturing (17 | 7.3%).
Employment Industries by Sex in Johnson City
The Johnson City industries that see more men than women are Real Estate, Rental & Leasing (100.0%), Wholesale Trade (90.9%), and Construction (77.8%), whereas the industries that tend to have a higher number of women are Professional & Scientific (100.0%), Public Administration (100.0%), and Health Care & Social Assistance (89.1%).
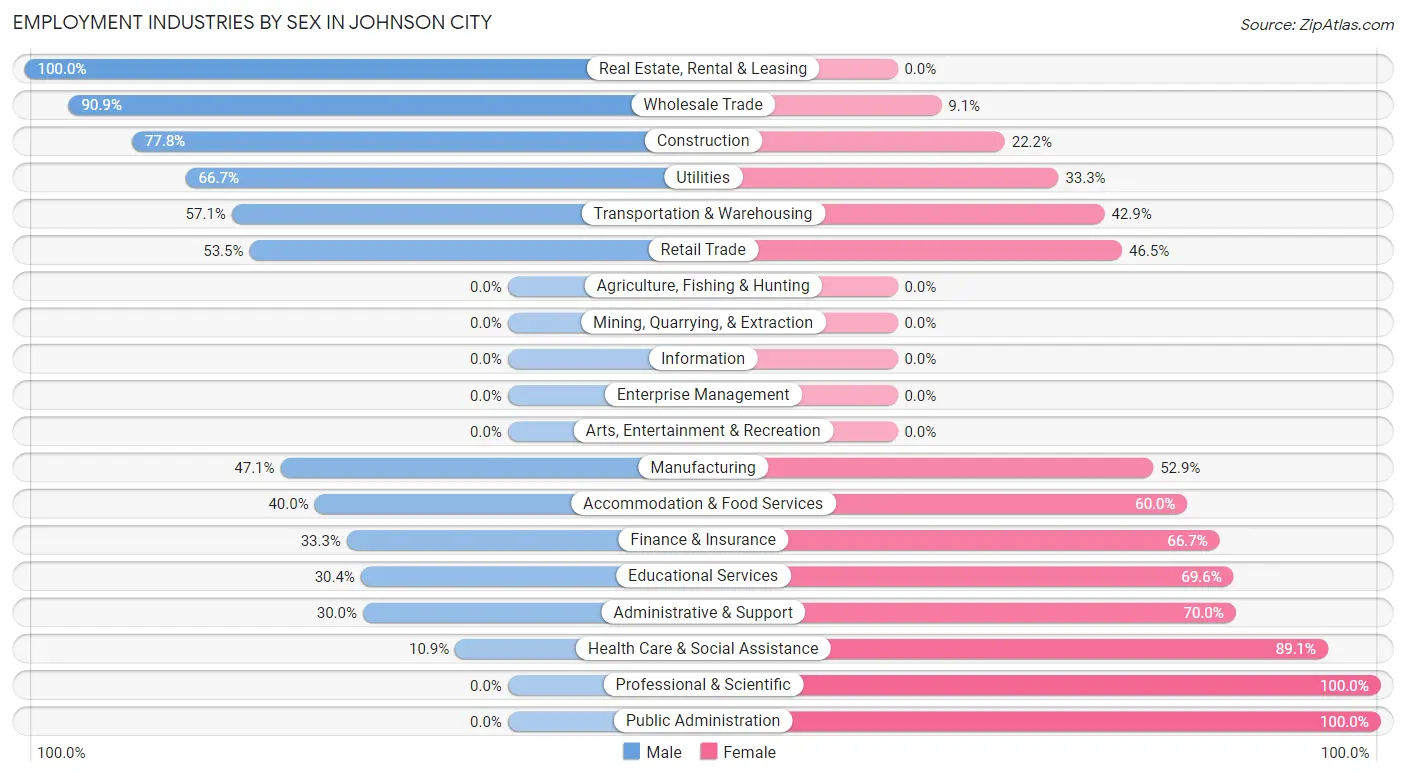
| Industry | Male | Female |
| Agriculture, Fishing & Hunting | 0 (0.0%) | 0 (0.0%) |
| Mining, Quarrying, & Extraction | 0 (0.0%) | 0 (0.0%) |
| Construction | 7 (77.8%) | 2 (22.2%) |
| Manufacturing | 8 (47.1%) | 9 (52.9%) |
| Wholesale Trade | 20 (90.9%) | 2 (9.1%) |
| Retail Trade | 23 (53.5%) | 20 (46.5%) |
| Transportation & Warehousing | 8 (57.1%) | 6 (42.9%) |
| Utilities | 2 (66.7%) | 1 (33.3%) |
| Information | 0 (0.0%) | 0 (0.0%) |
| Finance & Insurance | 2 (33.3%) | 4 (66.7%) |
| Real Estate, Rental & Leasing | 2 (100.0%) | 0 (0.0%) |
| Professional & Scientific | 0 (0.0%) | 2 (100.0%) |
| Enterprise Management | 0 (0.0%) | 0 (0.0%) |
| Administrative & Support | 3 (30.0%) | 7 (70.0%) |
| Educational Services | 7 (30.4%) | 16 (69.6%) |
| Health Care & Social Assistance | 6 (10.9%) | 49 (89.1%) |
| Arts, Entertainment & Recreation | 0 (0.0%) | 0 (0.0%) |
| Accommodation & Food Services | 6 (40.0%) | 9 (60.0%) |
| Public Administration | 0 (0.0%) | 7 (100.0%) |
| Total | 94 (40.5%) | 138 (59.5%) |
Education in Johnson City
School Enrollment in Johnson City
The most common levels of schooling among the 31 students in Johnson City are high school (15 | 48.4%), middle school (8 | 25.8%), and college / undergraduate (6 | 19.4%).
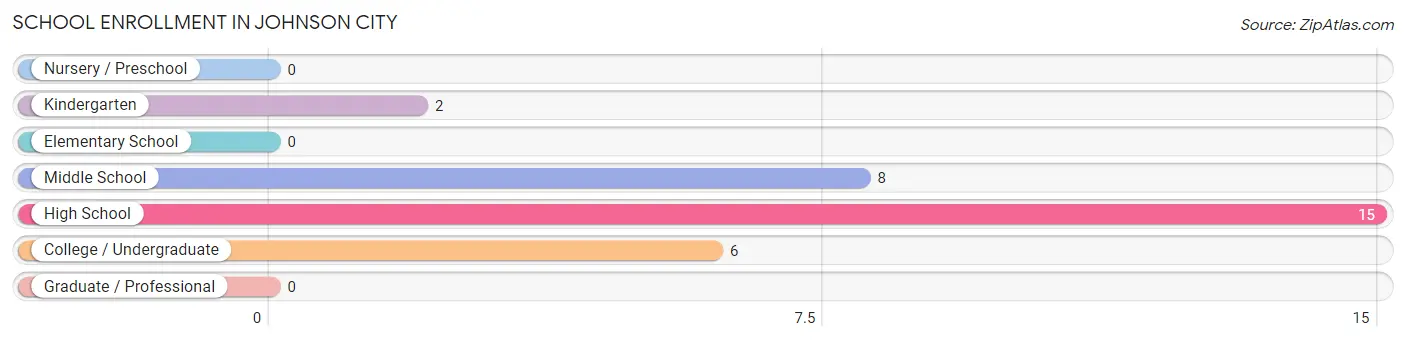
| School Level | # Students | % Students |
| Nursery / Preschool | 0 | 0.0% |
| Kindergarten | 2 | 6.5% |
| Elementary School | 0 | 0.0% |
| Middle School | 8 | 25.8% |
| High School | 15 | 48.4% |
| College / Undergraduate | 6 | 19.4% |
| Graduate / Professional | 0 | 0.0% |
| Total | 31 | 100.0% |
School Enrollment by Age by Funding Source in Johnson City
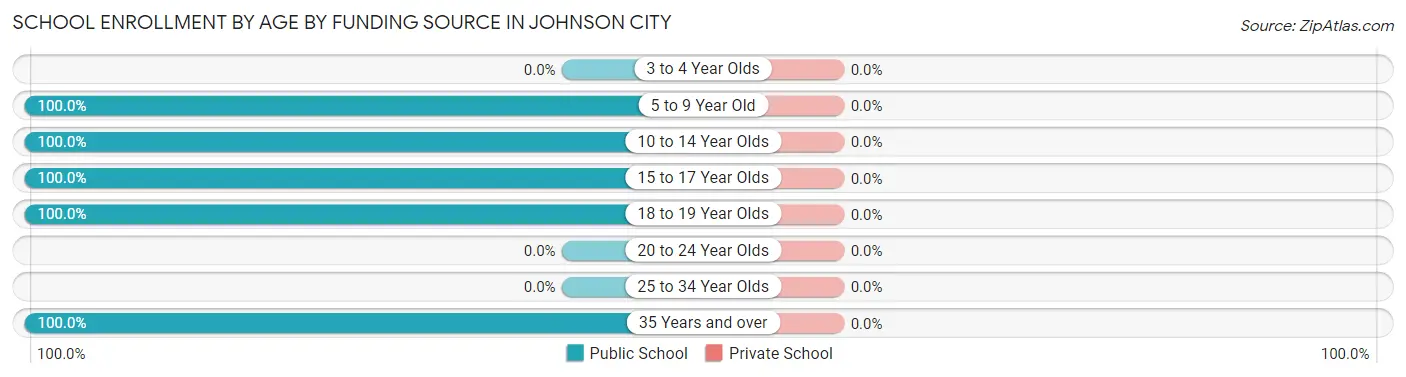
| Age Bracket | Public School | Private School |
| 3 to 4 Year Olds | 0 (0.0%) | 0 (0.0%) |
| 5 to 9 Year Old | 2 (100.0%) | 0 (0.0%) |
| 10 to 14 Year Olds | 8 (100.0%) | 0 (0.0%) |
| 15 to 17 Year Olds | 9 (100.0%) | 0 (0.0%) |
| 18 to 19 Year Olds | 6 (100.0%) | 0 (0.0%) |
| 20 to 24 Year Olds | 0 (0.0%) | 0 (0.0%) |
| 25 to 34 Year Olds | 0 (0.0%) | 0 (0.0%) |
| 35 Years and over | 6 (100.0%) | 0 (0.0%) |
| Total | 31 (100.0%) | 0 (0.0%) |
Educational Attainment by Field of Study in Johnson City
Liberal arts & history (14 | 31.8%), business (13 | 29.5%), science & technology (5 | 11.4%), social sciences (4 | 9.1%), and visual & performing arts (2 | 4.5%) are the most common fields of study among 44 individuals in Johnson City who have obtained a bachelor's degree or higher.
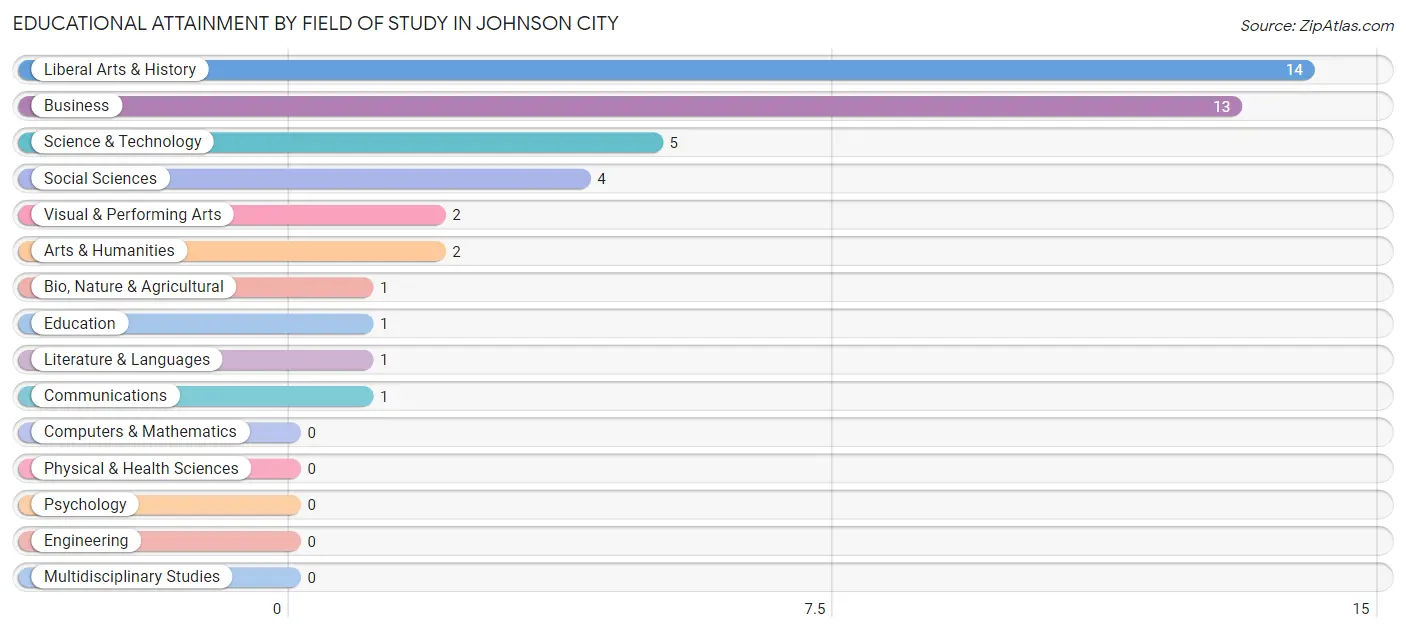
| Field of Study | # Graduates | % Graduates |
| Computers & Mathematics | 0 | 0.0% |
| Bio, Nature & Agricultural | 1 | 2.3% |
| Physical & Health Sciences | 0 | 0.0% |
| Psychology | 0 | 0.0% |
| Social Sciences | 4 | 9.1% |
| Engineering | 0 | 0.0% |
| Multidisciplinary Studies | 0 | 0.0% |
| Science & Technology | 5 | 11.4% |
| Business | 13 | 29.5% |
| Education | 1 | 2.3% |
| Literature & Languages | 1 | 2.3% |
| Liberal Arts & History | 14 | 31.8% |
| Visual & Performing Arts | 2 | 4.5% |
| Communications | 1 | 2.3% |
| Arts & Humanities | 2 | 4.5% |
| Total | 44 | 100.0% |
Transportation & Commute in Johnson City
Vehicle Availability by Sex in Johnson City
The most prevalent vehicle ownership categories in Johnson City are males with 2 vehicles (47, accounting for 58.0%) and females with 2 vehicles (55, making up 35.6%).
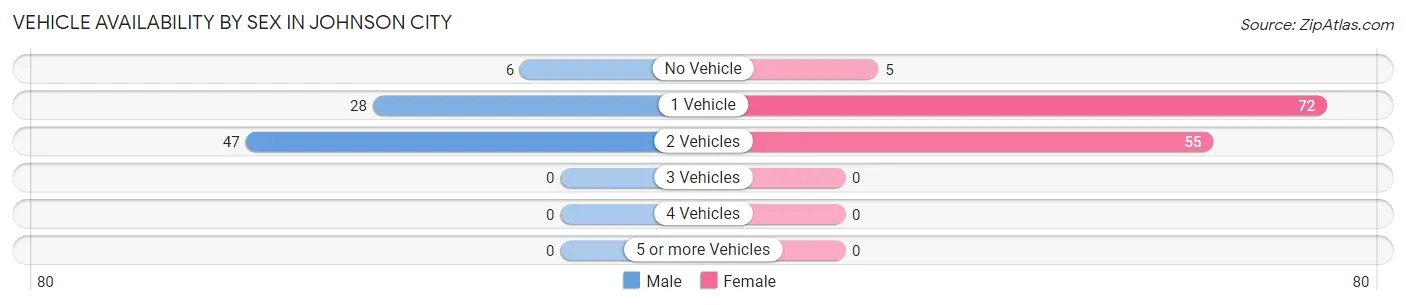
| Vehicles Available | Male | Female |
| No Vehicle | 6 (7.4%) | 5 (3.8%) |
| 1 Vehicle | 28 (34.6%) | 72 (54.5%) |
| 2 Vehicles | 47 (58.0%) | 55 (41.7%) |
| 3 Vehicles | 0 (0.0%) | 0 (0.0%) |
| 4 Vehicles | 0 (0.0%) | 0 (0.0%) |
| 5 or more Vehicles | 0 (0.0%) | 0 (0.0%) |
| Total | 81 (100.0%) | 132 (100.0%) |
Commute Time in Johnson City
The most frequently occuring commute durations in Johnson City are 10 to 14 minutes (49 commuters, 25.0%), 20 to 24 minutes (42 commuters, 21.4%), and 30 to 34 minutes (29 commuters, 14.8%).
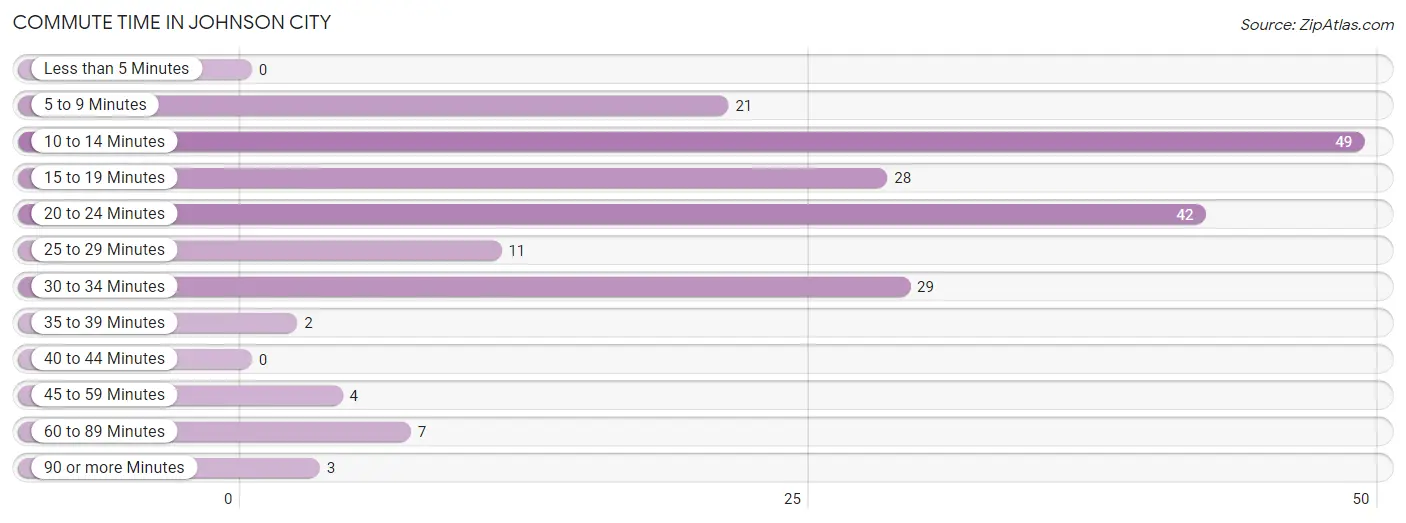
| Commute Time | # Commuters | % Commuters |
| Less than 5 Minutes | 0 | 0.0% |
| 5 to 9 Minutes | 21 | 10.7% |
| 10 to 14 Minutes | 49 | 25.0% |
| 15 to 19 Minutes | 28 | 14.3% |
| 20 to 24 Minutes | 42 | 21.4% |
| 25 to 29 Minutes | 11 | 5.6% |
| 30 to 34 Minutes | 29 | 14.8% |
| 35 to 39 Minutes | 2 | 1.0% |
| 40 to 44 Minutes | 0 | 0.0% |
| 45 to 59 Minutes | 4 | 2.0% |
| 60 to 89 Minutes | 7 | 3.6% |
| 90 or more Minutes | 3 | 1.5% |
Commute Time by Sex in Johnson City
The most common commute times in Johnson City are 20 to 24 minutes (24 commuters, 29.6%) for males and 10 to 14 minutes (37 commuters, 32.2%) for females.
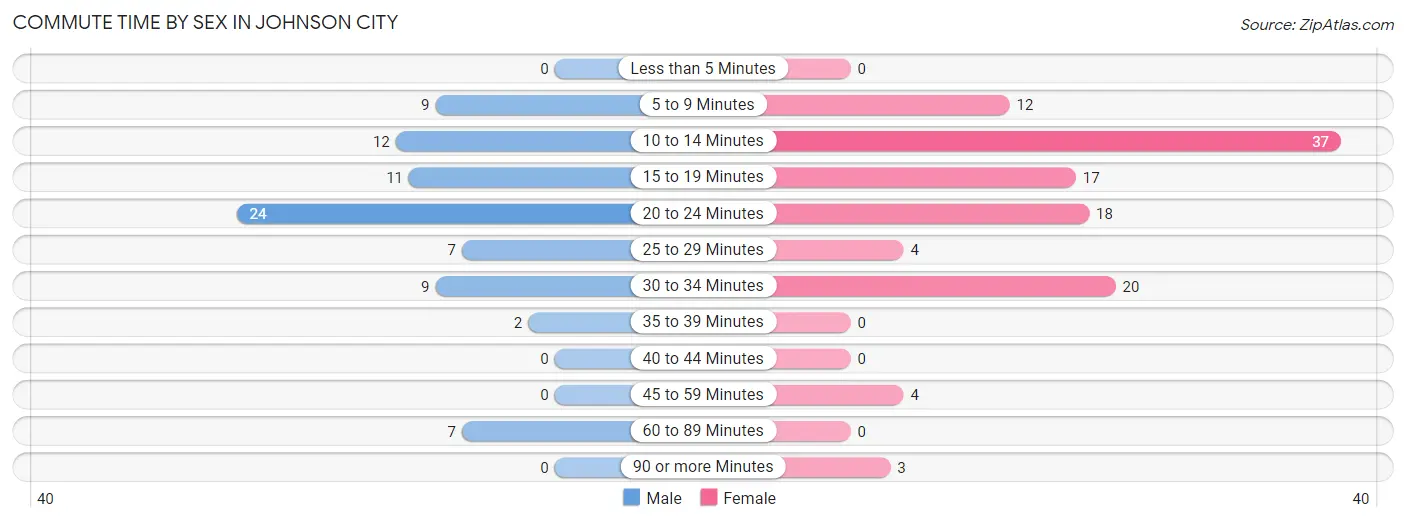
| Commute Time | Male | Female |
| Less than 5 Minutes | 0 (0.0%) | 0 (0.0%) |
| 5 to 9 Minutes | 9 (11.1%) | 12 (10.4%) |
| 10 to 14 Minutes | 12 (14.8%) | 37 (32.2%) |
| 15 to 19 Minutes | 11 (13.6%) | 17 (14.8%) |
| 20 to 24 Minutes | 24 (29.6%) | 18 (15.7%) |
| 25 to 29 Minutes | 7 (8.6%) | 4 (3.5%) |
| 30 to 34 Minutes | 9 (11.1%) | 20 (17.4%) |
| 35 to 39 Minutes | 2 (2.5%) | 0 (0.0%) |
| 40 to 44 Minutes | 0 (0.0%) | 0 (0.0%) |
| 45 to 59 Minutes | 0 (0.0%) | 4 (3.5%) |
| 60 to 89 Minutes | 7 (8.6%) | 0 (0.0%) |
| 90 or more Minutes | 0 (0.0%) | 3 (2.6%) |
Time of Departure to Work by Sex in Johnson City
The most frequent times of departure to work in Johnson City are 4:00 PM to 11:59 PM (23, 28.4%) for males and 7:00 AM to 7:29 AM (24, 20.9%) for females.
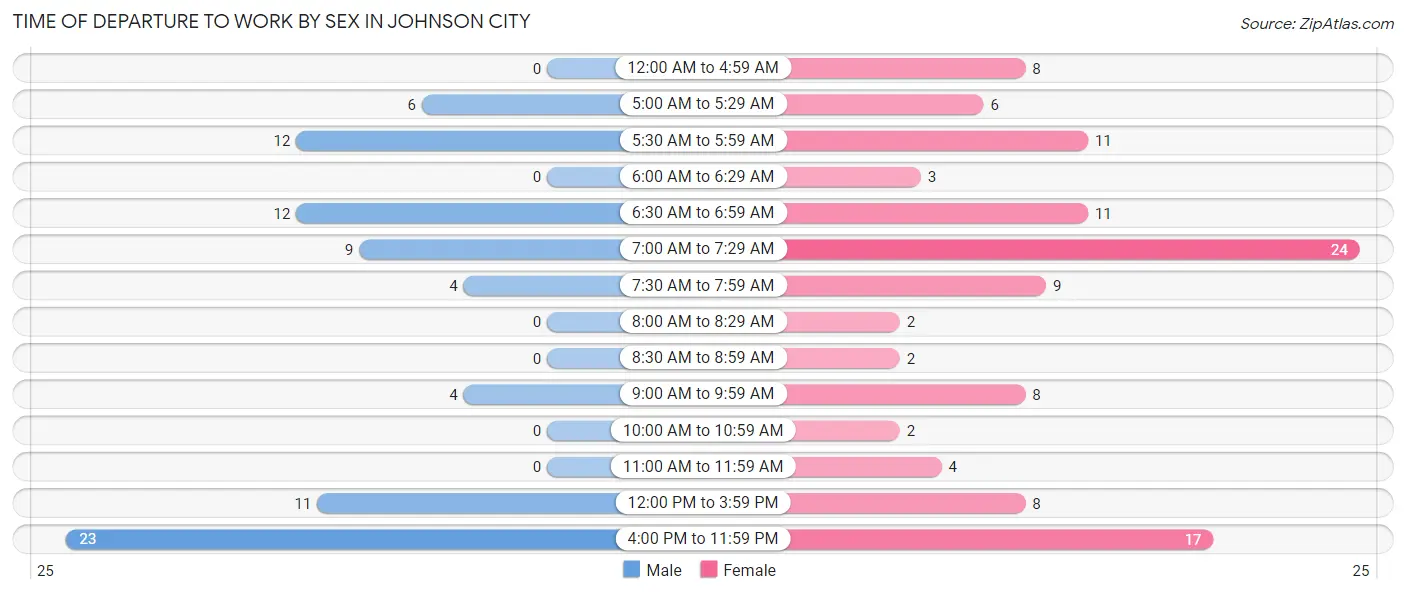
| Time of Departure | Male | Female |
| 12:00 AM to 4:59 AM | 0 (0.0%) | 8 (7.0%) |
| 5:00 AM to 5:29 AM | 6 (7.4%) | 6 (5.2%) |
| 5:30 AM to 5:59 AM | 12 (14.8%) | 11 (9.6%) |
| 6:00 AM to 6:29 AM | 0 (0.0%) | 3 (2.6%) |
| 6:30 AM to 6:59 AM | 12 (14.8%) | 11 (9.6%) |
| 7:00 AM to 7:29 AM | 9 (11.1%) | 24 (20.9%) |
| 7:30 AM to 7:59 AM | 4 (4.9%) | 9 (7.8%) |
| 8:00 AM to 8:29 AM | 0 (0.0%) | 2 (1.7%) |
| 8:30 AM to 8:59 AM | 0 (0.0%) | 2 (1.7%) |
| 9:00 AM to 9:59 AM | 4 (4.9%) | 8 (7.0%) |
| 10:00 AM to 10:59 AM | 0 (0.0%) | 2 (1.7%) |
| 11:00 AM to 11:59 AM | 0 (0.0%) | 4 (3.5%) |
| 12:00 PM to 3:59 PM | 11 (13.6%) | 8 (7.0%) |
| 4:00 PM to 11:59 PM | 23 (28.4%) | 17 (14.8%) |
| Total | 81 (100.0%) | 115 (100.0%) |
Housing Occupancy in Johnson City
Occupancy by Ownership in Johnson City
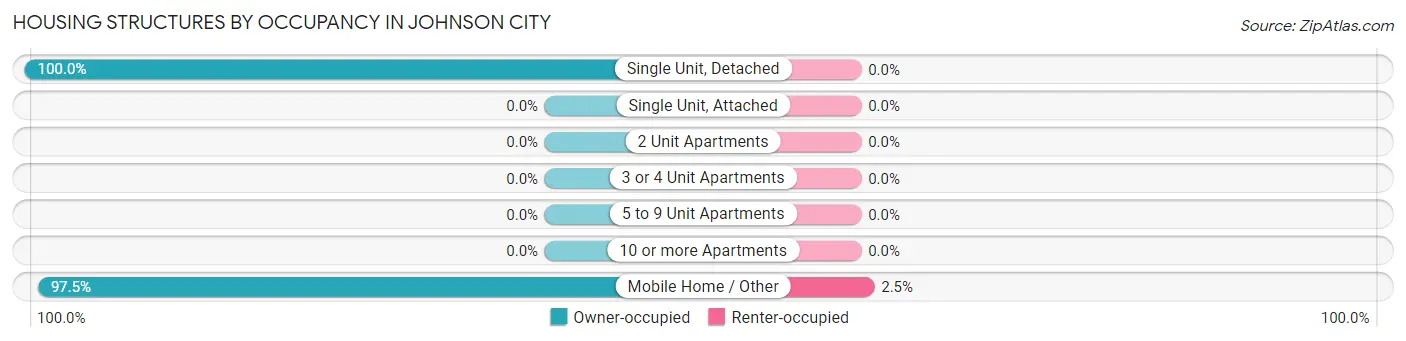
Of the total 244 dwellings in Johnson City, owner-occupied units account for 238 (97.5%), while renter-occupied units make up 6 (2.5%).
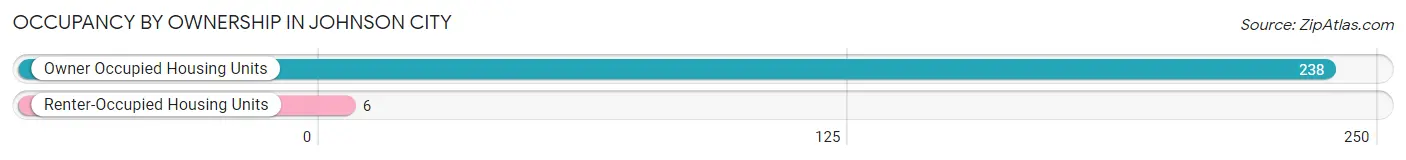
| Occupancy | # Housing Units | % Housing Units |
| Owner Occupied Housing Units | 238 | 97.5% |
| Renter-Occupied Housing Units | 6 | 2.5% |
| Total Occupied Housing Units | 244 | 100.0% |
Occupancy by Household Size in Johnson City
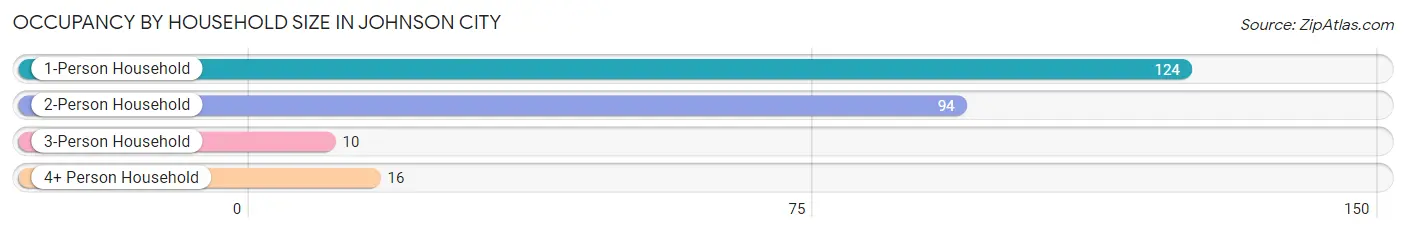
| Household Size | # Housing Units | % Housing Units |
| 1-Person Household | 124 | 50.8% |
| 2-Person Household | 94 | 38.5% |
| 3-Person Household | 10 | 4.1% |
| 4+ Person Household | 16 | 6.6% |
| Total Housing Units | 244 | 100.0% |
Occupancy by Ownership by Household Size in Johnson City
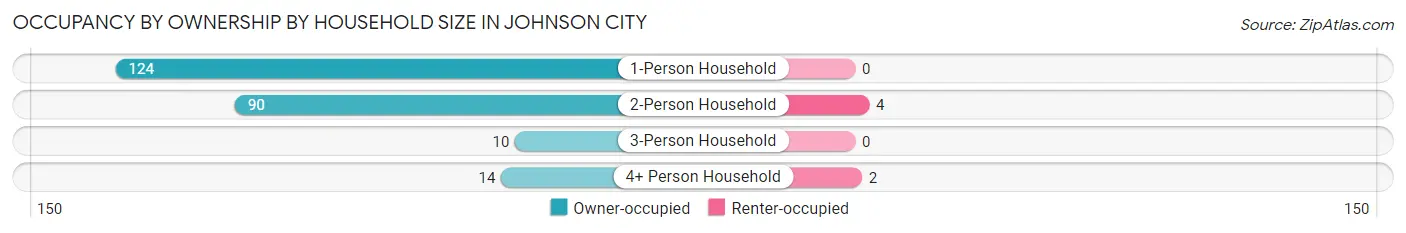
| Household Size | Owner-occupied | Renter-occupied |
| 1-Person Household | 124 (100.0%) | 0 (0.0%) |
| 2-Person Household | 90 (95.7%) | 4 (4.3%) |
| 3-Person Household | 10 (100.0%) | 0 (0.0%) |
| 4+ Person Household | 14 (87.5%) | 2 (12.5%) |
| Total Housing Units | 238 (97.5%) | 6 (2.5%) |
Occupancy by Educational Attainment in Johnson City
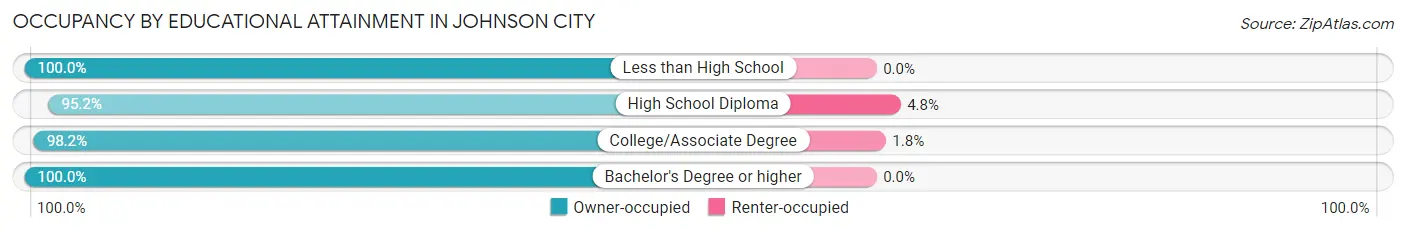
| Household Size | Owner-occupied | Renter-occupied |
| Less than High School | 22 (100.0%) | 0 (0.0%) |
| High School Diploma | 80 (95.2%) | 4 (4.8%) |
| College/Associate Degree | 107 (98.2%) | 2 (1.8%) |
| Bachelor's Degree or higher | 29 (100.0%) | 0 (0.0%) |
Occupancy by Age of Householder in Johnson City
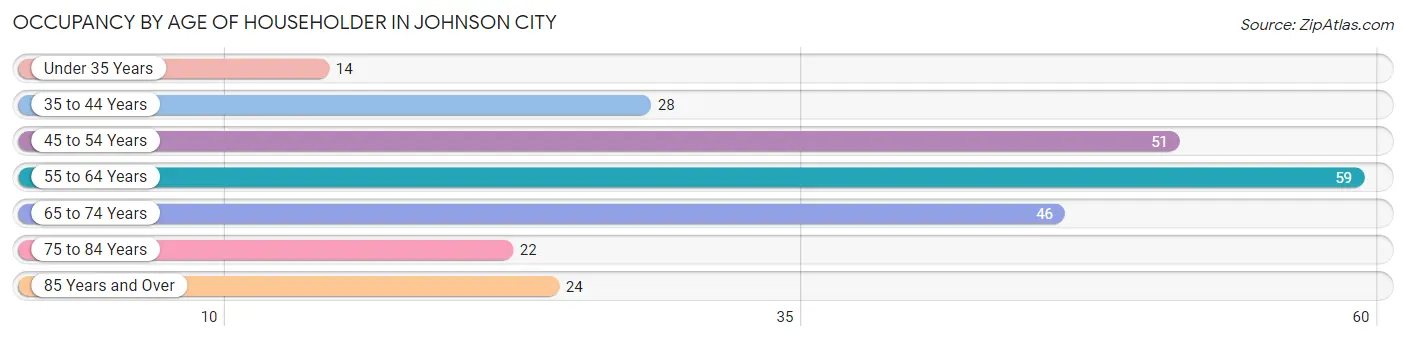
| Age Bracket | # Households | % Households |
| Under 35 Years | 14 | 5.7% |
| 35 to 44 Years | 28 | 11.5% |
| 45 to 54 Years | 51 | 20.9% |
| 55 to 64 Years | 59 | 24.2% |
| 65 to 74 Years | 46 | 18.9% |
| 75 to 84 Years | 22 | 9.0% |
| 85 Years and Over | 24 | 9.8% |
| Total | 244 | 100.0% |
Housing Finances in Johnson City
Median Income by Occupancy in Johnson City
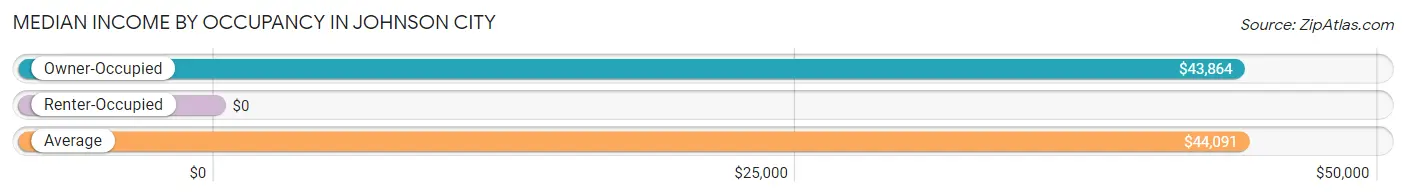
| Occupancy Type | # Households | Median Income |
| Owner-Occupied | 238 (97.5%) | $43,864 |
| Renter-Occupied | 6 (2.5%) | $0 |
| Average | 244 (100.0%) | $44,091 |
Occupancy by Householder Income Bracket in Johnson City
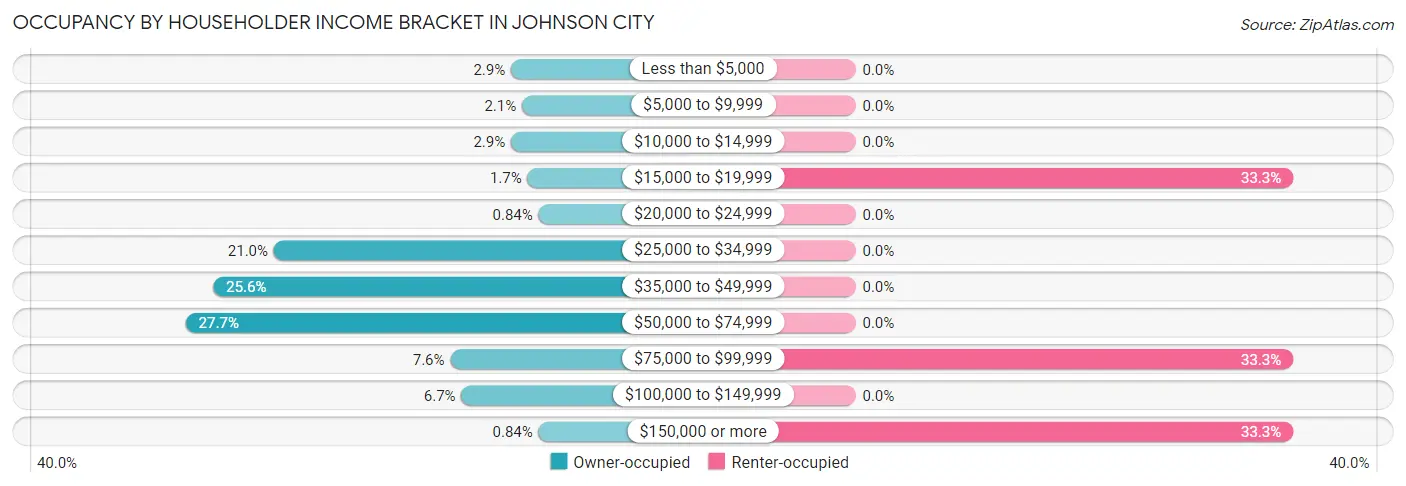
| Income Bracket | Owner-occupied | Renter-occupied |
| Less than $5,000 | 7 (2.9%) | 0 (0.0%) |
| $5,000 to $9,999 | 5 (2.1%) | 0 (0.0%) |
| $10,000 to $14,999 | 7 (2.9%) | 0 (0.0%) |
| $15,000 to $19,999 | 4 (1.7%) | 2 (33.3%) |
| $20,000 to $24,999 | 2 (0.8%) | 0 (0.0%) |
| $25,000 to $34,999 | 50 (21.0%) | 0 (0.0%) |
| $35,000 to $49,999 | 61 (25.6%) | 0 (0.0%) |
| $50,000 to $74,999 | 66 (27.7%) | 0 (0.0%) |
| $75,000 to $99,999 | 18 (7.6%) | 2 (33.3%) |
| $100,000 to $149,999 | 16 (6.7%) | 0 (0.0%) |
| $150,000 or more | 2 (0.8%) | 2 (33.3%) |
| Total | 238 (100.0%) | 6 (100.0%) |
Monthly Housing Cost Tiers in Johnson City
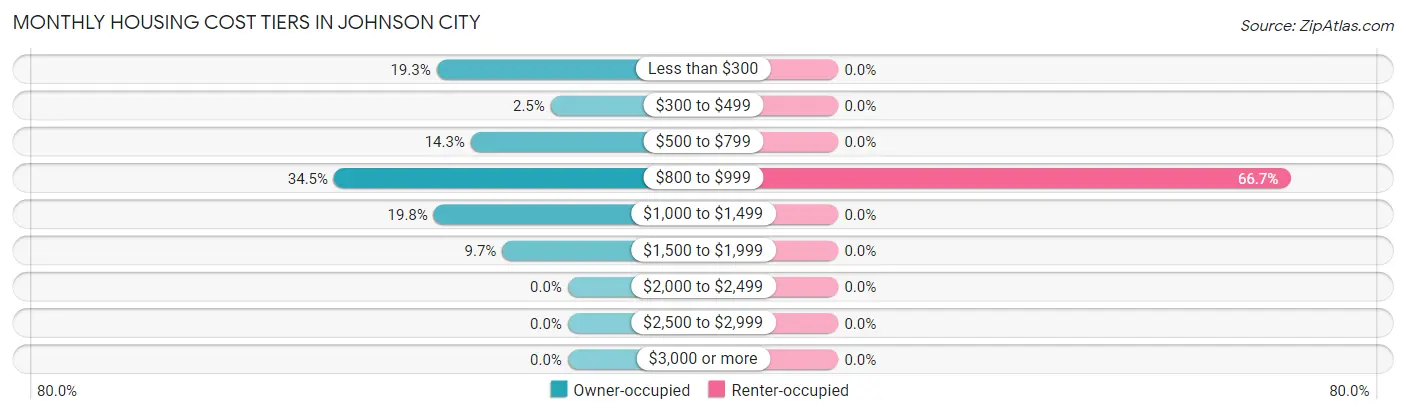
| Monthly Cost | Owner-occupied | Renter-occupied |
| Less than $300 | 46 (19.3%) | 0 (0.0%) |
| $300 to $499 | 6 (2.5%) | 0 (0.0%) |
| $500 to $799 | 34 (14.3%) | 0 (0.0%) |
| $800 to $999 | 82 (34.4%) | 4 (66.7%) |
| $1,000 to $1,499 | 47 (19.8%) | 0 (0.0%) |
| $1,500 to $1,999 | 23 (9.7%) | 0 (0.0%) |
| $2,000 to $2,499 | 0 (0.0%) | 0 (0.0%) |
| $2,500 to $2,999 | 0 (0.0%) | 0 (0.0%) |
| $3,000 or more | 0 (0.0%) | 0 (0.0%) |
| Total | 238 (100.0%) | 6 (100.0%) |
Physical Housing Characteristics in Johnson City
Housing Structures in Johnson City
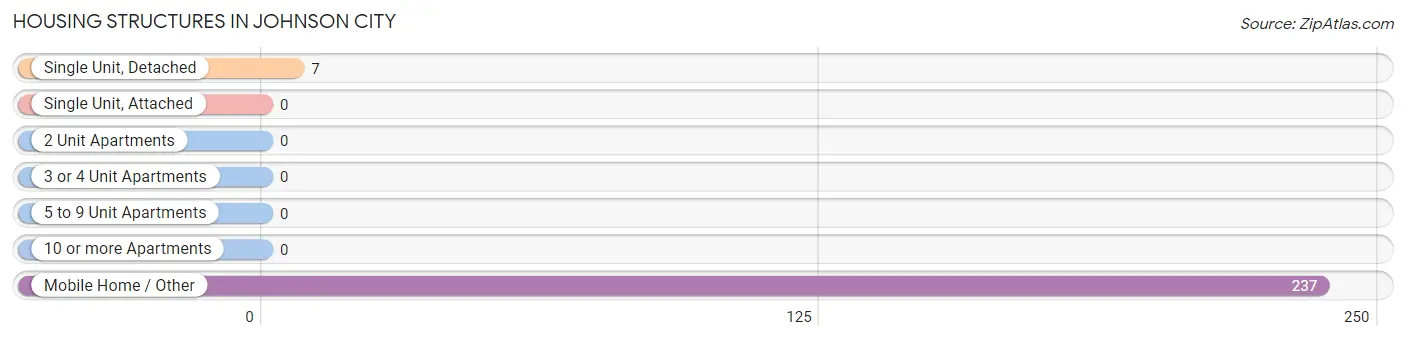
| Structure Type | # Housing Units | % Housing Units |
| Single Unit, Detached | 7 | 2.9% |
| Single Unit, Attached | 0 | 0.0% |
| 2 Unit Apartments | 0 | 0.0% |
| 3 or 4 Unit Apartments | 0 | 0.0% |
| 5 to 9 Unit Apartments | 0 | 0.0% |
| 10 or more Apartments | 0 | 0.0% |
| Mobile Home / Other | 237 | 97.1% |
| Total | 244 | 100.0% |
Housing Structures by Occupancy in Johnson City
| Structure Type | Owner-occupied | Renter-occupied |
| Single Unit, Detached | 7 (100.0%) | 0 (0.0%) |
| Single Unit, Attached | 0 (0.0%) | 0 (0.0%) |
| 2 Unit Apartments | 0 (0.0%) | 0 (0.0%) |
| 3 or 4 Unit Apartments | 0 (0.0%) | 0 (0.0%) |
| 5 to 9 Unit Apartments | 0 (0.0%) | 0 (0.0%) |
| 10 or more Apartments | 0 (0.0%) | 0 (0.0%) |
| Mobile Home / Other | 231 (97.5%) | 6 (2.5%) |
| Total | 238 (97.5%) | 6 (2.5%) |
Housing Structures by Number of Rooms in Johnson City
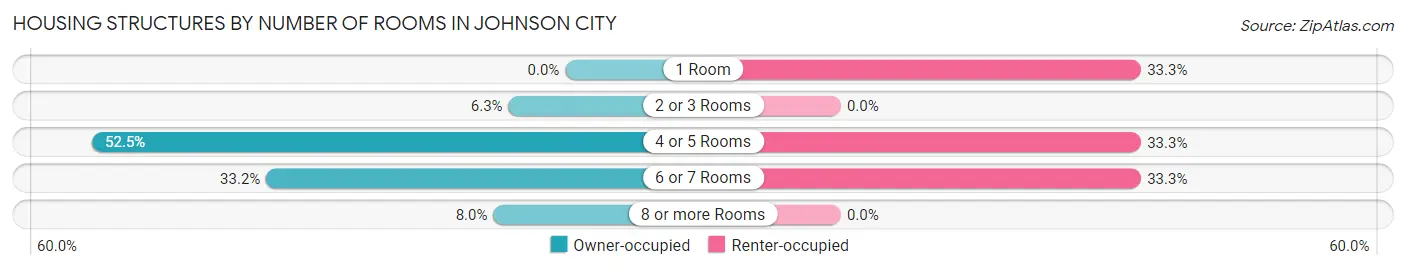
| Number of Rooms | Owner-occupied | Renter-occupied |
| 1 Room | 0 (0.0%) | 2 (33.3%) |
| 2 or 3 Rooms | 15 (6.3%) | 0 (0.0%) |
| 4 or 5 Rooms | 125 (52.5%) | 2 (33.3%) |
| 6 or 7 Rooms | 79 (33.2%) | 2 (33.3%) |
| 8 or more Rooms | 19 (8.0%) | 0 (0.0%) |
| Total | 238 (100.0%) | 6 (100.0%) |
Housing Structure by Heating Type in Johnson City
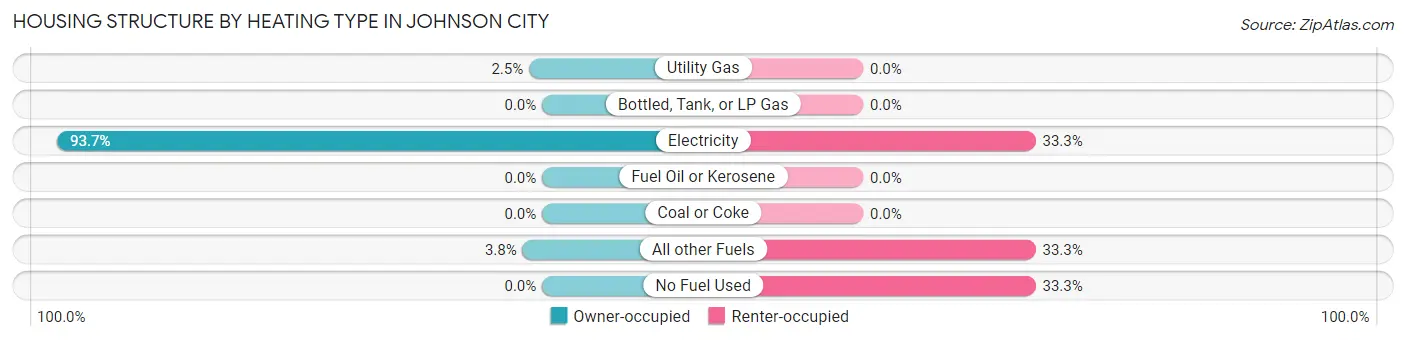
| Heating Type | Owner-occupied | Renter-occupied |
| Utility Gas | 6 (2.5%) | 0 (0.0%) |
| Bottled, Tank, or LP Gas | 0 (0.0%) | 0 (0.0%) |
| Electricity | 223 (93.7%) | 2 (33.3%) |
| Fuel Oil or Kerosene | 0 (0.0%) | 0 (0.0%) |
| Coal or Coke | 0 (0.0%) | 0 (0.0%) |
| All other Fuels | 9 (3.8%) | 2 (33.3%) |
| No Fuel Used | 0 (0.0%) | 2 (33.3%) |
| Total | 238 (100.0%) | 6 (100.0%) |
Household Vehicle Usage in Johnson City
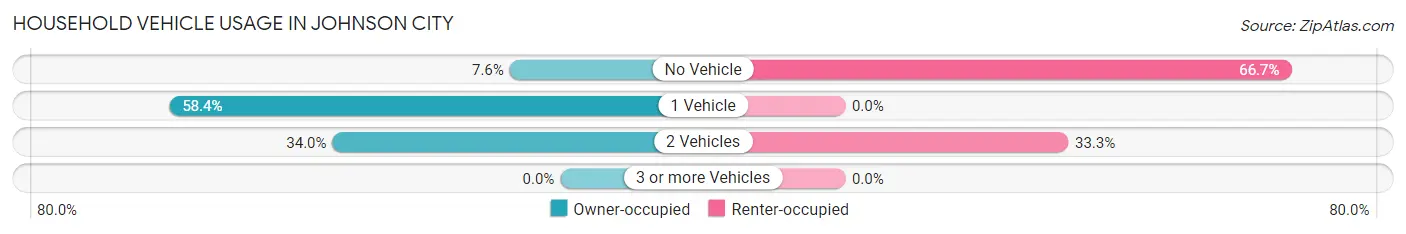
| Vehicles per Household | Owner-occupied | Renter-occupied |
| No Vehicle | 18 (7.6%) | 4 (66.7%) |
| 1 Vehicle | 139 (58.4%) | 0 (0.0%) |
| 2 Vehicles | 81 (34.0%) | 2 (33.3%) |
| 3 or more Vehicles | 0 (0.0%) | 0 (0.0%) |
| Total | 238 (100.0%) | 6 (100.0%) |
Real Estate & Mortgages in Johnson City
Real Estate and Mortgage Overview in Johnson City
| Characteristic | Without Mortgage | With Mortgage |
| Housing Units | 163 | 75 |
| Median Property Value | $56,700 | $83,800 |
| Median Household Income | $45,156 | $0 |
| Monthly Housing Costs | $814 | $0 |
| Real Estate Taxes | $422 | $32 |
Property Value by Mortgage Status in Johnson City
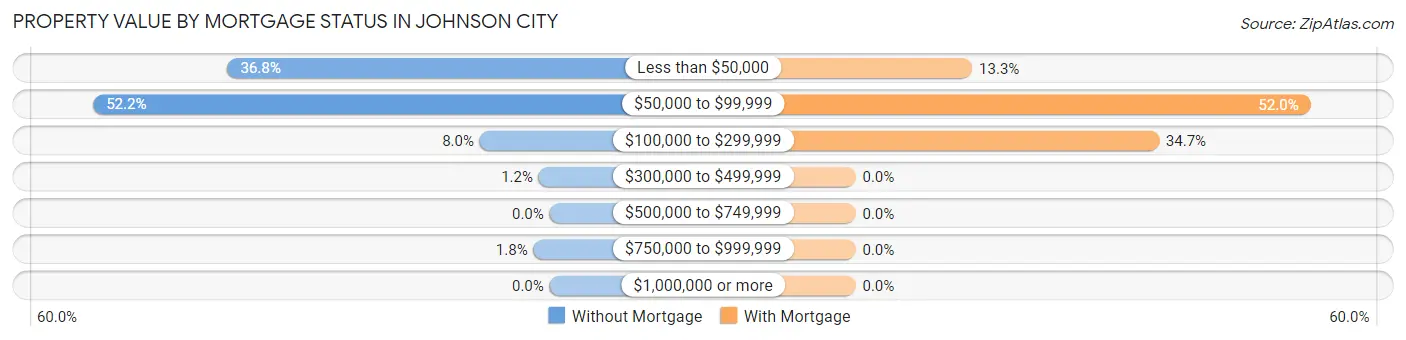
| Property Value | Without Mortgage | With Mortgage |
| Less than $50,000 | 60 (36.8%) | 10 (13.3%) |
| $50,000 to $99,999 | 85 (52.1%) | 39 (52.0%) |
| $100,000 to $299,999 | 13 (8.0%) | 26 (34.7%) |
| $300,000 to $499,999 | 2 (1.2%) | 0 (0.0%) |
| $500,000 to $749,999 | 0 (0.0%) | 0 (0.0%) |
| $750,000 to $999,999 | 3 (1.8%) | 0 (0.0%) |
| $1,000,000 or more | 0 (0.0%) | 0 (0.0%) |
| Total | 163 (100.0%) | 75 (100.0%) |
Household Income by Mortgage Status in Johnson City
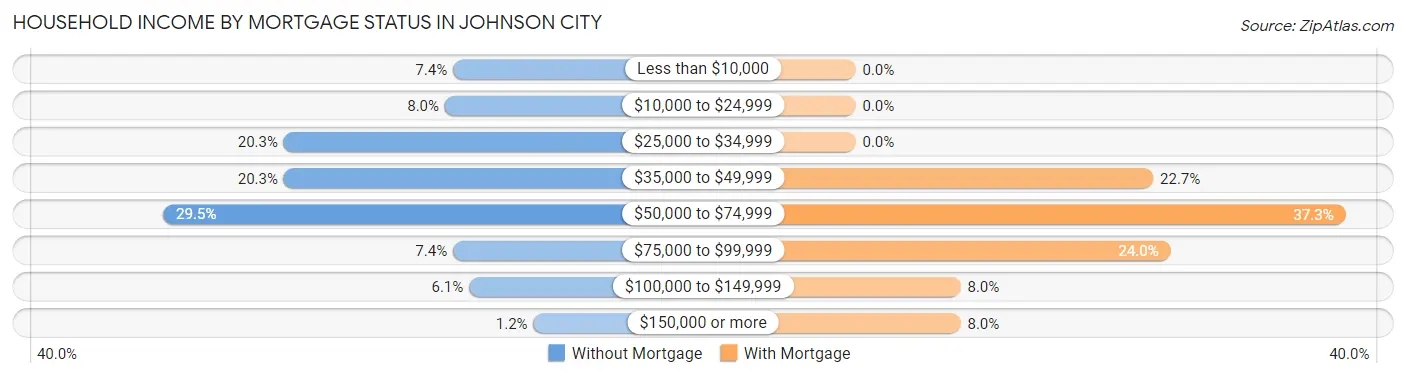
| Household Income | Without Mortgage | With Mortgage |
| Less than $10,000 | 12 (7.4%) | 0 (0.0%) |
| $10,000 to $24,999 | 13 (8.0%) | 0 (0.0%) |
| $25,000 to $34,999 | 33 (20.3%) | 0 (0.0%) |
| $35,000 to $49,999 | 33 (20.3%) | 17 (22.7%) |
| $50,000 to $74,999 | 48 (29.4%) | 28 (37.3%) |
| $75,000 to $99,999 | 12 (7.4%) | 18 (24.0%) |
| $100,000 to $149,999 | 10 (6.1%) | 6 (8.0%) |
| $150,000 or more | 2 (1.2%) | 6 (8.0%) |
| Total | 163 (100.0%) | 75 (100.0%) |
Property Value to Household Income Ratio in Johnson City
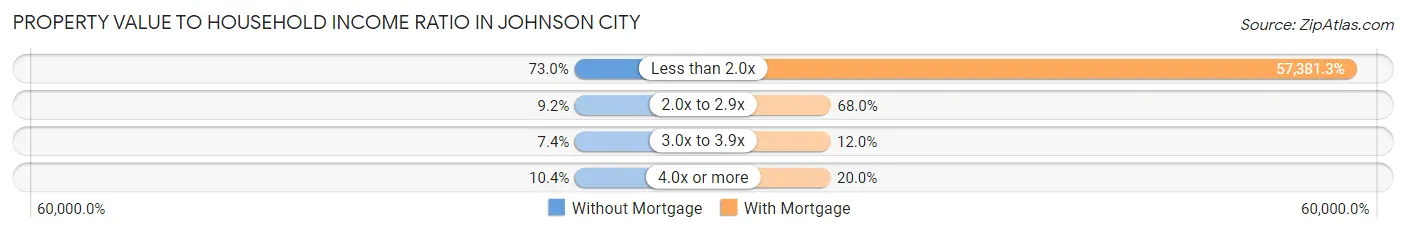
| Value-to-Income Ratio | Without Mortgage | With Mortgage |
| Less than 2.0x | 119 (73.0%) | 43,036 (57,381.3%) |
| 2.0x to 2.9x | 15 (9.2%) | 51 (68.0%) |
| 3.0x to 3.9x | 12 (7.4%) | 9 (12.0%) |
| 4.0x or more | 17 (10.4%) | 15 (20.0%) |
| Total | 163 (100.0%) | 75 (100.0%) |
Real Estate Taxes by Mortgage Status in Johnson City
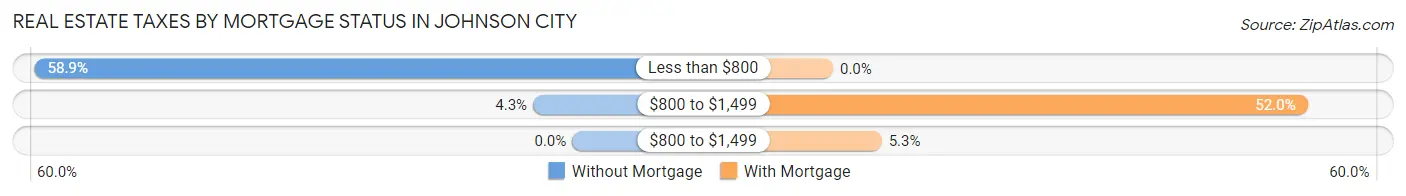
| Property Taxes | Without Mortgage | With Mortgage |
| Less than $800 | 96 (58.9%) | 0 (0.0%) |
| $800 to $1,499 | 7 (4.3%) | 39 (52.0%) |
| $800 to $1,499 | 0 (0.0%) | 4 (5.3%) |
| Total | 163 (100.0%) | 75 (100.0%) |
Health & Disability in Johnson City
Health Insurance Coverage by Age in Johnson City
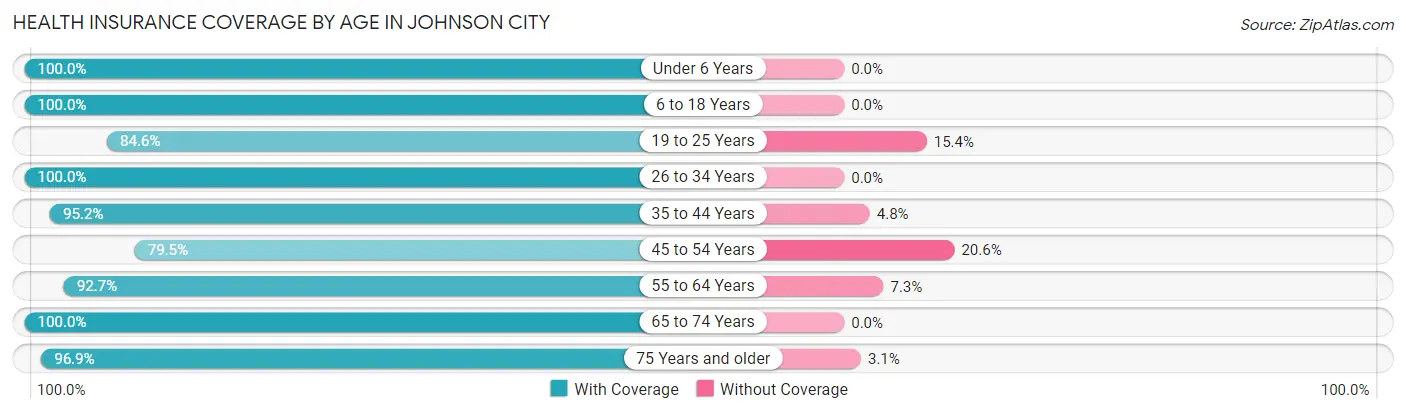
| Age Bracket | With Coverage | Without Coverage |
| Under 6 Years | 33 (100.0%) | 0 (0.0%) |
| 6 to 18 Years | 28 (100.0%) | 0 (0.0%) |
| 19 to 25 Years | 11 (84.6%) | 2 (15.4%) |
| 26 to 34 Years | 29 (100.0%) | 0 (0.0%) |
| 35 to 44 Years | 40 (95.2%) | 2 (4.8%) |
| 45 to 54 Years | 58 (79.4%) | 15 (20.5%) |
| 55 to 64 Years | 76 (92.7%) | 6 (7.3%) |
| 65 to 74 Years | 62 (100.0%) | 0 (0.0%) |
| 75 Years and older | 62 (96.9%) | 2 (3.1%) |
| Total | 399 (93.7%) | 27 (6.3%) |
Health Insurance Coverage by Citizenship Status in Johnson City
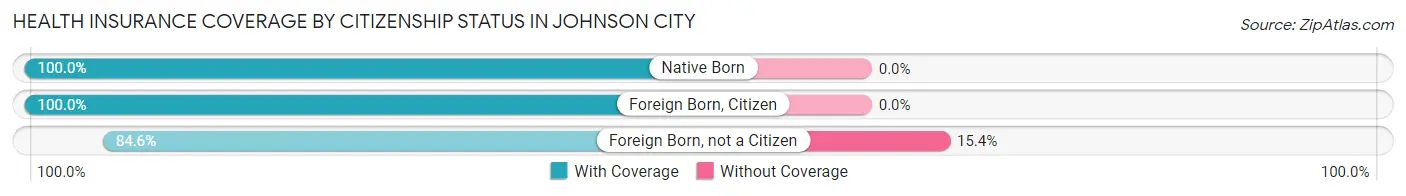
| Citizenship Status | With Coverage | Without Coverage |
| Native Born | 33 (100.0%) | 0 (0.0%) |
| Foreign Born, Citizen | 28 (100.0%) | 0 (0.0%) |
| Foreign Born, not a Citizen | 11 (84.6%) | 2 (15.4%) |
Health Insurance Coverage by Household Income in Johnson City
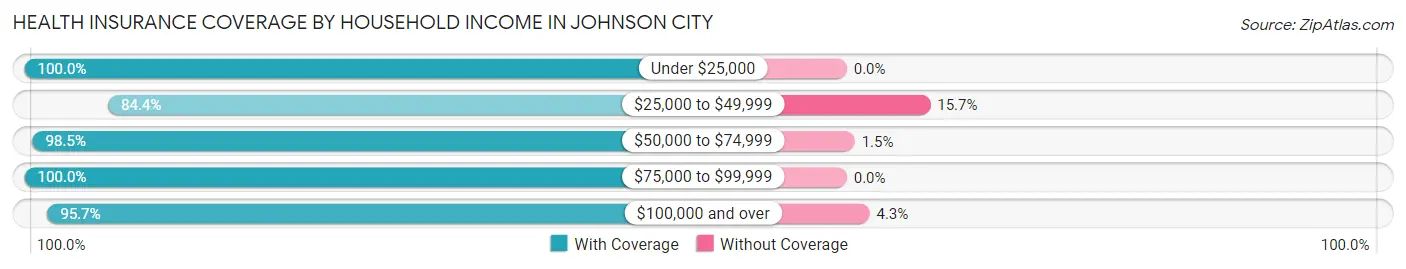
| Household Income | With Coverage | Without Coverage |
| Under $25,000 | 51 (100.0%) | 0 (0.0%) |
| $25,000 to $49,999 | 124 (84.4%) | 23 (15.7%) |
| $50,000 to $74,999 | 133 (98.5%) | 2 (1.5%) |
| $75,000 to $99,999 | 46 (100.0%) | 0 (0.0%) |
| $100,000 and over | 45 (95.7%) | 2 (4.3%) |
Public vs Private Health Insurance Coverage by Age in Johnson City
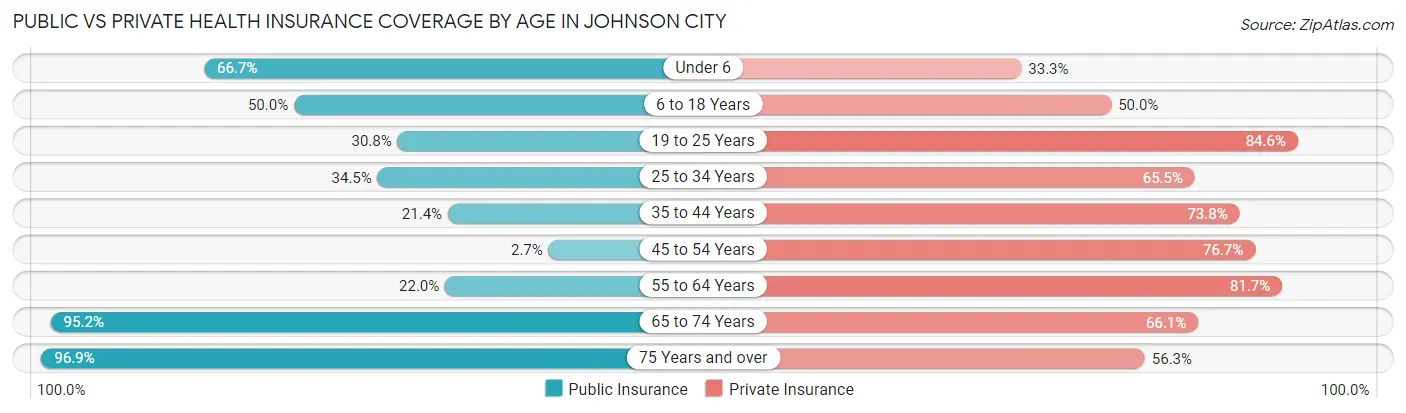
| Age Bracket | Public Insurance | Private Insurance |
| Under 6 | 22 (66.7%) | 11 (33.3%) |
| 6 to 18 Years | 14 (50.0%) | 14 (50.0%) |
| 19 to 25 Years | 4 (30.8%) | 11 (84.6%) |
| 25 to 34 Years | 10 (34.5%) | 19 (65.5%) |
| 35 to 44 Years | 9 (21.4%) | 31 (73.8%) |
| 45 to 54 Years | 2 (2.7%) | 56 (76.7%) |
| 55 to 64 Years | 18 (22.0%) | 67 (81.7%) |
| 65 to 74 Years | 59 (95.2%) | 41 (66.1%) |
| 75 Years and over | 62 (96.9%) | 36 (56.2%) |
| Total | 200 (46.9%) | 286 (67.1%) |
Disability Status by Sex by Age in Johnson City
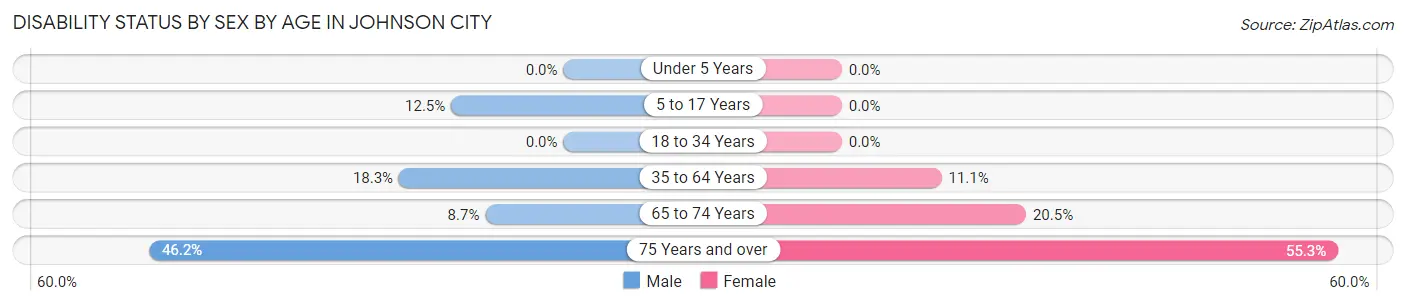
| Age Bracket | Male | Female |
| Under 5 Years | 0 (0.0%) | 0 (0.0%) |
| 5 to 17 Years | 2 (12.5%) | 0 (0.0%) |
| 18 to 34 Years | 0 (0.0%) | 0 (0.0%) |
| 35 to 64 Years | 13 (18.3%) | 14 (11.1%) |
| 65 to 74 Years | 2 (8.7%) | 8 (20.5%) |
| 75 Years and over | 12 (46.2%) | 21 (55.3%) |
Disability Class by Sex by Age in Johnson City
Disability Class: Hearing Difficulty
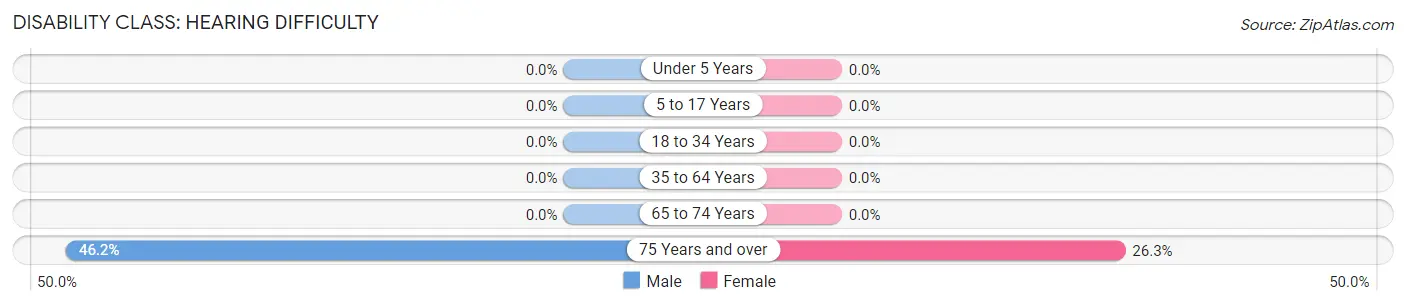
| Age Bracket | Male | Female |
| Under 5 Years | 0 (0.0%) | 0 (0.0%) |
| 5 to 17 Years | 0 (0.0%) | 0 (0.0%) |
| 18 to 34 Years | 0 (0.0%) | 0 (0.0%) |
| 35 to 64 Years | 0 (0.0%) | 0 (0.0%) |
| 65 to 74 Years | 0 (0.0%) | 0 (0.0%) |
| 75 Years and over | 12 (46.2%) | 10 (26.3%) |
Disability Class: Vision Difficulty
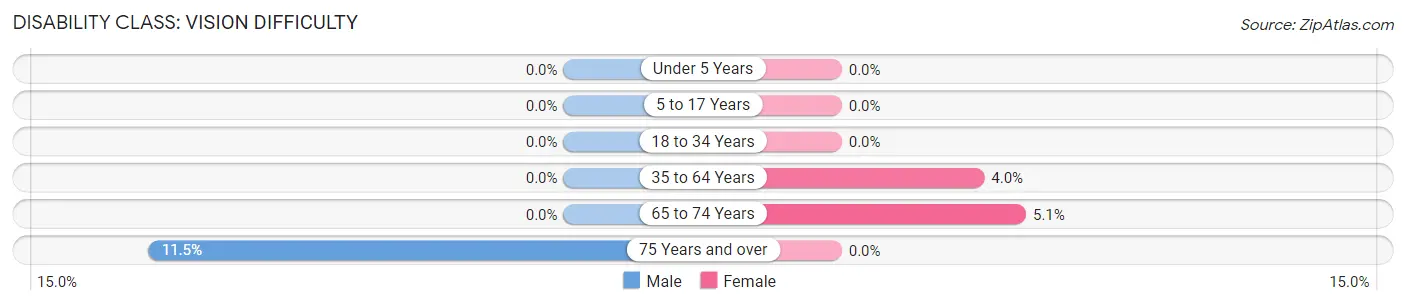
| Age Bracket | Male | Female |
| Under 5 Years | 0 (0.0%) | 0 (0.0%) |
| 5 to 17 Years | 0 (0.0%) | 0 (0.0%) |
| 18 to 34 Years | 0 (0.0%) | 0 (0.0%) |
| 35 to 64 Years | 0 (0.0%) | 5 (4.0%) |
| 65 to 74 Years | 0 (0.0%) | 2 (5.1%) |
| 75 Years and over | 3 (11.5%) | 0 (0.0%) |
Disability Class: Cognitive Difficulty
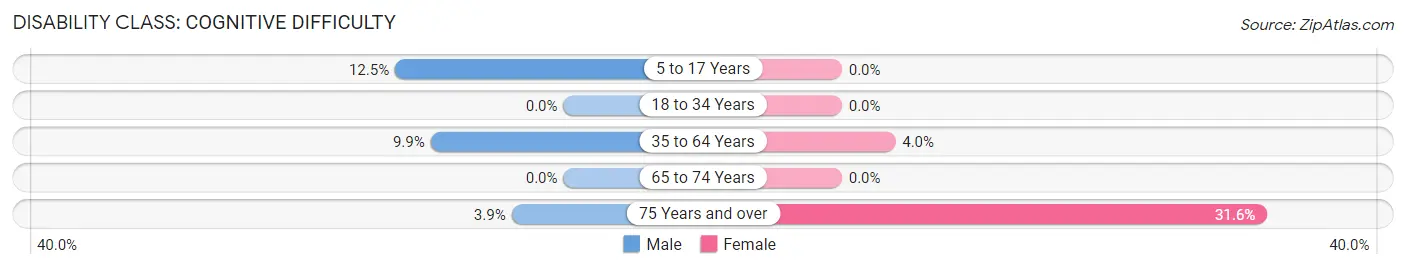
| Age Bracket | Male | Female |
| 5 to 17 Years | 2 (12.5%) | 0 (0.0%) |
| 18 to 34 Years | 0 (0.0%) | 0 (0.0%) |
| 35 to 64 Years | 7 (9.9%) | 5 (4.0%) |
| 65 to 74 Years | 0 (0.0%) | 0 (0.0%) |
| 75 Years and over | 1 (3.8%) | 12 (31.6%) |
Disability Class: Ambulatory Difficulty
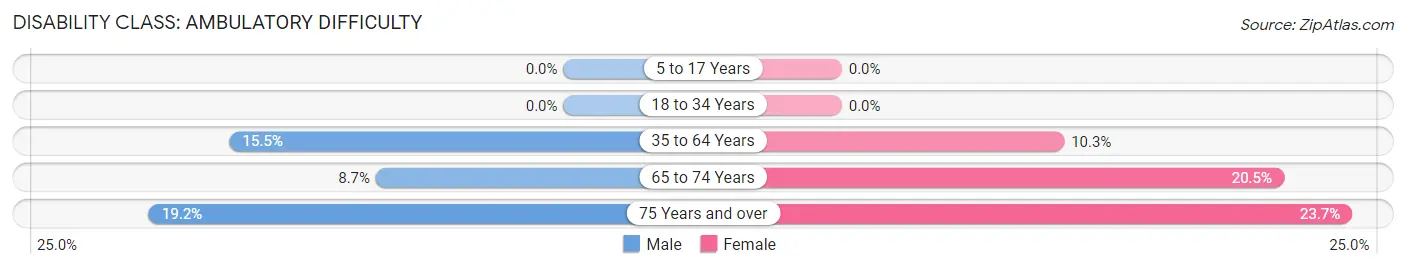
| Age Bracket | Male | Female |
| 5 to 17 Years | 0 (0.0%) | 0 (0.0%) |
| 18 to 34 Years | 0 (0.0%) | 0 (0.0%) |
| 35 to 64 Years | 11 (15.5%) | 13 (10.3%) |
| 65 to 74 Years | 2 (8.7%) | 8 (20.5%) |
| 75 Years and over | 5 (19.2%) | 9 (23.7%) |
Disability Class: Self-Care Difficulty
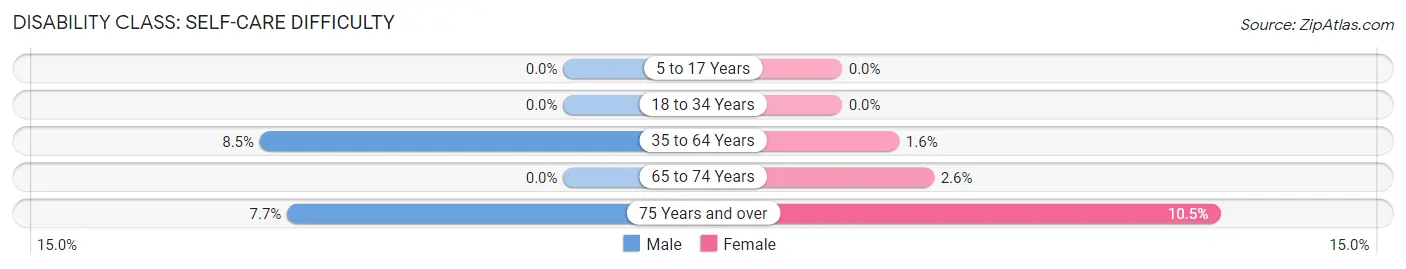
| Age Bracket | Male | Female |
| 5 to 17 Years | 0 (0.0%) | 0 (0.0%) |
| 18 to 34 Years | 0 (0.0%) | 0 (0.0%) |
| 35 to 64 Years | 6 (8.5%) | 2 (1.6%) |
| 65 to 74 Years | 0 (0.0%) | 1 (2.6%) |
| 75 Years and over | 2 (7.7%) | 4 (10.5%) |
Technology Access in Johnson City
Computing Device Access in Johnson City
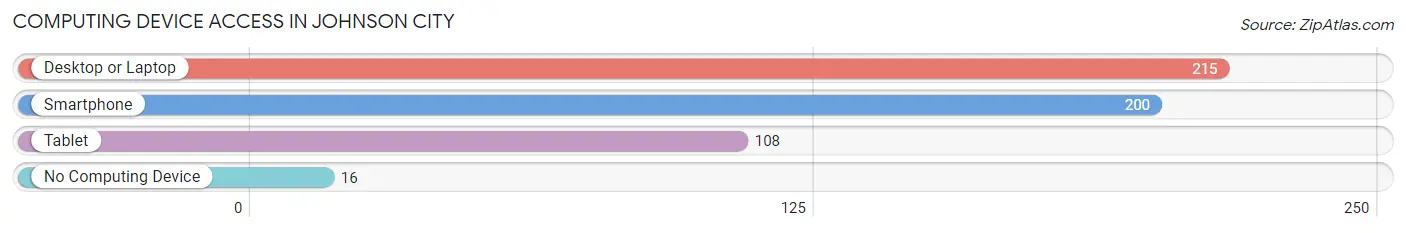
| Device Type | # Households | % Households |
| Desktop or Laptop | 215 | 88.1% |
| Smartphone | 200 | 82.0% |
| Tablet | 108 | 44.3% |
| No Computing Device | 16 | 6.6% |
| Total | 244 | 100.0% |
Internet Access in Johnson City
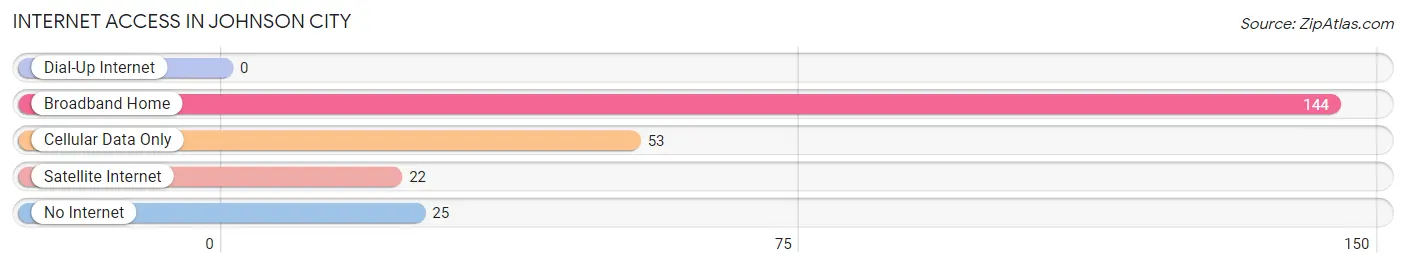
| Internet Type | # Households | % Households |
| Dial-Up Internet | 0 | 0.0% |
| Broadband Home | 144 | 59.0% |
| Cellular Data Only | 53 | 21.7% |
| Satellite Internet | 22 | 9.0% |
| No Internet | 25 | 10.2% |
| Total | 244 | 100.0% |
Johnson City Summary
Johnson City is a small unincorporated community located in the foothills of the Cascade Mountains in Oregon. It is situated in the Willamette Valley, about 25 miles south of Portland. The community is home to about 500 people and is known for its rural charm and small-town atmosphere.
History
Johnson City was founded in 1851 by a group of settlers from the Midwest. The settlers were looking for a place to settle and start a new life. They chose the area because of its fertile soil and abundant natural resources. The settlers named the town after their leader, John Johnson.
The town grew slowly but steadily over the years, and by the early 1900s, it had become a thriving agricultural community. The town was home to several small businesses, including a general store, a blacksmith shop, and a sawmill.
In the 1950s, the town began to decline as many of its residents moved away in search of better opportunities. By the 1970s, the population had dropped to just over 200 people.
Geography
Johnson City is located in the foothills of the Cascade Mountains in Oregon. It is situated in the Willamette Valley, about 25 miles south of Portland. The town is surrounded by rolling hills and lush forests. The climate is mild and temperate, with warm summers and cool winters.
The town is located near several rivers, including the Clackamas, the Willamette, and the Santiam. These rivers provide ample opportunities for fishing, boating, and other recreational activities.
Economy
The economy of Johnson City is largely based on agriculture. The town is home to several farms, which produce a variety of crops, including hay, wheat, and corn. The town also has a few small businesses, including a general store, a hardware store, and a restaurant.
The town is also home to a few small manufacturing companies, which produce a variety of products, including furniture, clothing, and electronics.
Demographics
As of the 2010 census, the population of Johnson City was 498. The racial makeup of the town was 95.2% White, 0.6% African American, 0.4% Native American, 0.4% Asian, 0.2% Pacific Islander, and 2.2% from other races. The median household income was $41,250, and the median family income was $50,000.
Conclusion
Johnson City is a small unincorporated community located in the foothills of the Cascade Mountains in Oregon. It is situated in the Willamette Valley, about 25 miles south of Portland. The town is known for its rural charm and small-town atmosphere. The economy of Johnson City is largely based on agriculture, and the town is home to several small businesses. As of the 2010 census, the population of Johnson City was 498.
Common Questions
What is Per Capita Income in Johnson City?
Per Capita income in Johnson City is $33,843.
What is the Median Family Income in Johnson City?
Median Family Income in Johnson City is $65,500.
What is the Median Household income in Johnson City?
Median Household Income in Johnson City is $44,091.
What is Income or Wage Gap in Johnson City?
Income or Wage Gap in Johnson City is 30.8%.
Women in Johnson City earn 69.2 cents for every dollar earned by a man.
What is Family Income Deficit in Johnson City?
Family Income Deficit in Johnson City is $16,780.
Families that are below poverty line in Johnson City earn $16,780 less on average than the poverty threshold level.
What is Inequality or Gini Index in Johnson City?
Inequality or Gini Index in Johnson City is 0.40.
What is the Total Population of Johnson City?
Total Population of Johnson City is 430.
What is the Total Male Population of Johnson City?
Total Male Population of Johnson City is 193.
What is the Total Female Population of Johnson City?
Total Female Population of Johnson City is 237.
What is the Ratio of Males per 100 Females in Johnson City?
There are 81.43 Males per 100 Females in Johnson City.
What is the Ratio of Females per 100 Males in Johnson City?
There are 122.80 Females per 100 Males in Johnson City.
What is the Median Population Age in Johnson City?
Median Population Age in Johnson City is 54.7 Years.
What is the Average Family Size in Johnson City
Average Family Size in Johnson City is 2.6 People.
What is the Average Household Size in Johnson City
Average Household Size in Johnson City is 1.8 People.
How Large is the Labor Force in Johnson City?
There are 232 People in the Labor Forcein in Johnson City.
What is the Percentage of People in the Labor Force in Johnson City?
60.9% of People are in the Labor Force in Johnson City.