Zip Codes with the Highest Percentage of Population Employed in Firefighting & Prevention in Oklahoma City, OK

RELATED REPORTS & OPTIONS

Firefighting & Prevention
Population
Families and Households
Female Fertility
Female Fertility (Unmarried)
Race (Community Size)
Race (Percentage)
Ancestry (Community Size)
AfricanAlaska NativeAlbanianAmericanApacheArabArapahoArgentineanArmenianAustralianAustrianBahamianBangladeshiBarbadianBasqueBelgianBhutaneseBlackfeetBolivianBrazilianBritishBritish West IndianBulgarianBurmeseCajunCambodianCanadianCelticCentral AmericanCentral American IndianCherokeeCheyenneChickasawChileanChippewaChoctawColombianComancheCreeCreekCroatianCubanCzechCzechoslovakianDanishDelawareDominicanDutchDutch West IndianEastern EuropeanEcuadorianEgyptianEnglishEstonianEthiopianEuropeanFijianFilipinoFinnishFrenchFrench American IndianFrench CanadianGermanGerman RussianGhanaianGreekGuamanian / ChamorroGuatemalanGuyaneseHaitianHonduranHopiHungarianIcelanderIndian (Asian)IndonesianInupiatIranianIraqiIrishIroquoisIsraeliItalianJamaicanJapaneseJordanianKenyanKiowaKoreanLaotianLatvianLebaneseLiberianLithuanianLuxembourgerMalaysianMexicanMexican American IndianMongolianMoroccanNative HawaiianNavajoNew ZealanderNicaraguanNigerianNorthern EuropeanNorwegianOkinawanOsagePakistaniPalestinianPanamanianPennsylvania GermanPeruvianPimaPolishPortuguesePotawatomiPuebloPuerto RicanRomanianRussianSalvadoranSamoanScandinavianScotch-IrishScottishSeminoleSerbianSiouxSlavicSlovakSloveneSouth AfricanSouth AmericanSouth American IndianSpaniardSpanishSpanish American IndianSri LankanSubsaharan AfricanSudaneseSwedishSwissSyrianThaiTlingit-HaidaTonganTrinidadian and TobagonianTurkishU.S. Virgin IslanderUkrainianUruguayanVenezuelanVietnameseWelshWest IndianYugoslavianZimbabwean
Ancestry (Percentage)
AfricanAlaska NativeAlbanianAmericanApacheArabArapahoArgentineanArmenianAustralianAustrianBahamianBangladeshiBarbadianBasqueBelgianBhutaneseBlackfeetBolivianBrazilianBritishBritish West IndianBulgarianBurmeseCajunCambodianCanadianCelticCentral AmericanCentral American IndianCherokeeCheyenneChickasawChileanChippewaChoctawColombianComancheCreeCreekCroatianCubanCzechCzechoslovakianDanishDelawareDominicanDutchDutch West IndianEastern EuropeanEcuadorianEgyptianEnglishEstonianEthiopianEuropeanFijianFilipinoFinnishFrenchFrench American IndianFrench CanadianGermanGerman RussianGhanaianGreekGuamanian / ChamorroGuatemalanGuyaneseHaitianHonduranHopiHungarianIcelanderIndian (Asian)IndonesianInupiatIranianIraqiIrishIroquoisIsraeliItalianJamaicanJapaneseJordanianKenyanKiowaKoreanLaotianLatvianLebaneseLiberianLithuanianLuxembourgerMalaysianMexicanMexican American IndianMongolianMoroccanNative HawaiianNavajoNew ZealanderNicaraguanNigerianNorthern EuropeanNorwegianOkinawanOsagePakistaniPalestinianPanamanianPennsylvania GermanPeruvianPimaPolishPortuguesePotawatomiPuebloPuerto RicanRomanianRussianSalvadoranSamoanScandinavianScotch-IrishScottishSeminoleSerbianSiouxSlavicSlovakSloveneSouth AfricanSouth AmericanSouth American IndianSpaniardSpanishSpanish American IndianSri LankanSubsaharan AfricanSudaneseSwedishSwissSyrianThaiTlingit-HaidaTonganTrinidadian and TobagonianTurkishU.S. Virgin IslanderUkrainianUruguayanVenezuelanVietnameseWelshWest IndianYugoslavianZimbabwean
Immigrant Origin (Total)
AfricaArgentinaAsiaAustraliaAustriaBahamasBangladeshBosnia and HerzegovinaBrazilBulgariaBurma / MyanmarCambodiaCameroonCanadaCaribbeanCentral AmericaChileChinaColombiaCubaDominican RepublicEastern AfricaEastern AsiaEastern EuropeEcuadorEgyptEl SalvadorEnglandEritreaEthiopiaEuropeFranceGermanyGhanaGreeceGuatemalaHondurasHong KongIndiaIndonesiaIranIraqIrelandItalyJamaicaJapanJordanKazakhstanKenyaKoreaKuwaitLaosLatin AmericaLebanonLiberiaMalaysiaMexicoMiddle AfricaMoroccoNepalNetherlandsNicaraguaNigeriaNorthern AfricaNorthern EuropeNorwayOceaniaPakistanPanamaPeruPhilippinesPolandPortugalRussiaSaudi ArabiaScotlandSingaporeSouth AfricaSouth AmericaSouth Central AsiaSouth Eastern AsiaSouthern EuropeSpainSudanSyriaTaiwanThailandTrinidad and TobagoTurkeyUkraineVenezuelaVietnamWestern AfricaWestern AsiaWestern EuropeZaireZimbabwe
Immigrant Origin (Percentage)
AfricaArgentinaAsiaAustraliaAustriaBahamasBangladeshBosnia and HerzegovinaBrazilBulgariaBurma / MyanmarCambodiaCameroonCanadaCaribbeanCentral AmericaChileChinaColombiaCubaDominican RepublicEastern AfricaEastern AsiaEastern EuropeEcuadorEgyptEl SalvadorEnglandEritreaEthiopiaEuropeFranceGermanyGhanaGreeceGuatemalaHondurasHong KongIndiaIndonesiaIranIraqIrelandItalyJamaicaJapanJordanKazakhstanKenyaKoreaKuwaitLaosLatin AmericaLebanonLiberiaMalaysiaMexicoMiddle AfricaMoroccoNepalNetherlandsNicaraguaNigeriaNorthern AfricaNorthern EuropeNorwayOceaniaPakistanPanamaPeruPhilippinesPolandPortugalRussiaSaudi ArabiaScotlandSingaporeSouth AfricaSouth AmericaSouth Central AsiaSouth Eastern AsiaSouthern EuropeSpainSudanSyriaTaiwanThailandTrinidad and TobagoTurkeyUkraineVenezuelaVietnamWestern AfricaWestern AsiaWestern EuropeZaireZimbabwe
Income
Income (Families)
Income (Households)
Poverty
Poverty (Families)
Unemployment
Employment Occupations
Employment Industries
Employer Class
Commute Time
Commute Means
School Enrollment
Education by Degree Field
Occupancy
Finances
Physical Characteristics
Oklahoma City
Compare Zip Codes
Comparison Subject

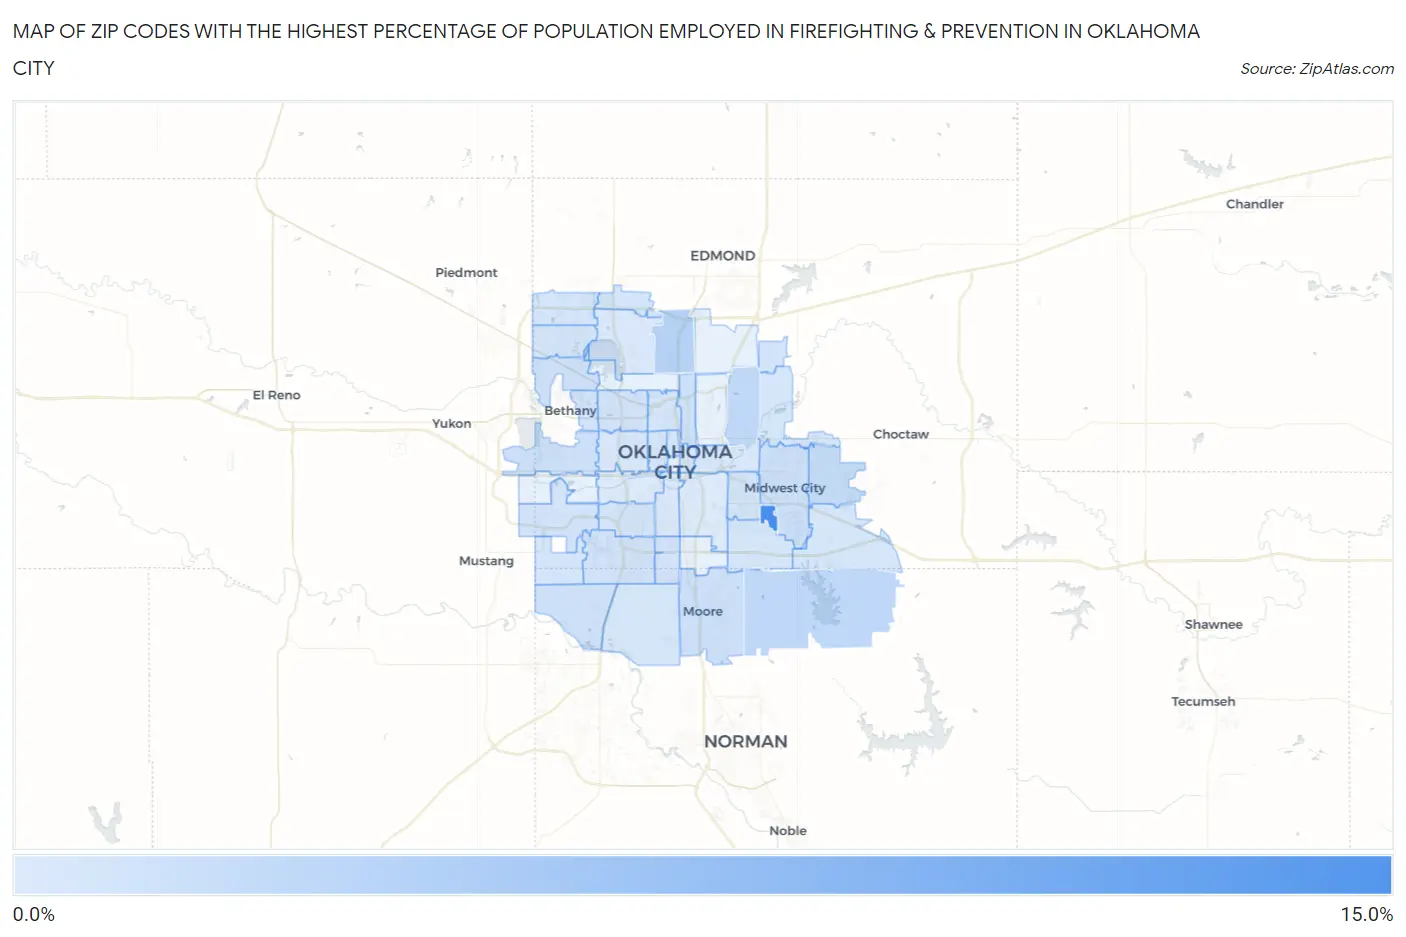
Map of Zip Codes with the Highest Percentage of Population Employed in Firefighting & Prevention in Oklahoma City

0.0%
15.0%
Zip Codes with the Highest Percentage of Population Employed in Firefighting & Prevention in Oklahoma City Map

Zip Codes with the Highest Percentage of Population Employed in Firefighting & Prevention in Oklahoma City, OK

Zip Code % Employed vs State vs National
1.7314513.7%1.1%(+12.7)#41.2%(+12.6)#183
2.731143.4%1.1%(+2.36)#311.2%(+2.24)#1,789
3.731652.7%1.1%(+1.67)#541.2%(+1.55)#2,660
4.731212.7%1.1%(+1.64)#551.2%(+1.53)#2,708
5.731302.2%1.1%(+1.08)#811.2%(+0.966)#4,011
6.731101.6%1.1%(+0.527)#1361.2%(+0.411)#6,399
7.731271.6%1.1%(+0.497)#1381.2%(+0.381)#6,564
8.731601.5%1.1%(+0.409)#1481.2%(+0.293)#7,118
9.731051.4%1.1%(+0.318)#1601.2%(+0.203)#7,722
10.731321.4%1.1%(+0.308)#1611.2%(+0.192)#7,788
11.731731.3%1.1%(+0.265)#1691.2%(+0.149)#8,093
12.731591.2%1.1%(+0.126)#1861.2%(+0.010)#9,184
13.731791.2%1.1%(+0.113)#1911.2%(-0.003)#9,292
14.731391.1%1.1%(+0.059)#1991.2%(-0.057)#9,831
15.731221.1%1.1%(+0.030)#2051.2%(-0.085)#10,101
16.731121.0%1.1%(-0.036)#2251.2%(-0.152)#10,737
17.731691.0%1.1%(-0.066)#2331.2%(-0.182)#11,057
18.731510.98%1.1%(-0.091)#2401.2%(-0.206)#11,310
19.731340.96%1.1%(-0.111)#2451.2%(-0.226)#11,547
20.731150.95%1.1%(-0.120)#2491.2%(-0.236)#11,639
21.731620.90%1.1%(-0.166)#2601.2%(-0.282)#12,126
22.731420.90%1.1%(-0.172)#2611.2%(-0.288)#12,188
23.731190.90%1.1%(-0.173)#2621.2%(-0.289)#12,199
24.731030.88%1.1%(-0.194)#2681.2%(-0.310)#12,405
25.731180.84%1.1%(-0.235)#2791.2%(-0.351)#12,814
26.731350.73%1.1%(-0.339)#2951.2%(-0.454)#13,966
27.731060.73%1.1%(-0.340)#2961.2%(-0.456)#13,987
28.731700.70%1.1%(-0.370)#3041.2%(-0.485)#14,322
29.731500.68%1.1%(-0.386)#3101.2%(-0.502)#14,525
30.731410.66%1.1%(-0.410)#3171.2%(-0.526)#14,798
31.731040.57%1.1%(-0.499)#3381.2%(-0.615)#15,731
32.731170.55%1.1%(-0.523)#3431.2%(-0.639)#15,994
33.731070.49%1.1%(-0.577)#3581.2%(-0.693)#16,635
34.731090.34%1.1%(-0.732)#3811.2%(-0.848)#18,370
35.731200.34%1.1%(-0.732)#3821.2%(-0.848)#18,378
36.731080.20%1.1%(-0.868)#4001.2%(-0.983)#19,664
37.731290.13%1.1%(-0.943)#4091.2%(-1.06)#20,180

Common Questions

What are the Top 10 Zip Codes with the Highest Percentage of Population Employed in Firefighting & Prevention in Oklahoma City, OK?
Top 10 Zip Codes with the Highest Percentage of Population Employed in Firefighting & Prevention in Oklahoma City, OK are:
#1
13.7%
#2
3.4%
#3
2.7%
#4
2.7%
#5
2.2%
#6
1.6%
#7
1.6%
#8
1.5%
#9
1.4%
#10
1.4%
What zip code has the Highest Percentage of Population Employed in Firefighting & Prevention in Oklahoma City, OK?
73145 has the Highest Percentage of Population Employed in Firefighting & Prevention in Oklahoma City, OK with 13.7%.
What is the Percentage of Population Employed in Firefighting & Prevention in Oklahoma City, OK?
Percentage of Population Employed in Firefighting & Prevention in Oklahoma City is 1.0%.
What is the Percentage of Population Employed in Firefighting & Prevention in Oklahoma?
Percentage of Population Employed in Firefighting & Prevention in Oklahoma is 1.1%.
What is the Percentage of Population Employed in Firefighting & Prevention in the United States?
Percentage of Population Employed in Firefighting & Prevention in the United States is 1.2%.