Sulphur, OK Map & Demographics
Sulphur Map
Sulphur Overview
$30,745
PER CAPITA INCOME
$76,250
AVG FAMILY INCOME
$55,951
AVG HOUSEHOLD INCOME
11.6%
WAGE / INCOME GAP [ % ]
88.4¢/ $1
WAGE / INCOME GAP [ $ ]
0.50
INEQUALITY / GINI INDEX
5,025
TOTAL POPULATION
2,529
MALE POPULATION
2,496
FEMALE POPULATION
101.32
MALES / 100 FEMALES
98.70
FEMALES / 100 MALES
38.8
MEDIAN AGE
3.7
AVG FAMILY SIZE
2.6
AVG HOUSEHOLD SIZE
1,909
LABOR FORCE [ PEOPLE ]
50.4%
PERCENT IN LABOR FORCE
Sulphur Zip Codes
Sulphur Area Codes
Income in Sulphur
Income Overview in Sulphur
Per Capita Income in Sulphur is $30,745, while median incomes of families and households are $76,250 and $55,951 respectively.
| Characteristic | Number | Measure |
| Per Capita Income | 5,025 | $30,745 |
| Median Family Income | 988 | $76,250 |
| Mean Family Income | 988 | $96,129 |
| Median Household Income | 1,757 | $55,951 |
| Mean Household Income | 1,757 | $80,556 |
| Income Deficit | 988 | $0 |
| Wage / Income Gap (%) | 5,025 | 11.60% |
| Wage / Income Gap ($) | 5,025 | 88.40¢ per $1 |
| Gini / Inequality Index | 5,025 | 0.50 |
Earnings by Sex in Sulphur
Average Earnings in Sulphur are $36,587, $40,288 for men and $35,615 for women, a difference of 11.6%.
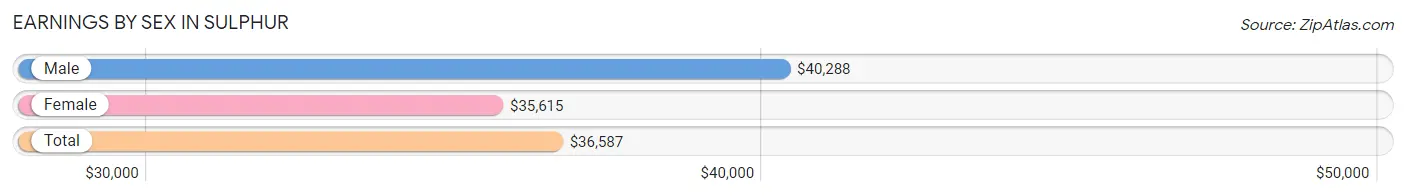
| Sex | Number | Average Earnings |
| Male | 1,080 (52.8%) | $40,288 |
| Female | 964 (47.2%) | $35,615 |
| Total | 2,044 (100.0%) | $36,587 |
Earnings by Sex by Income Bracket in Sulphur
The most common earnings brackets in Sulphur are $55,000 to $64,999 for men (136 | 12.6%) and $35,000 to $39,999 for women (207 | 21.5%).
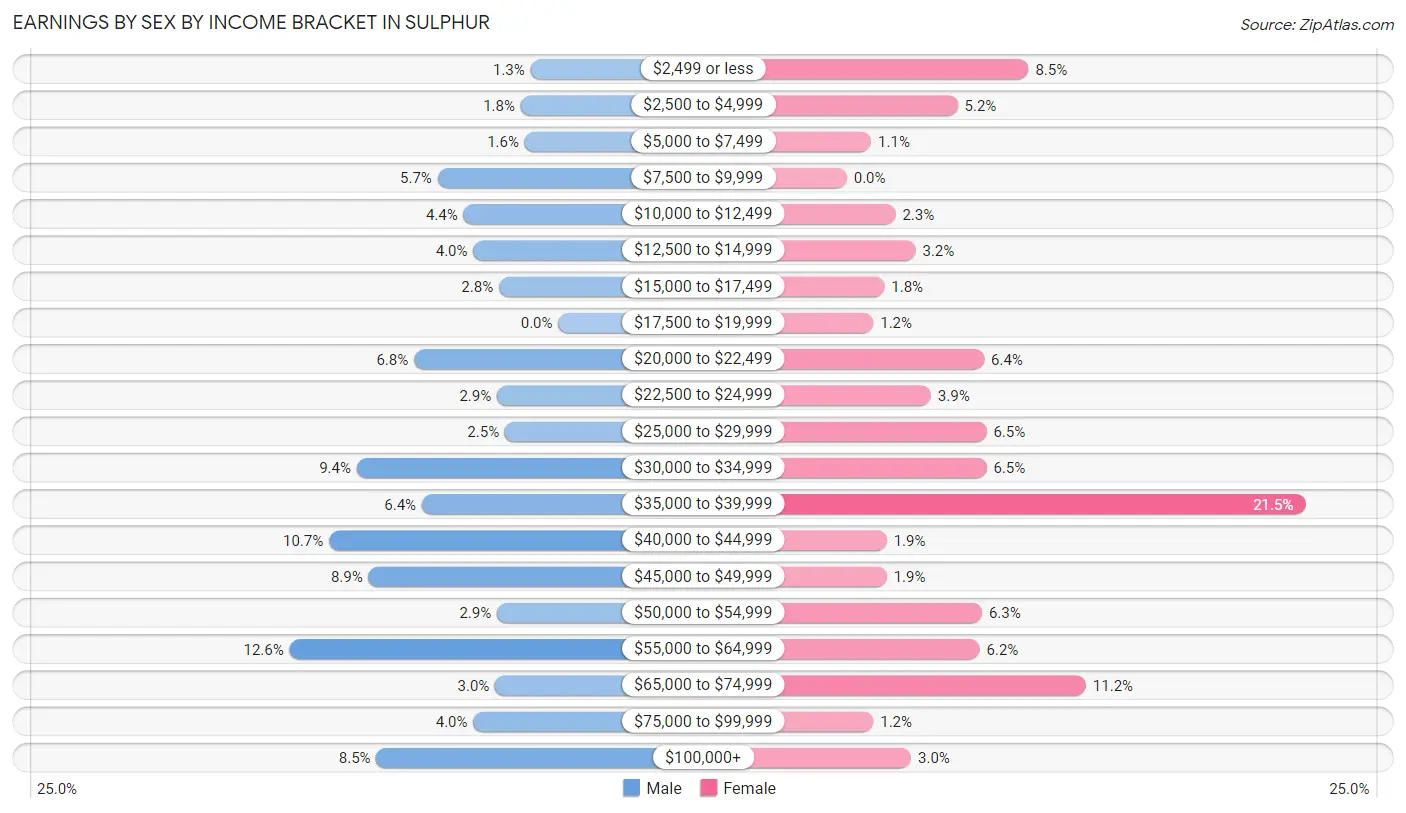
| Income | Male | Female |
| $2,499 or less | 14 (1.3%) | 82 (8.5%) |
| $2,500 to $4,999 | 19 (1.8%) | 50 (5.2%) |
| $5,000 to $7,499 | 17 (1.6%) | 11 (1.1%) |
| $7,500 to $9,999 | 61 (5.7%) | 0 (0.0%) |
| $10,000 to $12,499 | 48 (4.4%) | 22 (2.3%) |
| $12,500 to $14,999 | 43 (4.0%) | 31 (3.2%) |
| $15,000 to $17,499 | 30 (2.8%) | 17 (1.8%) |
| $17,500 to $19,999 | 0 (0.0%) | 12 (1.2%) |
| $20,000 to $22,499 | 73 (6.8%) | 62 (6.4%) |
| $22,500 to $24,999 | 31 (2.9%) | 38 (3.9%) |
| $25,000 to $29,999 | 27 (2.5%) | 63 (6.5%) |
| $30,000 to $34,999 | 102 (9.4%) | 63 (6.5%) |
| $35,000 to $39,999 | 69 (6.4%) | 207 (21.5%) |
| $40,000 to $44,999 | 116 (10.7%) | 18 (1.9%) |
| $45,000 to $49,999 | 96 (8.9%) | 18 (1.9%) |
| $50,000 to $54,999 | 31 (2.9%) | 61 (6.3%) |
| $55,000 to $64,999 | 136 (12.6%) | 60 (6.2%) |
| $65,000 to $74,999 | 32 (3.0%) | 108 (11.2%) |
| $75,000 to $99,999 | 43 (4.0%) | 12 (1.2%) |
| $100,000+ | 92 (8.5%) | 29 (3.0%) |
| Total | 1,080 (100.0%) | 964 (100.0%) |
Earnings by Sex by Educational Attainment in Sulphur
Average earnings in Sulphur are $46,725 for men and $36,806 for women, a difference of 21.2%. Men with an educational attainment of bachelor's degree enjoy the highest average annual earnings of $62,381, while those with high school diploma education earn the least with $41,743. Women with an educational attainment of high school diploma earn the most with the average annual earnings of $52,976, while those with less than high school education have the smallest earnings of $26,080.
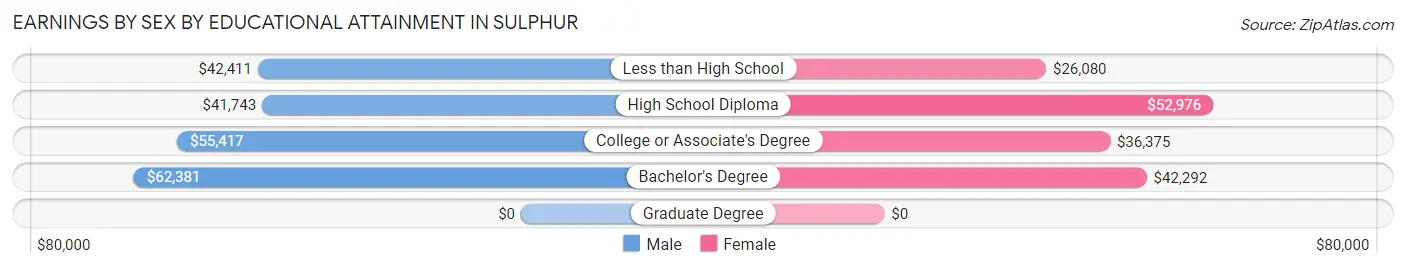
| Educational Attainment | Male Income | Female Income |
| Less than High School | $42,411 | $26,080 |
| High School Diploma | $41,743 | $52,976 |
| College or Associate's Degree | $55,417 | $36,375 |
| Bachelor's Degree | $62,381 | $42,292 |
| Graduate Degree | - | - |
| Total | $46,725 | $36,806 |
Family Income in Sulphur
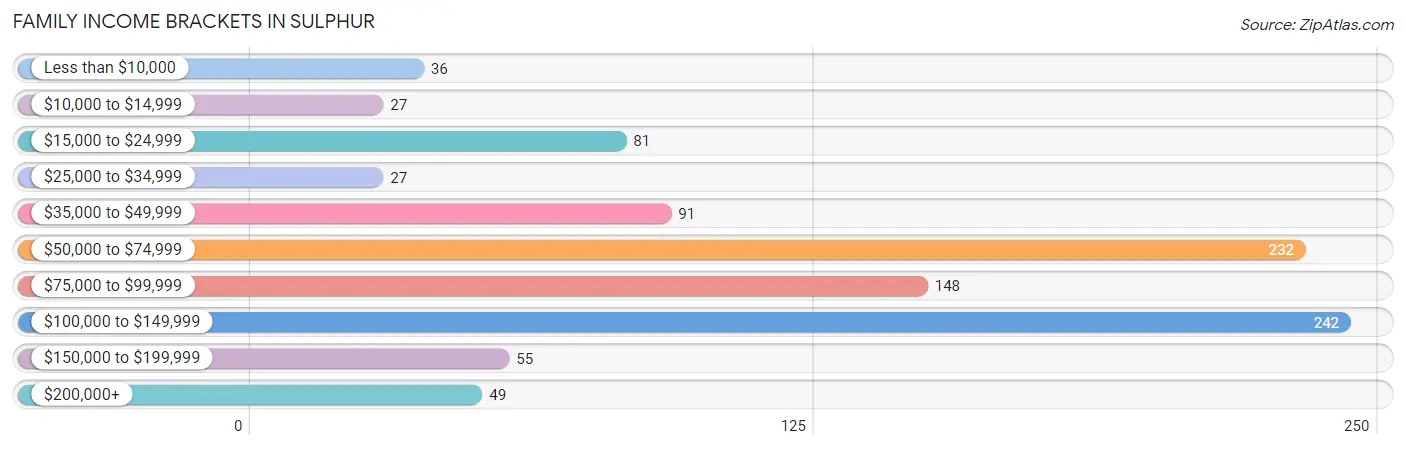
Family Income Brackets in Sulphur
According to the Sulphur family income data, there are 242 families falling into the $100,000 to $149,999 income range, which is the most common income bracket and makes up 24.5% of all families. Conversely, the $10,000 to $14,999 income bracket is the least frequent group with only 27 families (2.7%) belonging to this category.
| Income Bracket | # Families | % Families |
| Less than $10,000 | 36 | 3.6% |
| $10,000 to $14,999 | 27 | 2.7% |
| $15,000 to $24,999 | 81 | 8.2% |
| $25,000 to $34,999 | 27 | 2.7% |
| $35,000 to $49,999 | 91 | 9.2% |
| $50,000 to $74,999 | 232 | 23.5% |
| $75,000 to $99,999 | 148 | 15.0% |
| $100,000 to $149,999 | 242 | 24.5% |
| $150,000 to $199,999 | 55 | 5.6% |
| $200,000+ | 49 | 5.0% |
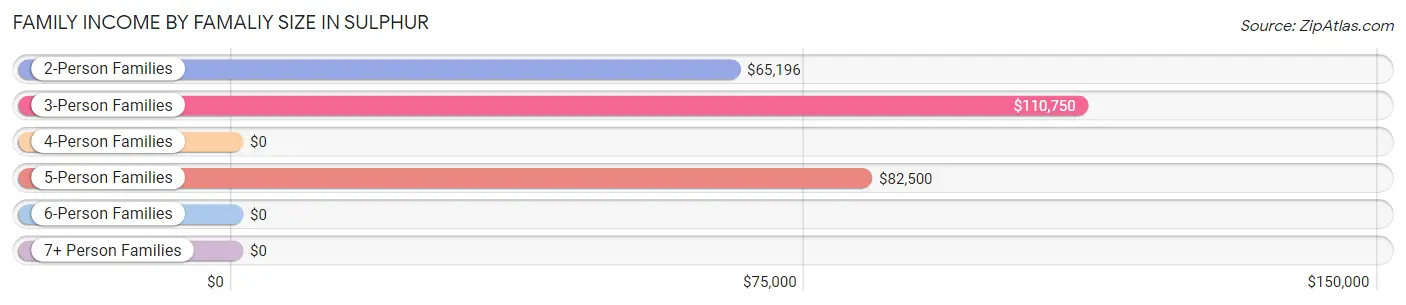
Family Income by Famaliy Size in Sulphur
3-person families (140 | 14.2%) account for the highest median family income in Sulphur with $110,750 per family, while 3-person families (140 | 14.2%) have the highest median income of $36,917 per family member.
| Income Bracket | # Families | Median Income |
| 2-Person Families | 476 (48.2%) | $65,196 |
| 3-Person Families | 140 (14.2%) | $110,750 |
| 4-Person Families | 147 (14.9%) | $0 |
| 5-Person Families | 146 (14.8%) | $82,500 |
| 6-Person Families | 53 (5.4%) | $0 |
| 7+ Person Families | 26 (2.6%) | $0 |
| Total | 988 (100.0%) | $76,250 |
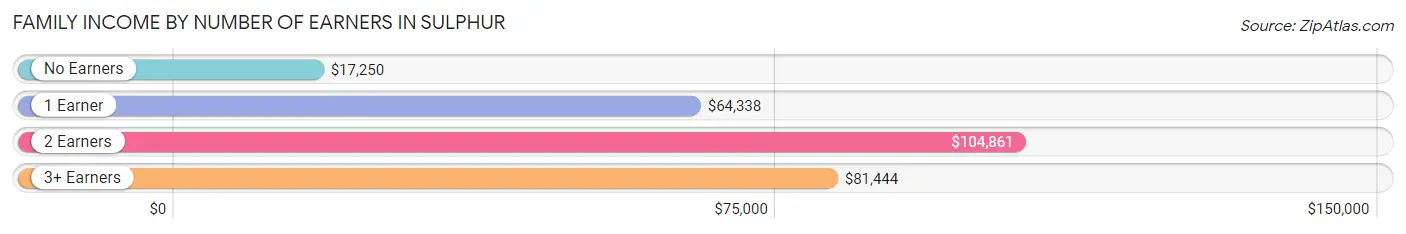
Family Income by Number of Earners in Sulphur
The median family income in Sulphur is $76,250, with families comprising 2 earners (417) having the highest median family income of $104,861, while families with no earners (162) have the lowest median family income of $17,250, accounting for 42.2% and 16.4% of families, respectively.
| Number of Earners | # Families | Median Income |
| No Earners | 162 (16.4%) | $17,250 |
| 1 Earner | 345 (34.9%) | $64,338 |
| 2 Earners | 417 (42.2%) | $104,861 |
| 3+ Earners | 64 (6.5%) | $81,444 |
| Total | 988 (100.0%) | $76,250 |
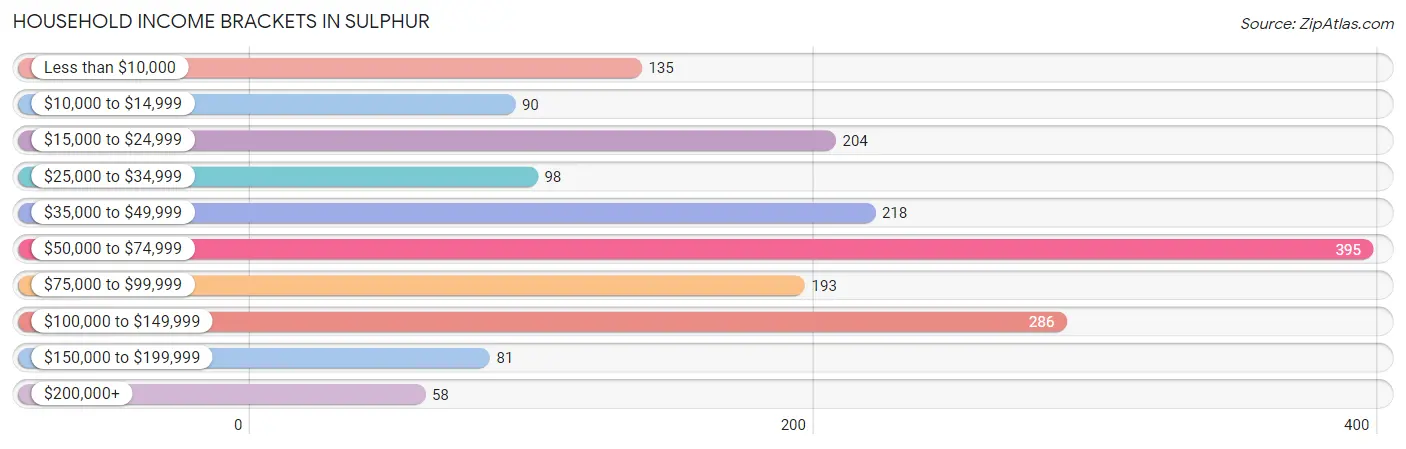
Household Income in Sulphur
Household Income Brackets in Sulphur
With 395 households falling in the category, the $50,000 to $74,999 income range is the most frequent in Sulphur, accounting for 22.5% of all households. In contrast, only 58 households (3.3%) fall into the $200,000+ income bracket, making it the least populous group.
| Income Bracket | # Households | % Households |
| Less than $10,000 | 135 | 7.7% |
| $10,000 to $14,999 | 90 | 5.1% |
| $15,000 to $24,999 | 204 | 11.6% |
| $25,000 to $34,999 | 98 | 5.6% |
| $35,000 to $49,999 | 218 | 12.4% |
| $50,000 to $74,999 | 395 | 22.5% |
| $75,000 to $99,999 | 193 | 11.0% |
| $100,000 to $149,999 | 286 | 16.3% |
| $150,000 to $199,999 | 81 | 4.6% |
| $200,000+ | 58 | 3.3% |
Household Income by Householder Age in Sulphur
The median household income in Sulphur is $55,951, with the highest median household income of $78,833 found in the 25 to 44 years age bracket for the primary householder. A total of 418 households (23.8%) fall into this category. Meanwhile, the 45 to 64 years age bracket for the primary householder has the lowest median household income of $46,989, with 712 households (40.5%) in this group.
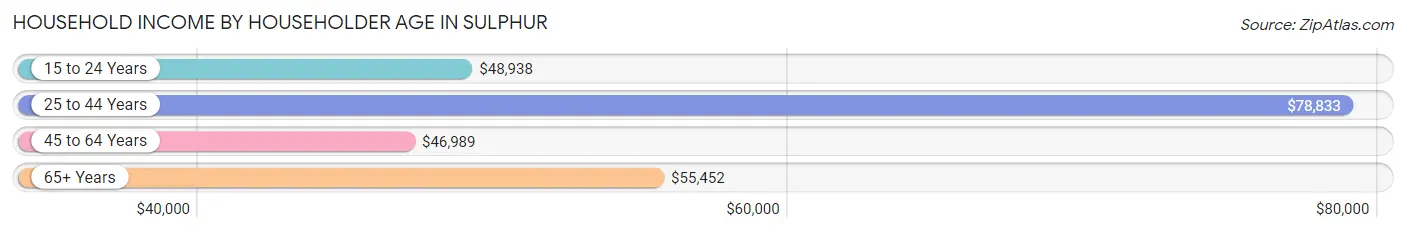
| Income Bracket | # Households | Median Income |
| 15 to 24 Years | 119 (6.8%) | $48,938 |
| 25 to 44 Years | 418 (23.8%) | $78,833 |
| 45 to 64 Years | 712 (40.5%) | $46,989 |
| 65+ Years | 508 (28.9%) | $55,452 |
| Total | 1,757 (100.0%) | $55,951 |
Poverty in Sulphur
Income Below Poverty by Sex and Age in Sulphur
With 19.5% poverty level for males and 22.4% for females among the residents of Sulphur, 12 to 14 year old males and 18 to 24 year old females are the most vulnerable to poverty, with 81 males (35.1%) and 73 females (44.2%) in their respective age groups living below the poverty level.
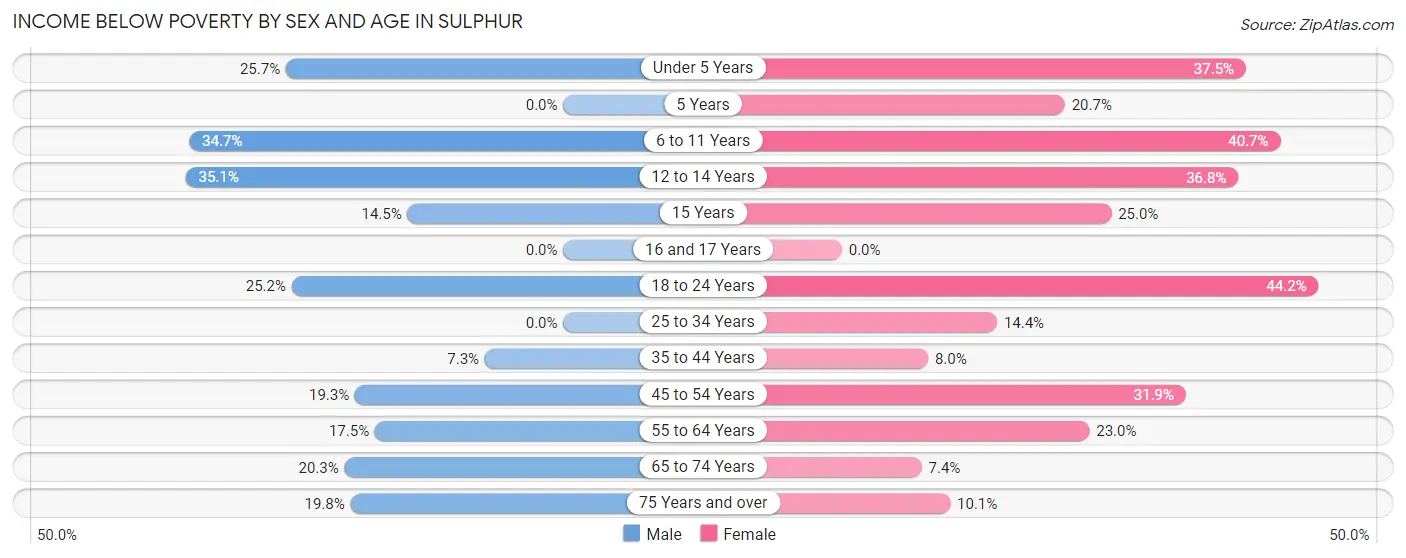
| Age Bracket | Male | Female |
| Under 5 Years | 52 (25.7%) | 57 (37.5%) |
| 5 Years | 0 (0.0%) | 12 (20.7%) |
| 6 to 11 Years | 58 (34.7%) | 70 (40.7%) |
| 12 to 14 Years | 81 (35.1%) | 39 (36.8%) |
| 15 Years | 12 (14.5%) | 11 (25.0%) |
| 16 and 17 Years | 0 (0.0%) | 0 (0.0%) |
| 18 to 24 Years | 63 (25.2%) | 73 (44.2%) |
| 25 to 34 Years | 0 (0.0%) | 37 (14.4%) |
| 35 to 44 Years | 15 (7.3%) | 22 (8.0%) |
| 45 to 54 Years | 52 (19.3%) | 91 (31.9%) |
| 55 to 64 Years | 50 (17.5%) | 79 (23.0%) |
| 65 to 74 Years | 39 (20.3%) | 20 (7.4%) |
| 75 Years and over | 16 (19.8%) | 22 (10.1%) |
| Total | 438 (19.5%) | 533 (22.4%) |
Income Above Poverty by Sex and Age in Sulphur
According to the poverty statistics in Sulphur, males aged 5 years and females aged 16 and 17 years are the age groups that are most secure financially, with 100.0% of males and 100.0% of females in these age groups living above the poverty line.
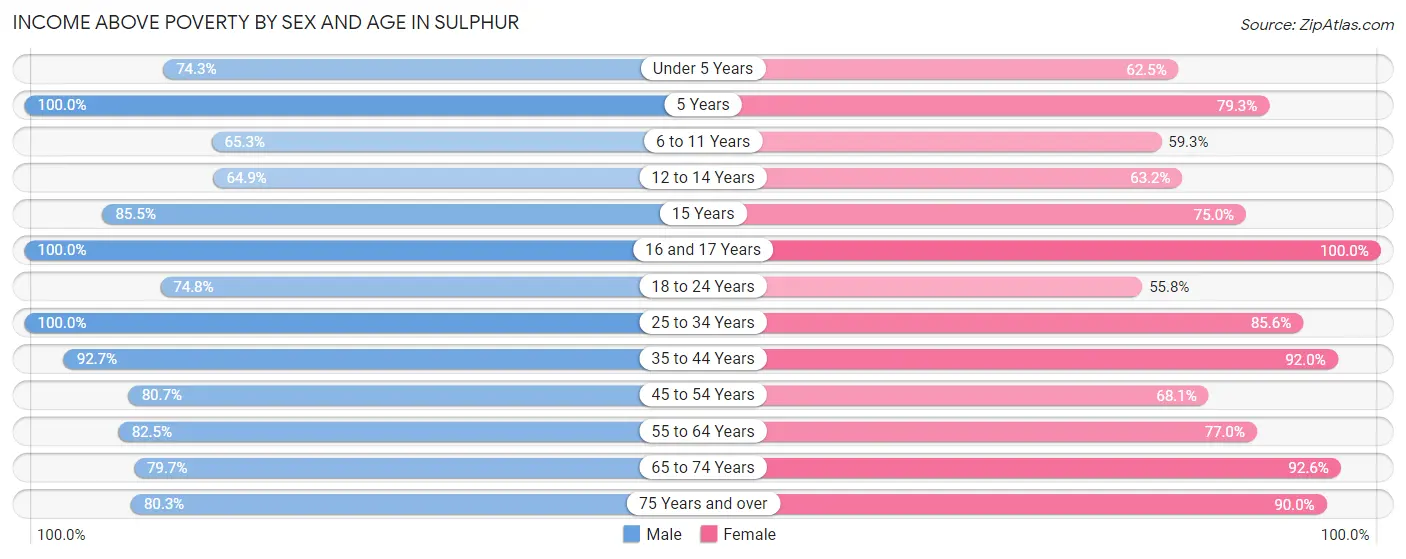
| Age Bracket | Male | Female |
| Under 5 Years | 150 (74.3%) | 95 (62.5%) |
| 5 Years | 22 (100.0%) | 46 (79.3%) |
| 6 to 11 Years | 109 (65.3%) | 102 (59.3%) |
| 12 to 14 Years | 150 (64.9%) | 67 (63.2%) |
| 15 Years | 71 (85.5%) | 33 (75.0%) |
| 16 and 17 Years | 102 (100.0%) | 29 (100.0%) |
| 18 to 24 Years | 187 (74.8%) | 92 (55.8%) |
| 25 to 34 Years | 152 (100.0%) | 220 (85.6%) |
| 35 to 44 Years | 191 (92.7%) | 253 (92.0%) |
| 45 to 54 Years | 217 (80.7%) | 194 (68.1%) |
| 55 to 64 Years | 236 (82.5%) | 265 (77.0%) |
| 65 to 74 Years | 153 (79.7%) | 250 (92.6%) |
| 75 Years and over | 65 (80.2%) | 197 (89.9%) |
| Total | 1,805 (80.5%) | 1,843 (77.6%) |
Income Below Poverty Among Married-Couple Families in Sulphur
The poverty statistics for married-couple families in Sulphur show that 7.1% or 50 of the total 699 families live below the poverty line. Families with 5 or more children have the highest poverty rate of 100.0%, comprising of 12 families. On the other hand, families with 1 or 2 children have the lowest poverty rate of 0.0%, which includes 0 families.
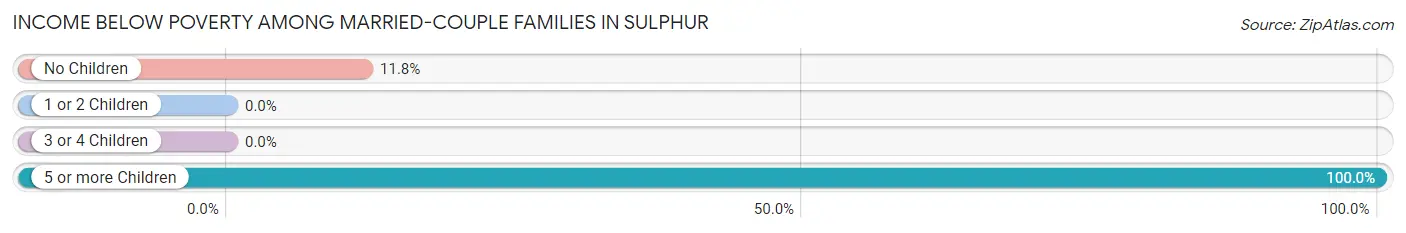
| Children | Above Poverty | Below Poverty |
| No Children | 285 (88.2%) | 38 (11.8%) |
| 1 or 2 Children | 255 (100.0%) | 0 (0.0%) |
| 3 or 4 Children | 109 (100.0%) | 0 (0.0%) |
| 5 or more Children | 0 (0.0%) | 12 (100.0%) |
| Total | 649 (92.8%) | 50 (7.1%) |
Income Below Poverty Among Single-Parent Households in Sulphur
According to the poverty data in Sulphur, 40.3% or 31 single-father households and 24.1% or 51 single-mother households are living below the poverty line. Among single-father households, those with 3 or 4 children have the highest poverty rate, with 12 households (100.0%) experiencing poverty. Likewise, among single-mother households, those with 3 or 4 children have the highest poverty rate, with 39 households (100.0%) falling below the poverty line.
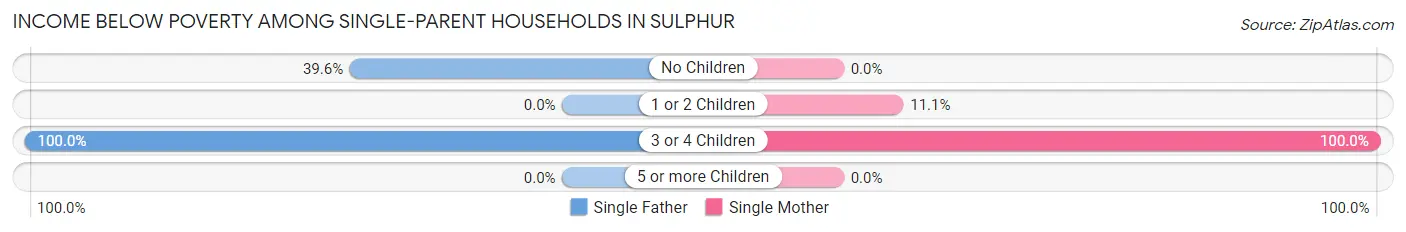
| Children | Single Father | Single Mother |
| No Children | 19 (39.6%) | 0 (0.0%) |
| 1 or 2 Children | 0 (0.0%) | 12 (11.1%) |
| 3 or 4 Children | 12 (100.0%) | 39 (100.0%) |
| 5 or more Children | 0 (0.0%) | 0 (0.0%) |
| Total | 31 (40.3%) | 51 (24.1%) |
Income Below Poverty Among Married-Couple vs Single-Parent Households in Sulphur
The poverty data for Sulphur shows that 50 of the married-couple family households (7.1%) and 82 of the single-parent households (28.4%) are living below the poverty level. Within the married-couple family households, those with 5 or more children have the highest poverty rate, with 12 households (100.0%) falling below the poverty line. Among the single-parent households, those with 3 or 4 children have the highest poverty rate, with 51 household (100.0%) living below poverty.
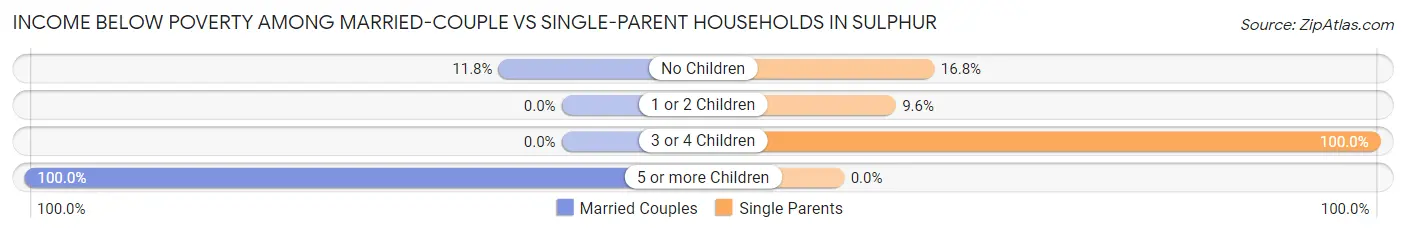
| Children | Married-Couple Families | Single-Parent Households |
| No Children | 38 (11.8%) | 19 (16.8%) |
| 1 or 2 Children | 0 (0.0%) | 12 (9.6%) |
| 3 or 4 Children | 0 (0.0%) | 51 (100.0%) |
| 5 or more Children | 12 (100.0%) | 0 (0.0%) |
| Total | 50 (7.1%) | 82 (28.4%) |
Race in Sulphur
The most populous races in Sulphur are White / Caucasian (3,517 | 70.0%), Two or more Races (811 | 16.1%), and Hispanic or Latino (616 | 12.3%).
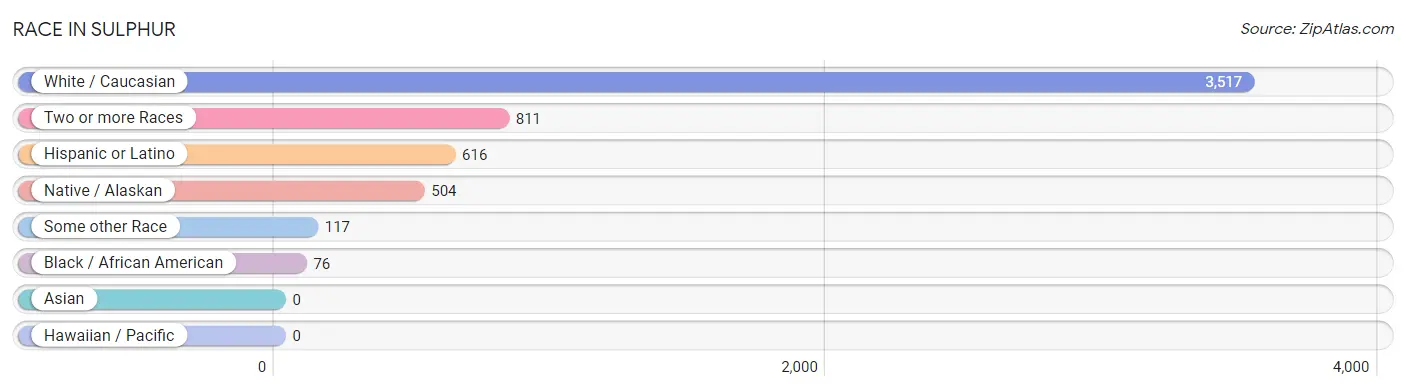
| Race | # Population | % Population |
| Asian | 0 | 0.0% |
| Black / African American | 76 | 1.5% |
| Hawaiian / Pacific | 0 | 0.0% |
| Hispanic or Latino | 616 | 12.3% |
| Native / Alaskan | 504 | 10.0% |
| White / Caucasian | 3,517 | 70.0% |
| Two or more Races | 811 | 16.1% |
| Some other Race | 117 | 2.3% |
| Total | 5,025 | 100.0% |
Ancestry in Sulphur
The most populous ancestries reported in Sulphur are German (607 | 12.1%), Mexican (455 | 9.0%), American (414 | 8.2%), English (411 | 8.2%), and Chickasaw (380 | 7.6%), together accounting for 45.1% of all Sulphur residents.
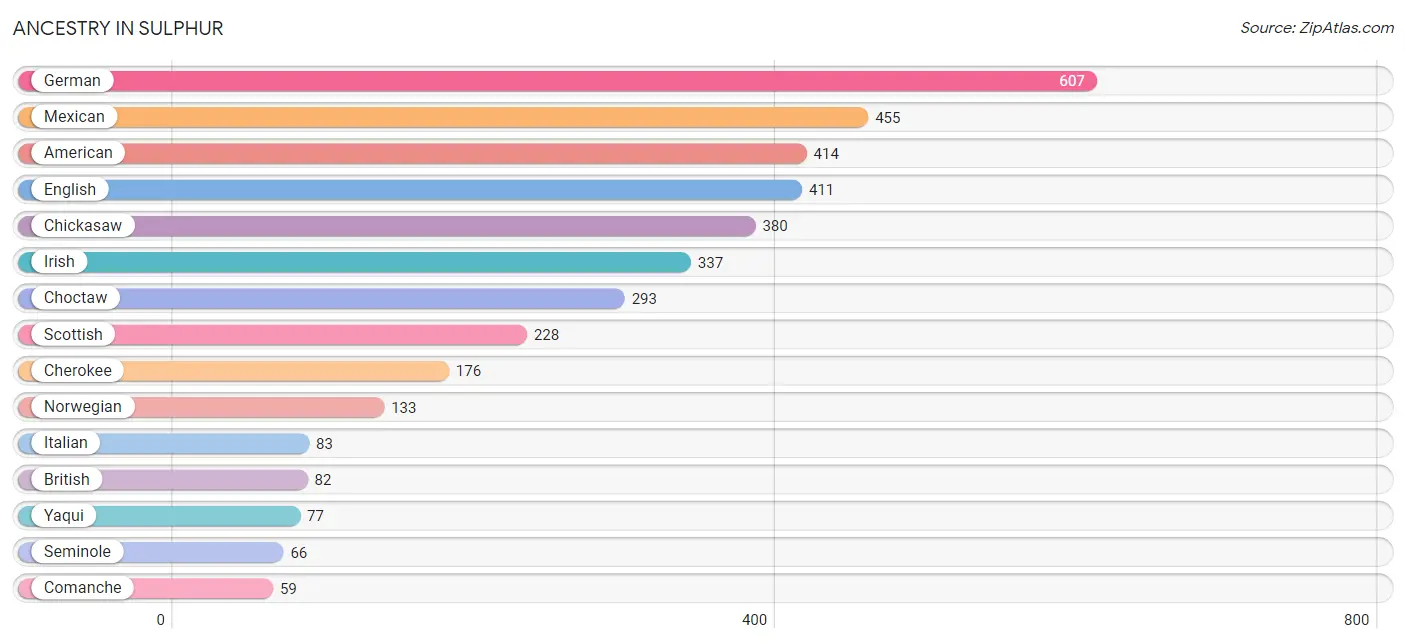
| Ancestry | # Population | % Population |
| American | 414 | 8.2% |
| Blackfeet | 17 | 0.3% |
| British | 82 | 1.6% |
| Cherokee | 176 | 3.5% |
| Chickasaw | 380 | 7.6% |
| Choctaw | 293 | 5.8% |
| Comanche | 59 | 1.2% |
| Dutch | 26 | 0.5% |
| Dutch West Indian | 7 | 0.1% |
| Eastern European | 4 | 0.1% |
| English | 411 | 8.2% |
| French | 30 | 0.6% |
| German | 607 | 12.1% |
| Irish | 337 | 6.7% |
| Italian | 83 | 1.7% |
| Mexican | 455 | 9.0% |
| Norwegian | 133 | 2.6% |
| Polish | 45 | 0.9% |
| Portuguese | 13 | 0.3% |
| Potawatomi | 33 | 0.7% |
| Puerto Rican | 57 | 1.1% |
| Russian | 32 | 0.6% |
| Scotch-Irish | 24 | 0.5% |
| Scottish | 228 | 4.5% |
| Seminole | 66 | 1.3% |
| Spanish | 41 | 0.8% |
| Yaqui | 77 | 1.5% | View All 27 Rows |
Immigrants in Sulphur
The most numerous immigrant groups reported in Sulphur came from Central America (78 | 1.5%), Latin America (78 | 1.5%), Mexico (78 | 1.5%), Europe (12 | 0.2%), and Northern Europe (12 | 0.2%), together accounting for 5.1% of all Sulphur residents.
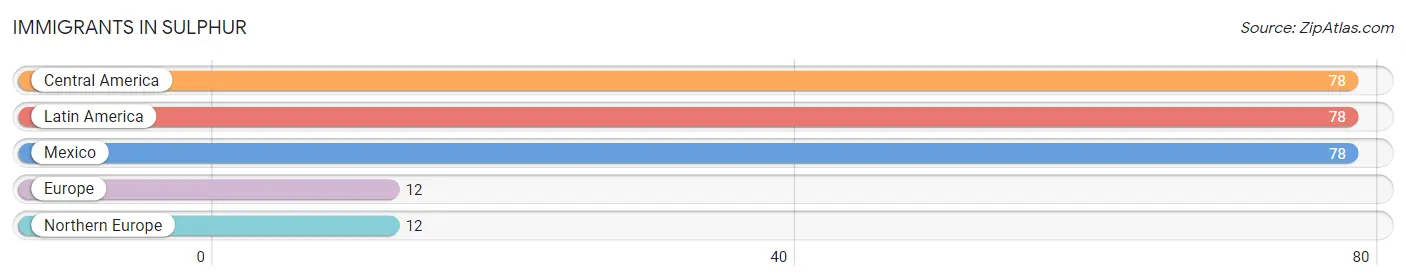
| Immigration Origin | # Population | % Population |
| Central America | 78 | 1.5% |
| Europe | 12 | 0.2% |
| Latin America | 78 | 1.5% |
| Mexico | 78 | 1.5% |
| Northern Europe | 12 | 0.2% | View All 5 Rows |
Sex and Age in Sulphur
Sex and Age in Sulphur
The most populous age groups in Sulphur are 15 to 19 Years (285 | 11.3%) for men and 5 to 9 Years (201 | 8.1%) for women.
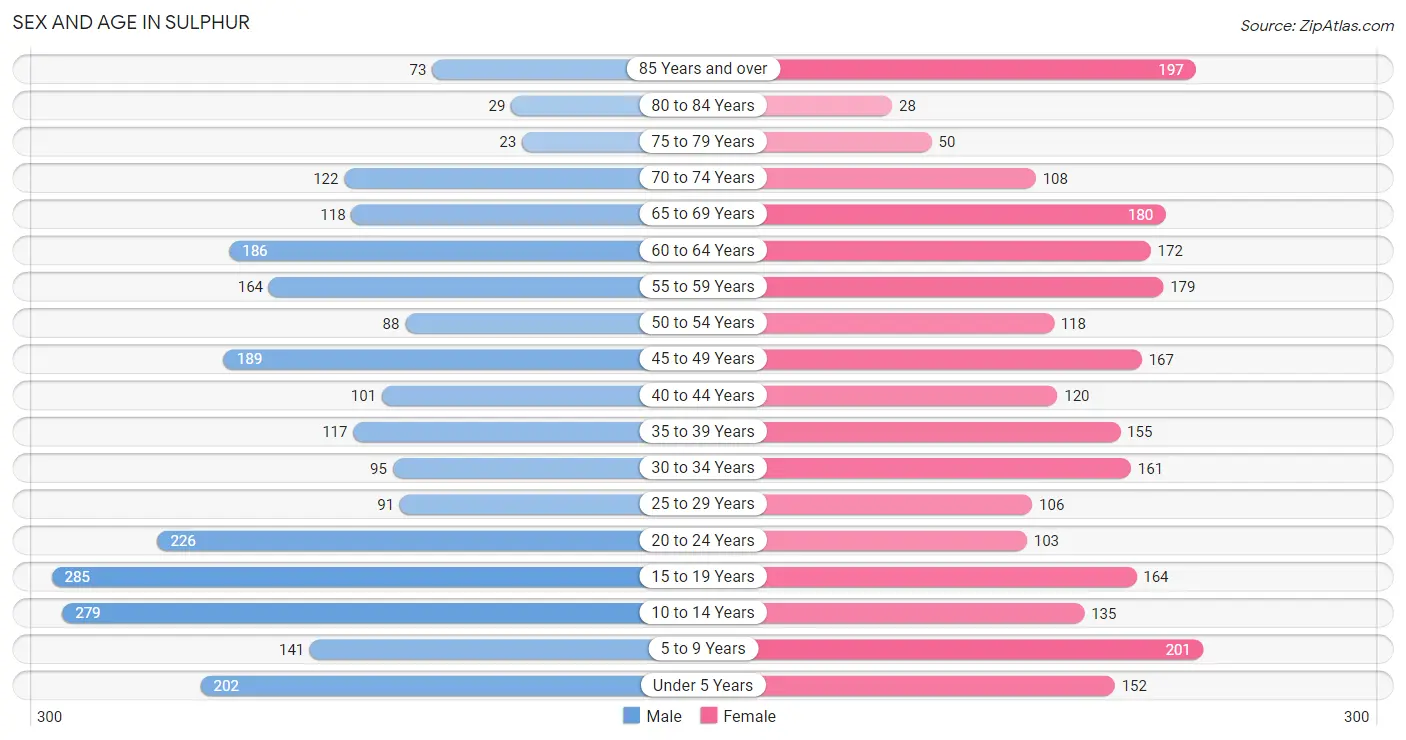
| Age Bracket | Male | Female |
| Under 5 Years | 202 (8.0%) | 152 (6.1%) |
| 5 to 9 Years | 141 (5.6%) | 201 (8.1%) |
| 10 to 14 Years | 279 (11.0%) | 135 (5.4%) |
| 15 to 19 Years | 285 (11.3%) | 164 (6.6%) |
| 20 to 24 Years | 226 (8.9%) | 103 (4.1%) |
| 25 to 29 Years | 91 (3.6%) | 106 (4.3%) |
| 30 to 34 Years | 95 (3.8%) | 161 (6.5%) |
| 35 to 39 Years | 117 (4.6%) | 155 (6.2%) |
| 40 to 44 Years | 101 (4.0%) | 120 (4.8%) |
| 45 to 49 Years | 189 (7.5%) | 167 (6.7%) |
| 50 to 54 Years | 88 (3.5%) | 118 (4.7%) |
| 55 to 59 Years | 164 (6.5%) | 179 (7.2%) |
| 60 to 64 Years | 186 (7.3%) | 172 (6.9%) |
| 65 to 69 Years | 118 (4.7%) | 180 (7.2%) |
| 70 to 74 Years | 122 (4.8%) | 108 (4.3%) |
| 75 to 79 Years | 23 (0.9%) | 50 (2.0%) |
| 80 to 84 Years | 29 (1.1%) | 28 (1.1%) |
| 85 Years and over | 73 (2.9%) | 197 (7.9%) |
| Total | 2,529 (100.0%) | 2,496 (100.0%) |
Families and Households in Sulphur
Median Family Size in Sulphur
The median family size in Sulphur is 3.68 persons per family, with single female/mother families (212 | 21.5%) accounting for the largest median family size of 4.19 persons per family. On the other hand, single male/father families (77 | 7.8%) represent the smallest median family size with 3.43 persons per family.
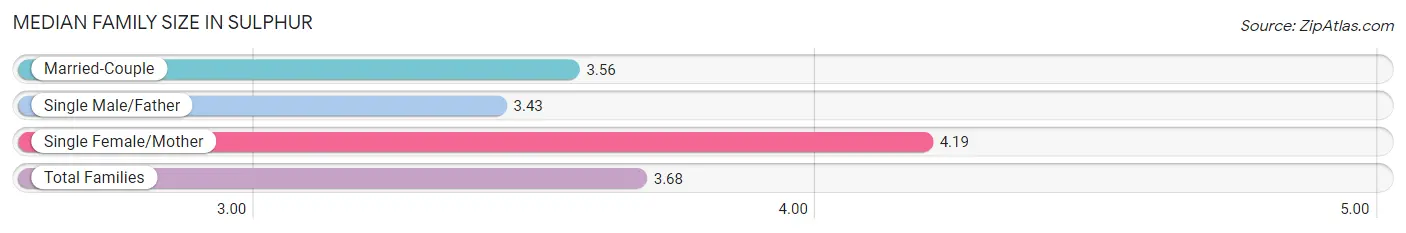
| Family Type | # Families | Family Size |
| Married-Couple | 699 (70.8%) | 3.56 |
| Single Male/Father | 77 (7.8%) | 3.43 |
| Single Female/Mother | 212 (21.5%) | 4.19 |
| Total Families | 988 (100.0%) | 3.68 |
Median Household Size in Sulphur
The median household size in Sulphur is 2.63 persons per household, with single female/mother households (212 | 12.1%) accounting for the largest median household size of 4.19 persons per household. non-family households (769 | 43.8%) represent the smallest median household size with 1.25 persons per household.
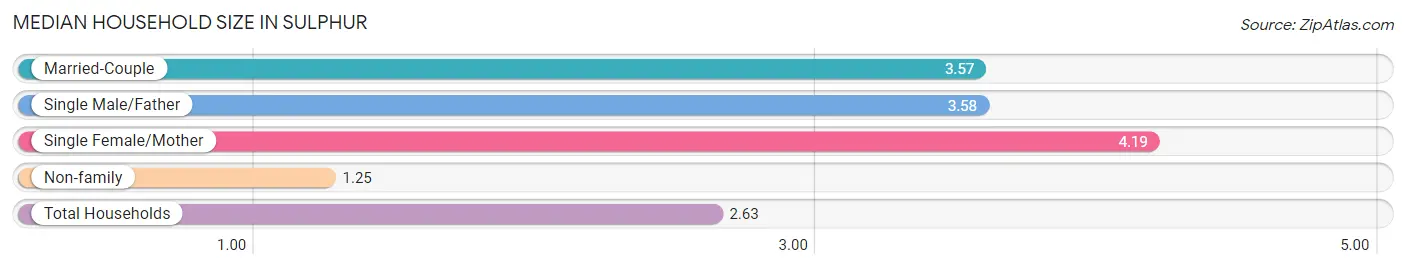
| Household Type | # Households | Household Size |
| Married-Couple | 699 (39.8%) | 3.57 |
| Single Male/Father | 77 (4.4%) | 3.58 |
| Single Female/Mother | 212 (12.1%) | 4.19 |
| Non-family | 769 (43.8%) | 1.25 |
| Total Households | 1,757 (100.0%) | 2.63 |
Household Size by Marriage Status in Sulphur
Out of a total of 1,757 households in Sulphur, 988 (56.2%) are family households, while 769 (43.8%) are nonfamily households. The most numerous type of family households are 2-person households, comprising 475, and the most common type of nonfamily households are 1-person households, comprising 663.
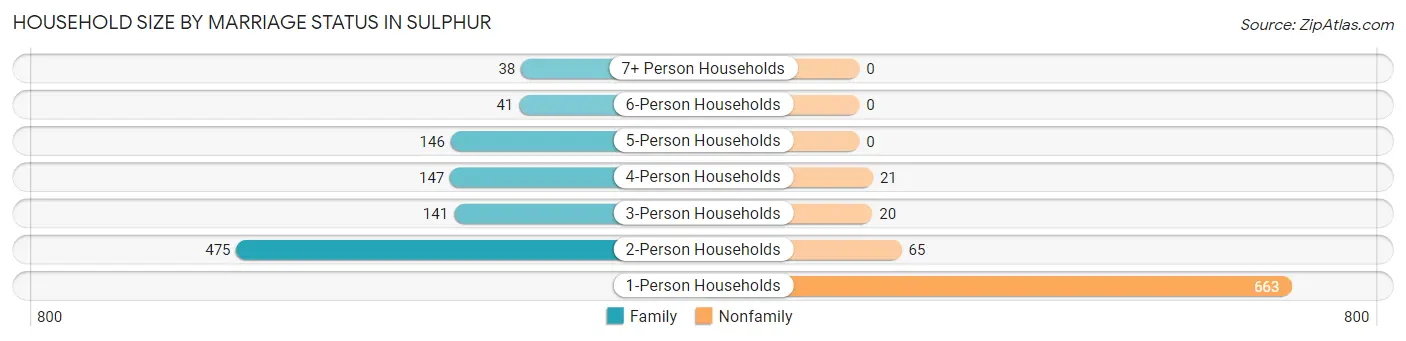
| Household Size | Family Households | Nonfamily Households |
| 1-Person Households | - | 663 (37.7%) |
| 2-Person Households | 475 (27.0%) | 65 (3.7%) |
| 3-Person Households | 141 (8.0%) | 20 (1.1%) |
| 4-Person Households | 147 (8.4%) | 21 (1.2%) |
| 5-Person Households | 146 (8.3%) | 0 (0.0%) |
| 6-Person Households | 41 (2.3%) | 0 (0.0%) |
| 7+ Person Households | 38 (2.2%) | 0 (0.0%) |
| Total | 988 (56.2%) | 769 (43.8%) |
Female Fertility in Sulphur
Fertility by Age in Sulphur
Average fertility rate in Sulphur is 29.0 births per 1,000 women. Women in the age bracket of 20 to 34 years have the highest fertility rate with 78.0 births per 1,000 women. Women in the age bracket of 20 to 34 years acount for 100.0% of all women with births.
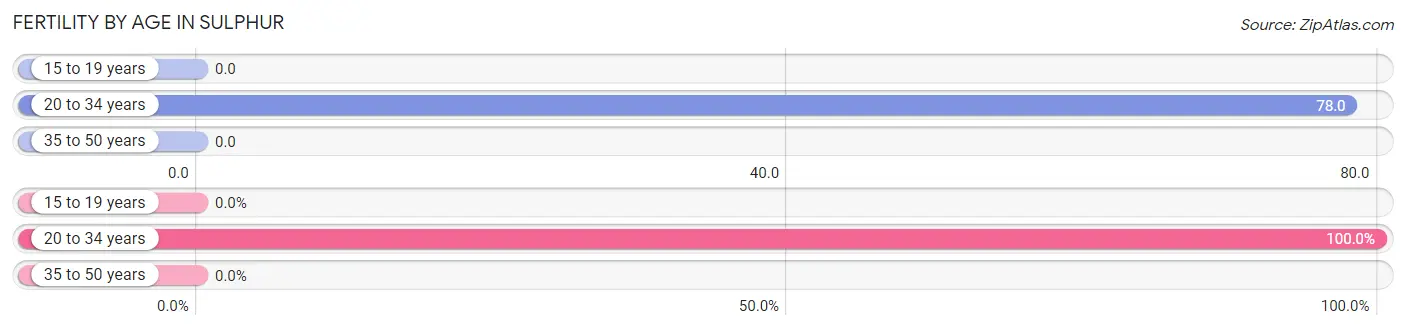
| Age Bracket | Women with Births | Births / 1,000 Women |
| 15 to 19 years | 0 (0.0%) | 0.0 |
| 20 to 34 years | 29 (100.0%) | 78.0 |
| 35 to 50 years | 0 (0.0%) | 0.0 |
| Total | 29 (100.0%) | 29.0 |
Fertility by Age by Marriage Status in Sulphur
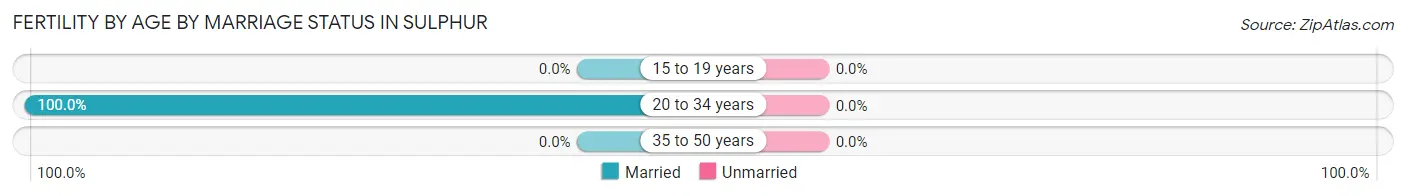
| Age Bracket | Married | Unmarried |
| 15 to 19 years | 0 (0.0%) | 0 (0.0%) |
| 20 to 34 years | 29 (100.0%) | 0 (0.0%) |
| 35 to 50 years | 0 (0.0%) | 0 (0.0%) |
| Total | 29 (100.0%) | 0 (0.0%) |
Fertility by Education in Sulphur
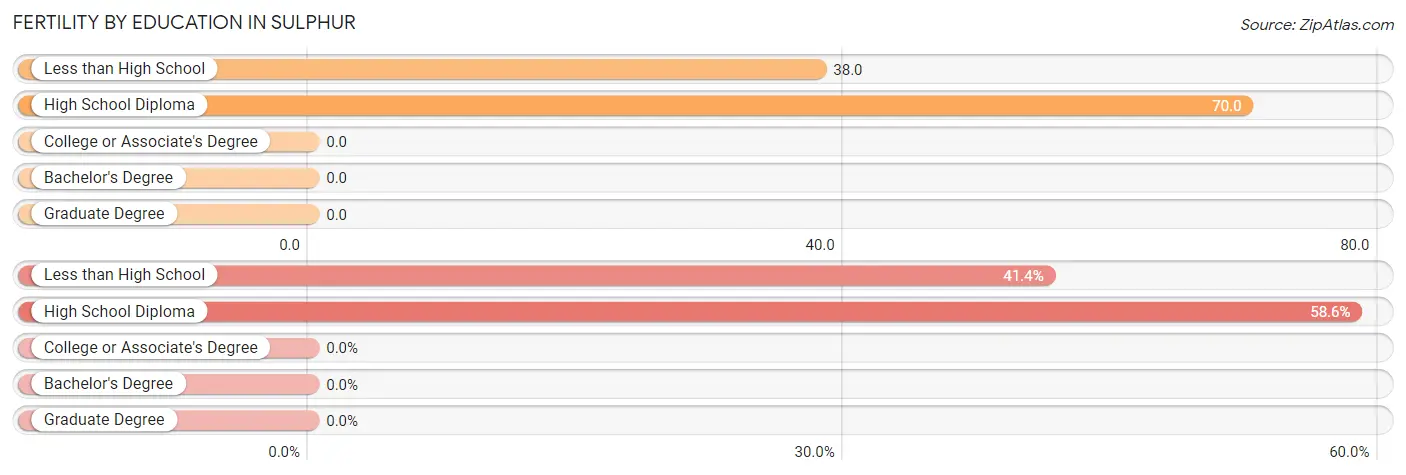
| Educational Attainment | Women with Births | Births / 1,000 Women |
| Less than High School | 12 (41.4%) | 38.0 |
| High School Diploma | 17 (58.6%) | 70.0 |
| College or Associate's Degree | 0 (0.0%) | 0.0 |
| Bachelor's Degree | 0 (0.0%) | 0.0 |
| Graduate Degree | 0 (0.0%) | 0.0 |
| Total | 29 (100.0%) | 29.0 |
Fertility by Education by Marriage Status in Sulphur
| Educational Attainment | Married | Unmarried |
| Less than High School | 12 (100.0%) | 0 (0.0%) |
| High School Diploma | 17 (100.0%) | 0 (0.0%) |
| College or Associate's Degree | 0 (0.0%) | 0 (0.0%) |
| Bachelor's Degree | 0 (0.0%) | 0 (0.0%) |
| Graduate Degree | 0 (0.0%) | 0 (0.0%) |
| Total | 29 (100.0%) | 0 (0.0%) |
Employment Characteristics in Sulphur
Employment by Class of Employer in Sulphur
Among the 1,899 employed individuals in Sulphur, private company employees (1,289 | 67.9%), local government employees (168 | 8.8%), and self-employed (not incorporated) (132 | 7.0%) make up the most common classes of employment.
| Employer Class | # Employees | % Employees |
| Private Company Employees | 1,289 | 67.9% |
| Self-Employed (Incorporated) | 57 | 3.0% |
| Self-Employed (Not Incorporated) | 132 | 7.0% |
| Not-for-profit Organizations | 62 | 3.3% |
| Local Government Employees | 168 | 8.8% |
| State Government Employees | 70 | 3.7% |
| Federal Government Employees | 101 | 5.3% |
| Unpaid Family Workers | 20 | 1.1% |
| Total | 1,899 | 100.0% |
Employment Status by Age in Sulphur
| Age Bracket | In Labor Force | Unemployed |
| 16 to 19 Years | 84 (26.1%) | 0 (0.0%) |
| 20 to 24 Years | 297 (90.3%) | 0 (0.0%) |
| 25 to 29 Years | 143 (72.6%) | 0 (0.0%) |
| 30 to 34 Years | 192 (75.0%) | 0 (0.0%) |
| 35 to 44 Years | 404 (81.9%) | 0 (0.0%) |
| 45 to 54 Years | 341 (60.7%) | 0 (0.0%) |
| 55 to 59 Years | 228 (66.5%) | 0 (0.0%) |
| 60 to 64 Years | 123 (34.4%) | 0 (0.0%) |
| 65 to 74 Years | 97 (18.4%) | 0 (0.0%) |
| 75 Years and over | 0 (0.0%) | 0 (0.0%) |
| Total | 1,909 (50.4%) | 0 (0.0%) |
Employment Status by Educational Attainment in Sulphur
| Educational Attainment | In Labor Force | Unemployed |
| Less than High School | 234 (61.1%) | 0 (0.0%) |
| High School Diploma | 358 (44.7%) | 0 (0.0%) |
| College / Associate Degree | 608 (80.5%) | 0 (0.0%) |
| Bachelor's Degree or higher | 231 (85.6%) | 0 (0.0%) |
| Total | 1,431 (64.8%) | 0 (0.0%) |
Employment Occupations by Sex in Sulphur
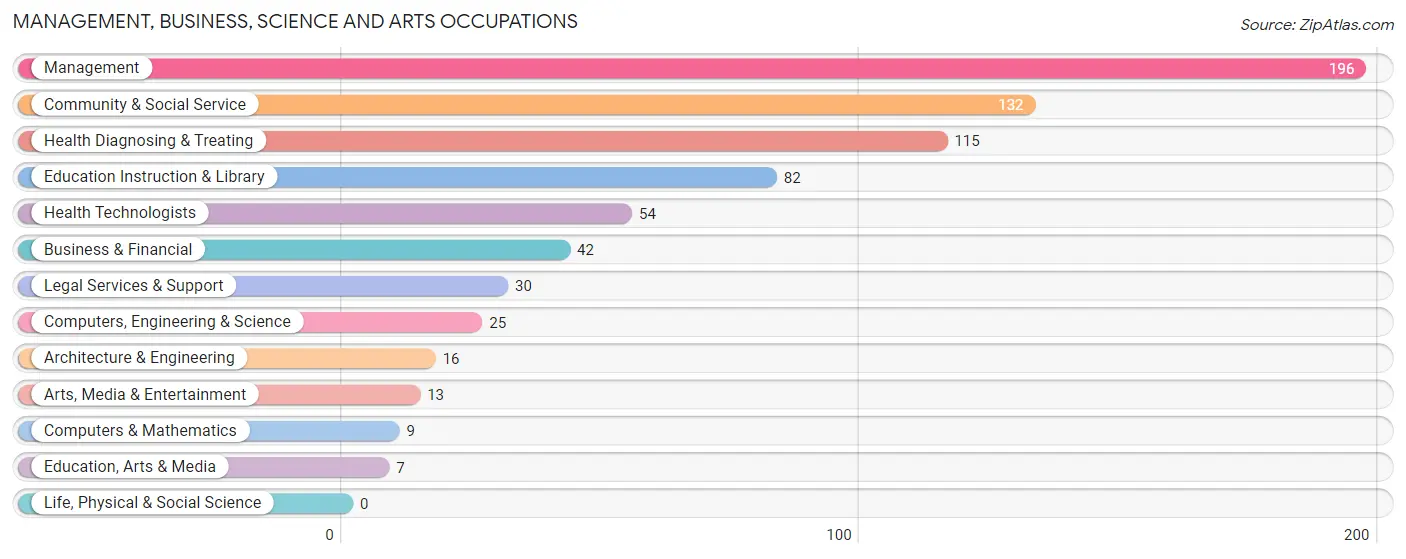
Management, Business, Science and Arts Occupations
The most common Management, Business, Science and Arts occupations in Sulphur are Management (196 | 10.3%), Community & Social Service (132 | 7.0%), Health Diagnosing & Treating (115 | 6.1%), Education Instruction & Library (82 | 4.3%), and Health Technologists (54 | 2.8%).
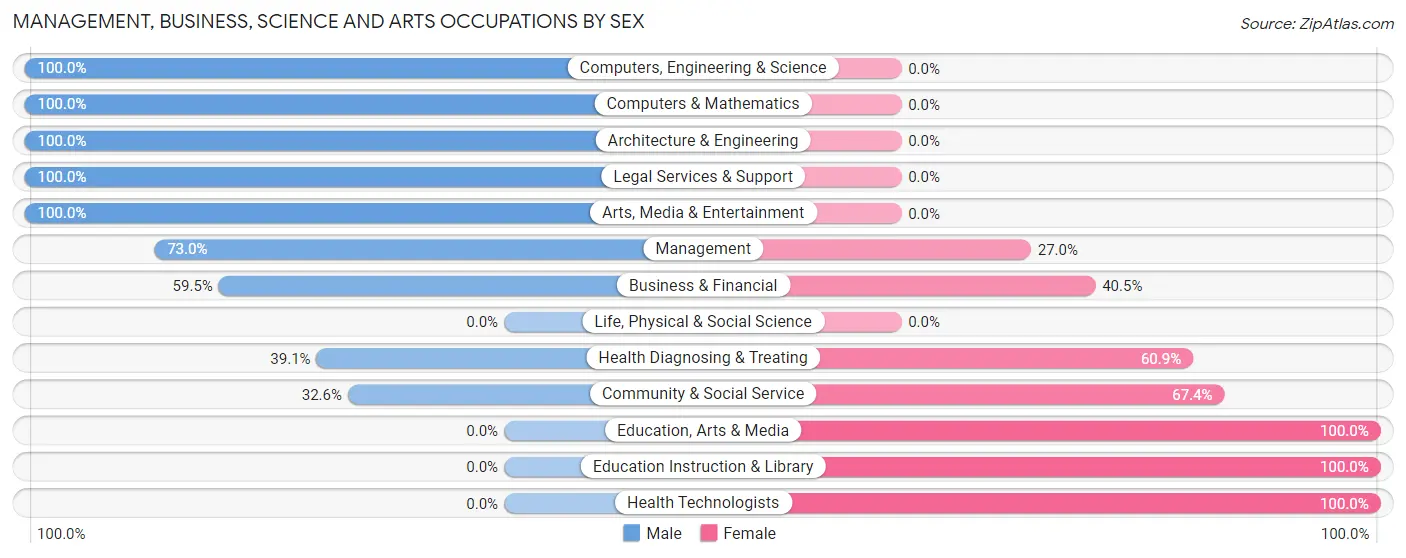
Management, Business, Science and Arts Occupations by Sex
Within the Management, Business, Science and Arts occupations in Sulphur, the most male-oriented occupations are Computers, Engineering & Science (100.0%), Computers & Mathematics (100.0%), and Architecture & Engineering (100.0%), while the most female-oriented occupations are Education, Arts & Media (100.0%), Education Instruction & Library (100.0%), and Health Technologists (100.0%).
| Occupation | Male | Female |
| Management | 143 (73.0%) | 53 (27.0%) |
| Business & Financial | 25 (59.5%) | 17 (40.5%) |
| Computers, Engineering & Science | 25 (100.0%) | 0 (0.0%) |
| Computers & Mathematics | 9 (100.0%) | 0 (0.0%) |
| Architecture & Engineering | 16 (100.0%) | 0 (0.0%) |
| Life, Physical & Social Science | 0 (0.0%) | 0 (0.0%) |
| Community & Social Service | 43 (32.6%) | 89 (67.4%) |
| Education, Arts & Media | 0 (0.0%) | 7 (100.0%) |
| Legal Services & Support | 30 (100.0%) | 0 (0.0%) |
| Education Instruction & Library | 0 (0.0%) | 82 (100.0%) |
| Arts, Media & Entertainment | 13 (100.0%) | 0 (0.0%) |
| Health Diagnosing & Treating | 45 (39.1%) | 70 (60.9%) |
| Health Technologists | 0 (0.0%) | 54 (100.0%) |
| Total (Category) | 281 (55.1%) | 229 (44.9%) |
| Total (Overall) | 1,014 (53.4%) | 885 (46.6%) |
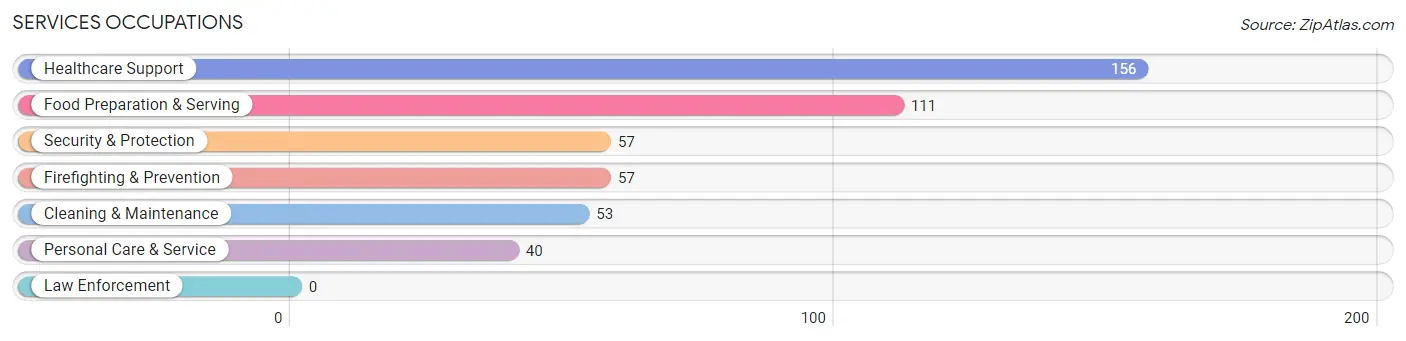
Services Occupations
The most common Services occupations in Sulphur are Healthcare Support (156 | 8.2%), Food Preparation & Serving (111 | 5.9%), Security & Protection (57 | 3.0%), Firefighting & Prevention (57 | 3.0%), and Cleaning & Maintenance (53 | 2.8%).
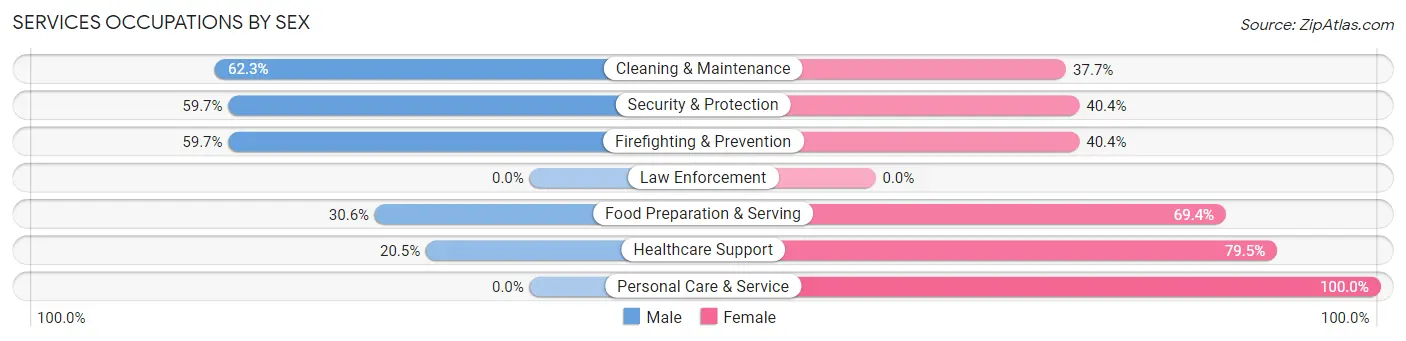
Services Occupations by Sex
Within the Services occupations in Sulphur, the most male-oriented occupations are Cleaning & Maintenance (62.3%), Security & Protection (59.7%), and Firefighting & Prevention (59.7%), while the most female-oriented occupations are Personal Care & Service (100.0%), Healthcare Support (79.5%), and Food Preparation & Serving (69.4%).
| Occupation | Male | Female |
| Healthcare Support | 32 (20.5%) | 124 (79.5%) |
| Security & Protection | 34 (59.7%) | 23 (40.4%) |
| Firefighting & Prevention | 34 (59.7%) | 23 (40.4%) |
| Law Enforcement | 0 (0.0%) | 0 (0.0%) |
| Food Preparation & Serving | 34 (30.6%) | 77 (69.4%) |
| Cleaning & Maintenance | 33 (62.3%) | 20 (37.7%) |
| Personal Care & Service | 0 (0.0%) | 40 (100.0%) |
| Total (Category) | 133 (31.9%) | 284 (68.1%) |
| Total (Overall) | 1,014 (53.4%) | 885 (46.6%) |
Sales and Office Occupations
The most common Sales and Office occupations in Sulphur are Office & Administration (255 | 13.4%), and Sales & Related (108 | 5.7%).

Sales and Office Occupations by Sex
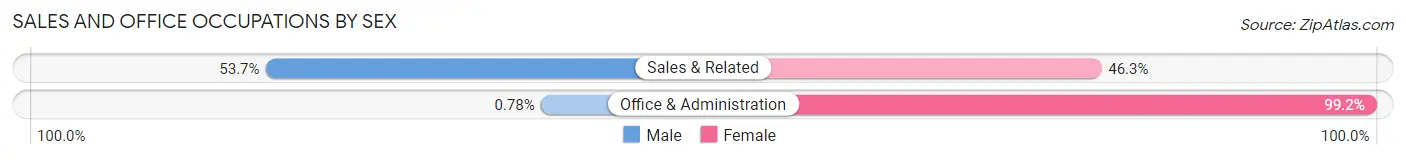
| Occupation | Male | Female |
| Sales & Related | 58 (53.7%) | 50 (46.3%) |
| Office & Administration | 2 (0.8%) | 253 (99.2%) |
| Total (Category) | 60 (16.5%) | 303 (83.5%) |
| Total (Overall) | 1,014 (53.4%) | 885 (46.6%) |
Natural Resources, Construction and Maintenance Occupations
The most common Natural Resources, Construction and Maintenance occupations in Sulphur are Installation, Maintenance & Repair (152 | 8.0%), Construction & Extraction (125 | 6.6%), and Farming, Fishing & Forestry (16 | 0.8%).
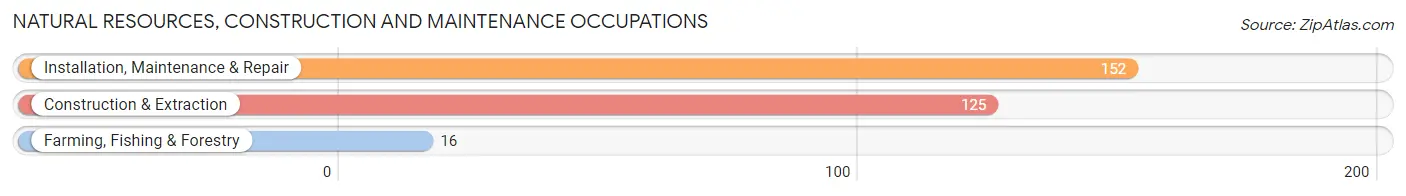
Natural Resources, Construction and Maintenance Occupations by Sex
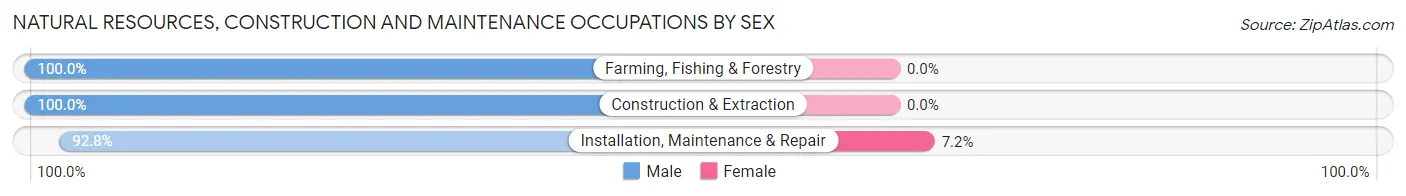
| Occupation | Male | Female |
| Farming, Fishing & Forestry | 16 (100.0%) | 0 (0.0%) |
| Construction & Extraction | 125 (100.0%) | 0 (0.0%) |
| Installation, Maintenance & Repair | 141 (92.8%) | 11 (7.2%) |
| Total (Category) | 282 (96.3%) | 11 (3.7%) |
| Total (Overall) | 1,014 (53.4%) | 885 (46.6%) |
Production, Transportation and Moving Occupations
The most common Production, Transportation and Moving occupations in Sulphur are Material Moving (151 | 8.0%), Production (87 | 4.6%), and Transportation (78 | 4.1%).
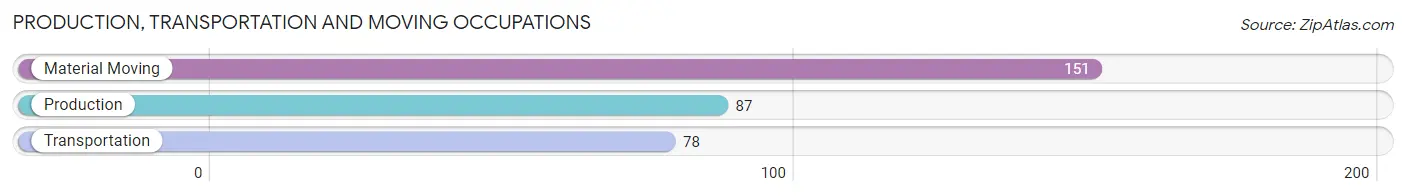
Production, Transportation and Moving Occupations by Sex
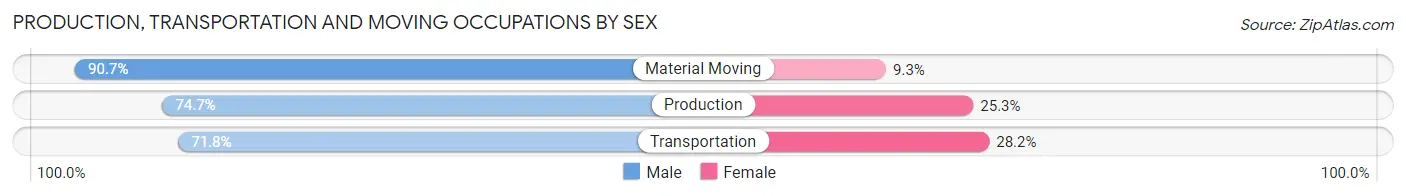
| Occupation | Male | Female |
| Production | 65 (74.7%) | 22 (25.3%) |
| Transportation | 56 (71.8%) | 22 (28.2%) |
| Material Moving | 137 (90.7%) | 14 (9.3%) |
| Total (Category) | 258 (81.7%) | 58 (18.3%) |
| Total (Overall) | 1,014 (53.4%) | 885 (46.6%) |
Employment Industries by Sex in Sulphur
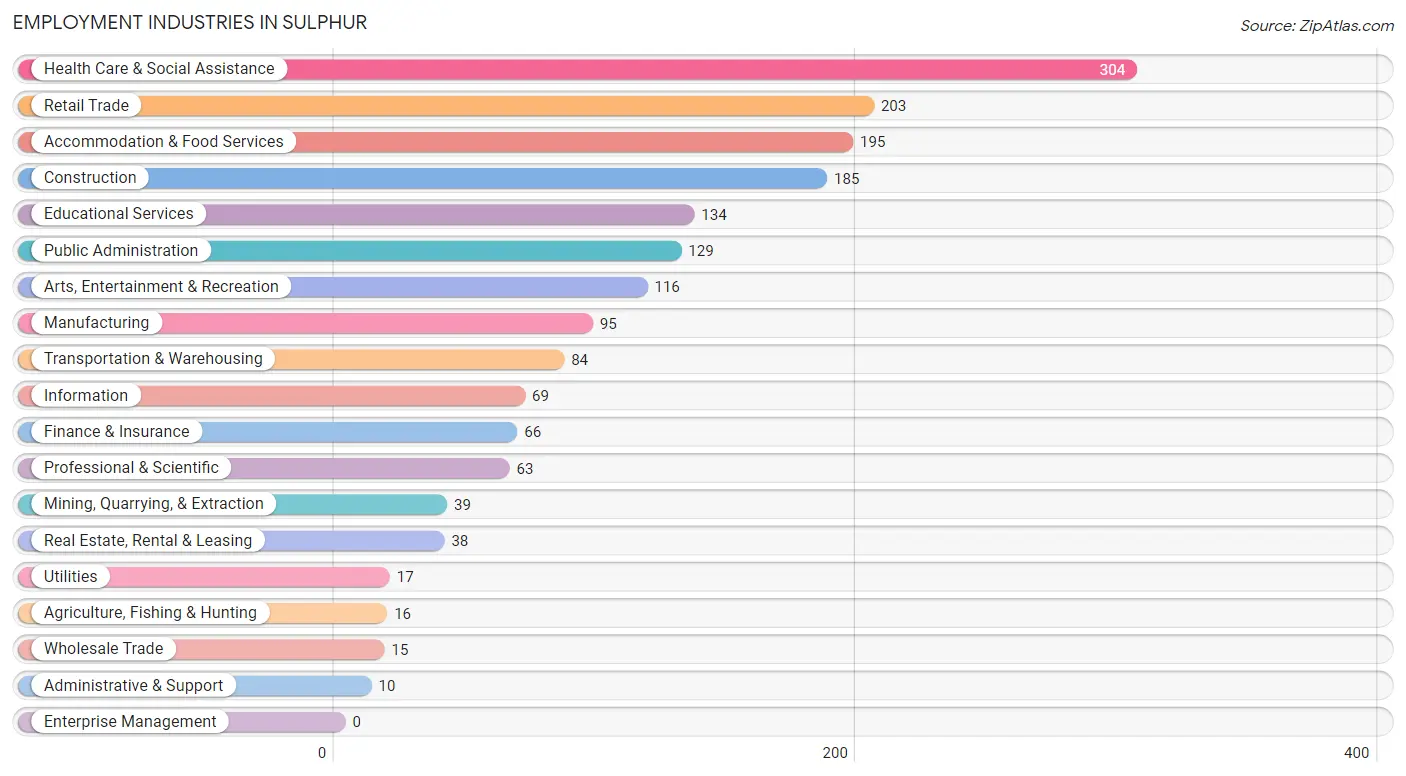
Employment Industries in Sulphur
The major employment industries in Sulphur include Health Care & Social Assistance (304 | 16.0%), Retail Trade (203 | 10.7%), Accommodation & Food Services (195 | 10.3%), Construction (185 | 9.7%), and Educational Services (134 | 7.1%).
Employment Industries by Sex in Sulphur
The Sulphur industries that see more men than women are Agriculture, Fishing & Hunting (100.0%), Mining, Quarrying, & Extraction (100.0%), and Construction (100.0%), whereas the industries that tend to have a higher number of women are Real Estate, Rental & Leasing (100.0%), Administrative & Support (100.0%), and Health Care & Social Assistance (74.0%).
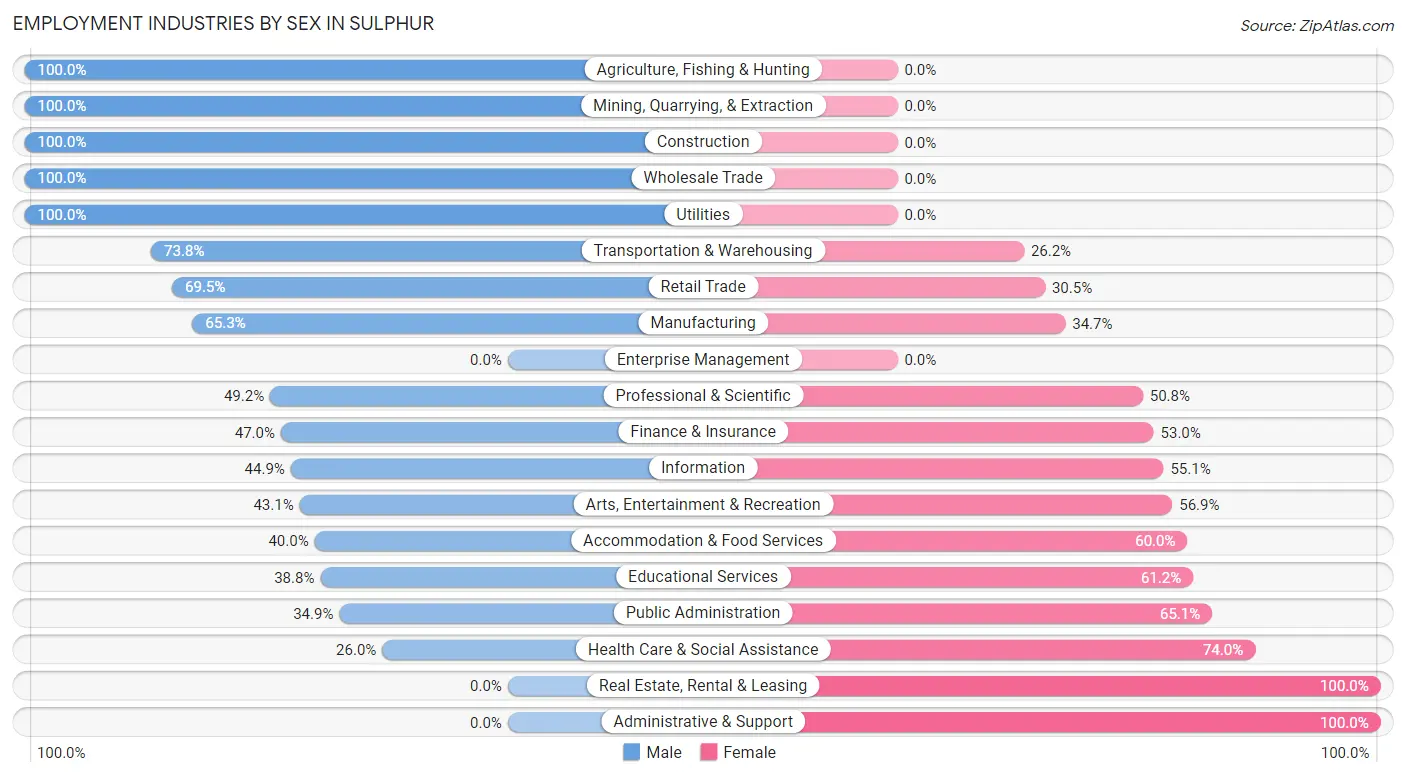
| Industry | Male | Female |
| Agriculture, Fishing & Hunting | 16 (100.0%) | 0 (0.0%) |
| Mining, Quarrying, & Extraction | 39 (100.0%) | 0 (0.0%) |
| Construction | 185 (100.0%) | 0 (0.0%) |
| Manufacturing | 62 (65.3%) | 33 (34.7%) |
| Wholesale Trade | 15 (100.0%) | 0 (0.0%) |
| Retail Trade | 141 (69.5%) | 62 (30.5%) |
| Transportation & Warehousing | 62 (73.8%) | 22 (26.2%) |
| Utilities | 17 (100.0%) | 0 (0.0%) |
| Information | 31 (44.9%) | 38 (55.1%) |
| Finance & Insurance | 31 (47.0%) | 35 (53.0%) |
| Real Estate, Rental & Leasing | 0 (0.0%) | 38 (100.0%) |
| Professional & Scientific | 31 (49.2%) | 32 (50.8%) |
| Enterprise Management | 0 (0.0%) | 0 (0.0%) |
| Administrative & Support | 0 (0.0%) | 10 (100.0%) |
| Educational Services | 52 (38.8%) | 82 (61.2%) |
| Health Care & Social Assistance | 79 (26.0%) | 225 (74.0%) |
| Arts, Entertainment & Recreation | 50 (43.1%) | 66 (56.9%) |
| Accommodation & Food Services | 78 (40.0%) | 117 (60.0%) |
| Public Administration | 45 (34.9%) | 84 (65.1%) |
| Total | 1,014 (53.4%) | 885 (46.6%) |
Education in Sulphur
School Enrollment in Sulphur
The most common levels of schooling among the 1,305 students in Sulphur are middle school (373 | 28.6%), elementary school (273 | 20.9%), and high school (233 | 17.8%).
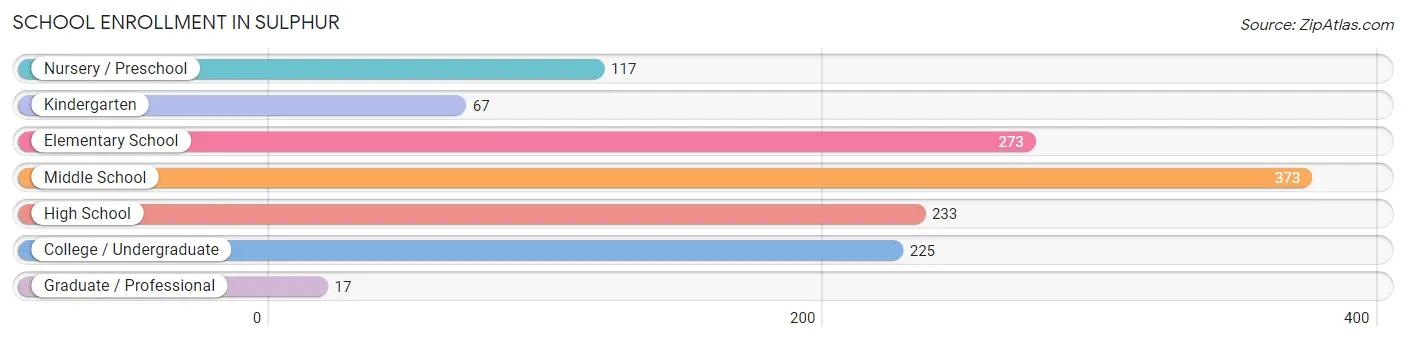
| School Level | # Students | % Students |
| Nursery / Preschool | 117 | 9.0% |
| Kindergarten | 67 | 5.1% |
| Elementary School | 273 | 20.9% |
| Middle School | 373 | 28.6% |
| High School | 233 | 17.8% |
| College / Undergraduate | 225 | 17.2% |
| Graduate / Professional | 17 | 1.3% |
| Total | 1,305 | 100.0% |
School Enrollment by Age by Funding Source in Sulphur
Out of a total of 1,305 students who are enrolled in schools in Sulphur, 144 (11.0%) attend a private institution, while the remaining 1,161 (89.0%) are enrolled in public schools. The age group of 35 years and over has the highest likelihood of being enrolled in private schools, with 45 (57.7% in the age bracket) enrolled. Conversely, the age group of 3 to 4 year olds has the lowest likelihood of being enrolled in a private school, with 60 (100.0% in the age bracket) attending a public institution.
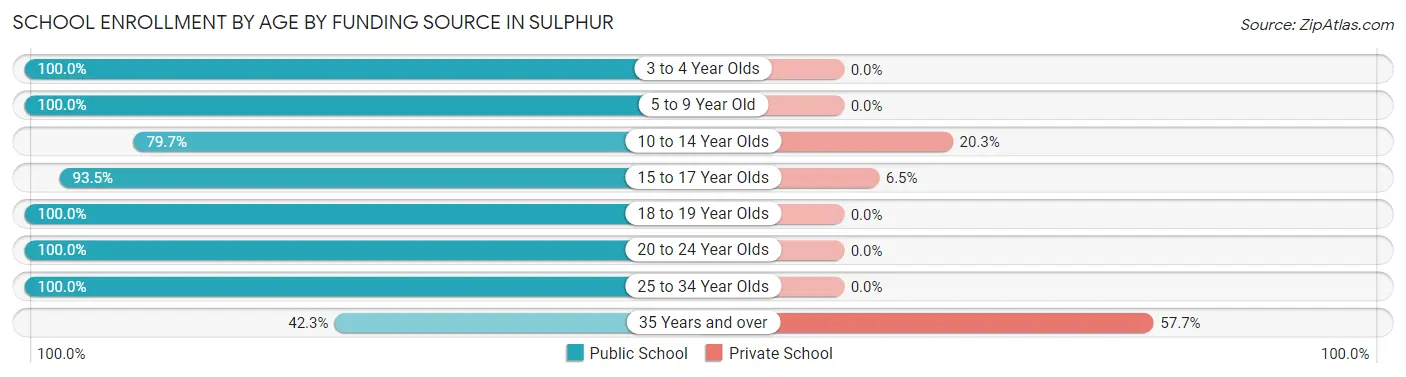
| Age Bracket | Public School | Private School |
| 3 to 4 Year Olds | 60 (100.0%) | 0 (0.0%) |
| 5 to 9 Year Old | 342 (100.0%) | 0 (0.0%) |
| 10 to 14 Year Olds | 330 (79.7%) | 84 (20.3%) |
| 15 to 17 Year Olds | 200 (93.5%) | 14 (6.5%) |
| 18 to 19 Year Olds | 86 (100.0%) | 0 (0.0%) |
| 20 to 24 Year Olds | 102 (100.0%) | 0 (0.0%) |
| 25 to 34 Year Olds | 9 (100.0%) | 0 (0.0%) |
| 35 Years and over | 33 (42.3%) | 45 (57.7%) |
| Total | 1,161 (89.0%) | 144 (11.0%) |
Educational Attainment by Field of Study in Sulphur
Education (223 | 37.5%), computers & mathematics (87 | 14.6%), business (74 | 12.4%), liberal arts & history (74 | 12.4%), and bio, nature & agricultural (53 | 8.9%) are the most common fields of study among 595 individuals in Sulphur who have obtained a bachelor's degree or higher.
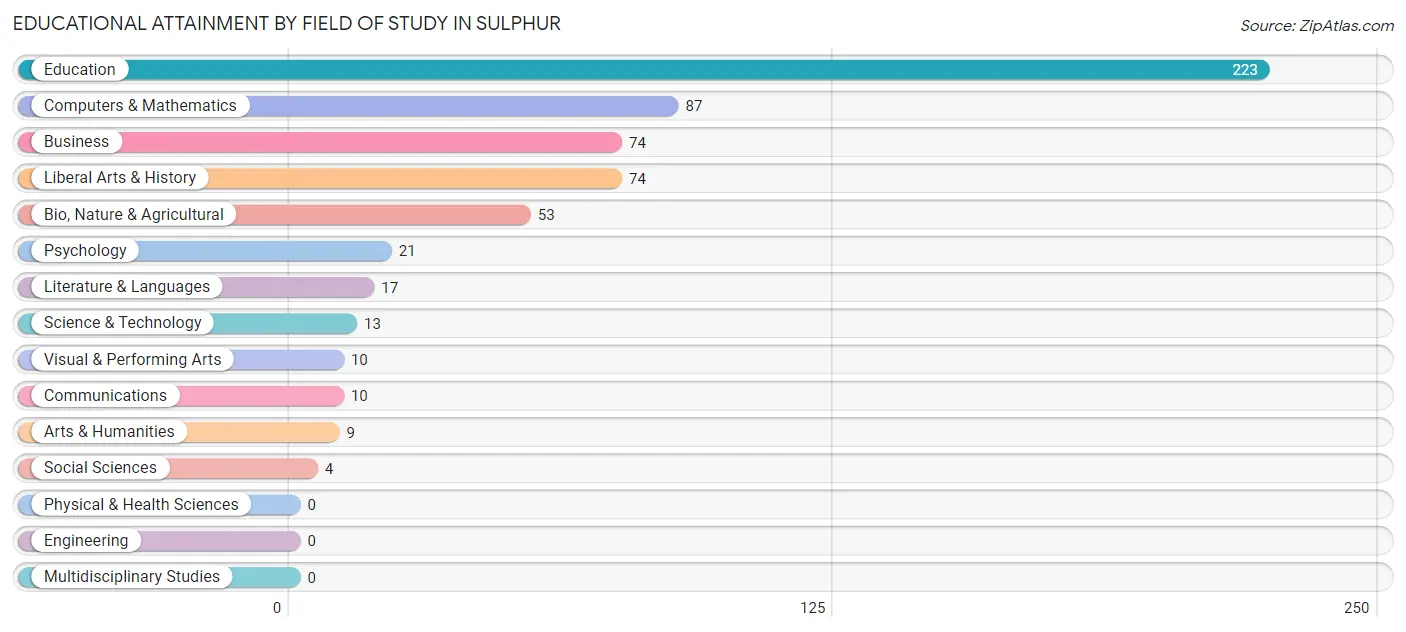
| Field of Study | # Graduates | % Graduates |
| Computers & Mathematics | 87 | 14.6% |
| Bio, Nature & Agricultural | 53 | 8.9% |
| Physical & Health Sciences | 0 | 0.0% |
| Psychology | 21 | 3.5% |
| Social Sciences | 4 | 0.7% |
| Engineering | 0 | 0.0% |
| Multidisciplinary Studies | 0 | 0.0% |
| Science & Technology | 13 | 2.2% |
| Business | 74 | 12.4% |
| Education | 223 | 37.5% |
| Literature & Languages | 17 | 2.9% |
| Liberal Arts & History | 74 | 12.4% |
| Visual & Performing Arts | 10 | 1.7% |
| Communications | 10 | 1.7% |
| Arts & Humanities | 9 | 1.5% |
| Total | 595 | 100.0% |
Transportation & Commute in Sulphur
Vehicle Availability by Sex in Sulphur
The most prevalent vehicle ownership categories in Sulphur are males with 2 vehicles (526, accounting for 51.9%) and females with 2 vehicles (421, making up 59.4%).
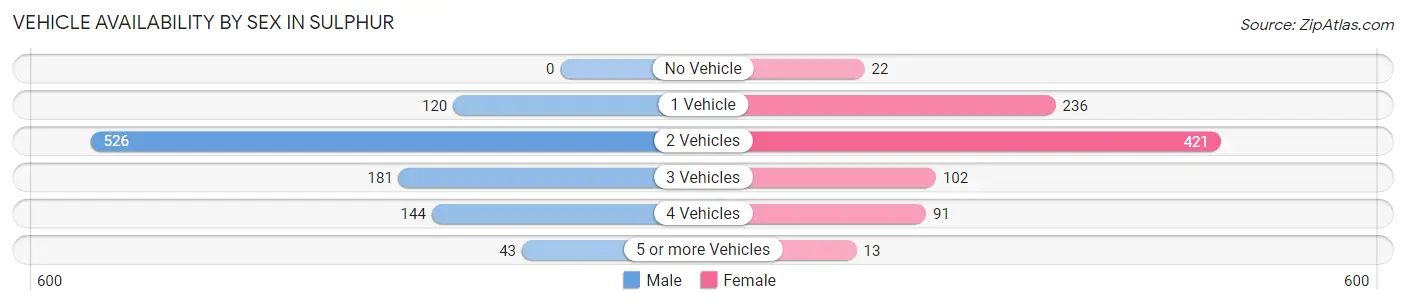
| Vehicles Available | Male | Female |
| No Vehicle | 0 (0.0%) | 22 (2.5%) |
| 1 Vehicle | 120 (11.8%) | 236 (26.7%) |
| 2 Vehicles | 526 (51.9%) | 421 (47.6%) |
| 3 Vehicles | 181 (17.8%) | 102 (11.5%) |
| 4 Vehicles | 144 (14.2%) | 91 (10.3%) |
| 5 or more Vehicles | 43 (4.2%) | 13 (1.5%) |
| Total | 1,014 (100.0%) | 885 (100.0%) |
Commute Time in Sulphur
The most frequently occuring commute durations in Sulphur are 15 to 19 minutes (393 commuters, 21.0%), 5 to 9 minutes (357 commuters, 19.1%), and less than 5 minutes (296 commuters, 15.8%).
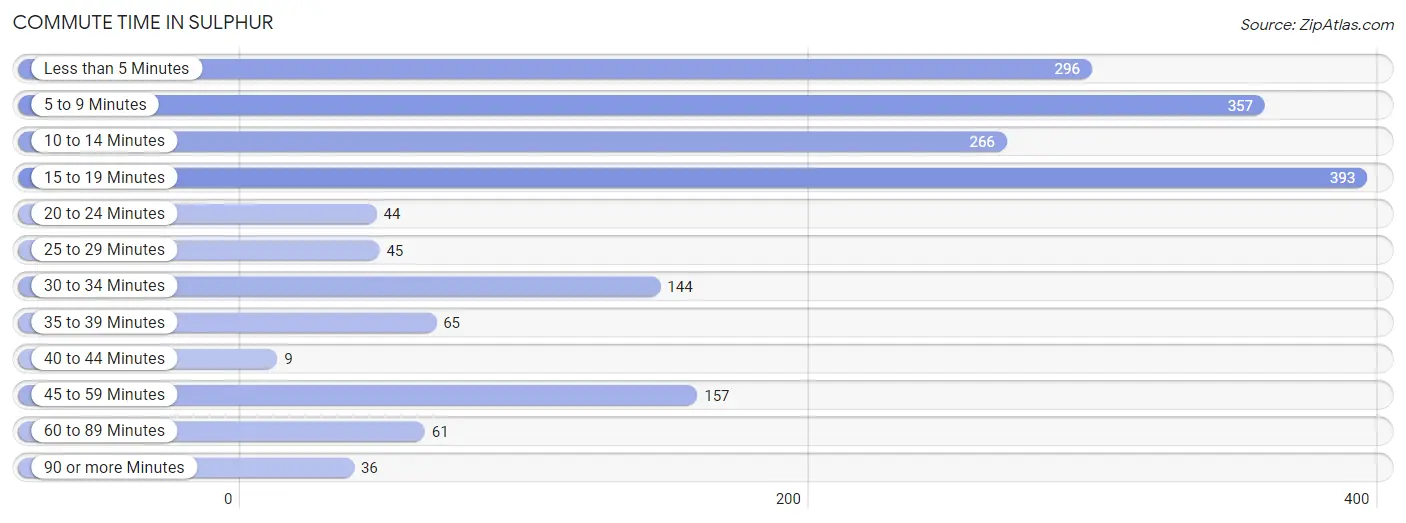
| Commute Time | # Commuters | % Commuters |
| Less than 5 Minutes | 296 | 15.8% |
| 5 to 9 Minutes | 357 | 19.1% |
| 10 to 14 Minutes | 266 | 14.2% |
| 15 to 19 Minutes | 393 | 21.0% |
| 20 to 24 Minutes | 44 | 2.4% |
| 25 to 29 Minutes | 45 | 2.4% |
| 30 to 34 Minutes | 144 | 7.7% |
| 35 to 39 Minutes | 65 | 3.5% |
| 40 to 44 Minutes | 9 | 0.5% |
| 45 to 59 Minutes | 157 | 8.4% |
| 60 to 89 Minutes | 61 | 3.3% |
| 90 or more Minutes | 36 | 1.9% |
Commute Time by Sex in Sulphur
The most common commute times in Sulphur are 5 to 9 minutes (209 commuters, 21.1%) for males and 15 to 19 minutes (195 commuters, 22.0%) for females.
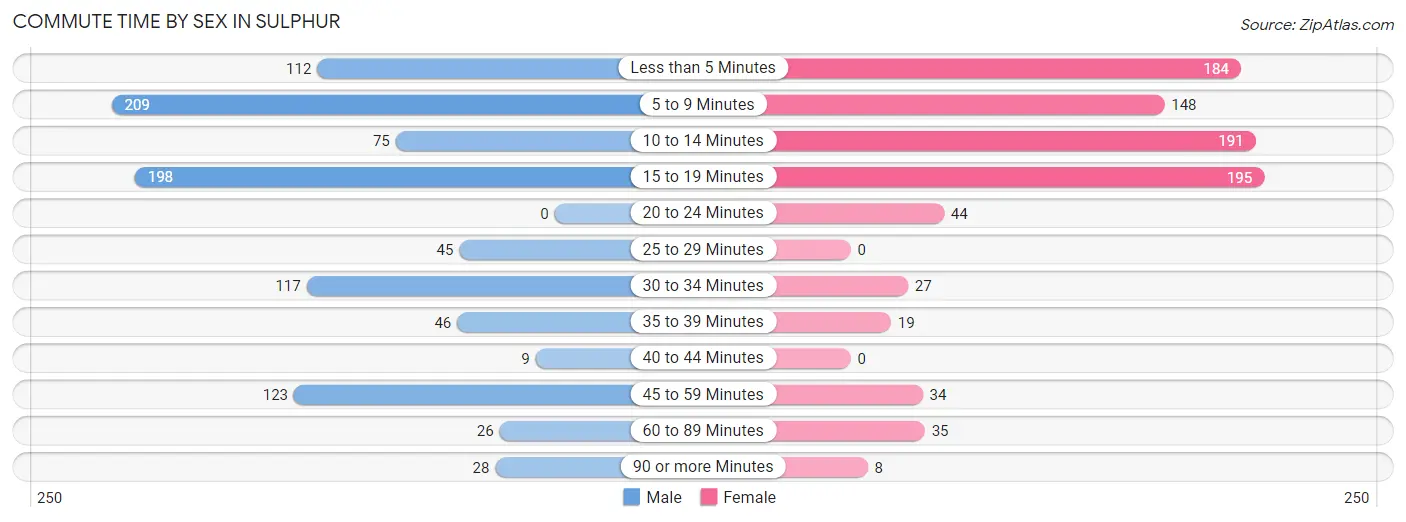
| Commute Time | Male | Female |
| Less than 5 Minutes | 112 (11.3%) | 184 (20.8%) |
| 5 to 9 Minutes | 209 (21.1%) | 148 (16.7%) |
| 10 to 14 Minutes | 75 (7.6%) | 191 (21.6%) |
| 15 to 19 Minutes | 198 (20.0%) | 195 (22.0%) |
| 20 to 24 Minutes | 0 (0.0%) | 44 (5.0%) |
| 25 to 29 Minutes | 45 (4.5%) | 0 (0.0%) |
| 30 to 34 Minutes | 117 (11.8%) | 27 (3.0%) |
| 35 to 39 Minutes | 46 (4.7%) | 19 (2.1%) |
| 40 to 44 Minutes | 9 (0.9%) | 0 (0.0%) |
| 45 to 59 Minutes | 123 (12.4%) | 34 (3.8%) |
| 60 to 89 Minutes | 26 (2.6%) | 35 (4.0%) |
| 90 or more Minutes | 28 (2.8%) | 8 (0.9%) |
Time of Departure to Work by Sex in Sulphur
The most frequent times of departure to work in Sulphur are 12:00 PM to 3:59 PM (186, 18.8%) for males and 7:30 AM to 7:59 AM (128, 14.5%) for females.
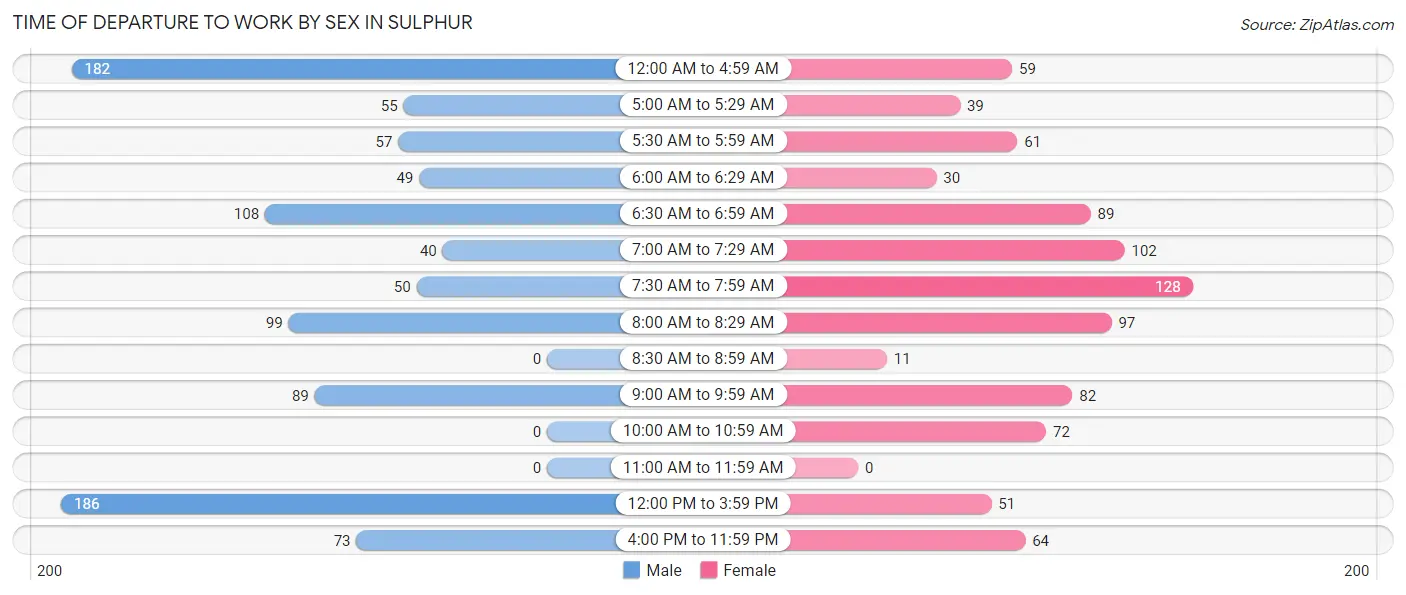
| Time of Departure | Male | Female |
| 12:00 AM to 4:59 AM | 182 (18.4%) | 59 (6.7%) |
| 5:00 AM to 5:29 AM | 55 (5.6%) | 39 (4.4%) |
| 5:30 AM to 5:59 AM | 57 (5.8%) | 61 (6.9%) |
| 6:00 AM to 6:29 AM | 49 (5.0%) | 30 (3.4%) |
| 6:30 AM to 6:59 AM | 108 (10.9%) | 89 (10.1%) |
| 7:00 AM to 7:29 AM | 40 (4.1%) | 102 (11.5%) |
| 7:30 AM to 7:59 AM | 50 (5.1%) | 128 (14.5%) |
| 8:00 AM to 8:29 AM | 99 (10.0%) | 97 (11.0%) |
| 8:30 AM to 8:59 AM | 0 (0.0%) | 11 (1.2%) |
| 9:00 AM to 9:59 AM | 89 (9.0%) | 82 (9.3%) |
| 10:00 AM to 10:59 AM | 0 (0.0%) | 72 (8.1%) |
| 11:00 AM to 11:59 AM | 0 (0.0%) | 0 (0.0%) |
| 12:00 PM to 3:59 PM | 186 (18.8%) | 51 (5.8%) |
| 4:00 PM to 11:59 PM | 73 (7.4%) | 64 (7.2%) |
| Total | 988 (100.0%) | 885 (100.0%) |
Housing Occupancy in Sulphur
Occupancy by Ownership in Sulphur
Of the total 1,757 dwellings in Sulphur, owner-occupied units account for 1,149 (65.4%), while renter-occupied units make up 608 (34.6%).
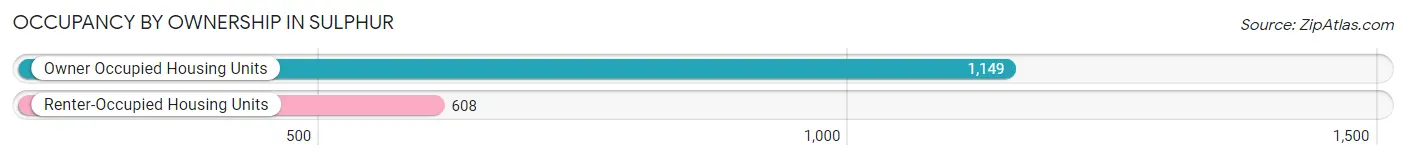
| Occupancy | # Housing Units | % Housing Units |
| Owner Occupied Housing Units | 1,149 | 65.4% |
| Renter-Occupied Housing Units | 608 | 34.6% |
| Total Occupied Housing Units | 1,757 | 100.0% |
Occupancy by Household Size in Sulphur
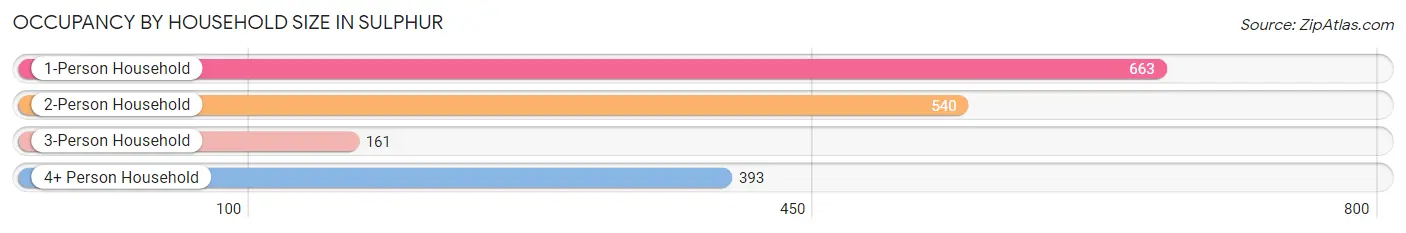
| Household Size | # Housing Units | % Housing Units |
| 1-Person Household | 663 | 37.7% |
| 2-Person Household | 540 | 30.7% |
| 3-Person Household | 161 | 9.2% |
| 4+ Person Household | 393 | 22.4% |
| Total Housing Units | 1,757 | 100.0% |
Occupancy by Ownership by Household Size in Sulphur
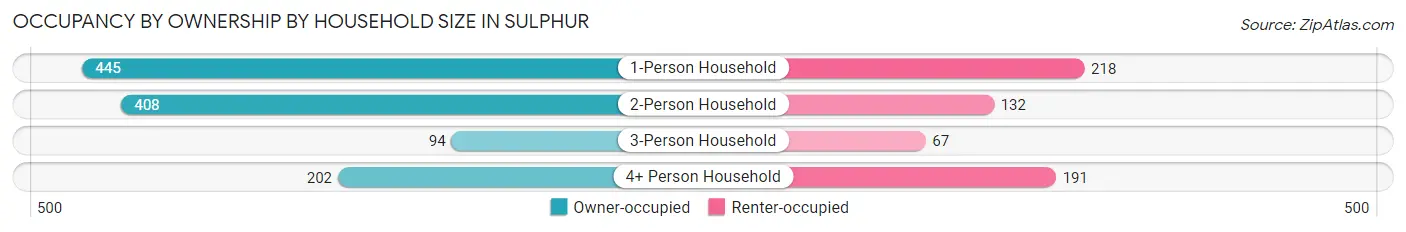
| Household Size | Owner-occupied | Renter-occupied |
| 1-Person Household | 445 (67.1%) | 218 (32.9%) |
| 2-Person Household | 408 (75.6%) | 132 (24.4%) |
| 3-Person Household | 94 (58.4%) | 67 (41.6%) |
| 4+ Person Household | 202 (51.4%) | 191 (48.6%) |
| Total Housing Units | 1,149 (65.4%) | 608 (34.6%) |
Occupancy by Educational Attainment in Sulphur
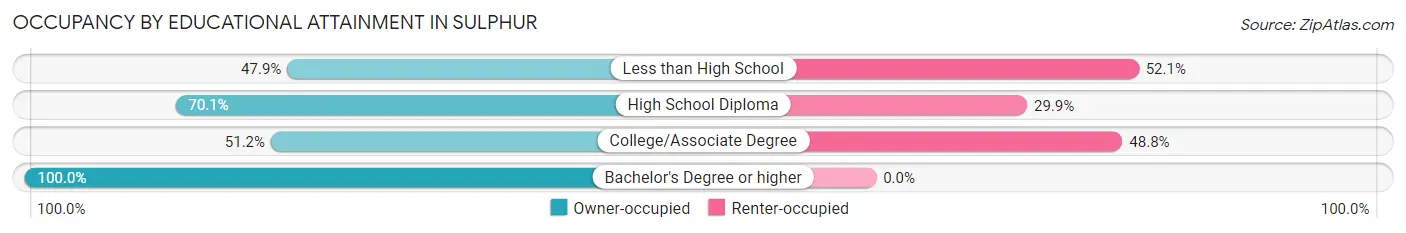
| Household Size | Owner-occupied | Renter-occupied |
| Less than High School | 128 (47.9%) | 139 (52.1%) |
| High School Diploma | 375 (70.1%) | 160 (29.9%) |
| College/Associate Degree | 324 (51.2%) | 309 (48.8%) |
| Bachelor's Degree or higher | 322 (100.0%) | 0 (0.0%) |
Occupancy by Age of Householder in Sulphur
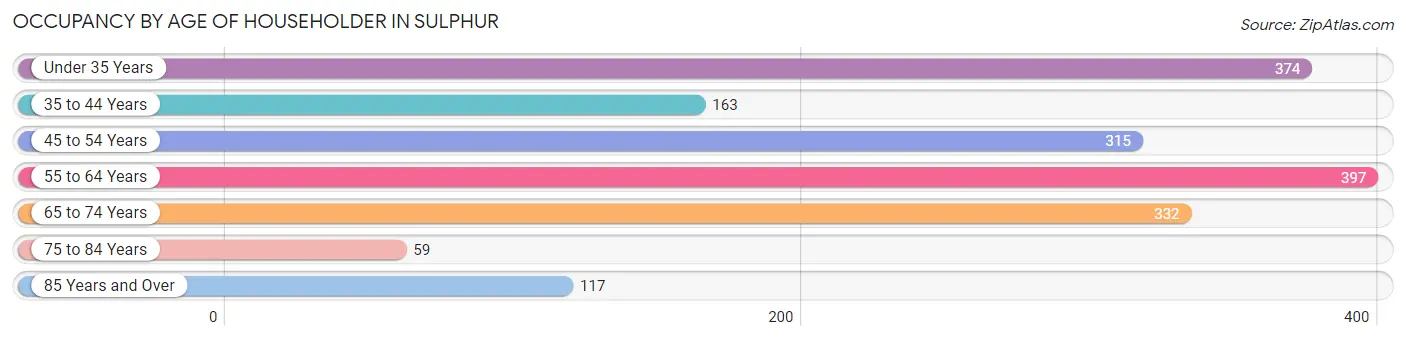
| Age Bracket | # Households | % Households |
| Under 35 Years | 374 | 21.3% |
| 35 to 44 Years | 163 | 9.3% |
| 45 to 54 Years | 315 | 17.9% |
| 55 to 64 Years | 397 | 22.6% |
| 65 to 74 Years | 332 | 18.9% |
| 75 to 84 Years | 59 | 3.4% |
| 85 Years and Over | 117 | 6.7% |
| Total | 1,757 | 100.0% |
Housing Finances in Sulphur
Median Income by Occupancy in Sulphur
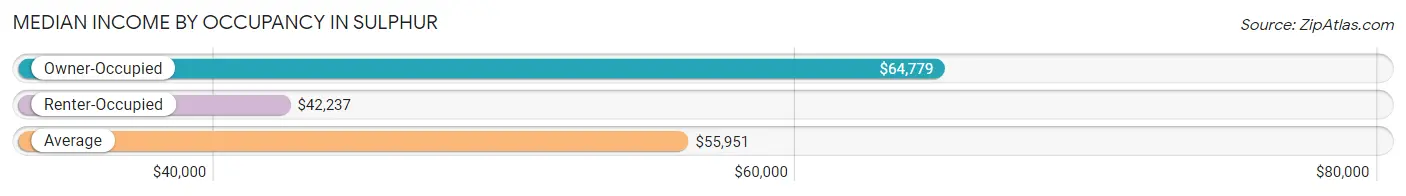
| Occupancy Type | # Households | Median Income |
| Owner-Occupied | 1,149 (65.4%) | $64,779 |
| Renter-Occupied | 608 (34.6%) | $42,237 |
| Average | 1,757 (100.0%) | $55,951 |
Occupancy by Householder Income Bracket in Sulphur
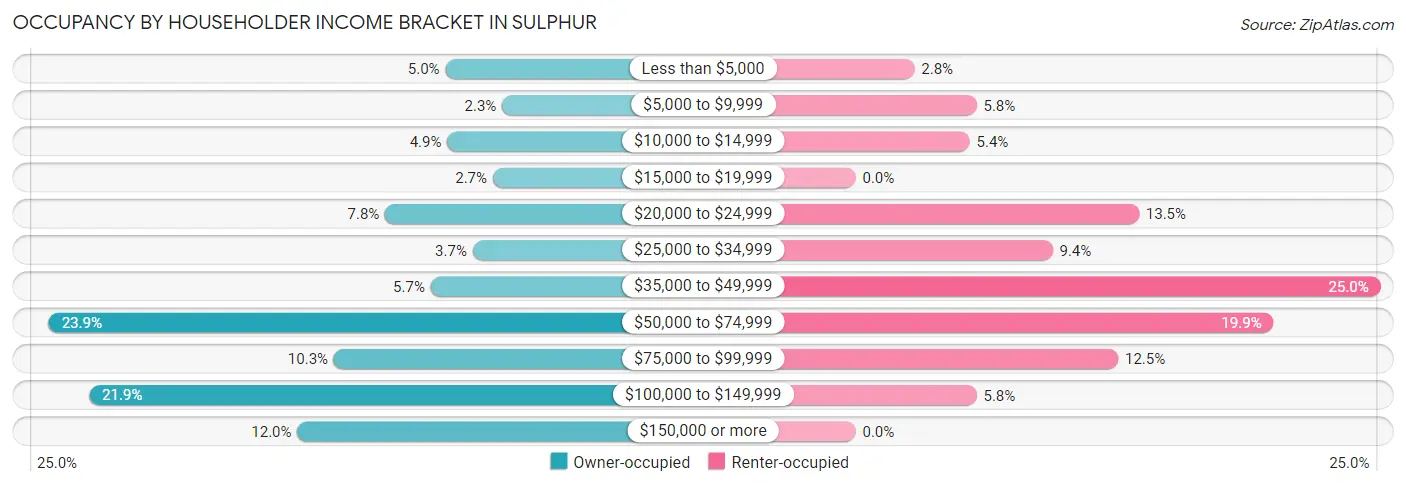
| Income Bracket | Owner-occupied | Renter-occupied |
| Less than $5,000 | 57 (5.0%) | 17 (2.8%) |
| $5,000 to $9,999 | 26 (2.3%) | 35 (5.8%) |
| $10,000 to $14,999 | 56 (4.9%) | 33 (5.4%) |
| $15,000 to $19,999 | 31 (2.7%) | 0 (0.0%) |
| $20,000 to $24,999 | 90 (7.8%) | 82 (13.5%) |
| $25,000 to $34,999 | 42 (3.7%) | 57 (9.4%) |
| $35,000 to $49,999 | 65 (5.7%) | 152 (25.0%) |
| $50,000 to $74,999 | 274 (23.8%) | 121 (19.9%) |
| $75,000 to $99,999 | 118 (10.3%) | 76 (12.5%) |
| $100,000 to $149,999 | 252 (21.9%) | 35 (5.8%) |
| $150,000 or more | 138 (12.0%) | 0 (0.0%) |
| Total | 1,149 (100.0%) | 608 (100.0%) |
Monthly Housing Cost Tiers in Sulphur
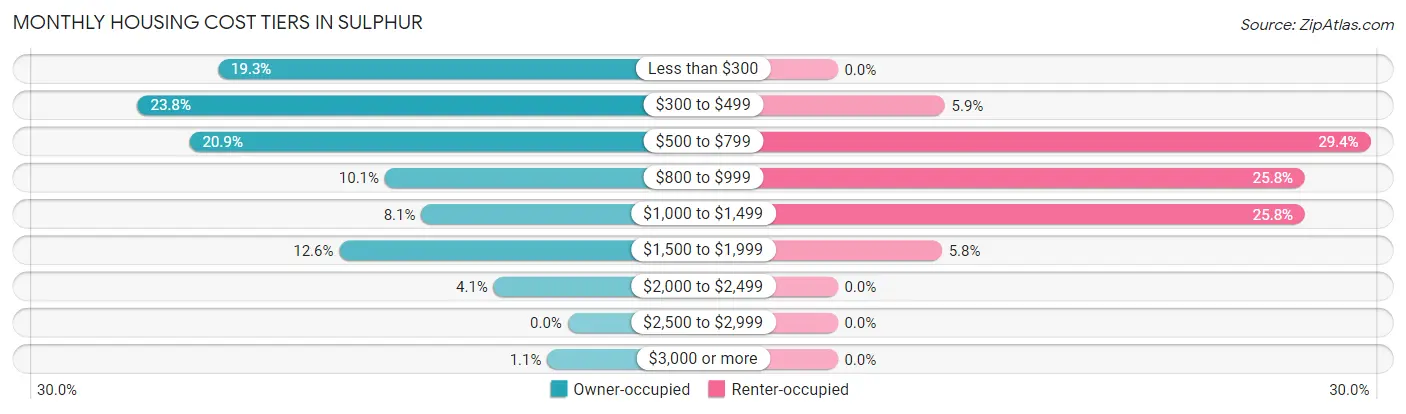
| Monthly Cost | Owner-occupied | Renter-occupied |
| Less than $300 | 222 (19.3%) | 0 (0.0%) |
| $300 to $499 | 273 (23.8%) | 36 (5.9%) |
| $500 to $799 | 240 (20.9%) | 179 (29.4%) |
| $800 to $999 | 116 (10.1%) | 157 (25.8%) |
| $1,000 to $1,499 | 93 (8.1%) | 157 (25.8%) |
| $1,500 to $1,999 | 145 (12.6%) | 35 (5.8%) |
| $2,000 to $2,499 | 47 (4.1%) | 0 (0.0%) |
| $2,500 to $2,999 | 0 (0.0%) | 0 (0.0%) |
| $3,000 or more | 13 (1.1%) | 0 (0.0%) |
| Total | 1,149 (100.0%) | 608 (100.0%) |
Physical Housing Characteristics in Sulphur
Housing Structures in Sulphur
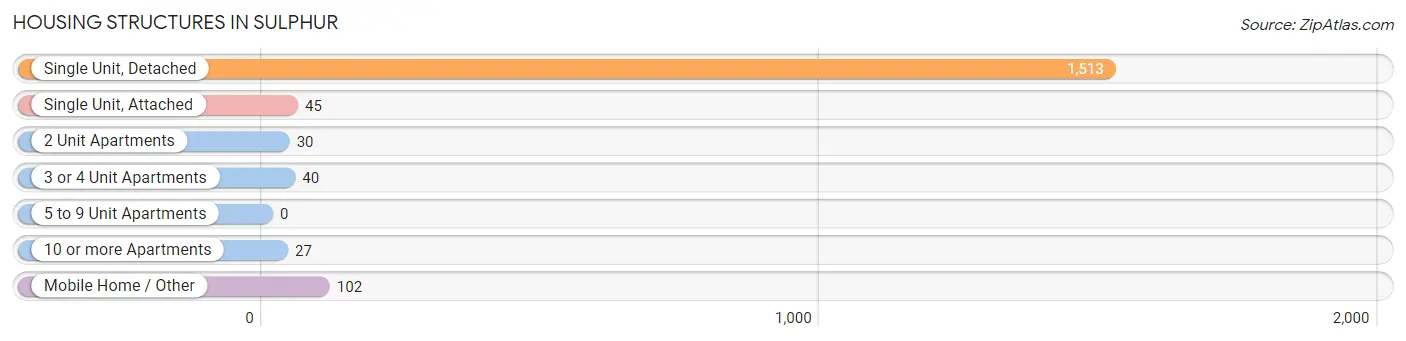
| Structure Type | # Housing Units | % Housing Units |
| Single Unit, Detached | 1,513 | 86.1% |
| Single Unit, Attached | 45 | 2.6% |
| 2 Unit Apartments | 30 | 1.7% |
| 3 or 4 Unit Apartments | 40 | 2.3% |
| 5 to 9 Unit Apartments | 0 | 0.0% |
| 10 or more Apartments | 27 | 1.5% |
| Mobile Home / Other | 102 | 5.8% |
| Total | 1,757 | 100.0% |
Housing Structures by Occupancy in Sulphur
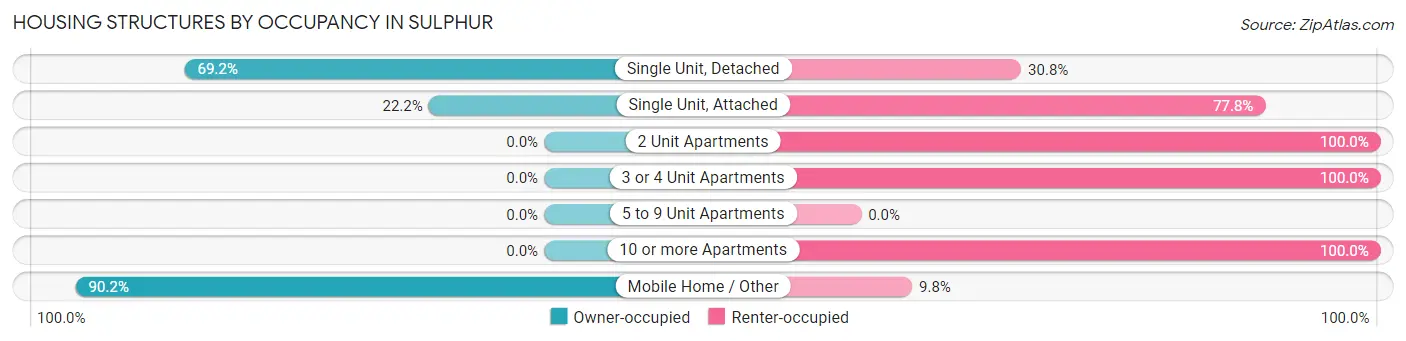
| Structure Type | Owner-occupied | Renter-occupied |
| Single Unit, Detached | 1,047 (69.2%) | 466 (30.8%) |
| Single Unit, Attached | 10 (22.2%) | 35 (77.8%) |
| 2 Unit Apartments | 0 (0.0%) | 30 (100.0%) |
| 3 or 4 Unit Apartments | 0 (0.0%) | 40 (100.0%) |
| 5 to 9 Unit Apartments | 0 (0.0%) | 0 (0.0%) |
| 10 or more Apartments | 0 (0.0%) | 27 (100.0%) |
| Mobile Home / Other | 92 (90.2%) | 10 (9.8%) |
| Total | 1,149 (65.4%) | 608 (34.6%) |
Housing Structures by Number of Rooms in Sulphur
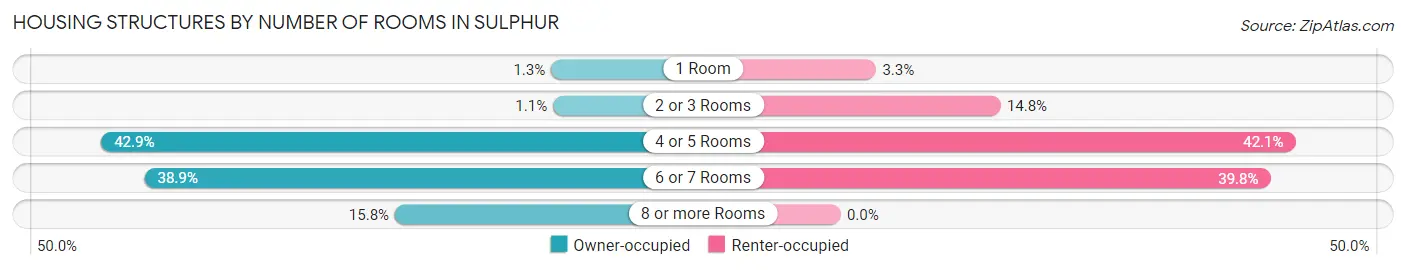
| Number of Rooms | Owner-occupied | Renter-occupied |
| 1 Room | 15 (1.3%) | 20 (3.3%) |
| 2 or 3 Rooms | 13 (1.1%) | 90 (14.8%) |
| 4 or 5 Rooms | 493 (42.9%) | 256 (42.1%) |
| 6 or 7 Rooms | 447 (38.9%) | 242 (39.8%) |
| 8 or more Rooms | 181 (15.8%) | 0 (0.0%) |
| Total | 1,149 (100.0%) | 608 (100.0%) |
Housing Structure by Heating Type in Sulphur
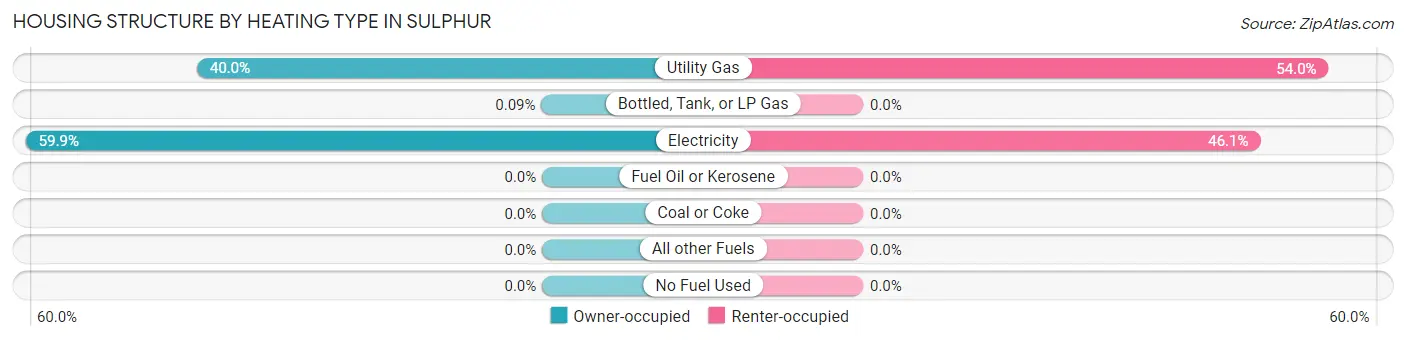
| Heating Type | Owner-occupied | Renter-occupied |
| Utility Gas | 460 (40.0%) | 328 (53.9%) |
| Bottled, Tank, or LP Gas | 1 (0.1%) | 0 (0.0%) |
| Electricity | 688 (59.9%) | 280 (46.1%) |
| Fuel Oil or Kerosene | 0 (0.0%) | 0 (0.0%) |
| Coal or Coke | 0 (0.0%) | 0 (0.0%) |
| All other Fuels | 0 (0.0%) | 0 (0.0%) |
| No Fuel Used | 0 (0.0%) | 0 (0.0%) |
| Total | 1,149 (100.0%) | 608 (100.0%) |
Household Vehicle Usage in Sulphur
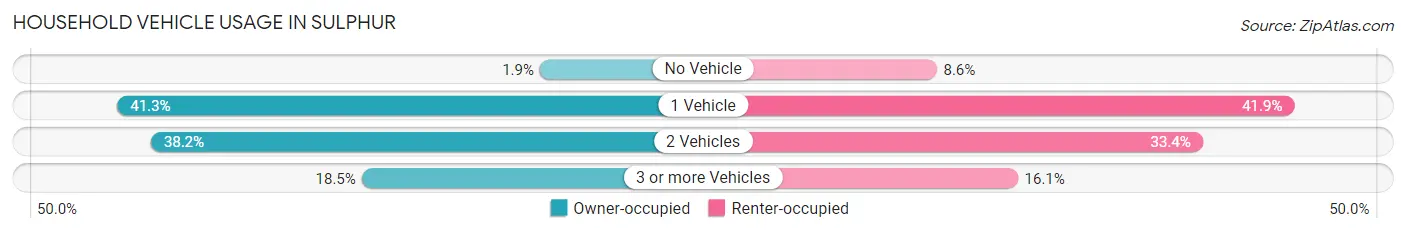
| Vehicles per Household | Owner-occupied | Renter-occupied |
| No Vehicle | 22 (1.9%) | 52 (8.6%) |
| 1 Vehicle | 475 (41.3%) | 255 (41.9%) |
| 2 Vehicles | 439 (38.2%) | 203 (33.4%) |
| 3 or more Vehicles | 213 (18.5%) | 98 (16.1%) |
| Total | 1,149 (100.0%) | 608 (100.0%) |
Real Estate & Mortgages in Sulphur
Real Estate and Mortgage Overview in Sulphur
| Characteristic | Without Mortgage | With Mortgage |
| Housing Units | 597 | 552 |
| Median Property Value | $94,100 | $184,000 |
| Median Household Income | $56,521 | $55 |
| Monthly Housing Costs | $326 | $13 |
| Real Estate Taxes | $270 | $17 |
Property Value by Mortgage Status in Sulphur
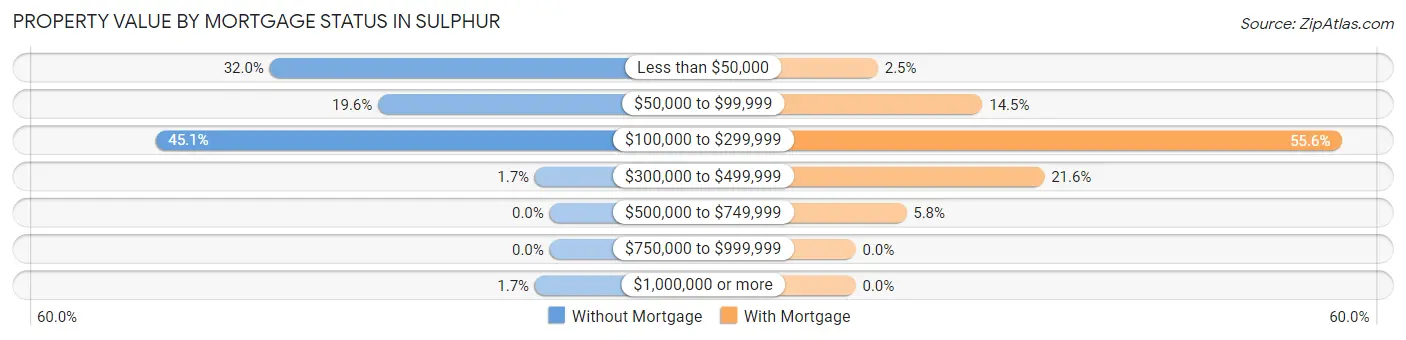
| Property Value | Without Mortgage | With Mortgage |
| Less than $50,000 | 191 (32.0%) | 14 (2.5%) |
| $50,000 to $99,999 | 117 (19.6%) | 80 (14.5%) |
| $100,000 to $299,999 | 269 (45.1%) | 307 (55.6%) |
| $300,000 to $499,999 | 10 (1.7%) | 119 (21.6%) |
| $500,000 to $749,999 | 0 (0.0%) | 32 (5.8%) |
| $750,000 to $999,999 | 0 (0.0%) | 0 (0.0%) |
| $1,000,000 or more | 10 (1.7%) | 0 (0.0%) |
| Total | 597 (100.0%) | 552 (100.0%) |
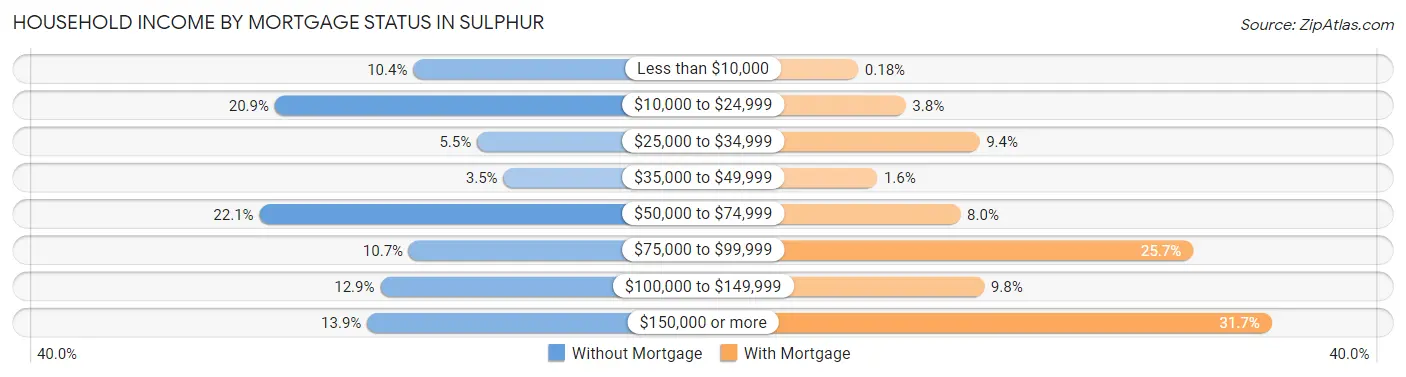
Household Income by Mortgage Status in Sulphur
| Household Income | Without Mortgage | With Mortgage |
| Less than $10,000 | 62 (10.4%) | 1 (0.2%) |
| $10,000 to $24,999 | 125 (20.9%) | 21 (3.8%) |
| $25,000 to $34,999 | 33 (5.5%) | 52 (9.4%) |
| $35,000 to $49,999 | 21 (3.5%) | 9 (1.6%) |
| $50,000 to $74,999 | 132 (22.1%) | 44 (8.0%) |
| $75,000 to $99,999 | 64 (10.7%) | 142 (25.7%) |
| $100,000 to $149,999 | 77 (12.9%) | 54 (9.8%) |
| $150,000 or more | 83 (13.9%) | 175 (31.7%) |
| Total | 597 (100.0%) | 552 (100.0%) |
Property Value to Household Income Ratio in Sulphur
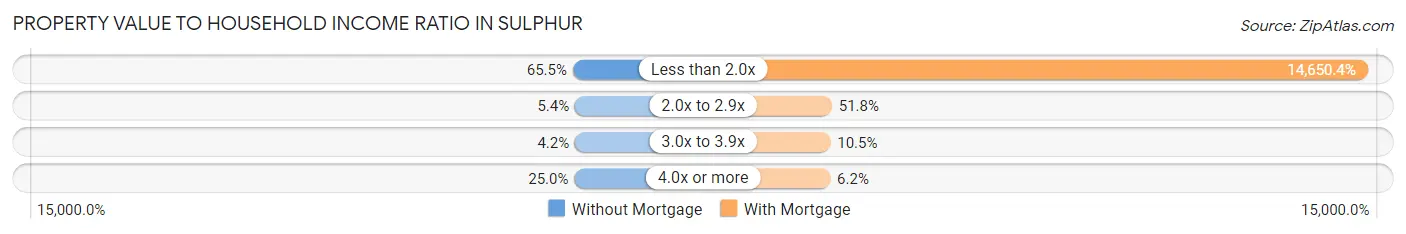
| Value-to-Income Ratio | Without Mortgage | With Mortgage |
| Less than 2.0x | 391 (65.5%) | 80,870 (14,650.4%) |
| 2.0x to 2.9x | 32 (5.4%) | 286 (51.8%) |
| 3.0x to 3.9x | 25 (4.2%) | 58 (10.5%) |
| 4.0x or more | 149 (25.0%) | 34 (6.2%) |
| Total | 597 (100.0%) | 552 (100.0%) |
Real Estate Taxes by Mortgage Status in Sulphur
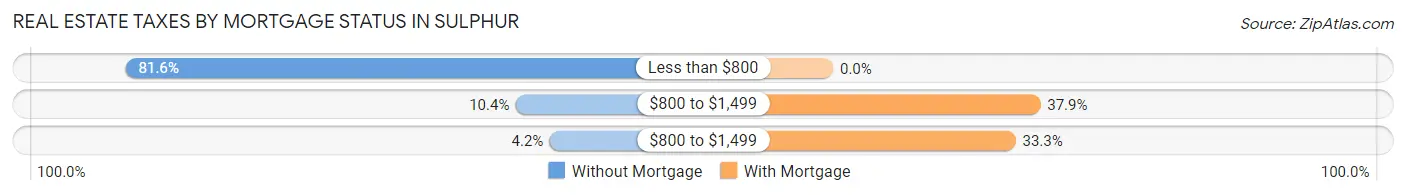
| Property Taxes | Without Mortgage | With Mortgage |
| Less than $800 | 487 (81.6%) | 0 (0.0%) |
| $800 to $1,499 | 62 (10.4%) | 209 (37.9%) |
| $800 to $1,499 | 25 (4.2%) | 184 (33.3%) |
| Total | 597 (100.0%) | 552 (100.0%) |
Health & Disability in Sulphur
Health Insurance Coverage by Age in Sulphur
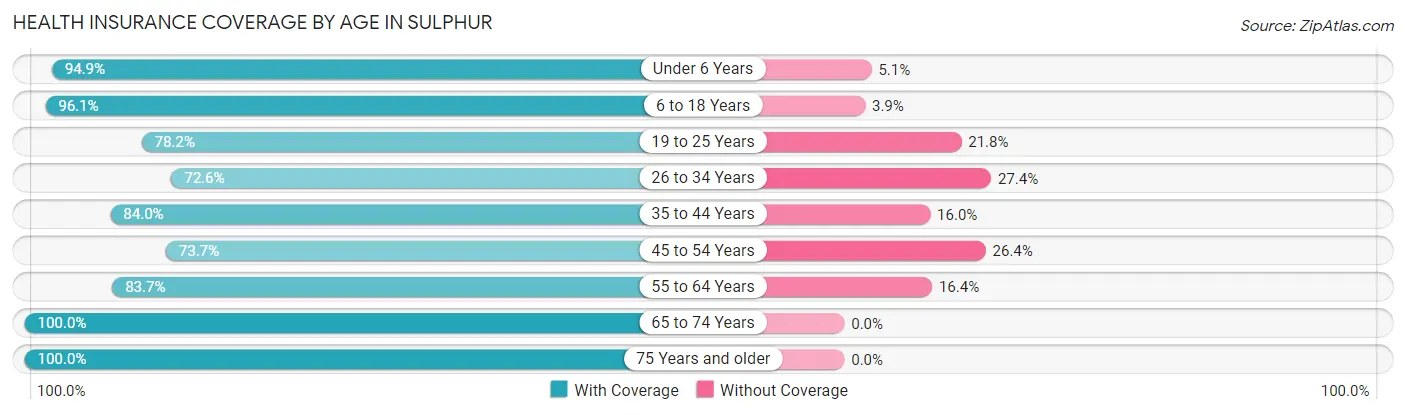
| Age Bracket | With Coverage | Without Coverage |
| Under 6 Years | 412 (94.9%) | 22 (5.1%) |
| 6 to 18 Years | 945 (96.1%) | 38 (3.9%) |
| 19 to 25 Years | 301 (78.2%) | 84 (21.8%) |
| 26 to 34 Years | 276 (72.6%) | 104 (27.4%) |
| 35 to 44 Years | 404 (84.0%) | 77 (16.0%) |
| 45 to 54 Years | 408 (73.7%) | 146 (26.4%) |
| 55 to 64 Years | 527 (83.7%) | 103 (16.4%) |
| 65 to 74 Years | 462 (100.0%) | 0 (0.0%) |
| 75 Years and older | 300 (100.0%) | 0 (0.0%) |
| Total | 4,035 (87.5%) | 574 (12.4%) |
Health Insurance Coverage by Citizenship Status in Sulphur
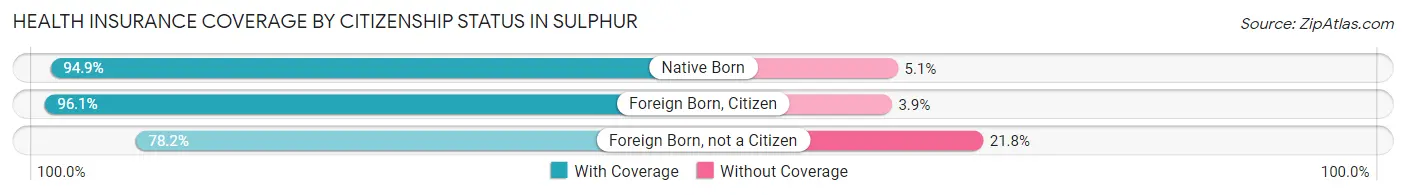
| Citizenship Status | With Coverage | Without Coverage |
| Native Born | 412 (94.9%) | 22 (5.1%) |
| Foreign Born, Citizen | 945 (96.1%) | 38 (3.9%) |
| Foreign Born, not a Citizen | 301 (78.2%) | 84 (21.8%) |
Health Insurance Coverage by Household Income in Sulphur
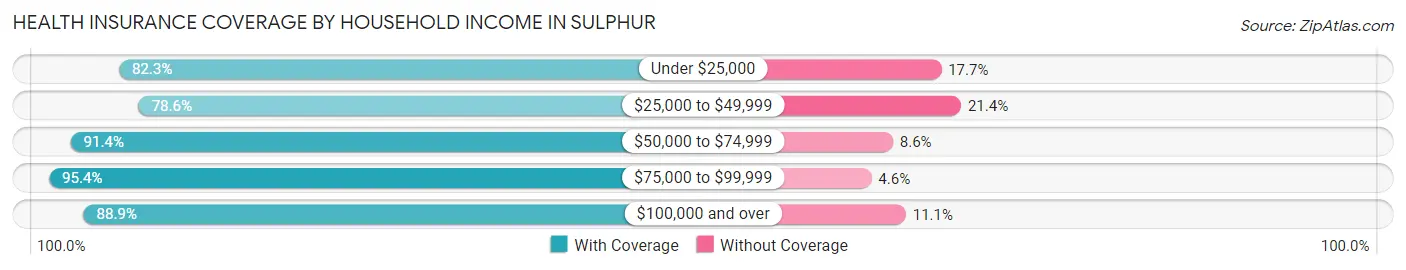
| Household Income | With Coverage | Without Coverage |
| Under $25,000 | 707 (82.3%) | 152 (17.7%) |
| $25,000 to $49,999 | 555 (78.6%) | 151 (21.4%) |
| $50,000 to $74,999 | 1,048 (91.4%) | 99 (8.6%) |
| $75,000 to $99,999 | 559 (95.4%) | 27 (4.6%) |
| $100,000 and over | 1,166 (88.9%) | 145 (11.1%) |
Public vs Private Health Insurance Coverage by Age in Sulphur
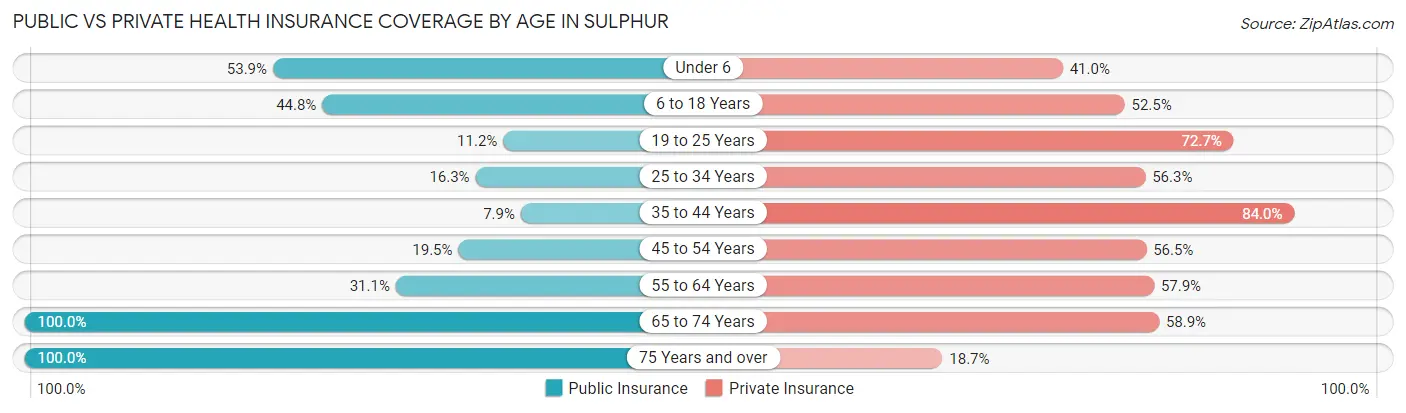
| Age Bracket | Public Insurance | Private Insurance |
| Under 6 | 234 (53.9%) | 178 (41.0%) |
| 6 to 18 Years | 440 (44.8%) | 516 (52.5%) |
| 19 to 25 Years | 43 (11.2%) | 280 (72.7%) |
| 25 to 34 Years | 62 (16.3%) | 214 (56.3%) |
| 35 to 44 Years | 38 (7.9%) | 404 (84.0%) |
| 45 to 54 Years | 108 (19.5%) | 313 (56.5%) |
| 55 to 64 Years | 196 (31.1%) | 365 (57.9%) |
| 65 to 74 Years | 462 (100.0%) | 272 (58.9%) |
| 75 Years and over | 300 (100.0%) | 56 (18.7%) |
| Total | 1,883 (40.8%) | 2,598 (56.4%) |
Disability Status by Sex by Age in Sulphur
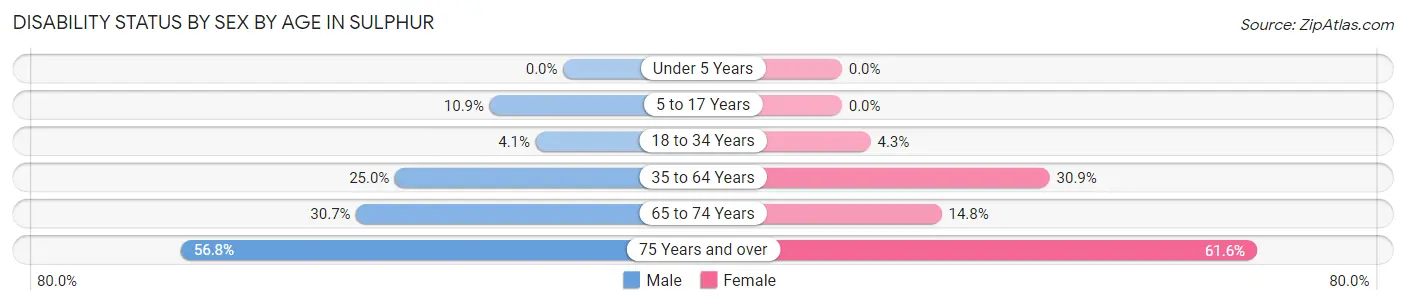
| Age Bracket | Male | Female |
| Under 5 Years | 0 (0.0%) | 0 (0.0%) |
| 5 to 17 Years | 66 (10.9%) | 0 (0.0%) |
| 18 to 34 Years | 16 (4.1%) | 18 (4.3%) |
| 35 to 64 Years | 190 (25.0%) | 279 (30.9%) |
| 65 to 74 Years | 59 (30.7%) | 40 (14.8%) |
| 75 Years and over | 46 (56.8%) | 135 (61.6%) |
Disability Class by Sex by Age in Sulphur
Disability Class: Hearing Difficulty
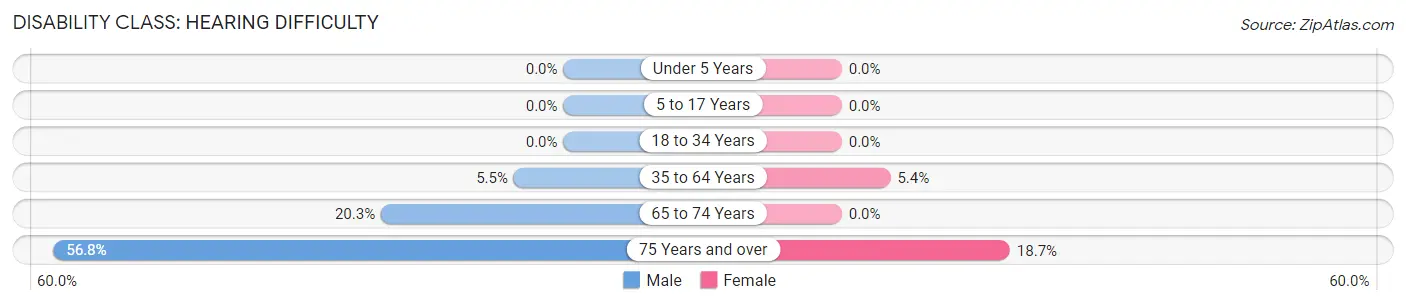
| Age Bracket | Male | Female |
| Under 5 Years | 0 (0.0%) | 0 (0.0%) |
| 5 to 17 Years | 0 (0.0%) | 0 (0.0%) |
| 18 to 34 Years | 0 (0.0%) | 0 (0.0%) |
| 35 to 64 Years | 42 (5.5%) | 49 (5.4%) |
| 65 to 74 Years | 39 (20.3%) | 0 (0.0%) |
| 75 Years and over | 46 (56.8%) | 41 (18.7%) |
Disability Class: Vision Difficulty
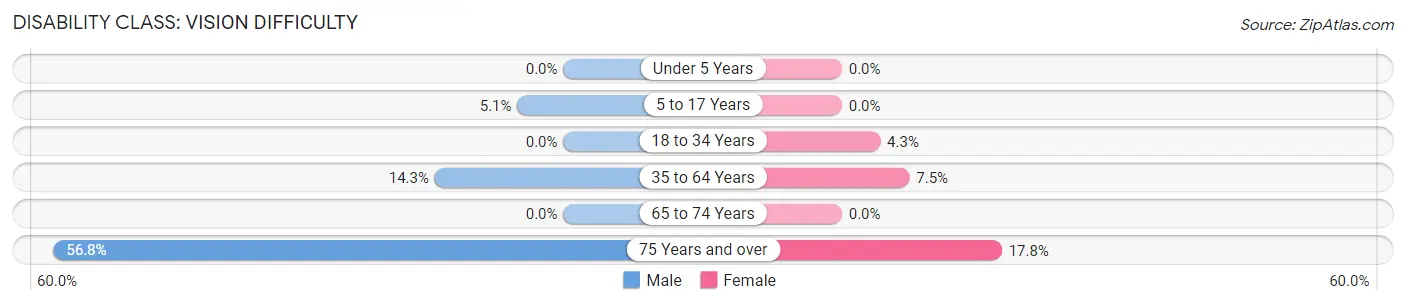
| Age Bracket | Male | Female |
| Under 5 Years | 0 (0.0%) | 0 (0.0%) |
| 5 to 17 Years | 31 (5.1%) | 0 (0.0%) |
| 18 to 34 Years | 0 (0.0%) | 18 (4.3%) |
| 35 to 64 Years | 109 (14.3%) | 68 (7.5%) |
| 65 to 74 Years | 0 (0.0%) | 0 (0.0%) |
| 75 Years and over | 46 (56.8%) | 39 (17.8%) |
Disability Class: Cognitive Difficulty
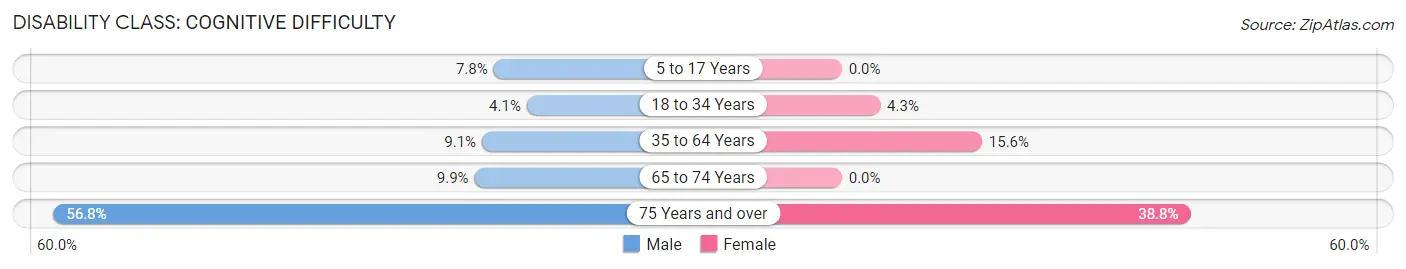
| Age Bracket | Male | Female |
| 5 to 17 Years | 47 (7.8%) | 0 (0.0%) |
| 18 to 34 Years | 16 (4.1%) | 18 (4.3%) |
| 35 to 64 Years | 69 (9.1%) | 141 (15.6%) |
| 65 to 74 Years | 19 (9.9%) | 0 (0.0%) |
| 75 Years and over | 46 (56.8%) | 85 (38.8%) |
Disability Class: Ambulatory Difficulty
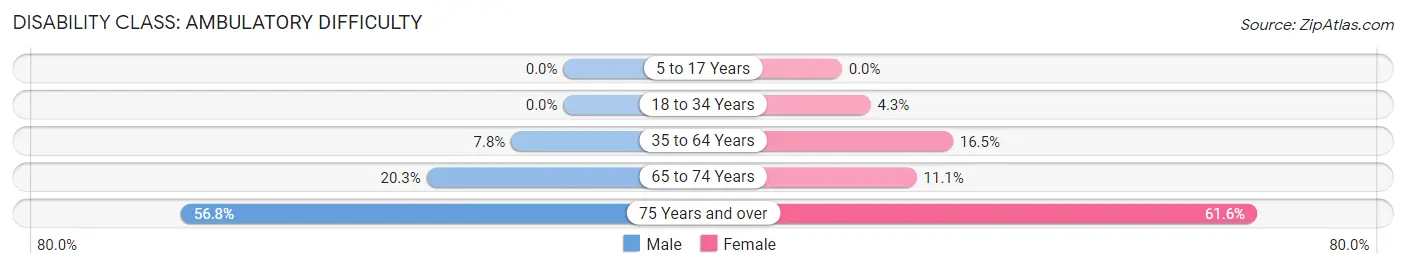
| Age Bracket | Male | Female |
| 5 to 17 Years | 0 (0.0%) | 0 (0.0%) |
| 18 to 34 Years | 0 (0.0%) | 18 (4.3%) |
| 35 to 64 Years | 59 (7.7%) | 149 (16.5%) |
| 65 to 74 Years | 39 (20.3%) | 30 (11.1%) |
| 75 Years and over | 46 (56.8%) | 135 (61.6%) |
Disability Class: Self-Care Difficulty
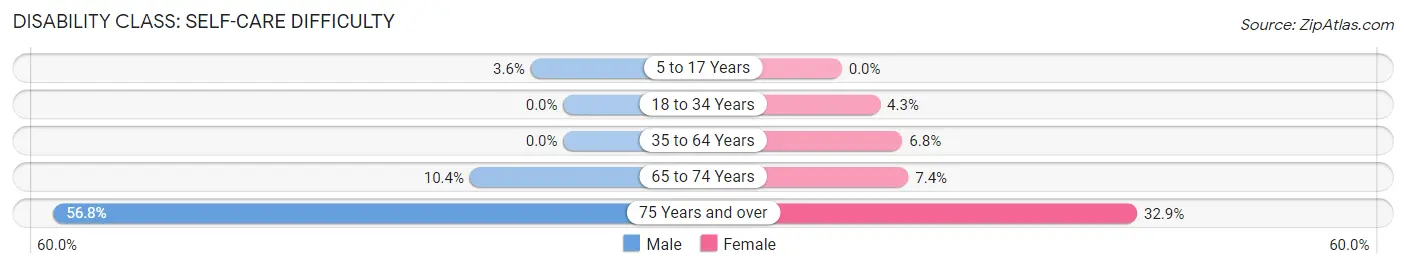
| Age Bracket | Male | Female |
| 5 to 17 Years | 22 (3.6%) | 0 (0.0%) |
| 18 to 34 Years | 0 (0.0%) | 18 (4.3%) |
| 35 to 64 Years | 0 (0.0%) | 61 (6.8%) |
| 65 to 74 Years | 20 (10.4%) | 20 (7.4%) |
| 75 Years and over | 46 (56.8%) | 72 (32.9%) |
Technology Access in Sulphur
Computing Device Access in Sulphur
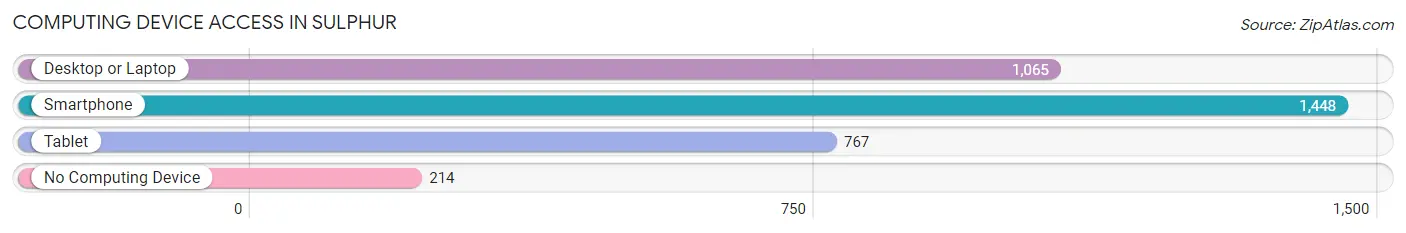
| Device Type | # Households | % Households |
| Desktop or Laptop | 1,065 | 60.6% |
| Smartphone | 1,448 | 82.4% |
| Tablet | 767 | 43.6% |
| No Computing Device | 214 | 12.2% |
| Total | 1,757 | 100.0% |
Internet Access in Sulphur
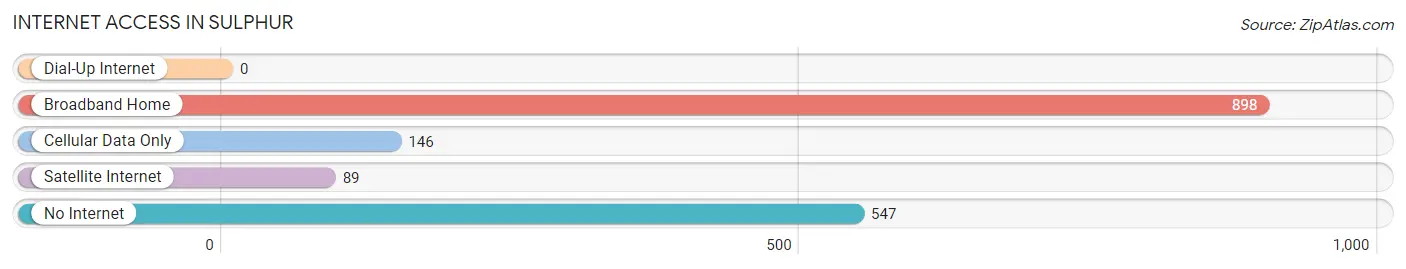
| Internet Type | # Households | % Households |
| Dial-Up Internet | 0 | 0.0% |
| Broadband Home | 898 | 51.1% |
| Cellular Data Only | 146 | 8.3% |
| Satellite Internet | 89 | 5.1% |
| No Internet | 547 | 31.1% |
| Total | 1,757 | 100.0% |
Sulphur Summary
Sulphur is a city located in Murray County, Oklahoma, United States. It is the county seat of Murray County and is situated in the Arbuckle Mountains. The population was 4,929 at the 2010 census, an increase of 8.3 percent from 4,547 at the 2000 census.
History
Sulphur was founded in 1882 by the Choctaw Nation. The town was named after the nearby Sulphur Springs, which were believed to have medicinal properties. The springs were a popular destination for visitors from all over the region.
The town was incorporated in 1898 and quickly became a center of commerce and industry. The first bank in the area was established in Sulphur in 1901. The town was also home to a number of businesses, including a cotton gin, a flour mill, a sawmill, and a brick factory.
In the early 1900s, Sulphur was a popular tourist destination. The town was home to a number of resorts, including the Sulphur Springs Hotel, which was built in 1902. The hotel was a popular destination for visitors from all over the region.
Geography
Sulphur is located at the intersection of U.S. Route 177 and State Highway 7 in Murray County. It is situated in the Arbuckle Mountains, which are part of the larger Ouachita Mountains range. The city is located approximately 80 miles south of Oklahoma City and 110 miles north of Dallas, Texas.
The city has a total area of 4.2 square miles, all of which is land. The city is located at an elevation of 890 feet above sea level.
Economy
Sulphur is a small city with a diverse economy. The city is home to a number of businesses, including a number of retail stores, restaurants, and service providers. The city is also home to a number of manufacturing and industrial businesses, including a number of oil and gas companies.
The city is also home to a number of educational institutions, including Murray State College and the Sulphur Public Schools. The city is also home to a number of medical facilities, including the Murray County Medical Center.
Demographics
As of the 2010 census, there were 4,929 people, 1,945 households, and 1,269 families residing in the city. The population density was 1,179.3 people per square mile. The racial makeup of the city was 81.2% White, 0.7% African American, 11.2% Native American, 0.3% Asian, 0.1% Pacific Islander, 0.7% from other races, and 5.8% from two or more races. Hispanic or Latino of any race were 3.2% of the population.
The median income for a household in the city was $30,938, and the median income for a family was $37,813. Males had a median income of $30,938 versus $20,972 for females. The per capita income for the city was $16,945. About 14.2% of families and 17.7% of the population were below the poverty line, including 25.2% of those under age 18 and 11.2% of those age 65 or over.
Common Questions
What is Per Capita Income in Sulphur?
Per Capita income in Sulphur is $30,745.
What is the Median Family Income in Sulphur?
Median Family Income in Sulphur is $76,250.
What is the Median Household income in Sulphur?
Median Household Income in Sulphur is $55,951.
What is Income or Wage Gap in Sulphur?
Income or Wage Gap in Sulphur is 11.6%.
Women in Sulphur earn 88.4 cents for every dollar earned by a man.
What is Inequality or Gini Index in Sulphur?
Inequality or Gini Index in Sulphur is 0.50.
What is the Total Population of Sulphur?
Total Population of Sulphur is 5,025.
What is the Total Male Population of Sulphur?
Total Male Population of Sulphur is 2,529.
What is the Total Female Population of Sulphur?
Total Female Population of Sulphur is 2,496.
What is the Ratio of Males per 100 Females in Sulphur?
There are 101.32 Males per 100 Females in Sulphur.
What is the Ratio of Females per 100 Males in Sulphur?
There are 98.70 Females per 100 Males in Sulphur.
What is the Median Population Age in Sulphur?
Median Population Age in Sulphur is 38.8 Years.
What is the Average Family Size in Sulphur
Average Family Size in Sulphur is 3.7 People.
What is the Average Household Size in Sulphur
Average Household Size in Sulphur is 2.6 People.
How Large is the Labor Force in Sulphur?
There are 1,909 People in the Labor Forcein in Sulphur.
What is the Percentage of People in the Labor Force in Sulphur?
50.4% of People are in the Labor Force in Sulphur.