Lake Waccamaw, NC Map & Demographics
Lake Waccamaw Map
Lake Waccamaw Overview
$43,990
PER CAPITA INCOME
$108,854
AVG FAMILY INCOME
$74,297
AVG HOUSEHOLD INCOME
15.9%
WAGE / INCOME GAP [ % ]
84.1¢/ $1
WAGE / INCOME GAP [ $ ]
0.49
INEQUALITY / GINI INDEX
1,462
TOTAL POPULATION
710
MALE POPULATION
752
FEMALE POPULATION
94.41
MALES / 100 FEMALES
105.92
FEMALES / 100 MALES
53.5
MEDIAN AGE
2.6
AVG FAMILY SIZE
2.2
AVG HOUSEHOLD SIZE
540
LABOR FORCE [ PEOPLE ]
44.8%
PERCENT IN LABOR FORCE
2.2%
UNEMPLOYMENT RATE
Lake Waccamaw Zip Codes
Lake Waccamaw Area Codes
Income in Lake Waccamaw
Income Overview in Lake Waccamaw
Per Capita Income in Lake Waccamaw is $43,990, while median incomes of families and households are $108,854 and $74,297 respectively.
| Characteristic | Number | Measure |
| Per Capita Income | 1,462 | $43,990 |
| Median Family Income | 393 | $108,854 |
| Mean Family Income | 393 | $133,975 |
| Median Household Income | 555 | $74,297 |
| Mean Household Income | 555 | $111,596 |
| Income Deficit | 393 | $0 |
| Wage / Income Gap (%) | 1,462 | 15.92% |
| Wage / Income Gap ($) | 1,462 | 84.08¢ per $1 |
| Gini / Inequality Index | 1,462 | 0.49 |
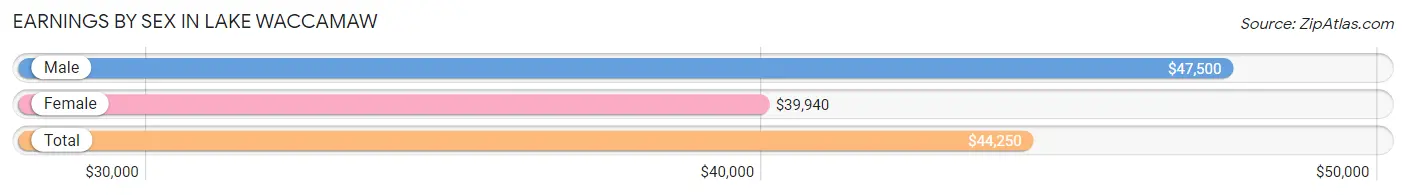
Earnings by Sex in Lake Waccamaw
Average Earnings in Lake Waccamaw are $44,250, $47,500 for men and $39,940 for women, a difference of 15.9%.
| Sex | Number | Average Earnings |
| Male | 270 (46.6%) | $47,500 |
| Female | 309 (53.4%) | $39,940 |
| Total | 579 (100.0%) | $44,250 |
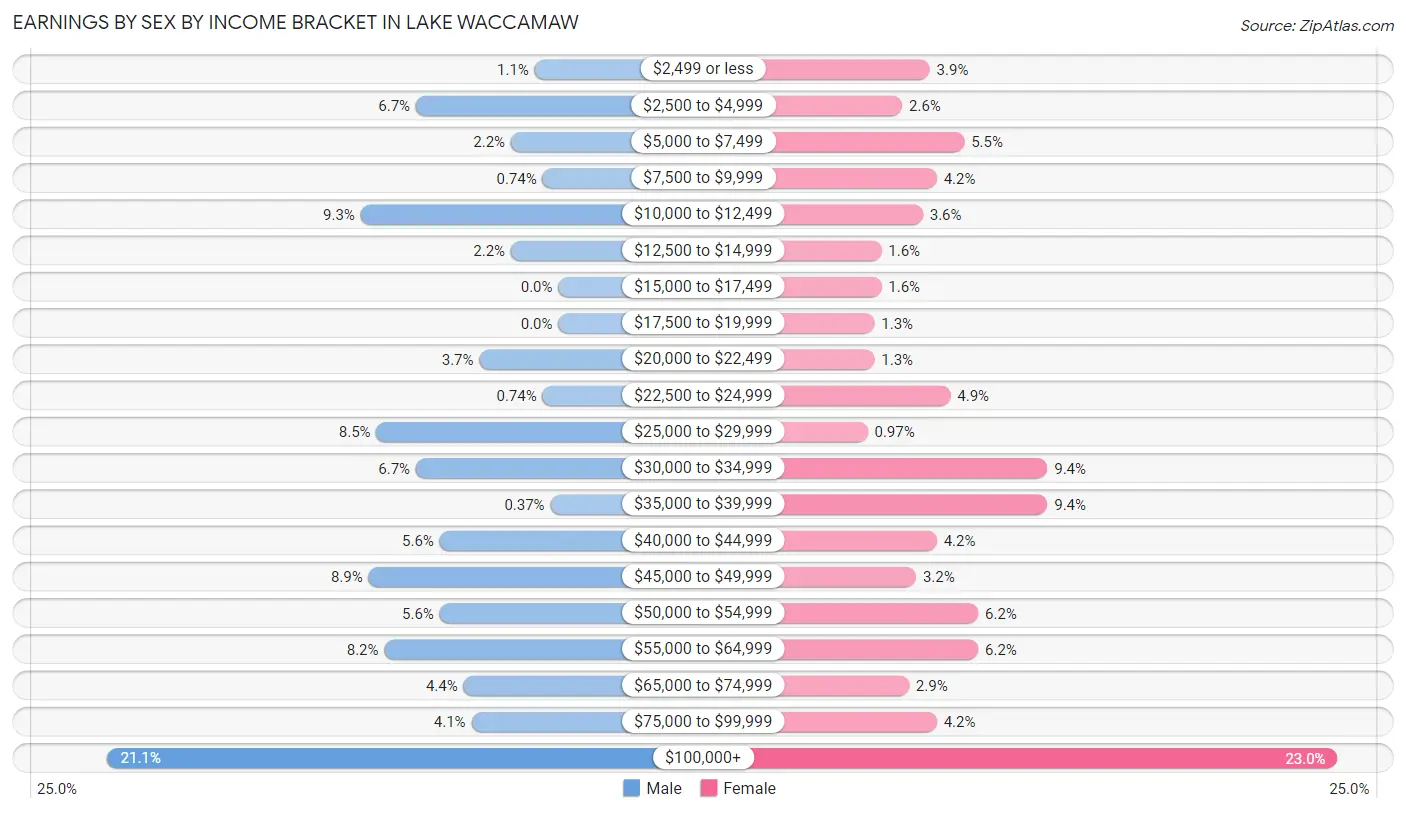
Earnings by Sex by Income Bracket in Lake Waccamaw
The most common earnings brackets in Lake Waccamaw are $100,000+ for men (57 | 21.1%) and $100,000+ for women (71 | 23.0%).
| Income | Male | Female |
| $2,499 or less | 3 (1.1%) | 12 (3.9%) |
| $2,500 to $4,999 | 18 (6.7%) | 8 (2.6%) |
| $5,000 to $7,499 | 6 (2.2%) | 17 (5.5%) |
| $7,500 to $9,999 | 2 (0.7%) | 13 (4.2%) |
| $10,000 to $12,499 | 25 (9.3%) | 11 (3.6%) |
| $12,500 to $14,999 | 6 (2.2%) | 5 (1.6%) |
| $15,000 to $17,499 | 0 (0.0%) | 5 (1.6%) |
| $17,500 to $19,999 | 0 (0.0%) | 4 (1.3%) |
| $20,000 to $22,499 | 10 (3.7%) | 4 (1.3%) |
| $22,500 to $24,999 | 2 (0.7%) | 15 (4.9%) |
| $25,000 to $29,999 | 23 (8.5%) | 3 (1.0%) |
| $30,000 to $34,999 | 18 (6.7%) | 29 (9.4%) |
| $35,000 to $39,999 | 1 (0.4%) | 29 (9.4%) |
| $40,000 to $44,999 | 15 (5.6%) | 13 (4.2%) |
| $45,000 to $49,999 | 24 (8.9%) | 10 (3.2%) |
| $50,000 to $54,999 | 15 (5.6%) | 19 (6.1%) |
| $55,000 to $64,999 | 22 (8.2%) | 19 (6.1%) |
| $65,000 to $74,999 | 12 (4.4%) | 9 (2.9%) |
| $75,000 to $99,999 | 11 (4.1%) | 13 (4.2%) |
| $100,000+ | 57 (21.1%) | 71 (23.0%) |
| Total | 270 (100.0%) | 309 (100.0%) |
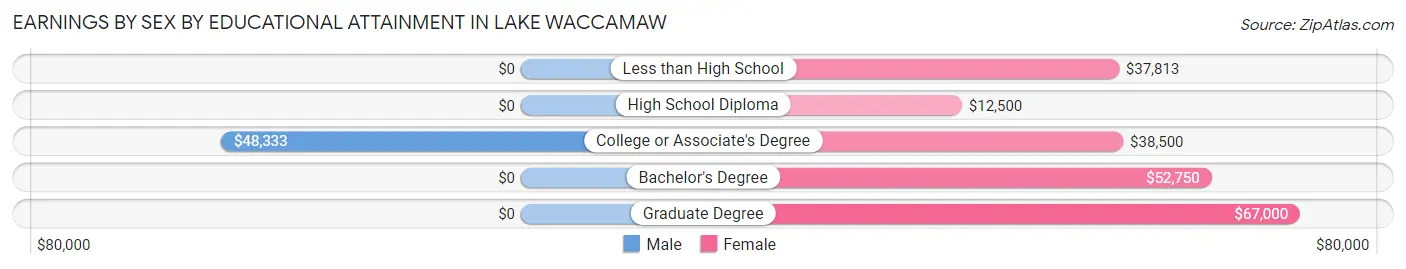
Earnings by Sex by Educational Attainment in Lake Waccamaw
Average earnings in Lake Waccamaw are $49,375 for men and $42,885 for women, a difference of 13.1%. Men with an educational attainment of college or associate's degree enjoy the highest average annual earnings of $48,333, while those with college or associate's degree education earn the least with $48,333. Women with an educational attainment of graduate degree earn the most with the average annual earnings of $67,000, while those with high school diploma education have the smallest earnings of $12,500.
| Educational Attainment | Male Income | Female Income |
| Less than High School | - | - |
| High School Diploma | - | - |
| College or Associate's Degree | $48,333 | $38,500 |
| Bachelor's Degree | - | - |
| Graduate Degree | - | - |
| Total | $49,375 | $42,885 |
Family Income in Lake Waccamaw
Family Income Brackets in Lake Waccamaw
According to the Lake Waccamaw family income data, there are 79 families falling into the $100,000 to $149,999 income range, which is the most common income bracket and makes up 20.1% of all families. Conversely, the $10,000 to $14,999 income bracket is the least frequent group with only 5 families (1.3%) belonging to this category.
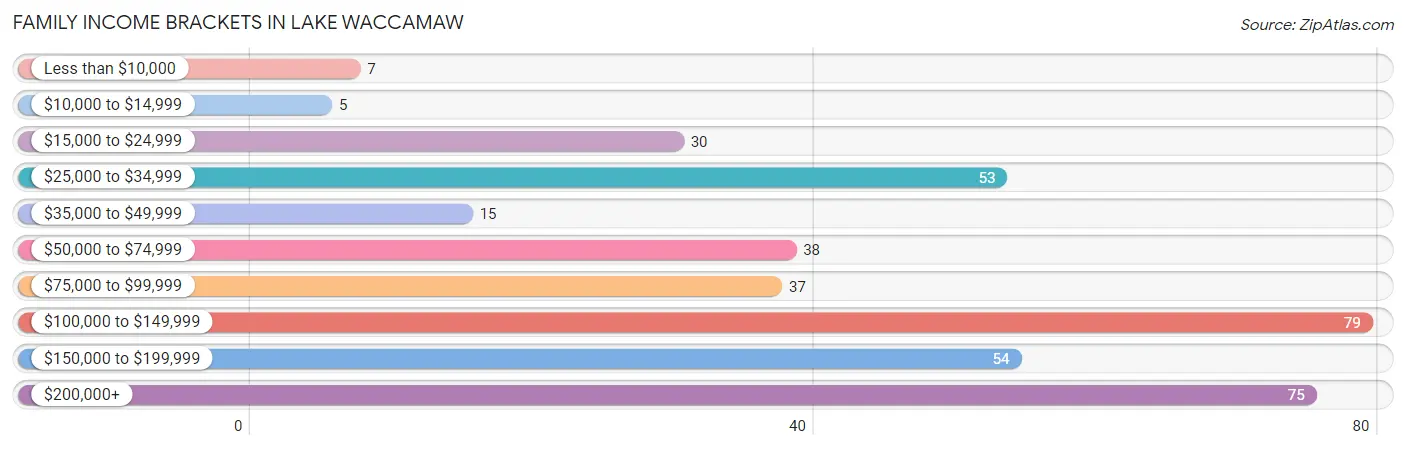
| Income Bracket | # Families | % Families |
| Less than $10,000 | 7 | 1.8% |
| $10,000 to $14,999 | 5 | 1.3% |
| $15,000 to $24,999 | 30 | 7.6% |
| $25,000 to $34,999 | 53 | 13.5% |
| $35,000 to $49,999 | 15 | 3.8% |
| $50,000 to $74,999 | 38 | 9.7% |
| $75,000 to $99,999 | 37 | 9.4% |
| $100,000 to $149,999 | 79 | 20.1% |
| $150,000 to $199,999 | 54 | 13.7% |
| $200,000+ | 75 | 19.1% |
Family Income by Famaliy Size in Lake Waccamaw
3-person families (45 | 11.5%) account for the highest median family income in Lake Waccamaw with $154,375 per family, while 3-person families (45 | 11.5%) have the highest median income of $51,458 per family member.
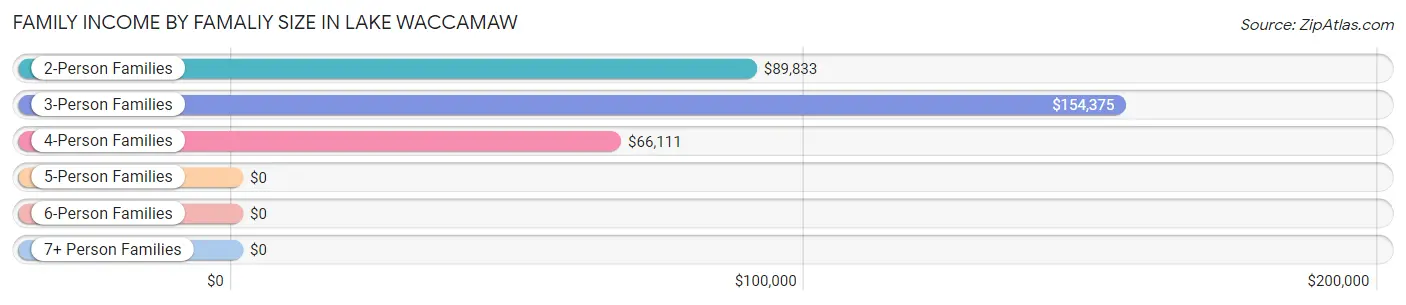
| Income Bracket | # Families | Median Income |
| 2-Person Families | 280 (71.3%) | $89,833 |
| 3-Person Families | 45 (11.5%) | $154,375 |
| 4-Person Families | 60 (15.3%) | $66,111 |
| 5-Person Families | 4 (1.0%) | $0 |
| 6-Person Families | 0 (0.0%) | $0 |
| 7+ Person Families | 4 (1.0%) | $0 |
| Total | 393 (100.0%) | $108,854 |
Family Income by Number of Earners in Lake Waccamaw
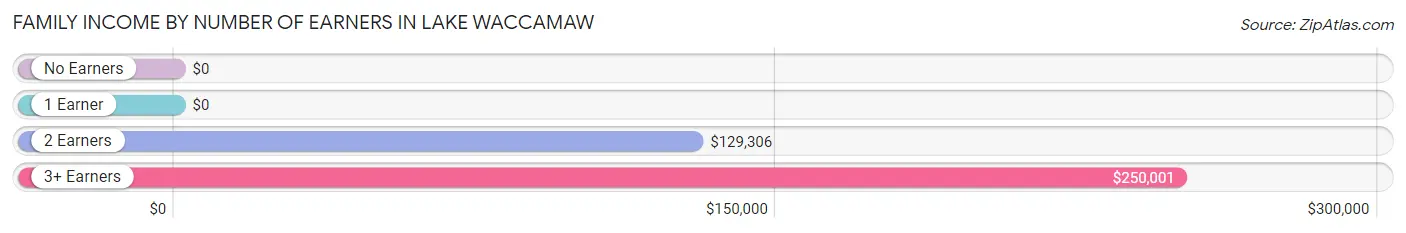
| Number of Earners | # Families | Median Income |
| No Earners | 92 (23.4%) | $0 |
| 1 Earner | 124 (31.6%) | $0 |
| 2 Earners | 161 (41.0%) | $129,306 |
| 3+ Earners | 16 (4.1%) | $250,001 |
| Total | 393 (100.0%) | $108,854 |
Household Income in Lake Waccamaw
Household Income Brackets in Lake Waccamaw
With 89 households falling in the category, the $15,000 to $24,999 income range is the most frequent in Lake Waccamaw, accounting for 16.0% of all households. In contrast, only 5 households (0.9%) fall into the $10,000 to $14,999 income bracket, making it the least populous group.
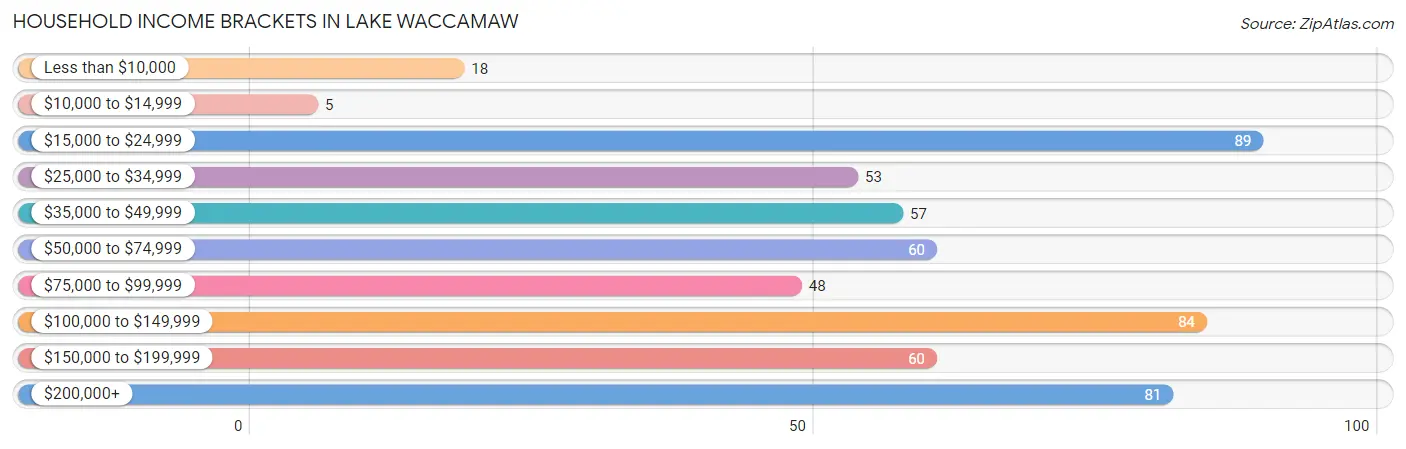
| Income Bracket | # Households | % Households |
| Less than $10,000 | 18 | 3.2% |
| $10,000 to $14,999 | 5 | 0.9% |
| $15,000 to $24,999 | 89 | 16.0% |
| $25,000 to $34,999 | 53 | 9.5% |
| $35,000 to $49,999 | 57 | 10.3% |
| $50,000 to $74,999 | 60 | 10.8% |
| $75,000 to $99,999 | 48 | 8.6% |
| $100,000 to $149,999 | 84 | 15.1% |
| $150,000 to $199,999 | 60 | 10.8% |
| $200,000+ | 81 | 14.6% |
Household Income by Householder Age in Lake Waccamaw
The median household income in Lake Waccamaw is $74,297, with the highest median household income of $109,286 found in the 45 to 64 years age bracket for the primary householder. A total of 206 households (37.1%) fall into this category. Meanwhile, the 15 to 24 years age bracket for the primary householder has the lowest median household income of $0, with 6 households (1.1%) in this group.
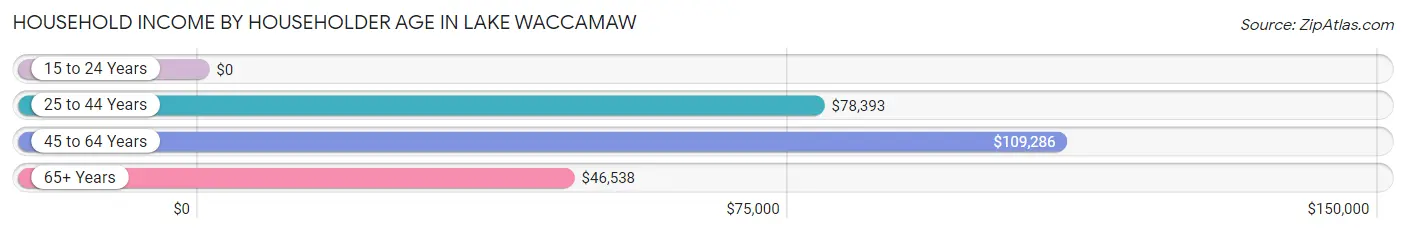
| Income Bracket | # Households | Median Income |
| 15 to 24 Years | 6 (1.1%) | $0 |
| 25 to 44 Years | 75 (13.5%) | $78,393 |
| 45 to 64 Years | 206 (37.1%) | $109,286 |
| 65+ Years | 268 (48.3%) | $46,538 |
| Total | 555 (100.0%) | $74,297 |
Poverty in Lake Waccamaw
Income Below Poverty by Sex and Age in Lake Waccamaw
With 8.4% poverty level for males and 3.4% for females among the residents of Lake Waccamaw, 16 and 17 year old males and 25 to 34 year old females are the most vulnerable to poverty, with 12 males (100.0%) and 4 females (10.8%) in their respective age groups living below the poverty level.
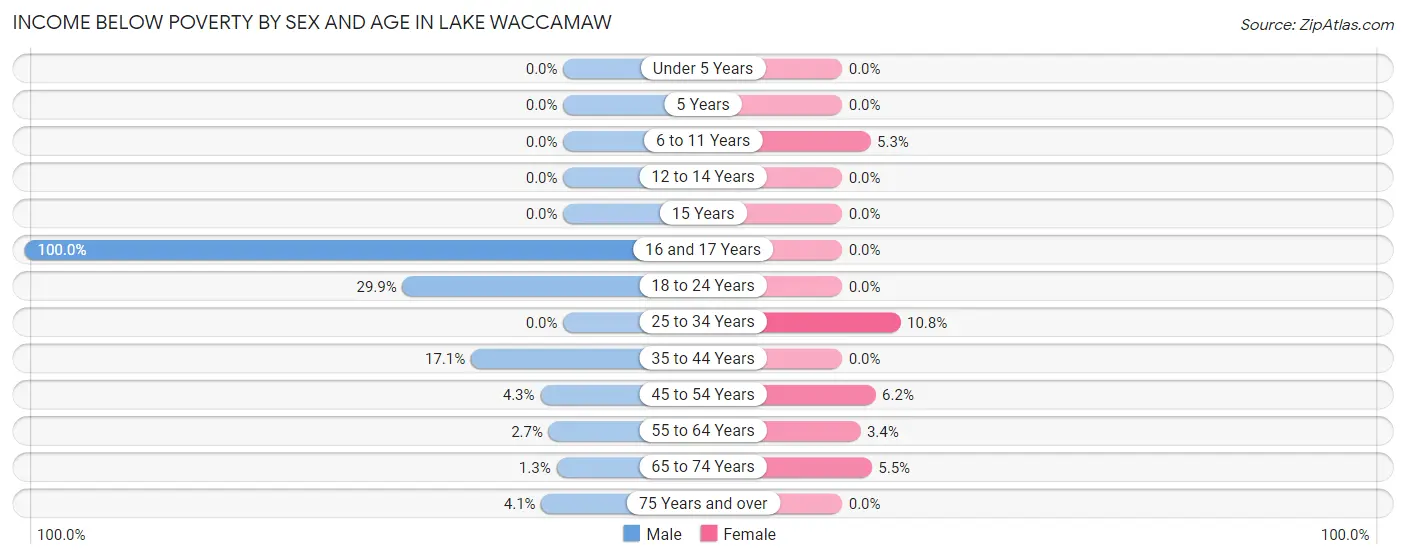
| Age Bracket | Male | Female |
| Under 5 Years | 0 (0.0%) | 0 (0.0%) |
| 5 Years | 0 (0.0%) | 0 (0.0%) |
| 6 to 11 Years | 0 (0.0%) | 3 (5.3%) |
| 12 to 14 Years | 0 (0.0%) | 0 (0.0%) |
| 15 Years | 0 (0.0%) | 0 (0.0%) |
| 16 and 17 Years | 12 (100.0%) | 0 (0.0%) |
| 18 to 24 Years | 20 (29.8%) | 0 (0.0%) |
| 25 to 34 Years | 0 (0.0%) | 4 (10.8%) |
| 35 to 44 Years | 6 (17.1%) | 0 (0.0%) |
| 45 to 54 Years | 4 (4.3%) | 7 (6.2%) |
| 55 to 64 Years | 2 (2.7%) | 3 (3.4%) |
| 65 to 74 Years | 1 (1.3%) | 5 (5.5%) |
| 75 Years and over | 5 (4.1%) | 0 (0.0%) |
| Total | 50 (8.4%) | 22 (3.4%) |
Income Above Poverty by Sex and Age in Lake Waccamaw
According to the poverty statistics in Lake Waccamaw, males aged under 5 years and females aged under 5 years are the age groups that are most secure financially, with 100.0% of males and 100.0% of females in these age groups living above the poverty line.
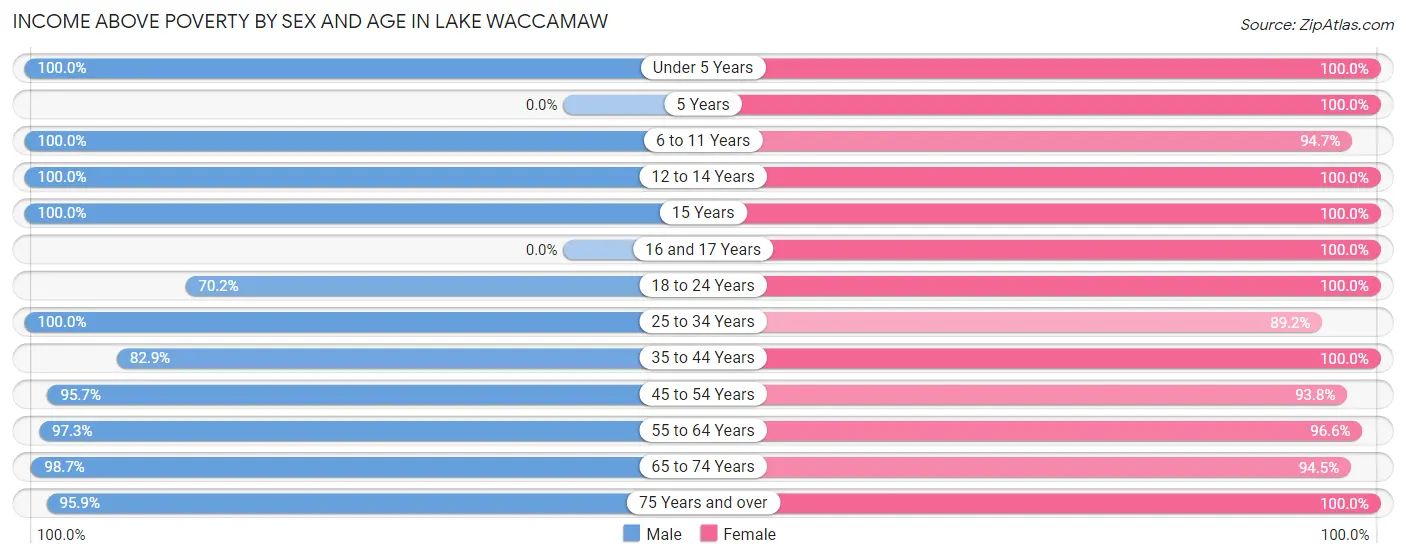
| Age Bracket | Male | Female |
| Under 5 Years | 16 (100.0%) | 10 (100.0%) |
| 5 Years | 0 (0.0%) | 4 (100.0%) |
| 6 to 11 Years | 38 (100.0%) | 54 (94.7%) |
| 12 to 14 Years | 34 (100.0%) | 53 (100.0%) |
| 15 Years | 4 (100.0%) | 5 (100.0%) |
| 16 and 17 Years | 0 (0.0%) | 10 (100.0%) |
| 18 to 24 Years | 47 (70.2%) | 22 (100.0%) |
| 25 to 34 Years | 22 (100.0%) | 33 (89.2%) |
| 35 to 44 Years | 29 (82.9%) | 49 (100.0%) |
| 45 to 54 Years | 90 (95.7%) | 106 (93.8%) |
| 55 to 64 Years | 72 (97.3%) | 86 (96.6%) |
| 65 to 74 Years | 78 (98.7%) | 86 (94.5%) |
| 75 Years and over | 118 (95.9%) | 99 (100.0%) |
| Total | 548 (91.6%) | 617 (96.6%) |
Income Below Poverty Among Married-Couple Families in Lake Waccamaw
The poverty statistics for married-couple families in Lake Waccamaw show that 1.6% or 5 of the total 306 families live below the poverty line. Families with no children have the highest poverty rate of 2.1%, comprising of 5 families. On the other hand, families with 1 or 2 children have the lowest poverty rate of 0.0%, which includes 0 families.
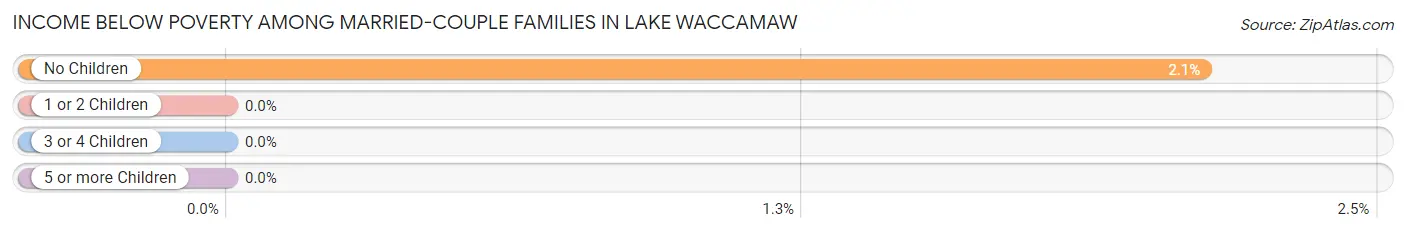
| Children | Above Poverty | Below Poverty |
| No Children | 231 (97.9%) | 5 (2.1%) |
| 1 or 2 Children | 62 (100.0%) | 0 (0.0%) |
| 3 or 4 Children | 4 (100.0%) | 0 (0.0%) |
| 5 or more Children | 4 (100.0%) | 0 (0.0%) |
| Total | 301 (98.4%) | 5 (1.6%) |
Income Below Poverty Among Single-Parent Households in Lake Waccamaw
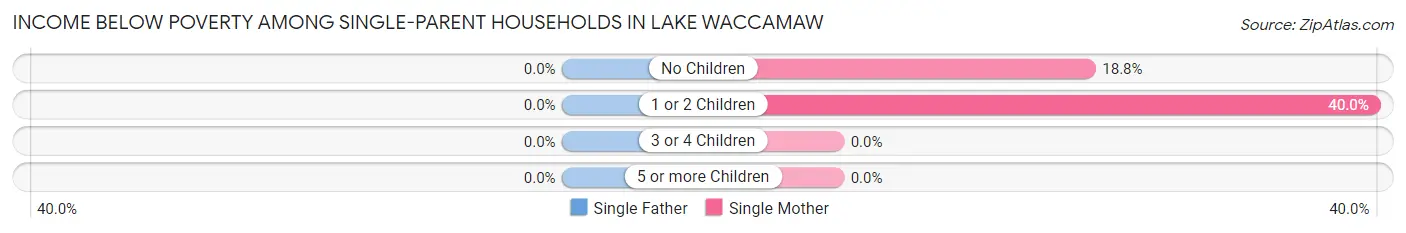
| Children | Single Father | Single Mother |
| No Children | 0 (0.0%) | 3 (18.8%) |
| 1 or 2 Children | 0 (0.0%) | 4 (40.0%) |
| 3 or 4 Children | 0 (0.0%) | 0 (0.0%) |
| 5 or more Children | 0 (0.0%) | 0 (0.0%) |
| Total | 0 (0.0%) | 7 (15.9%) |
Income Below Poverty Among Married-Couple vs Single-Parent Households in Lake Waccamaw
The poverty data for Lake Waccamaw shows that 5 of the married-couple family households (1.6%) and 7 of the single-parent households (8.1%) are living below the poverty level. Within the married-couple family households, those with no children have the highest poverty rate, with 5 households (2.1%) falling below the poverty line. Among the single-parent households, those with 1 or 2 children have the highest poverty rate, with 4 household (17.4%) living below poverty.
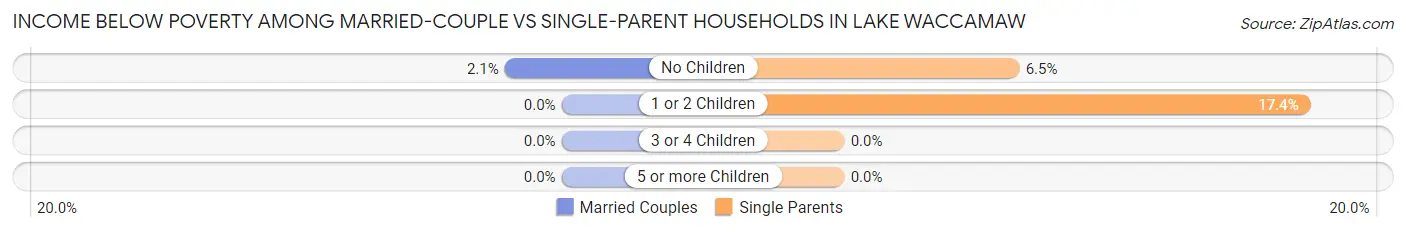
| Children | Married-Couple Families | Single-Parent Households |
| No Children | 5 (2.1%) | 3 (6.5%) |
| 1 or 2 Children | 0 (0.0%) | 4 (17.4%) |
| 3 or 4 Children | 0 (0.0%) | 0 (0.0%) |
| 5 or more Children | 0 (0.0%) | 0 (0.0%) |
| Total | 5 (1.6%) | 7 (8.1%) |
Race in Lake Waccamaw
The most populous races in Lake Waccamaw are White / Caucasian (1,145 | 78.3%), Black / African American (167 | 11.4%), and Two or more Races (65 | 4.4%).
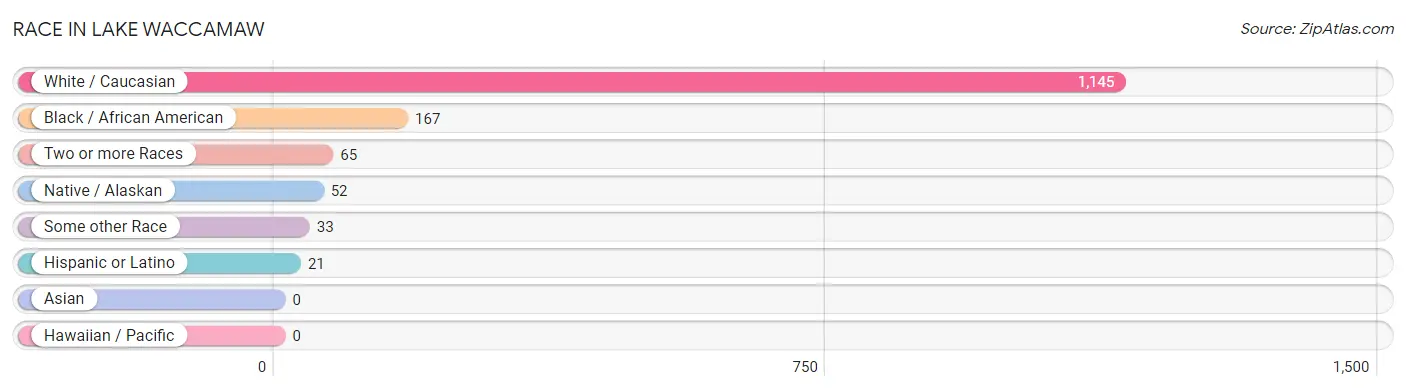
| Race | # Population | % Population |
| Asian | 0 | 0.0% |
| Black / African American | 167 | 11.4% |
| Hawaiian / Pacific | 0 | 0.0% |
| Hispanic or Latino | 21 | 1.4% |
| Native / Alaskan | 52 | 3.6% |
| White / Caucasian | 1,145 | 78.3% |
| Two or more Races | 65 | 4.4% |
| Some other Race | 33 | 2.3% |
| Total | 1,462 | 100.0% |
Ancestry in Lake Waccamaw
The most populous ancestries reported in Lake Waccamaw are American (231 | 15.8%), English (202 | 13.8%), Irish (98 | 6.7%), Scotch-Irish (96 | 6.6%), and Scottish (72 | 4.9%), together accounting for 47.8% of all Lake Waccamaw residents.
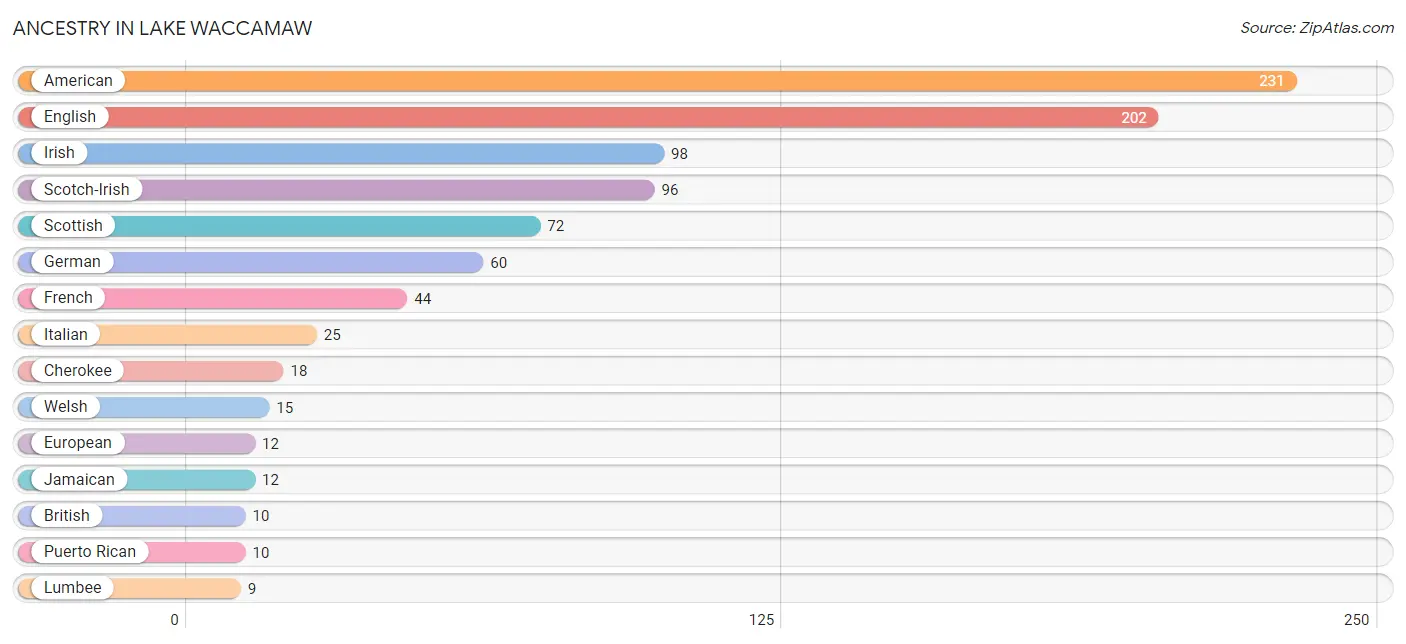
| Ancestry | # Population | % Population |
| African | 6 | 0.4% |
| American | 231 | 15.8% |
| Arab | 6 | 0.4% |
| Austrian | 3 | 0.2% |
| British | 10 | 0.7% |
| Cherokee | 18 | 1.2% |
| Danish | 2 | 0.1% |
| Eastern European | 8 | 0.5% |
| English | 202 | 13.8% |
| European | 12 | 0.8% |
| French | 44 | 3.0% |
| German | 60 | 4.1% |
| Greek | 4 | 0.3% |
| Irish | 98 | 6.7% |
| Italian | 25 | 1.7% |
| Jamaican | 12 | 0.8% |
| Lithuanian | 1 | 0.1% |
| Lumbee | 9 | 0.6% |
| Mexican | 5 | 0.3% |
| Northern European | 4 | 0.3% |
| Puerto Rican | 10 | 0.7% |
| Russian | 6 | 0.4% |
| Scotch-Irish | 96 | 6.6% |
| Scottish | 72 | 4.9% |
| Subsaharan African | 6 | 0.4% |
| Swiss | 6 | 0.4% |
| Syrian | 6 | 0.4% |
| Welsh | 15 | 1.0% | View All 28 Rows |
Immigrants in Lake Waccamaw
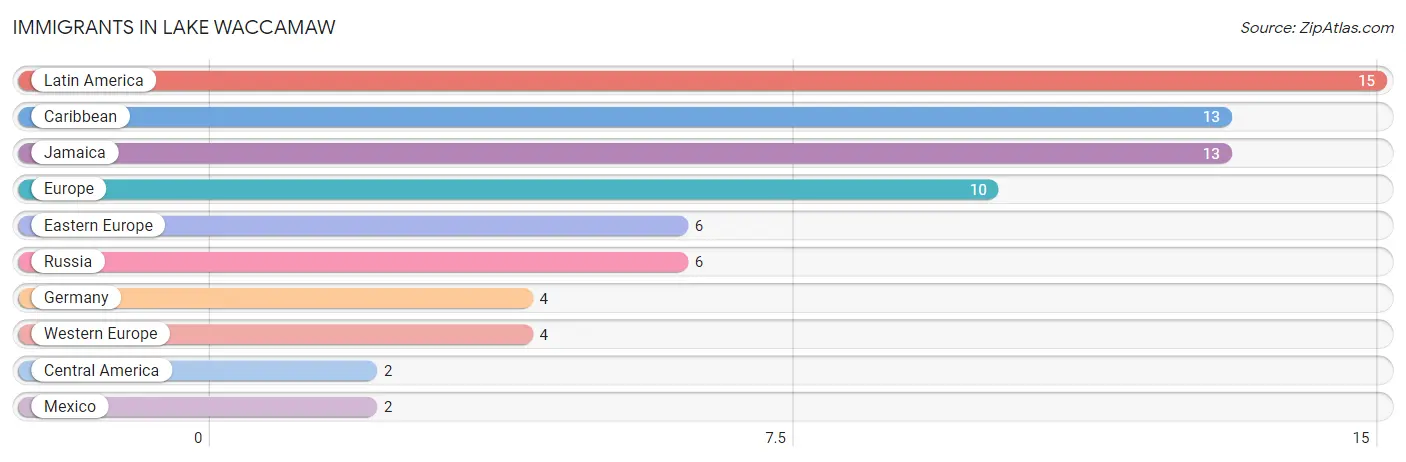
The most numerous immigrant groups reported in Lake Waccamaw came from Latin America (15 | 1.0%), Caribbean (13 | 0.9%), Jamaica (13 | 0.9%), Europe (10 | 0.7%), and Eastern Europe (6 | 0.4%), together accounting for 3.9% of all Lake Waccamaw residents.
| Immigration Origin | # Population | % Population |
| Caribbean | 13 | 0.9% |
| Central America | 2 | 0.1% |
| Eastern Europe | 6 | 0.4% |
| Europe | 10 | 0.7% |
| Germany | 4 | 0.3% |
| Jamaica | 13 | 0.9% |
| Latin America | 15 | 1.0% |
| Mexico | 2 | 0.1% |
| Russia | 6 | 0.4% |
| Western Europe | 4 | 0.3% | View All 10 Rows |
Sex and Age in Lake Waccamaw
Sex and Age in Lake Waccamaw
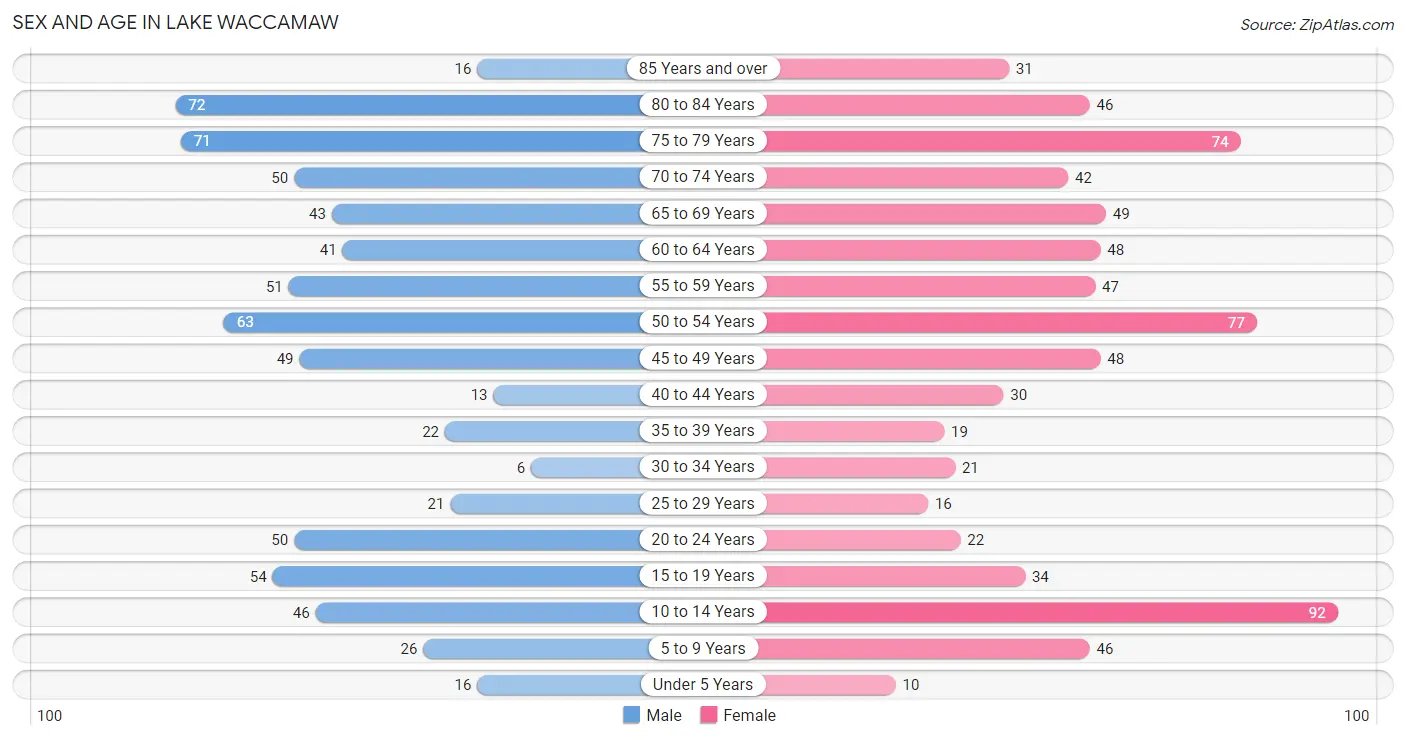
The most populous age groups in Lake Waccamaw are 80 to 84 Years (72 | 10.1%) for men and 10 to 14 Years (92 | 12.2%) for women.
| Age Bracket | Male | Female |
| Under 5 Years | 16 (2.2%) | 10 (1.3%) |
| 5 to 9 Years | 26 (3.7%) | 46 (6.1%) |
| 10 to 14 Years | 46 (6.5%) | 92 (12.2%) |
| 15 to 19 Years | 54 (7.6%) | 34 (4.5%) |
| 20 to 24 Years | 50 (7.0%) | 22 (2.9%) |
| 25 to 29 Years | 21 (3.0%) | 16 (2.1%) |
| 30 to 34 Years | 6 (0.9%) | 21 (2.8%) |
| 35 to 39 Years | 22 (3.1%) | 19 (2.5%) |
| 40 to 44 Years | 13 (1.8%) | 30 (4.0%) |
| 45 to 49 Years | 49 (6.9%) | 48 (6.4%) |
| 50 to 54 Years | 63 (8.9%) | 77 (10.2%) |
| 55 to 59 Years | 51 (7.2%) | 47 (6.2%) |
| 60 to 64 Years | 41 (5.8%) | 48 (6.4%) |
| 65 to 69 Years | 43 (6.1%) | 49 (6.5%) |
| 70 to 74 Years | 50 (7.0%) | 42 (5.6%) |
| 75 to 79 Years | 71 (10.0%) | 74 (9.8%) |
| 80 to 84 Years | 72 (10.1%) | 46 (6.1%) |
| 85 Years and over | 16 (2.2%) | 31 (4.1%) |
| Total | 710 (100.0%) | 752 (100.0%) |
Families and Households in Lake Waccamaw
Median Family Size in Lake Waccamaw
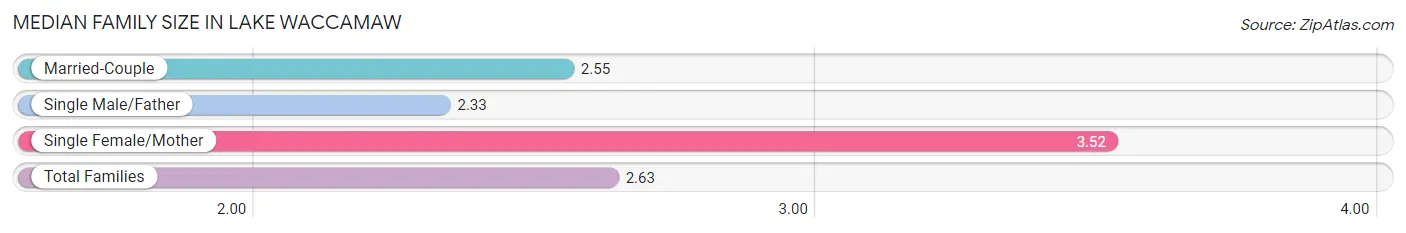
The median family size in Lake Waccamaw is 2.63 persons per family, with single female/mother families (44 | 11.2%) accounting for the largest median family size of 3.52 persons per family. On the other hand, single male/father families (43 | 10.9%) represent the smallest median family size with 2.33 persons per family.
| Family Type | # Families | Family Size |
| Married-Couple | 306 (77.9%) | 2.55 |
| Single Male/Father | 43 (10.9%) | 2.33 |
| Single Female/Mother | 44 (11.2%) | 3.52 |
| Total Families | 393 (100.0%) | 2.63 |
Median Household Size in Lake Waccamaw
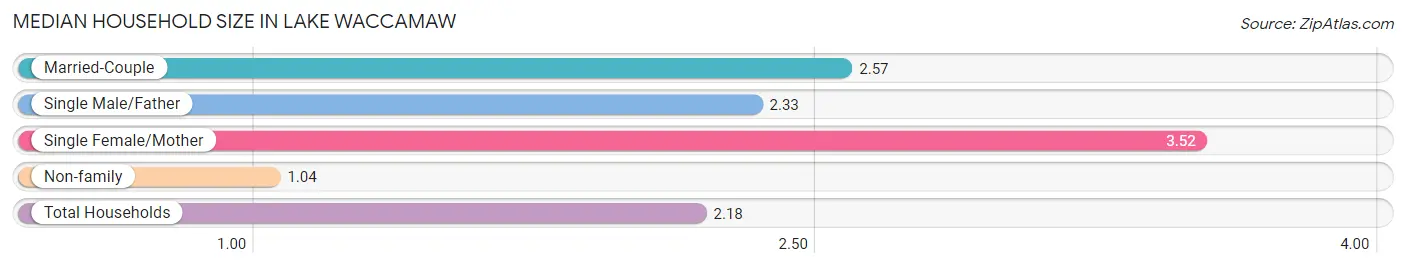
The median household size in Lake Waccamaw is 2.18 persons per household, with single female/mother households (44 | 7.9%) accounting for the largest median household size of 3.52 persons per household. non-family households (162 | 29.2%) represent the smallest median household size with 1.04 persons per household.
| Household Type | # Households | Household Size |
| Married-Couple | 306 (55.1%) | 2.57 |
| Single Male/Father | 43 (7.7%) | 2.33 |
| Single Female/Mother | 44 (7.9%) | 3.52 |
| Non-family | 162 (29.2%) | 1.04 |
| Total Households | 555 (100.0%) | 2.18 |
Household Size by Marriage Status in Lake Waccamaw
Out of a total of 555 households in Lake Waccamaw, 393 (70.8%) are family households, while 162 (29.2%) are nonfamily households. The most numerous type of family households are 2-person households, comprising 277, and the most common type of nonfamily households are 1-person households, comprising 153.
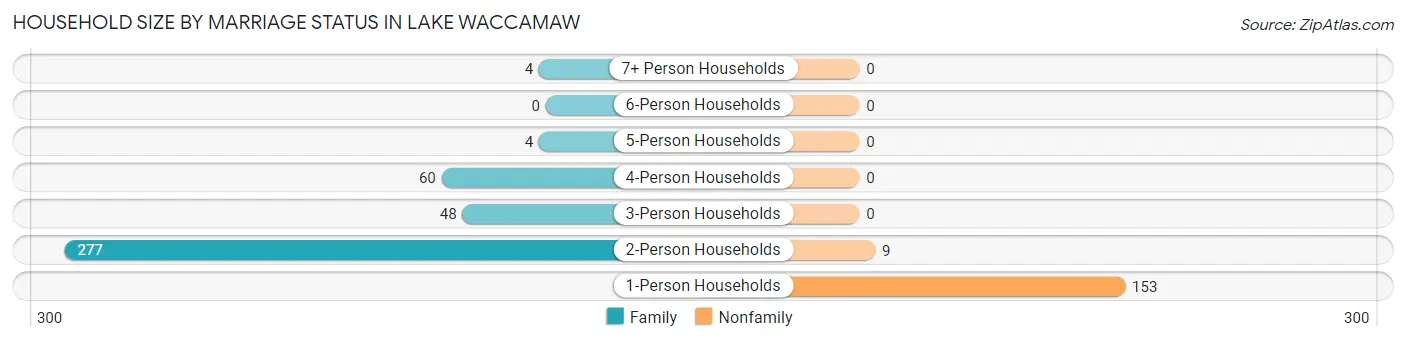
| Household Size | Family Households | Nonfamily Households |
| 1-Person Households | - | 153 (27.6%) |
| 2-Person Households | 277 (49.9%) | 9 (1.6%) |
| 3-Person Households | 48 (8.6%) | 0 (0.0%) |
| 4-Person Households | 60 (10.8%) | 0 (0.0%) |
| 5-Person Households | 4 (0.7%) | 0 (0.0%) |
| 6-Person Households | 0 (0.0%) | 0 (0.0%) |
| 7+ Person Households | 4 (0.7%) | 0 (0.0%) |
| Total | 393 (70.8%) | 162 (29.2%) |
Female Fertility in Lake Waccamaw
Fertility by Age in Lake Waccamaw
| Age Bracket | Women with Births | Births / 1,000 Women |
| 15 to 19 years | 0 (0.0%) | 0.0 |
| 20 to 34 years | 0 (0.0%) | 0.0 |
| 35 to 50 years | 0 (0.0%) | 0.0 |
| Total | 0 (0.0%) | 0.0 |
Fertility by Age by Marriage Status in Lake Waccamaw
| Age Bracket | Married | Unmarried |
| 15 to 19 years | 0 (0.0%) | 0 (0.0%) |
| 20 to 34 years | 0 (0.0%) | 0 (0.0%) |
| 35 to 50 years | 0 (0.0%) | 0 (0.0%) |
| Total | 0 (0.0%) | 0 (0.0%) |
Fertility by Education in Lake Waccamaw
| Educational Attainment | Women with Births | Births / 1,000 Women |
| Less than High School | 0 (0.0%) | 0.0 |
| High School Diploma | 0 (0.0%) | 0.0 |
| College or Associate's Degree | 0 (0.0%) | 0.0 |
| Bachelor's Degree | 0 (0.0%) | 0.0 |
| Graduate Degree | 0 (0.0%) | 0.0 |
| Total | 0 (0.0%) | 0.0 |
Fertility by Education by Marriage Status in Lake Waccamaw
| Educational Attainment | Married | Unmarried |
| Less than High School | 0 (0.0%) | 0 (0.0%) |
| High School Diploma | 0 (0.0%) | 0 (0.0%) |
| College or Associate's Degree | 0 (0.0%) | 0 (0.0%) |
| Bachelor's Degree | 0 (0.0%) | 0 (0.0%) |
| Graduate Degree | 0 (0.0%) | 0 (0.0%) |
| Total | 0 (0.0%) | 0 (0.0%) |
Employment Characteristics in Lake Waccamaw
Employment by Class of Employer in Lake Waccamaw
Among the 524 employed individuals in Lake Waccamaw, private company employees (228 | 43.5%), not-for-profit organizations (83 | 15.8%), and state government employees (58 | 11.1%) make up the most common classes of employment.
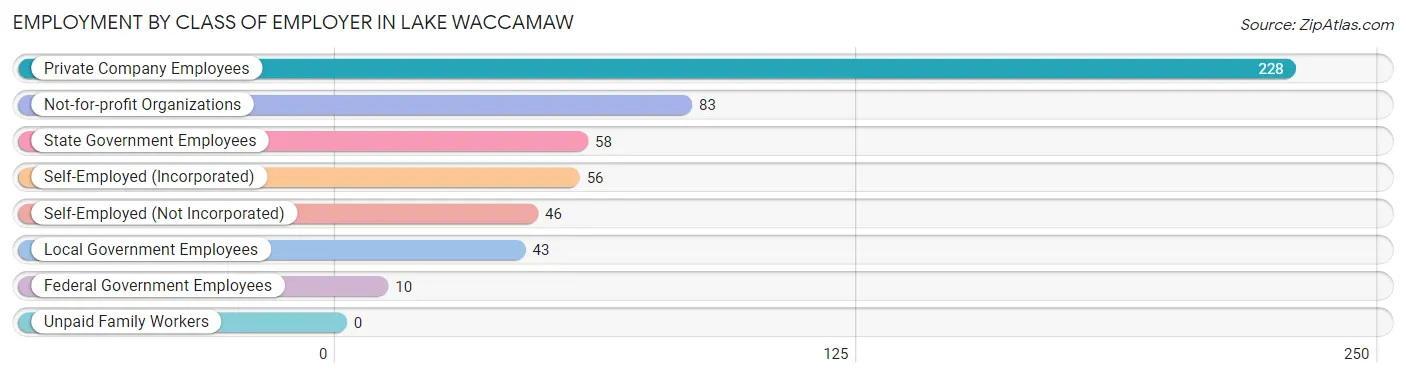
| Employer Class | # Employees | % Employees |
| Private Company Employees | 228 | 43.5% |
| Self-Employed (Incorporated) | 56 | 10.7% |
| Self-Employed (Not Incorporated) | 46 | 8.8% |
| Not-for-profit Organizations | 83 | 15.8% |
| Local Government Employees | 43 | 8.2% |
| State Government Employees | 58 | 11.1% |
| Federal Government Employees | 10 | 1.9% |
| Unpaid Family Workers | 0 | 0.0% |
| Total | 524 | 100.0% |
Employment Status by Age in Lake Waccamaw
According to the labor force statistics for Lake Waccamaw, out of the total population over 16 years of age (1,206), 44.8% or 540 individuals are in the labor force, with 2.2% or 12 of them unemployed. The age group with the highest labor force participation rate is 35 to 44 years, with 89.3% or 75 individuals in the labor force. Within the labor force, the 16 to 19 years age range has the highest percentage of unemployed individuals, with 44.4% or 12 of them being unemployed.
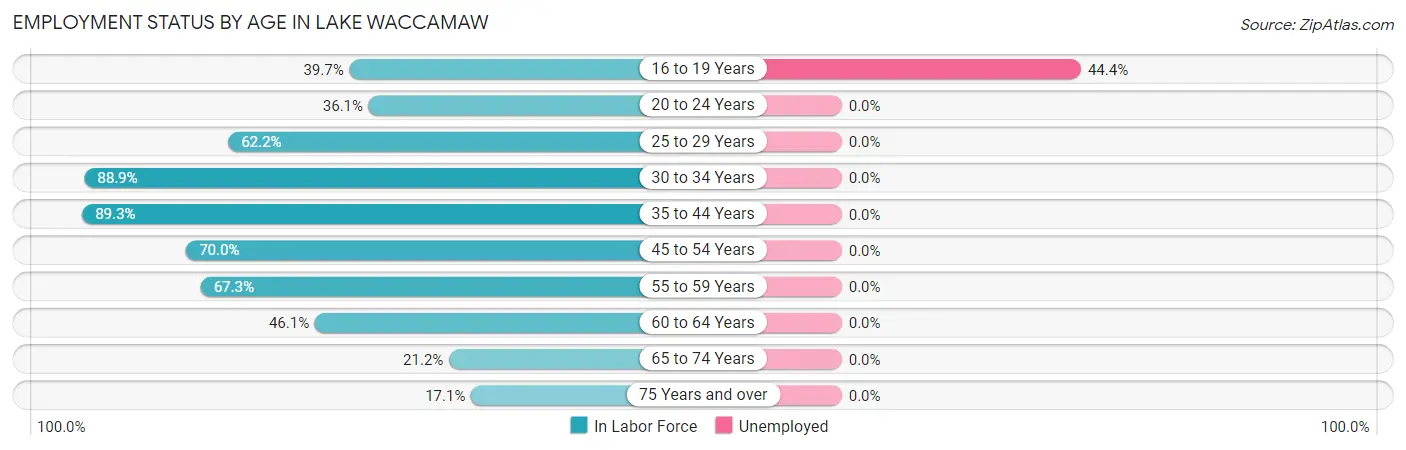
| Age Bracket | In Labor Force | Unemployed |
| 16 to 19 Years | 27 (39.7%) | 12 (44.4%) |
| 20 to 24 Years | 26 (36.1%) | 0 (0.0%) |
| 25 to 29 Years | 23 (62.2%) | 0 (0.0%) |
| 30 to 34 Years | 24 (88.9%) | 0 (0.0%) |
| 35 to 44 Years | 75 (89.3%) | 0 (0.0%) |
| 45 to 54 Years | 166 (70.0%) | 0 (0.0%) |
| 55 to 59 Years | 66 (67.3%) | 0 (0.0%) |
| 60 to 64 Years | 41 (46.1%) | 0 (0.0%) |
| 65 to 74 Years | 39 (21.2%) | 0 (0.0%) |
| 75 Years and over | 53 (17.1%) | 0 (0.0%) |
| Total | 540 (44.8%) | 12 (2.2%) |
Employment Status by Educational Attainment in Lake Waccamaw
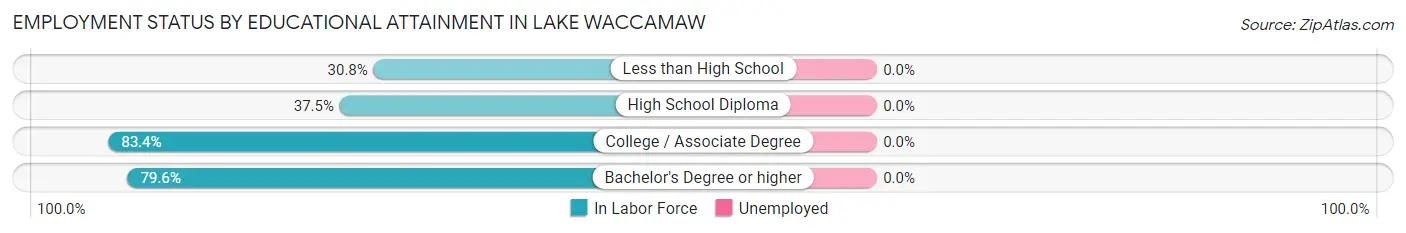
| Educational Attainment | In Labor Force | Unemployed |
| Less than High School | 24 (30.8%) | 0 (0.0%) |
| High School Diploma | 27 (37.5%) | 0 (0.0%) |
| College / Associate Degree | 176 (83.4%) | 0 (0.0%) |
| Bachelor's Degree or higher | 168 (79.6%) | 0 (0.0%) |
| Total | 395 (69.1%) | 0 (0.0%) |
Employment Occupations by Sex in Lake Waccamaw
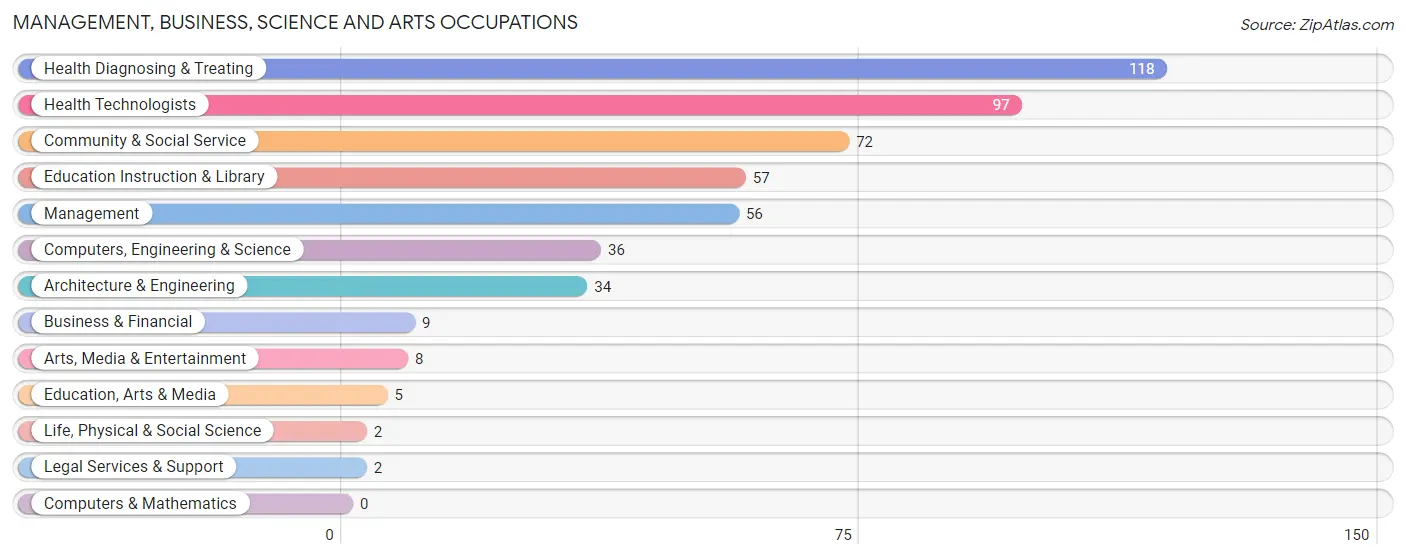
Management, Business, Science and Arts Occupations
The most common Management, Business, Science and Arts occupations in Lake Waccamaw are Health Diagnosing & Treating (118 | 22.4%), Health Technologists (97 | 18.4%), Community & Social Service (72 | 13.6%), Education Instruction & Library (57 | 10.8%), and Management (56 | 10.6%).
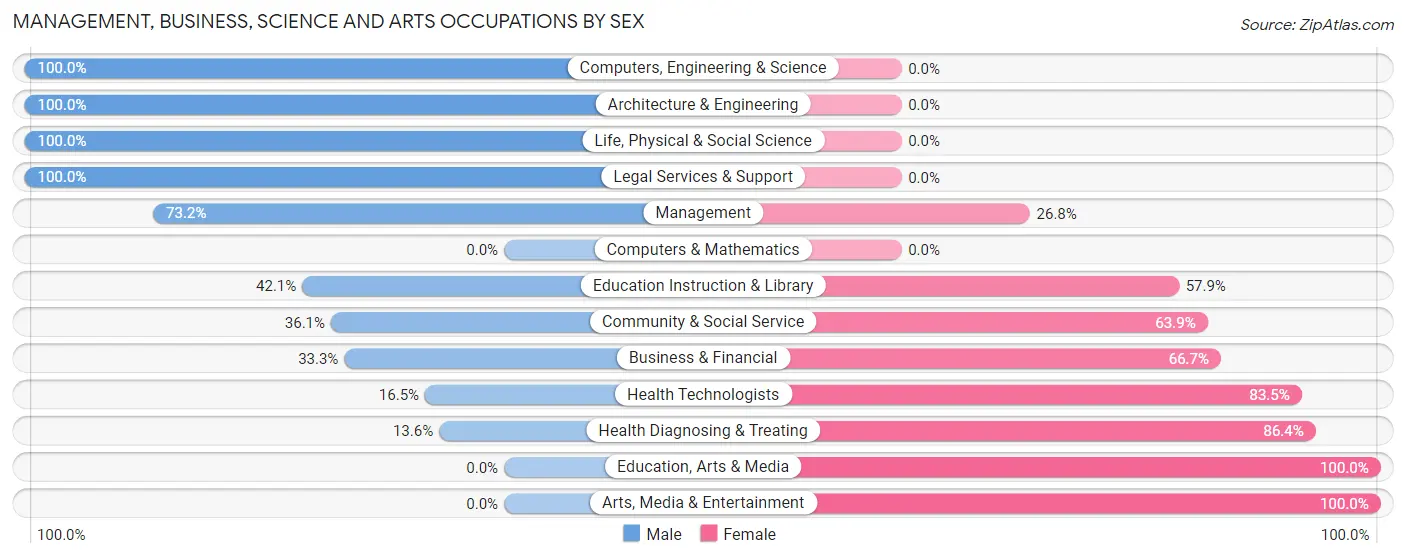
Management, Business, Science and Arts Occupations by Sex
Within the Management, Business, Science and Arts occupations in Lake Waccamaw, the most male-oriented occupations are Computers, Engineering & Science (100.0%), Architecture & Engineering (100.0%), and Life, Physical & Social Science (100.0%), while the most female-oriented occupations are Education, Arts & Media (100.0%), Arts, Media & Entertainment (100.0%), and Health Diagnosing & Treating (86.4%).
| Occupation | Male | Female |
| Management | 41 (73.2%) | 15 (26.8%) |
| Business & Financial | 3 (33.3%) | 6 (66.7%) |
| Computers, Engineering & Science | 36 (100.0%) | 0 (0.0%) |
| Computers & Mathematics | 0 (0.0%) | 0 (0.0%) |
| Architecture & Engineering | 34 (100.0%) | 0 (0.0%) |
| Life, Physical & Social Science | 2 (100.0%) | 0 (0.0%) |
| Community & Social Service | 26 (36.1%) | 46 (63.9%) |
| Education, Arts & Media | 0 (0.0%) | 5 (100.0%) |
| Legal Services & Support | 2 (100.0%) | 0 (0.0%) |
| Education Instruction & Library | 24 (42.1%) | 33 (57.9%) |
| Arts, Media & Entertainment | 0 (0.0%) | 8 (100.0%) |
| Health Diagnosing & Treating | 16 (13.6%) | 102 (86.4%) |
| Health Technologists | 16 (16.5%) | 81 (83.5%) |
| Total (Category) | 122 (41.9%) | 169 (58.1%) |
| Total (Overall) | 248 (47.0%) | 280 (53.0%) |
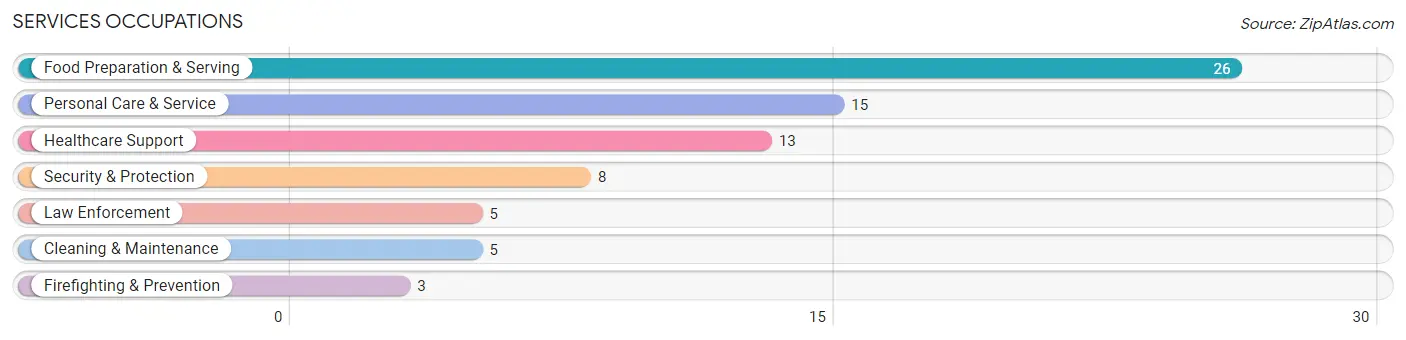
Services Occupations
The most common Services occupations in Lake Waccamaw are Food Preparation & Serving (26 | 4.9%), Personal Care & Service (15 | 2.8%), Healthcare Support (13 | 2.5%), Security & Protection (8 | 1.5%), and Law Enforcement (5 | 0.9%).
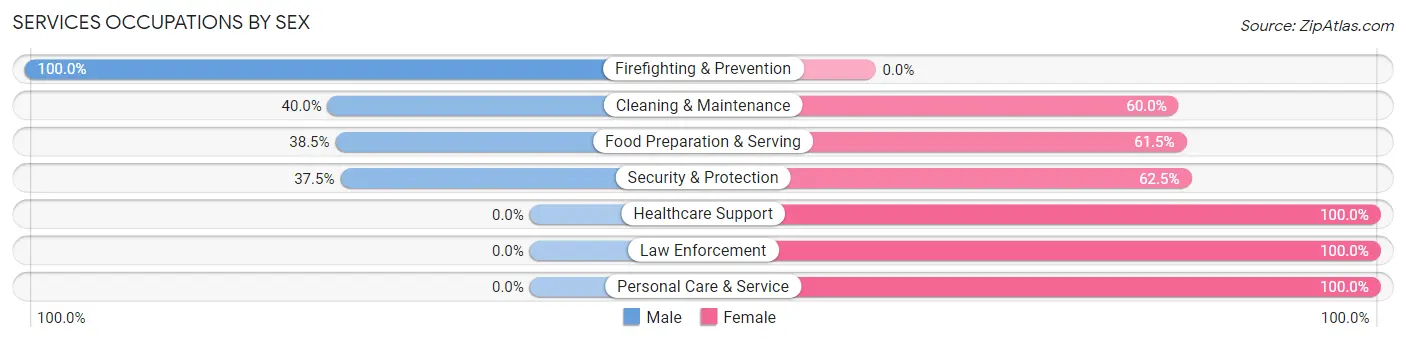
Services Occupations by Sex
Within the Services occupations in Lake Waccamaw, the most male-oriented occupations are Firefighting & Prevention (100.0%), Cleaning & Maintenance (40.0%), and Food Preparation & Serving (38.5%), while the most female-oriented occupations are Healthcare Support (100.0%), Law Enforcement (100.0%), and Personal Care & Service (100.0%).
| Occupation | Male | Female |
| Healthcare Support | 0 (0.0%) | 13 (100.0%) |
| Security & Protection | 3 (37.5%) | 5 (62.5%) |
| Firefighting & Prevention | 3 (100.0%) | 0 (0.0%) |
| Law Enforcement | 0 (0.0%) | 5 (100.0%) |
| Food Preparation & Serving | 10 (38.5%) | 16 (61.5%) |
| Cleaning & Maintenance | 2 (40.0%) | 3 (60.0%) |
| Personal Care & Service | 0 (0.0%) | 15 (100.0%) |
| Total (Category) | 15 (22.4%) | 52 (77.6%) |
| Total (Overall) | 248 (47.0%) | 280 (53.0%) |
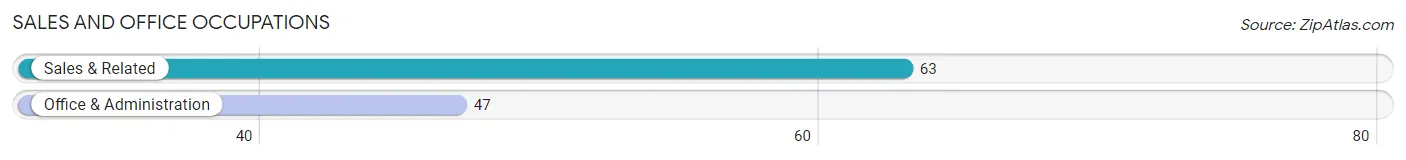
Sales and Office Occupations
The most common Sales and Office occupations in Lake Waccamaw are Sales & Related (63 | 11.9%), and Office & Administration (47 | 8.9%).
Sales and Office Occupations by Sex
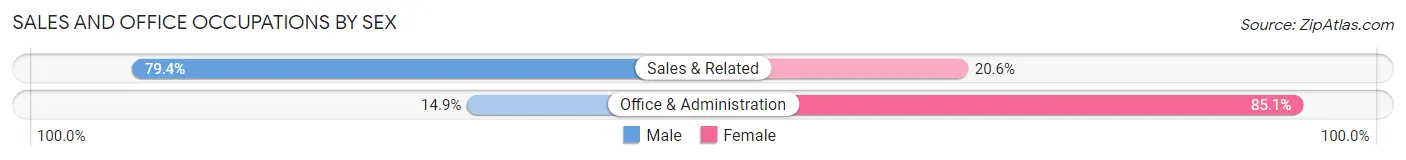
| Occupation | Male | Female |
| Sales & Related | 50 (79.4%) | 13 (20.6%) |
| Office & Administration | 7 (14.9%) | 40 (85.1%) |
| Total (Category) | 57 (51.8%) | 53 (48.2%) |
| Total (Overall) | 248 (47.0%) | 280 (53.0%) |
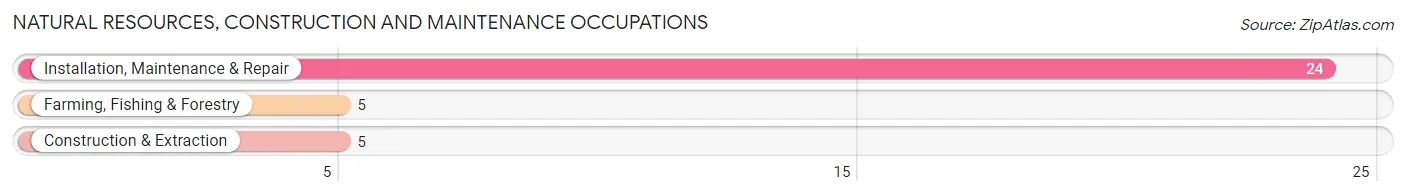
Natural Resources, Construction and Maintenance Occupations
The most common Natural Resources, Construction and Maintenance occupations in Lake Waccamaw are Installation, Maintenance & Repair (24 | 4.5%), Farming, Fishing & Forestry (5 | 0.9%), and Construction & Extraction (5 | 0.9%).
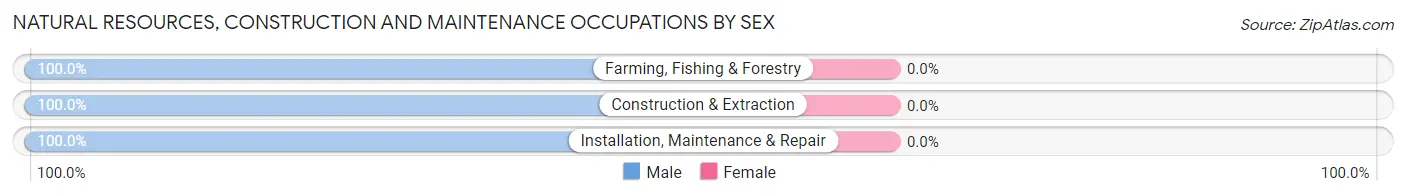
Natural Resources, Construction and Maintenance Occupations by Sex
| Occupation | Male | Female |
| Farming, Fishing & Forestry | 5 (100.0%) | 0 (0.0%) |
| Construction & Extraction | 5 (100.0%) | 0 (0.0%) |
| Installation, Maintenance & Repair | 24 (100.0%) | 0 (0.0%) |
| Total (Category) | 34 (100.0%) | 0 (0.0%) |
| Total (Overall) | 248 (47.0%) | 280 (53.0%) |
Production, Transportation and Moving Occupations
The most common Production, Transportation and Moving occupations in Lake Waccamaw are Production (14 | 2.6%), and Transportation (12 | 2.3%).
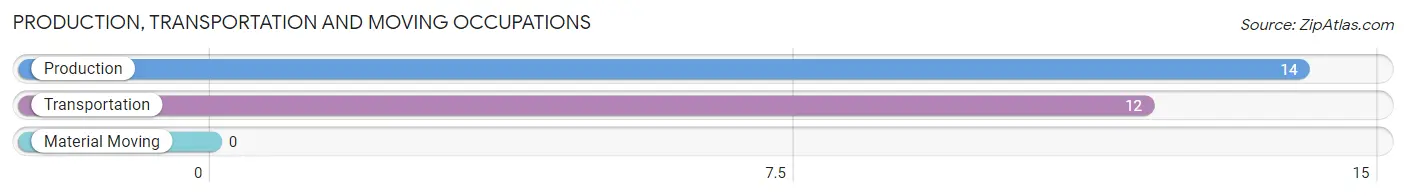
Production, Transportation and Moving Occupations by Sex
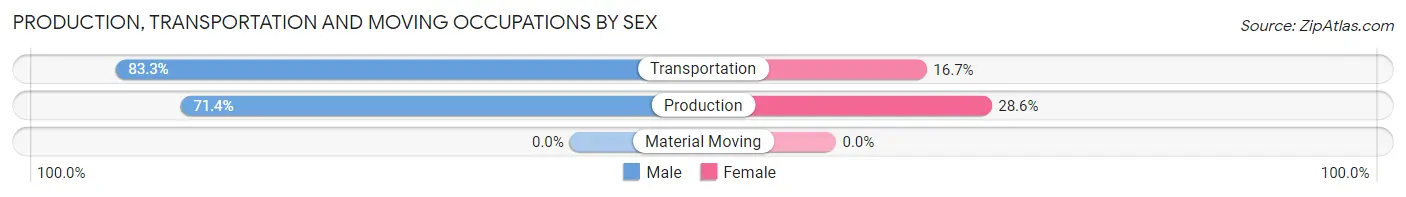
| Occupation | Male | Female |
| Production | 10 (71.4%) | 4 (28.6%) |
| Transportation | 10 (83.3%) | 2 (16.7%) |
| Material Moving | 0 (0.0%) | 0 (0.0%) |
| Total (Category) | 20 (76.9%) | 6 (23.1%) |
| Total (Overall) | 248 (47.0%) | 280 (53.0%) |
Employment Industries by Sex in Lake Waccamaw
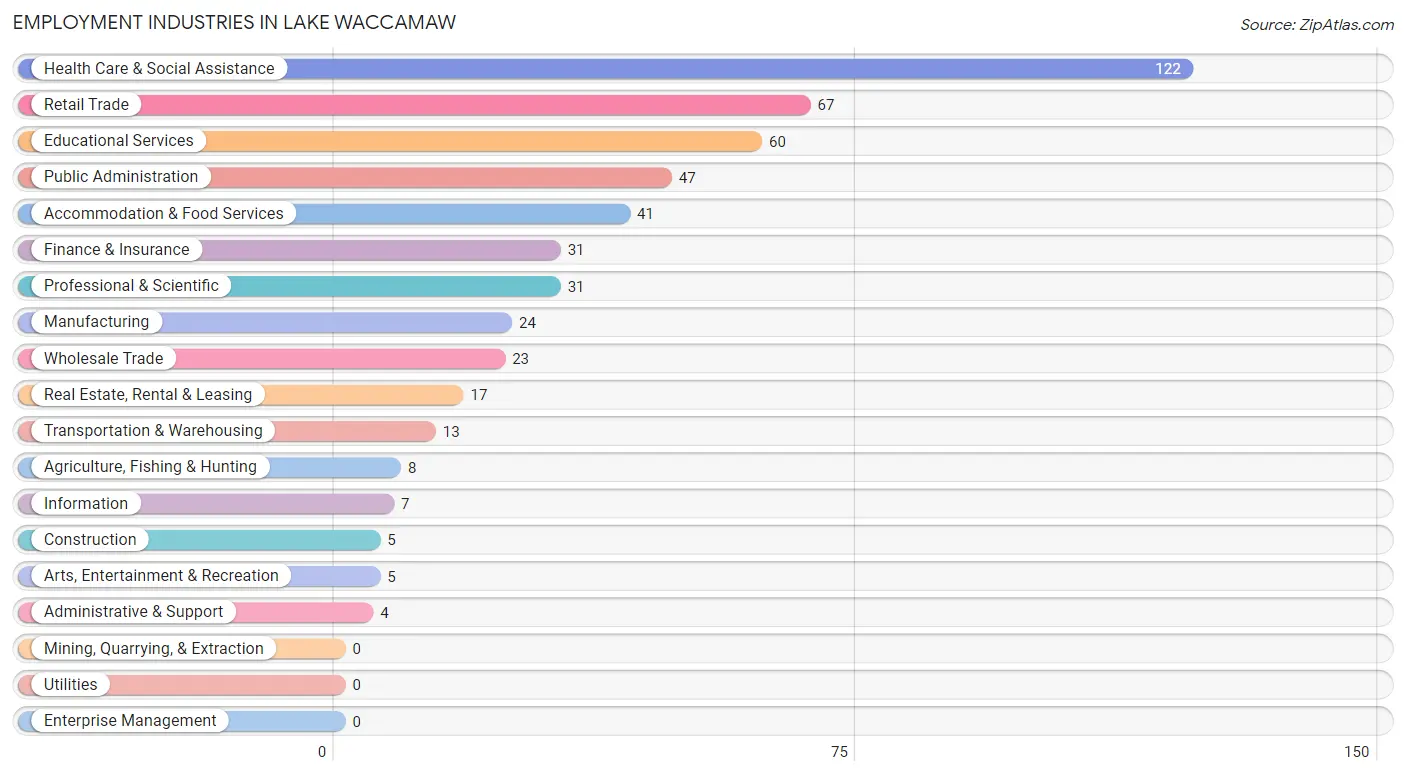
Employment Industries in Lake Waccamaw
The major employment industries in Lake Waccamaw include Health Care & Social Assistance (122 | 23.1%), Retail Trade (67 | 12.7%), Educational Services (60 | 11.4%), Public Administration (47 | 8.9%), and Accommodation & Food Services (41 | 7.8%).
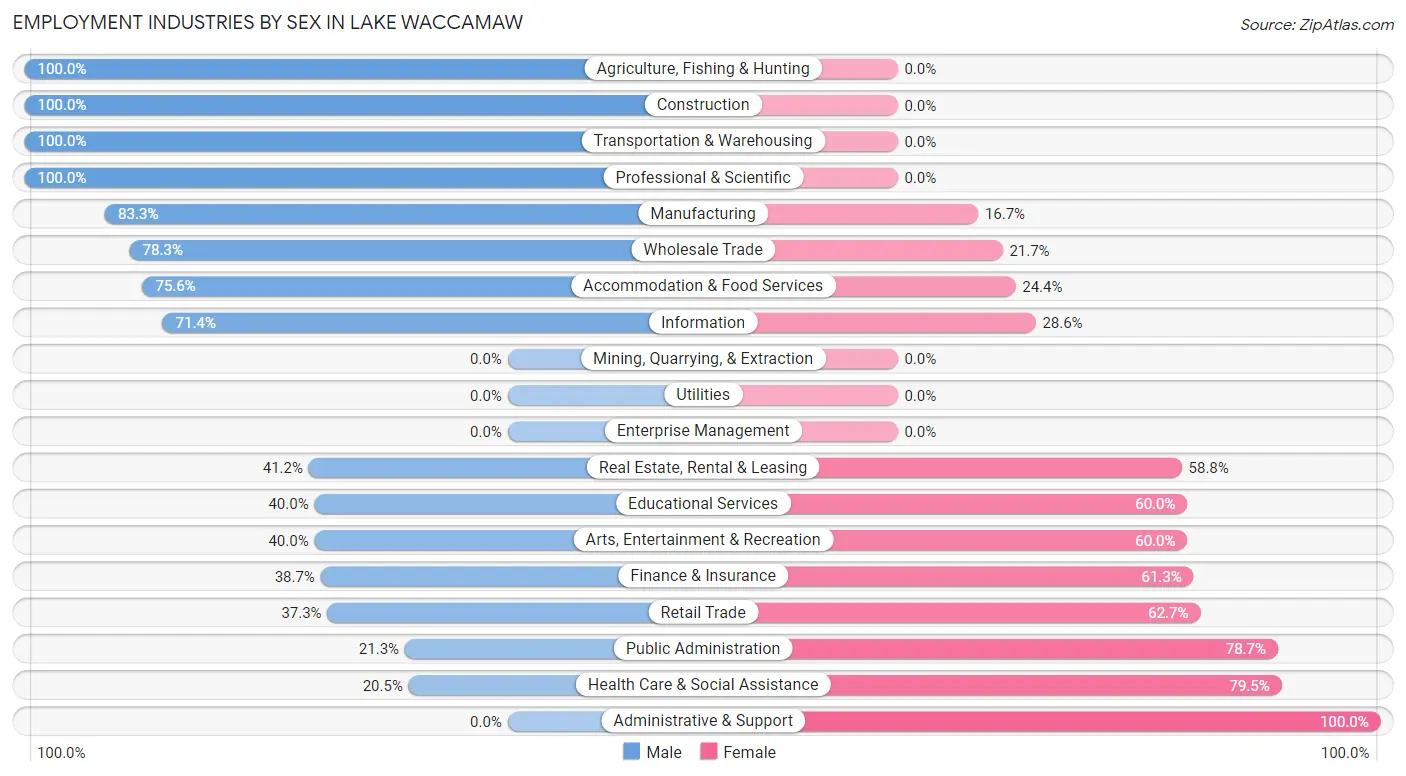
Employment Industries by Sex in Lake Waccamaw
The Lake Waccamaw industries that see more men than women are Agriculture, Fishing & Hunting (100.0%), Construction (100.0%), and Transportation & Warehousing (100.0%), whereas the industries that tend to have a higher number of women are Administrative & Support (100.0%), Health Care & Social Assistance (79.5%), and Public Administration (78.7%).
| Industry | Male | Female |
| Agriculture, Fishing & Hunting | 8 (100.0%) | 0 (0.0%) |
| Mining, Quarrying, & Extraction | 0 (0.0%) | 0 (0.0%) |
| Construction | 5 (100.0%) | 0 (0.0%) |
| Manufacturing | 20 (83.3%) | 4 (16.7%) |
| Wholesale Trade | 18 (78.3%) | 5 (21.7%) |
| Retail Trade | 25 (37.3%) | 42 (62.7%) |
| Transportation & Warehousing | 13 (100.0%) | 0 (0.0%) |
| Utilities | 0 (0.0%) | 0 (0.0%) |
| Information | 5 (71.4%) | 2 (28.6%) |
| Finance & Insurance | 12 (38.7%) | 19 (61.3%) |
| Real Estate, Rental & Leasing | 7 (41.2%) | 10 (58.8%) |
| Professional & Scientific | 31 (100.0%) | 0 (0.0%) |
| Enterprise Management | 0 (0.0%) | 0 (0.0%) |
| Administrative & Support | 0 (0.0%) | 4 (100.0%) |
| Educational Services | 24 (40.0%) | 36 (60.0%) |
| Health Care & Social Assistance | 25 (20.5%) | 97 (79.5%) |
| Arts, Entertainment & Recreation | 2 (40.0%) | 3 (60.0%) |
| Accommodation & Food Services | 31 (75.6%) | 10 (24.4%) |
| Public Administration | 10 (21.3%) | 37 (78.7%) |
| Total | 248 (47.0%) | 280 (53.0%) |
Education in Lake Waccamaw
School Enrollment in Lake Waccamaw
The most common levels of schooling among the 354 students in Lake Waccamaw are high school (122 | 34.5%), middle school (107 | 30.2%), and elementary school (65 | 18.4%).
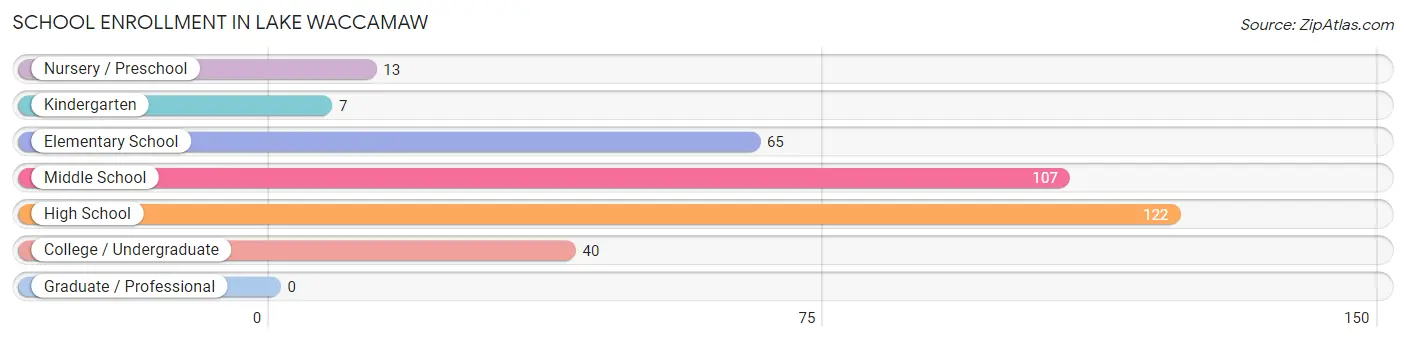
| School Level | # Students | % Students |
| Nursery / Preschool | 13 | 3.7% |
| Kindergarten | 7 | 2.0% |
| Elementary School | 65 | 18.4% |
| Middle School | 107 | 30.2% |
| High School | 122 | 34.5% |
| College / Undergraduate | 40 | 11.3% |
| Graduate / Professional | 0 | 0.0% |
| Total | 354 | 100.0% |
School Enrollment by Age by Funding Source in Lake Waccamaw
Out of a total of 354 students who are enrolled in schools in Lake Waccamaw, 57 (16.1%) attend a private institution, while the remaining 297 (83.9%) are enrolled in public schools. The age group of 3 to 4 year olds has the highest likelihood of being enrolled in private schools, with 5 (38.5% in the age bracket) enrolled. Conversely, the age group of 18 to 19 year olds has the lowest likelihood of being enrolled in a private school, with 28 (100.0% in the age bracket) attending a public institution.
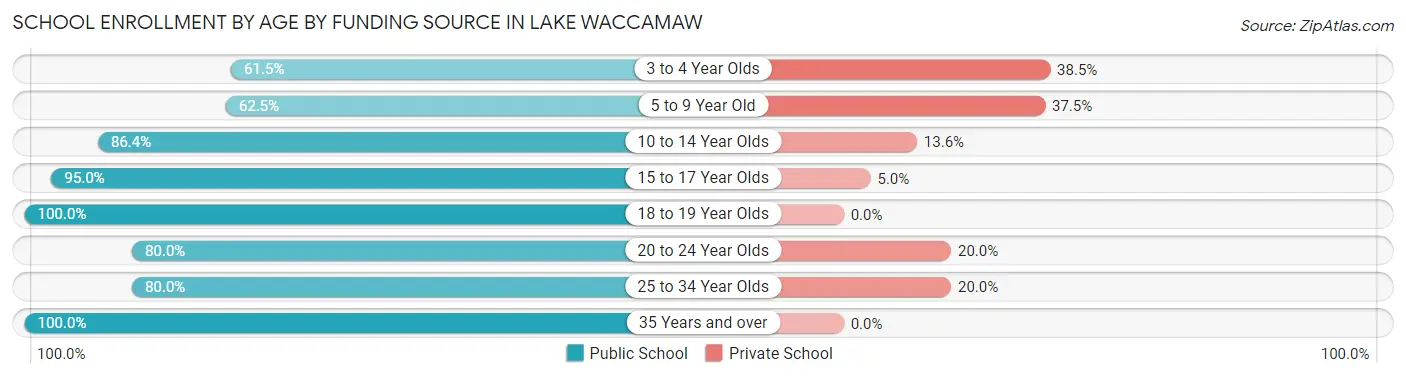
| Age Bracket | Public School | Private School |
| 3 to 4 Year Olds | 8 (61.5%) | 5 (38.5%) |
| 5 to 9 Year Old | 45 (62.5%) | 27 (37.5%) |
| 10 to 14 Year Olds | 114 (86.4%) | 18 (13.6%) |
| 15 to 17 Year Olds | 57 (95.0%) | 3 (5.0%) |
| 18 to 19 Year Olds | 28 (100.0%) | 0 (0.0%) |
| 20 to 24 Year Olds | 12 (80.0%) | 3 (20.0%) |
| 25 to 34 Year Olds | 4 (80.0%) | 1 (20.0%) |
| 35 Years and over | 29 (100.0%) | 0 (0.0%) |
| Total | 297 (83.9%) | 57 (16.1%) |
Educational Attainment by Field of Study in Lake Waccamaw
Business (88 | 22.9%), education (88 | 22.9%), science & technology (51 | 13.3%), bio, nature & agricultural (34 | 8.8%), and liberal arts & history (24 | 6.2%) are the most common fields of study among 384 individuals in Lake Waccamaw who have obtained a bachelor's degree or higher.
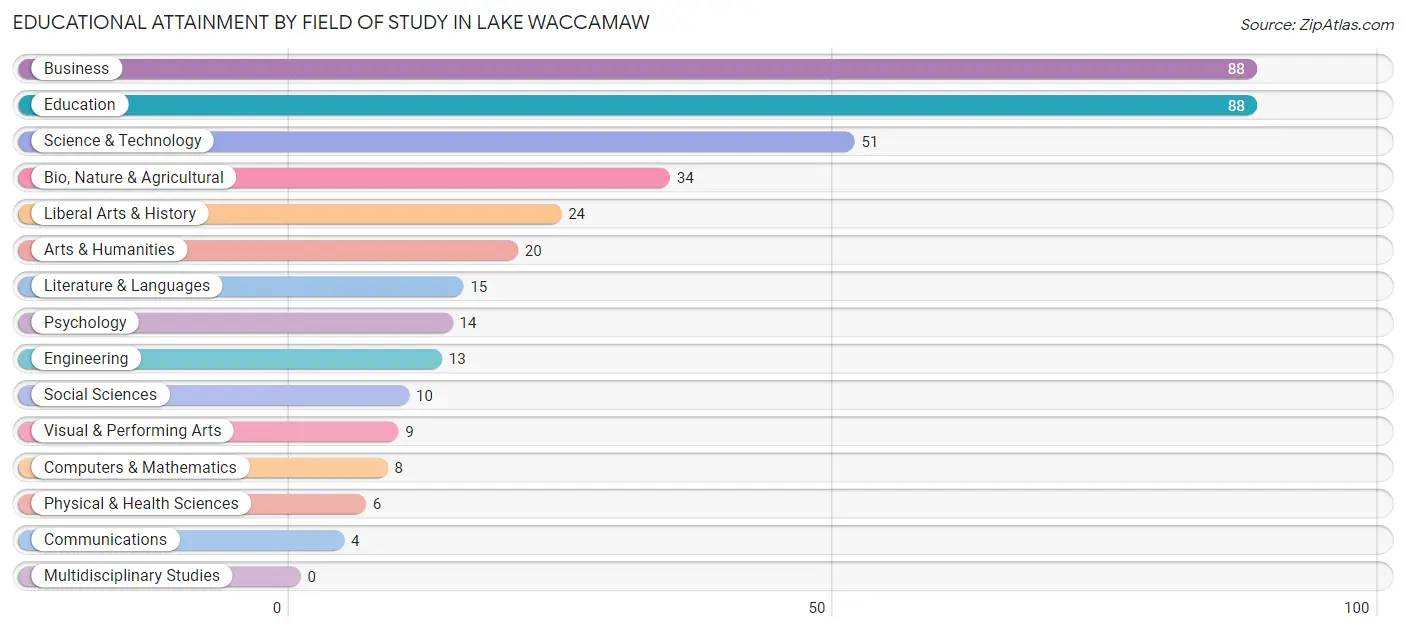
| Field of Study | # Graduates | % Graduates |
| Computers & Mathematics | 8 | 2.1% |
| Bio, Nature & Agricultural | 34 | 8.8% |
| Physical & Health Sciences | 6 | 1.6% |
| Psychology | 14 | 3.6% |
| Social Sciences | 10 | 2.6% |
| Engineering | 13 | 3.4% |
| Multidisciplinary Studies | 0 | 0.0% |
| Science & Technology | 51 | 13.3% |
| Business | 88 | 22.9% |
| Education | 88 | 22.9% |
| Literature & Languages | 15 | 3.9% |
| Liberal Arts & History | 24 | 6.2% |
| Visual & Performing Arts | 9 | 2.3% |
| Communications | 4 | 1.0% |
| Arts & Humanities | 20 | 5.2% |
| Total | 384 | 100.0% |
Transportation & Commute in Lake Waccamaw
Vehicle Availability by Sex in Lake Waccamaw
The most prevalent vehicle ownership categories in Lake Waccamaw are males with 2 vehicles (122, accounting for 50.0%) and females with 2 vehicles (127, making up 44.2%).
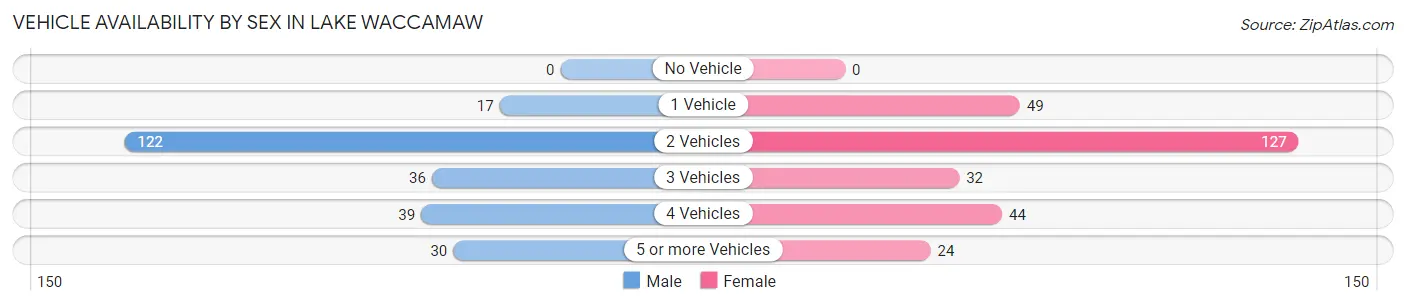
| Vehicles Available | Male | Female |
| No Vehicle | 0 (0.0%) | 0 (0.0%) |
| 1 Vehicle | 17 (7.0%) | 49 (17.7%) |
| 2 Vehicles | 122 (50.0%) | 127 (46.0%) |
| 3 Vehicles | 36 (14.7%) | 32 (11.6%) |
| 4 Vehicles | 39 (16.0%) | 44 (15.9%) |
| 5 or more Vehicles | 30 (12.3%) | 24 (8.7%) |
| Total | 244 (100.0%) | 276 (100.0%) |
Commute Time in Lake Waccamaw
The most frequently occuring commute durations in Lake Waccamaw are 20 to 24 minutes (84 commuters, 17.2%), 45 to 59 minutes (70 commuters, 14.4%), and 10 to 14 minutes (61 commuters, 12.5%).
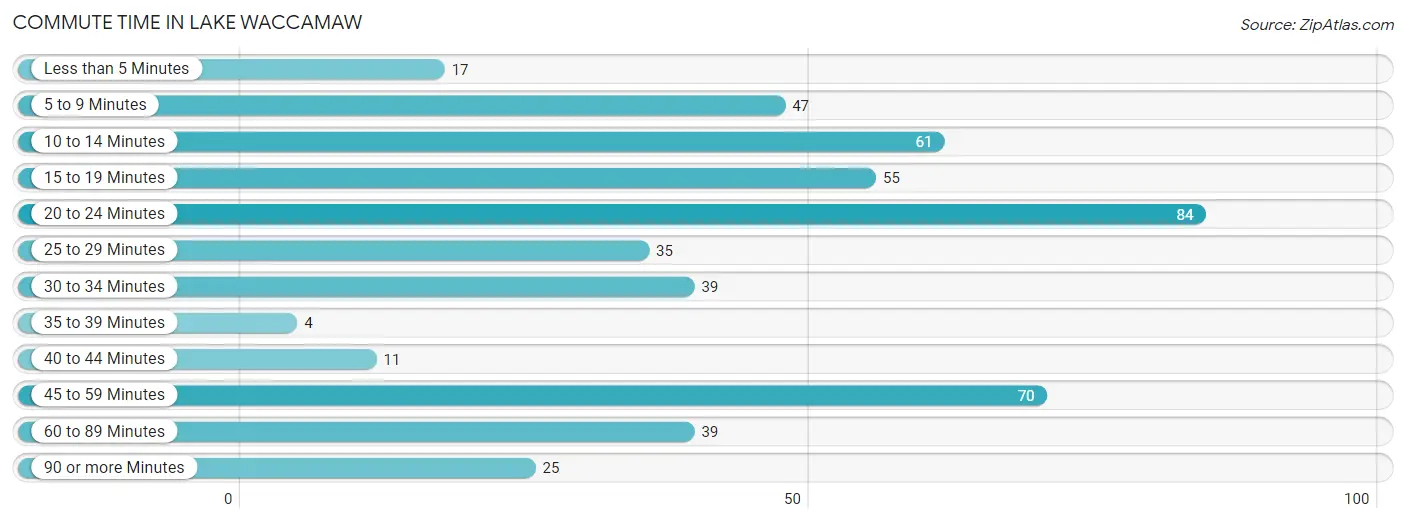
| Commute Time | # Commuters | % Commuters |
| Less than 5 Minutes | 17 | 3.5% |
| 5 to 9 Minutes | 47 | 9.7% |
| 10 to 14 Minutes | 61 | 12.5% |
| 15 to 19 Minutes | 55 | 11.3% |
| 20 to 24 Minutes | 84 | 17.2% |
| 25 to 29 Minutes | 35 | 7.2% |
| 30 to 34 Minutes | 39 | 8.0% |
| 35 to 39 Minutes | 4 | 0.8% |
| 40 to 44 Minutes | 11 | 2.3% |
| 45 to 59 Minutes | 70 | 14.4% |
| 60 to 89 Minutes | 39 | 8.0% |
| 90 or more Minutes | 25 | 5.1% |
Commute Time by Sex in Lake Waccamaw
The most common commute times in Lake Waccamaw are 10 to 14 minutes (61 commuters, 25.2%) for males and 20 to 24 minutes (67 commuters, 27.4%) for females.
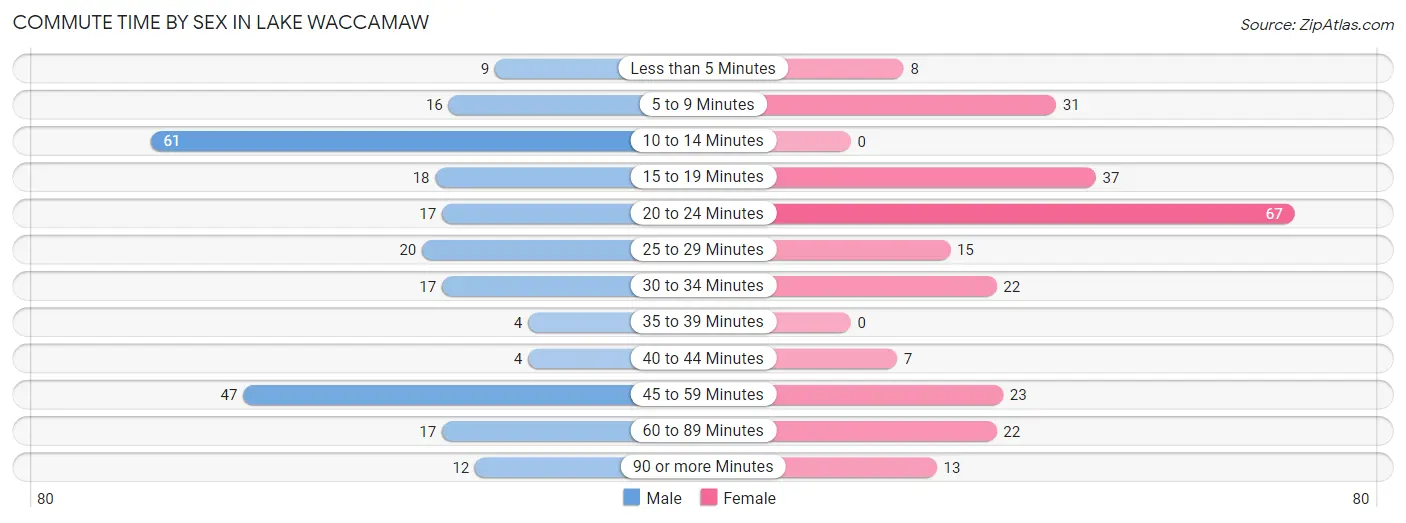
| Commute Time | Male | Female |
| Less than 5 Minutes | 9 (3.7%) | 8 (3.3%) |
| 5 to 9 Minutes | 16 (6.6%) | 31 (12.7%) |
| 10 to 14 Minutes | 61 (25.2%) | 0 (0.0%) |
| 15 to 19 Minutes | 18 (7.4%) | 37 (15.1%) |
| 20 to 24 Minutes | 17 (7.0%) | 67 (27.4%) |
| 25 to 29 Minutes | 20 (8.3%) | 15 (6.1%) |
| 30 to 34 Minutes | 17 (7.0%) | 22 (9.0%) |
| 35 to 39 Minutes | 4 (1.7%) | 0 (0.0%) |
| 40 to 44 Minutes | 4 (1.7%) | 7 (2.9%) |
| 45 to 59 Minutes | 47 (19.4%) | 23 (9.4%) |
| 60 to 89 Minutes | 17 (7.0%) | 22 (9.0%) |
| 90 or more Minutes | 12 (5.0%) | 13 (5.3%) |
Time of Departure to Work by Sex in Lake Waccamaw
The most frequent times of departure to work in Lake Waccamaw are 7:30 AM to 7:59 AM (72, 29.7%) for males and 7:00 AM to 7:29 AM (66, 26.9%) for females.
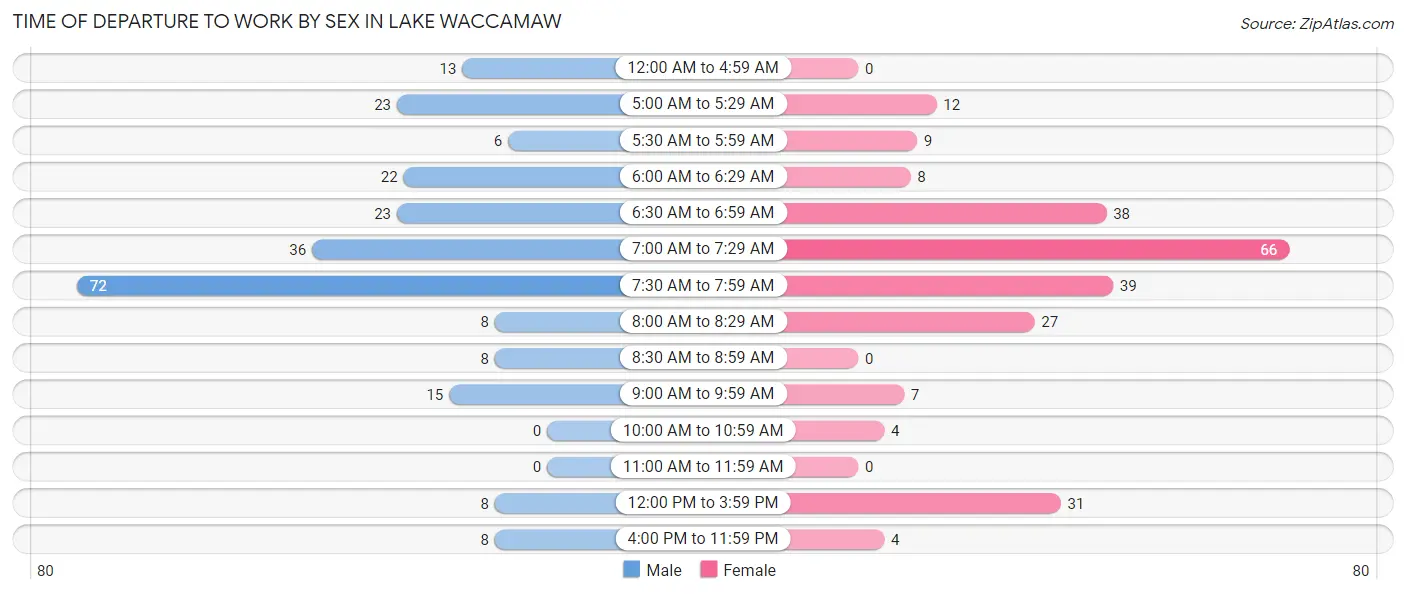
| Time of Departure | Male | Female |
| 12:00 AM to 4:59 AM | 13 (5.4%) | 0 (0.0%) |
| 5:00 AM to 5:29 AM | 23 (9.5%) | 12 (4.9%) |
| 5:30 AM to 5:59 AM | 6 (2.5%) | 9 (3.7%) |
| 6:00 AM to 6:29 AM | 22 (9.1%) | 8 (3.3%) |
| 6:30 AM to 6:59 AM | 23 (9.5%) | 38 (15.5%) |
| 7:00 AM to 7:29 AM | 36 (14.9%) | 66 (26.9%) |
| 7:30 AM to 7:59 AM | 72 (29.7%) | 39 (15.9%) |
| 8:00 AM to 8:29 AM | 8 (3.3%) | 27 (11.0%) |
| 8:30 AM to 8:59 AM | 8 (3.3%) | 0 (0.0%) |
| 9:00 AM to 9:59 AM | 15 (6.2%) | 7 (2.9%) |
| 10:00 AM to 10:59 AM | 0 (0.0%) | 4 (1.6%) |
| 11:00 AM to 11:59 AM | 0 (0.0%) | 0 (0.0%) |
| 12:00 PM to 3:59 PM | 8 (3.3%) | 31 (12.7%) |
| 4:00 PM to 11:59 PM | 8 (3.3%) | 4 (1.6%) |
| Total | 242 (100.0%) | 245 (100.0%) |
Housing Occupancy in Lake Waccamaw
Occupancy by Ownership in Lake Waccamaw
Of the total 555 dwellings in Lake Waccamaw, owner-occupied units account for 461 (83.1%), while renter-occupied units make up 94 (16.9%).
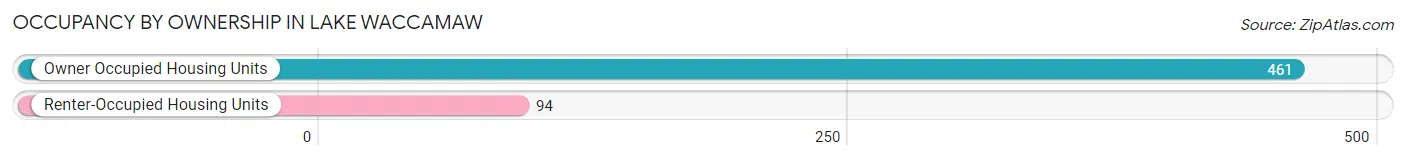
| Occupancy | # Housing Units | % Housing Units |
| Owner Occupied Housing Units | 461 | 83.1% |
| Renter-Occupied Housing Units | 94 | 16.9% |
| Total Occupied Housing Units | 555 | 100.0% |
Occupancy by Household Size in Lake Waccamaw
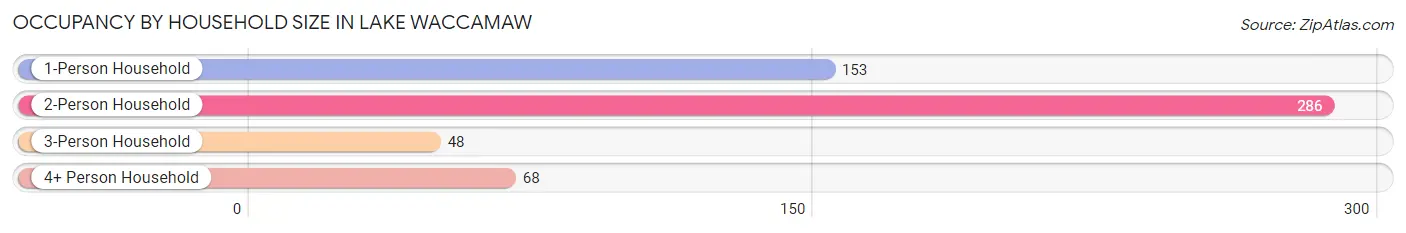
| Household Size | # Housing Units | % Housing Units |
| 1-Person Household | 153 | 27.6% |
| 2-Person Household | 286 | 51.5% |
| 3-Person Household | 48 | 8.6% |
| 4+ Person Household | 68 | 12.2% |
| Total Housing Units | 555 | 100.0% |
Occupancy by Ownership by Household Size in Lake Waccamaw
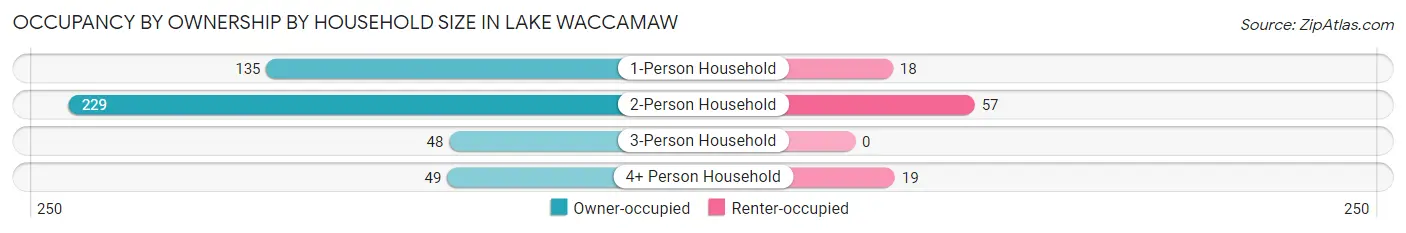
| Household Size | Owner-occupied | Renter-occupied |
| 1-Person Household | 135 (88.2%) | 18 (11.8%) |
| 2-Person Household | 229 (80.1%) | 57 (19.9%) |
| 3-Person Household | 48 (100.0%) | 0 (0.0%) |
| 4+ Person Household | 49 (72.1%) | 19 (27.9%) |
| Total Housing Units | 461 (83.1%) | 94 (16.9%) |
Occupancy by Educational Attainment in Lake Waccamaw
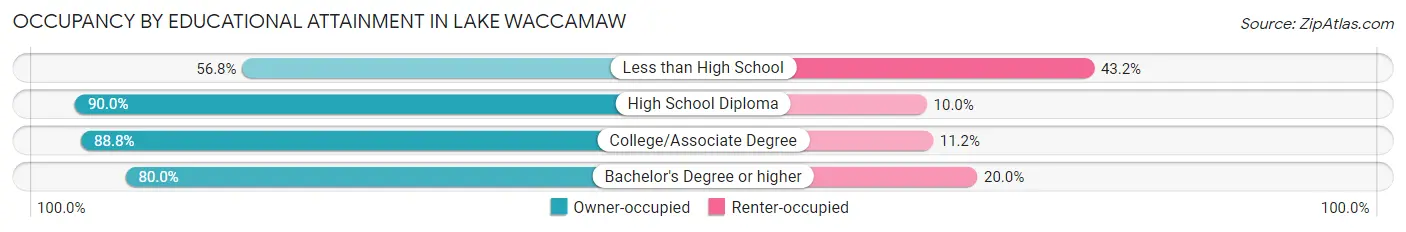
| Household Size | Owner-occupied | Renter-occupied |
| Less than High School | 25 (56.8%) | 19 (43.2%) |
| High School Diploma | 90 (90.0%) | 10 (10.0%) |
| College/Associate Degree | 174 (88.8%) | 22 (11.2%) |
| Bachelor's Degree or higher | 172 (80.0%) | 43 (20.0%) |
Occupancy by Age of Householder in Lake Waccamaw
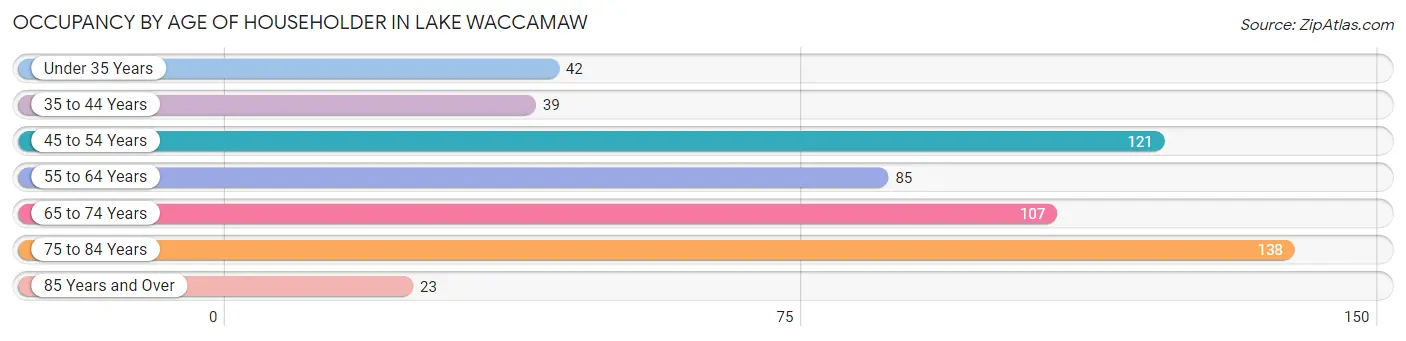
| Age Bracket | # Households | % Households |
| Under 35 Years | 42 | 7.6% |
| 35 to 44 Years | 39 | 7.0% |
| 45 to 54 Years | 121 | 21.8% |
| 55 to 64 Years | 85 | 15.3% |
| 65 to 74 Years | 107 | 19.3% |
| 75 to 84 Years | 138 | 24.9% |
| 85 Years and Over | 23 | 4.1% |
| Total | 555 | 100.0% |
Housing Finances in Lake Waccamaw
Median Income by Occupancy in Lake Waccamaw
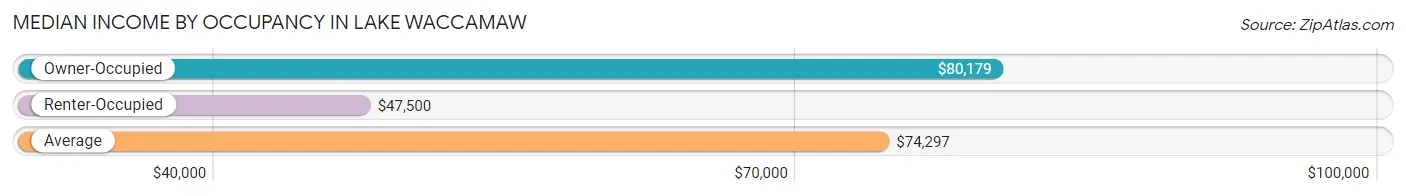
| Occupancy Type | # Households | Median Income |
| Owner-Occupied | 461 (83.1%) | $80,179 |
| Renter-Occupied | 94 (16.9%) | $47,500 |
| Average | 555 (100.0%) | $74,297 |
Occupancy by Householder Income Bracket in Lake Waccamaw
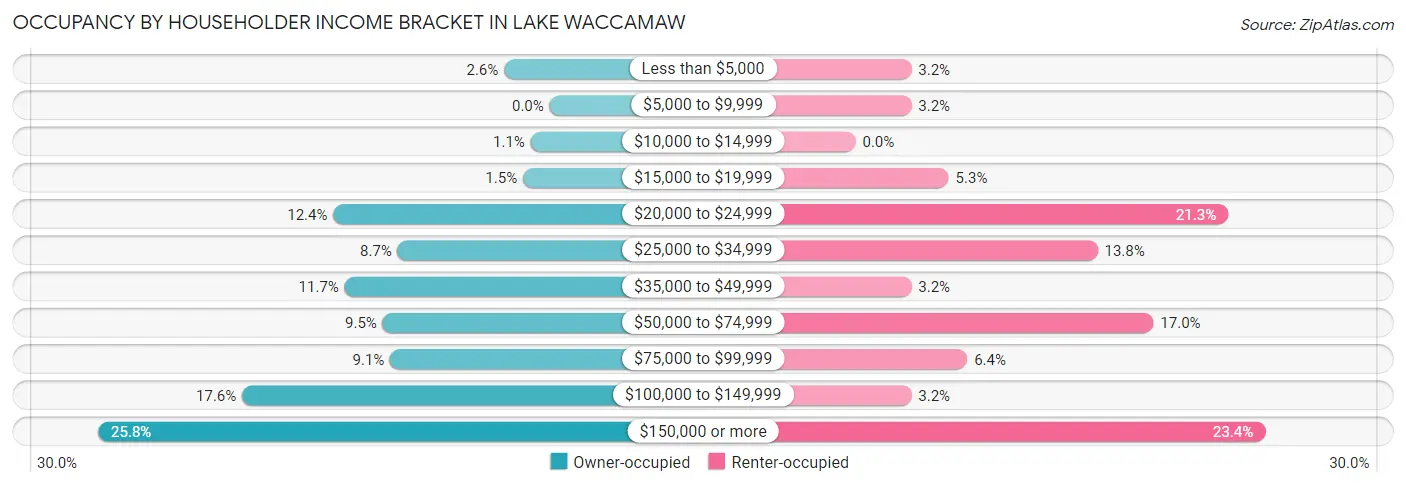
| Income Bracket | Owner-occupied | Renter-occupied |
| Less than $5,000 | 12 (2.6%) | 3 (3.2%) |
| $5,000 to $9,999 | 0 (0.0%) | 3 (3.2%) |
| $10,000 to $14,999 | 5 (1.1%) | 0 (0.0%) |
| $15,000 to $19,999 | 7 (1.5%) | 5 (5.3%) |
| $20,000 to $24,999 | 57 (12.4%) | 20 (21.3%) |
| $25,000 to $34,999 | 40 (8.7%) | 13 (13.8%) |
| $35,000 to $49,999 | 54 (11.7%) | 3 (3.2%) |
| $50,000 to $74,999 | 44 (9.5%) | 16 (17.0%) |
| $75,000 to $99,999 | 42 (9.1%) | 6 (6.4%) |
| $100,000 to $149,999 | 81 (17.6%) | 3 (3.2%) |
| $150,000 or more | 119 (25.8%) | 22 (23.4%) |
| Total | 461 (100.0%) | 94 (100.0%) |
Monthly Housing Cost Tiers in Lake Waccamaw
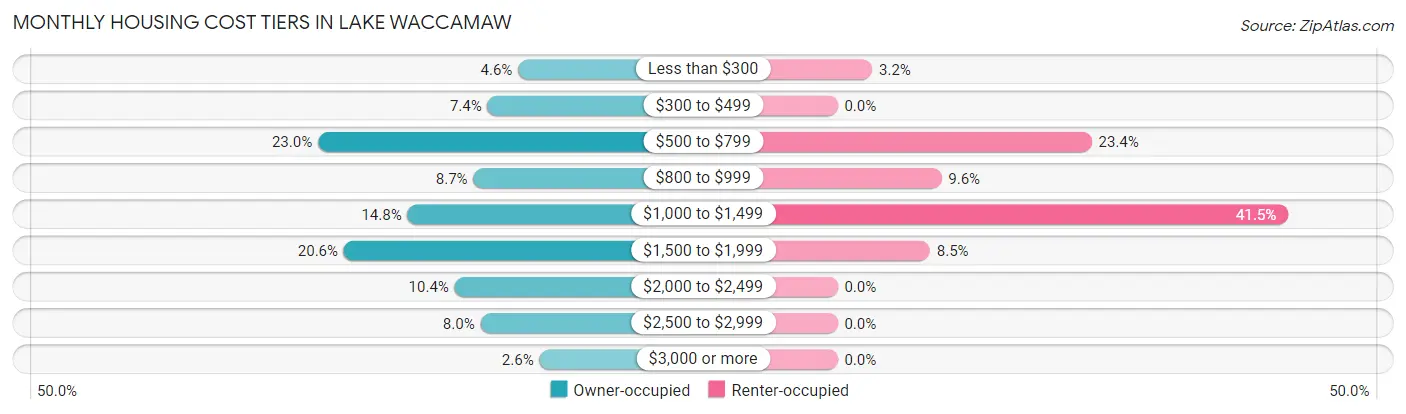
| Monthly Cost | Owner-occupied | Renter-occupied |
| Less than $300 | 21 (4.6%) | 3 (3.2%) |
| $300 to $499 | 34 (7.4%) | 0 (0.0%) |
| $500 to $799 | 106 (23.0%) | 22 (23.4%) |
| $800 to $999 | 40 (8.7%) | 9 (9.6%) |
| $1,000 to $1,499 | 68 (14.7%) | 39 (41.5%) |
| $1,500 to $1,999 | 95 (20.6%) | 8 (8.5%) |
| $2,000 to $2,499 | 48 (10.4%) | 0 (0.0%) |
| $2,500 to $2,999 | 37 (8.0%) | 0 (0.0%) |
| $3,000 or more | 12 (2.6%) | 0 (0.0%) |
| Total | 461 (100.0%) | 94 (100.0%) |
Physical Housing Characteristics in Lake Waccamaw
Housing Structures in Lake Waccamaw
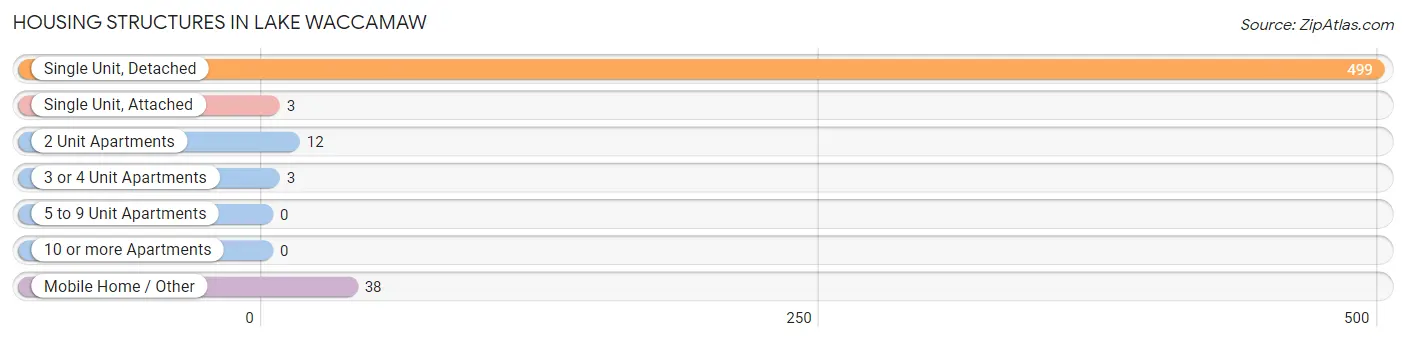
| Structure Type | # Housing Units | % Housing Units |
| Single Unit, Detached | 499 | 89.9% |
| Single Unit, Attached | 3 | 0.5% |
| 2 Unit Apartments | 12 | 2.2% |
| 3 or 4 Unit Apartments | 3 | 0.5% |
| 5 to 9 Unit Apartments | 0 | 0.0% |
| 10 or more Apartments | 0 | 0.0% |
| Mobile Home / Other | 38 | 6.9% |
| Total | 555 | 100.0% |
Housing Structures by Occupancy in Lake Waccamaw
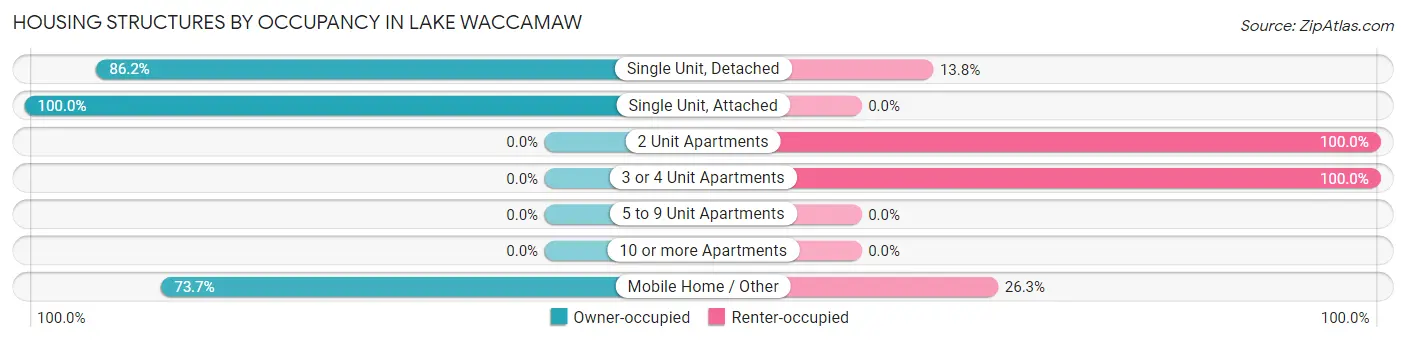
| Structure Type | Owner-occupied | Renter-occupied |
| Single Unit, Detached | 430 (86.2%) | 69 (13.8%) |
| Single Unit, Attached | 3 (100.0%) | 0 (0.0%) |
| 2 Unit Apartments | 0 (0.0%) | 12 (100.0%) |
| 3 or 4 Unit Apartments | 0 (0.0%) | 3 (100.0%) |
| 5 to 9 Unit Apartments | 0 (0.0%) | 0 (0.0%) |
| 10 or more Apartments | 0 (0.0%) | 0 (0.0%) |
| Mobile Home / Other | 28 (73.7%) | 10 (26.3%) |
| Total | 461 (83.1%) | 94 (16.9%) |
Housing Structures by Number of Rooms in Lake Waccamaw
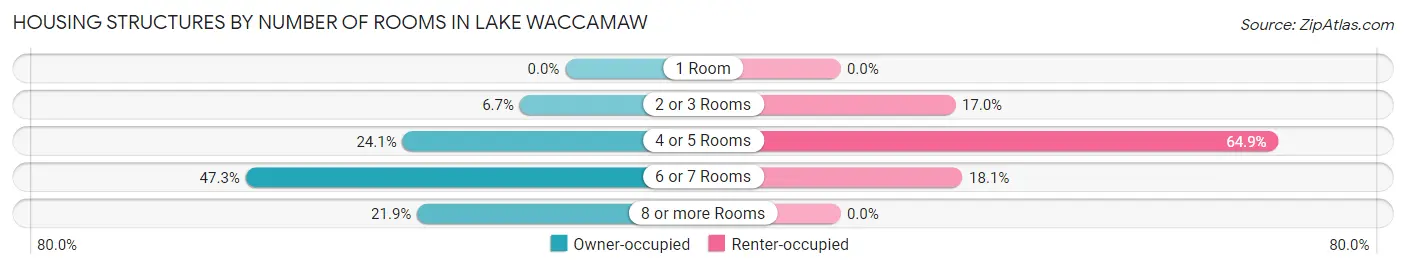
| Number of Rooms | Owner-occupied | Renter-occupied |
| 1 Room | 0 (0.0%) | 0 (0.0%) |
| 2 or 3 Rooms | 31 (6.7%) | 16 (17.0%) |
| 4 or 5 Rooms | 111 (24.1%) | 61 (64.9%) |
| 6 or 7 Rooms | 218 (47.3%) | 17 (18.1%) |
| 8 or more Rooms | 101 (21.9%) | 0 (0.0%) |
| Total | 461 (100.0%) | 94 (100.0%) |
Housing Structure by Heating Type in Lake Waccamaw
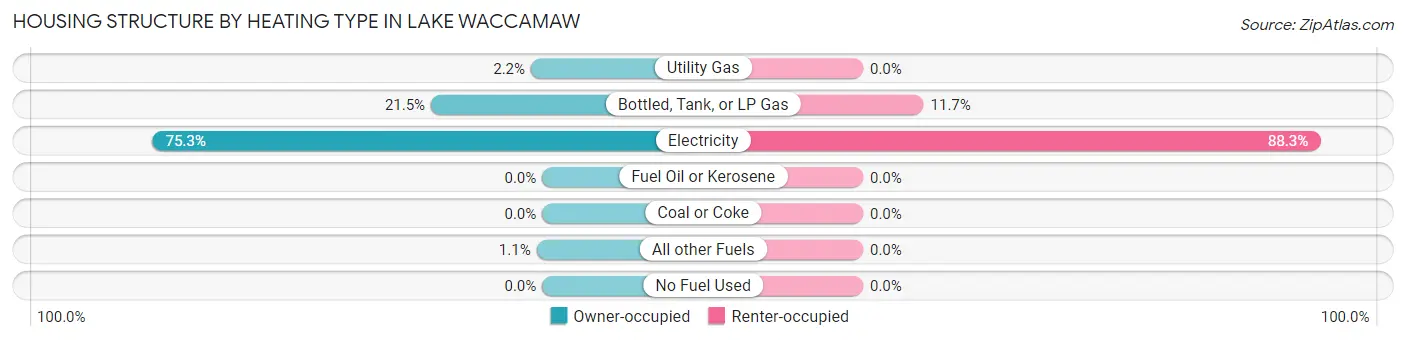
| Heating Type | Owner-occupied | Renter-occupied |
| Utility Gas | 10 (2.2%) | 0 (0.0%) |
| Bottled, Tank, or LP Gas | 99 (21.5%) | 11 (11.7%) |
| Electricity | 347 (75.3%) | 83 (88.3%) |
| Fuel Oil or Kerosene | 0 (0.0%) | 0 (0.0%) |
| Coal or Coke | 0 (0.0%) | 0 (0.0%) |
| All other Fuels | 5 (1.1%) | 0 (0.0%) |
| No Fuel Used | 0 (0.0%) | 0 (0.0%) |
| Total | 461 (100.0%) | 94 (100.0%) |
Household Vehicle Usage in Lake Waccamaw
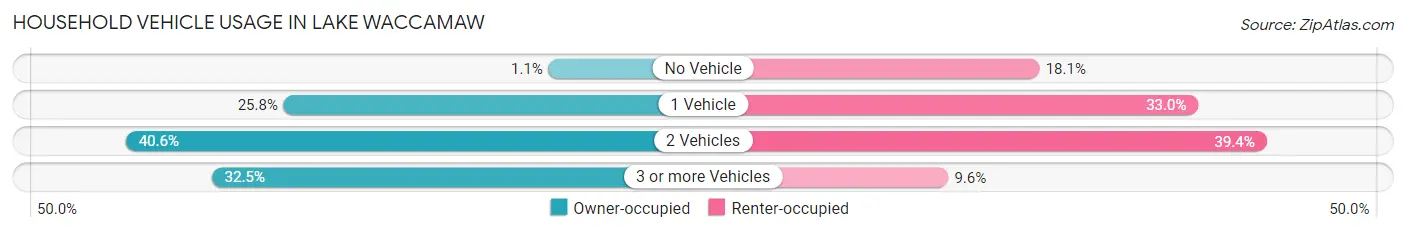
| Vehicles per Household | Owner-occupied | Renter-occupied |
| No Vehicle | 5 (1.1%) | 17 (18.1%) |
| 1 Vehicle | 119 (25.8%) | 31 (33.0%) |
| 2 Vehicles | 187 (40.6%) | 37 (39.4%) |
| 3 or more Vehicles | 150 (32.5%) | 9 (9.6%) |
| Total | 461 (100.0%) | 94 (100.0%) |
Real Estate & Mortgages in Lake Waccamaw
Real Estate and Mortgage Overview in Lake Waccamaw
| Characteristic | Without Mortgage | With Mortgage |
| Housing Units | 193 | 268 |
| Median Property Value | $276,700 | $311,300 |
| Median Household Income | $70,625 | $66 |
| Monthly Housing Costs | $594 | $12 |
| Real Estate Taxes | $2,387 | $0 |
Property Value by Mortgage Status in Lake Waccamaw
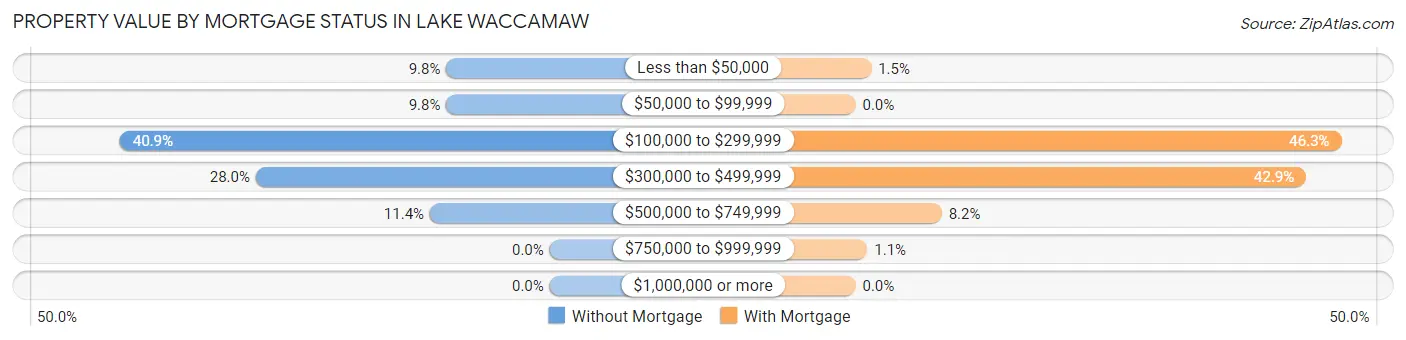
| Property Value | Without Mortgage | With Mortgage |
| Less than $50,000 | 19 (9.8%) | 4 (1.5%) |
| $50,000 to $99,999 | 19 (9.8%) | 0 (0.0%) |
| $100,000 to $299,999 | 79 (40.9%) | 124 (46.3%) |
| $300,000 to $499,999 | 54 (28.0%) | 115 (42.9%) |
| $500,000 to $749,999 | 22 (11.4%) | 22 (8.2%) |
| $750,000 to $999,999 | 0 (0.0%) | 3 (1.1%) |
| $1,000,000 or more | 0 (0.0%) | 0 (0.0%) |
| Total | 193 (100.0%) | 268 (100.0%) |
Household Income by Mortgage Status in Lake Waccamaw
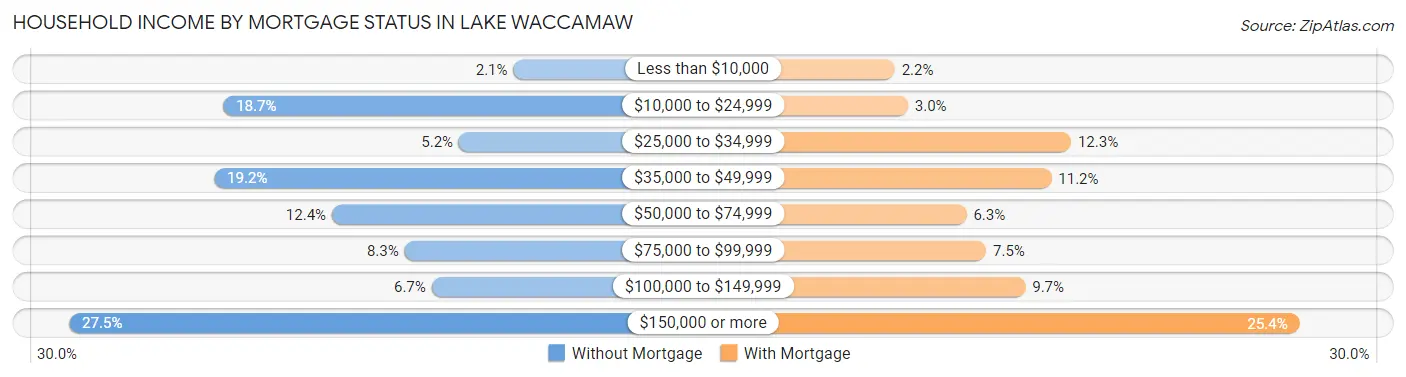
| Household Income | Without Mortgage | With Mortgage |
| Less than $10,000 | 4 (2.1%) | 6 (2.2%) |
| $10,000 to $24,999 | 36 (18.6%) | 8 (3.0%) |
| $25,000 to $34,999 | 10 (5.2%) | 33 (12.3%) |
| $35,000 to $49,999 | 37 (19.2%) | 30 (11.2%) |
| $50,000 to $74,999 | 24 (12.4%) | 17 (6.3%) |
| $75,000 to $99,999 | 16 (8.3%) | 20 (7.5%) |
| $100,000 to $149,999 | 13 (6.7%) | 26 (9.7%) |
| $150,000 or more | 53 (27.5%) | 68 (25.4%) |
| Total | 193 (100.0%) | 268 (100.0%) |
Property Value to Household Income Ratio in Lake Waccamaw
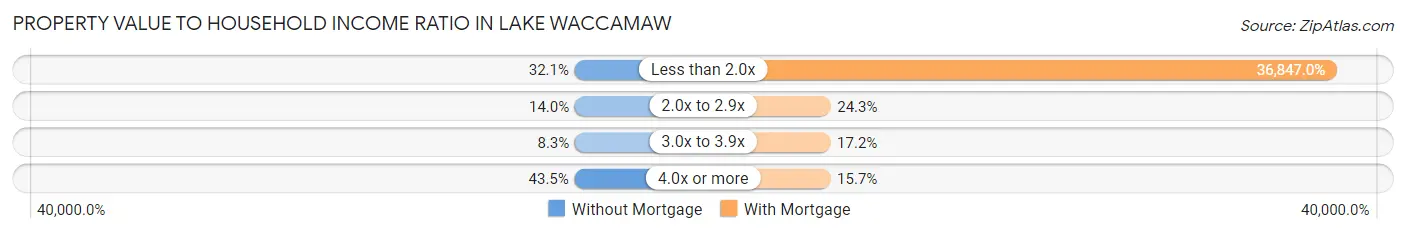
| Value-to-Income Ratio | Without Mortgage | With Mortgage |
| Less than 2.0x | 62 (32.1%) | 98,750 (36,847.0%) |
| 2.0x to 2.9x | 27 (14.0%) | 65 (24.2%) |
| 3.0x to 3.9x | 16 (8.3%) | 46 (17.2%) |
| 4.0x or more | 84 (43.5%) | 42 (15.7%) |
| Total | 193 (100.0%) | 268 (100.0%) |
Real Estate Taxes by Mortgage Status in Lake Waccamaw
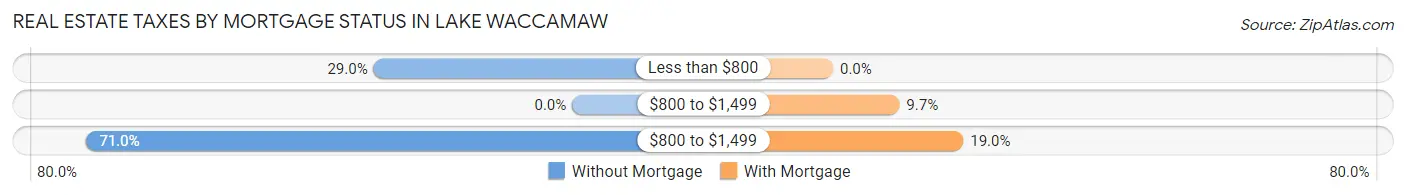
| Property Taxes | Without Mortgage | With Mortgage |
| Less than $800 | 56 (29.0%) | 0 (0.0%) |
| $800 to $1,499 | 0 (0.0%) | 26 (9.7%) |
| $800 to $1,499 | 137 (71.0%) | 51 (19.0%) |
| Total | 193 (100.0%) | 268 (100.0%) |
Health & Disability in Lake Waccamaw
Health Insurance Coverage by Age in Lake Waccamaw
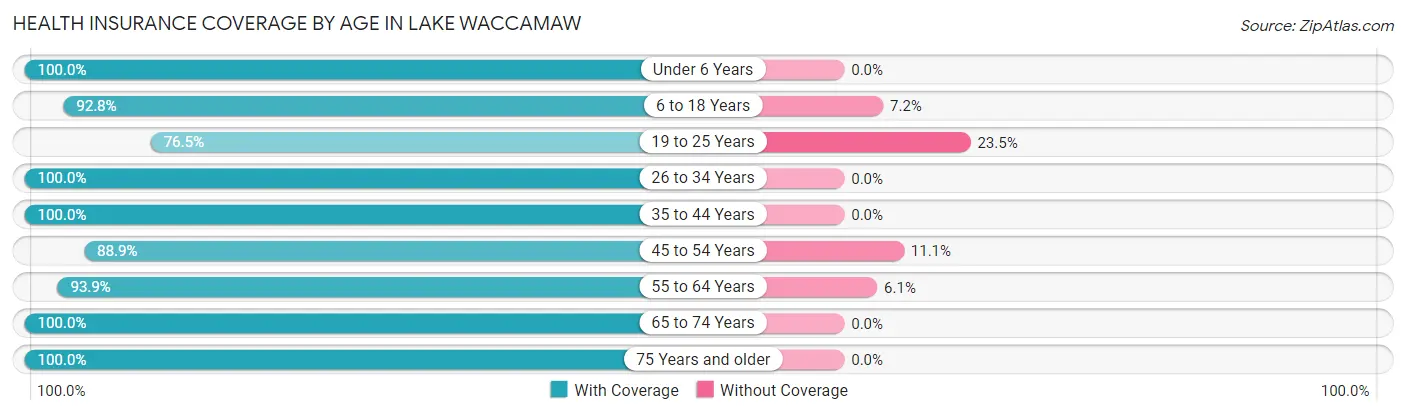
| Age Bracket | With Coverage | Without Coverage |
| Under 6 Years | 30 (100.0%) | 0 (0.0%) |
| 6 to 18 Years | 205 (92.8%) | 16 (7.2%) |
| 19 to 25 Years | 65 (76.5%) | 20 (23.5%) |
| 26 to 34 Years | 55 (100.0%) | 0 (0.0%) |
| 35 to 44 Years | 84 (100.0%) | 0 (0.0%) |
| 45 to 54 Years | 184 (88.9%) | 23 (11.1%) |
| 55 to 64 Years | 153 (93.9%) | 10 (6.1%) |
| 65 to 74 Years | 170 (100.0%) | 0 (0.0%) |
| 75 Years and older | 222 (100.0%) | 0 (0.0%) |
| Total | 1,168 (94.4%) | 69 (5.6%) |
Health Insurance Coverage by Citizenship Status in Lake Waccamaw
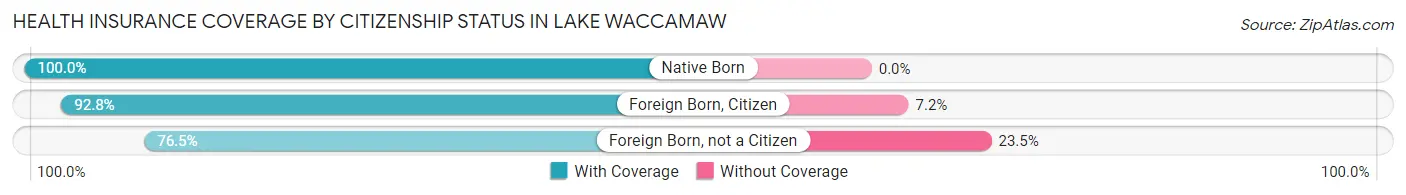
| Citizenship Status | With Coverage | Without Coverage |
| Native Born | 30 (100.0%) | 0 (0.0%) |
| Foreign Born, Citizen | 205 (92.8%) | 16 (7.2%) |
| Foreign Born, not a Citizen | 65 (76.5%) | 20 (23.5%) |
Health Insurance Coverage by Household Income in Lake Waccamaw
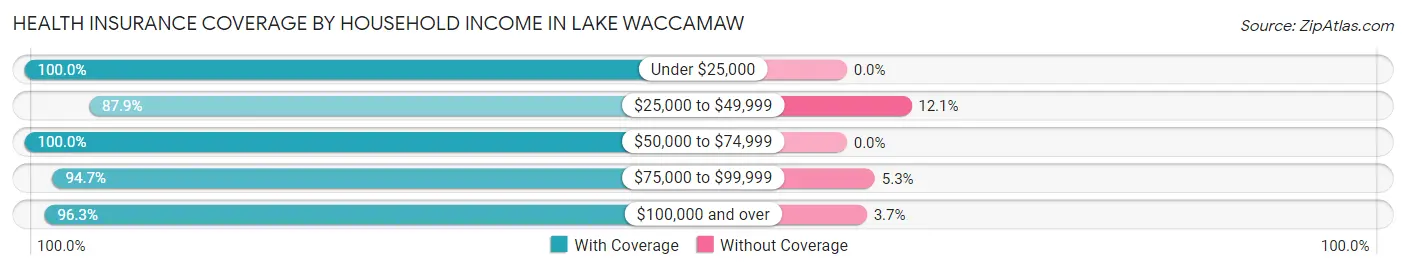
| Household Income | With Coverage | Without Coverage |
| Under $25,000 | 168 (100.0%) | 0 (0.0%) |
| $25,000 to $49,999 | 189 (87.9%) | 26 (12.1%) |
| $50,000 to $74,999 | 141 (100.0%) | 0 (0.0%) |
| $75,000 to $99,999 | 90 (94.7%) | 5 (5.3%) |
| $100,000 and over | 568 (96.3%) | 22 (3.7%) |
Public vs Private Health Insurance Coverage by Age in Lake Waccamaw
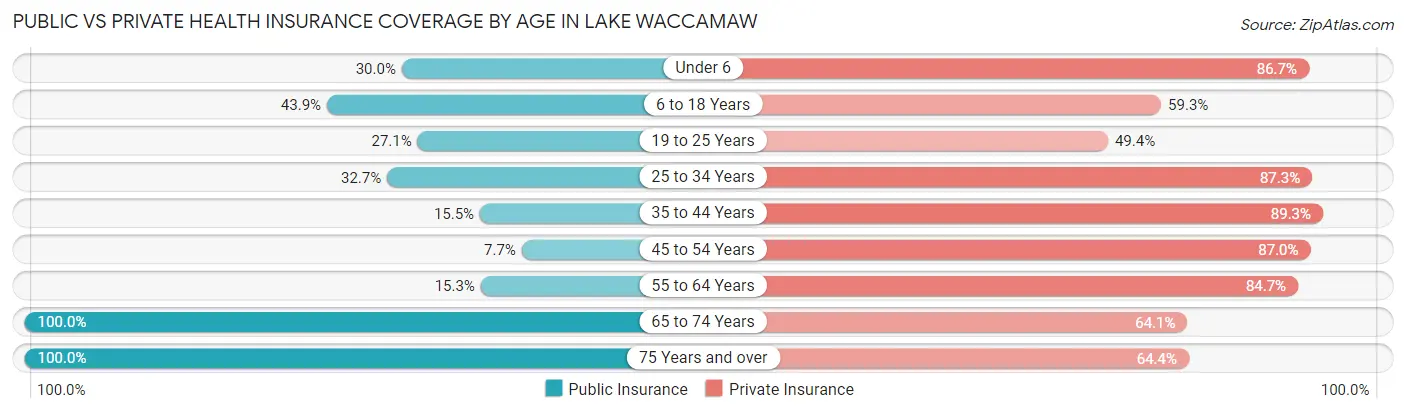
| Age Bracket | Public Insurance | Private Insurance |
| Under 6 | 9 (30.0%) | 26 (86.7%) |
| 6 to 18 Years | 97 (43.9%) | 131 (59.3%) |
| 19 to 25 Years | 23 (27.1%) | 42 (49.4%) |
| 25 to 34 Years | 18 (32.7%) | 48 (87.3%) |
| 35 to 44 Years | 13 (15.5%) | 75 (89.3%) |
| 45 to 54 Years | 16 (7.7%) | 180 (87.0%) |
| 55 to 64 Years | 25 (15.3%) | 138 (84.7%) |
| 65 to 74 Years | 170 (100.0%) | 109 (64.1%) |
| 75 Years and over | 222 (100.0%) | 143 (64.4%) |
| Total | 593 (47.9%) | 892 (72.1%) |
Disability Status by Sex by Age in Lake Waccamaw
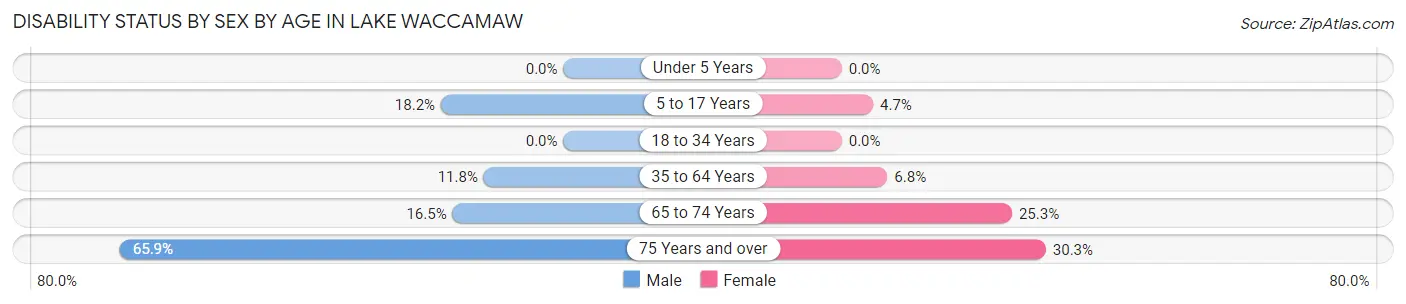
| Age Bracket | Male | Female |
| Under 5 Years | 0 (0.0%) | 0 (0.0%) |
| 5 to 17 Years | 16 (18.2%) | 6 (4.6%) |
| 18 to 34 Years | 0 (0.0%) | 0 (0.0%) |
| 35 to 64 Years | 24 (11.8%) | 17 (6.8%) |
| 65 to 74 Years | 13 (16.5%) | 23 (25.3%) |
| 75 Years and over | 81 (65.8%) | 30 (30.3%) |
Disability Class by Sex by Age in Lake Waccamaw
Disability Class: Hearing Difficulty
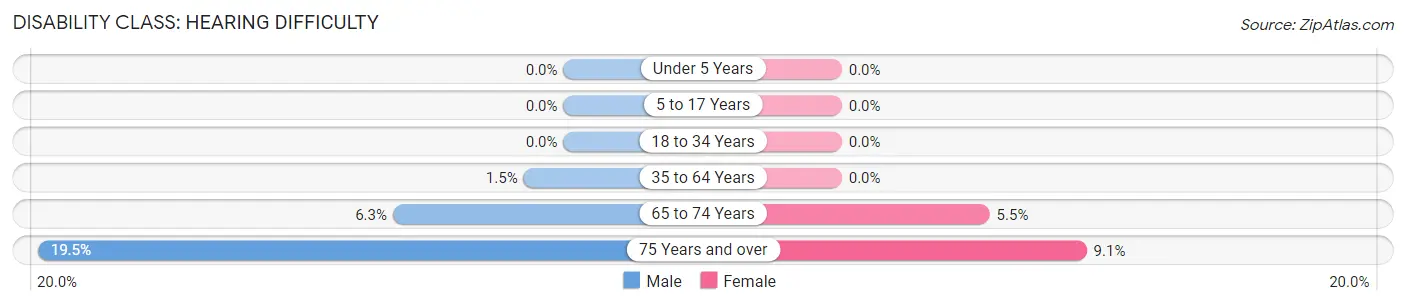
| Age Bracket | Male | Female |
| Under 5 Years | 0 (0.0%) | 0 (0.0%) |
| 5 to 17 Years | 0 (0.0%) | 0 (0.0%) |
| 18 to 34 Years | 0 (0.0%) | 0 (0.0%) |
| 35 to 64 Years | 3 (1.5%) | 0 (0.0%) |
| 65 to 74 Years | 5 (6.3%) | 5 (5.5%) |
| 75 Years and over | 24 (19.5%) | 9 (9.1%) |
Disability Class: Vision Difficulty
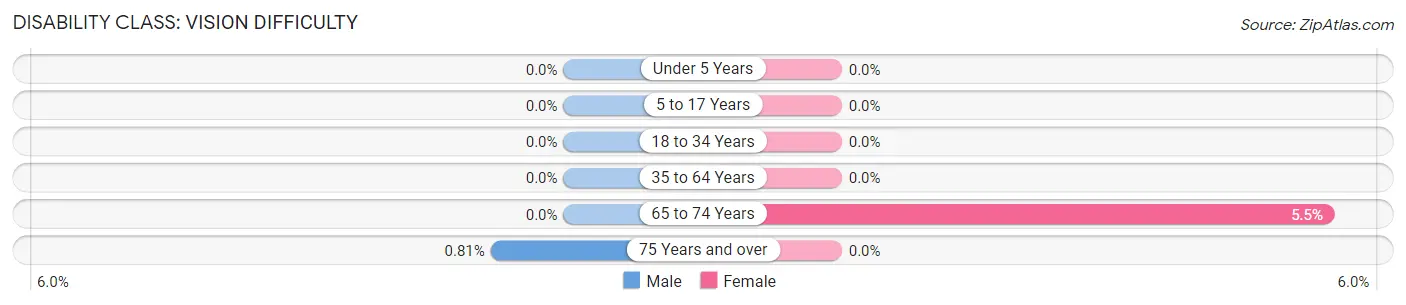
| Age Bracket | Male | Female |
| Under 5 Years | 0 (0.0%) | 0 (0.0%) |
| 5 to 17 Years | 0 (0.0%) | 0 (0.0%) |
| 18 to 34 Years | 0 (0.0%) | 0 (0.0%) |
| 35 to 64 Years | 0 (0.0%) | 0 (0.0%) |
| 65 to 74 Years | 0 (0.0%) | 5 (5.5%) |
| 75 Years and over | 1 (0.8%) | 0 (0.0%) |
Disability Class: Cognitive Difficulty
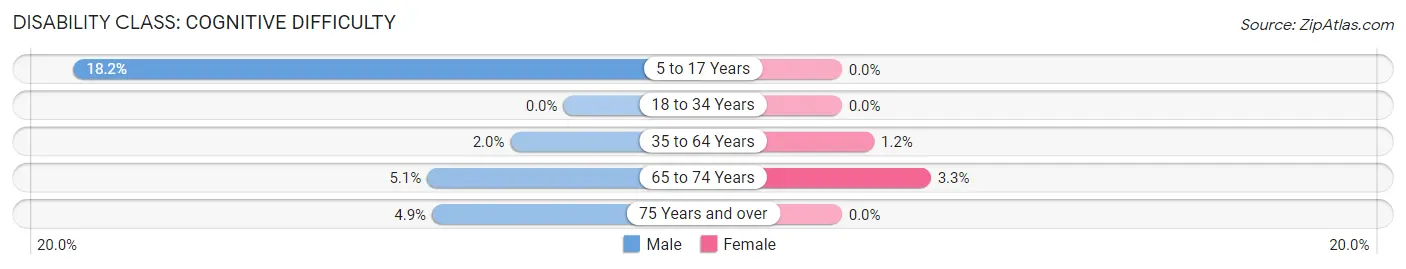
| Age Bracket | Male | Female |
| 5 to 17 Years | 16 (18.2%) | 0 (0.0%) |
| 18 to 34 Years | 0 (0.0%) | 0 (0.0%) |
| 35 to 64 Years | 4 (2.0%) | 3 (1.2%) |
| 65 to 74 Years | 4 (5.1%) | 3 (3.3%) |
| 75 Years and over | 6 (4.9%) | 0 (0.0%) |
Disability Class: Ambulatory Difficulty
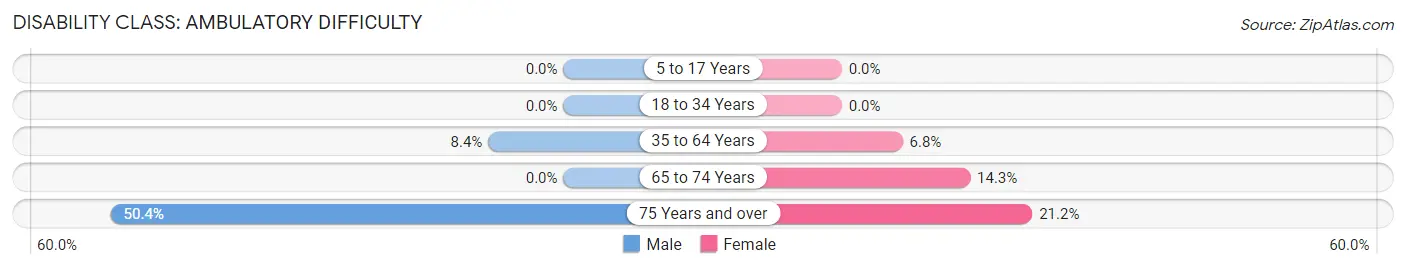
| Age Bracket | Male | Female |
| 5 to 17 Years | 0 (0.0%) | 0 (0.0%) |
| 18 to 34 Years | 0 (0.0%) | 0 (0.0%) |
| 35 to 64 Years | 17 (8.4%) | 17 (6.8%) |
| 65 to 74 Years | 0 (0.0%) | 13 (14.3%) |
| 75 Years and over | 62 (50.4%) | 21 (21.2%) |
Disability Class: Self-Care Difficulty
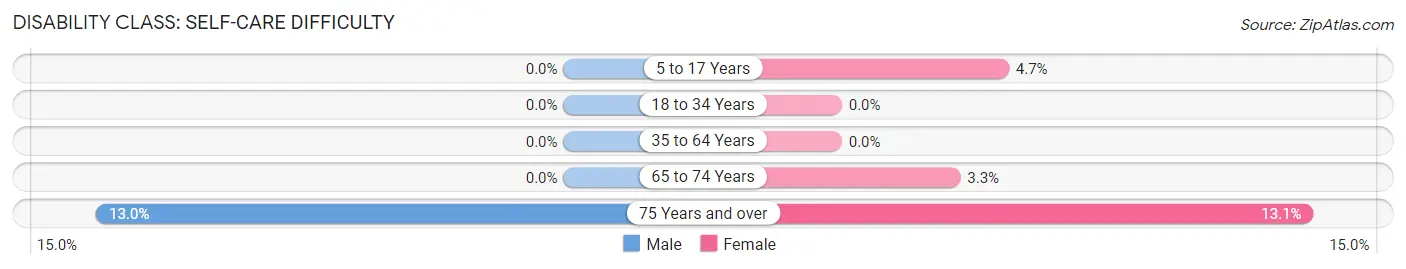
| Age Bracket | Male | Female |
| 5 to 17 Years | 0 (0.0%) | 6 (4.6%) |
| 18 to 34 Years | 0 (0.0%) | 0 (0.0%) |
| 35 to 64 Years | 0 (0.0%) | 0 (0.0%) |
| 65 to 74 Years | 0 (0.0%) | 3 (3.3%) |
| 75 Years and over | 16 (13.0%) | 13 (13.1%) |
Technology Access in Lake Waccamaw
Computing Device Access in Lake Waccamaw
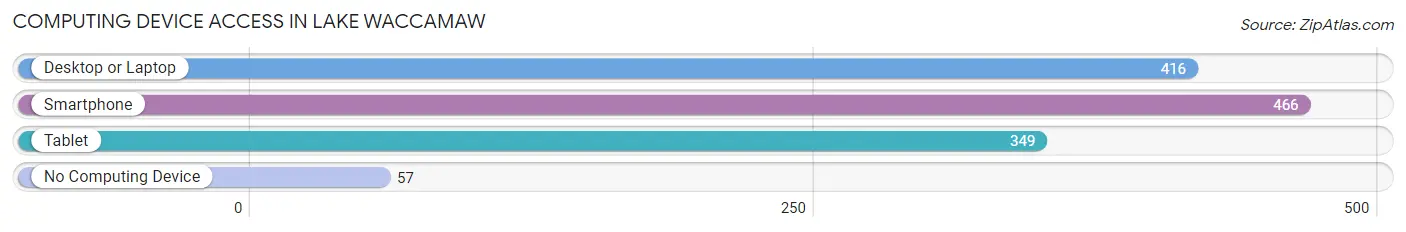
| Device Type | # Households | % Households |
| Desktop or Laptop | 416 | 75.0% |
| Smartphone | 466 | 84.0% |
| Tablet | 349 | 62.9% |
| No Computing Device | 57 | 10.3% |
| Total | 555 | 100.0% |
Internet Access in Lake Waccamaw
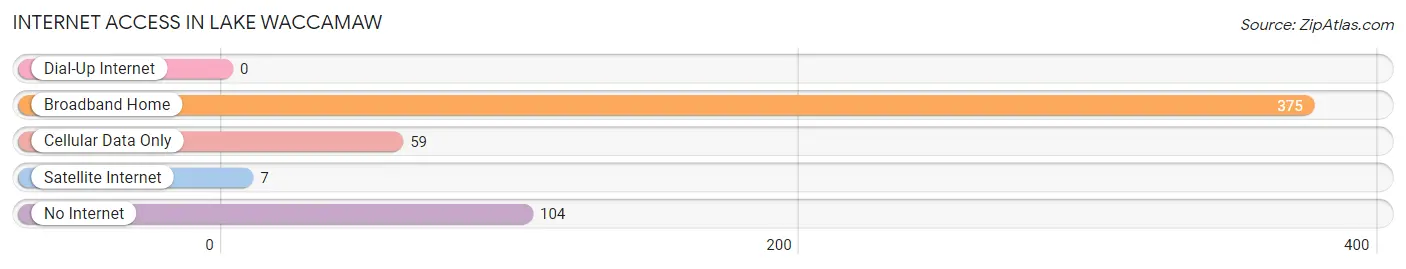
| Internet Type | # Households | % Households |
| Dial-Up Internet | 0 | 0.0% |
| Broadband Home | 375 | 67.6% |
| Cellular Data Only | 59 | 10.6% |
| Satellite Internet | 7 | 1.3% |
| No Internet | 104 | 18.7% |
| Total | 555 | 100.0% |
Lake Waccamaw Summary
Lake Waccamaw is a small town located in Columbus County, North Carolina. It is situated on the banks of the Waccamaw River, which is part of the Intracoastal Waterway. The town is home to a population of approximately 1,000 people and is known for its natural beauty and recreational opportunities.
History
The area around Lake Waccamaw has been inhabited for thousands of years. The Waccamaw Indians were the first known inhabitants of the area, and they lived in the area until the early 1700s. The first European settlers arrived in the area in the late 1700s, and the town of Lake Waccamaw was officially established in 1820.
The town was named after the Waccamaw River, which was named after the Waccamaw Indians. The town was originally a small fishing village, but it grew in size and importance over the years. In the late 1800s, the town became a popular tourist destination, and it was known for its beautiful scenery and recreational opportunities.
Geography
Lake Waccamaw is located in the southeastern corner of North Carolina, near the border with South Carolina. The town is situated on the banks of the Waccamaw River, which is part of the Intracoastal Waterway. The town is surrounded by a number of lakes, including Lake Waccamaw, Lake Tabor, and Lake Waccamaw State Park.
The town is located in a humid subtropical climate zone, and it experiences hot, humid summers and mild winters. The average annual temperature is around 70 degrees Fahrenheit, and the average annual precipitation is around 50 inches.
Economy
The economy of Lake Waccamaw is largely based on tourism and recreation. The town is home to a number of resorts and hotels, as well as a variety of restaurants and shops. The town is also home to a number of marinas, which offer boat rentals and other services.
The town is also home to a number of manufacturing and industrial businesses, including a paper mill and a lumber mill. The town is also home to a number of agricultural businesses, including a number of farms and nurseries.
Demographics
As of the 2010 census, the population of Lake Waccamaw was 1,039. The racial makeup of the town was 79.3% White, 16.2% African American, 0.7% Native American, 0.3% Asian, and 3.5% from other races. The median household income was $30,938, and the median family income was $37,813.
The town is home to a number of churches, including the First Baptist Church of Lake Waccamaw, the Lake Waccamaw United Methodist Church, and the Lake Waccamaw Presbyterian Church. The town is also home to a number of schools, including Lake Waccamaw Elementary School, Lake Waccamaw Middle School, and Lake Waccamaw High School.
Conclusion
Lake Waccamaw is a small town located in Columbus County, North Carolina. It is situated on the banks of the Waccamaw River, which is part of the Intracoastal Waterway. The town is home to a population of approximately 1,000 people and is known for its natural beauty and recreational opportunities. The economy of the town is largely based on tourism and recreation, and the town is home to a number of churches, schools, and businesses.
Common Questions
What is Per Capita Income in Lake Waccamaw?
Per Capita income in Lake Waccamaw is $43,990.
What is the Median Family Income in Lake Waccamaw?
Median Family Income in Lake Waccamaw is $108,854.
What is the Median Household income in Lake Waccamaw?
Median Household Income in Lake Waccamaw is $74,297.
What is Income or Wage Gap in Lake Waccamaw?
Income or Wage Gap in Lake Waccamaw is 15.9%.
Women in Lake Waccamaw earn 84.1 cents for every dollar earned by a man.
What is Inequality or Gini Index in Lake Waccamaw?
Inequality or Gini Index in Lake Waccamaw is 0.49.
What is the Total Population of Lake Waccamaw?
Total Population of Lake Waccamaw is 1,462.
What is the Total Male Population of Lake Waccamaw?
Total Male Population of Lake Waccamaw is 710.
What is the Total Female Population of Lake Waccamaw?
Total Female Population of Lake Waccamaw is 752.
What is the Ratio of Males per 100 Females in Lake Waccamaw?
There are 94.41 Males per 100 Females in Lake Waccamaw.
What is the Ratio of Females per 100 Males in Lake Waccamaw?
There are 105.92 Females per 100 Males in Lake Waccamaw.
What is the Median Population Age in Lake Waccamaw?
Median Population Age in Lake Waccamaw is 53.5 Years.
What is the Average Family Size in Lake Waccamaw
Average Family Size in Lake Waccamaw is 2.6 People.
What is the Average Household Size in Lake Waccamaw
Average Household Size in Lake Waccamaw is 2.2 People.
How Large is the Labor Force in Lake Waccamaw?
There are 540 People in the Labor Forcein in Lake Waccamaw.
What is the Percentage of People in the Labor Force in Lake Waccamaw?
44.8% of People are in the Labor Force in Lake Waccamaw.
What is the Unemployment Rate in Lake Waccamaw?
Unemployment Rate in Lake Waccamaw is 2.2%.