Kitty Hawk, NC Map & Demographics
Kitty Hawk Map
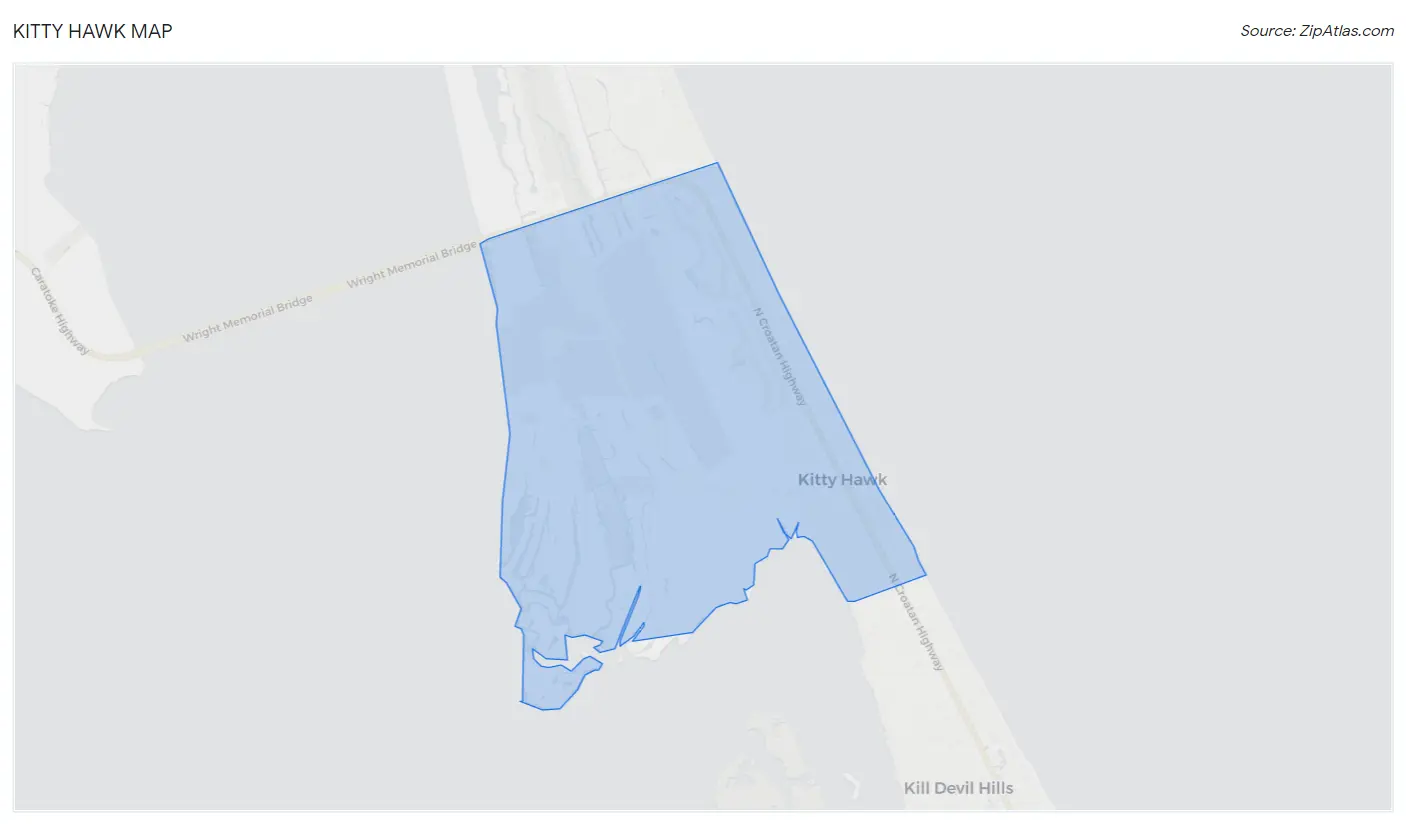
Kitty Hawk Overview
$49,216
PER CAPITA INCOME
$100,368
AVG FAMILY INCOME
$85,700
AVG HOUSEHOLD INCOME
35.2%
WAGE / INCOME GAP [ % ]
64.8¢/ $1
WAGE / INCOME GAP [ $ ]
0.39
INEQUALITY / GINI INDEX
3,690
TOTAL POPULATION
1,782
MALE POPULATION
1,908
FEMALE POPULATION
93.40
MALES / 100 FEMALES
107.07
FEMALES / 100 MALES
49.8
MEDIAN AGE
2.7
AVG FAMILY SIZE
2.3
AVG HOUSEHOLD SIZE
2,146
LABOR FORCE [ PEOPLE ]
69.8%
PERCENT IN LABOR FORCE
7.1%
UNEMPLOYMENT RATE
Kitty Hawk Zip Codes
Kitty Hawk Area Codes
Income in Kitty Hawk
Income Overview in Kitty Hawk
Per Capita Income in Kitty Hawk is $49,216, while median incomes of families and households are $100,368 and $85,700 respectively.
| Characteristic | Number | Measure |
| Per Capita Income | 3,690 | $49,216 |
| Median Family Income | 1,143 | $100,368 |
| Mean Family Income | 1,143 | $131,305 |
| Median Household Income | 1,578 | $85,700 |
| Mean Household Income | 1,578 | $116,631 |
| Income Deficit | 1,143 | $0 |
| Wage / Income Gap (%) | 3,690 | 35.24% |
| Wage / Income Gap ($) | 3,690 | 64.76¢ per $1 |
| Gini / Inequality Index | 3,690 | 0.39 |
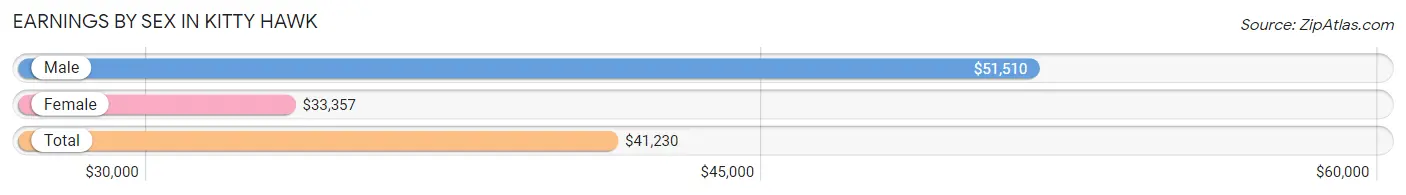
Earnings by Sex in Kitty Hawk
Average Earnings in Kitty Hawk are $41,230, $51,510 for men and $33,357 for women, a difference of 35.2%.
| Sex | Number | Average Earnings |
| Male | 1,124 (51.0%) | $51,510 |
| Female | 1,080 (49.0%) | $33,357 |
| Total | 2,204 (100.0%) | $41,230 |
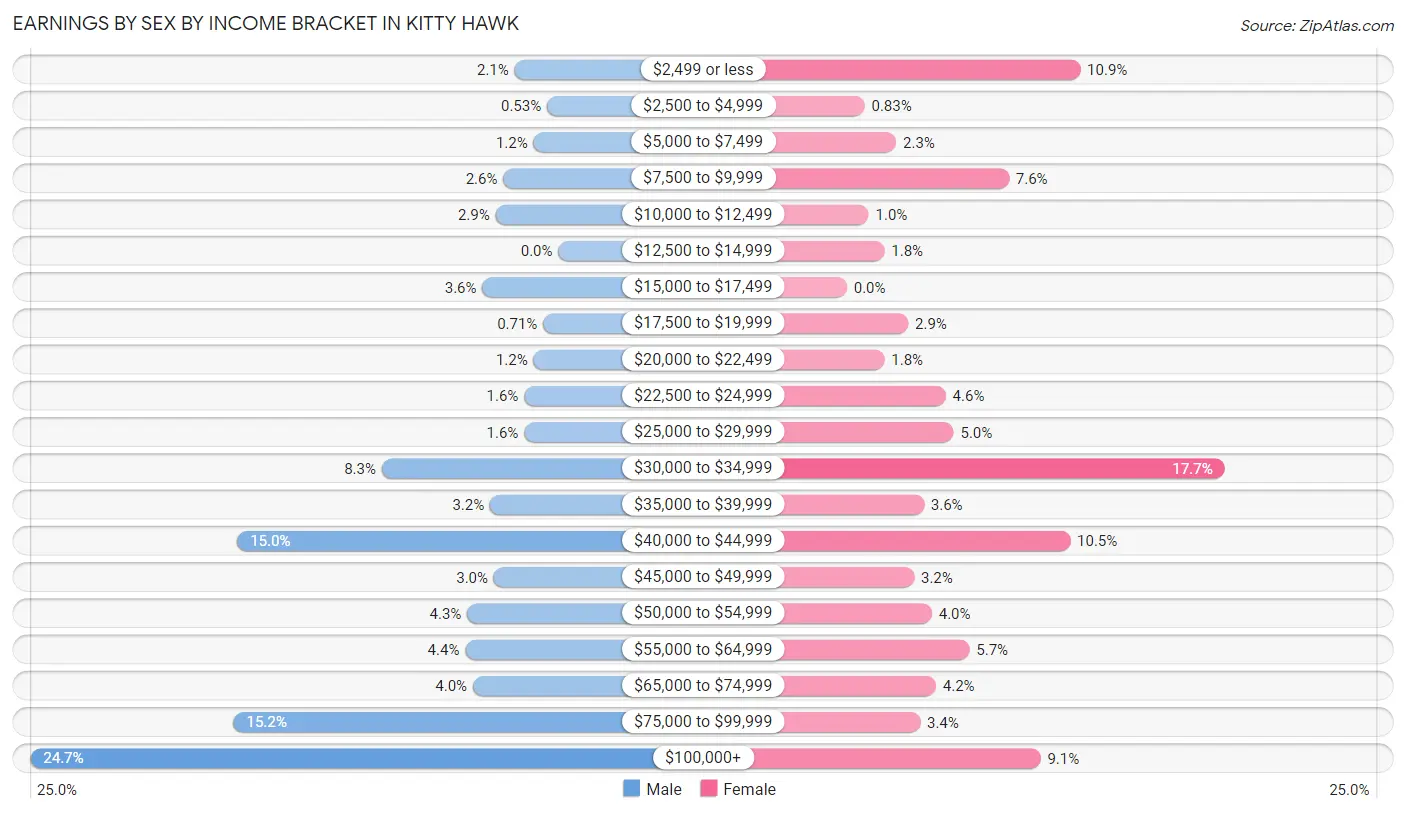
Earnings by Sex by Income Bracket in Kitty Hawk
The most common earnings brackets in Kitty Hawk are $100,000+ for men (278 | 24.7%) and $30,000 to $34,999 for women (191 | 17.7%).
| Income | Male | Female |
| $2,499 or less | 23 (2.1%) | 118 (10.9%) |
| $2,500 to $4,999 | 6 (0.5%) | 9 (0.8%) |
| $5,000 to $7,499 | 13 (1.2%) | 25 (2.3%) |
| $7,500 to $9,999 | 29 (2.6%) | 82 (7.6%) |
| $10,000 to $12,499 | 33 (2.9%) | 11 (1.0%) |
| $12,500 to $14,999 | 0 (0.0%) | 19 (1.8%) |
| $15,000 to $17,499 | 40 (3.6%) | 0 (0.0%) |
| $17,500 to $19,999 | 8 (0.7%) | 31 (2.9%) |
| $20,000 to $22,499 | 13 (1.2%) | 19 (1.8%) |
| $22,500 to $24,999 | 18 (1.6%) | 50 (4.6%) |
| $25,000 to $29,999 | 18 (1.6%) | 54 (5.0%) |
| $30,000 to $34,999 | 93 (8.3%) | 191 (17.7%) |
| $35,000 to $39,999 | 36 (3.2%) | 39 (3.6%) |
| $40,000 to $44,999 | 169 (15.0%) | 113 (10.5%) |
| $45,000 to $49,999 | 34 (3.0%) | 34 (3.2%) |
| $50,000 to $54,999 | 48 (4.3%) | 43 (4.0%) |
| $55,000 to $64,999 | 49 (4.4%) | 62 (5.7%) |
| $65,000 to $74,999 | 45 (4.0%) | 45 (4.2%) |
| $75,000 to $99,999 | 171 (15.2%) | 37 (3.4%) |
| $100,000+ | 278 (24.7%) | 98 (9.1%) |
| Total | 1,124 (100.0%) | 1,080 (100.0%) |
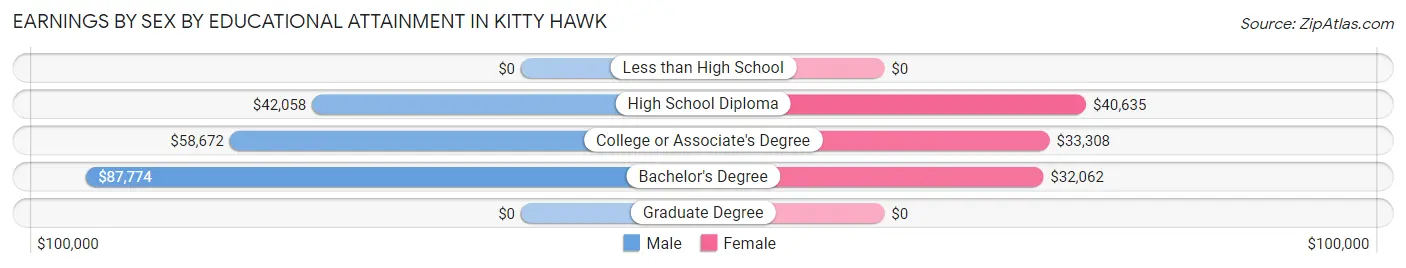
Earnings by Sex by Educational Attainment in Kitty Hawk
Average earnings in Kitty Hawk are $61,439 for men and $33,571 for women, a difference of 45.4%. Men with an educational attainment of bachelor's degree enjoy the highest average annual earnings of $87,774, while those with high school diploma education earn the least with $42,058. Women with an educational attainment of high school diploma earn the most with the average annual earnings of $40,635, while those with bachelor's degree education have the smallest earnings of $32,062.
| Educational Attainment | Male Income | Female Income |
| Less than High School | - | - |
| High School Diploma | $42,058 | $40,635 |
| College or Associate's Degree | $58,672 | $33,308 |
| Bachelor's Degree | $87,774 | $32,062 |
| Graduate Degree | - | - |
| Total | $61,439 | $33,571 |
Family Income in Kitty Hawk
Family Income Brackets in Kitty Hawk
According to the Kitty Hawk family income data, there are 219 families falling into the $75,000 to $99,999 income range, which is the most common income bracket and makes up 19.2% of all families.
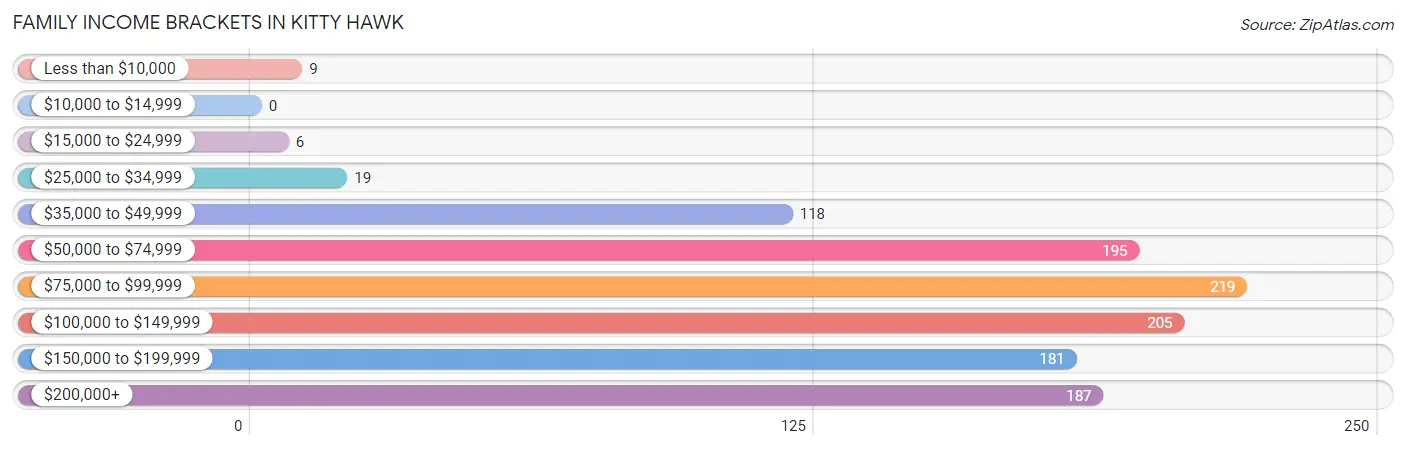
| Income Bracket | # Families | % Families |
| Less than $10,000 | 9 | 0.8% |
| $10,000 to $14,999 | 0 | 0.0% |
| $15,000 to $24,999 | 6 | 0.5% |
| $25,000 to $34,999 | 19 | 1.7% |
| $35,000 to $49,999 | 118 | 10.3% |
| $50,000 to $74,999 | 195 | 17.1% |
| $75,000 to $99,999 | 219 | 19.2% |
| $100,000 to $149,999 | 205 | 17.9% |
| $150,000 to $199,999 | 181 | 15.8% |
| $200,000+ | 187 | 16.4% |
Family Income by Famaliy Size in Kitty Hawk
3-person families (239 | 20.9%) account for the highest median family income in Kitty Hawk with $157,926 per family, while 3-person families (239 | 20.9%) have the highest median income of $52,642 per family member.
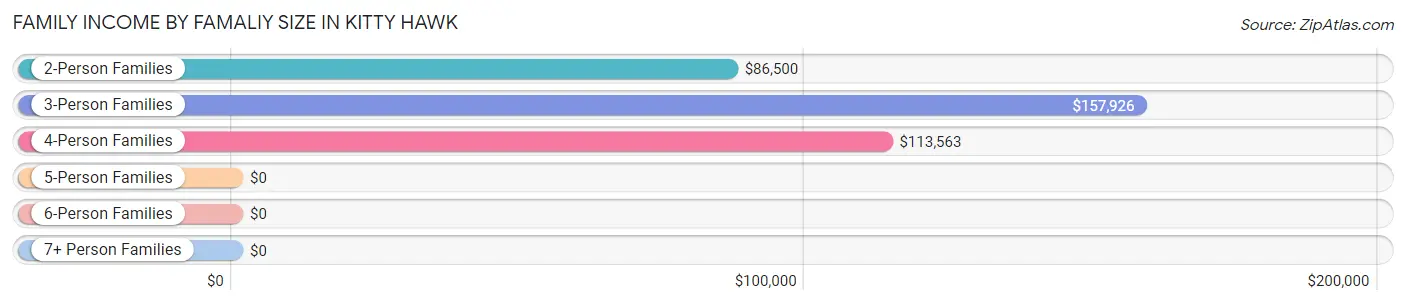
| Income Bracket | # Families | Median Income |
| 2-Person Families | 578 (50.6%) | $86,500 |
| 3-Person Families | 239 (20.9%) | $157,926 |
| 4-Person Families | 243 (21.3%) | $113,563 |
| 5-Person Families | 83 (7.3%) | $0 |
| 6-Person Families | 0 (0.0%) | $0 |
| 7+ Person Families | 0 (0.0%) | $0 |
| Total | 1,143 (100.0%) | $100,368 |
Family Income by Number of Earners in Kitty Hawk
The median family income in Kitty Hawk is $100,368, with families comprising 3+ earners (97) having the highest median family income of $197,782, while families with no earners (126) have the lowest median family income of $44,286, accounting for 8.5% and 11.0% of families, respectively.
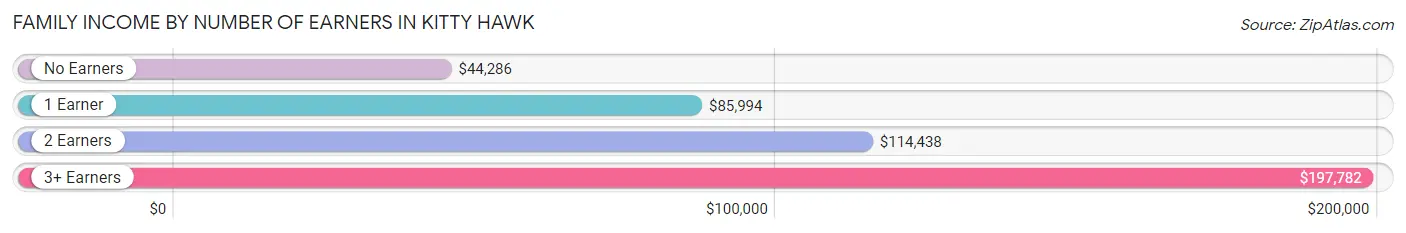
| Number of Earners | # Families | Median Income |
| No Earners | 126 (11.0%) | $44,286 |
| 1 Earner | 347 (30.4%) | $85,994 |
| 2 Earners | 573 (50.1%) | $114,438 |
| 3+ Earners | 97 (8.5%) | $197,782 |
| Total | 1,143 (100.0%) | $100,368 |
Household Income in Kitty Hawk
Household Income Brackets in Kitty Hawk
With 284 households falling in the category, the $50,000 to $74,999 income range is the most frequent in Kitty Hawk, accounting for 18.0% of all households. In contrast, only 6 households (0.4%) fall into the $10,000 to $14,999 income bracket, making it the least populous group.
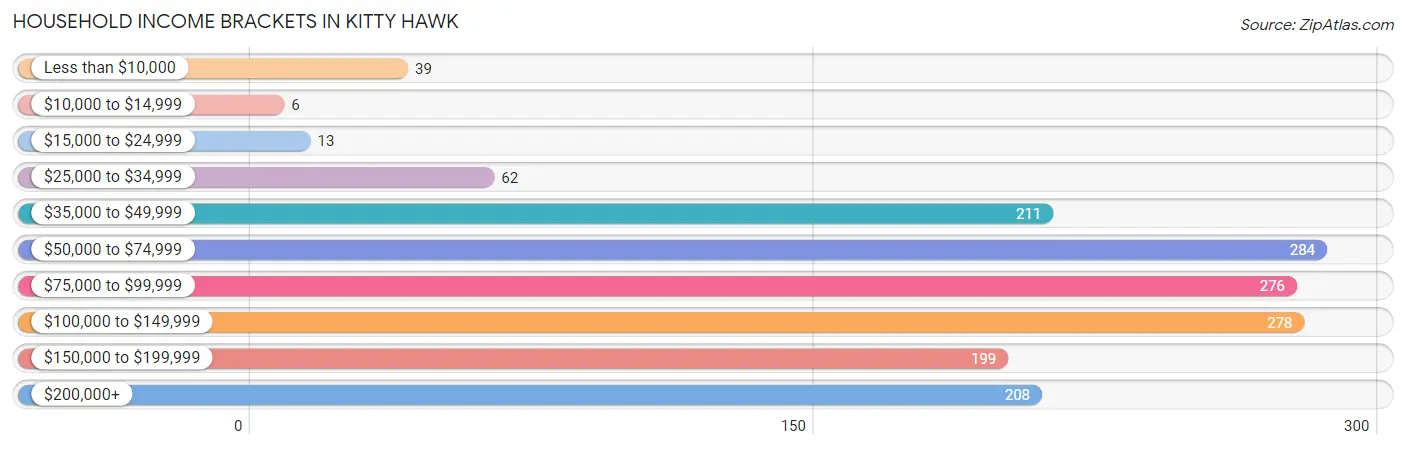
| Income Bracket | # Households | % Households |
| Less than $10,000 | 39 | 2.5% |
| $10,000 to $14,999 | 6 | 0.4% |
| $15,000 to $24,999 | 13 | 0.8% |
| $25,000 to $34,999 | 62 | 3.9% |
| $35,000 to $49,999 | 211 | 13.4% |
| $50,000 to $74,999 | 284 | 18.0% |
| $75,000 to $99,999 | 276 | 17.5% |
| $100,000 to $149,999 | 278 | 17.6% |
| $150,000 to $199,999 | 199 | 12.6% |
| $200,000+ | 208 | 13.2% |
Household Income by Householder Age in Kitty Hawk
The median household income in Kitty Hawk is $85,700, with the highest median household income of $87,246 found in the 45 to 64 years age bracket for the primary householder. A total of 683 households (43.3%) fall into this category.
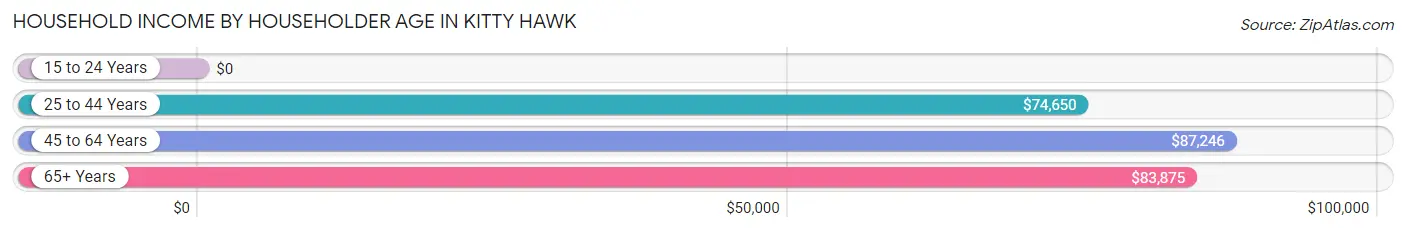
| Income Bracket | # Households | Median Income |
| 15 to 24 Years | 0 (0.0%) | $0 |
| 25 to 44 Years | 362 (22.9%) | $74,650 |
| 45 to 64 Years | 683 (43.3%) | $87,246 |
| 65+ Years | 533 (33.8%) | $83,875 |
| Total | 1,578 (100.0%) | $85,700 |
Poverty in Kitty Hawk
Income Below Poverty by Sex and Age in Kitty Hawk
With 2.8% poverty level for males and 3.6% for females among the residents of Kitty Hawk, 25 to 34 year old males and 65 to 74 year old females are the most vulnerable to poverty, with 19 males (13.1%) and 31 females (11.7%) in their respective age groups living below the poverty level.
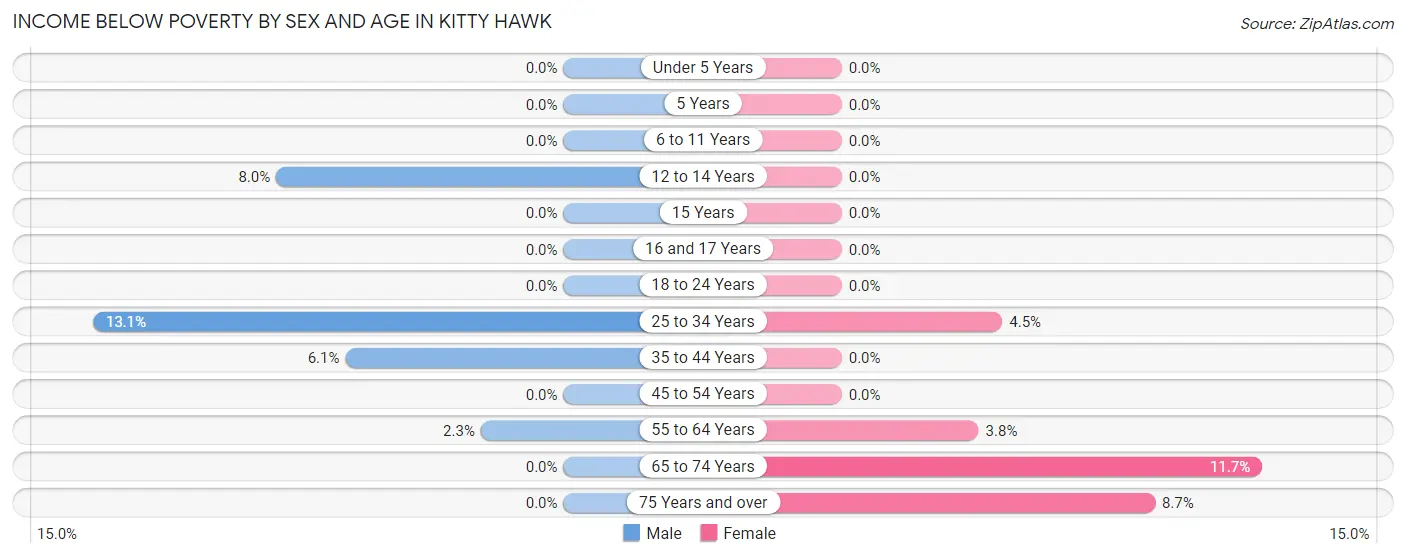
| Age Bracket | Male | Female |
| Under 5 Years | 0 (0.0%) | 0 (0.0%) |
| 5 Years | 0 (0.0%) | 0 (0.0%) |
| 6 to 11 Years | 0 (0.0%) | 0 (0.0%) |
| 12 to 14 Years | 6 (8.0%) | 0 (0.0%) |
| 15 Years | 0 (0.0%) | 0 (0.0%) |
| 16 and 17 Years | 0 (0.0%) | 0 (0.0%) |
| 18 to 24 Years | 0 (0.0%) | 0 (0.0%) |
| 25 to 34 Years | 19 (13.1%) | 8 (4.5%) |
| 35 to 44 Years | 15 (6.1%) | 0 (0.0%) |
| 45 to 54 Years | 0 (0.0%) | 0 (0.0%) |
| 55 to 64 Years | 9 (2.3%) | 16 (3.8%) |
| 65 to 74 Years | 0 (0.0%) | 31 (11.7%) |
| 75 Years and over | 0 (0.0%) | 13 (8.7%) |
| Total | 49 (2.8%) | 68 (3.6%) |
Income Above Poverty by Sex and Age in Kitty Hawk
According to the poverty statistics in Kitty Hawk, males aged under 5 years and females aged under 5 years are the age groups that are most secure financially, with 100.0% of males and 100.0% of females in these age groups living above the poverty line.
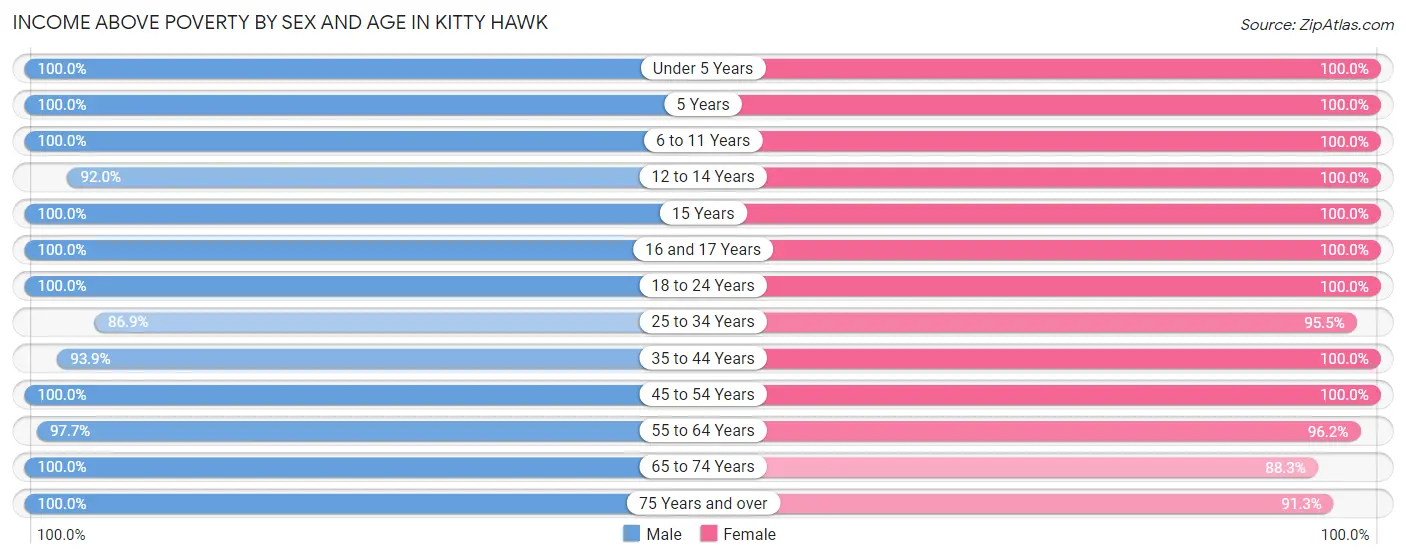
| Age Bracket | Male | Female |
| Under 5 Years | 60 (100.0%) | 61 (100.0%) |
| 5 Years | 20 (100.0%) | 24 (100.0%) |
| 6 to 11 Years | 83 (100.0%) | 83 (100.0%) |
| 12 to 14 Years | 69 (92.0%) | 180 (100.0%) |
| 15 Years | 6 (100.0%) | 24 (100.0%) |
| 16 and 17 Years | 68 (100.0%) | 8 (100.0%) |
| 18 to 24 Years | 110 (100.0%) | 52 (100.0%) |
| 25 to 34 Years | 126 (86.9%) | 171 (95.5%) |
| 35 to 44 Years | 232 (93.9%) | 219 (100.0%) |
| 45 to 54 Years | 164 (100.0%) | 244 (100.0%) |
| 55 to 64 Years | 382 (97.7%) | 404 (96.2%) |
| 65 to 74 Years | 247 (100.0%) | 234 (88.3%) |
| 75 Years and over | 166 (100.0%) | 136 (91.3%) |
| Total | 1,733 (97.3%) | 1,840 (96.4%) |
Income Below Poverty Among Married-Couple Families in Kitty Hawk
The poverty statistics for married-couple families in Kitty Hawk show that 0.8% or 9 of the total 1,093 families live below the poverty line. Families with no children have the highest poverty rate of 1.3%, comprising of 9 families. On the other hand, families with 1 or 2 children have the lowest poverty rate of 0.0%, which includes 0 families.
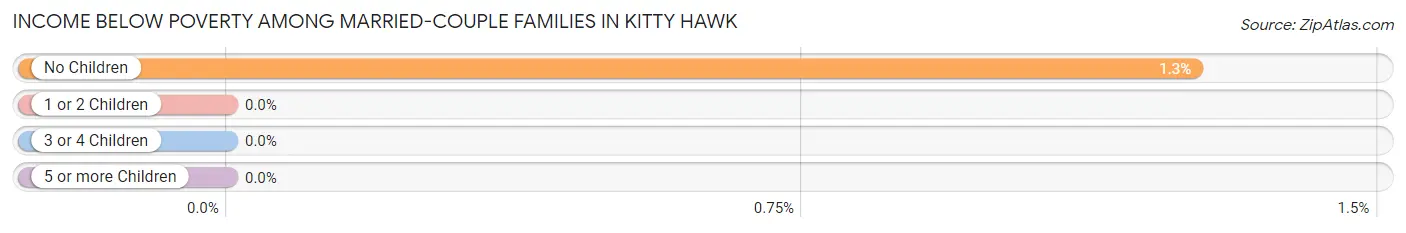
| Children | Above Poverty | Below Poverty |
| No Children | 705 (98.7%) | 9 (1.3%) |
| 1 or 2 Children | 321 (100.0%) | 0 (0.0%) |
| 3 or 4 Children | 58 (100.0%) | 0 (0.0%) |
| 5 or more Children | 0 (0.0%) | 0 (0.0%) |
| Total | 1,084 (99.2%) | 9 (0.8%) |
Income Below Poverty Among Single-Parent Households in Kitty Hawk
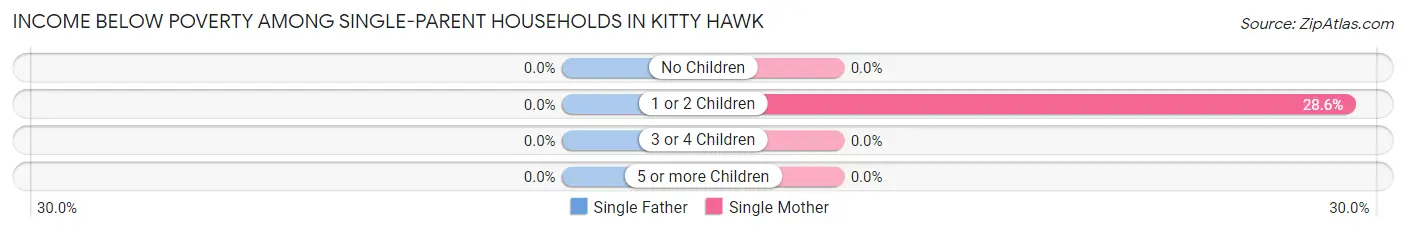
| Children | Single Father | Single Mother |
| No Children | 0 (0.0%) | 0 (0.0%) |
| 1 or 2 Children | 0 (0.0%) | 6 (28.6%) |
| 3 or 4 Children | 0 (0.0%) | 0 (0.0%) |
| 5 or more Children | 0 (0.0%) | 0 (0.0%) |
| Total | 0 (0.0%) | 6 (22.2%) |
Income Below Poverty Among Married-Couple vs Single-Parent Households in Kitty Hawk
The poverty data for Kitty Hawk shows that 9 of the married-couple family households (0.8%) and 6 of the single-parent households (12.0%) are living below the poverty level. Within the married-couple family households, those with no children have the highest poverty rate, with 9 households (1.3%) falling below the poverty line. Among the single-parent households, those with 1 or 2 children have the highest poverty rate, with 6 household (13.6%) living below poverty.
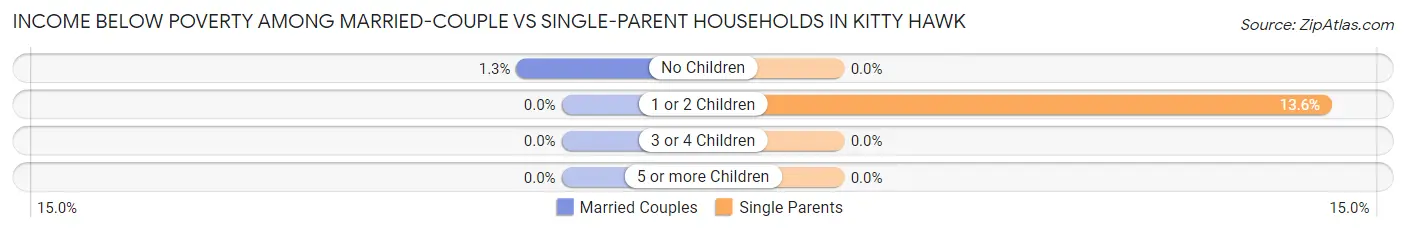
| Children | Married-Couple Families | Single-Parent Households |
| No Children | 9 (1.3%) | 0 (0.0%) |
| 1 or 2 Children | 0 (0.0%) | 6 (13.6%) |
| 3 or 4 Children | 0 (0.0%) | 0 (0.0%) |
| 5 or more Children | 0 (0.0%) | 0 (0.0%) |
| Total | 9 (0.8%) | 6 (12.0%) |
Race in Kitty Hawk
The most populous races in Kitty Hawk are White / Caucasian (3,262 | 88.4%), Some other Race (225 | 6.1%), and Two or more Races (194 | 5.3%).
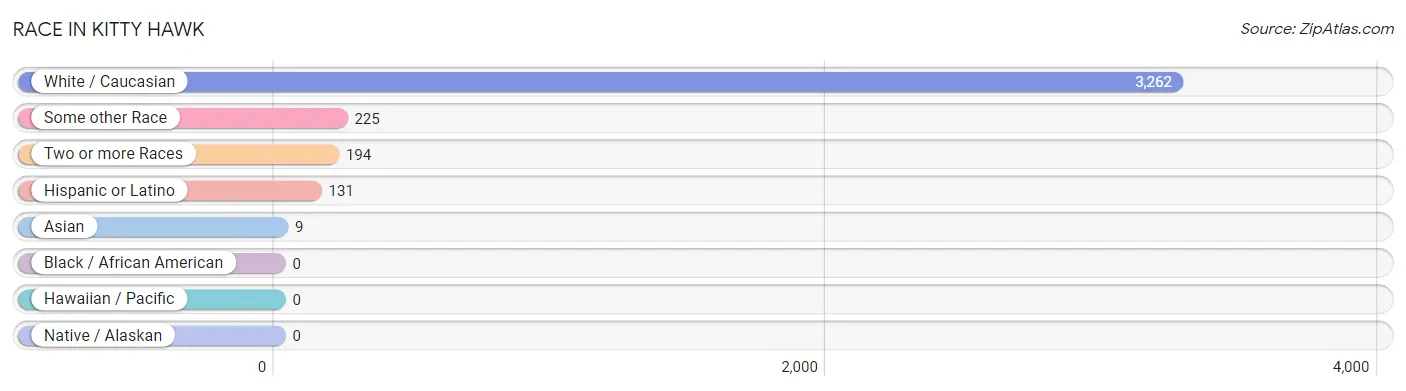
| Race | # Population | % Population |
| Asian | 9 | 0.2% |
| Black / African American | 0 | 0.0% |
| Hawaiian / Pacific | 0 | 0.0% |
| Hispanic or Latino | 131 | 3.5% |
| Native / Alaskan | 0 | 0.0% |
| White / Caucasian | 3,262 | 88.4% |
| Two or more Races | 194 | 5.3% |
| Some other Race | 225 | 6.1% |
| Total | 3,690 | 100.0% |
Ancestry in Kitty Hawk
The most populous ancestries reported in Kitty Hawk are American (838 | 22.7%), English (648 | 17.6%), Italian (415 | 11.3%), Irish (387 | 10.5%), and German (288 | 7.8%), together accounting for 69.8% of all Kitty Hawk residents.
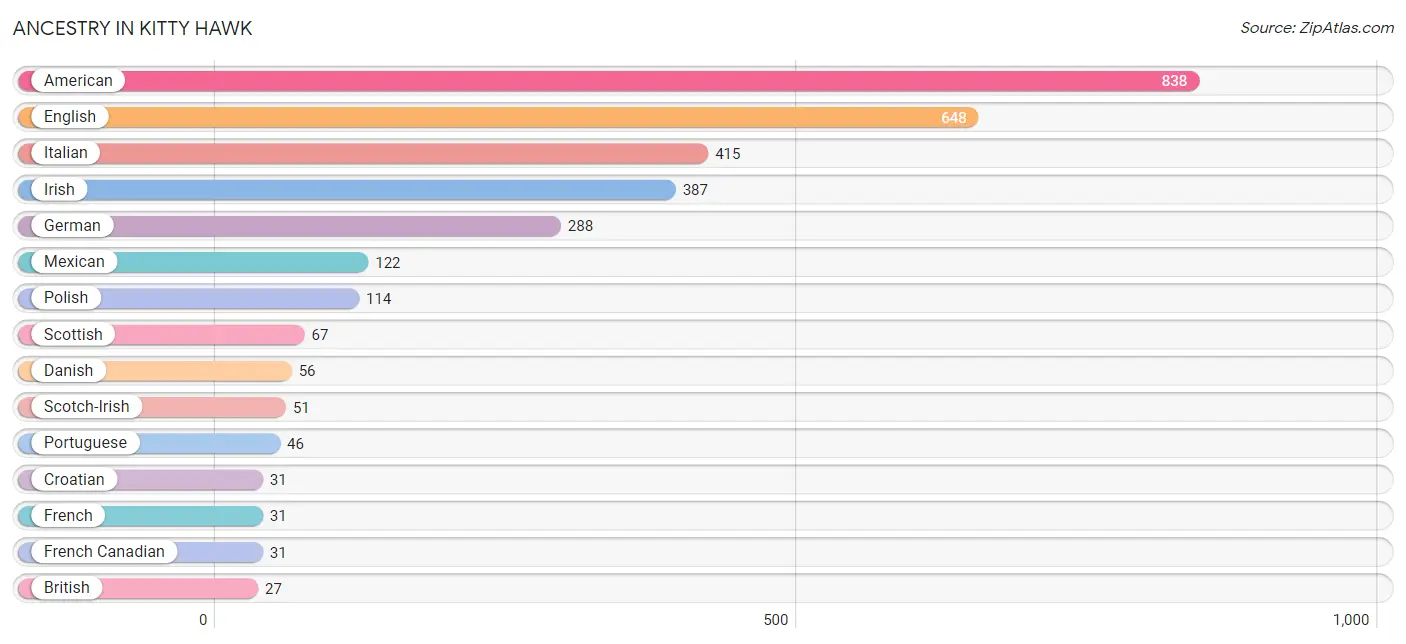
| Ancestry | # Population | % Population |
| American | 838 | 22.7% |
| Arab | 16 | 0.4% |
| Argentinean | 9 | 0.2% |
| Brazilian | 12 | 0.3% |
| British | 27 | 0.7% |
| Croatian | 31 | 0.8% |
| Czech | 11 | 0.3% |
| Danish | 56 | 1.5% |
| Dutch | 26 | 0.7% |
| Eastern European | 6 | 0.2% |
| English | 648 | 17.6% |
| European | 25 | 0.7% |
| French | 31 | 0.8% |
| French Canadian | 31 | 0.8% |
| German | 288 | 7.8% |
| Irish | 387 | 10.5% |
| Italian | 415 | 11.3% |
| Korean | 9 | 0.2% |
| Mexican | 122 | 3.3% |
| Norwegian | 13 | 0.4% |
| Pennsylvania German | 6 | 0.2% |
| Polish | 114 | 3.1% |
| Portuguese | 46 | 1.3% |
| Russian | 10 | 0.3% |
| Scotch-Irish | 51 | 1.4% |
| Scottish | 67 | 1.8% |
| Slovak | 20 | 0.5% |
| South American | 9 | 0.2% |
| Swedish | 7 | 0.2% |
| Syrian | 16 | 0.4% |
| Ukrainian | 11 | 0.3% |
| Welsh | 20 | 0.5% | View All 32 Rows |
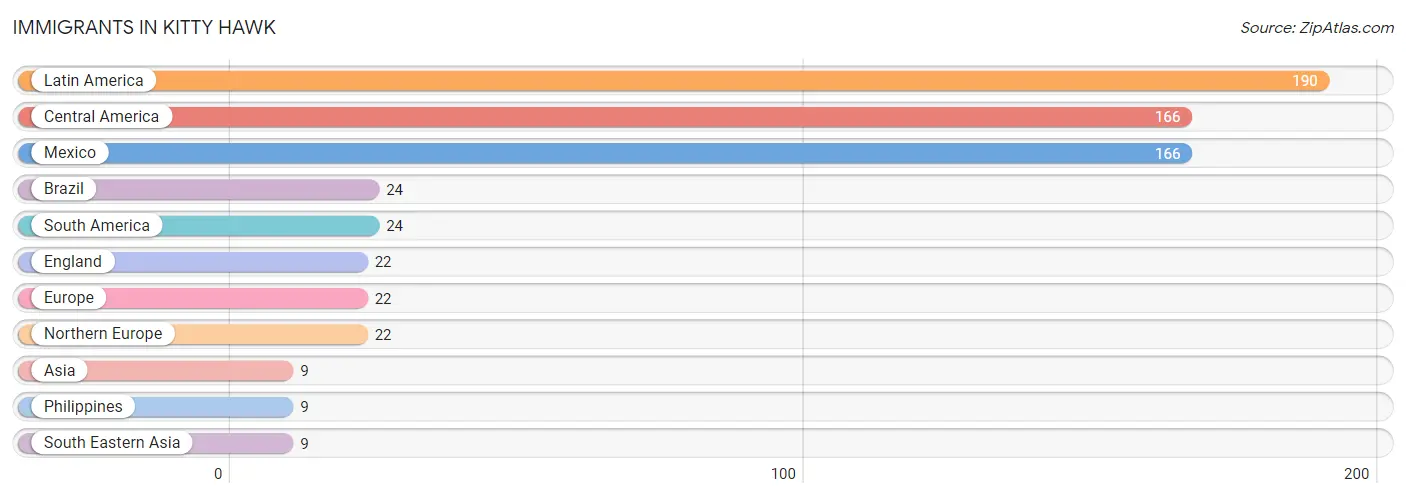
Immigrants in Kitty Hawk
The most numerous immigrant groups reported in Kitty Hawk came from Latin America (190 | 5.1%), Central America (166 | 4.5%), Mexico (166 | 4.5%), Brazil (24 | 0.6%), and South America (24 | 0.6%), together accounting for 15.5% of all Kitty Hawk residents.
| Immigration Origin | # Population | % Population |
| Asia | 9 | 0.2% |
| Brazil | 24 | 0.6% |
| Central America | 166 | 4.5% |
| England | 22 | 0.6% |
| Europe | 22 | 0.6% |
| Latin America | 190 | 5.1% |
| Mexico | 166 | 4.5% |
| Northern Europe | 22 | 0.6% |
| Philippines | 9 | 0.2% |
| South America | 24 | 0.6% |
| South Eastern Asia | 9 | 0.2% | View All 11 Rows |
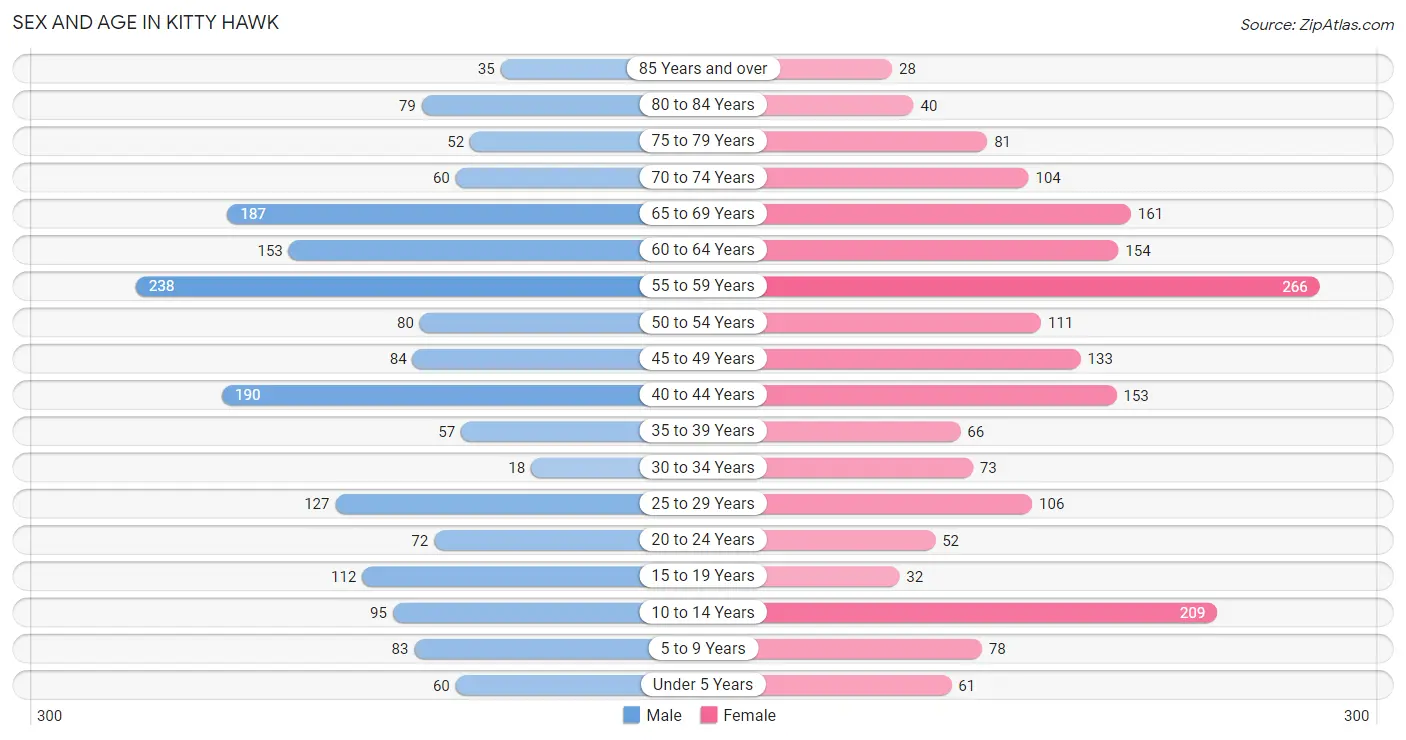
Sex and Age in Kitty Hawk
Sex and Age in Kitty Hawk
The most populous age groups in Kitty Hawk are 55 to 59 Years (238 | 13.4%) for men and 55 to 59 Years (266 | 13.9%) for women.
| Age Bracket | Male | Female |
| Under 5 Years | 60 (3.4%) | 61 (3.2%) |
| 5 to 9 Years | 83 (4.7%) | 78 (4.1%) |
| 10 to 14 Years | 95 (5.3%) | 209 (11.0%) |
| 15 to 19 Years | 112 (6.3%) | 32 (1.7%) |
| 20 to 24 Years | 72 (4.0%) | 52 (2.7%) |
| 25 to 29 Years | 127 (7.1%) | 106 (5.6%) |
| 30 to 34 Years | 18 (1.0%) | 73 (3.8%) |
| 35 to 39 Years | 57 (3.2%) | 66 (3.5%) |
| 40 to 44 Years | 190 (10.7%) | 153 (8.0%) |
| 45 to 49 Years | 84 (4.7%) | 133 (7.0%) |
| 50 to 54 Years | 80 (4.5%) | 111 (5.8%) |
| 55 to 59 Years | 238 (13.4%) | 266 (13.9%) |
| 60 to 64 Years | 153 (8.6%) | 154 (8.1%) |
| 65 to 69 Years | 187 (10.5%) | 161 (8.4%) |
| 70 to 74 Years | 60 (3.4%) | 104 (5.4%) |
| 75 to 79 Years | 52 (2.9%) | 81 (4.3%) |
| 80 to 84 Years | 79 (4.4%) | 40 (2.1%) |
| 85 Years and over | 35 (2.0%) | 28 (1.5%) |
| Total | 1,782 (100.0%) | 1,908 (100.0%) |
Families and Households in Kitty Hawk
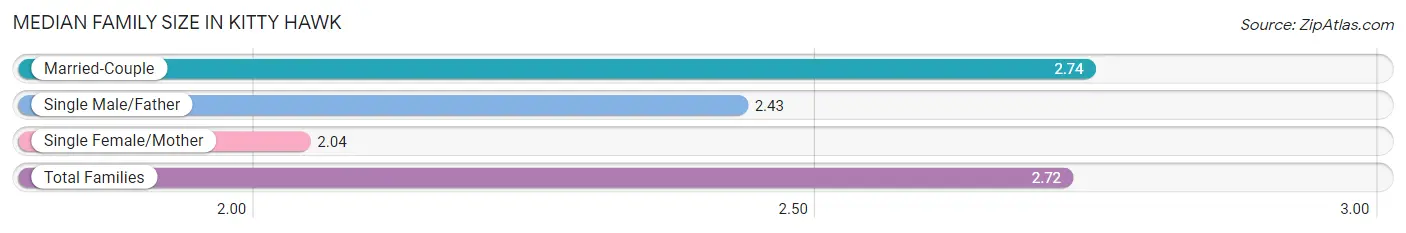
Median Family Size in Kitty Hawk
The median family size in Kitty Hawk is 2.72 persons per family, with married-couple families (1,093 | 95.6%) accounting for the largest median family size of 2.74 persons per family. On the other hand, single female/mother families (27 | 2.4%) represent the smallest median family size with 2.04 persons per family.
| Family Type | # Families | Family Size |
| Married-Couple | 1,093 (95.6%) | 2.74 |
| Single Male/Father | 23 (2.0%) | 2.43 |
| Single Female/Mother | 27 (2.4%) | 2.04 |
| Total Families | 1,143 (100.0%) | 2.72 |
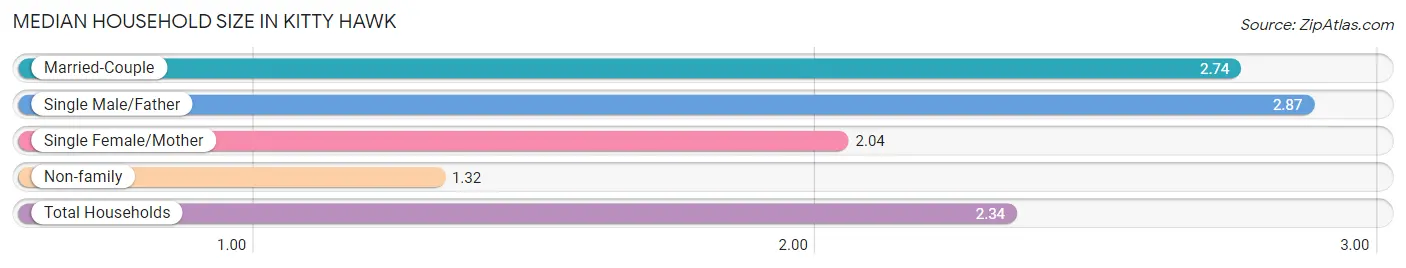
Median Household Size in Kitty Hawk
The median household size in Kitty Hawk is 2.34 persons per household, with single male/father households (23 | 1.5%) accounting for the largest median household size of 2.87 persons per household. non-family households (435 | 27.6%) represent the smallest median household size with 1.32 persons per household.
| Household Type | # Households | Household Size |
| Married-Couple | 1,093 (69.3%) | 2.74 |
| Single Male/Father | 23 (1.5%) | 2.87 |
| Single Female/Mother | 27 (1.7%) | 2.04 |
| Non-family | 435 (27.6%) | 1.32 |
| Total Households | 1,578 (100.0%) | 2.34 |
Household Size by Marriage Status in Kitty Hawk
Out of a total of 1,578 households in Kitty Hawk, 1,143 (72.4%) are family households, while 435 (27.6%) are nonfamily households. The most numerous type of family households are 2-person households, comprising 568, and the most common type of nonfamily households are 1-person households, comprising 320.
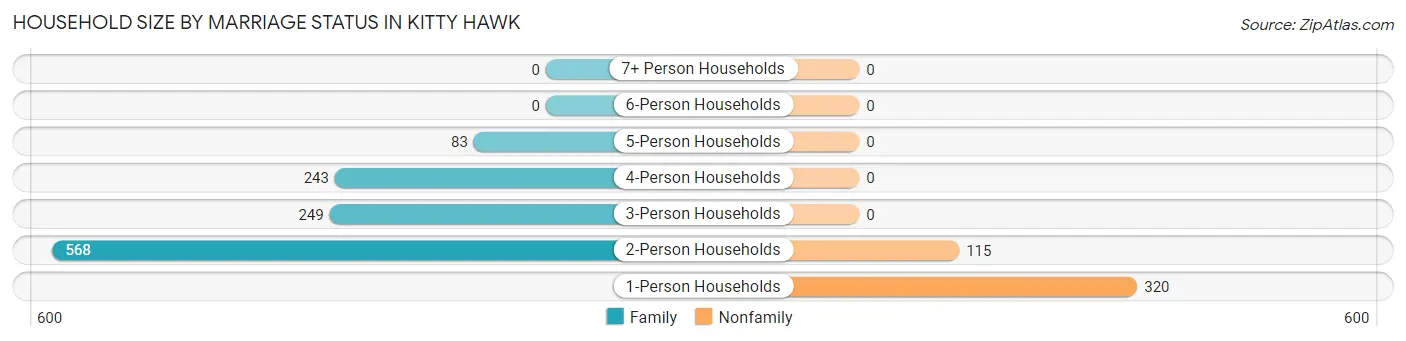
| Household Size | Family Households | Nonfamily Households |
| 1-Person Households | - | 320 (20.3%) |
| 2-Person Households | 568 (36.0%) | 115 (7.3%) |
| 3-Person Households | 249 (15.8%) | 0 (0.0%) |
| 4-Person Households | 243 (15.4%) | 0 (0.0%) |
| 5-Person Households | 83 (5.3%) | 0 (0.0%) |
| 6-Person Households | 0 (0.0%) | 0 (0.0%) |
| 7+ Person Households | 0 (0.0%) | 0 (0.0%) |
| Total | 1,143 (72.4%) | 435 (27.6%) |
Female Fertility in Kitty Hawk
Fertility by Age in Kitty Hawk
Average fertility rate in Kitty Hawk is 19.0 births per 1,000 women. Women in the age bracket of 35 to 50 years have the highest fertility rate with 32.0 births per 1,000 women. Women in the age bracket of 35 to 50 years acount for 100.0% of all women with births.
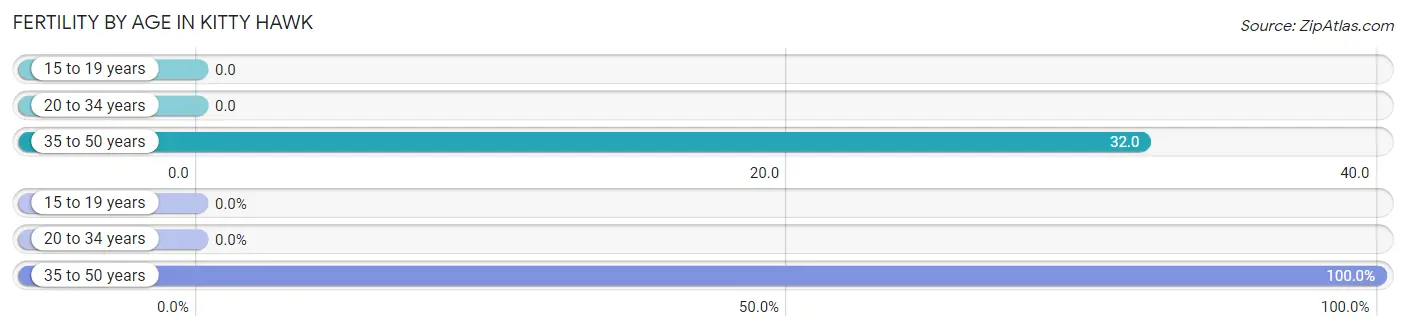
| Age Bracket | Women with Births | Births / 1,000 Women |
| 15 to 19 years | 0 (0.0%) | 0.0 |
| 20 to 34 years | 0 (0.0%) | 0.0 |
| 35 to 50 years | 12 (100.0%) | 32.0 |
| Total | 12 (100.0%) | 19.0 |
Fertility by Age by Marriage Status in Kitty Hawk
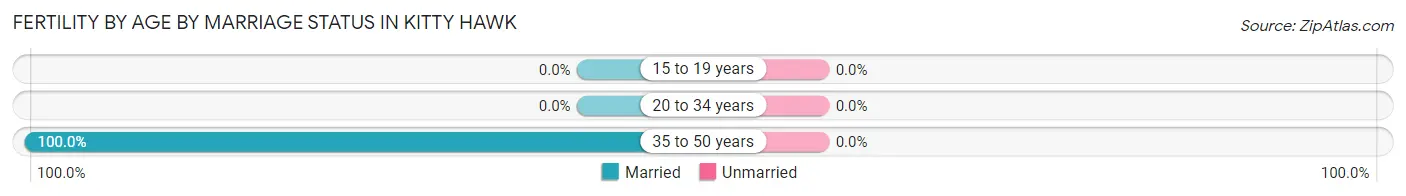
| Age Bracket | Married | Unmarried |
| 15 to 19 years | 0 (0.0%) | 0 (0.0%) |
| 20 to 34 years | 0 (0.0%) | 0 (0.0%) |
| 35 to 50 years | 12 (100.0%) | 0 (0.0%) |
| Total | 12 (100.0%) | 0 (0.0%) |
Fertility by Education in Kitty Hawk
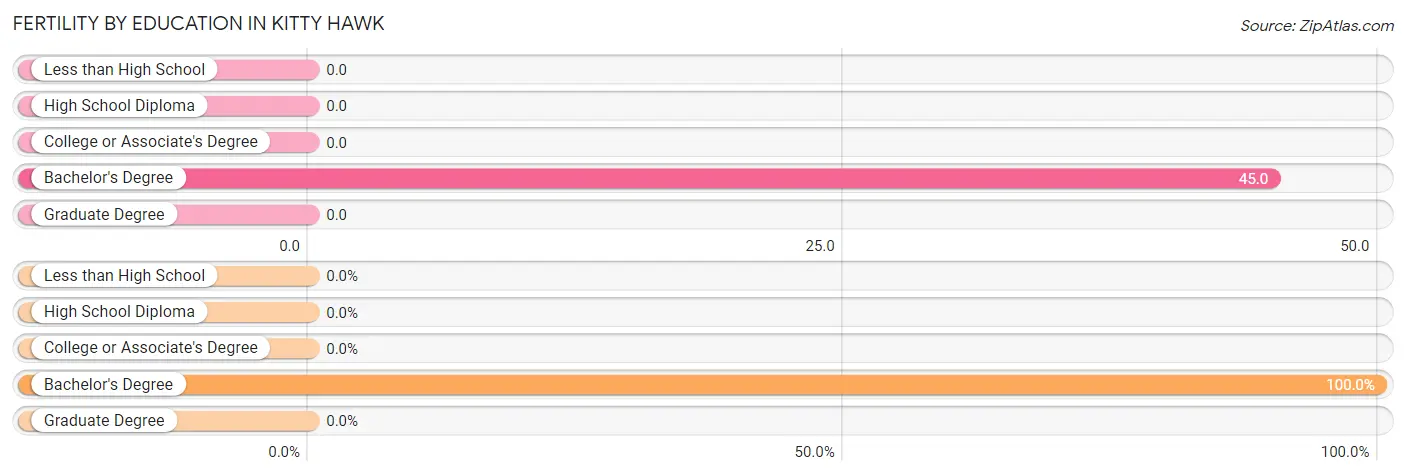
| Educational Attainment | Women with Births | Births / 1,000 Women |
| Less than High School | 0 (0.0%) | 0.0 |
| High School Diploma | 0 (0.0%) | 0.0 |
| College or Associate's Degree | 0 (0.0%) | 0.0 |
| Bachelor's Degree | 12 (100.0%) | 45.0 |
| Graduate Degree | 0 (0.0%) | 0.0 |
| Total | 12 (100.0%) | 19.0 |
Fertility by Education by Marriage Status in Kitty Hawk
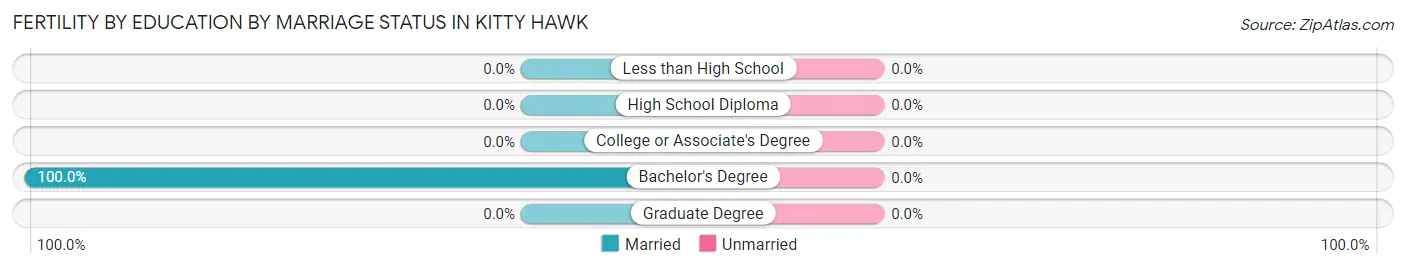
| Educational Attainment | Married | Unmarried |
| Less than High School | 0 (0.0%) | 0 (0.0%) |
| High School Diploma | 0 (0.0%) | 0 (0.0%) |
| College or Associate's Degree | 0 (0.0%) | 0 (0.0%) |
| Bachelor's Degree | 12 (100.0%) | 0 (0.0%) |
| Graduate Degree | 0 (0.0%) | 0 (0.0%) |
| Total | 12 (100.0%) | 0 (0.0%) |
Employment Characteristics in Kitty Hawk
Employment by Class of Employer in Kitty Hawk
Among the 1,960 employed individuals in Kitty Hawk, private company employees (1,131 | 57.7%), self-employed (incorporated) (287 | 14.6%), and self-employed (not incorporated) (269 | 13.7%) make up the most common classes of employment.
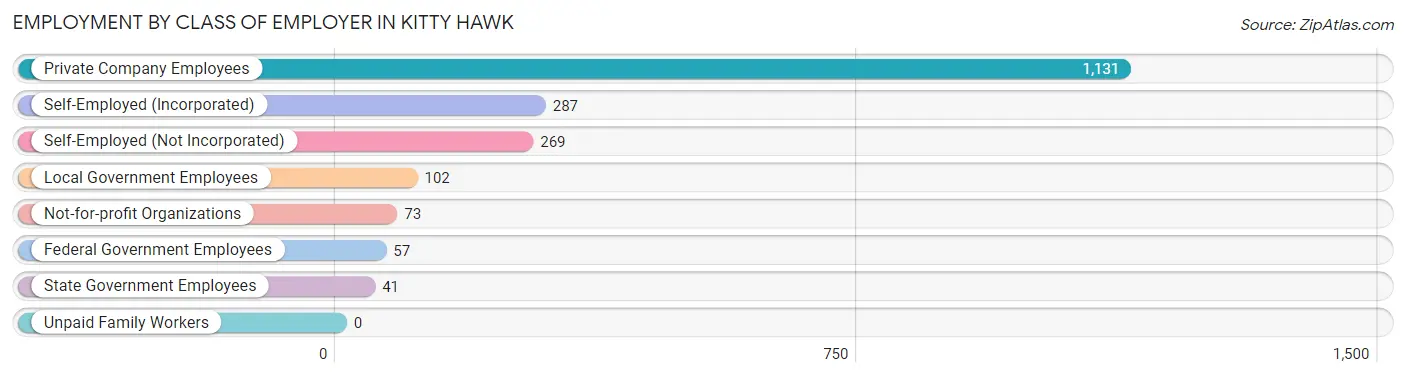
| Employer Class | # Employees | % Employees |
| Private Company Employees | 1,131 | 57.7% |
| Self-Employed (Incorporated) | 287 | 14.6% |
| Self-Employed (Not Incorporated) | 269 | 13.7% |
| Not-for-profit Organizations | 73 | 3.7% |
| Local Government Employees | 102 | 5.2% |
| State Government Employees | 41 | 2.1% |
| Federal Government Employees | 57 | 2.9% |
| Unpaid Family Workers | 0 | 0.0% |
| Total | 1,960 | 100.0% |
Employment Status by Age in Kitty Hawk
According to the labor force statistics for Kitty Hawk, out of the total population over 16 years of age (3,074), 69.8% or 2,146 individuals are in the labor force, with 7.1% or 152 of them unemployed. The age group with the highest labor force participation rate is 25 to 29 years, with 100.0% or 233 individuals in the labor force. Within the labor force, the 30 to 34 years age range has the highest percentage of unemployed individuals, with 42.9% or 33 of them being unemployed.
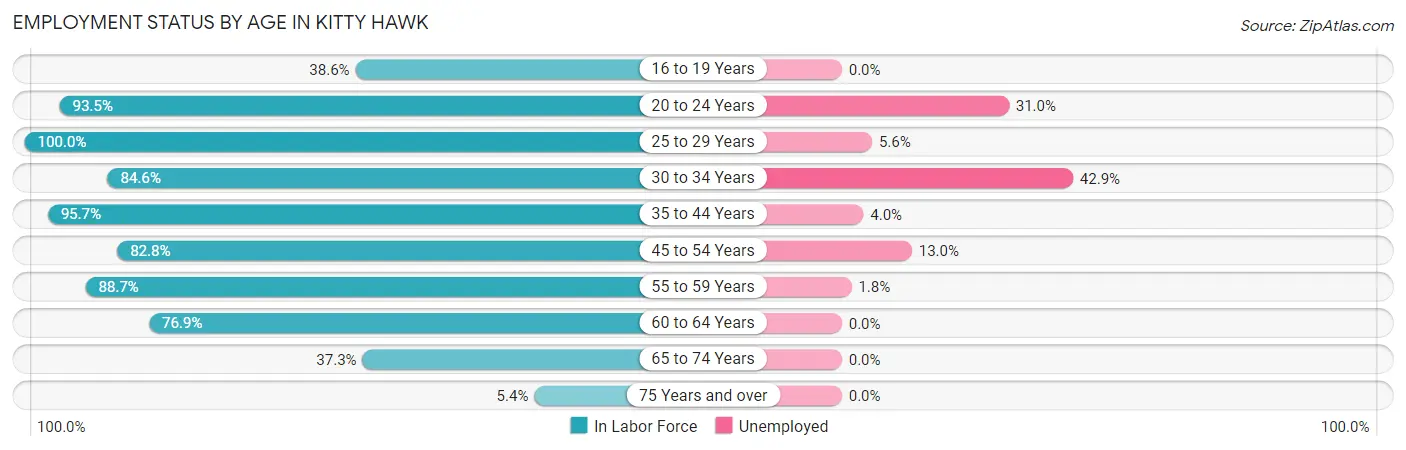
| Age Bracket | In Labor Force | Unemployed |
| 16 to 19 Years | 44 (38.6%) | 0 (0.0%) |
| 20 to 24 Years | 116 (93.5%) | 36 (31.0%) |
| 25 to 29 Years | 233 (100.0%) | 13 (5.6%) |
| 30 to 34 Years | 77 (84.6%) | 33 (42.9%) |
| 35 to 44 Years | 446 (95.7%) | 18 (4.0%) |
| 45 to 54 Years | 338 (82.8%) | 44 (13.0%) |
| 55 to 59 Years | 447 (88.7%) | 8 (1.8%) |
| 60 to 64 Years | 236 (76.9%) | 0 (0.0%) |
| 65 to 74 Years | 191 (37.3%) | 0 (0.0%) |
| 75 Years and over | 17 (5.4%) | 0 (0.0%) |
| Total | 2,146 (69.8%) | 152 (7.1%) |
Employment Status by Educational Attainment in Kitty Hawk
According to labor force statistics for Kitty Hawk, 88.5% of individuals (1,778) out of the total population between 25 and 64 years of age (2,009) are in the labor force, with 6.5% or 116 of them being unemployed. The group with the highest labor force participation rate are those with the educational attainment of bachelor's degree or higher, with 92.5% or 779 individuals in the labor force. Within the labor force, individuals with college / associate degree education have the highest percentage of unemployment, with 12.6% or 72 of them being unemployed.
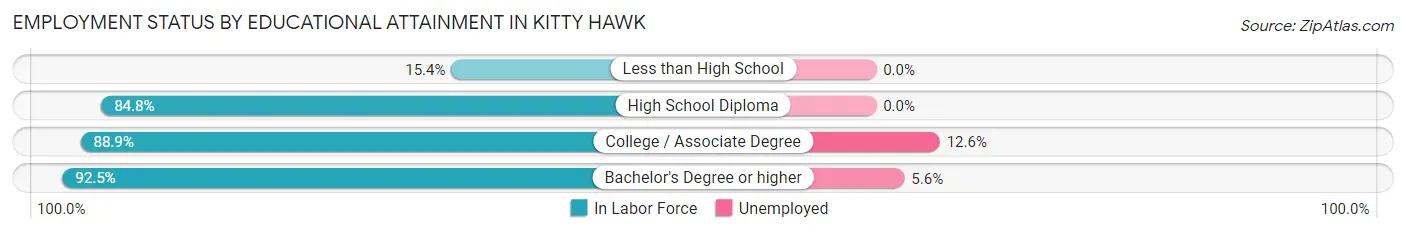
| Educational Attainment | In Labor Force | Unemployed |
| Less than High School | 4 (15.4%) | 0 (0.0%) |
| High School Diploma | 423 (84.8%) | 0 (0.0%) |
| College / Associate Degree | 571 (88.9%) | 81 (12.6%) |
| Bachelor's Degree or higher | 779 (92.5%) | 47 (5.6%) |
| Total | 1,778 (88.5%) | 131 (6.5%) |
Employment Occupations by Sex in Kitty Hawk
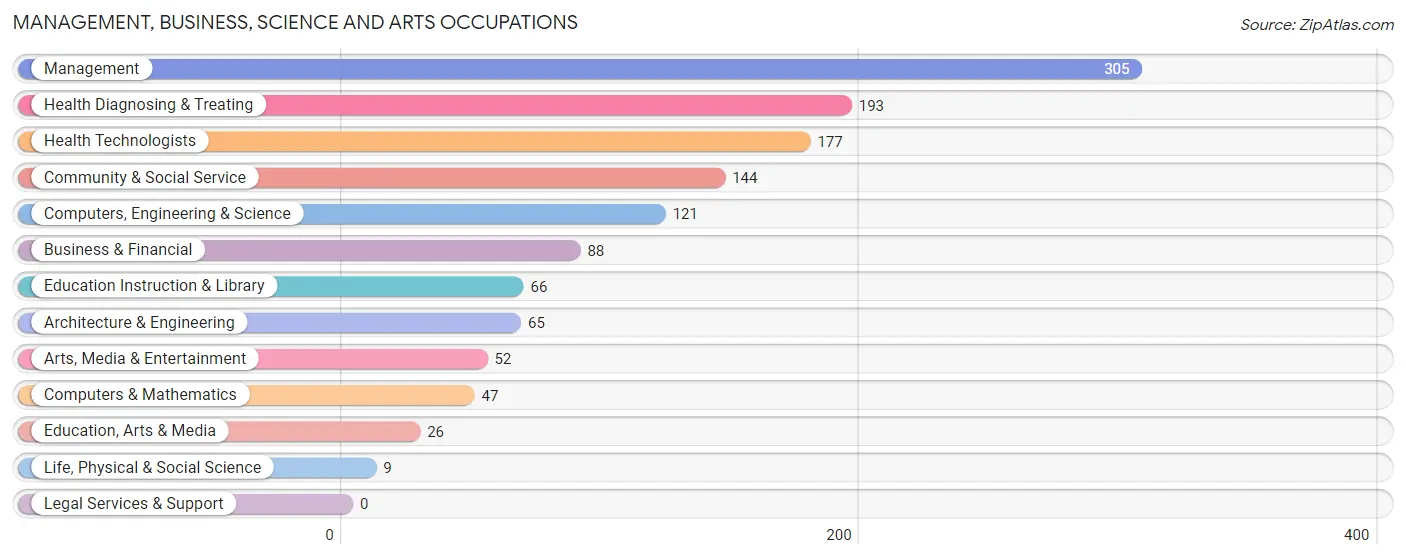
Management, Business, Science and Arts Occupations
The most common Management, Business, Science and Arts occupations in Kitty Hawk are Management (305 | 15.3%), Health Diagnosing & Treating (193 | 9.7%), Health Technologists (177 | 8.9%), Community & Social Service (144 | 7.2%), and Computers, Engineering & Science (121 | 6.1%).
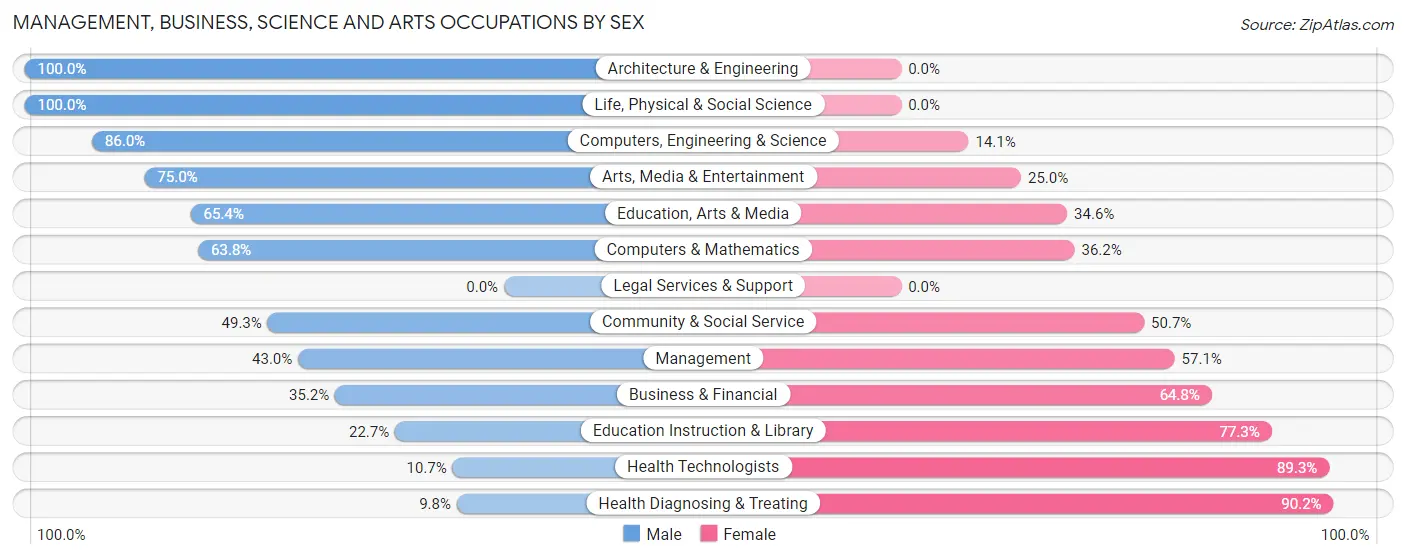
Management, Business, Science and Arts Occupations by Sex
Within the Management, Business, Science and Arts occupations in Kitty Hawk, the most male-oriented occupations are Architecture & Engineering (100.0%), Life, Physical & Social Science (100.0%), and Computers, Engineering & Science (86.0%), while the most female-oriented occupations are Health Diagnosing & Treating (90.2%), Health Technologists (89.3%), and Education Instruction & Library (77.3%).
| Occupation | Male | Female |
| Management | 131 (42.9%) | 174 (57.1%) |
| Business & Financial | 31 (35.2%) | 57 (64.8%) |
| Computers, Engineering & Science | 104 (86.0%) | 17 (14.1%) |
| Computers & Mathematics | 30 (63.8%) | 17 (36.2%) |
| Architecture & Engineering | 65 (100.0%) | 0 (0.0%) |
| Life, Physical & Social Science | 9 (100.0%) | 0 (0.0%) |
| Community & Social Service | 71 (49.3%) | 73 (50.7%) |
| Education, Arts & Media | 17 (65.4%) | 9 (34.6%) |
| Legal Services & Support | 0 (0.0%) | 0 (0.0%) |
| Education Instruction & Library | 15 (22.7%) | 51 (77.3%) |
| Arts, Media & Entertainment | 39 (75.0%) | 13 (25.0%) |
| Health Diagnosing & Treating | 19 (9.8%) | 174 (90.2%) |
| Health Technologists | 19 (10.7%) | 158 (89.3%) |
| Total (Category) | 356 (41.8%) | 495 (58.2%) |
| Total (Overall) | 1,045 (52.4%) | 948 (47.6%) |
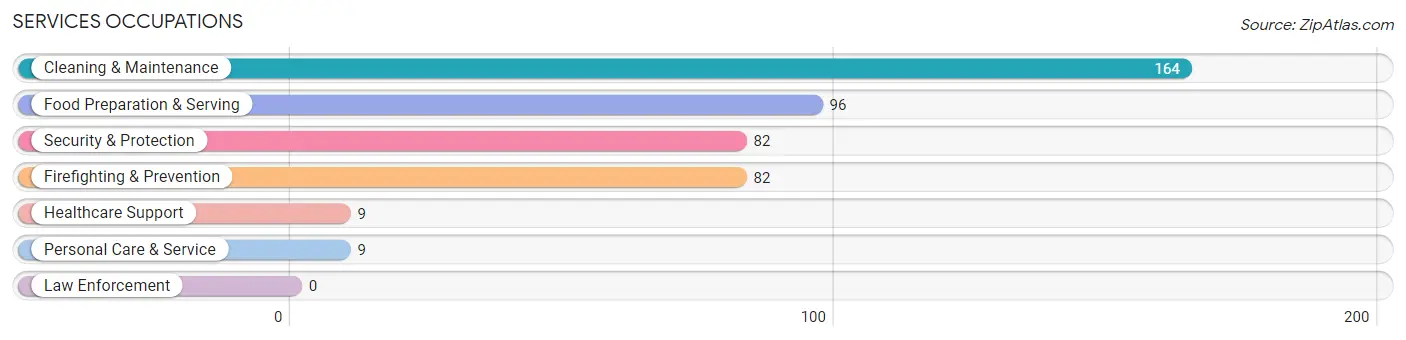
Services Occupations
The most common Services occupations in Kitty Hawk are Cleaning & Maintenance (164 | 8.2%), Food Preparation & Serving (96 | 4.8%), Security & Protection (82 | 4.1%), Firefighting & Prevention (82 | 4.1%), and Healthcare Support (9 | 0.4%).
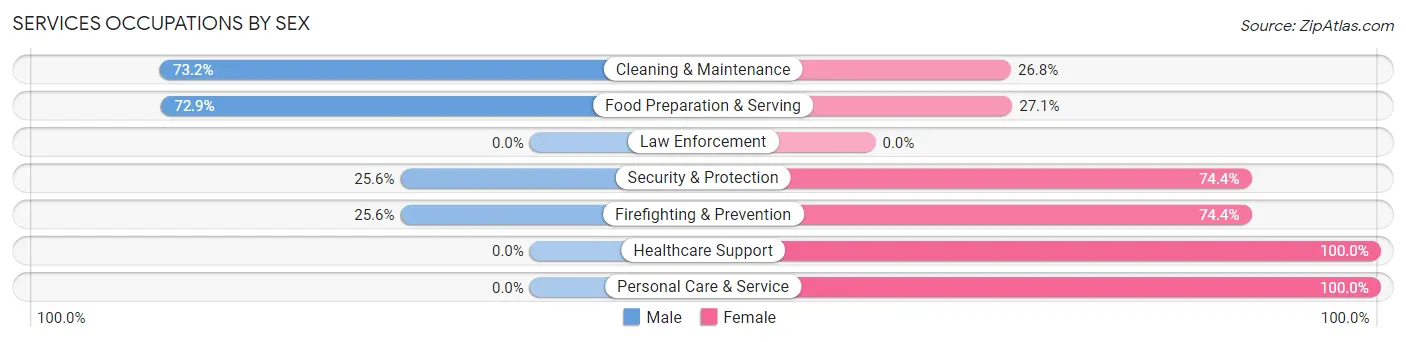
Services Occupations by Sex
Within the Services occupations in Kitty Hawk, the most male-oriented occupations are Cleaning & Maintenance (73.2%), Food Preparation & Serving (72.9%), and Security & Protection (25.6%), while the most female-oriented occupations are Healthcare Support (100.0%), Personal Care & Service (100.0%), and Security & Protection (74.4%).
| Occupation | Male | Female |
| Healthcare Support | 0 (0.0%) | 9 (100.0%) |
| Security & Protection | 21 (25.6%) | 61 (74.4%) |
| Firefighting & Prevention | 21 (25.6%) | 61 (74.4%) |
| Law Enforcement | 0 (0.0%) | 0 (0.0%) |
| Food Preparation & Serving | 70 (72.9%) | 26 (27.1%) |
| Cleaning & Maintenance | 120 (73.2%) | 44 (26.8%) |
| Personal Care & Service | 0 (0.0%) | 9 (100.0%) |
| Total (Category) | 211 (58.6%) | 149 (41.4%) |
| Total (Overall) | 1,045 (52.4%) | 948 (47.6%) |
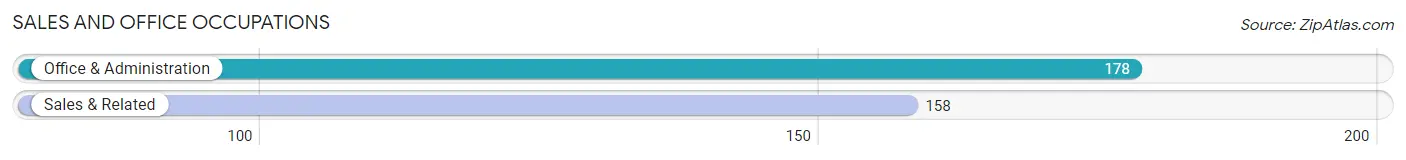
Sales and Office Occupations
The most common Sales and Office occupations in Kitty Hawk are Office & Administration (178 | 8.9%), and Sales & Related (158 | 7.9%).
Sales and Office Occupations by Sex
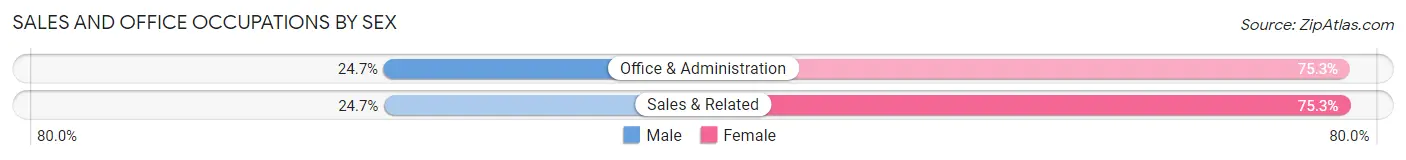
| Occupation | Male | Female |
| Sales & Related | 39 (24.7%) | 119 (75.3%) |
| Office & Administration | 44 (24.7%) | 134 (75.3%) |
| Total (Category) | 83 (24.7%) | 253 (75.3%) |
| Total (Overall) | 1,045 (52.4%) | 948 (47.6%) |
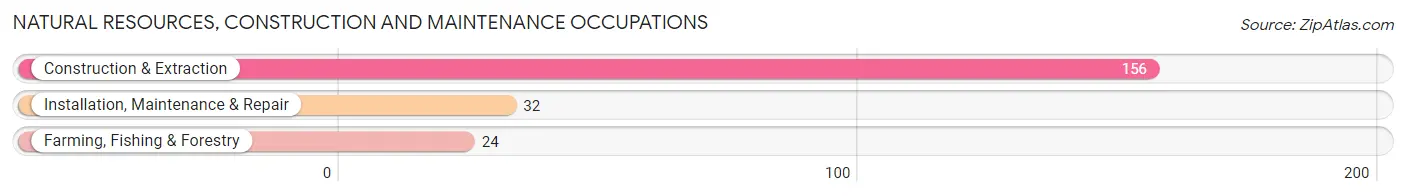
Natural Resources, Construction and Maintenance Occupations
The most common Natural Resources, Construction and Maintenance occupations in Kitty Hawk are Construction & Extraction (156 | 7.8%), Installation, Maintenance & Repair (32 | 1.6%), and Farming, Fishing & Forestry (24 | 1.2%).
Natural Resources, Construction and Maintenance Occupations by Sex
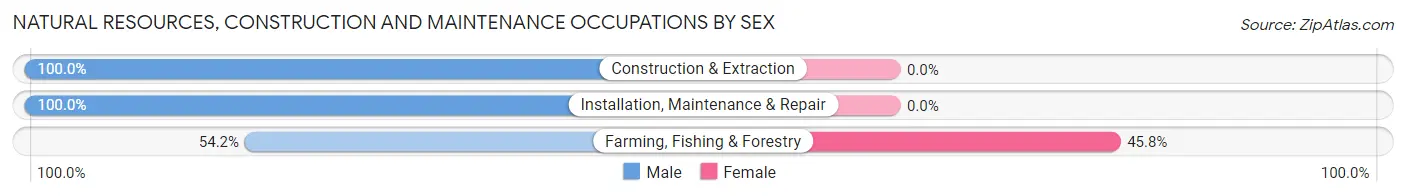
| Occupation | Male | Female |
| Farming, Fishing & Forestry | 13 (54.2%) | 11 (45.8%) |
| Construction & Extraction | 156 (100.0%) | 0 (0.0%) |
| Installation, Maintenance & Repair | 32 (100.0%) | 0 (0.0%) |
| Total (Category) | 201 (94.8%) | 11 (5.2%) |
| Total (Overall) | 1,045 (52.4%) | 948 (47.6%) |
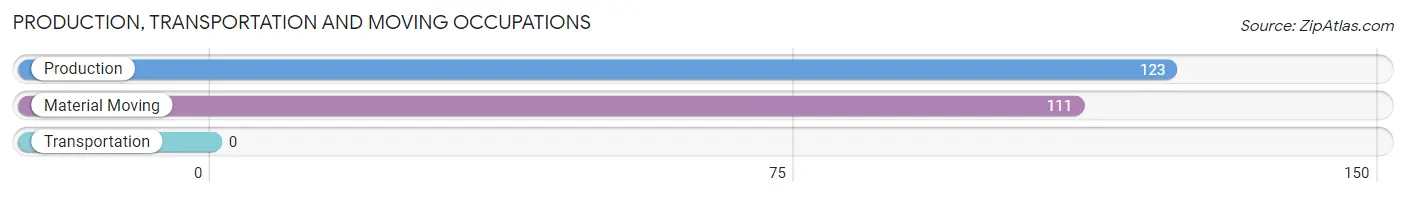
Production, Transportation and Moving Occupations
The most common Production, Transportation and Moving occupations in Kitty Hawk are Production (123 | 6.2%), and Material Moving (111 | 5.6%).
Production, Transportation and Moving Occupations by Sex
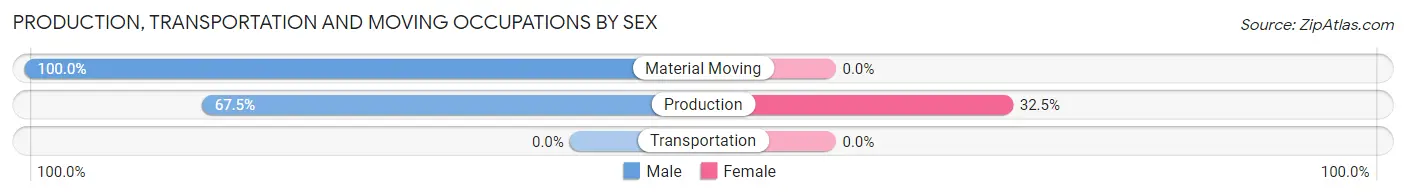
| Occupation | Male | Female |
| Production | 83 (67.5%) | 40 (32.5%) |
| Transportation | 0 (0.0%) | 0 (0.0%) |
| Material Moving | 111 (100.0%) | 0 (0.0%) |
| Total (Category) | 194 (82.9%) | 40 (17.1%) |
| Total (Overall) | 1,045 (52.4%) | 948 (47.6%) |
Employment Industries by Sex in Kitty Hawk
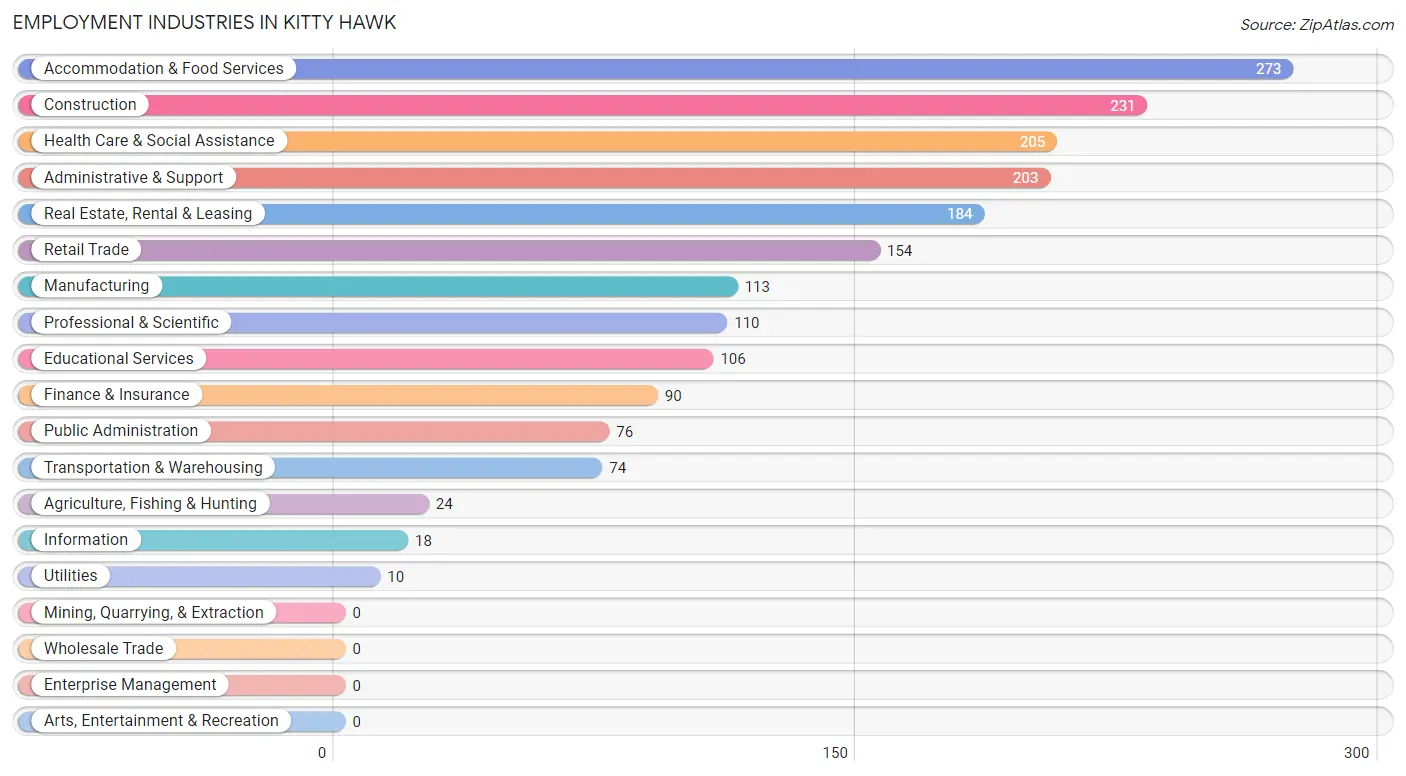
Employment Industries in Kitty Hawk
The major employment industries in Kitty Hawk include Accommodation & Food Services (273 | 13.7%), Construction (231 | 11.6%), Health Care & Social Assistance (205 | 10.3%), Administrative & Support (203 | 10.2%), and Real Estate, Rental & Leasing (184 | 9.2%).
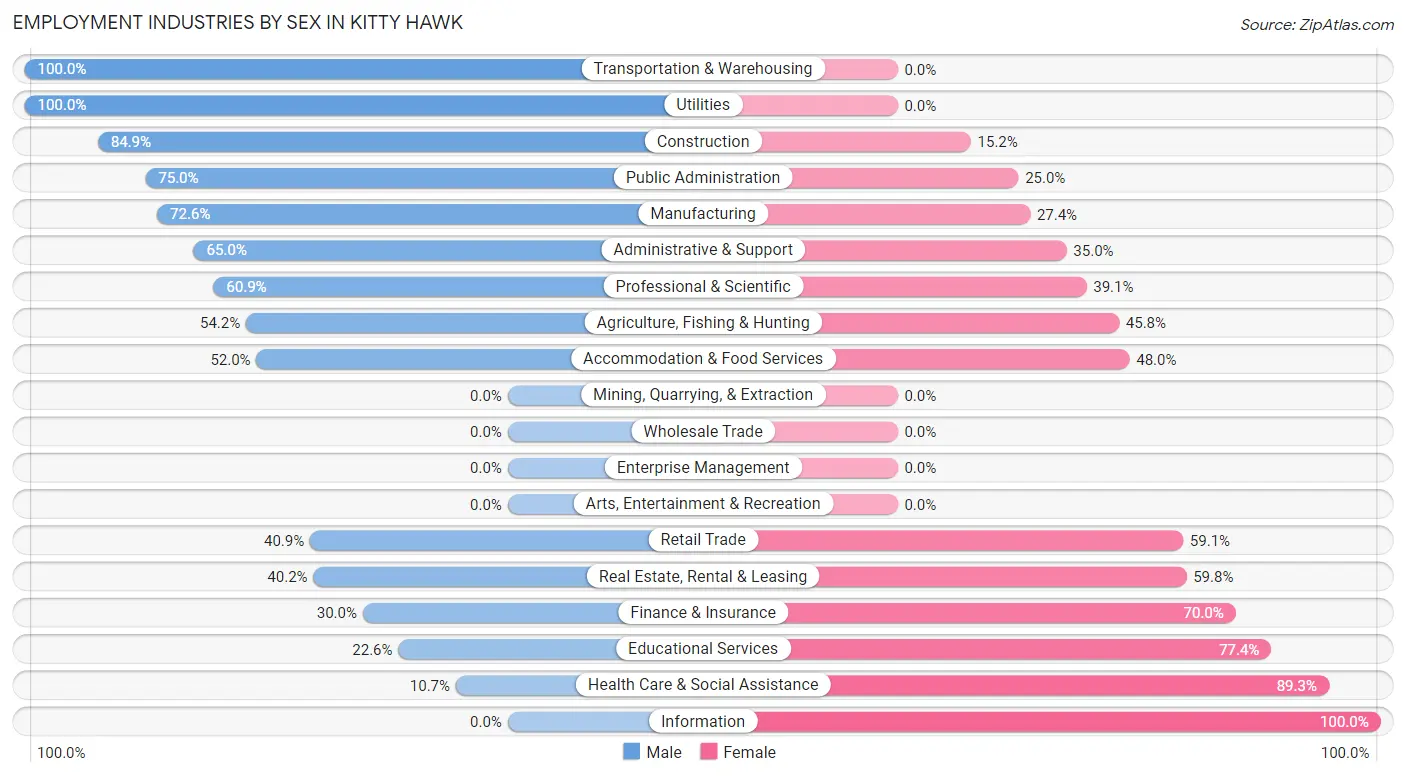
Employment Industries by Sex in Kitty Hawk
The Kitty Hawk industries that see more men than women are Transportation & Warehousing (100.0%), Utilities (100.0%), and Construction (84.9%), whereas the industries that tend to have a higher number of women are Information (100.0%), Health Care & Social Assistance (89.3%), and Educational Services (77.4%).
| Industry | Male | Female |
| Agriculture, Fishing & Hunting | 13 (54.2%) | 11 (45.8%) |
| Mining, Quarrying, & Extraction | 0 (0.0%) | 0 (0.0%) |
| Construction | 196 (84.9%) | 35 (15.1%) |
| Manufacturing | 82 (72.6%) | 31 (27.4%) |
| Wholesale Trade | 0 (0.0%) | 0 (0.0%) |
| Retail Trade | 63 (40.9%) | 91 (59.1%) |
| Transportation & Warehousing | 74 (100.0%) | 0 (0.0%) |
| Utilities | 10 (100.0%) | 0 (0.0%) |
| Information | 0 (0.0%) | 18 (100.0%) |
| Finance & Insurance | 27 (30.0%) | 63 (70.0%) |
| Real Estate, Rental & Leasing | 74 (40.2%) | 110 (59.8%) |
| Professional & Scientific | 67 (60.9%) | 43 (39.1%) |
| Enterprise Management | 0 (0.0%) | 0 (0.0%) |
| Administrative & Support | 132 (65.0%) | 71 (35.0%) |
| Educational Services | 24 (22.6%) | 82 (77.4%) |
| Health Care & Social Assistance | 22 (10.7%) | 183 (89.3%) |
| Arts, Entertainment & Recreation | 0 (0.0%) | 0 (0.0%) |
| Accommodation & Food Services | 142 (52.0%) | 131 (48.0%) |
| Public Administration | 57 (75.0%) | 19 (25.0%) |
| Total | 1,045 (52.4%) | 948 (47.6%) |
Education in Kitty Hawk
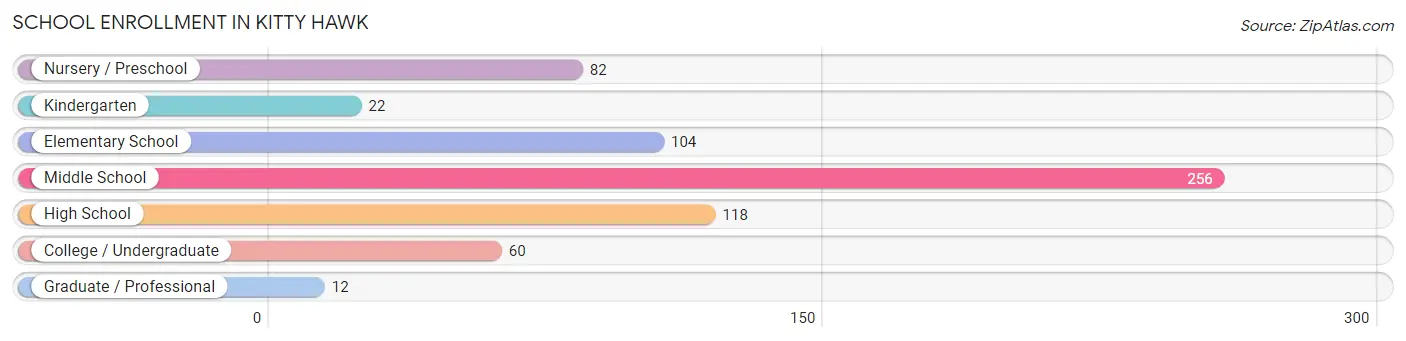
School Enrollment in Kitty Hawk
The most common levels of schooling among the 654 students in Kitty Hawk are middle school (256 | 39.1%), high school (118 | 18.0%), and elementary school (104 | 15.9%).
| School Level | # Students | % Students |
| Nursery / Preschool | 82 | 12.5% |
| Kindergarten | 22 | 3.4% |
| Elementary School | 104 | 15.9% |
| Middle School | 256 | 39.1% |
| High School | 118 | 18.0% |
| College / Undergraduate | 60 | 9.2% |
| Graduate / Professional | 12 | 1.8% |
| Total | 654 | 100.0% |
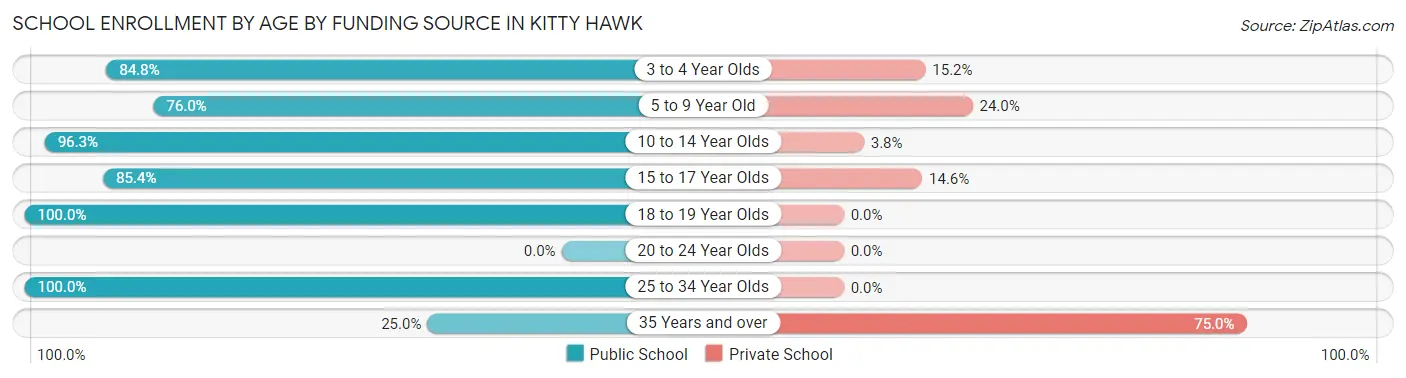
School Enrollment by Age by Funding Source in Kitty Hawk
Out of a total of 654 students who are enrolled in schools in Kitty Hawk, 79 (12.1%) attend a private institution, while the remaining 575 (87.9%) are enrolled in public schools. The age group of 35 years and over has the highest likelihood of being enrolled in private schools, with 12 (75.0% in the age bracket) enrolled. Conversely, the age group of 18 to 19 year olds has the lowest likelihood of being enrolled in a private school, with 27 (100.0% in the age bracket) attending a public institution.
| Age Bracket | Public School | Private School |
| 3 to 4 Year Olds | 39 (84.8%) | 7 (15.2%) |
| 5 to 9 Year Old | 114 (76.0%) | 36 (24.0%) |
| 10 to 14 Year Olds | 282 (96.3%) | 11 (3.7%) |
| 15 to 17 Year Olds | 76 (85.4%) | 13 (14.6%) |
| 18 to 19 Year Olds | 27 (100.0%) | 0 (0.0%) |
| 20 to 24 Year Olds | 0 (0.0%) | 0 (0.0%) |
| 25 to 34 Year Olds | 33 (100.0%) | 0 (0.0%) |
| 35 Years and over | 4 (25.0%) | 12 (75.0%) |
| Total | 575 (87.9%) | 79 (12.1%) |
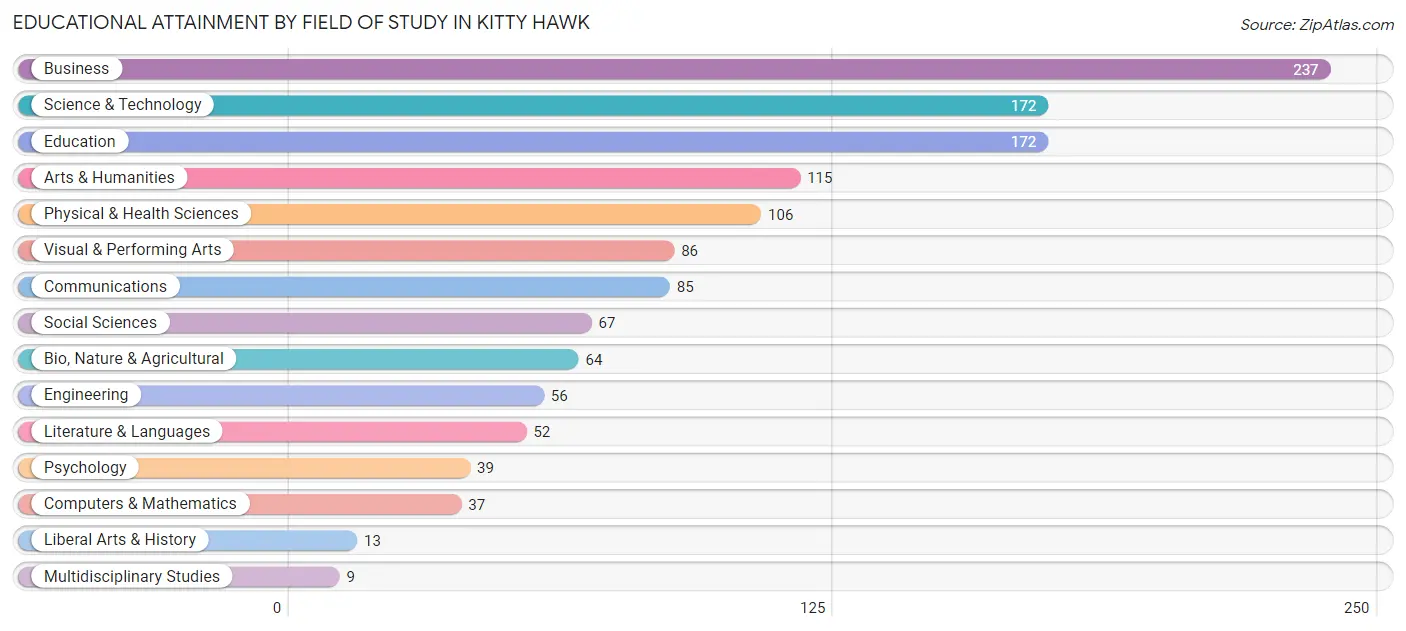
Educational Attainment by Field of Study in Kitty Hawk
Business (237 | 18.1%), science & technology (172 | 13.1%), education (172 | 13.1%), arts & humanities (115 | 8.8%), and physical & health sciences (106 | 8.1%) are the most common fields of study among 1,310 individuals in Kitty Hawk who have obtained a bachelor's degree or higher.
| Field of Study | # Graduates | % Graduates |
| Computers & Mathematics | 37 | 2.8% |
| Bio, Nature & Agricultural | 64 | 4.9% |
| Physical & Health Sciences | 106 | 8.1% |
| Psychology | 39 | 3.0% |
| Social Sciences | 67 | 5.1% |
| Engineering | 56 | 4.3% |
| Multidisciplinary Studies | 9 | 0.7% |
| Science & Technology | 172 | 13.1% |
| Business | 237 | 18.1% |
| Education | 172 | 13.1% |
| Literature & Languages | 52 | 4.0% |
| Liberal Arts & History | 13 | 1.0% |
| Visual & Performing Arts | 86 | 6.6% |
| Communications | 85 | 6.5% |
| Arts & Humanities | 115 | 8.8% |
| Total | 1,310 | 100.0% |
Transportation & Commute in Kitty Hawk
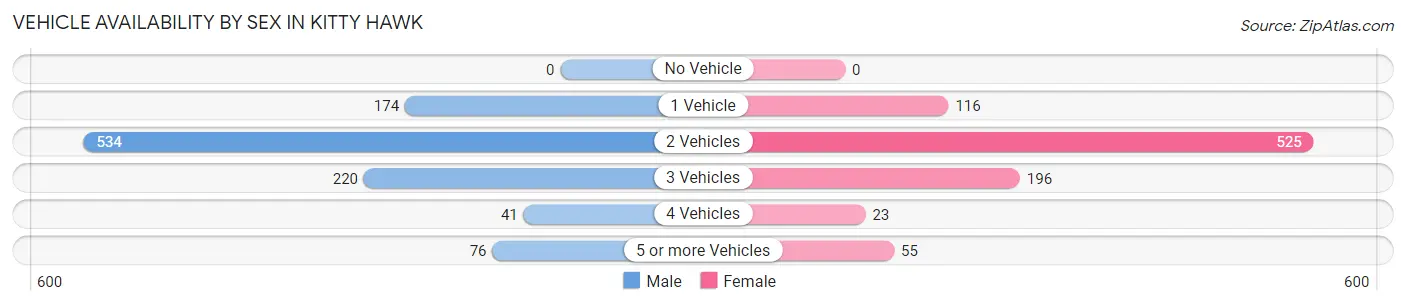
Vehicle Availability by Sex in Kitty Hawk
The most prevalent vehicle ownership categories in Kitty Hawk are males with 2 vehicles (534, accounting for 51.1%) and females with 2 vehicles (525, making up 58.4%).
| Vehicles Available | Male | Female |
| No Vehicle | 0 (0.0%) | 0 (0.0%) |
| 1 Vehicle | 174 (16.7%) | 116 (12.7%) |
| 2 Vehicles | 534 (51.1%) | 525 (57.4%) |
| 3 Vehicles | 220 (21.0%) | 196 (21.4%) |
| 4 Vehicles | 41 (3.9%) | 23 (2.5%) |
| 5 or more Vehicles | 76 (7.3%) | 55 (6.0%) |
| Total | 1,045 (100.0%) | 915 (100.0%) |
Commute Time in Kitty Hawk
The most frequently occuring commute durations in Kitty Hawk are 5 to 9 minutes (334 commuters, 20.4%), 15 to 19 minutes (317 commuters, 19.4%), and 20 to 24 minutes (235 commuters, 14.3%).
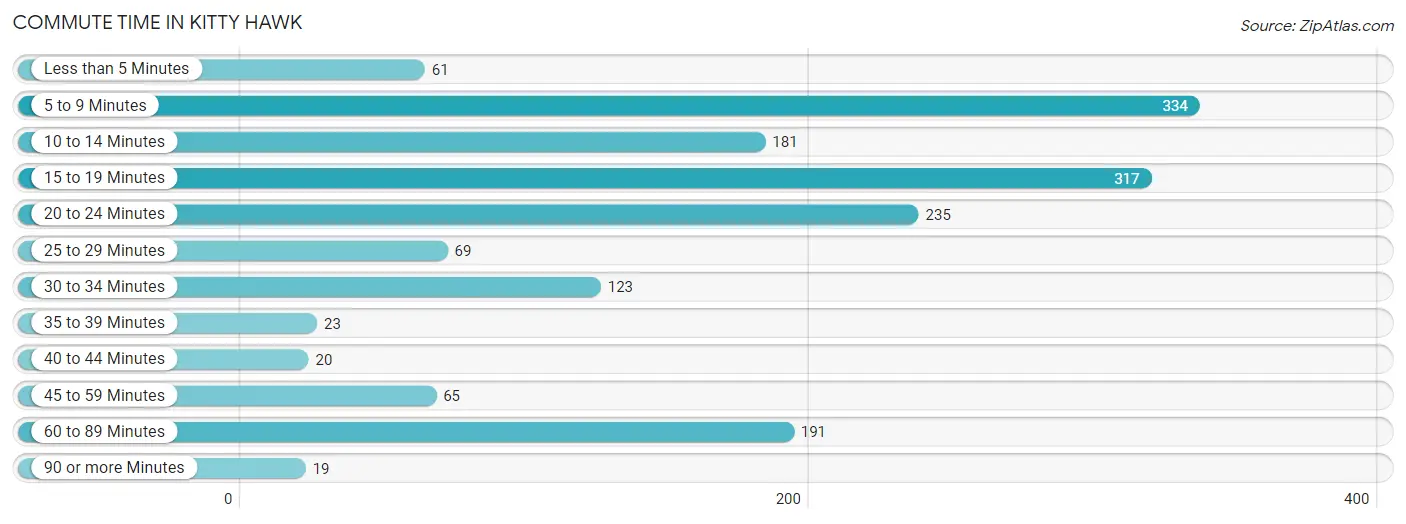
| Commute Time | # Commuters | % Commuters |
| Less than 5 Minutes | 61 | 3.7% |
| 5 to 9 Minutes | 334 | 20.4% |
| 10 to 14 Minutes | 181 | 11.1% |
| 15 to 19 Minutes | 317 | 19.4% |
| 20 to 24 Minutes | 235 | 14.3% |
| 25 to 29 Minutes | 69 | 4.2% |
| 30 to 34 Minutes | 123 | 7.5% |
| 35 to 39 Minutes | 23 | 1.4% |
| 40 to 44 Minutes | 20 | 1.2% |
| 45 to 59 Minutes | 65 | 4.0% |
| 60 to 89 Minutes | 191 | 11.7% |
| 90 or more Minutes | 19 | 1.2% |
Commute Time by Sex in Kitty Hawk
The most common commute times in Kitty Hawk are 15 to 19 minutes (203 commuters, 22.2%) for males and 5 to 9 minutes (174 commuters, 24.0%) for females.
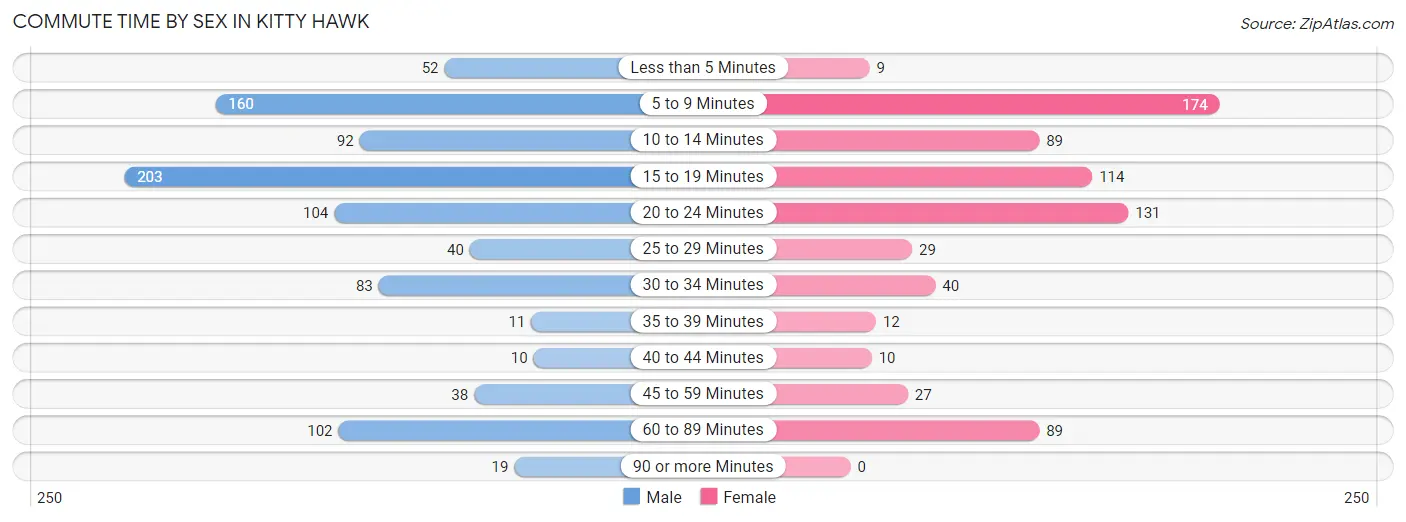
| Commute Time | Male | Female |
| Less than 5 Minutes | 52 (5.7%) | 9 (1.2%) |
| 5 to 9 Minutes | 160 (17.5%) | 174 (24.0%) |
| 10 to 14 Minutes | 92 (10.1%) | 89 (12.3%) |
| 15 to 19 Minutes | 203 (22.2%) | 114 (15.8%) |
| 20 to 24 Minutes | 104 (11.4%) | 131 (18.1%) |
| 25 to 29 Minutes | 40 (4.4%) | 29 (4.0%) |
| 30 to 34 Minutes | 83 (9.1%) | 40 (5.5%) |
| 35 to 39 Minutes | 11 (1.2%) | 12 (1.7%) |
| 40 to 44 Minutes | 10 (1.1%) | 10 (1.4%) |
| 45 to 59 Minutes | 38 (4.2%) | 27 (3.7%) |
| 60 to 89 Minutes | 102 (11.2%) | 89 (12.3%) |
| 90 or more Minutes | 19 (2.1%) | 0 (0.0%) |
Time of Departure to Work by Sex in Kitty Hawk
The most frequent times of departure to work in Kitty Hawk are 8:00 AM to 8:29 AM (173, 18.9%) for males and 9:00 AM to 9:59 AM (141, 19.5%) for females.
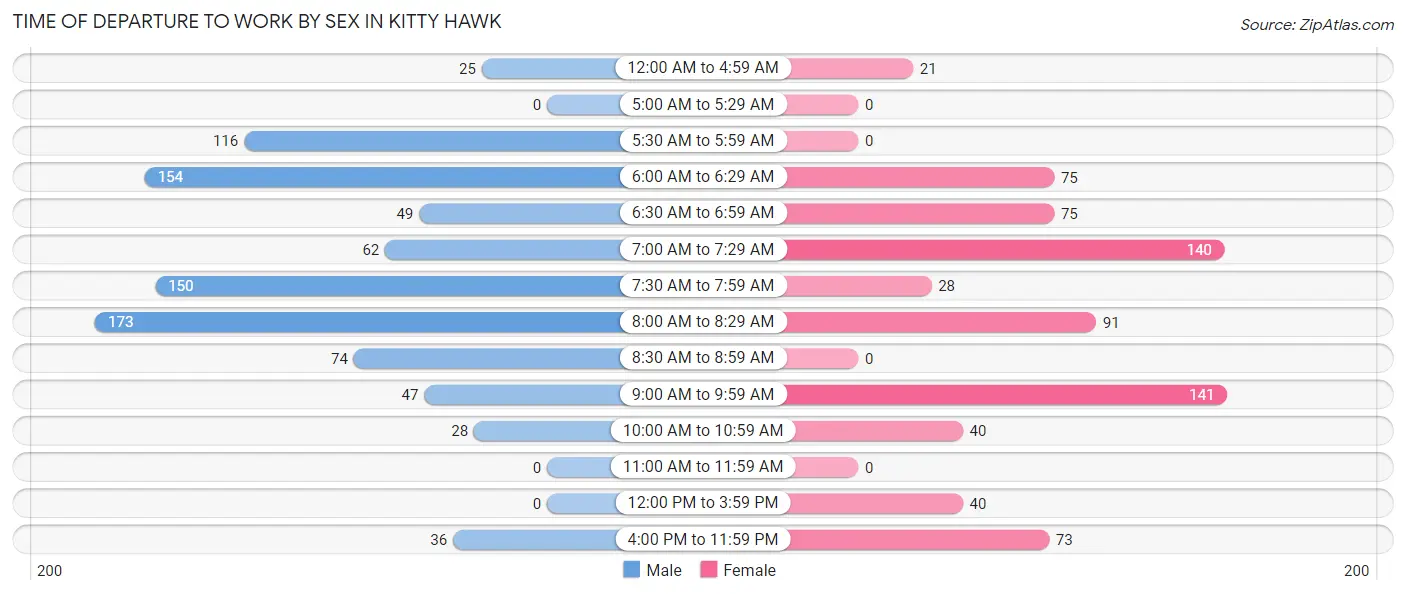
| Time of Departure | Male | Female |
| 12:00 AM to 4:59 AM | 25 (2.7%) | 21 (2.9%) |
| 5:00 AM to 5:29 AM | 0 (0.0%) | 0 (0.0%) |
| 5:30 AM to 5:59 AM | 116 (12.7%) | 0 (0.0%) |
| 6:00 AM to 6:29 AM | 154 (16.9%) | 75 (10.4%) |
| 6:30 AM to 6:59 AM | 49 (5.4%) | 75 (10.4%) |
| 7:00 AM to 7:29 AM | 62 (6.8%) | 140 (19.3%) |
| 7:30 AM to 7:59 AM | 150 (16.4%) | 28 (3.9%) |
| 8:00 AM to 8:29 AM | 173 (18.9%) | 91 (12.6%) |
| 8:30 AM to 8:59 AM | 74 (8.1%) | 0 (0.0%) |
| 9:00 AM to 9:59 AM | 47 (5.1%) | 141 (19.5%) |
| 10:00 AM to 10:59 AM | 28 (3.1%) | 40 (5.5%) |
| 11:00 AM to 11:59 AM | 0 (0.0%) | 0 (0.0%) |
| 12:00 PM to 3:59 PM | 0 (0.0%) | 40 (5.5%) |
| 4:00 PM to 11:59 PM | 36 (3.9%) | 73 (10.1%) |
| Total | 914 (100.0%) | 724 (100.0%) |
Housing Occupancy in Kitty Hawk
Occupancy by Ownership in Kitty Hawk
Of the total 1,578 dwellings in Kitty Hawk, owner-occupied units account for 1,221 (77.4%), while renter-occupied units make up 357 (22.6%).
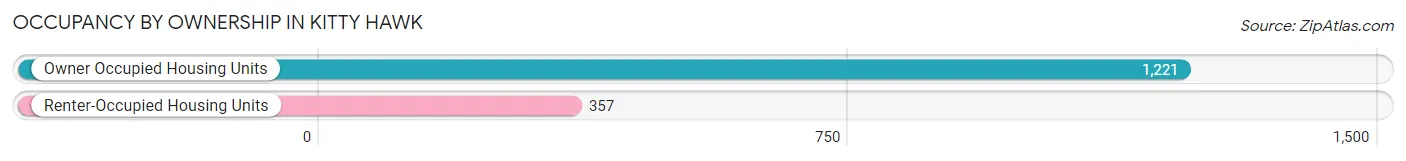
| Occupancy | # Housing Units | % Housing Units |
| Owner Occupied Housing Units | 1,221 | 77.4% |
| Renter-Occupied Housing Units | 357 | 22.6% |
| Total Occupied Housing Units | 1,578 | 100.0% |
Occupancy by Household Size in Kitty Hawk
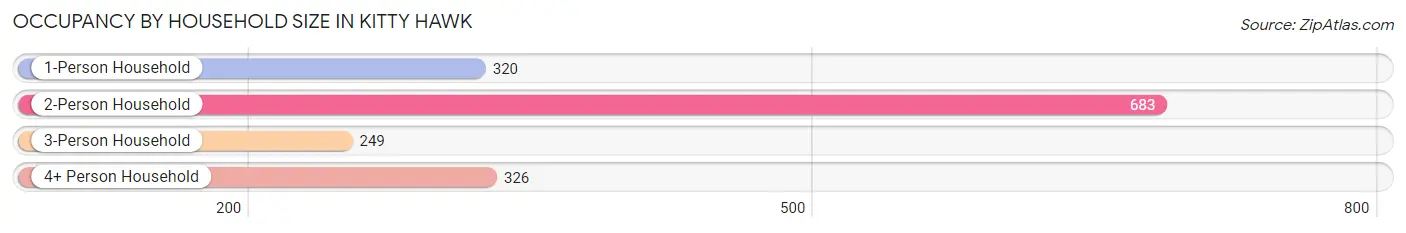
| Household Size | # Housing Units | % Housing Units |
| 1-Person Household | 320 | 20.3% |
| 2-Person Household | 683 | 43.3% |
| 3-Person Household | 249 | 15.8% |
| 4+ Person Household | 326 | 20.7% |
| Total Housing Units | 1,578 | 100.0% |
Occupancy by Ownership by Household Size in Kitty Hawk
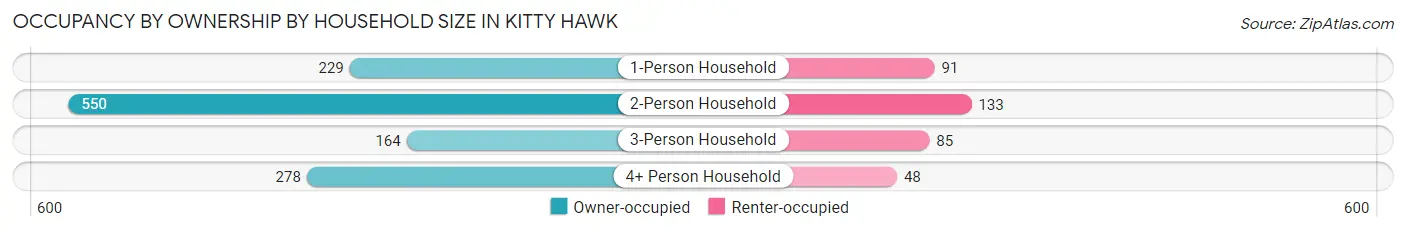
| Household Size | Owner-occupied | Renter-occupied |
| 1-Person Household | 229 (71.6%) | 91 (28.4%) |
| 2-Person Household | 550 (80.5%) | 133 (19.5%) |
| 3-Person Household | 164 (65.9%) | 85 (34.1%) |
| 4+ Person Household | 278 (85.3%) | 48 (14.7%) |
| Total Housing Units | 1,221 (77.4%) | 357 (22.6%) |
Occupancy by Educational Attainment in Kitty Hawk
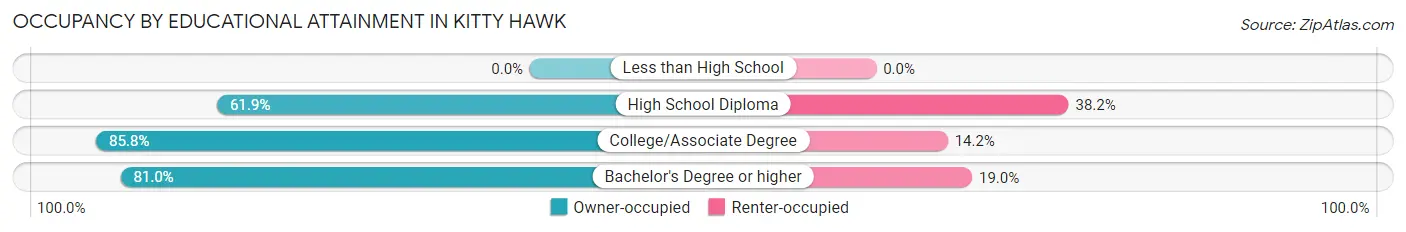
| Household Size | Owner-occupied | Renter-occupied |
| Less than High School | 0 (0.0%) | 0 (0.0%) |
| High School Diploma | 248 (61.9%) | 153 (38.2%) |
| College/Associate Degree | 351 (85.8%) | 58 (14.2%) |
| Bachelor's Degree or higher | 622 (81.0%) | 146 (19.0%) |
Occupancy by Age of Householder in Kitty Hawk
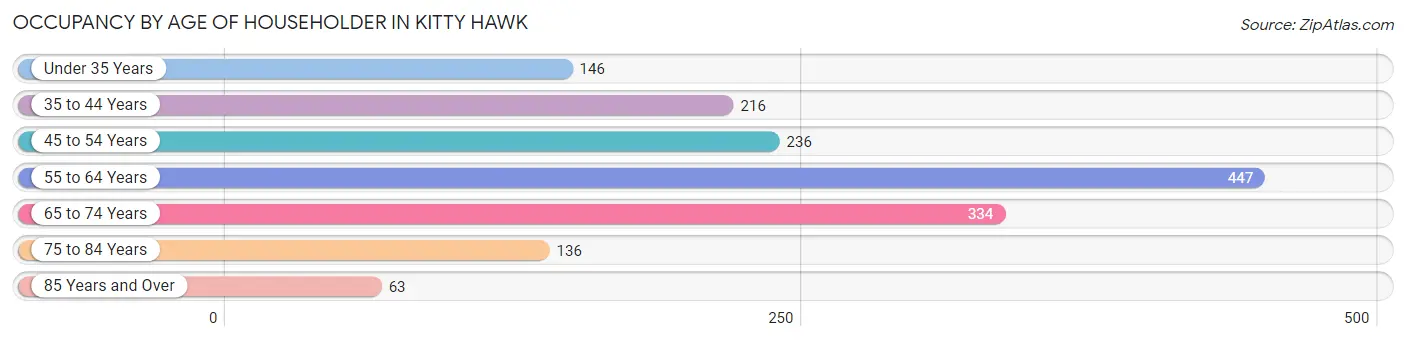
| Age Bracket | # Households | % Households |
| Under 35 Years | 146 | 9.2% |
| 35 to 44 Years | 216 | 13.7% |
| 45 to 54 Years | 236 | 15.0% |
| 55 to 64 Years | 447 | 28.3% |
| 65 to 74 Years | 334 | 21.2% |
| 75 to 84 Years | 136 | 8.6% |
| 85 Years and Over | 63 | 4.0% |
| Total | 1,578 | 100.0% |
Housing Finances in Kitty Hawk
Median Income by Occupancy in Kitty Hawk
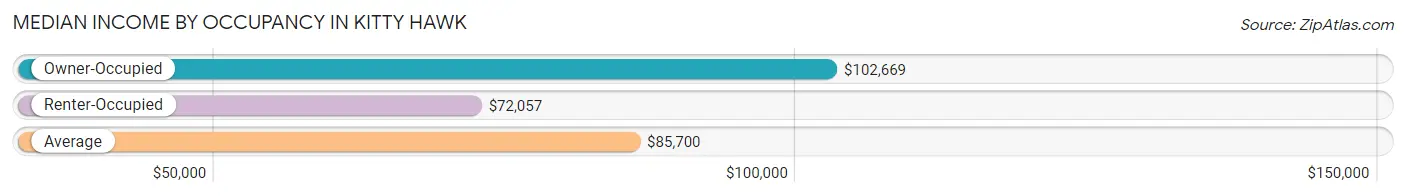
| Occupancy Type | # Households | Median Income |
| Owner-Occupied | 1,221 (77.4%) | $102,669 |
| Renter-Occupied | 357 (22.6%) | $72,057 |
| Average | 1,578 (100.0%) | $85,700 |
Occupancy by Householder Income Bracket in Kitty Hawk
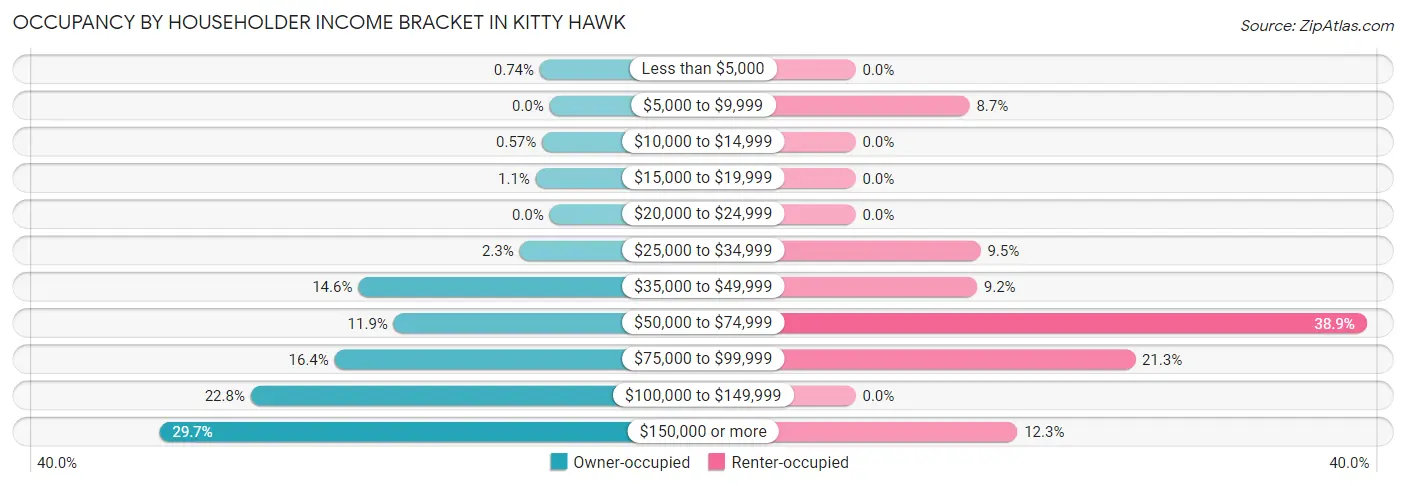
| Income Bracket | Owner-occupied | Renter-occupied |
| Less than $5,000 | 9 (0.7%) | 0 (0.0%) |
| $5,000 to $9,999 | 0 (0.0%) | 31 (8.7%) |
| $10,000 to $14,999 | 7 (0.6%) | 0 (0.0%) |
| $15,000 to $19,999 | 13 (1.1%) | 0 (0.0%) |
| $20,000 to $24,999 | 0 (0.0%) | 0 (0.0%) |
| $25,000 to $34,999 | 28 (2.3%) | 34 (9.5%) |
| $35,000 to $49,999 | 178 (14.6%) | 33 (9.2%) |
| $50,000 to $74,999 | 145 (11.9%) | 139 (38.9%) |
| $75,000 to $99,999 | 200 (16.4%) | 76 (21.3%) |
| $100,000 to $149,999 | 278 (22.8%) | 0 (0.0%) |
| $150,000 or more | 363 (29.7%) | 44 (12.3%) |
| Total | 1,221 (100.0%) | 357 (100.0%) |
Monthly Housing Cost Tiers in Kitty Hawk
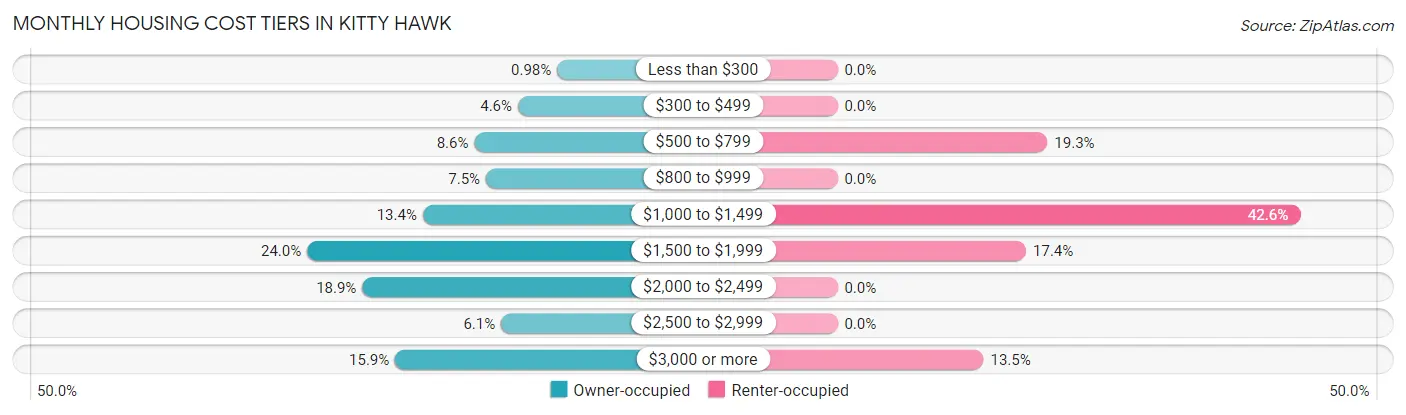
| Monthly Cost | Owner-occupied | Renter-occupied |
| Less than $300 | 12 (1.0%) | 0 (0.0%) |
| $300 to $499 | 56 (4.6%) | 0 (0.0%) |
| $500 to $799 | 105 (8.6%) | 69 (19.3%) |
| $800 to $999 | 92 (7.5%) | 0 (0.0%) |
| $1,000 to $1,499 | 163 (13.4%) | 152 (42.6%) |
| $1,500 to $1,999 | 293 (24.0%) | 62 (17.4%) |
| $2,000 to $2,499 | 231 (18.9%) | 0 (0.0%) |
| $2,500 to $2,999 | 75 (6.1%) | 0 (0.0%) |
| $3,000 or more | 194 (15.9%) | 48 (13.5%) |
| Total | 1,221 (100.0%) | 357 (100.0%) |
Physical Housing Characteristics in Kitty Hawk
Housing Structures in Kitty Hawk
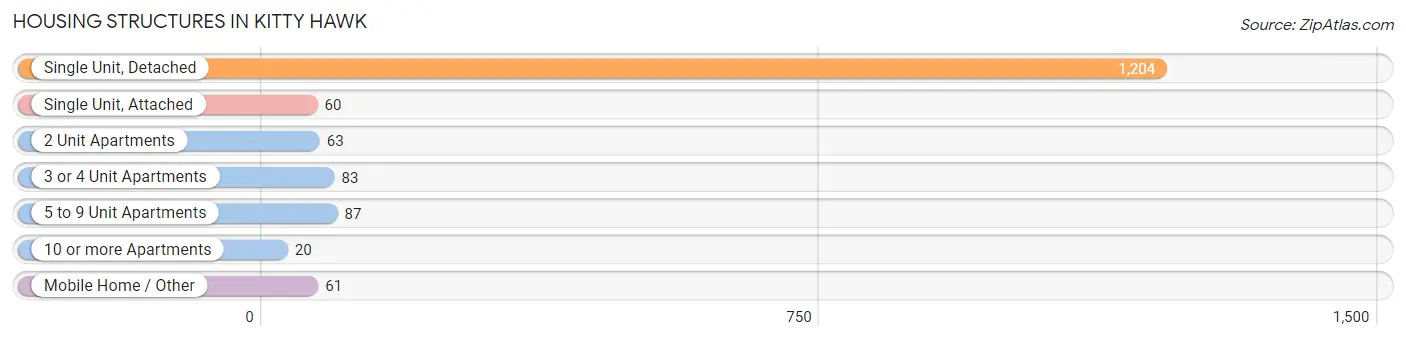
| Structure Type | # Housing Units | % Housing Units |
| Single Unit, Detached | 1,204 | 76.3% |
| Single Unit, Attached | 60 | 3.8% |
| 2 Unit Apartments | 63 | 4.0% |
| 3 or 4 Unit Apartments | 83 | 5.3% |
| 5 to 9 Unit Apartments | 87 | 5.5% |
| 10 or more Apartments | 20 | 1.3% |
| Mobile Home / Other | 61 | 3.9% |
| Total | 1,578 | 100.0% |
Housing Structures by Occupancy in Kitty Hawk
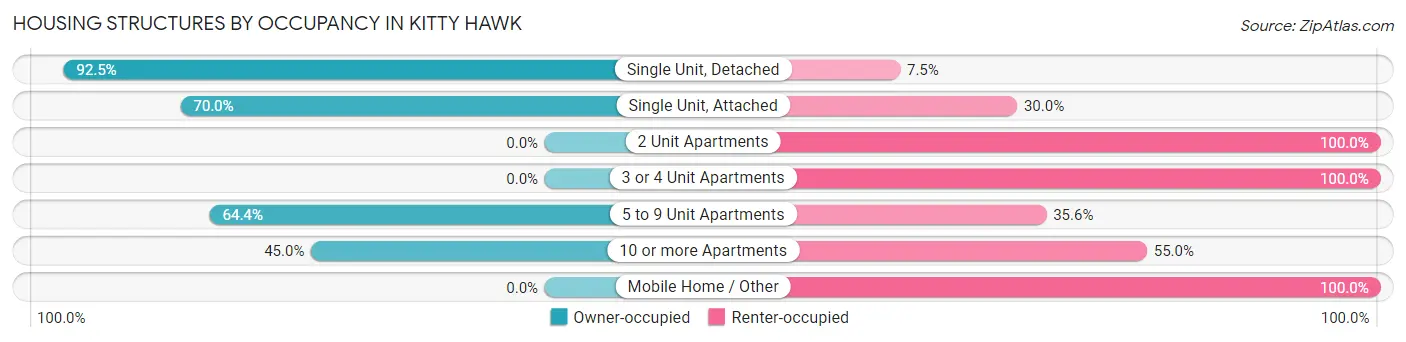
| Structure Type | Owner-occupied | Renter-occupied |
| Single Unit, Detached | 1,114 (92.5%) | 90 (7.5%) |
| Single Unit, Attached | 42 (70.0%) | 18 (30.0%) |
| 2 Unit Apartments | 0 (0.0%) | 63 (100.0%) |
| 3 or 4 Unit Apartments | 0 (0.0%) | 83 (100.0%) |
| 5 to 9 Unit Apartments | 56 (64.4%) | 31 (35.6%) |
| 10 or more Apartments | 9 (45.0%) | 11 (55.0%) |
| Mobile Home / Other | 0 (0.0%) | 61 (100.0%) |
| Total | 1,221 (77.4%) | 357 (22.6%) |
Housing Structures by Number of Rooms in Kitty Hawk
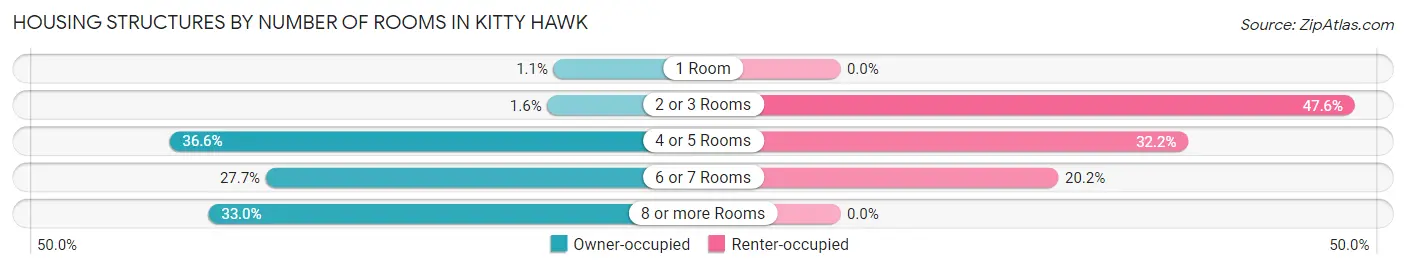
| Number of Rooms | Owner-occupied | Renter-occupied |
| 1 Room | 13 (1.1%) | 0 (0.0%) |
| 2 or 3 Rooms | 20 (1.6%) | 170 (47.6%) |
| 4 or 5 Rooms | 447 (36.6%) | 115 (32.2%) |
| 6 or 7 Rooms | 338 (27.7%) | 72 (20.2%) |
| 8 or more Rooms | 403 (33.0%) | 0 (0.0%) |
| Total | 1,221 (100.0%) | 357 (100.0%) |
Housing Structure by Heating Type in Kitty Hawk
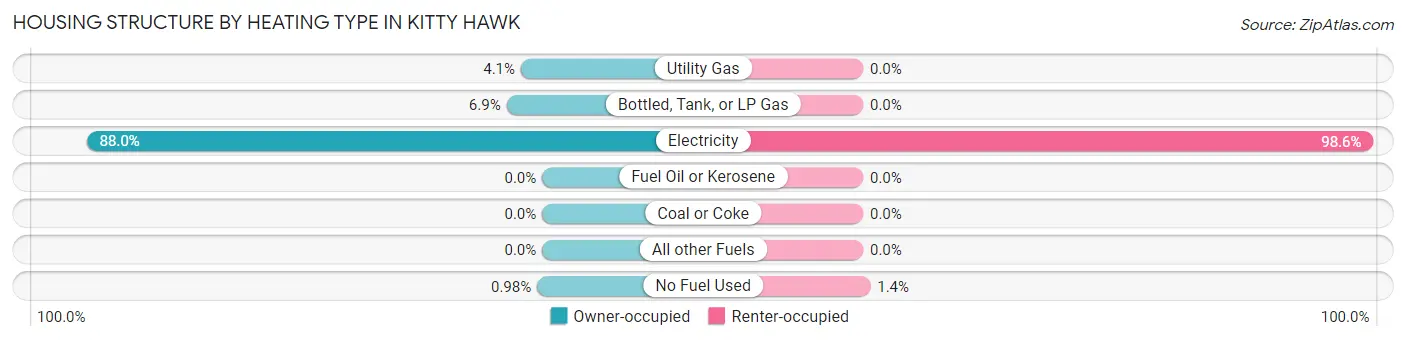
| Heating Type | Owner-occupied | Renter-occupied |
| Utility Gas | 50 (4.1%) | 0 (0.0%) |
| Bottled, Tank, or LP Gas | 84 (6.9%) | 0 (0.0%) |
| Electricity | 1,075 (88.0%) | 352 (98.6%) |
| Fuel Oil or Kerosene | 0 (0.0%) | 0 (0.0%) |
| Coal or Coke | 0 (0.0%) | 0 (0.0%) |
| All other Fuels | 0 (0.0%) | 0 (0.0%) |
| No Fuel Used | 12 (1.0%) | 5 (1.4%) |
| Total | 1,221 (100.0%) | 357 (100.0%) |
Household Vehicle Usage in Kitty Hawk
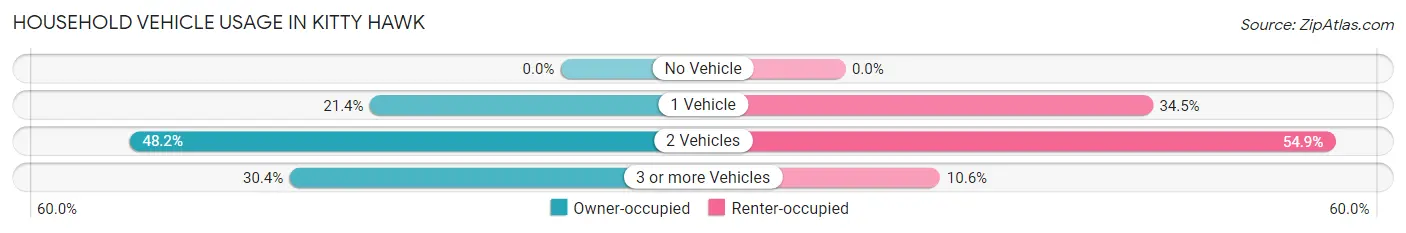
| Vehicles per Household | Owner-occupied | Renter-occupied |
| No Vehicle | 0 (0.0%) | 0 (0.0%) |
| 1 Vehicle | 261 (21.4%) | 123 (34.4%) |
| 2 Vehicles | 589 (48.2%) | 196 (54.9%) |
| 3 or more Vehicles | 371 (30.4%) | 38 (10.6%) |
| Total | 1,221 (100.0%) | 357 (100.0%) |
Real Estate & Mortgages in Kitty Hawk
Real Estate and Mortgage Overview in Kitty Hawk
| Characteristic | Without Mortgage | With Mortgage |
| Housing Units | 330 | 891 |
| Median Property Value | $443,300 | $461,600 |
| Median Household Income | $86,838 | $282 |
| Monthly Housing Costs | $689 | $194 |
| Real Estate Taxes | $2,500 | $9 |
Property Value by Mortgage Status in Kitty Hawk
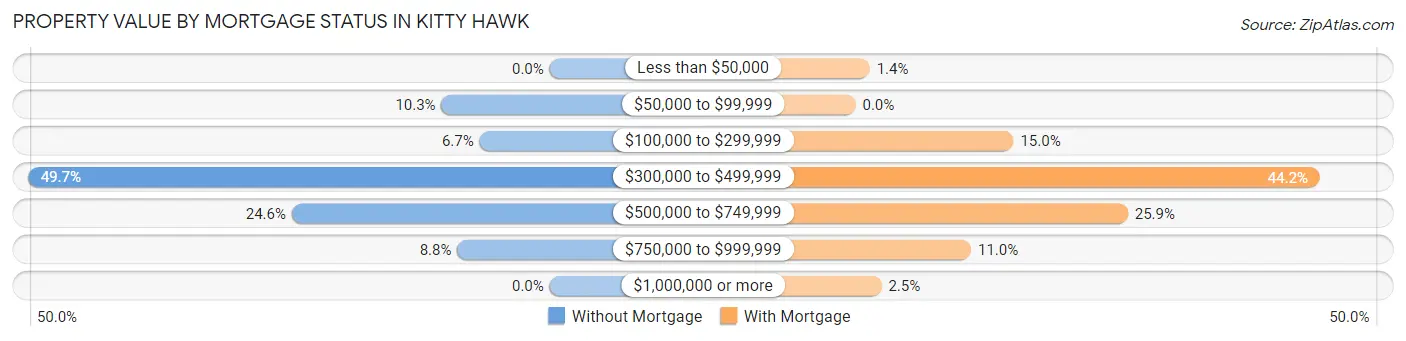
| Property Value | Without Mortgage | With Mortgage |
| Less than $50,000 | 0 (0.0%) | 12 (1.3%) |
| $50,000 to $99,999 | 34 (10.3%) | 0 (0.0%) |
| $100,000 to $299,999 | 22 (6.7%) | 134 (15.0%) |
| $300,000 to $499,999 | 164 (49.7%) | 394 (44.2%) |
| $500,000 to $749,999 | 81 (24.5%) | 231 (25.9%) |
| $750,000 to $999,999 | 29 (8.8%) | 98 (11.0%) |
| $1,000,000 or more | 0 (0.0%) | 22 (2.5%) |
| Total | 330 (100.0%) | 891 (100.0%) |
Household Income by Mortgage Status in Kitty Hawk
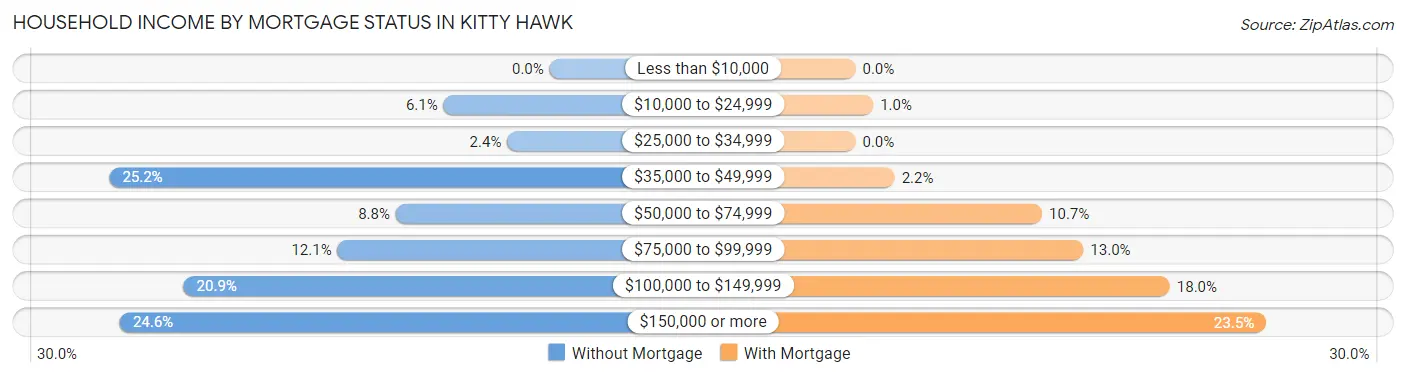
| Household Income | Without Mortgage | With Mortgage |
| Less than $10,000 | 0 (0.0%) | 0 (0.0%) |
| $10,000 to $24,999 | 20 (6.1%) | 9 (1.0%) |
| $25,000 to $34,999 | 8 (2.4%) | 0 (0.0%) |
| $35,000 to $49,999 | 83 (25.2%) | 20 (2.2%) |
| $50,000 to $74,999 | 29 (8.8%) | 95 (10.7%) |
| $75,000 to $99,999 | 40 (12.1%) | 116 (13.0%) |
| $100,000 to $149,999 | 69 (20.9%) | 160 (18.0%) |
| $150,000 or more | 81 (24.5%) | 209 (23.5%) |
| Total | 330 (100.0%) | 891 (100.0%) |
Property Value to Household Income Ratio in Kitty Hawk
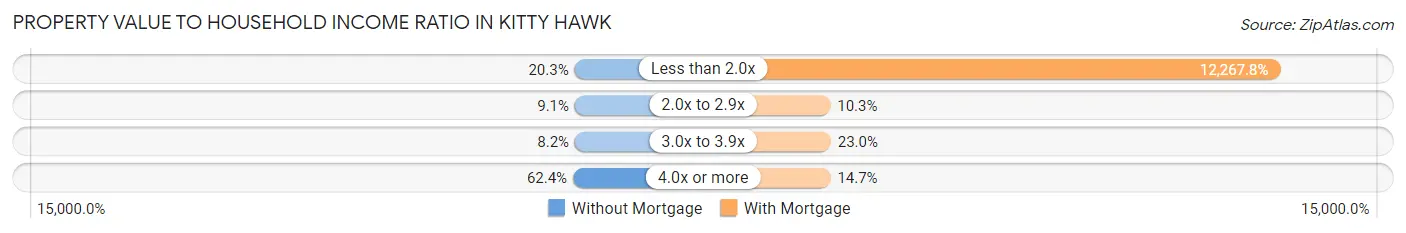
| Value-to-Income Ratio | Without Mortgage | With Mortgage |
| Less than 2.0x | 67 (20.3%) | 109,306 (12,267.8%) |
| 2.0x to 2.9x | 30 (9.1%) | 92 (10.3%) |
| 3.0x to 3.9x | 27 (8.2%) | 205 (23.0%) |
| 4.0x or more | 206 (62.4%) | 131 (14.7%) |
| Total | 330 (100.0%) | 891 (100.0%) |
Real Estate Taxes by Mortgage Status in Kitty Hawk
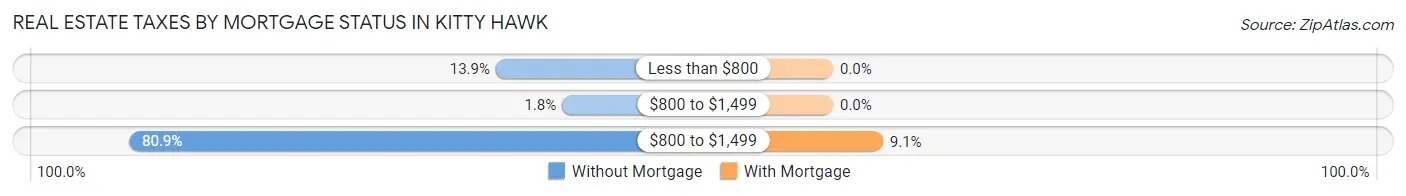
| Property Taxes | Without Mortgage | With Mortgage |
| Less than $800 | 46 (13.9%) | 0 (0.0%) |
| $800 to $1,499 | 6 (1.8%) | 0 (0.0%) |
| $800 to $1,499 | 267 (80.9%) | 81 (9.1%) |
| Total | 330 (100.0%) | 891 (100.0%) |
Health & Disability in Kitty Hawk
Health Insurance Coverage by Age in Kitty Hawk
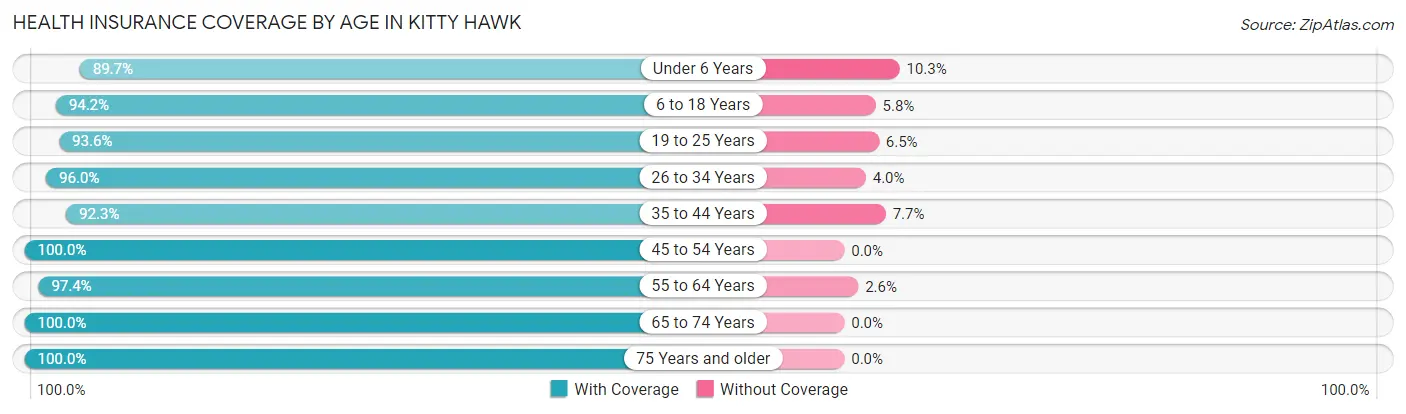
| Age Bracket | With Coverage | Without Coverage |
| Under 6 Years | 148 (89.7%) | 17 (10.3%) |
| 6 to 18 Years | 532 (94.2%) | 33 (5.8%) |
| 19 to 25 Years | 116 (93.5%) | 8 (6.5%) |
| 26 to 34 Years | 311 (96.0%) | 13 (4.0%) |
| 35 to 44 Years | 430 (92.3%) | 36 (7.7%) |
| 45 to 54 Years | 408 (100.0%) | 0 (0.0%) |
| 55 to 64 Years | 790 (97.4%) | 21 (2.6%) |
| 65 to 74 Years | 512 (100.0%) | 0 (0.0%) |
| 75 Years and older | 315 (100.0%) | 0 (0.0%) |
| Total | 3,562 (96.5%) | 128 (3.5%) |
Health Insurance Coverage by Citizenship Status in Kitty Hawk
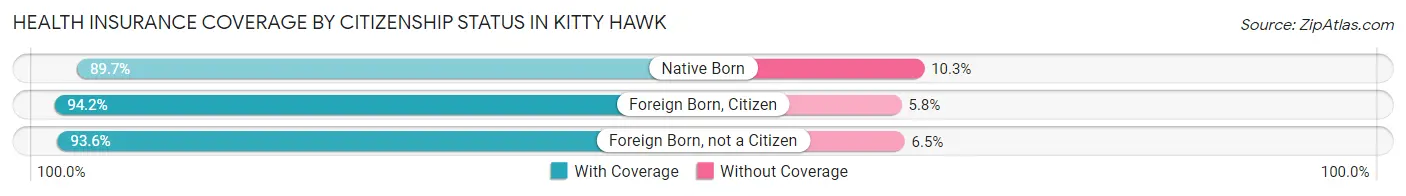
| Citizenship Status | With Coverage | Without Coverage |
| Native Born | 148 (89.7%) | 17 (10.3%) |
| Foreign Born, Citizen | 532 (94.2%) | 33 (5.8%) |
| Foreign Born, not a Citizen | 116 (93.5%) | 8 (6.5%) |
Health Insurance Coverage by Household Income in Kitty Hawk
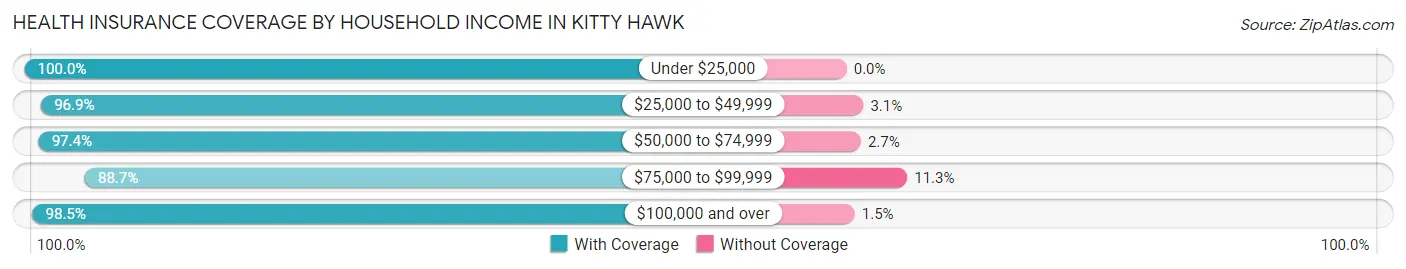
| Household Income | With Coverage | Without Coverage |
| Under $25,000 | 104 (100.0%) | 0 (0.0%) |
| $25,000 to $49,999 | 434 (96.9%) | 14 (3.1%) |
| $50,000 to $74,999 | 809 (97.4%) | 22 (2.6%) |
| $75,000 to $99,999 | 516 (88.7%) | 66 (11.3%) |
| $100,000 and over | 1,699 (98.5%) | 26 (1.5%) |
Public vs Private Health Insurance Coverage by Age in Kitty Hawk
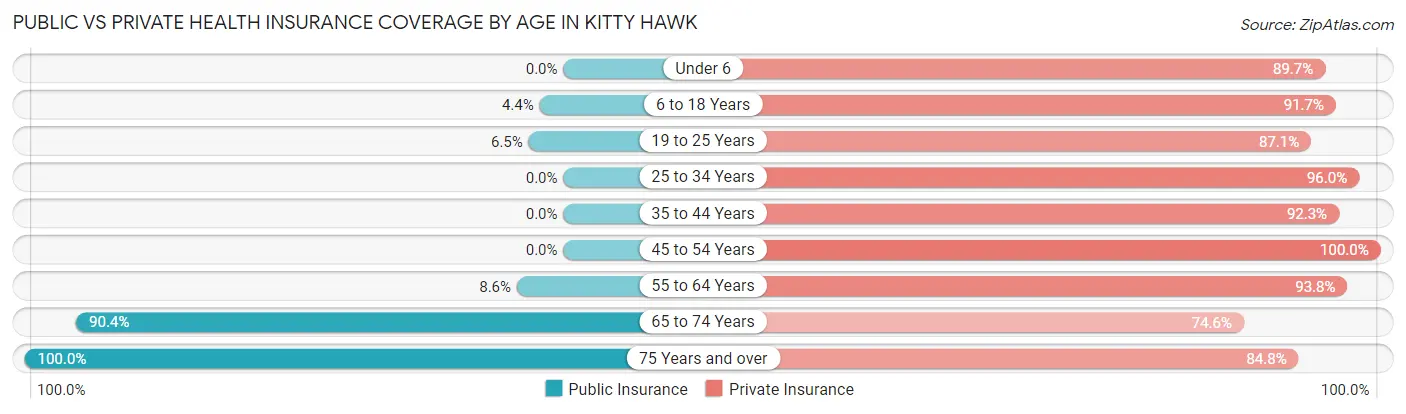
| Age Bracket | Public Insurance | Private Insurance |
| Under 6 | 0 (0.0%) | 148 (89.7%) |
| 6 to 18 Years | 25 (4.4%) | 518 (91.7%) |
| 19 to 25 Years | 8 (6.5%) | 108 (87.1%) |
| 25 to 34 Years | 0 (0.0%) | 311 (96.0%) |
| 35 to 44 Years | 0 (0.0%) | 430 (92.3%) |
| 45 to 54 Years | 0 (0.0%) | 408 (100.0%) |
| 55 to 64 Years | 70 (8.6%) | 761 (93.8%) |
| 65 to 74 Years | 463 (90.4%) | 382 (74.6%) |
| 75 Years and over | 315 (100.0%) | 267 (84.8%) |
| Total | 881 (23.9%) | 3,333 (90.3%) |
Disability Status by Sex by Age in Kitty Hawk
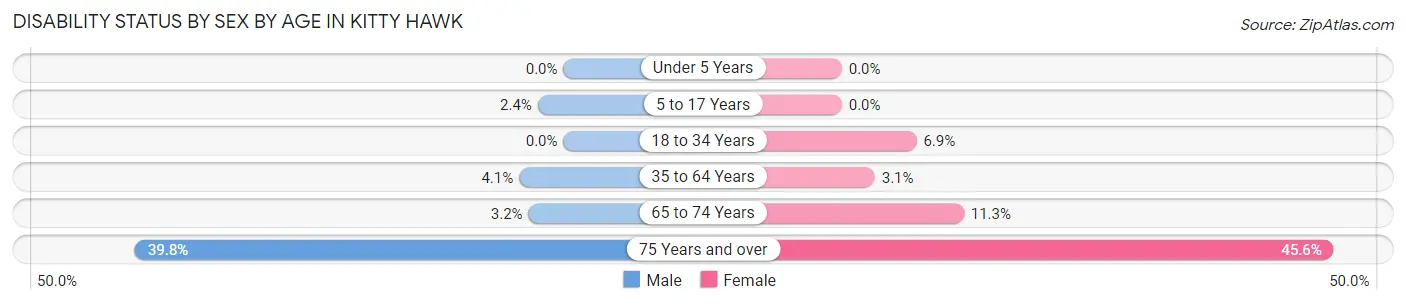
| Age Bracket | Male | Female |
| Under 5 Years | 0 (0.0%) | 0 (0.0%) |
| 5 to 17 Years | 6 (2.4%) | 0 (0.0%) |
| 18 to 34 Years | 0 (0.0%) | 16 (6.9%) |
| 35 to 64 Years | 33 (4.1%) | 27 (3.1%) |
| 65 to 74 Years | 8 (3.2%) | 30 (11.3%) |
| 75 Years and over | 66 (39.8%) | 68 (45.6%) |
Disability Class by Sex by Age in Kitty Hawk
Disability Class: Hearing Difficulty
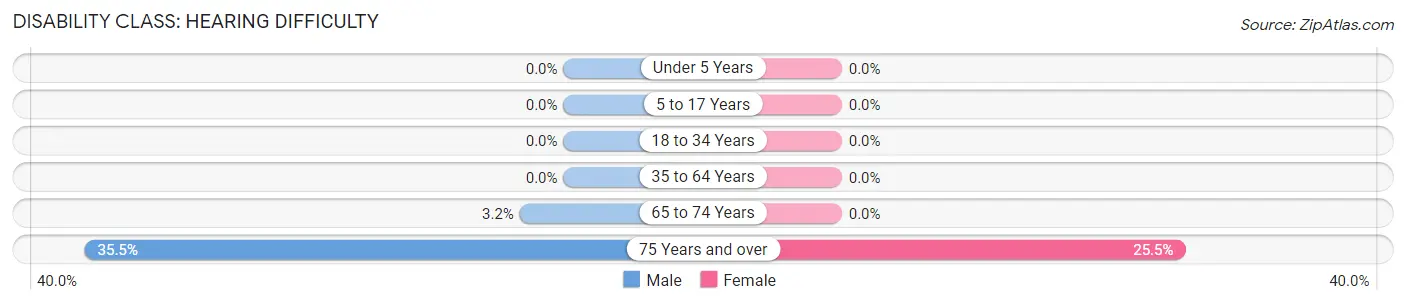
| Age Bracket | Male | Female |
| Under 5 Years | 0 (0.0%) | 0 (0.0%) |
| 5 to 17 Years | 0 (0.0%) | 0 (0.0%) |
| 18 to 34 Years | 0 (0.0%) | 0 (0.0%) |
| 35 to 64 Years | 0 (0.0%) | 0 (0.0%) |
| 65 to 74 Years | 8 (3.2%) | 0 (0.0%) |
| 75 Years and over | 59 (35.5%) | 38 (25.5%) |
Disability Class: Vision Difficulty
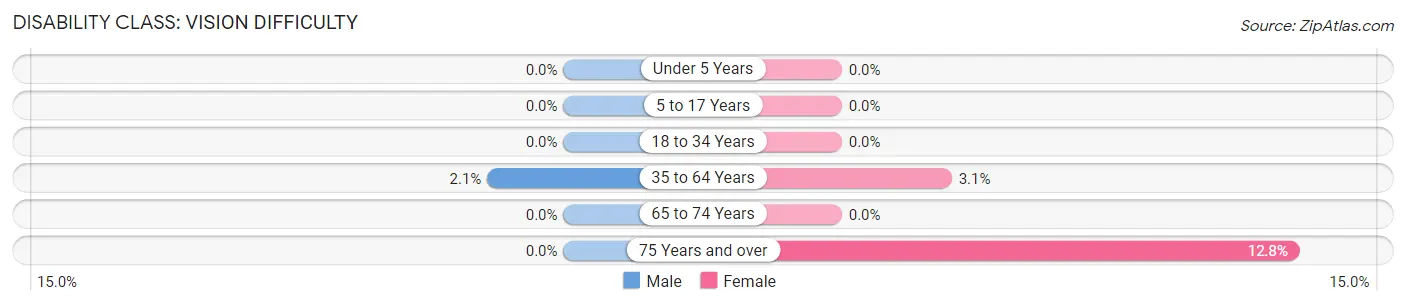
| Age Bracket | Male | Female |
| Under 5 Years | 0 (0.0%) | 0 (0.0%) |
| 5 to 17 Years | 0 (0.0%) | 0 (0.0%) |
| 18 to 34 Years | 0 (0.0%) | 0 (0.0%) |
| 35 to 64 Years | 17 (2.1%) | 27 (3.1%) |
| 65 to 74 Years | 0 (0.0%) | 0 (0.0%) |
| 75 Years and over | 0 (0.0%) | 19 (12.8%) |
Disability Class: Cognitive Difficulty
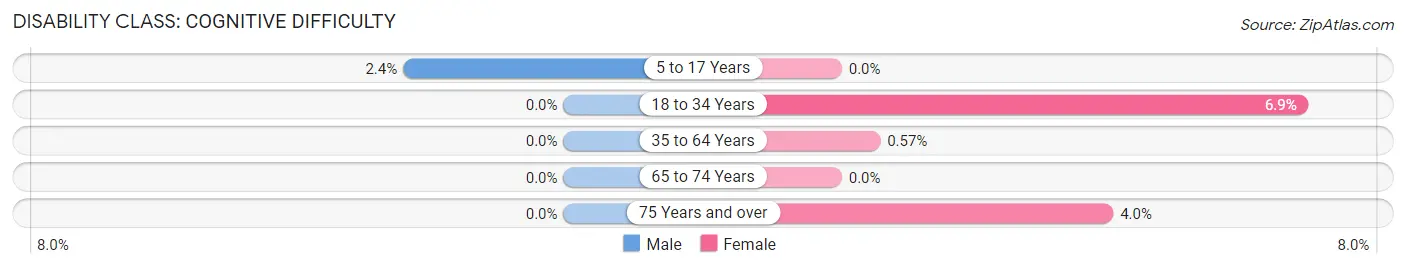
| Age Bracket | Male | Female |
| 5 to 17 Years | 6 (2.4%) | 0 (0.0%) |
| 18 to 34 Years | 0 (0.0%) | 16 (6.9%) |
| 35 to 64 Years | 0 (0.0%) | 5 (0.6%) |
| 65 to 74 Years | 0 (0.0%) | 0 (0.0%) |
| 75 Years and over | 0 (0.0%) | 6 (4.0%) |
Disability Class: Ambulatory Difficulty
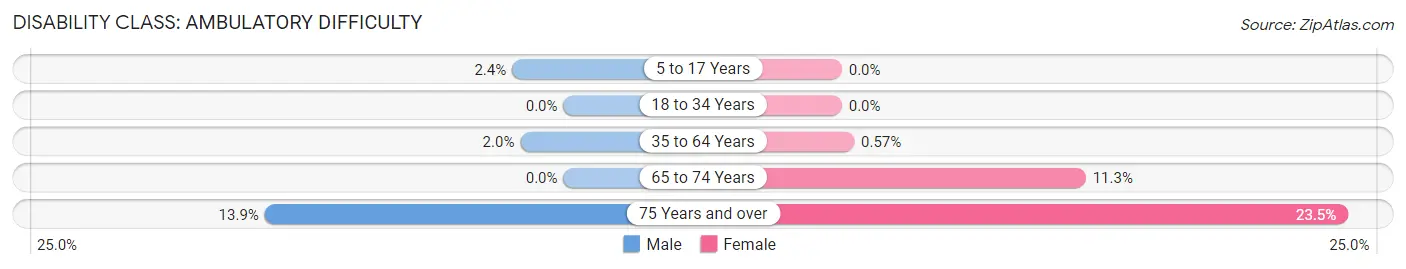
| Age Bracket | Male | Female |
| 5 to 17 Years | 6 (2.4%) | 0 (0.0%) |
| 18 to 34 Years | 0 (0.0%) | 0 (0.0%) |
| 35 to 64 Years | 16 (2.0%) | 5 (0.6%) |
| 65 to 74 Years | 0 (0.0%) | 30 (11.3%) |
| 75 Years and over | 23 (13.9%) | 35 (23.5%) |
Disability Class: Self-Care Difficulty
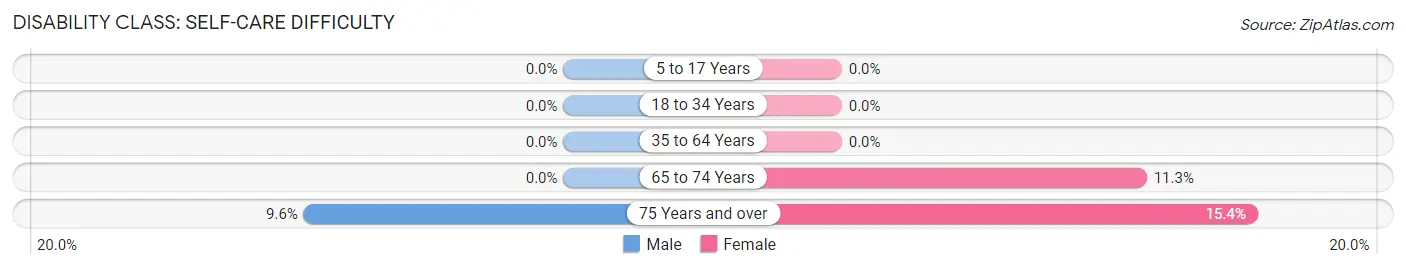
| Age Bracket | Male | Female |
| 5 to 17 Years | 0 (0.0%) | 0 (0.0%) |
| 18 to 34 Years | 0 (0.0%) | 0 (0.0%) |
| 35 to 64 Years | 0 (0.0%) | 0 (0.0%) |
| 65 to 74 Years | 0 (0.0%) | 30 (11.3%) |
| 75 Years and over | 16 (9.6%) | 23 (15.4%) |
Technology Access in Kitty Hawk
Computing Device Access in Kitty Hawk
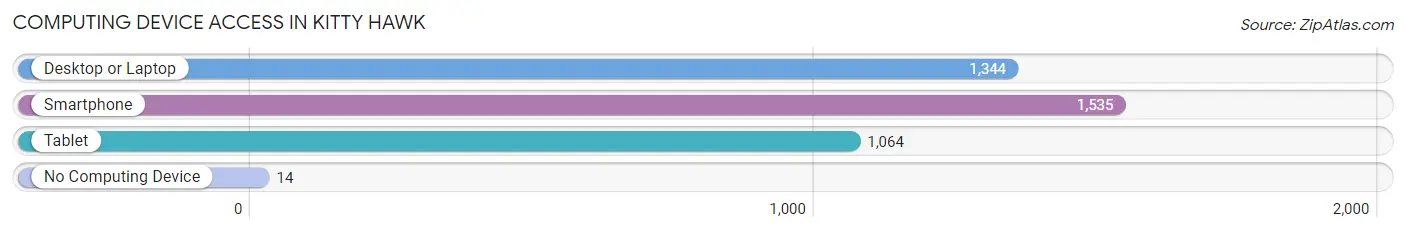
| Device Type | # Households | % Households |
| Desktop or Laptop | 1,344 | 85.2% |
| Smartphone | 1,535 | 97.3% |
| Tablet | 1,064 | 67.4% |
| No Computing Device | 14 | 0.9% |
| Total | 1,578 | 100.0% |
Internet Access in Kitty Hawk
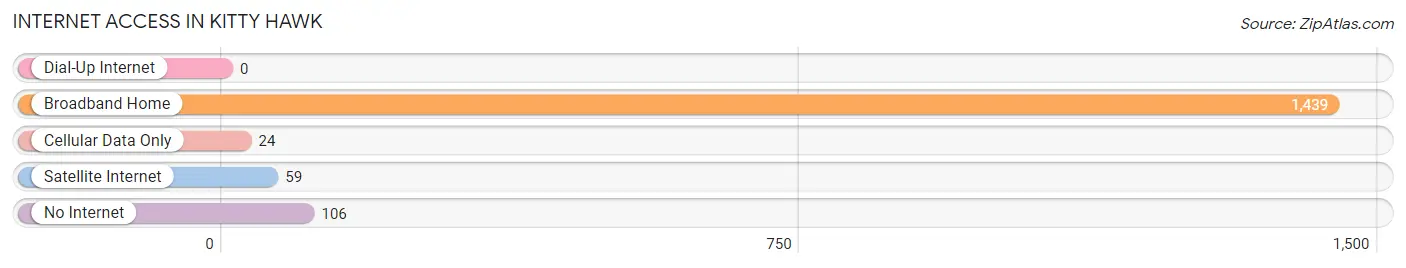
| Internet Type | # Households | % Households |
| Dial-Up Internet | 0 | 0.0% |
| Broadband Home | 1,439 | 91.2% |
| Cellular Data Only | 24 | 1.5% |
| Satellite Internet | 59 | 3.7% |
| No Internet | 106 | 6.7% |
| Total | 1,578 | 100.0% |
Kitty Hawk Summary
Kitty Hawk is a small town located on the Outer Banks of North Carolina. It is known for its beautiful beaches, historical sites, and its connection to the Wright Brothers’ first powered flight. The town has a population of 3,272 people, according to the 2010 census.
Geography
Kitty Hawk is located on the Outer Banks of North Carolina, a 200-mile stretch of barrier islands along the Atlantic Coast. The town is situated on the northern end of the Outer Banks, just south of Nags Head. It is bordered by the Atlantic Ocean to the east and the Currituck Sound to the west. The town is located in Dare County and is part of the Kill Devil Hills-Nags Head Metropolitan Statistical Area.
The town is divided into two distinct areas: the mainland and the barrier islands. The mainland is home to the majority of the town’s population and is where most of the businesses and services are located. The barrier islands are home to the town’s beaches and are popular tourist destinations.
History
Kitty Hawk was first settled in the late 1700s by English settlers. The town was named after the local Native American tribe, the Kitty Hawk Indians. The town was a popular fishing and hunting destination for many years.
In 1903, the Wright Brothers made history when they completed the first powered flight in Kitty Hawk. The Wright Brothers National Memorial is located in the town and is a popular tourist destination.
In the 1950s, the town began to experience a population boom as people moved to the area for the beaches and the mild climate. The town has continued to grow since then and is now a popular tourist destination.
Economy
Kitty Hawk’s economy is largely driven by tourism. The town is home to several popular beaches, including Kitty Hawk Beach, Kill Devil Hills Beach, and Nags Head Beach. These beaches attract thousands of visitors each year and are a major source of revenue for the town.
The town is also home to several businesses, including restaurants, hotels, and retail stores. These businesses provide jobs for many of the town’s residents.
Demographics
Kitty Hawk has a population of 3,272 people, according to the 2010 census. The town has a median age of 44.7 years and a median household income of $50,945. The town is predominantly white (90.2%) and has a small Hispanic population (3.2%).
Conclusion
Kitty Hawk is a small town located on the Outer Banks of North Carolina. It is known for its beautiful beaches, historical sites, and its connection to the Wright Brothers’ first powered flight. The town has a population of 3,272 people and is predominantly white. The town’s economy is largely driven by tourism and the town is home to several businesses. Kitty Hawk is a popular tourist destination and is a great place to visit or live.
Common Questions
What is Per Capita Income in Kitty Hawk?
Per Capita income in Kitty Hawk is $49,216.
What is the Median Family Income in Kitty Hawk?
Median Family Income in Kitty Hawk is $100,368.
What is the Median Household income in Kitty Hawk?
Median Household Income in Kitty Hawk is $85,700.
What is Income or Wage Gap in Kitty Hawk?
Income or Wage Gap in Kitty Hawk is 35.2%.
Women in Kitty Hawk earn 64.8 cents for every dollar earned by a man.
What is Inequality or Gini Index in Kitty Hawk?
Inequality or Gini Index in Kitty Hawk is 0.39.
What is the Total Population of Kitty Hawk?
Total Population of Kitty Hawk is 3,690.
What is the Total Male Population of Kitty Hawk?
Total Male Population of Kitty Hawk is 1,782.
What is the Total Female Population of Kitty Hawk?
Total Female Population of Kitty Hawk is 1,908.
What is the Ratio of Males per 100 Females in Kitty Hawk?
There are 93.40 Males per 100 Females in Kitty Hawk.
What is the Ratio of Females per 100 Males in Kitty Hawk?
There are 107.07 Females per 100 Males in Kitty Hawk.
What is the Median Population Age in Kitty Hawk?
Median Population Age in Kitty Hawk is 49.8 Years.
What is the Average Family Size in Kitty Hawk
Average Family Size in Kitty Hawk is 2.7 People.
What is the Average Household Size in Kitty Hawk
Average Household Size in Kitty Hawk is 2.3 People.
How Large is the Labor Force in Kitty Hawk?
There are 2,146 People in the Labor Forcein in Kitty Hawk.
What is the Percentage of People in the Labor Force in Kitty Hawk?
69.8% of People are in the Labor Force in Kitty Hawk.
What is the Unemployment Rate in Kitty Hawk?
Unemployment Rate in Kitty Hawk is 7.1%.