Peletier, NC Map & Demographics
Peletier Map
Peletier Overview
$26,714
PER CAPITA INCOME
$56,953
AVG FAMILY INCOME
$45,781
AVG HOUSEHOLD INCOME
18.5%
WAGE / INCOME GAP [ % ]
81.5¢/ $1
WAGE / INCOME GAP [ $ ]
0.46
INEQUALITY / GINI INDEX
749
TOTAL POPULATION
371
MALE POPULATION
378
FEMALE POPULATION
98.15
MALES / 100 FEMALES
101.89
FEMALES / 100 MALES
46.3
MEDIAN AGE
2.9
AVG FAMILY SIZE
2.0
AVG HOUSEHOLD SIZE
366
LABOR FORCE [ PEOPLE ]
55.1%
PERCENT IN LABOR FORCE
15.3%
UNEMPLOYMENT RATE
Income in Peletier
Income Overview in Peletier
Per Capita Income in Peletier is $26,714, while median incomes of families and households are $56,953 and $45,781 respectively.
| Characteristic | Number | Measure |
| Per Capita Income | 749 | $26,714 |
| Median Family Income | 191 | $56,953 |
| Mean Family Income | 191 | $72,798 |
| Median Household Income | 367 | $45,781 |
| Mean Household Income | 367 | $56,261 |
| Income Deficit | 191 | $0 |
| Wage / Income Gap (%) | 749 | 18.54% |
| Wage / Income Gap ($) | 749 | 81.46¢ per $1 |
| Gini / Inequality Index | 749 | 0.46 |
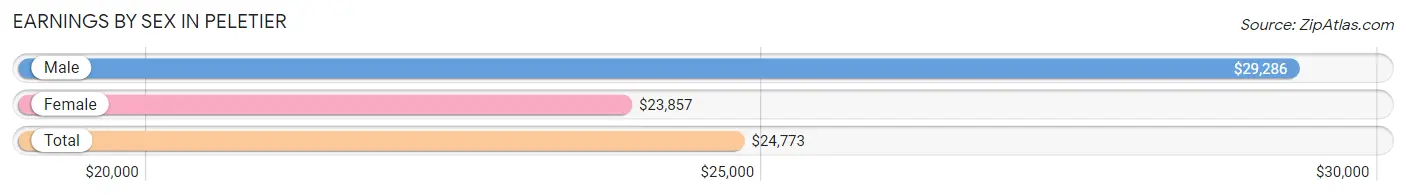
Earnings by Sex in Peletier
Average Earnings in Peletier are $24,773, $29,286 for men and $23,857 for women, a difference of 18.5%.
| Sex | Number | Average Earnings |
| Male | 154 (43.5%) | $29,286 |
| Female | 200 (56.5%) | $23,857 |
| Total | 354 (100.0%) | $24,773 |
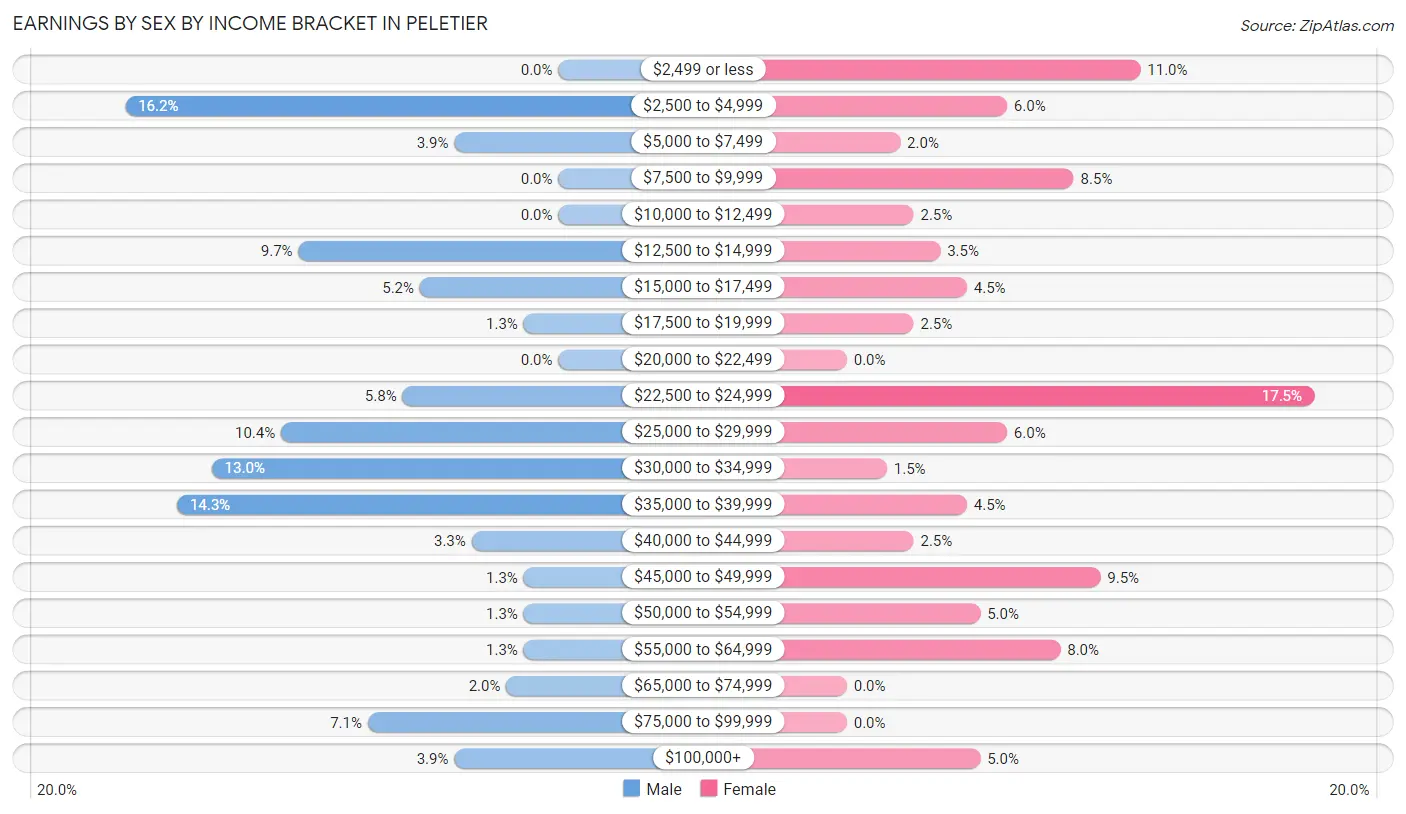
Earnings by Sex by Income Bracket in Peletier
The most common earnings brackets in Peletier are $2,500 to $4,999 for men (25 | 16.2%) and $22,500 to $24,999 for women (35 | 17.5%).
| Income | Male | Female |
| $2,499 or less | 0 (0.0%) | 22 (11.0%) |
| $2,500 to $4,999 | 25 (16.2%) | 12 (6.0%) |
| $5,000 to $7,499 | 6 (3.9%) | 4 (2.0%) |
| $7,500 to $9,999 | 0 (0.0%) | 17 (8.5%) |
| $10,000 to $12,499 | 0 (0.0%) | 5 (2.5%) |
| $12,500 to $14,999 | 15 (9.7%) | 7 (3.5%) |
| $15,000 to $17,499 | 8 (5.2%) | 9 (4.5%) |
| $17,500 to $19,999 | 2 (1.3%) | 5 (2.5%) |
| $20,000 to $22,499 | 0 (0.0%) | 0 (0.0%) |
| $22,500 to $24,999 | 9 (5.8%) | 35 (17.5%) |
| $25,000 to $29,999 | 16 (10.4%) | 12 (6.0%) |
| $30,000 to $34,999 | 20 (13.0%) | 3 (1.5%) |
| $35,000 to $39,999 | 22 (14.3%) | 9 (4.5%) |
| $40,000 to $44,999 | 5 (3.3%) | 5 (2.5%) |
| $45,000 to $49,999 | 2 (1.3%) | 19 (9.5%) |
| $50,000 to $54,999 | 2 (1.3%) | 10 (5.0%) |
| $55,000 to $64,999 | 2 (1.3%) | 16 (8.0%) |
| $65,000 to $74,999 | 3 (1.9%) | 0 (0.0%) |
| $75,000 to $99,999 | 11 (7.1%) | 0 (0.0%) |
| $100,000+ | 6 (3.9%) | 10 (5.0%) |
| Total | 154 (100.0%) | 200 (100.0%) |
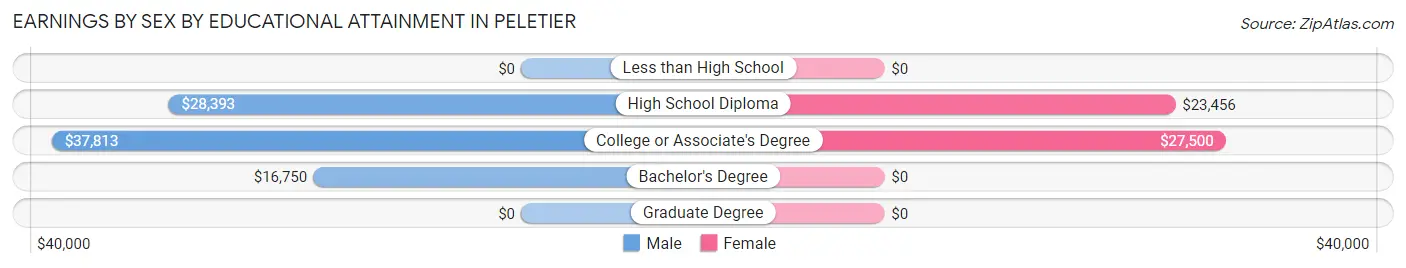
Earnings by Sex by Educational Attainment in Peletier
Average earnings in Peletier are $31,731 for men and $24,612 for women, a difference of 22.4%. Men with an educational attainment of college or associate's degree enjoy the highest average annual earnings of $37,813, while those with bachelor's degree education earn the least with $16,750. Women with an educational attainment of college or associate's degree earn the most with the average annual earnings of $27,500, while those with high school diploma education have the smallest earnings of $23,456.
| Educational Attainment | Male Income | Female Income |
| Less than High School | - | - |
| High School Diploma | $28,393 | $23,456 |
| College or Associate's Degree | $37,813 | $27,500 |
| Bachelor's Degree | $16,750 | $0 |
| Graduate Degree | - | - |
| Total | $31,731 | $24,612 |
Family Income in Peletier
Family Income Brackets in Peletier
According to the Peletier family income data, there are 60 families falling into the $50,000 to $74,999 income range, which is the most common income bracket and makes up 31.4% of all families.
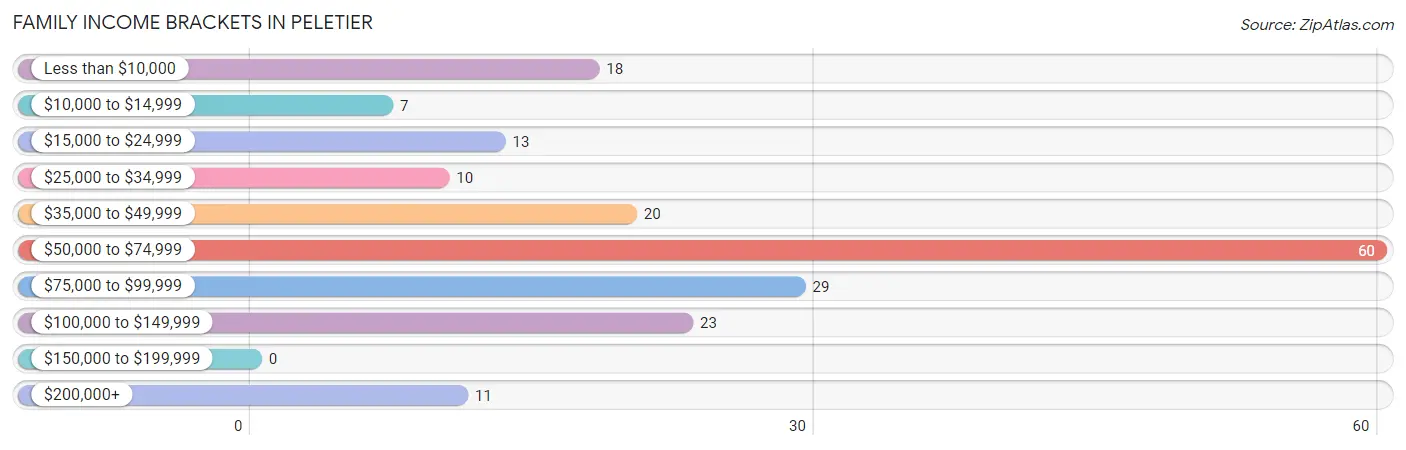
| Income Bracket | # Families | % Families |
| Less than $10,000 | 18 | 9.4% |
| $10,000 to $14,999 | 7 | 3.7% |
| $15,000 to $24,999 | 13 | 6.8% |
| $25,000 to $34,999 | 10 | 5.2% |
| $35,000 to $49,999 | 20 | 10.5% |
| $50,000 to $74,999 | 60 | 31.4% |
| $75,000 to $99,999 | 29 | 15.2% |
| $100,000 to $149,999 | 23 | 12.0% |
| $150,000 to $199,999 | 0 | 0.0% |
| $200,000+ | 11 | 5.8% |
Family Income by Famaliy Size in Peletier
4-person families (35 | 18.3%) account for the highest median family income in Peletier with $88,125 per family, while 2-person families (107 | 56.0%) have the highest median income of $26,792 per family member.
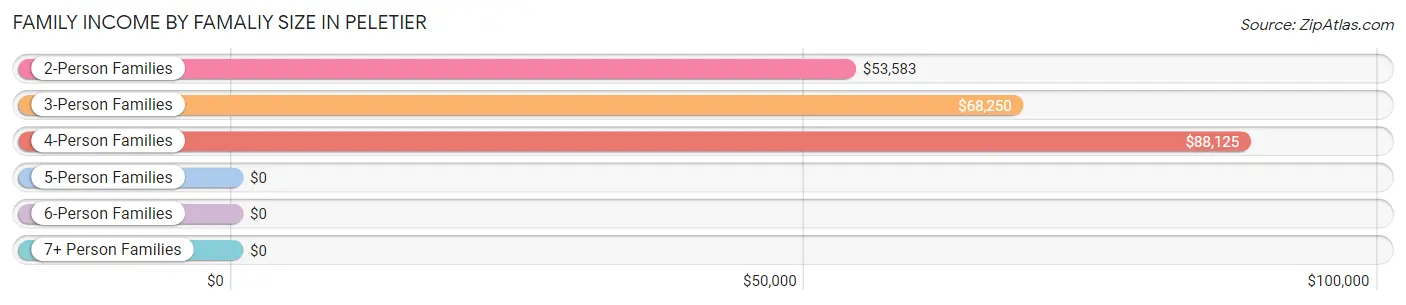
| Income Bracket | # Families | Median Income |
| 2-Person Families | 107 (56.0%) | $53,583 |
| 3-Person Families | 27 (14.1%) | $68,250 |
| 4-Person Families | 35 (18.3%) | $88,125 |
| 5-Person Families | 5 (2.6%) | $0 |
| 6-Person Families | 17 (8.9%) | $0 |
| 7+ Person Families | 0 (0.0%) | $0 |
| Total | 191 (100.0%) | $56,953 |
Family Income by Number of Earners in Peletier
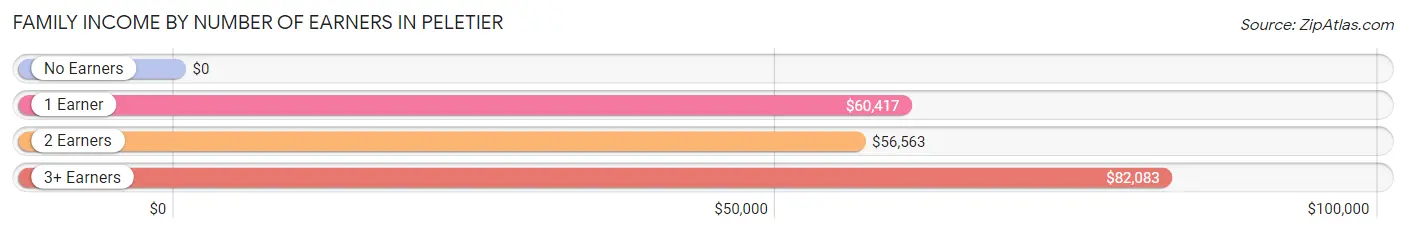
| Number of Earners | # Families | Median Income |
| No Earners | 36 (18.9%) | $0 |
| 1 Earner | 77 (40.3%) | $60,417 |
| 2 Earners | 48 (25.1%) | $56,563 |
| 3+ Earners | 30 (15.7%) | $82,083 |
| Total | 191 (100.0%) | $56,953 |
Household Income in Peletier
Household Income Brackets in Peletier
With 93 households falling in the category, the $50,000 to $74,999 income range is the most frequent in Peletier, accounting for 25.3% of all households. In contrast, only 2 households (0.5%) fall into the $150,000 to $199,999 income bracket, making it the least populous group.
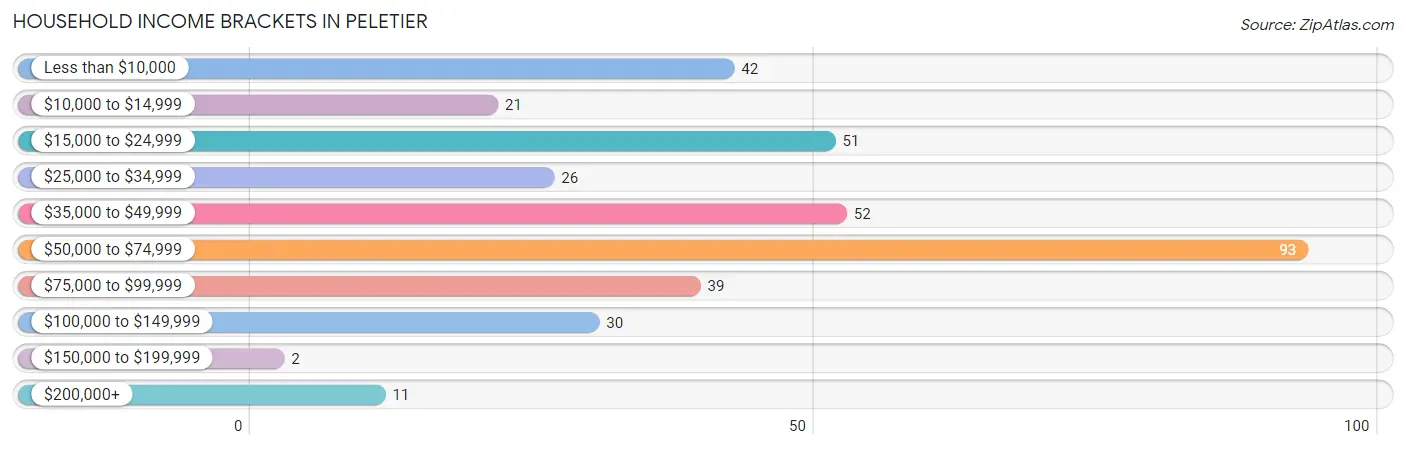
| Income Bracket | # Households | % Households |
| Less than $10,000 | 42 | 11.4% |
| $10,000 to $14,999 | 21 | 5.7% |
| $15,000 to $24,999 | 51 | 13.9% |
| $25,000 to $34,999 | 26 | 7.1% |
| $35,000 to $49,999 | 52 | 14.2% |
| $50,000 to $74,999 | 93 | 25.3% |
| $75,000 to $99,999 | 39 | 10.6% |
| $100,000 to $149,999 | 30 | 8.2% |
| $150,000 to $199,999 | 2 | 0.5% |
| $200,000+ | 11 | 3.0% |
Household Income by Householder Age in Peletier
The median household income in Peletier is $45,781, with the highest median household income of $55,391 found in the 45 to 64 years age bracket for the primary householder. A total of 129 households (35.1%) fall into this category. Meanwhile, the 15 to 24 years age bracket for the primary householder has the lowest median household income of $0, with 6 households (1.6%) in this group.
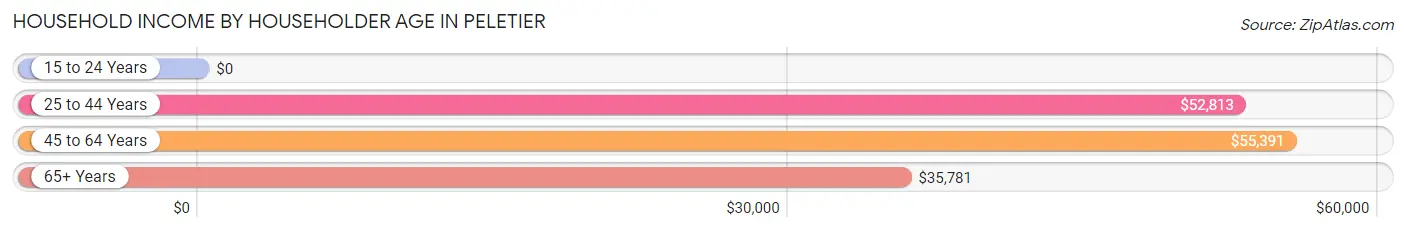
| Income Bracket | # Households | Median Income |
| 15 to 24 Years | 6 (1.6%) | $0 |
| 25 to 44 Years | 85 (23.2%) | $52,813 |
| 45 to 64 Years | 129 (35.1%) | $55,391 |
| 65+ Years | 147 (40.1%) | $35,781 |
| Total | 367 (100.0%) | $45,781 |
Poverty in Peletier
Income Below Poverty by Sex and Age in Peletier
With 16.7% poverty level for males and 20.4% for females among the residents of Peletier, 12 to 14 year old males and under 5 year old females are the most vulnerable to poverty, with 7 males (41.2%) and 4 females (100.0%) in their respective age groups living below the poverty level.
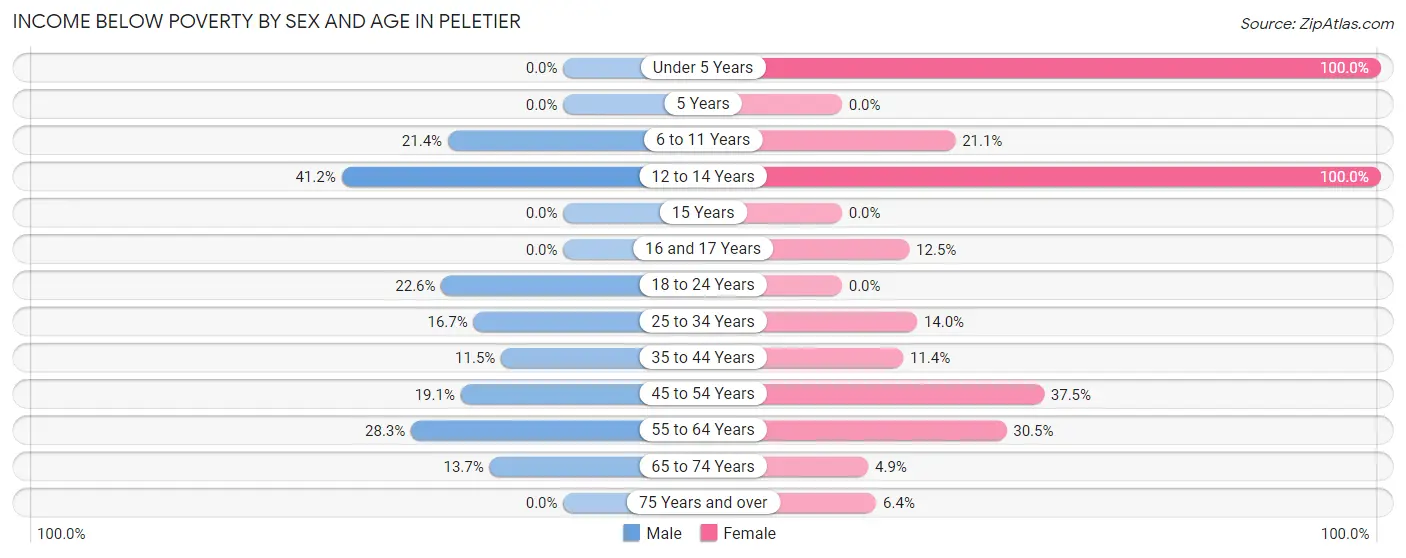
| Age Bracket | Male | Female |
| Under 5 Years | 0 (0.0%) | 4 (100.0%) |
| 5 Years | 0 (0.0%) | 0 (0.0%) |
| 6 to 11 Years | 3 (21.4%) | 4 (21.0%) |
| 12 to 14 Years | 7 (41.2%) | 4 (100.0%) |
| 15 Years | 0 (0.0%) | 0 (0.0%) |
| 16 and 17 Years | 0 (0.0%) | 2 (12.5%) |
| 18 to 24 Years | 12 (22.6%) | 0 (0.0%) |
| 25 to 34 Years | 7 (16.7%) | 6 (14.0%) |
| 35 to 44 Years | 6 (11.5%) | 5 (11.4%) |
| 45 to 54 Years | 4 (19.1%) | 18 (37.5%) |
| 55 to 64 Years | 13 (28.3%) | 29 (30.5%) |
| 65 to 74 Years | 10 (13.7%) | 2 (4.9%) |
| 75 Years and over | 0 (0.0%) | 3 (6.4%) |
| Total | 62 (16.7%) | 77 (20.4%) |
Income Above Poverty by Sex and Age in Peletier
According to the poverty statistics in Peletier, males aged 5 years and females aged 5 years are the age groups that are most secure financially, with 100.0% of males and 100.0% of females in these age groups living above the poverty line.
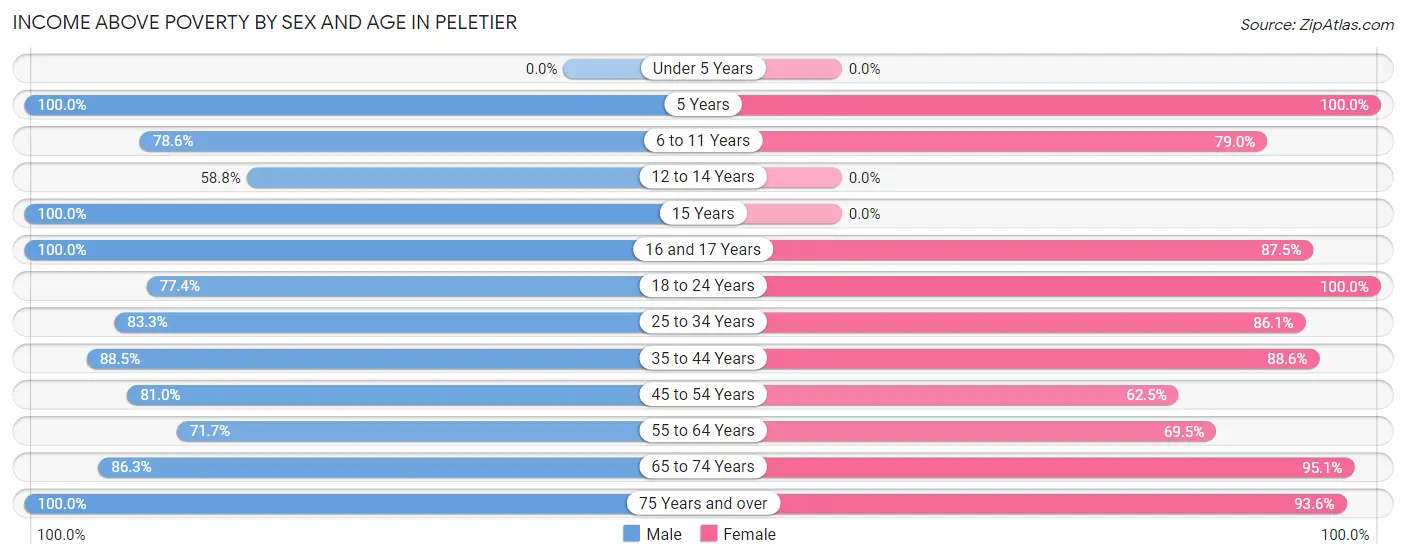
| Age Bracket | Male | Female |
| Under 5 Years | 0 (0.0%) | 0 (0.0%) |
| 5 Years | 15 (100.0%) | 10 (100.0%) |
| 6 to 11 Years | 11 (78.6%) | 15 (78.9%) |
| 12 to 14 Years | 10 (58.8%) | 0 (0.0%) |
| 15 Years | 2 (100.0%) | 0 (0.0%) |
| 16 and 17 Years | 17 (100.0%) | 14 (87.5%) |
| 18 to 24 Years | 41 (77.4%) | 7 (100.0%) |
| 25 to 34 Years | 35 (83.3%) | 37 (86.1%) |
| 35 to 44 Years | 46 (88.5%) | 39 (88.6%) |
| 45 to 54 Years | 17 (80.9%) | 30 (62.5%) |
| 55 to 64 Years | 33 (71.7%) | 66 (69.5%) |
| 65 to 74 Years | 63 (86.3%) | 39 (95.1%) |
| 75 Years and over | 19 (100.0%) | 44 (93.6%) |
| Total | 309 (83.3%) | 301 (79.6%) |
Income Below Poverty Among Married-Couple Families in Peletier
The poverty statistics for married-couple families in Peletier show that 8.2% or 9 of the total 110 families live below the poverty line. Families with 3 or 4 children have the highest poverty rate of 100.0%, comprising of 7 families. On the other hand, families with 1 or 2 children have the lowest poverty rate of 0.0%, which includes 0 families.
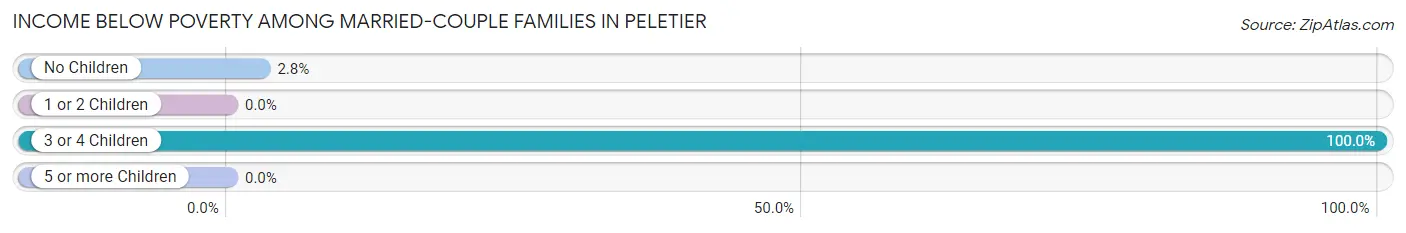
| Children | Above Poverty | Below Poverty |
| No Children | 69 (97.2%) | 2 (2.8%) |
| 1 or 2 Children | 32 (100.0%) | 0 (0.0%) |
| 3 or 4 Children | 0 (0.0%) | 7 (100.0%) |
| 5 or more Children | 0 (0.0%) | 0 (0.0%) |
| Total | 101 (91.8%) | 9 (8.2%) |
Income Below Poverty Among Single-Parent Households in Peletier
According to the poverty data in Peletier, 61.5% or 8 single-father households and 29.4% or 20 single-mother households are living below the poverty line. Among single-father households, those with no children have the highest poverty rate, with 8 households (61.5%) experiencing poverty. Likewise, among single-mother households, those with 3 or 4 children have the highest poverty rate, with 5 households (100.0%) falling below the poverty line.
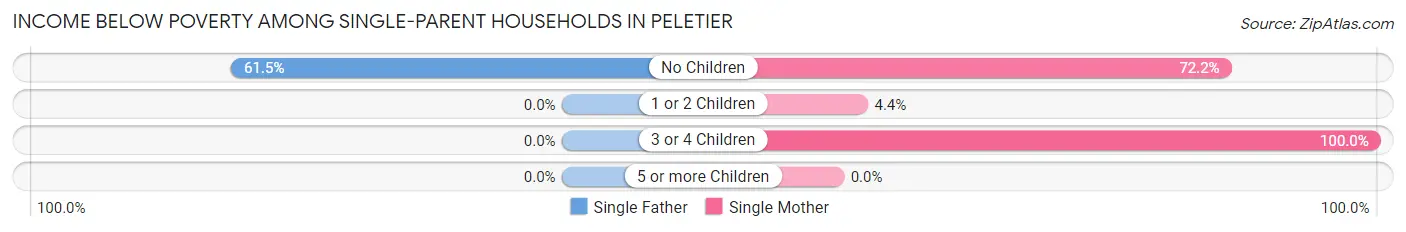
| Children | Single Father | Single Mother |
| No Children | 8 (61.5%) | 13 (72.2%) |
| 1 or 2 Children | 0 (0.0%) | 2 (4.4%) |
| 3 or 4 Children | 0 (0.0%) | 5 (100.0%) |
| 5 or more Children | 0 (0.0%) | 0 (0.0%) |
| Total | 8 (61.5%) | 20 (29.4%) |
Income Below Poverty Among Married-Couple vs Single-Parent Households in Peletier
The poverty data for Peletier shows that 9 of the married-couple family households (8.2%) and 28 of the single-parent households (34.6%) are living below the poverty level. Within the married-couple family households, those with 3 or 4 children have the highest poverty rate, with 7 households (100.0%) falling below the poverty line. Among the single-parent households, those with 3 or 4 children have the highest poverty rate, with 5 household (100.0%) living below poverty.
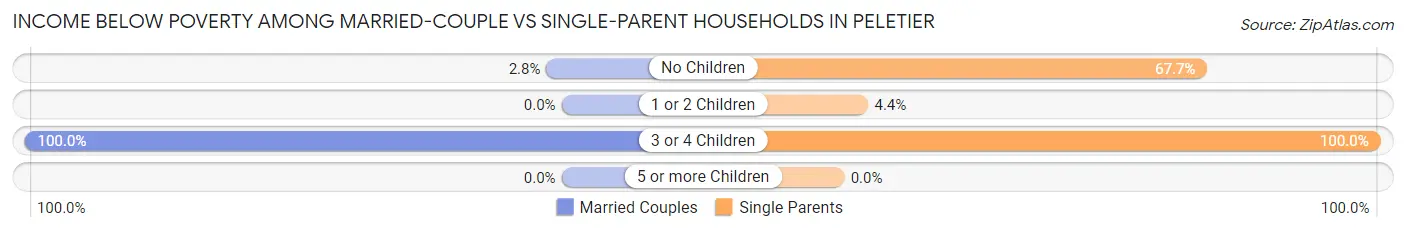
| Children | Married-Couple Families | Single-Parent Households |
| No Children | 2 (2.8%) | 21 (67.7%) |
| 1 or 2 Children | 0 (0.0%) | 2 (4.4%) |
| 3 or 4 Children | 7 (100.0%) | 5 (100.0%) |
| 5 or more Children | 0 (0.0%) | 0 (0.0%) |
| Total | 9 (8.2%) | 28 (34.6%) |
Race in Peletier
The most populous races in Peletier are White / Caucasian (683 | 91.2%), Asian (30 | 4.0%), and Black / African American (13 | 1.7%).
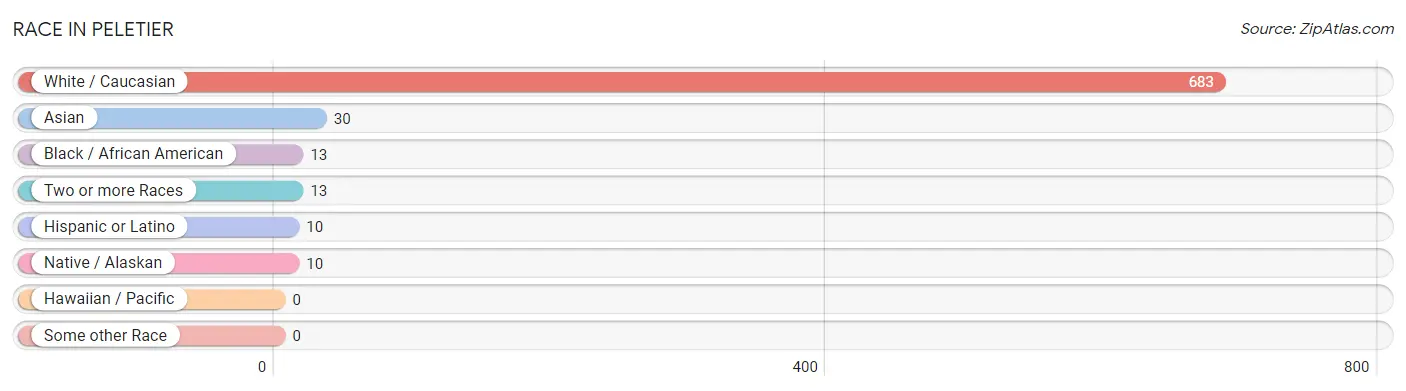
| Race | # Population | % Population |
| Asian | 30 | 4.0% |
| Black / African American | 13 | 1.7% |
| Hawaiian / Pacific | 0 | 0.0% |
| Hispanic or Latino | 10 | 1.3% |
| Native / Alaskan | 10 | 1.3% |
| White / Caucasian | 683 | 91.2% |
| Two or more Races | 13 | 1.7% |
| Some other Race | 0 | 0.0% |
| Total | 749 | 100.0% |
Ancestry in Peletier
The most populous ancestries reported in Peletier are English (186 | 24.8%), German (94 | 12.6%), American (85 | 11.4%), Irish (81 | 10.8%), and Polish (44 | 5.9%), together accounting for 65.4% of all Peletier residents.
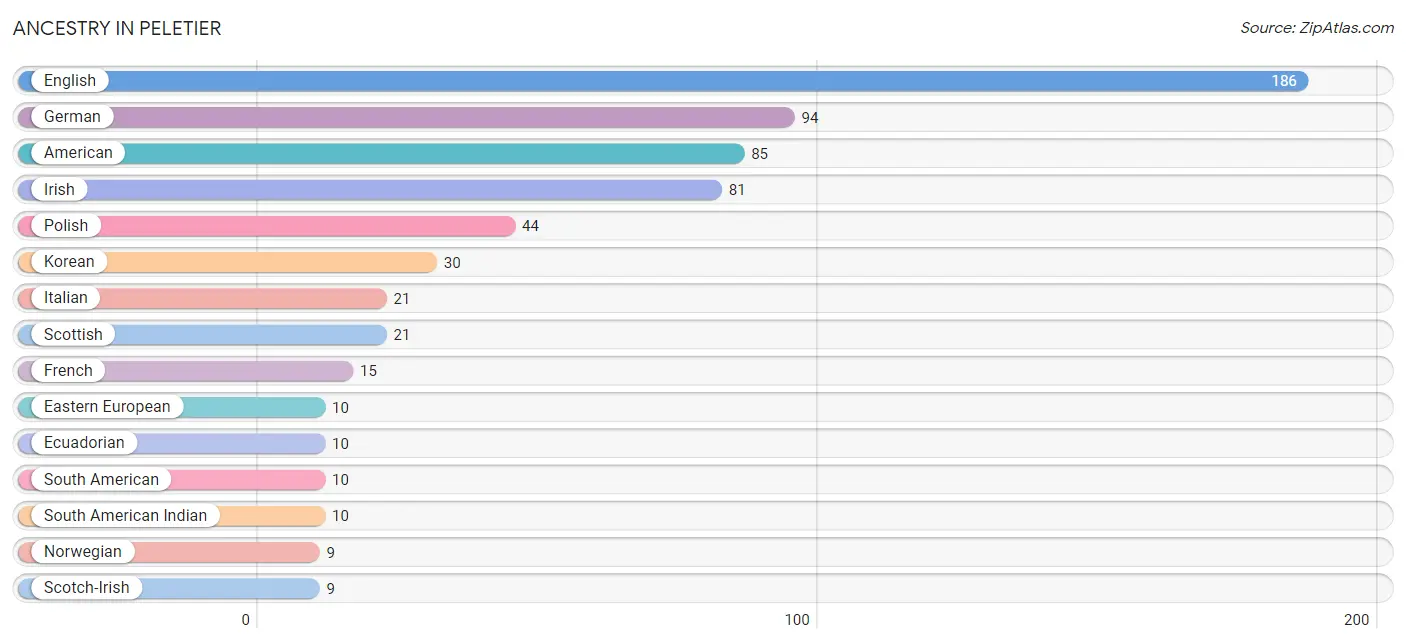
| Ancestry | # Population | % Population |
| American | 85 | 11.4% |
| British | 5 | 0.7% |
| Cherokee | 4 | 0.5% |
| Danish | 5 | 0.7% |
| Dutch | 7 | 0.9% |
| Eastern European | 10 | 1.3% |
| Ecuadorian | 10 | 1.3% |
| English | 186 | 24.8% |
| European | 5 | 0.7% |
| French | 15 | 2.0% |
| French Canadian | 6 | 0.8% |
| German | 94 | 12.6% |
| Hungarian | 3 | 0.4% |
| Irish | 81 | 10.8% |
| Italian | 21 | 2.8% |
| Korean | 30 | 4.0% |
| Lithuanian | 2 | 0.3% |
| Norwegian | 9 | 1.2% |
| Polish | 44 | 5.9% |
| Scotch-Irish | 9 | 1.2% |
| Scottish | 21 | 2.8% |
| Slovak | 7 | 0.9% |
| South American | 10 | 1.3% |
| South American Indian | 10 | 1.3% |
| Swedish | 7 | 0.9% |
| Swiss | 6 | 0.8% |
| Ukrainian | 4 | 0.5% | View All 27 Rows |
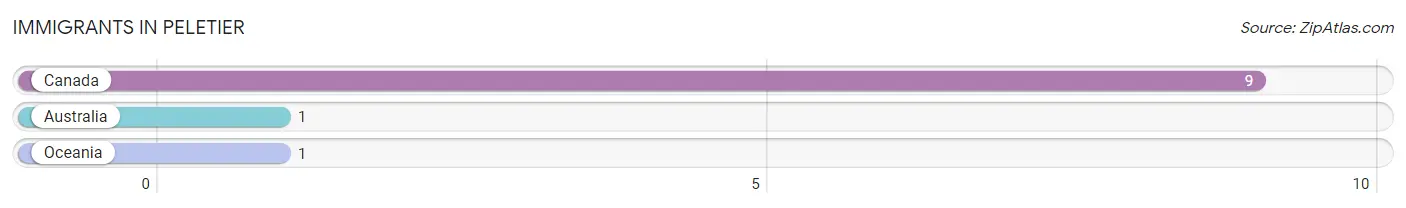
Immigrants in Peletier
The most numerous immigrant groups reported in Peletier came from Canada (9 | 1.2%), Australia (1 | 0.1%), and Oceania (1 | 0.1%), together accounting for 1.5% of all Peletier residents.
| Immigration Origin | # Population | % Population |
| Australia | 1 | 0.1% |
| Canada | 9 | 1.2% |
| Oceania | 1 | 0.1% | View All 3 Rows |
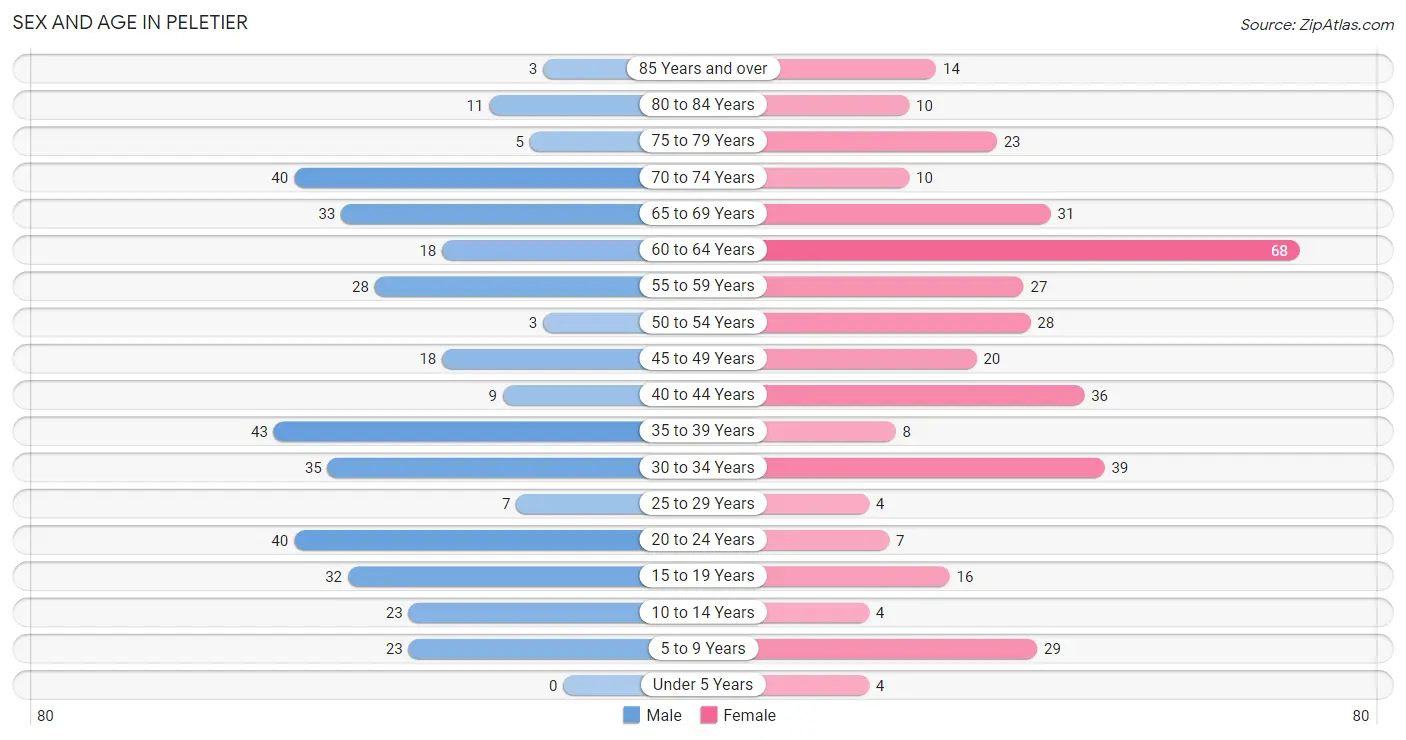
Sex and Age in Peletier
Sex and Age in Peletier
The most populous age groups in Peletier are 35 to 39 Years (43 | 11.6%) for men and 60 to 64 Years (68 | 18.0%) for women.
| Age Bracket | Male | Female |
| Under 5 Years | 0 (0.0%) | 4 (1.1%) |
| 5 to 9 Years | 23 (6.2%) | 29 (7.7%) |
| 10 to 14 Years | 23 (6.2%) | 4 (1.1%) |
| 15 to 19 Years | 32 (8.6%) | 16 (4.2%) |
| 20 to 24 Years | 40 (10.8%) | 7 (1.8%) |
| 25 to 29 Years | 7 (1.9%) | 4 (1.1%) |
| 30 to 34 Years | 35 (9.4%) | 39 (10.3%) |
| 35 to 39 Years | 43 (11.6%) | 8 (2.1%) |
| 40 to 44 Years | 9 (2.4%) | 36 (9.5%) |
| 45 to 49 Years | 18 (4.9%) | 20 (5.3%) |
| 50 to 54 Years | 3 (0.8%) | 28 (7.4%) |
| 55 to 59 Years | 28 (7.5%) | 27 (7.1%) |
| 60 to 64 Years | 18 (4.9%) | 68 (18.0%) |
| 65 to 69 Years | 33 (8.9%) | 31 (8.2%) |
| 70 to 74 Years | 40 (10.8%) | 10 (2.6%) |
| 75 to 79 Years | 5 (1.3%) | 23 (6.1%) |
| 80 to 84 Years | 11 (3.0%) | 10 (2.6%) |
| 85 Years and over | 3 (0.8%) | 14 (3.7%) |
| Total | 371 (100.0%) | 378 (100.0%) |
Families and Households in Peletier
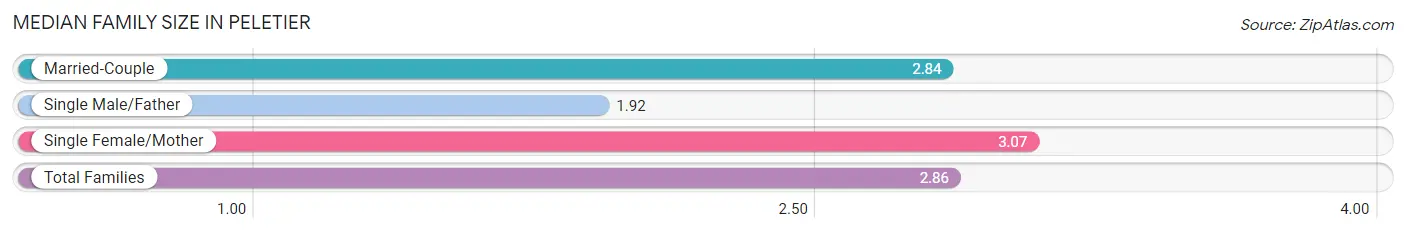
Median Family Size in Peletier
The median family size in Peletier is 2.86 persons per family, with single female/mother families (68 | 35.6%) accounting for the largest median family size of 3.07 persons per family. On the other hand, single male/father families (13 | 6.8%) represent the smallest median family size with 1.92 persons per family.
| Family Type | # Families | Family Size |
| Married-Couple | 110 (57.6%) | 2.84 |
| Single Male/Father | 13 (6.8%) | 1.92 |
| Single Female/Mother | 68 (35.6%) | 3.07 |
| Total Families | 191 (100.0%) | 2.86 |
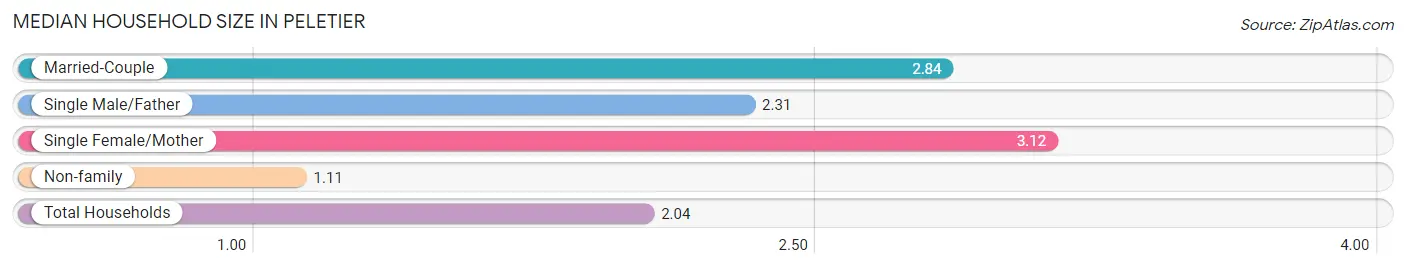
Median Household Size in Peletier
The median household size in Peletier is 2.04 persons per household, with single female/mother households (68 | 18.5%) accounting for the largest median household size of 3.12 persons per household. non-family households (176 | 48.0%) represent the smallest median household size with 1.11 persons per household.
| Household Type | # Households | Household Size |
| Married-Couple | 110 (30.0%) | 2.84 |
| Single Male/Father | 13 (3.5%) | 2.31 |
| Single Female/Mother | 68 (18.5%) | 3.12 |
| Non-family | 176 (48.0%) | 1.11 |
| Total Households | 367 (100.0%) | 2.04 |
Household Size by Marriage Status in Peletier
Out of a total of 367 households in Peletier, 191 (52.0%) are family households, while 176 (48.0%) are nonfamily households. The most numerous type of family households are 2-person households, comprising 99, and the most common type of nonfamily households are 1-person households, comprising 156.
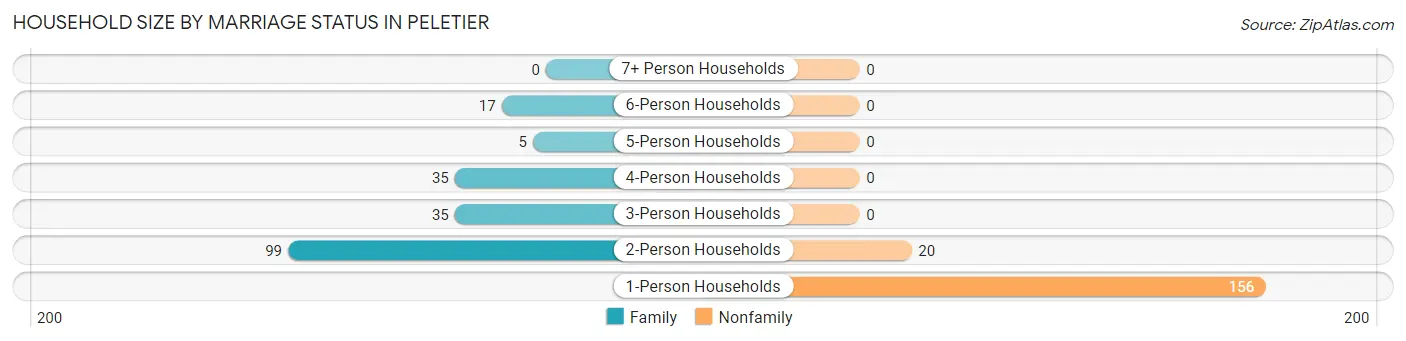
| Household Size | Family Households | Nonfamily Households |
| 1-Person Households | - | 156 (42.5%) |
| 2-Person Households | 99 (27.0%) | 20 (5.4%) |
| 3-Person Households | 35 (9.5%) | 0 (0.0%) |
| 4-Person Households | 35 (9.5%) | 0 (0.0%) |
| 5-Person Households | 5 (1.4%) | 0 (0.0%) |
| 6-Person Households | 17 (4.6%) | 0 (0.0%) |
| 7+ Person Households | 0 (0.0%) | 0 (0.0%) |
| Total | 191 (52.0%) | 176 (48.0%) |
Female Fertility in Peletier
Fertility by Age in Peletier
| Age Bracket | Women with Births | Births / 1,000 Women |
| 15 to 19 years | 0 (0.0%) | 0.0 |
| 20 to 34 years | 0 (0.0%) | 0.0 |
| 35 to 50 years | 0 (0.0%) | 0.0 |
| Total | 0 (0.0%) | 0.0 |
Fertility by Age by Marriage Status in Peletier
| Age Bracket | Married | Unmarried |
| 15 to 19 years | 0 (0.0%) | 0 (0.0%) |
| 20 to 34 years | 0 (0.0%) | 0 (0.0%) |
| 35 to 50 years | 0 (0.0%) | 0 (0.0%) |
| Total | 0 (0.0%) | 0 (0.0%) |
Fertility by Education in Peletier
| Educational Attainment | Women with Births | Births / 1,000 Women |
| Less than High School | 0 (0.0%) | 0.0 |
| High School Diploma | 0 (0.0%) | 0.0 |
| College or Associate's Degree | 0 (0.0%) | 0.0 |
| Bachelor's Degree | 0 (0.0%) | 0.0 |
| Graduate Degree | 0 (0.0%) | 0.0 |
| Total | 0 (0.0%) | 0.0 |
Fertility by Education by Marriage Status in Peletier
| Educational Attainment | Married | Unmarried |
| Less than High School | 0 (0.0%) | 0 (0.0%) |
| High School Diploma | 0 (0.0%) | 0 (0.0%) |
| College or Associate's Degree | 0 (0.0%) | 0 (0.0%) |
| Bachelor's Degree | 0 (0.0%) | 0 (0.0%) |
| Graduate Degree | 0 (0.0%) | 0 (0.0%) |
| Total | 0 (0.0%) | 0 (0.0%) |
Employment Characteristics in Peletier
Employment by Class of Employer in Peletier
Among the 304 employed individuals in Peletier, private company employees (192 | 63.2%), local government employees (29 | 9.5%), and federal government employees (27 | 8.9%) make up the most common classes of employment.
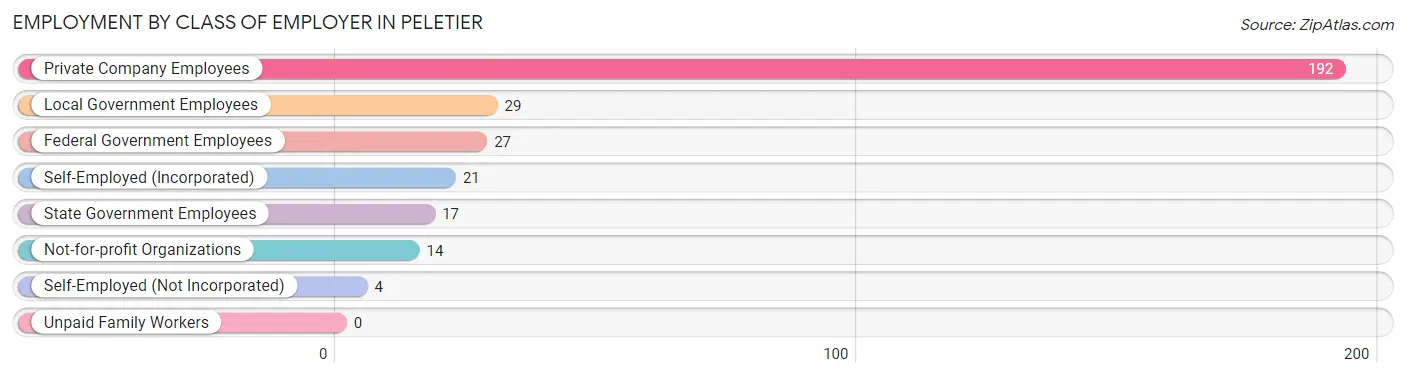
| Employer Class | # Employees | % Employees |
| Private Company Employees | 192 | 63.2% |
| Self-Employed (Incorporated) | 21 | 6.9% |
| Self-Employed (Not Incorporated) | 4 | 1.3% |
| Not-for-profit Organizations | 14 | 4.6% |
| Local Government Employees | 29 | 9.5% |
| State Government Employees | 17 | 5.6% |
| Federal Government Employees | 27 | 8.9% |
| Unpaid Family Workers | 0 | 0.0% |
| Total | 304 | 100.0% |
Employment Status by Age in Peletier
According to the labor force statistics for Peletier, out of the total population over 16 years of age (664), 55.1% or 366 individuals are in the labor force, with 15.3% or 56 of them unemployed. The age group with the highest labor force participation rate is 60 to 64 years, with 75.6% or 65 individuals in the labor force. Within the labor force, the 20 to 24 years age range has the highest percentage of unemployed individuals, with 61.8% or 21 of them being unemployed.
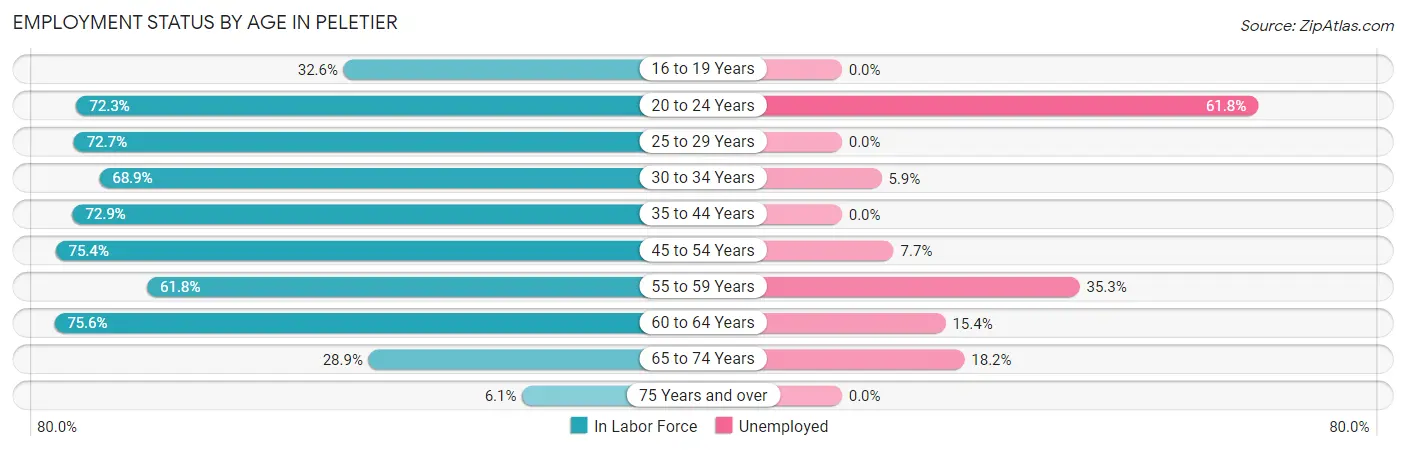
| Age Bracket | In Labor Force | Unemployed |
| 16 to 19 Years | 15 (32.6%) | 0 (0.0%) |
| 20 to 24 Years | 34 (72.3%) | 21 (61.8%) |
| 25 to 29 Years | 8 (72.7%) | 0 (0.0%) |
| 30 to 34 Years | 51 (68.9%) | 3 (5.9%) |
| 35 to 44 Years | 70 (72.9%) | 0 (0.0%) |
| 45 to 54 Years | 52 (75.4%) | 4 (7.7%) |
| 55 to 59 Years | 34 (61.8%) | 12 (35.3%) |
| 60 to 64 Years | 65 (75.6%) | 10 (15.4%) |
| 65 to 74 Years | 33 (28.9%) | 6 (18.2%) |
| 75 Years and over | 4 (6.1%) | 0 (0.0%) |
| Total | 366 (55.1%) | 56 (15.3%) |
Employment Status by Educational Attainment in Peletier
According to labor force statistics for Peletier, 71.6% of individuals (280) out of the total population between 25 and 64 years of age (391) are in the labor force, with 10.4% or 29 of them being unemployed. The group with the highest labor force participation rate are those with the educational attainment of bachelor's degree or higher, with 81.1% or 43 individuals in the labor force. Within the labor force, individuals with less than high school education have the highest percentage of unemployment, with 83.3% or 10 of them being unemployed.
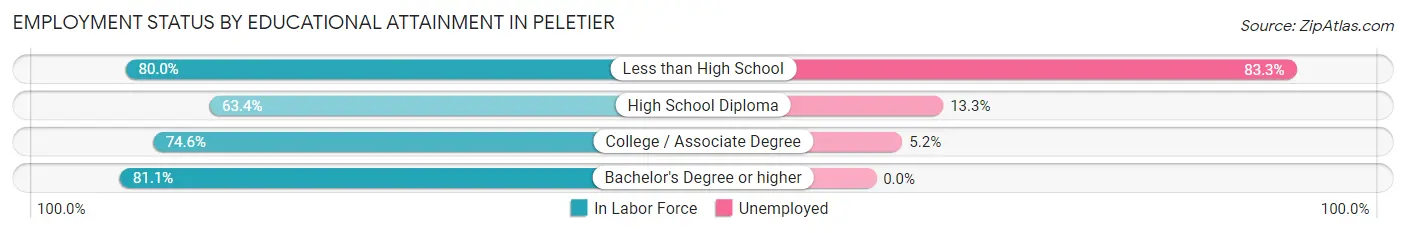
| Educational Attainment | In Labor Force | Unemployed |
| Less than High School | 12 (80.0%) | 12 (83.3%) |
| High School Diploma | 90 (63.4%) | 19 (13.3%) |
| College / Associate Degree | 135 (74.6%) | 9 (5.2%) |
| Bachelor's Degree or higher | 43 (81.1%) | 0 (0.0%) |
| Total | 280 (71.6%) | 41 (10.4%) |
Employment Occupations by Sex in Peletier
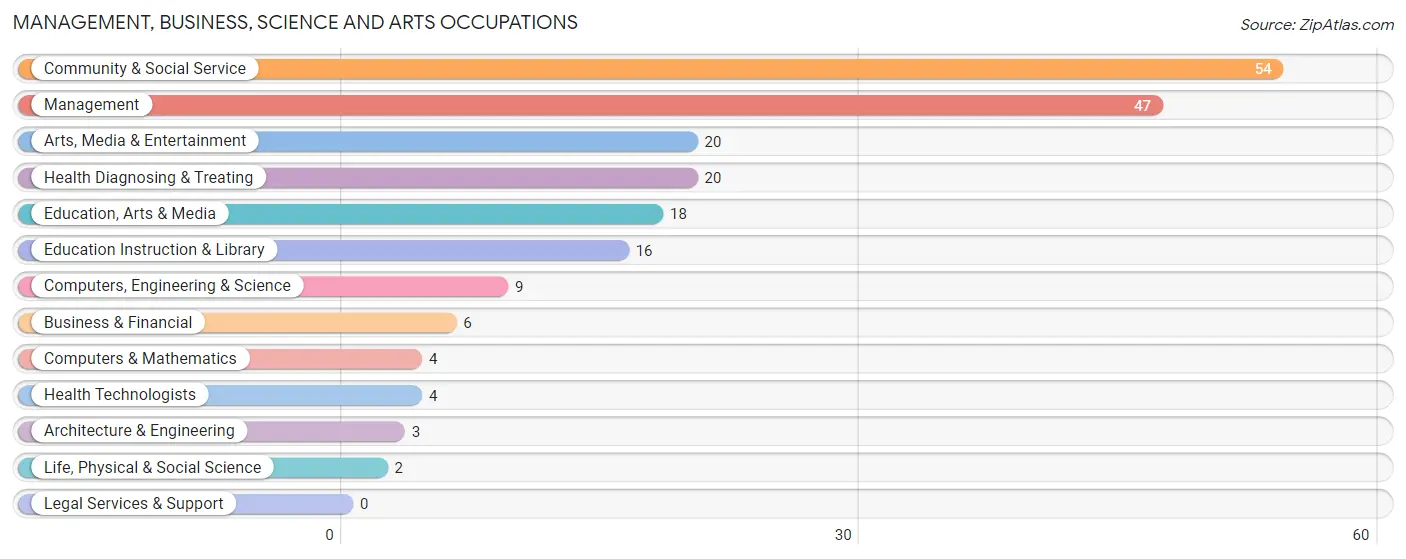
Management, Business, Science and Arts Occupations
The most common Management, Business, Science and Arts occupations in Peletier are Community & Social Service (54 | 17.4%), Management (47 | 15.2%), Arts, Media & Entertainment (20 | 6.5%), Health Diagnosing & Treating (20 | 6.5%), and Education, Arts & Media (18 | 5.8%).
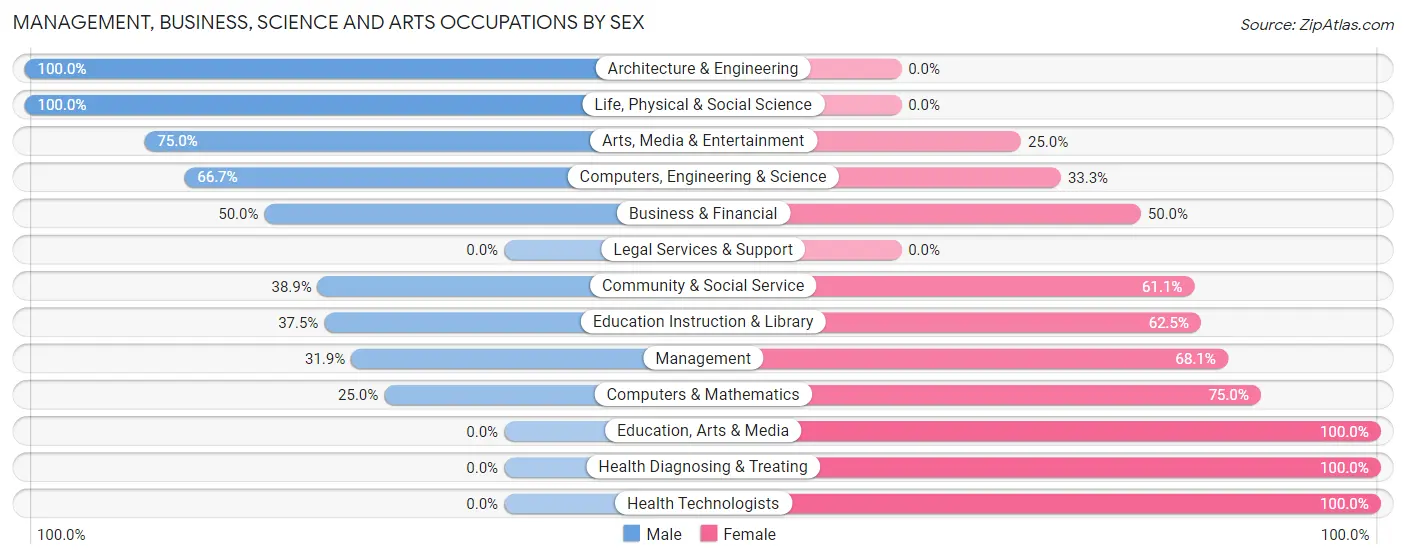
Management, Business, Science and Arts Occupations by Sex
Within the Management, Business, Science and Arts occupations in Peletier, the most male-oriented occupations are Architecture & Engineering (100.0%), Life, Physical & Social Science (100.0%), and Arts, Media & Entertainment (75.0%), while the most female-oriented occupations are Education, Arts & Media (100.0%), Health Diagnosing & Treating (100.0%), and Health Technologists (100.0%).
| Occupation | Male | Female |
| Management | 15 (31.9%) | 32 (68.1%) |
| Business & Financial | 3 (50.0%) | 3 (50.0%) |
| Computers, Engineering & Science | 6 (66.7%) | 3 (33.3%) |
| Computers & Mathematics | 1 (25.0%) | 3 (75.0%) |
| Architecture & Engineering | 3 (100.0%) | 0 (0.0%) |
| Life, Physical & Social Science | 2 (100.0%) | 0 (0.0%) |
| Community & Social Service | 21 (38.9%) | 33 (61.1%) |
| Education, Arts & Media | 0 (0.0%) | 18 (100.0%) |
| Legal Services & Support | 0 (0.0%) | 0 (0.0%) |
| Education Instruction & Library | 6 (37.5%) | 10 (62.5%) |
| Arts, Media & Entertainment | 15 (75.0%) | 5 (25.0%) |
| Health Diagnosing & Treating | 0 (0.0%) | 20 (100.0%) |
| Health Technologists | 0 (0.0%) | 4 (100.0%) |
| Total (Category) | 45 (33.1%) | 91 (66.9%) |
| Total (Overall) | 136 (43.9%) | 174 (56.1%) |
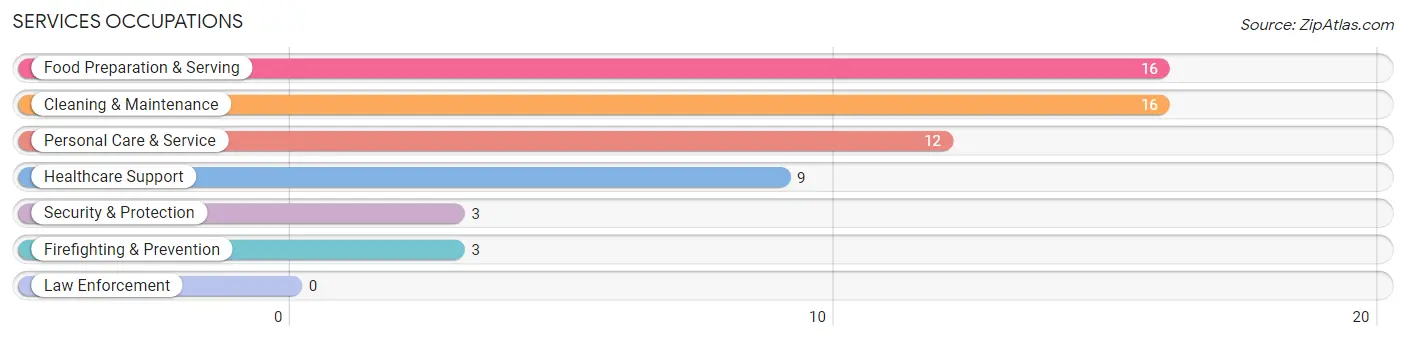
Services Occupations
The most common Services occupations in Peletier are Food Preparation & Serving (16 | 5.2%), Cleaning & Maintenance (16 | 5.2%), Personal Care & Service (12 | 3.9%), Healthcare Support (9 | 2.9%), and Security & Protection (3 | 1.0%).
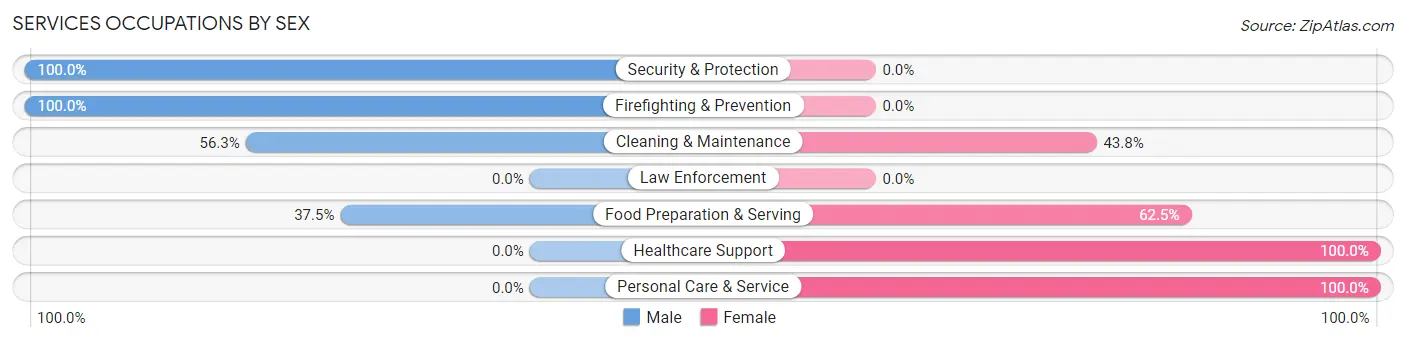
Services Occupations by Sex
Within the Services occupations in Peletier, the most male-oriented occupations are Security & Protection (100.0%), Firefighting & Prevention (100.0%), and Cleaning & Maintenance (56.2%), while the most female-oriented occupations are Healthcare Support (100.0%), Personal Care & Service (100.0%), and Food Preparation & Serving (62.5%).
| Occupation | Male | Female |
| Healthcare Support | 0 (0.0%) | 9 (100.0%) |
| Security & Protection | 3 (100.0%) | 0 (0.0%) |
| Firefighting & Prevention | 3 (100.0%) | 0 (0.0%) |
| Law Enforcement | 0 (0.0%) | 0 (0.0%) |
| Food Preparation & Serving | 6 (37.5%) | 10 (62.5%) |
| Cleaning & Maintenance | 9 (56.2%) | 7 (43.8%) |
| Personal Care & Service | 0 (0.0%) | 12 (100.0%) |
| Total (Category) | 18 (32.1%) | 38 (67.9%) |
| Total (Overall) | 136 (43.9%) | 174 (56.1%) |
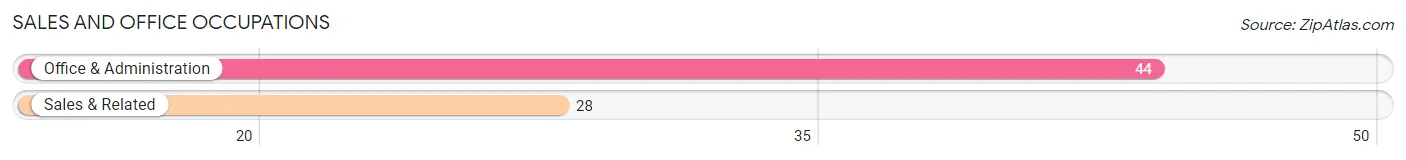
Sales and Office Occupations
The most common Sales and Office occupations in Peletier are Office & Administration (44 | 14.2%), and Sales & Related (28 | 9.0%).
Sales and Office Occupations by Sex
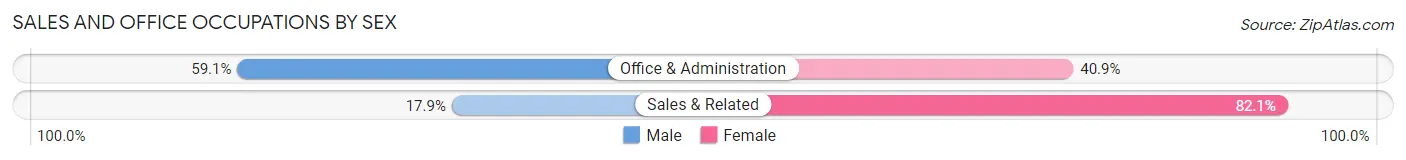
| Occupation | Male | Female |
| Sales & Related | 5 (17.9%) | 23 (82.1%) |
| Office & Administration | 26 (59.1%) | 18 (40.9%) |
| Total (Category) | 31 (43.1%) | 41 (56.9%) |
| Total (Overall) | 136 (43.9%) | 174 (56.1%) |
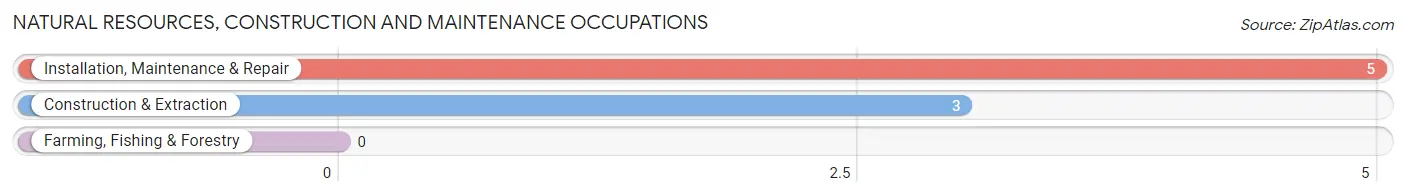
Natural Resources, Construction and Maintenance Occupations
The most common Natural Resources, Construction and Maintenance occupations in Peletier are Installation, Maintenance & Repair (5 | 1.6%), and Construction & Extraction (3 | 1.0%).
Natural Resources, Construction and Maintenance Occupations by Sex
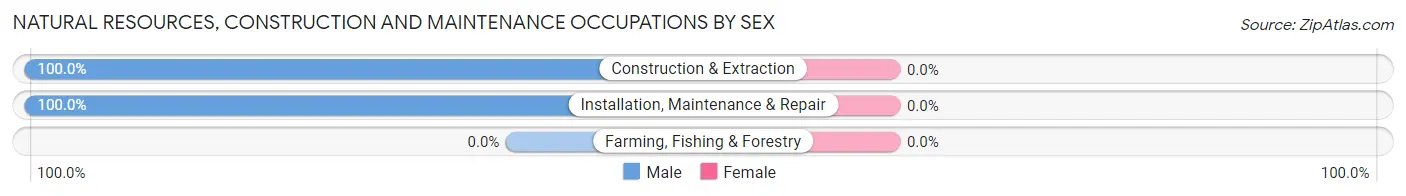
| Occupation | Male | Female |
| Farming, Fishing & Forestry | 0 (0.0%) | 0 (0.0%) |
| Construction & Extraction | 3 (100.0%) | 0 (0.0%) |
| Installation, Maintenance & Repair | 5 (100.0%) | 0 (0.0%) |
| Total (Category) | 8 (100.0%) | 0 (0.0%) |
| Total (Overall) | 136 (43.9%) | 174 (56.1%) |
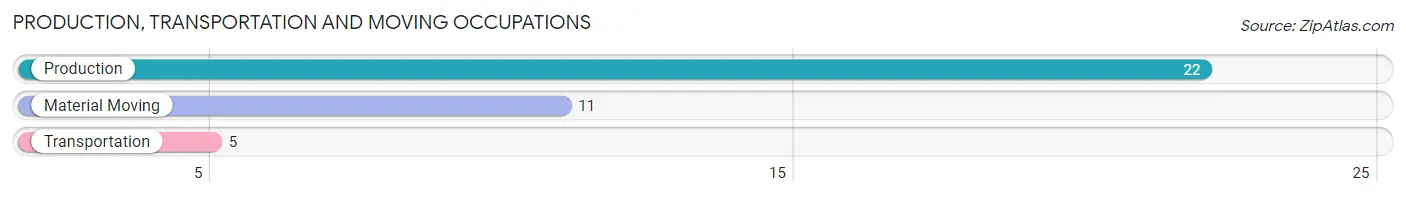
Production, Transportation and Moving Occupations
The most common Production, Transportation and Moving occupations in Peletier are Production (22 | 7.1%), Material Moving (11 | 3.5%), and Transportation (5 | 1.6%).
Production, Transportation and Moving Occupations by Sex
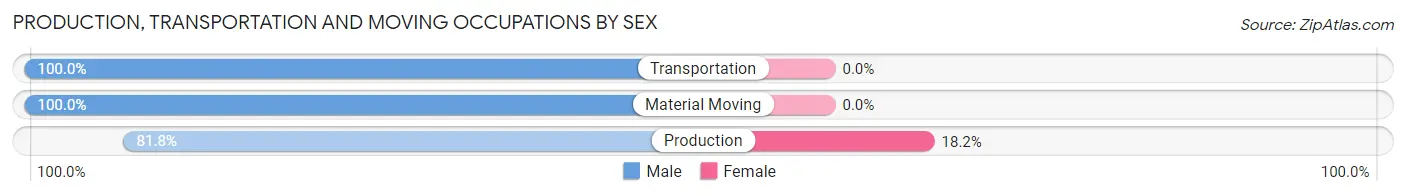
| Occupation | Male | Female |
| Production | 18 (81.8%) | 4 (18.2%) |
| Transportation | 5 (100.0%) | 0 (0.0%) |
| Material Moving | 11 (100.0%) | 0 (0.0%) |
| Total (Category) | 34 (89.5%) | 4 (10.5%) |
| Total (Overall) | 136 (43.9%) | 174 (56.1%) |
Employment Industries by Sex in Peletier
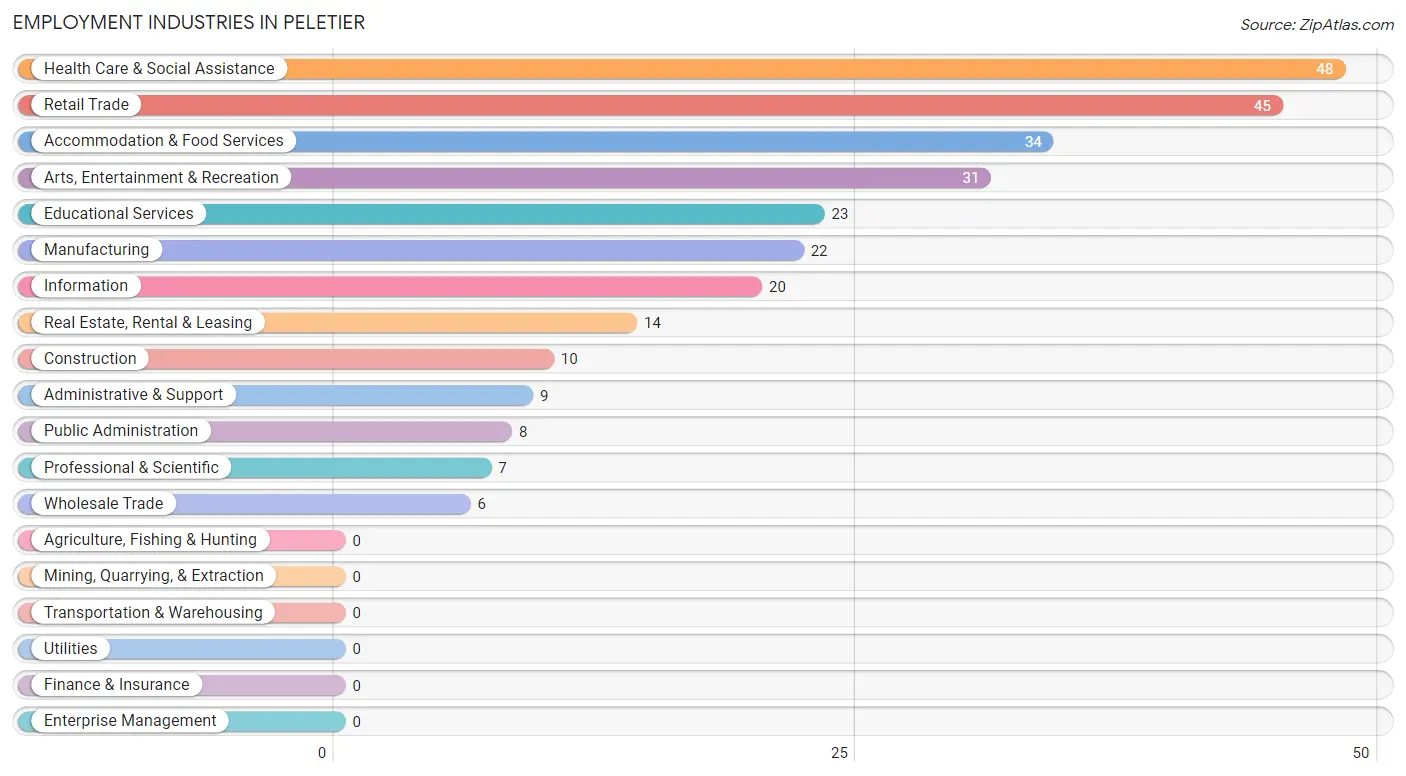
Employment Industries in Peletier
The major employment industries in Peletier include Health Care & Social Assistance (48 | 15.5%), Retail Trade (45 | 14.5%), Accommodation & Food Services (34 | 11.0%), Arts, Entertainment & Recreation (31 | 10.0%), and Educational Services (23 | 7.4%).
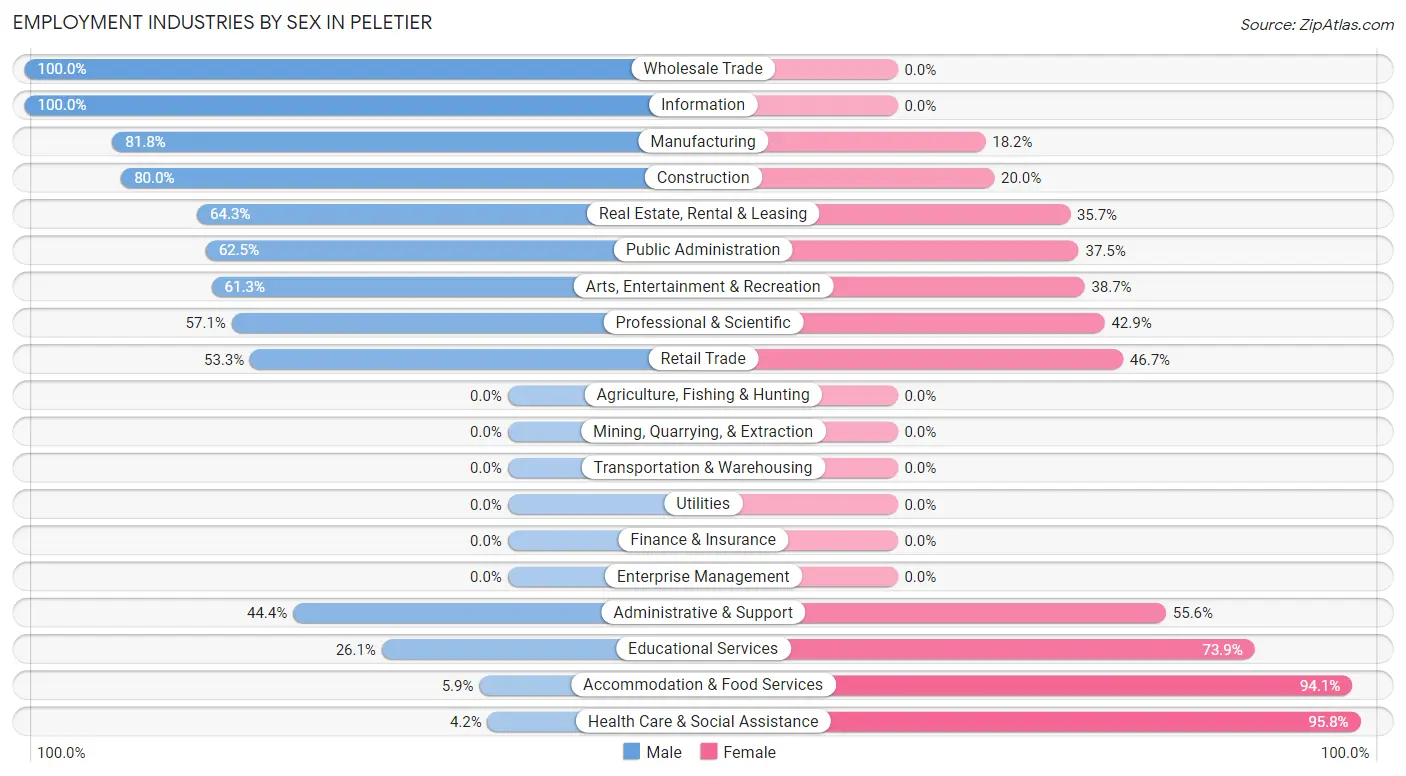
Employment Industries by Sex in Peletier
The Peletier industries that see more men than women are Wholesale Trade (100.0%), Information (100.0%), and Manufacturing (81.8%), whereas the industries that tend to have a higher number of women are Health Care & Social Assistance (95.8%), Accommodation & Food Services (94.1%), and Educational Services (73.9%).
| Industry | Male | Female |
| Agriculture, Fishing & Hunting | 0 (0.0%) | 0 (0.0%) |
| Mining, Quarrying, & Extraction | 0 (0.0%) | 0 (0.0%) |
| Construction | 8 (80.0%) | 2 (20.0%) |
| Manufacturing | 18 (81.8%) | 4 (18.2%) |
| Wholesale Trade | 6 (100.0%) | 0 (0.0%) |
| Retail Trade | 24 (53.3%) | 21 (46.7%) |
| Transportation & Warehousing | 0 (0.0%) | 0 (0.0%) |
| Utilities | 0 (0.0%) | 0 (0.0%) |
| Information | 20 (100.0%) | 0 (0.0%) |
| Finance & Insurance | 0 (0.0%) | 0 (0.0%) |
| Real Estate, Rental & Leasing | 9 (64.3%) | 5 (35.7%) |
| Professional & Scientific | 4 (57.1%) | 3 (42.9%) |
| Enterprise Management | 0 (0.0%) | 0 (0.0%) |
| Administrative & Support | 4 (44.4%) | 5 (55.6%) |
| Educational Services | 6 (26.1%) | 17 (73.9%) |
| Health Care & Social Assistance | 2 (4.2%) | 46 (95.8%) |
| Arts, Entertainment & Recreation | 19 (61.3%) | 12 (38.7%) |
| Accommodation & Food Services | 2 (5.9%) | 32 (94.1%) |
| Public Administration | 5 (62.5%) | 3 (37.5%) |
| Total | 136 (43.9%) | 174 (56.1%) |
Education in Peletier
School Enrollment in Peletier
The most common levels of schooling among the 129 students in Peletier are high school (48 | 37.2%), elementary school (30 | 23.3%), and college / undergraduate (25 | 19.4%).
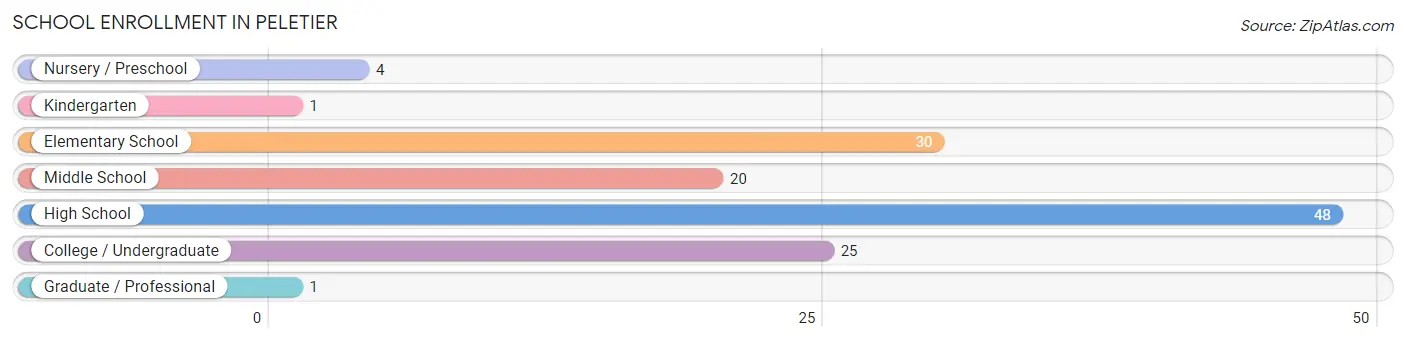
| School Level | # Students | % Students |
| Nursery / Preschool | 4 | 3.1% |
| Kindergarten | 1 | 0.8% |
| Elementary School | 30 | 23.3% |
| Middle School | 20 | 15.5% |
| High School | 48 | 37.2% |
| College / Undergraduate | 25 | 19.4% |
| Graduate / Professional | 1 | 0.8% |
| Total | 129 | 100.0% |
School Enrollment by Age by Funding Source in Peletier
Out of a total of 129 students who are enrolled in schools in Peletier, 4 (3.1%) attend a private institution, while the remaining 125 (96.9%) are enrolled in public schools. The age group of 3 to 4 year olds has the highest likelihood of being enrolled in private schools, with 4 (100.0% in the age bracket) enrolled. Conversely, the age group of 5 to 9 year old has the lowest likelihood of being enrolled in a private school, with 28 (100.0% in the age bracket) attending a public institution.
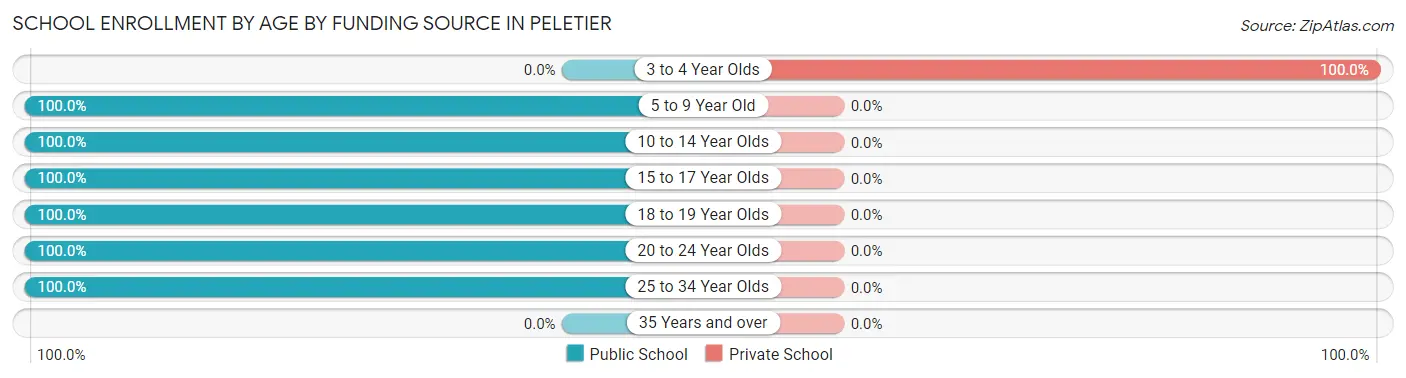
| Age Bracket | Public School | Private School |
| 3 to 4 Year Olds | 0 (0.0%) | 4 (100.0%) |
| 5 to 9 Year Old | 28 (100.0%) | 0 (0.0%) |
| 10 to 14 Year Olds | 27 (100.0%) | 0 (0.0%) |
| 15 to 17 Year Olds | 35 (100.0%) | 0 (0.0%) |
| 18 to 19 Year Olds | 13 (100.0%) | 0 (0.0%) |
| 20 to 24 Year Olds | 7 (100.0%) | 0 (0.0%) |
| 25 to 34 Year Olds | 15 (100.0%) | 0 (0.0%) |
| 35 Years and over | 0 (0.0%) | 0 (0.0%) |
| Total | 125 (96.9%) | 4 (3.1%) |
Educational Attainment by Field of Study in Peletier
Literature & languages (26 | 22.8%), education (22 | 19.3%), business (14 | 12.3%), science & technology (13 | 11.4%), and arts & humanities (12 | 10.5%) are the most common fields of study among 114 individuals in Peletier who have obtained a bachelor's degree or higher.
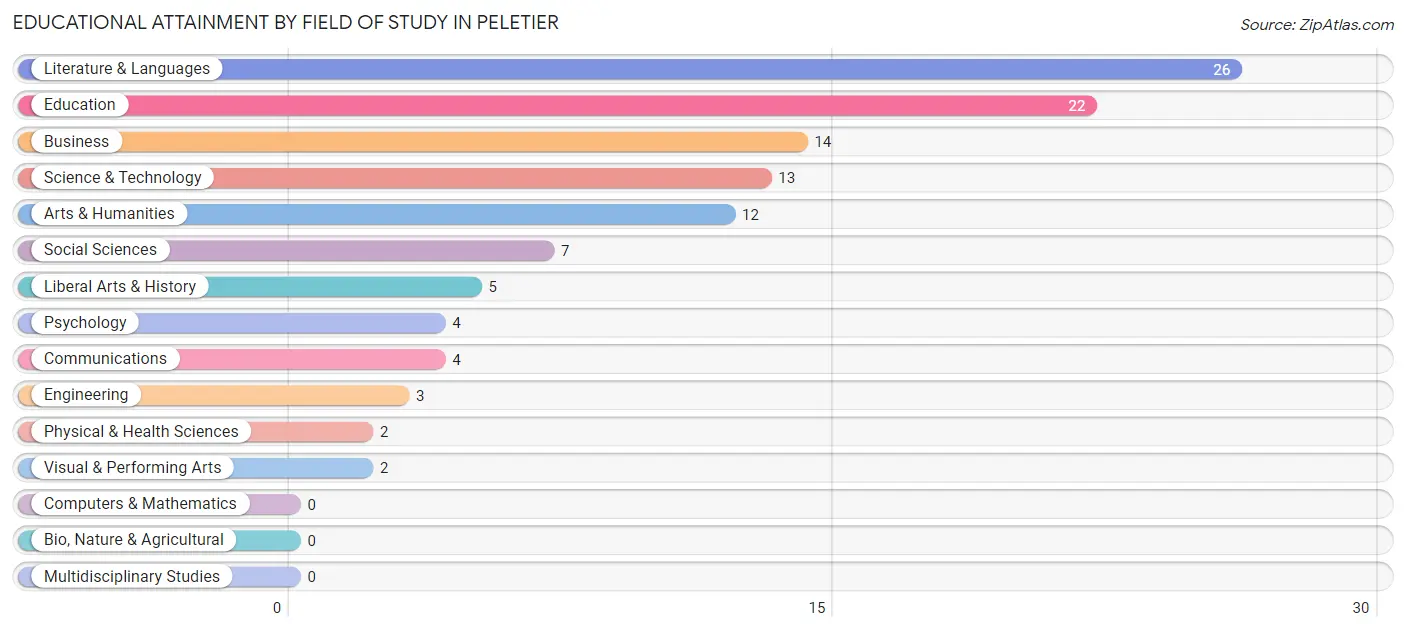
| Field of Study | # Graduates | % Graduates |
| Computers & Mathematics | 0 | 0.0% |
| Bio, Nature & Agricultural | 0 | 0.0% |
| Physical & Health Sciences | 2 | 1.8% |
| Psychology | 4 | 3.5% |
| Social Sciences | 7 | 6.1% |
| Engineering | 3 | 2.6% |
| Multidisciplinary Studies | 0 | 0.0% |
| Science & Technology | 13 | 11.4% |
| Business | 14 | 12.3% |
| Education | 22 | 19.3% |
| Literature & Languages | 26 | 22.8% |
| Liberal Arts & History | 5 | 4.4% |
| Visual & Performing Arts | 2 | 1.8% |
| Communications | 4 | 3.5% |
| Arts & Humanities | 12 | 10.5% |
| Total | 114 | 100.0% |
Transportation & Commute in Peletier
Vehicle Availability by Sex in Peletier
The most prevalent vehicle ownership categories in Peletier are males with 2 vehicles (45, accounting for 33.8%) and females with 2 vehicles (57, making up 26.3%).
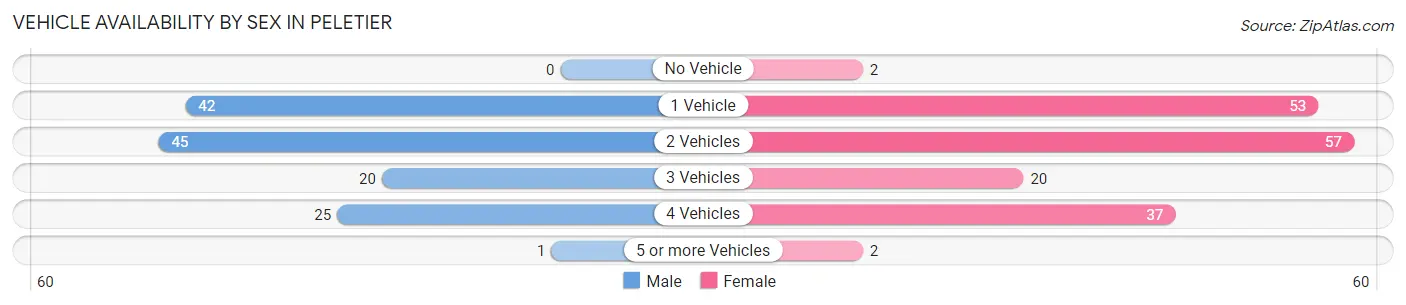
| Vehicles Available | Male | Female |
| No Vehicle | 0 (0.0%) | 2 (1.2%) |
| 1 Vehicle | 42 (31.6%) | 53 (31.0%) |
| 2 Vehicles | 45 (33.8%) | 57 (33.3%) |
| 3 Vehicles | 20 (15.0%) | 20 (11.7%) |
| 4 Vehicles | 25 (18.8%) | 37 (21.6%) |
| 5 or more Vehicles | 1 (0.7%) | 2 (1.2%) |
| Total | 133 (100.0%) | 171 (100.0%) |
Commute Time in Peletier
The most frequently occuring commute durations in Peletier are 30 to 34 minutes (70 commuters, 23.6%), 5 to 9 minutes (56 commuters, 18.9%), and 10 to 14 minutes (41 commuters, 13.9%).
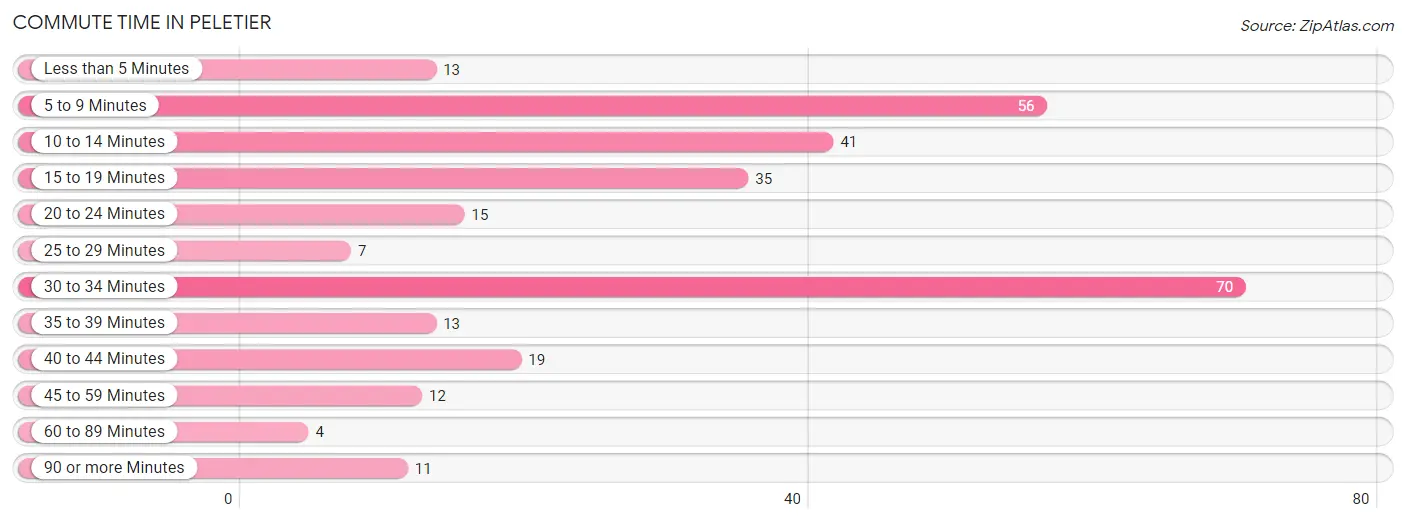
| Commute Time | # Commuters | % Commuters |
| Less than 5 Minutes | 13 | 4.4% |
| 5 to 9 Minutes | 56 | 18.9% |
| 10 to 14 Minutes | 41 | 13.9% |
| 15 to 19 Minutes | 35 | 11.8% |
| 20 to 24 Minutes | 15 | 5.1% |
| 25 to 29 Minutes | 7 | 2.4% |
| 30 to 34 Minutes | 70 | 23.6% |
| 35 to 39 Minutes | 13 | 4.4% |
| 40 to 44 Minutes | 19 | 6.4% |
| 45 to 59 Minutes | 12 | 4.1% |
| 60 to 89 Minutes | 4 | 1.3% |
| 90 or more Minutes | 11 | 3.7% |
Commute Time by Sex in Peletier
The most common commute times in Peletier are 10 to 14 minutes (34 commuters, 26.2%) for males and 30 to 34 minutes (43 commuters, 25.9%) for females.
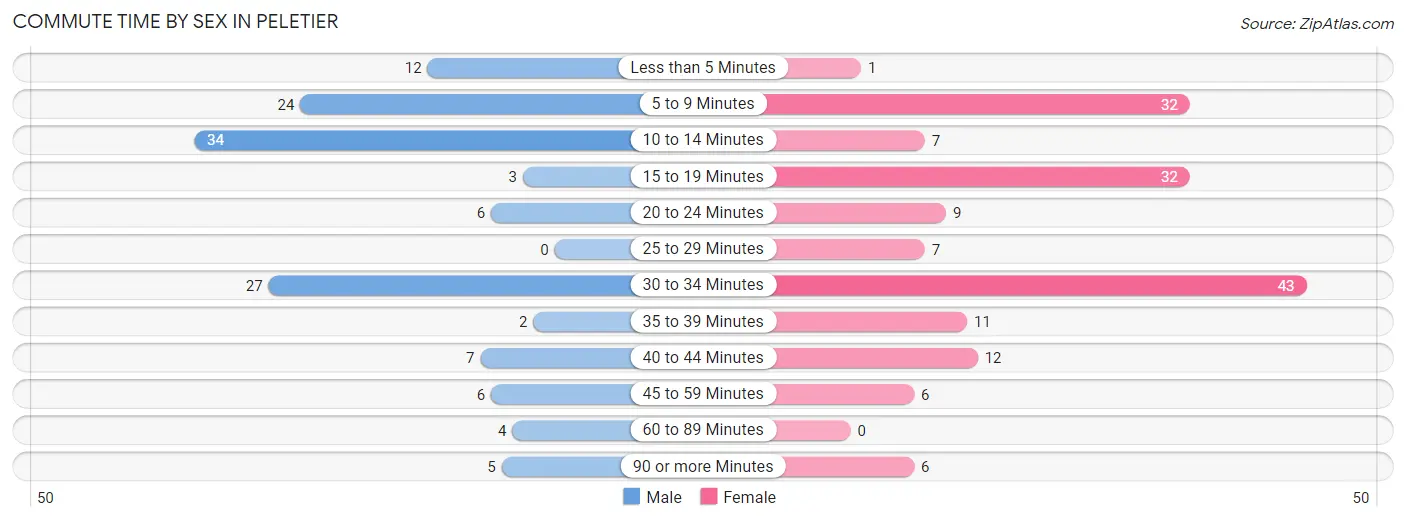
| Commute Time | Male | Female |
| Less than 5 Minutes | 12 (9.2%) | 1 (0.6%) |
| 5 to 9 Minutes | 24 (18.5%) | 32 (19.3%) |
| 10 to 14 Minutes | 34 (26.2%) | 7 (4.2%) |
| 15 to 19 Minutes | 3 (2.3%) | 32 (19.3%) |
| 20 to 24 Minutes | 6 (4.6%) | 9 (5.4%) |
| 25 to 29 Minutes | 0 (0.0%) | 7 (4.2%) |
| 30 to 34 Minutes | 27 (20.8%) | 43 (25.9%) |
| 35 to 39 Minutes | 2 (1.5%) | 11 (6.6%) |
| 40 to 44 Minutes | 7 (5.4%) | 12 (7.2%) |
| 45 to 59 Minutes | 6 (4.6%) | 6 (3.6%) |
| 60 to 89 Minutes | 4 (3.1%) | 0 (0.0%) |
| 90 or more Minutes | 5 (3.8%) | 6 (3.6%) |
Time of Departure to Work by Sex in Peletier
The most frequent times of departure to work in Peletier are 7:30 AM to 7:59 AM (26, 20.0%) for males and 7:00 AM to 7:29 AM (33, 19.9%) for females.
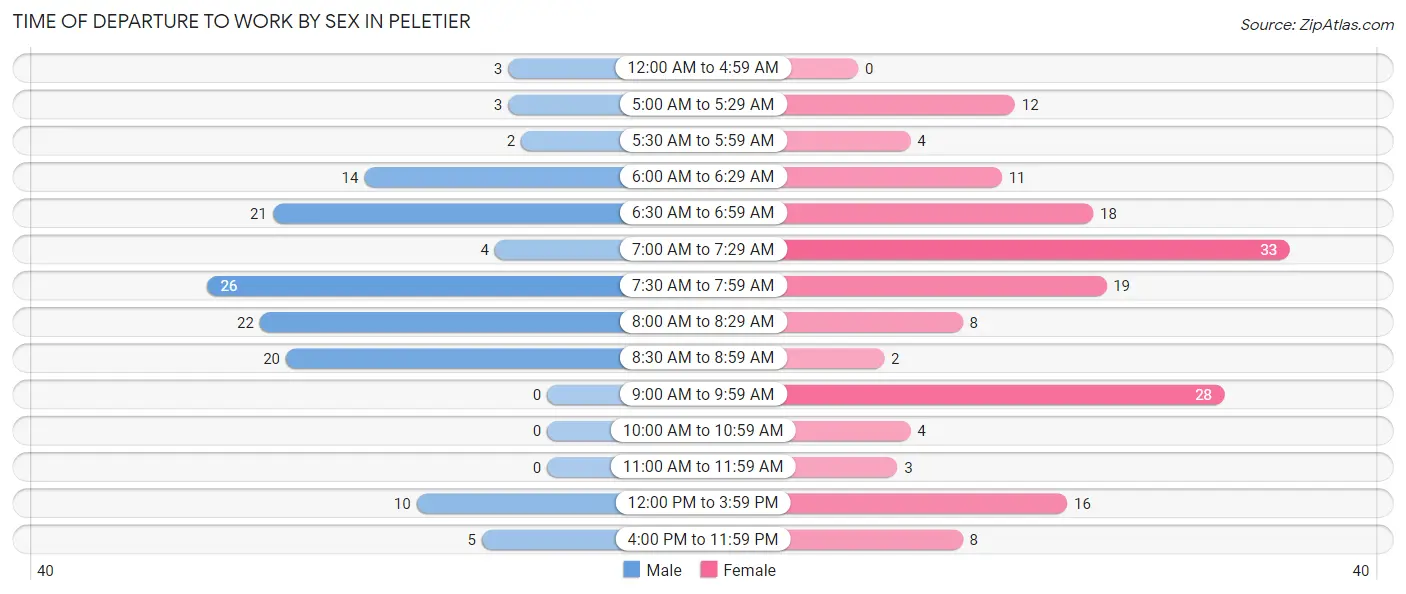
| Time of Departure | Male | Female |
| 12:00 AM to 4:59 AM | 3 (2.3%) | 0 (0.0%) |
| 5:00 AM to 5:29 AM | 3 (2.3%) | 12 (7.2%) |
| 5:30 AM to 5:59 AM | 2 (1.5%) | 4 (2.4%) |
| 6:00 AM to 6:29 AM | 14 (10.8%) | 11 (6.6%) |
| 6:30 AM to 6:59 AM | 21 (16.2%) | 18 (10.8%) |
| 7:00 AM to 7:29 AM | 4 (3.1%) | 33 (19.9%) |
| 7:30 AM to 7:59 AM | 26 (20.0%) | 19 (11.5%) |
| 8:00 AM to 8:29 AM | 22 (16.9%) | 8 (4.8%) |
| 8:30 AM to 8:59 AM | 20 (15.4%) | 2 (1.2%) |
| 9:00 AM to 9:59 AM | 0 (0.0%) | 28 (16.9%) |
| 10:00 AM to 10:59 AM | 0 (0.0%) | 4 (2.4%) |
| 11:00 AM to 11:59 AM | 0 (0.0%) | 3 (1.8%) |
| 12:00 PM to 3:59 PM | 10 (7.7%) | 16 (9.6%) |
| 4:00 PM to 11:59 PM | 5 (3.8%) | 8 (4.8%) |
| Total | 130 (100.0%) | 166 (100.0%) |
Housing Occupancy in Peletier
Occupancy by Ownership in Peletier
Of the total 367 dwellings in Peletier, owner-occupied units account for 266 (72.5%), while renter-occupied units make up 101 (27.5%).
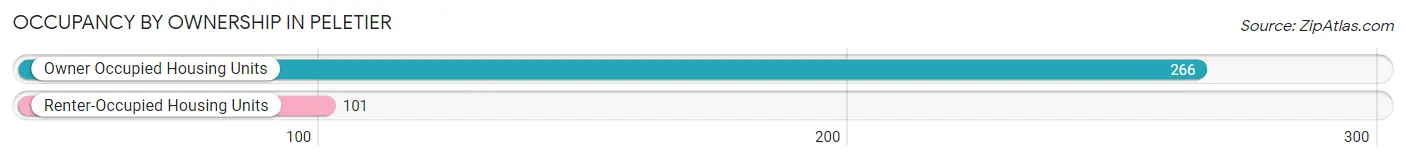
| Occupancy | # Housing Units | % Housing Units |
| Owner Occupied Housing Units | 266 | 72.5% |
| Renter-Occupied Housing Units | 101 | 27.5% |
| Total Occupied Housing Units | 367 | 100.0% |
Occupancy by Household Size in Peletier
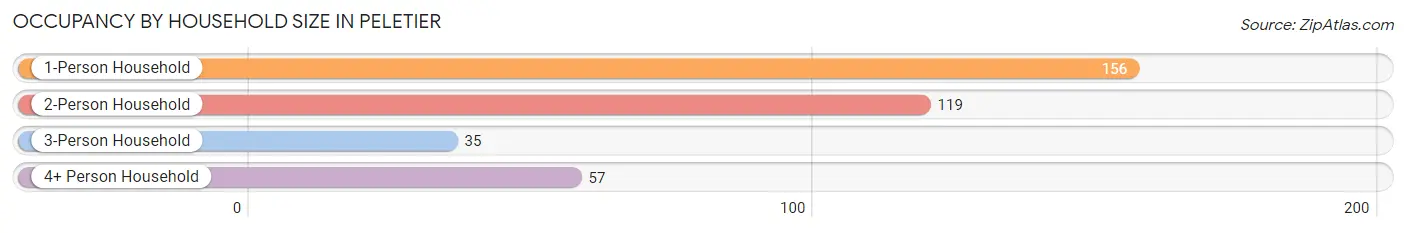
| Household Size | # Housing Units | % Housing Units |
| 1-Person Household | 156 | 42.5% |
| 2-Person Household | 119 | 32.4% |
| 3-Person Household | 35 | 9.5% |
| 4+ Person Household | 57 | 15.5% |
| Total Housing Units | 367 | 100.0% |
Occupancy by Ownership by Household Size in Peletier
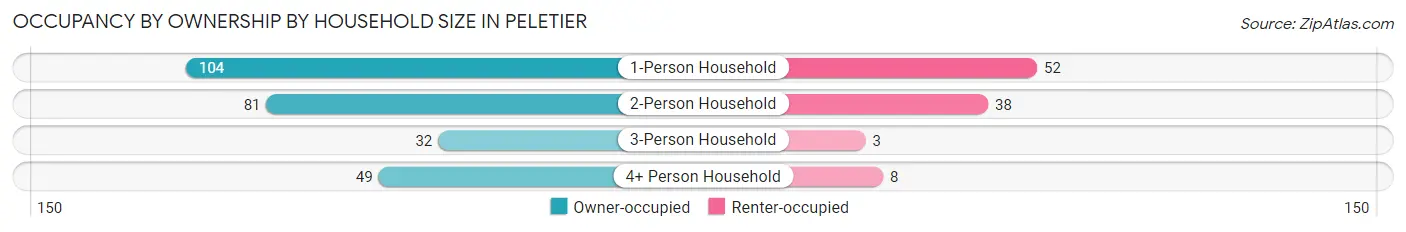
| Household Size | Owner-occupied | Renter-occupied |
| 1-Person Household | 104 (66.7%) | 52 (33.3%) |
| 2-Person Household | 81 (68.1%) | 38 (31.9%) |
| 3-Person Household | 32 (91.4%) | 3 (8.6%) |
| 4+ Person Household | 49 (86.0%) | 8 (14.0%) |
| Total Housing Units | 266 (72.5%) | 101 (27.5%) |
Occupancy by Educational Attainment in Peletier
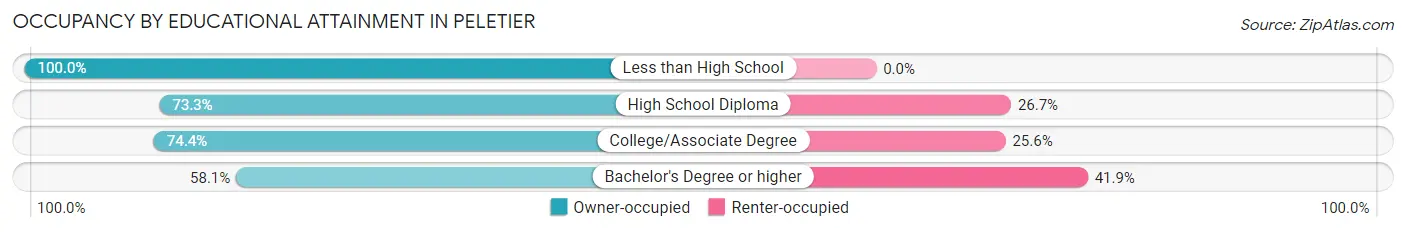
| Household Size | Owner-occupied | Renter-occupied |
| Less than High School | 18 (100.0%) | 0 (0.0%) |
| High School Diploma | 96 (73.3%) | 35 (26.7%) |
| College/Associate Degree | 116 (74.4%) | 40 (25.6%) |
| Bachelor's Degree or higher | 36 (58.1%) | 26 (41.9%) |
Occupancy by Age of Householder in Peletier
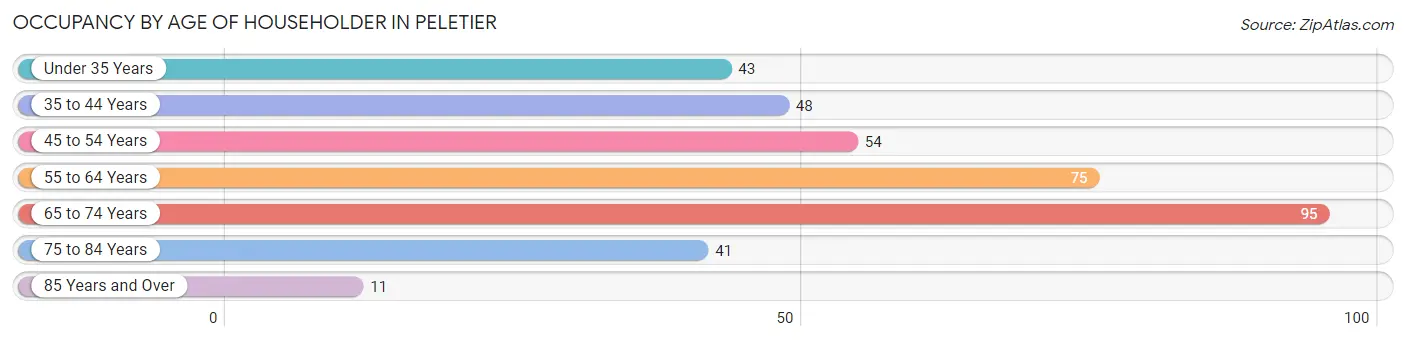
| Age Bracket | # Households | % Households |
| Under 35 Years | 43 | 11.7% |
| 35 to 44 Years | 48 | 13.1% |
| 45 to 54 Years | 54 | 14.7% |
| 55 to 64 Years | 75 | 20.4% |
| 65 to 74 Years | 95 | 25.9% |
| 75 to 84 Years | 41 | 11.2% |
| 85 Years and Over | 11 | 3.0% |
| Total | 367 | 100.0% |
Housing Finances in Peletier
Median Income by Occupancy in Peletier
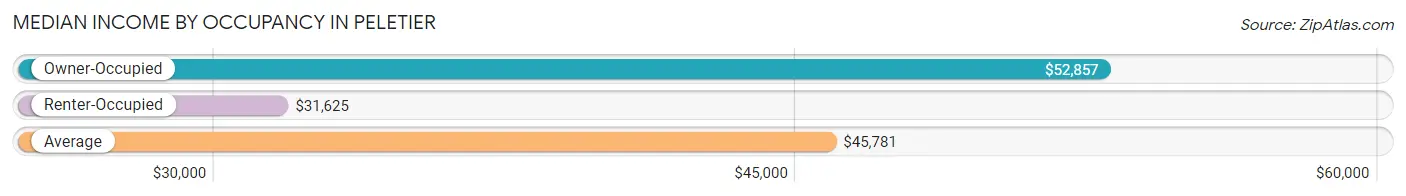
| Occupancy Type | # Households | Median Income |
| Owner-Occupied | 266 (72.5%) | $52,857 |
| Renter-Occupied | 101 (27.5%) | $31,625 |
| Average | 367 (100.0%) | $45,781 |
Occupancy by Householder Income Bracket in Peletier
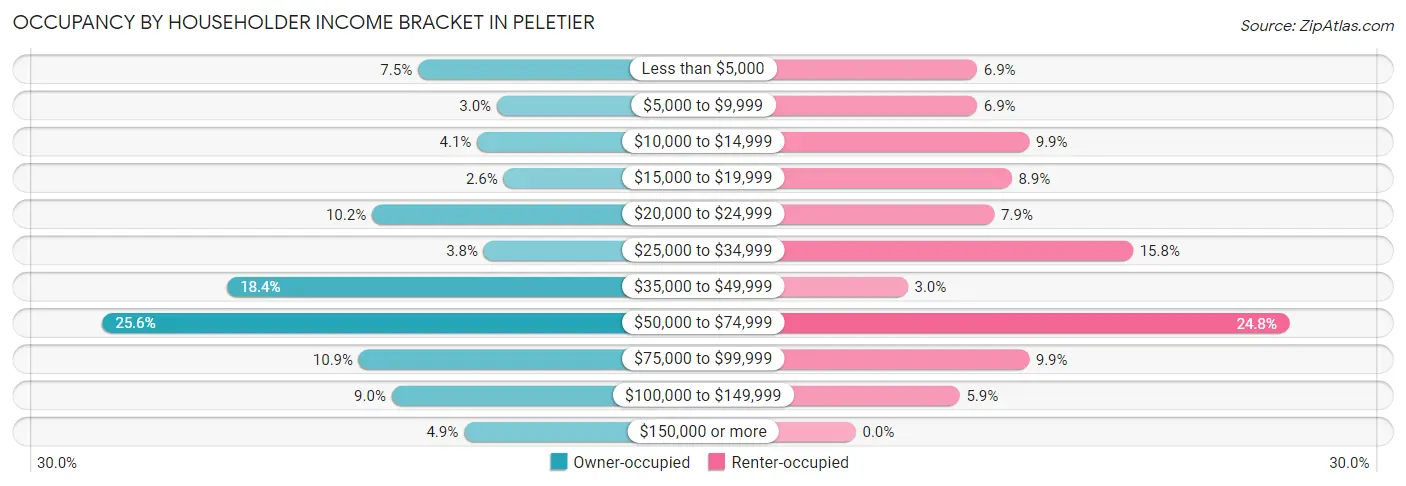
| Income Bracket | Owner-occupied | Renter-occupied |
| Less than $5,000 | 20 (7.5%) | 7 (6.9%) |
| $5,000 to $9,999 | 8 (3.0%) | 7 (6.9%) |
| $10,000 to $14,999 | 11 (4.1%) | 10 (9.9%) |
| $15,000 to $19,999 | 7 (2.6%) | 9 (8.9%) |
| $20,000 to $24,999 | 27 (10.2%) | 8 (7.9%) |
| $25,000 to $34,999 | 10 (3.8%) | 16 (15.8%) |
| $35,000 to $49,999 | 49 (18.4%) | 3 (3.0%) |
| $50,000 to $74,999 | 68 (25.6%) | 25 (24.7%) |
| $75,000 to $99,999 | 29 (10.9%) | 10 (9.9%) |
| $100,000 to $149,999 | 24 (9.0%) | 6 (5.9%) |
| $150,000 or more | 13 (4.9%) | 0 (0.0%) |
| Total | 266 (100.0%) | 101 (100.0%) |
Monthly Housing Cost Tiers in Peletier
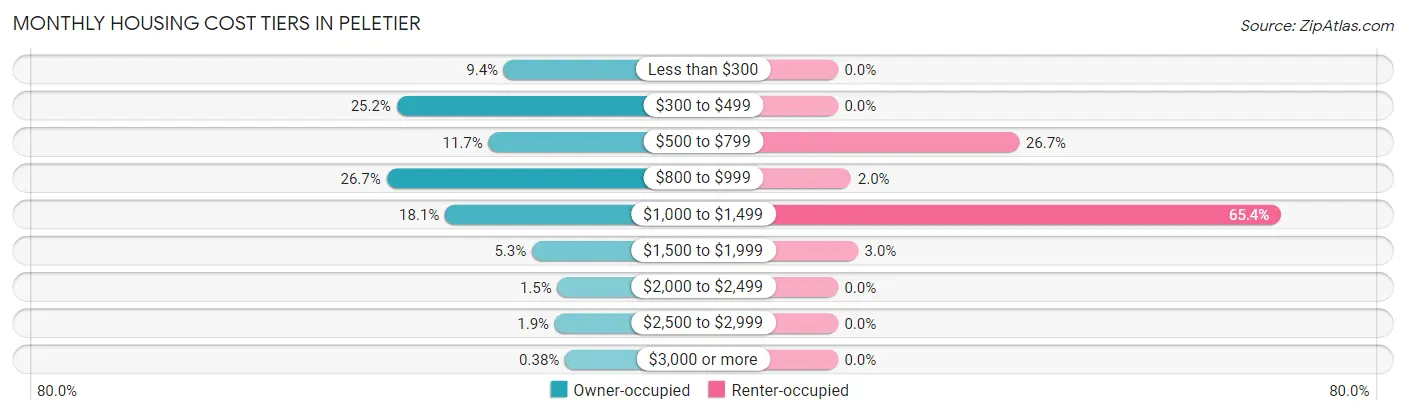
| Monthly Cost | Owner-occupied | Renter-occupied |
| Less than $300 | 25 (9.4%) | 0 (0.0%) |
| $300 to $499 | 67 (25.2%) | 0 (0.0%) |
| $500 to $799 | 31 (11.7%) | 27 (26.7%) |
| $800 to $999 | 71 (26.7%) | 2 (2.0%) |
| $1,000 to $1,499 | 48 (18.0%) | 66 (65.3%) |
| $1,500 to $1,999 | 14 (5.3%) | 3 (3.0%) |
| $2,000 to $2,499 | 4 (1.5%) | 0 (0.0%) |
| $2,500 to $2,999 | 5 (1.9%) | 0 (0.0%) |
| $3,000 or more | 1 (0.4%) | 0 (0.0%) |
| Total | 266 (100.0%) | 101 (100.0%) |
Physical Housing Characteristics in Peletier
Housing Structures in Peletier
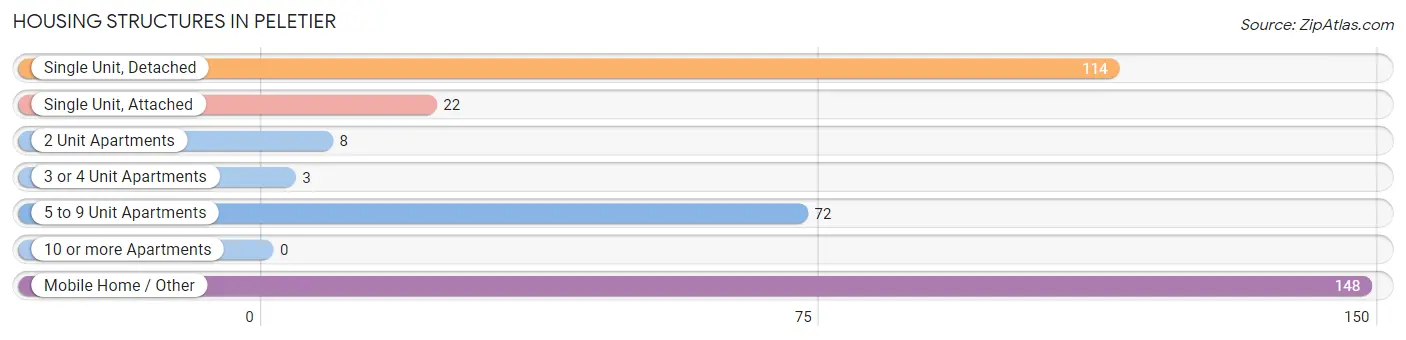
| Structure Type | # Housing Units | % Housing Units |
| Single Unit, Detached | 114 | 31.1% |
| Single Unit, Attached | 22 | 6.0% |
| 2 Unit Apartments | 8 | 2.2% |
| 3 or 4 Unit Apartments | 3 | 0.8% |
| 5 to 9 Unit Apartments | 72 | 19.6% |
| 10 or more Apartments | 0 | 0.0% |
| Mobile Home / Other | 148 | 40.3% |
| Total | 367 | 100.0% |
Housing Structures by Occupancy in Peletier
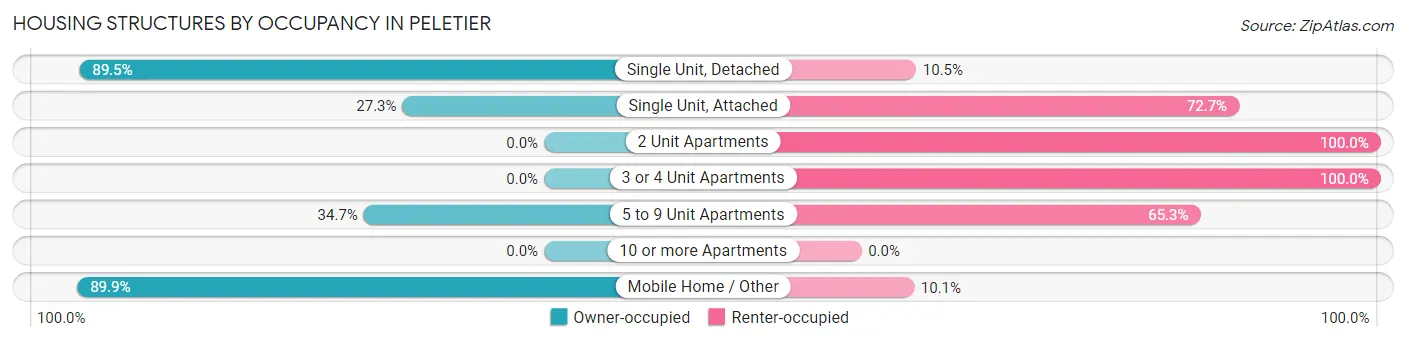
| Structure Type | Owner-occupied | Renter-occupied |
| Single Unit, Detached | 102 (89.5%) | 12 (10.5%) |
| Single Unit, Attached | 6 (27.3%) | 16 (72.7%) |
| 2 Unit Apartments | 0 (0.0%) | 8 (100.0%) |
| 3 or 4 Unit Apartments | 0 (0.0%) | 3 (100.0%) |
| 5 to 9 Unit Apartments | 25 (34.7%) | 47 (65.3%) |
| 10 or more Apartments | 0 (0.0%) | 0 (0.0%) |
| Mobile Home / Other | 133 (89.9%) | 15 (10.1%) |
| Total | 266 (72.5%) | 101 (27.5%) |
Housing Structures by Number of Rooms in Peletier
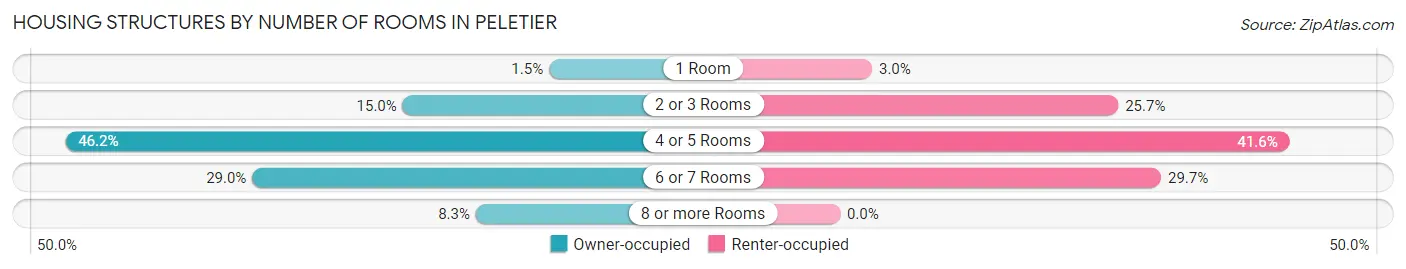
| Number of Rooms | Owner-occupied | Renter-occupied |
| 1 Room | 4 (1.5%) | 3 (3.0%) |
| 2 or 3 Rooms | 40 (15.0%) | 26 (25.7%) |
| 4 or 5 Rooms | 123 (46.2%) | 42 (41.6%) |
| 6 or 7 Rooms | 77 (28.9%) | 30 (29.7%) |
| 8 or more Rooms | 22 (8.3%) | 0 (0.0%) |
| Total | 266 (100.0%) | 101 (100.0%) |
Housing Structure by Heating Type in Peletier
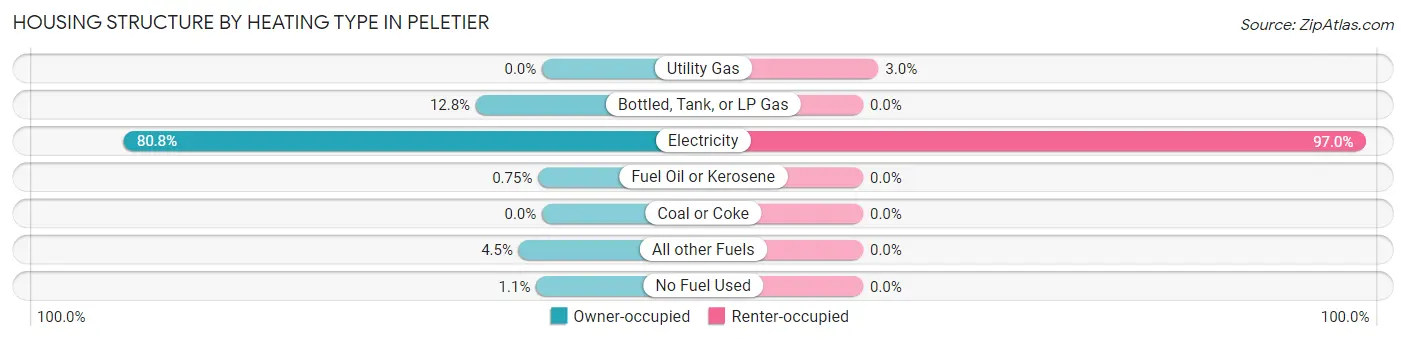
| Heating Type | Owner-occupied | Renter-occupied |
| Utility Gas | 0 (0.0%) | 3 (3.0%) |
| Bottled, Tank, or LP Gas | 34 (12.8%) | 0 (0.0%) |
| Electricity | 215 (80.8%) | 98 (97.0%) |
| Fuel Oil or Kerosene | 2 (0.7%) | 0 (0.0%) |
| Coal or Coke | 0 (0.0%) | 0 (0.0%) |
| All other Fuels | 12 (4.5%) | 0 (0.0%) |
| No Fuel Used | 3 (1.1%) | 0 (0.0%) |
| Total | 266 (100.0%) | 101 (100.0%) |
Household Vehicle Usage in Peletier
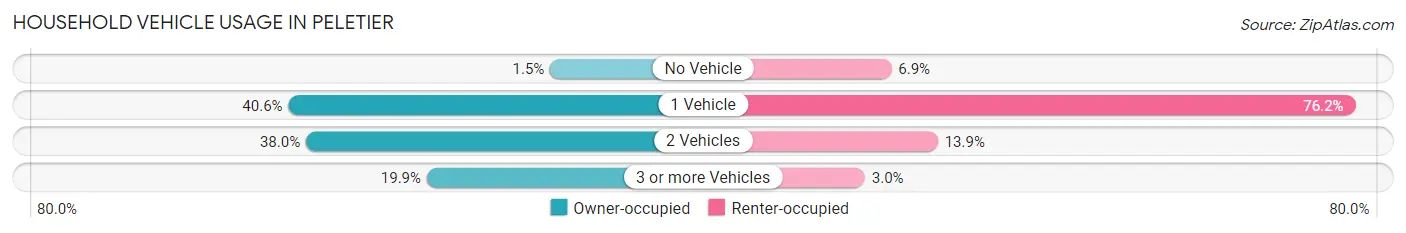
| Vehicles per Household | Owner-occupied | Renter-occupied |
| No Vehicle | 4 (1.5%) | 7 (6.9%) |
| 1 Vehicle | 108 (40.6%) | 77 (76.2%) |
| 2 Vehicles | 101 (38.0%) | 14 (13.9%) |
| 3 or more Vehicles | 53 (19.9%) | 3 (3.0%) |
| Total | 266 (100.0%) | 101 (100.0%) |
Real Estate & Mortgages in Peletier
Real Estate and Mortgage Overview in Peletier
| Characteristic | Without Mortgage | With Mortgage |
| Housing Units | 133 | 133 |
| Median Property Value | $95,000 | $145,500 |
| Median Household Income | $37,396 | $3 |
| Monthly Housing Costs | $386 | $1 |
| Real Estate Taxes | $424 | $0 |
Property Value by Mortgage Status in Peletier
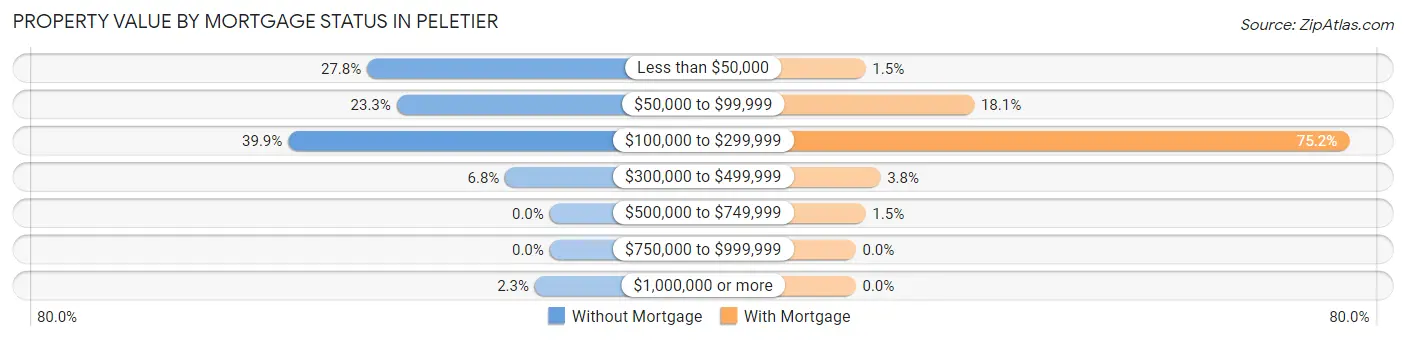
| Property Value | Without Mortgage | With Mortgage |
| Less than $50,000 | 37 (27.8%) | 2 (1.5%) |
| $50,000 to $99,999 | 31 (23.3%) | 24 (18.0%) |
| $100,000 to $299,999 | 53 (39.9%) | 100 (75.2%) |
| $300,000 to $499,999 | 9 (6.8%) | 5 (3.8%) |
| $500,000 to $749,999 | 0 (0.0%) | 2 (1.5%) |
| $750,000 to $999,999 | 0 (0.0%) | 0 (0.0%) |
| $1,000,000 or more | 3 (2.3%) | 0 (0.0%) |
| Total | 133 (100.0%) | 133 (100.0%) |
Household Income by Mortgage Status in Peletier
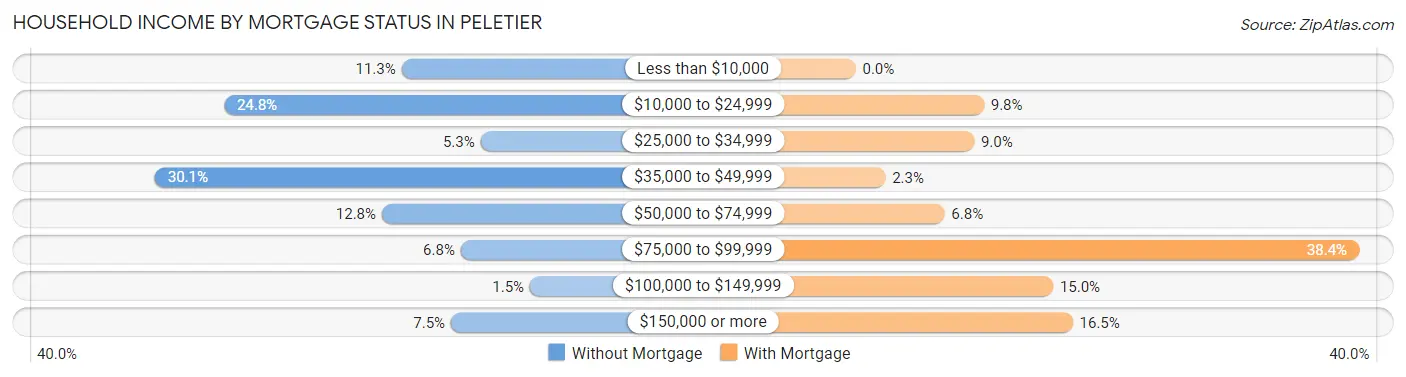
| Household Income | Without Mortgage | With Mortgage |
| Less than $10,000 | 15 (11.3%) | 0 (0.0%) |
| $10,000 to $24,999 | 33 (24.8%) | 13 (9.8%) |
| $25,000 to $34,999 | 7 (5.3%) | 12 (9.0%) |
| $35,000 to $49,999 | 40 (30.1%) | 3 (2.3%) |
| $50,000 to $74,999 | 17 (12.8%) | 9 (6.8%) |
| $75,000 to $99,999 | 9 (6.8%) | 51 (38.4%) |
| $100,000 to $149,999 | 2 (1.5%) | 20 (15.0%) |
| $150,000 or more | 10 (7.5%) | 22 (16.5%) |
| Total | 133 (100.0%) | 133 (100.0%) |
Property Value to Household Income Ratio in Peletier
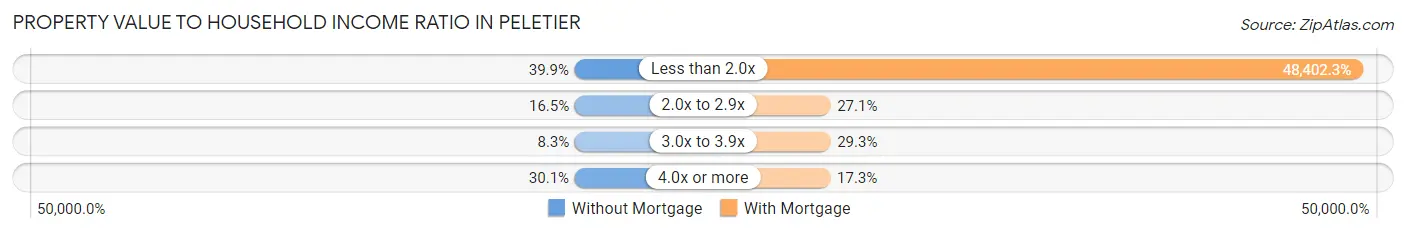
| Value-to-Income Ratio | Without Mortgage | With Mortgage |
| Less than 2.0x | 53 (39.9%) | 64,375 (48,402.3%) |
| 2.0x to 2.9x | 22 (16.5%) | 36 (27.1%) |
| 3.0x to 3.9x | 11 (8.3%) | 39 (29.3%) |
| 4.0x or more | 40 (30.1%) | 23 (17.3%) |
| Total | 133 (100.0%) | 133 (100.0%) |
Real Estate Taxes by Mortgage Status in Peletier
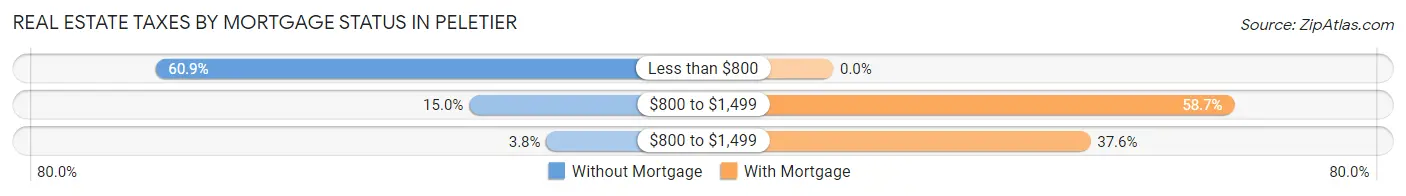
| Property Taxes | Without Mortgage | With Mortgage |
| Less than $800 | 81 (60.9%) | 0 (0.0%) |
| $800 to $1,499 | 20 (15.0%) | 78 (58.7%) |
| $800 to $1,499 | 5 (3.8%) | 50 (37.6%) |
| Total | 133 (100.0%) | 133 (100.0%) |
Health & Disability in Peletier
Health Insurance Coverage by Age in Peletier
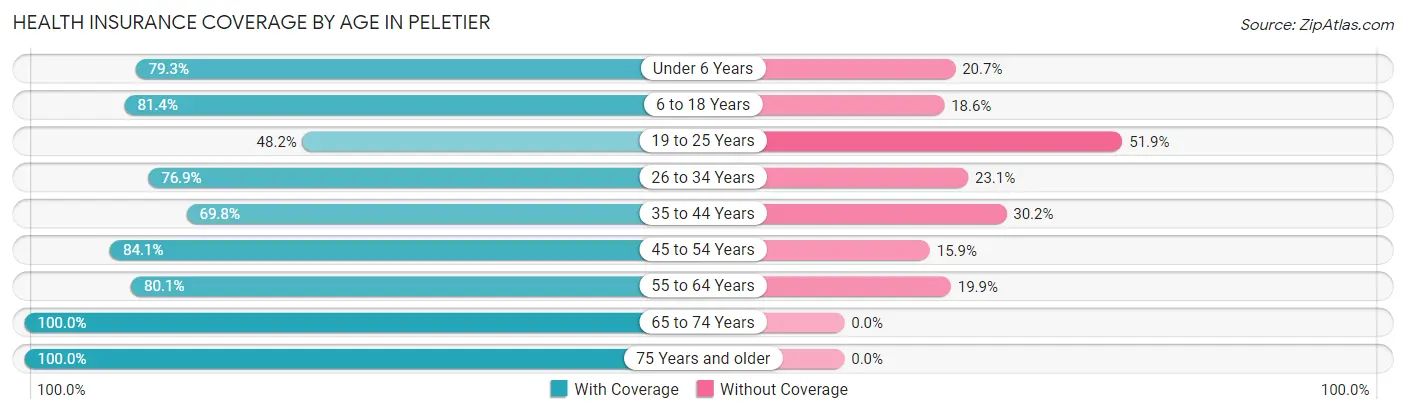
| Age Bracket | With Coverage | Without Coverage |
| Under 6 Years | 23 (79.3%) | 6 (20.7%) |
| 6 to 18 Years | 83 (81.4%) | 19 (18.6%) |
| 19 to 25 Years | 26 (48.1%) | 28 (51.8%) |
| 26 to 34 Years | 60 (76.9%) | 18 (23.1%) |
| 35 to 44 Years | 67 (69.8%) | 29 (30.2%) |
| 45 to 54 Years | 58 (84.1%) | 11 (15.9%) |
| 55 to 64 Years | 113 (80.1%) | 28 (19.9%) |
| 65 to 74 Years | 114 (100.0%) | 0 (0.0%) |
| 75 Years and older | 66 (100.0%) | 0 (0.0%) |
| Total | 610 (81.4%) | 139 (18.6%) |
Health Insurance Coverage by Citizenship Status in Peletier
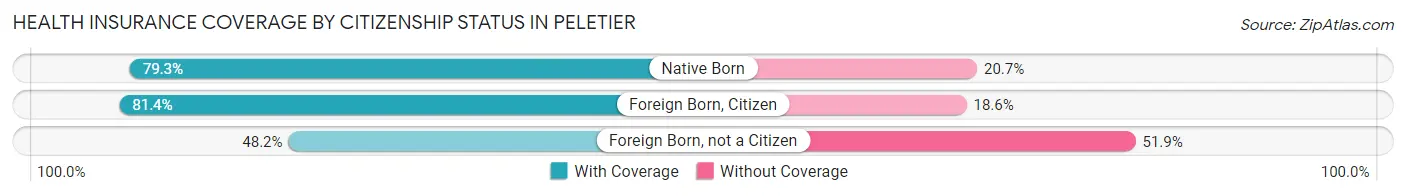
| Citizenship Status | With Coverage | Without Coverage |
| Native Born | 23 (79.3%) | 6 (20.7%) |
| Foreign Born, Citizen | 83 (81.4%) | 19 (18.6%) |
| Foreign Born, not a Citizen | 26 (48.1%) | 28 (51.8%) |
Health Insurance Coverage by Household Income in Peletier
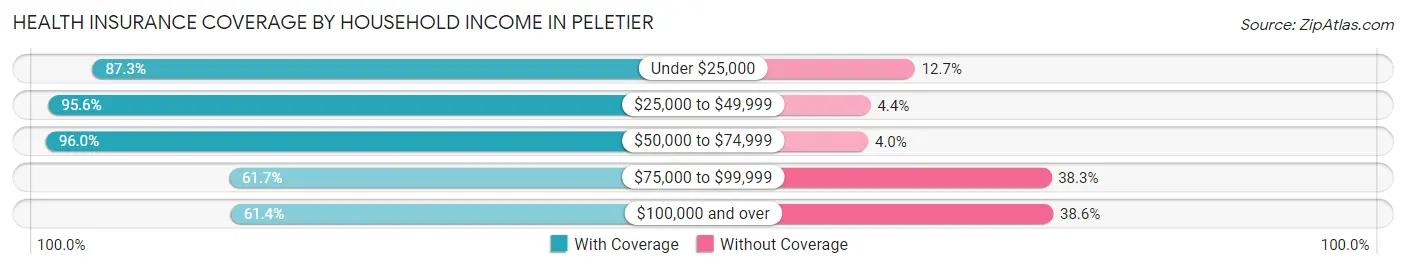
| Household Income | With Coverage | Without Coverage |
| Under $25,000 | 144 (87.3%) | 21 (12.7%) |
| $25,000 to $49,999 | 129 (95.6%) | 6 (4.4%) |
| $50,000 to $74,999 | 169 (96.0%) | 7 (4.0%) |
| $75,000 to $99,999 | 87 (61.7%) | 54 (38.3%) |
| $100,000 and over | 81 (61.4%) | 51 (38.6%) |
Public vs Private Health Insurance Coverage by Age in Peletier
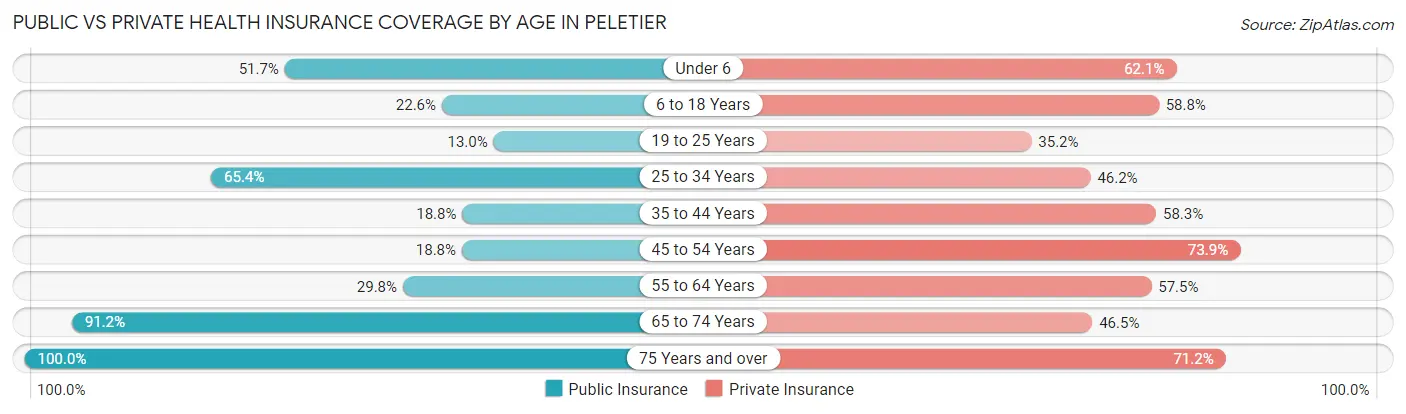
| Age Bracket | Public Insurance | Private Insurance |
| Under 6 | 15 (51.7%) | 18 (62.1%) |
| 6 to 18 Years | 23 (22.6%) | 60 (58.8%) |
| 19 to 25 Years | 7 (13.0%) | 19 (35.2%) |
| 25 to 34 Years | 51 (65.4%) | 36 (46.2%) |
| 35 to 44 Years | 18 (18.8%) | 56 (58.3%) |
| 45 to 54 Years | 13 (18.8%) | 51 (73.9%) |
| 55 to 64 Years | 42 (29.8%) | 81 (57.5%) |
| 65 to 74 Years | 104 (91.2%) | 53 (46.5%) |
| 75 Years and over | 66 (100.0%) | 47 (71.2%) |
| Total | 339 (45.3%) | 421 (56.2%) |
Disability Status by Sex by Age in Peletier
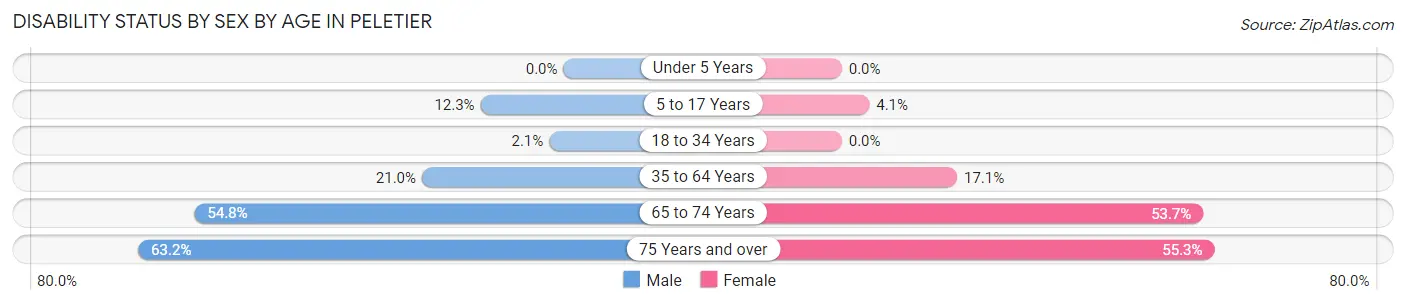
| Age Bracket | Male | Female |
| Under 5 Years | 0 (0.0%) | 0 (0.0%) |
| 5 to 17 Years | 8 (12.3%) | 2 (4.1%) |
| 18 to 34 Years | 2 (2.1%) | 0 (0.0%) |
| 35 to 64 Years | 25 (21.0%) | 32 (17.1%) |
| 65 to 74 Years | 40 (54.8%) | 22 (53.7%) |
| 75 Years and over | 12 (63.2%) | 26 (55.3%) |
Disability Class by Sex by Age in Peletier
Disability Class: Hearing Difficulty
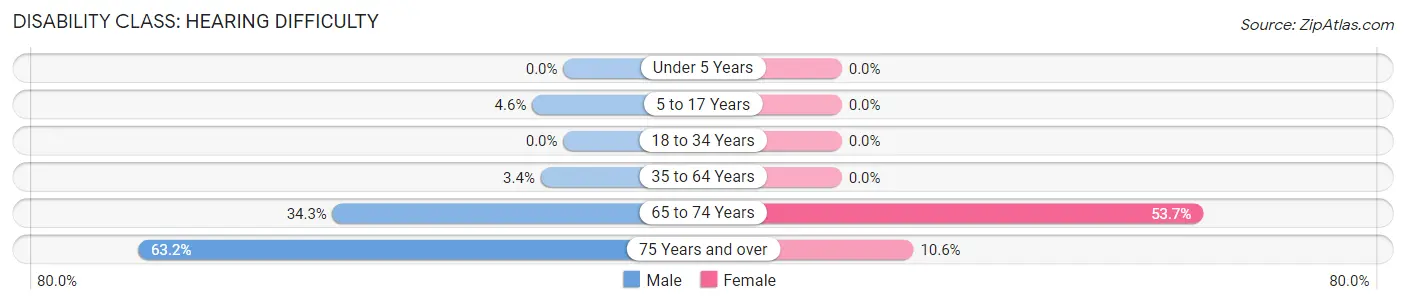
| Age Bracket | Male | Female |
| Under 5 Years | 0 (0.0%) | 0 (0.0%) |
| 5 to 17 Years | 3 (4.6%) | 0 (0.0%) |
| 18 to 34 Years | 0 (0.0%) | 0 (0.0%) |
| 35 to 64 Years | 4 (3.4%) | 0 (0.0%) |
| 65 to 74 Years | 25 (34.3%) | 22 (53.7%) |
| 75 Years and over | 12 (63.2%) | 5 (10.6%) |
Disability Class: Vision Difficulty
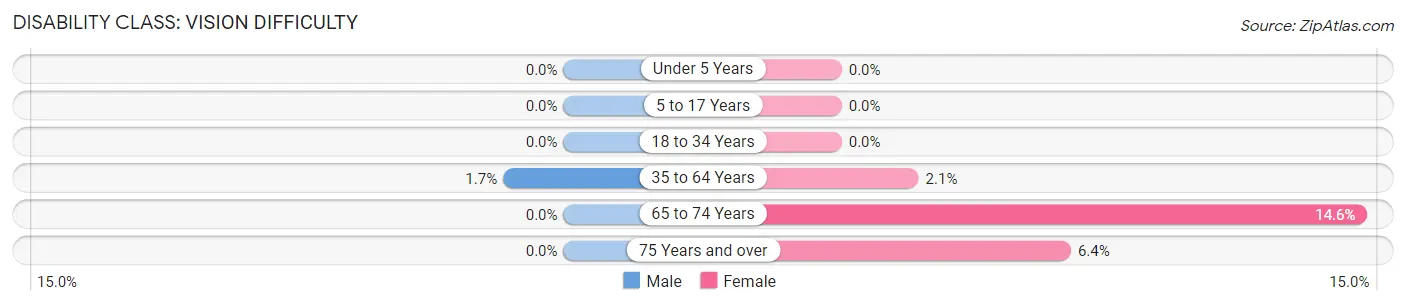
| Age Bracket | Male | Female |
| Under 5 Years | 0 (0.0%) | 0 (0.0%) |
| 5 to 17 Years | 0 (0.0%) | 0 (0.0%) |
| 18 to 34 Years | 0 (0.0%) | 0 (0.0%) |
| 35 to 64 Years | 2 (1.7%) | 4 (2.1%) |
| 65 to 74 Years | 0 (0.0%) | 6 (14.6%) |
| 75 Years and over | 0 (0.0%) | 3 (6.4%) |
Disability Class: Cognitive Difficulty
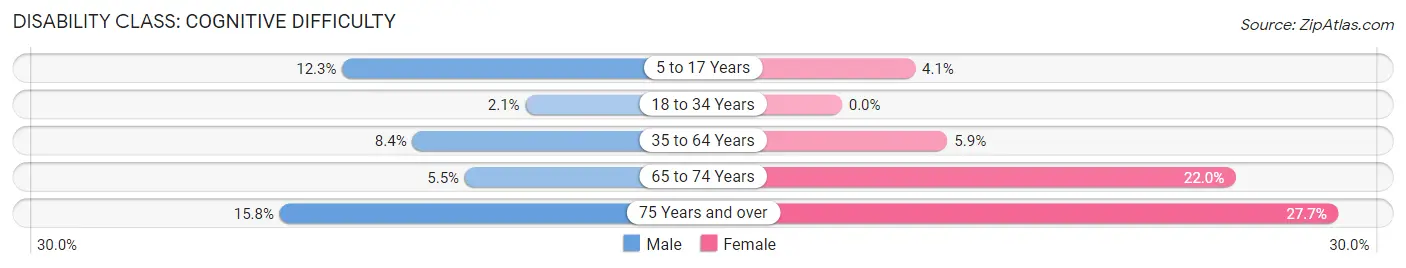
| Age Bracket | Male | Female |
| 5 to 17 Years | 8 (12.3%) | 2 (4.1%) |
| 18 to 34 Years | 2 (2.1%) | 0 (0.0%) |
| 35 to 64 Years | 10 (8.4%) | 11 (5.9%) |
| 65 to 74 Years | 4 (5.5%) | 9 (22.0%) |
| 75 Years and over | 3 (15.8%) | 13 (27.7%) |
Disability Class: Ambulatory Difficulty
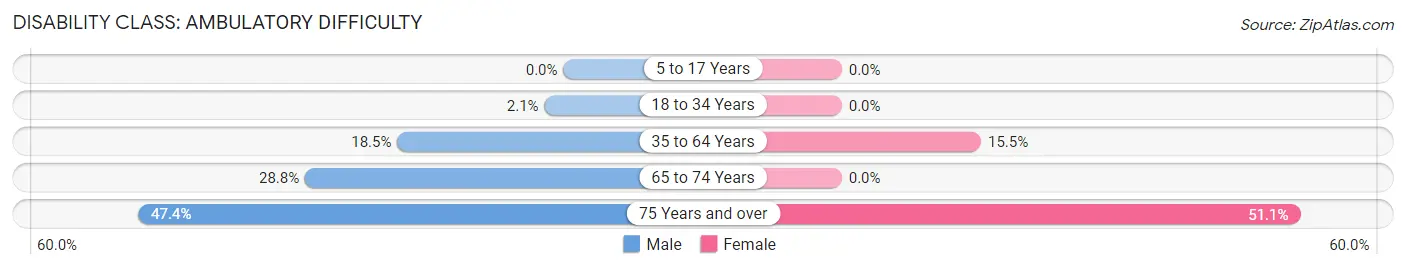
| Age Bracket | Male | Female |
| 5 to 17 Years | 0 (0.0%) | 0 (0.0%) |
| 18 to 34 Years | 2 (2.1%) | 0 (0.0%) |
| 35 to 64 Years | 22 (18.5%) | 29 (15.5%) |
| 65 to 74 Years | 21 (28.8%) | 0 (0.0%) |
| 75 Years and over | 9 (47.4%) | 24 (51.1%) |
Disability Class: Self-Care Difficulty
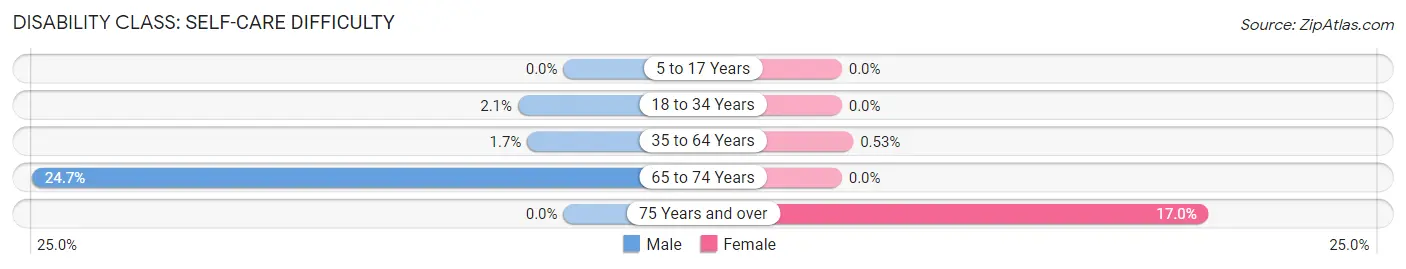
| Age Bracket | Male | Female |
| 5 to 17 Years | 0 (0.0%) | 0 (0.0%) |
| 18 to 34 Years | 2 (2.1%) | 0 (0.0%) |
| 35 to 64 Years | 2 (1.7%) | 1 (0.5%) |
| 65 to 74 Years | 18 (24.7%) | 0 (0.0%) |
| 75 Years and over | 0 (0.0%) | 8 (17.0%) |
Technology Access in Peletier
Computing Device Access in Peletier
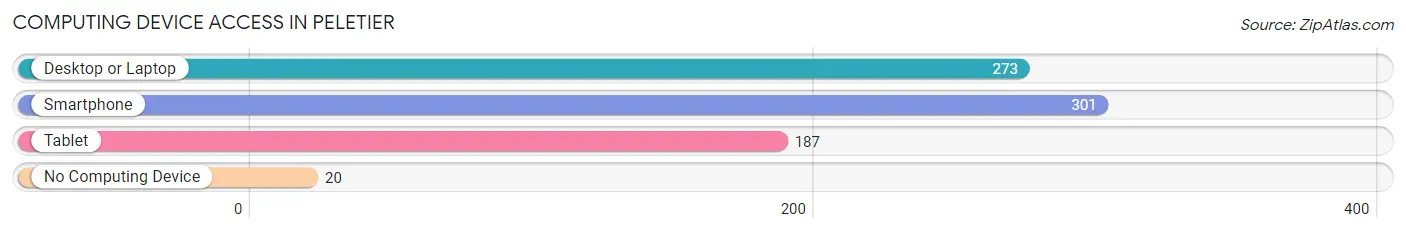
| Device Type | # Households | % Households |
| Desktop or Laptop | 273 | 74.4% |
| Smartphone | 301 | 82.0% |
| Tablet | 187 | 50.9% |
| No Computing Device | 20 | 5.4% |
| Total | 367 | 100.0% |
Internet Access in Peletier
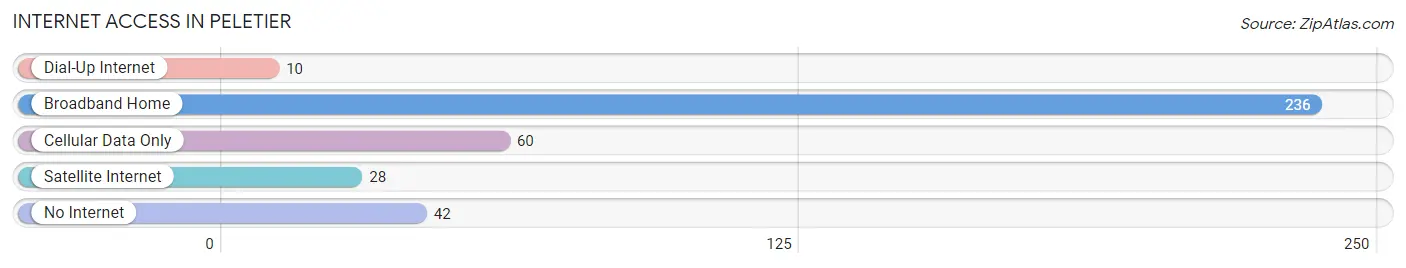
| Internet Type | # Households | % Households |
| Dial-Up Internet | 10 | 2.7% |
| Broadband Home | 236 | 64.3% |
| Cellular Data Only | 60 | 16.4% |
| Satellite Internet | 28 | 7.6% |
| No Internet | 42 | 11.4% |
| Total | 367 | 100.0% |
Peletier Summary
Peletier is a small unincorporated community located in Carteret County, North Carolina. It is situated on the eastern side of the county, just south of the town of Newport. Peletier is a rural community with a population of approximately 1,000 people.
History
Peletier was first settled in the late 1700s by a group of French Huguenots who had fled religious persecution in their native France. The community was named after one of the settlers, Pierre Peletier. The settlers established a small farming community and built a church, which still stands today.
In the early 1900s, Peletier began to grow as a commercial center. The town was home to several stores, a post office, a bank, and a hotel. The town also had a railroad station, which connected it to the larger cities of New Bern and Morehead City.
In the 1950s, Peletier began to decline as a commercial center. Many of the stores and businesses closed, and the railroad station was abandoned. The town has since become a quiet, rural community.
Geography
Peletier is located in the eastern part of Carteret County, just south of the town of Newport. The town is situated on the banks of the Newport River, which flows into the Atlantic Ocean. The town is surrounded by farmland and forests, and is home to several small lakes.
The climate in Peletier is humid subtropical, with hot, humid summers and mild winters. The average annual temperature is around 70 degrees Fahrenheit.
Economy
The economy of Peletier is largely based on agriculture. The town is home to several farms, which produce a variety of crops, including corn, soybeans, and tobacco. The town also has a few small businesses, including a gas station, a convenience store, and a restaurant.
Demographics
As of the 2010 census, the population of Peletier was 1,000. The racial makeup of the town was 97.2% White, 0.7% African American, 0.3% Native American, 0.3% Asian, and 1.5% from other races. The median household income was $35,000, and the median age was 44.
Conclusion
Peletier is a small, rural community located in Carteret County, North Carolina. The town was first settled in the late 1700s by French Huguenots, and has since become a quiet, agricultural community. The economy of Peletier is largely based on agriculture, and the town has a population of approximately 1,000 people.
Common Questions
What is Per Capita Income in Peletier?
Per Capita income in Peletier is $26,714.
What is the Median Family Income in Peletier?
Median Family Income in Peletier is $56,953.
What is the Median Household income in Peletier?
Median Household Income in Peletier is $45,781.
What is Income or Wage Gap in Peletier?
Income or Wage Gap in Peletier is 18.5%.
Women in Peletier earn 81.5 cents for every dollar earned by a man.
What is Inequality or Gini Index in Peletier?
Inequality or Gini Index in Peletier is 0.46.
What is the Total Population of Peletier?
Total Population of Peletier is 749.
What is the Total Male Population of Peletier?
Total Male Population of Peletier is 371.
What is the Total Female Population of Peletier?
Total Female Population of Peletier is 378.
What is the Ratio of Males per 100 Females in Peletier?
There are 98.15 Males per 100 Females in Peletier.
What is the Ratio of Females per 100 Males in Peletier?
There are 101.89 Females per 100 Males in Peletier.
What is the Median Population Age in Peletier?
Median Population Age in Peletier is 46.3 Years.
What is the Average Family Size in Peletier
Average Family Size in Peletier is 2.9 People.
What is the Average Household Size in Peletier
Average Household Size in Peletier is 2.0 People.
How Large is the Labor Force in Peletier?
There are 366 People in the Labor Forcein in Peletier.
What is the Percentage of People in the Labor Force in Peletier?
55.1% of People are in the Labor Force in Peletier.
What is the Unemployment Rate in Peletier?
Unemployment Rate in Peletier is 15.3%.