Shallotte, NC Map & Demographics
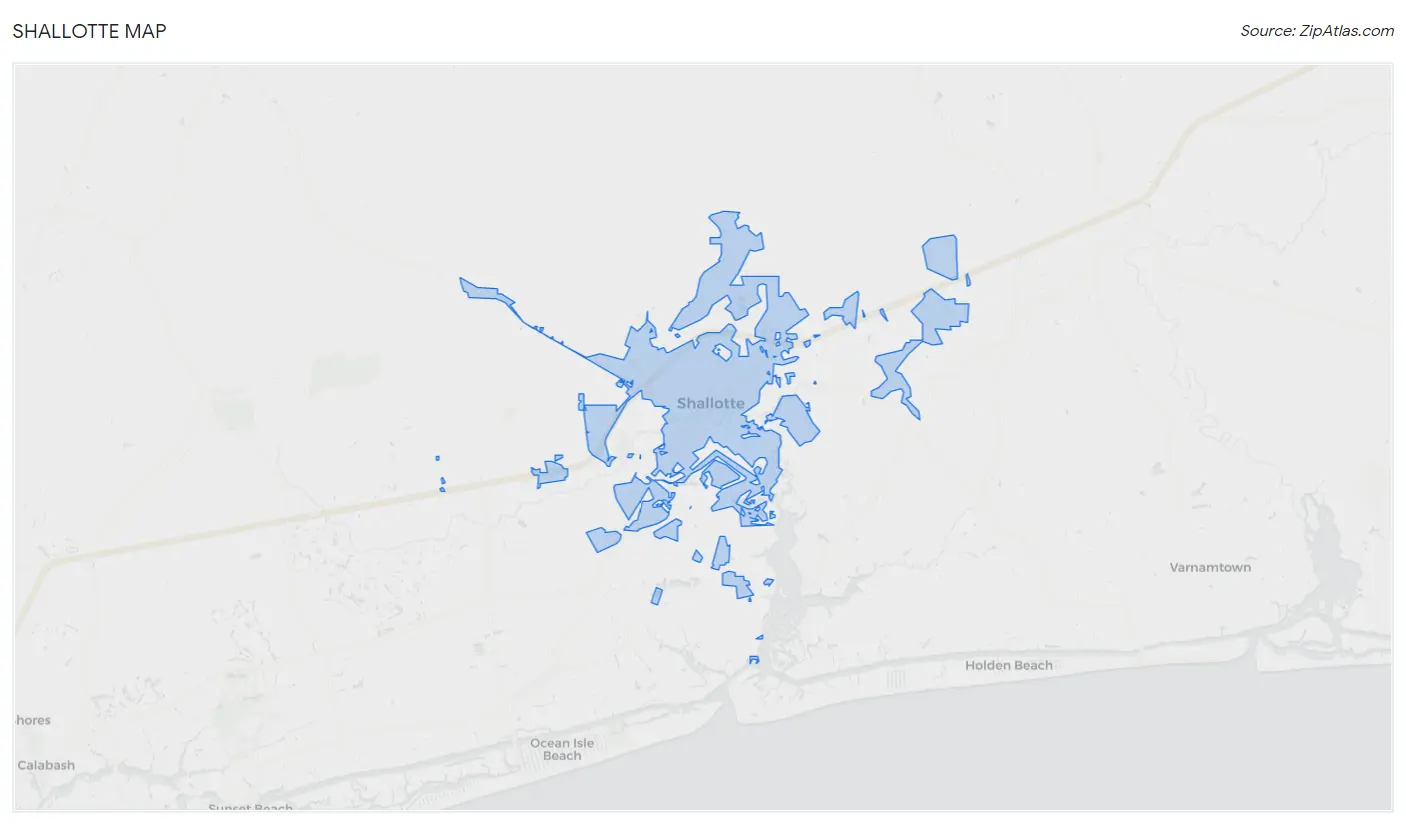
Shallotte Map
Shallotte Overview
$42,745
PER CAPITA INCOME
$85,284
AVG FAMILY INCOME
$71,659
AVG HOUSEHOLD INCOME
9.0%
WAGE / INCOME GAP [ % ]
91.0¢/ $1
WAGE / INCOME GAP [ $ ]
0.48
INEQUALITY / GINI INDEX
4,213
TOTAL POPULATION
1,999
MALE POPULATION
2,214
FEMALE POPULATION
90.29
MALES / 100 FEMALES
110.76
FEMALES / 100 MALES
47.5
MEDIAN AGE
2.6
AVG FAMILY SIZE
2.1
AVG HOUSEHOLD SIZE
2,085
LABOR FORCE [ PEOPLE ]
57.6%
PERCENT IN LABOR FORCE
1.3%
UNEMPLOYMENT RATE
Shallotte Zip Codes
Shallotte Area Codes
Income in Shallotte
Income Overview in Shallotte
Per Capita Income in Shallotte is $42,745, while median incomes of families and households are $85,284 and $71,659 respectively.
| Characteristic | Number | Measure |
| Per Capita Income | 4,213 | $42,745 |
| Median Family Income | 1,290 | $85,284 |
| Mean Family Income | 1,290 | $114,076 |
| Median Household Income | 1,903 | $71,659 |
| Mean Household Income | 1,903 | $93,586 |
| Income Deficit | 1,290 | $0 |
| Wage / Income Gap (%) | 4,213 | 9.03% |
| Wage / Income Gap ($) | 4,213 | 90.97¢ per $1 |
| Gini / Inequality Index | 4,213 | 0.48 |
Earnings by Sex in Shallotte
Average Earnings in Shallotte are $35,815, $36,414 for men and $33,125 for women, a difference of 9.0%.
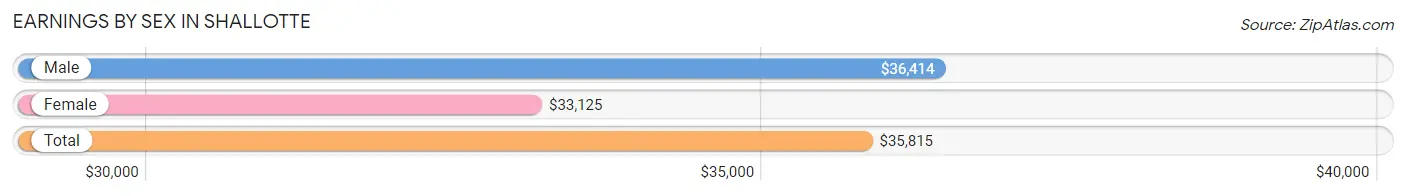
| Sex | Number | Average Earnings |
| Male | 1,040 (48.1%) | $36,414 |
| Female | 1,122 (51.9%) | $33,125 |
| Total | 2,162 (100.0%) | $35,815 |
Earnings by Sex by Income Bracket in Shallotte
The most common earnings brackets in Shallotte are $35,000 to $39,999 for men (227 | 21.8%) and $100,000+ for women (222 | 19.8%).
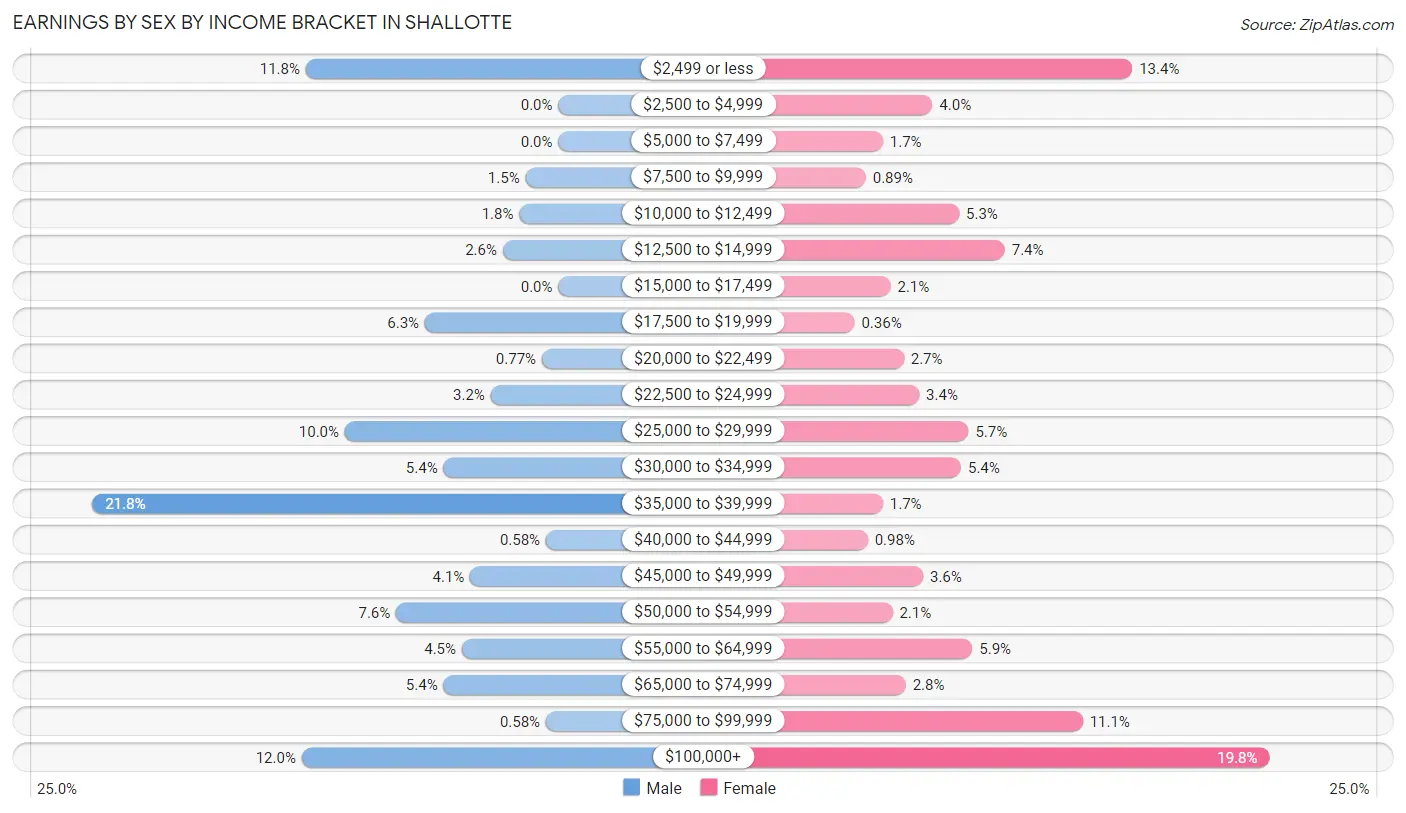
| Income | Male | Female |
| $2,499 or less | 123 (11.8%) | 150 (13.4%) |
| $2,500 to $4,999 | 0 (0.0%) | 45 (4.0%) |
| $5,000 to $7,499 | 0 (0.0%) | 19 (1.7%) |
| $7,500 to $9,999 | 16 (1.5%) | 10 (0.9%) |
| $10,000 to $12,499 | 19 (1.8%) | 59 (5.3%) |
| $12,500 to $14,999 | 27 (2.6%) | 83 (7.4%) |
| $15,000 to $17,499 | 0 (0.0%) | 23 (2.1%) |
| $17,500 to $19,999 | 65 (6.2%) | 4 (0.4%) |
| $20,000 to $22,499 | 8 (0.8%) | 30 (2.7%) |
| $22,500 to $24,999 | 33 (3.2%) | 38 (3.4%) |
| $25,000 to $29,999 | 104 (10.0%) | 64 (5.7%) |
| $30,000 to $34,999 | 56 (5.4%) | 60 (5.3%) |
| $35,000 to $39,999 | 227 (21.8%) | 19 (1.7%) |
| $40,000 to $44,999 | 6 (0.6%) | 11 (1.0%) |
| $45,000 to $49,999 | 43 (4.1%) | 40 (3.6%) |
| $50,000 to $54,999 | 79 (7.6%) | 24 (2.1%) |
| $55,000 to $64,999 | 47 (4.5%) | 66 (5.9%) |
| $65,000 to $74,999 | 56 (5.4%) | 31 (2.8%) |
| $75,000 to $99,999 | 6 (0.6%) | 124 (11.1%) |
| $100,000+ | 125 (12.0%) | 222 (19.8%) |
| Total | 1,040 (100.0%) | 1,122 (100.0%) |
Earnings by Sex by Educational Attainment in Shallotte
Average earnings in Shallotte are $37,049 for men and $47,750 for women, a difference of 22.4%. Men with an educational attainment of bachelor's degree enjoy the highest average annual earnings of $72,629, while those with less than high school education earn the least with $30,625. Women with an educational attainment of graduate degree earn the most with the average annual earnings of $103,110, while those with high school diploma education have the smallest earnings of $22,632.
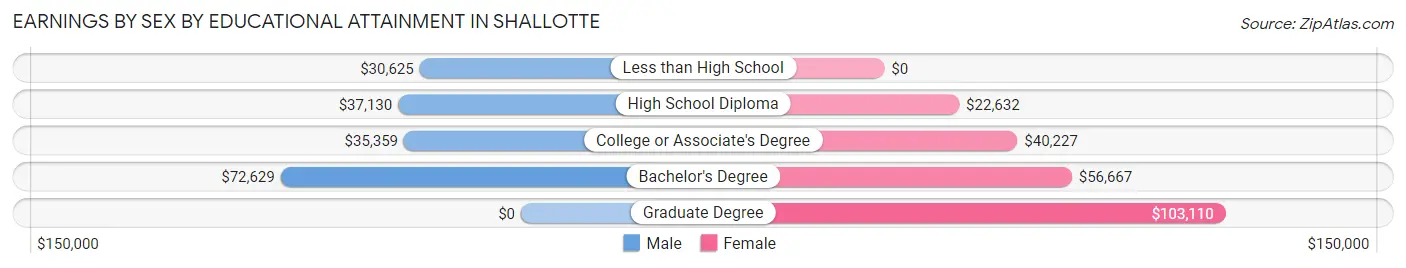
| Educational Attainment | Male Income | Female Income |
| Less than High School | $30,625 | $0 |
| High School Diploma | $37,130 | $22,632 |
| College or Associate's Degree | $35,359 | $40,227 |
| Bachelor's Degree | $72,629 | $56,667 |
| Graduate Degree | - | - |
| Total | $37,049 | $47,750 |
Family Income in Shallotte
Family Income Brackets in Shallotte
According to the Shallotte family income data, there are 332 families falling into the $100,000 to $149,999 income range, which is the most common income bracket and makes up 25.7% of all families.
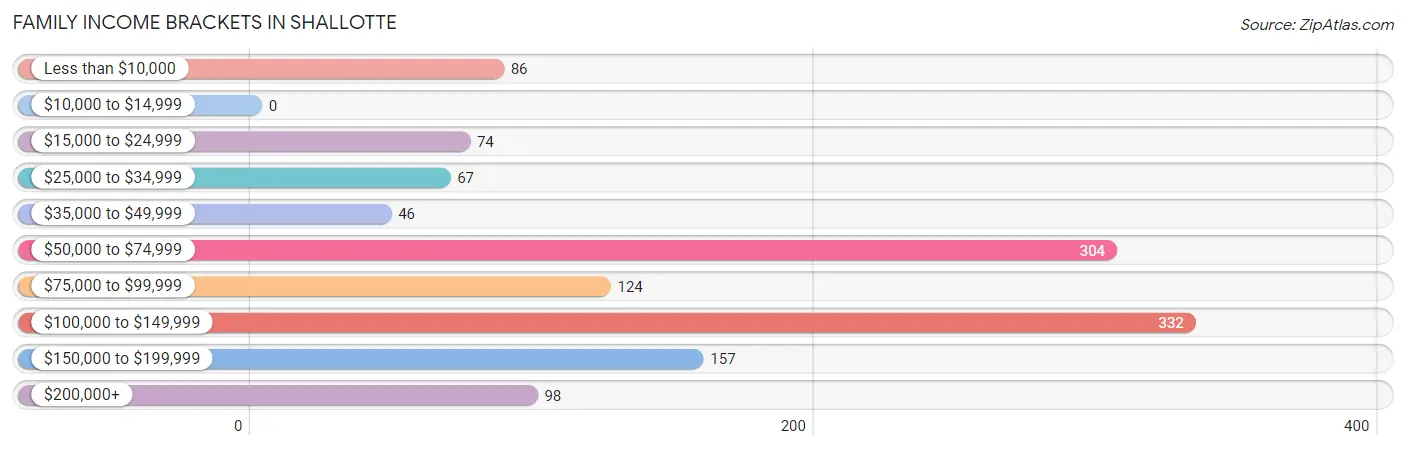
| Income Bracket | # Families | % Families |
| Less than $10,000 | 86 | 6.7% |
| $10,000 to $14,999 | 0 | 0.0% |
| $15,000 to $24,999 | 74 | 5.7% |
| $25,000 to $34,999 | 67 | 5.2% |
| $35,000 to $49,999 | 46 | 3.6% |
| $50,000 to $74,999 | 304 | 23.6% |
| $75,000 to $99,999 | 124 | 9.6% |
| $100,000 to $149,999 | 332 | 25.7% |
| $150,000 to $199,999 | 157 | 12.2% |
| $200,000+ | 98 | 7.6% |
Family Income by Famaliy Size in Shallotte
2-person families (811 | 62.9%) account for the highest median family income in Shallotte with $82,292 per family, while 2-person families (811 | 62.9%) have the highest median income of $41,146 per family member.
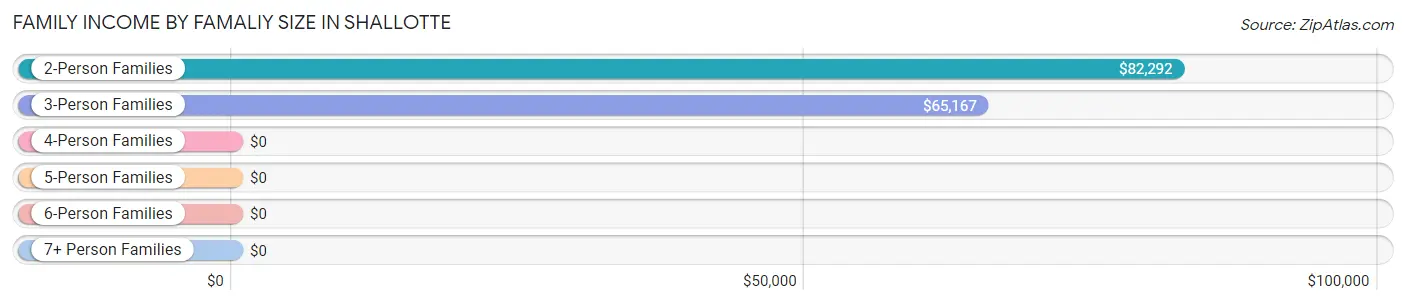
| Income Bracket | # Families | Median Income |
| 2-Person Families | 811 (62.9%) | $82,292 |
| 3-Person Families | 184 (14.3%) | $65,167 |
| 4-Person Families | 219 (17.0%) | $0 |
| 5-Person Families | 51 (4.0%) | $0 |
| 6-Person Families | 25 (1.9%) | $0 |
| 7+ Person Families | 0 (0.0%) | $0 |
| Total | 1,290 (100.0%) | $85,284 |
Family Income by Number of Earners in Shallotte
The median family income in Shallotte is $85,284, with families comprising 2 earners (522) having the highest median family income of $128,266, while families with 1 earner (295) have the lowest median family income of $69,514, accounting for 40.5% and 22.9% of families, respectively.
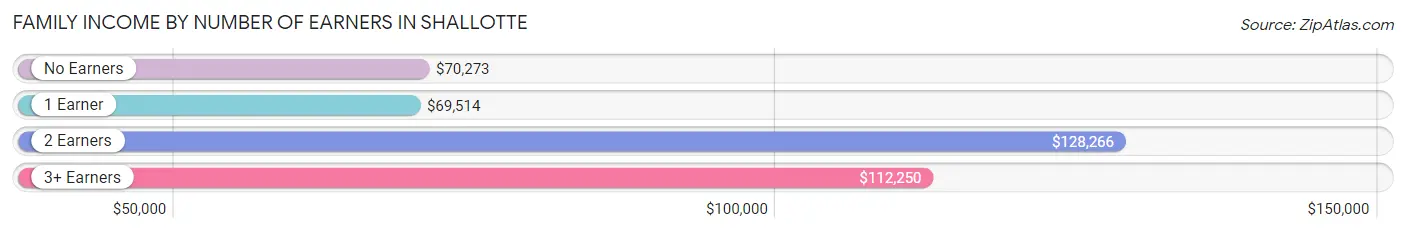
| Number of Earners | # Families | Median Income |
| No Earners | 378 (29.3%) | $70,273 |
| 1 Earner | 295 (22.9%) | $69,514 |
| 2 Earners | 522 (40.5%) | $128,266 |
| 3+ Earners | 95 (7.4%) | $112,250 |
| Total | 1,290 (100.0%) | $85,284 |
Household Income in Shallotte
Household Income Brackets in Shallotte
With 371 households falling in the category, the $50,000 to $74,999 income range is the most frequent in Shallotte, accounting for 19.5% of all households.
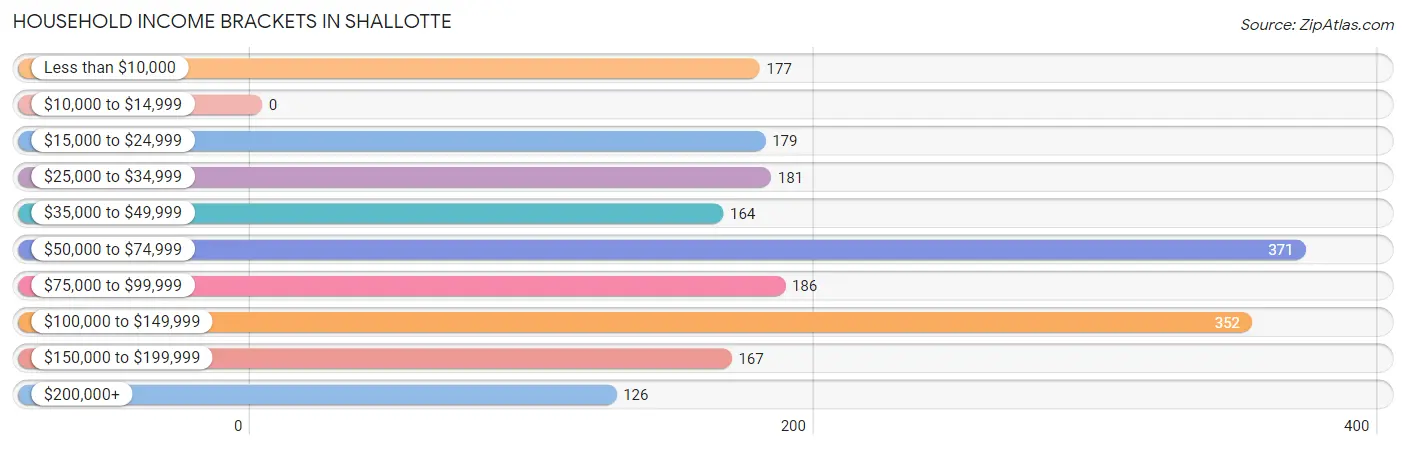
| Income Bracket | # Households | % Households |
| Less than $10,000 | 177 | 9.3% |
| $10,000 to $14,999 | 0 | 0.0% |
| $15,000 to $24,999 | 179 | 9.4% |
| $25,000 to $34,999 | 181 | 9.5% |
| $35,000 to $49,999 | 164 | 8.6% |
| $50,000 to $74,999 | 371 | 19.5% |
| $75,000 to $99,999 | 186 | 9.8% |
| $100,000 to $149,999 | 352 | 18.5% |
| $150,000 to $199,999 | 167 | 8.8% |
| $200,000+ | 126 | 6.6% |
Household Income by Householder Age in Shallotte
The median household income in Shallotte is $71,659, with the highest median household income of $75,673 found in the 45 to 64 years age bracket for the primary householder. A total of 688 households (36.1%) fall into this category. Meanwhile, the 15 to 24 years age bracket for the primary householder has the lowest median household income of $0, with 85 households (4.5%) in this group.
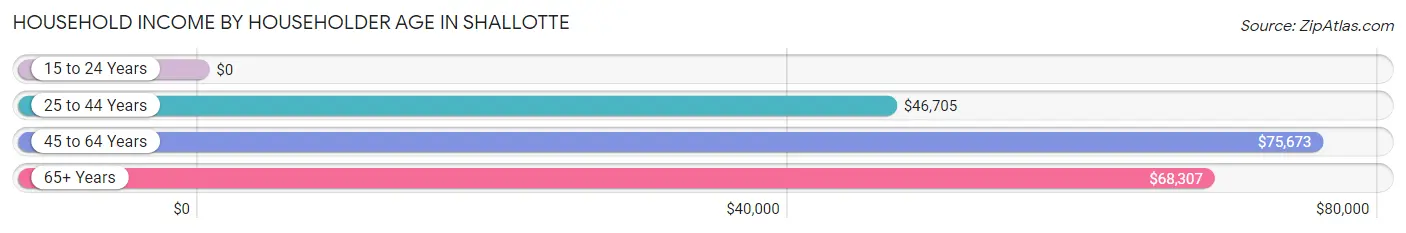
| Income Bracket | # Households | Median Income |
| 15 to 24 Years | 85 (4.5%) | $0 |
| 25 to 44 Years | 537 (28.2%) | $46,705 |
| 45 to 64 Years | 688 (36.1%) | $75,673 |
| 65+ Years | 593 (31.2%) | $68,307 |
| Total | 1,903 (100.0%) | $71,659 |
Poverty in Shallotte
Income Below Poverty by Sex and Age in Shallotte
With 7.1% poverty level for males and 13.4% for females among the residents of Shallotte, 5 year old males and under 5 year old females are the most vulnerable to poverty, with 11 males (52.4%) and 79 females (100.0%) in their respective age groups living below the poverty level.
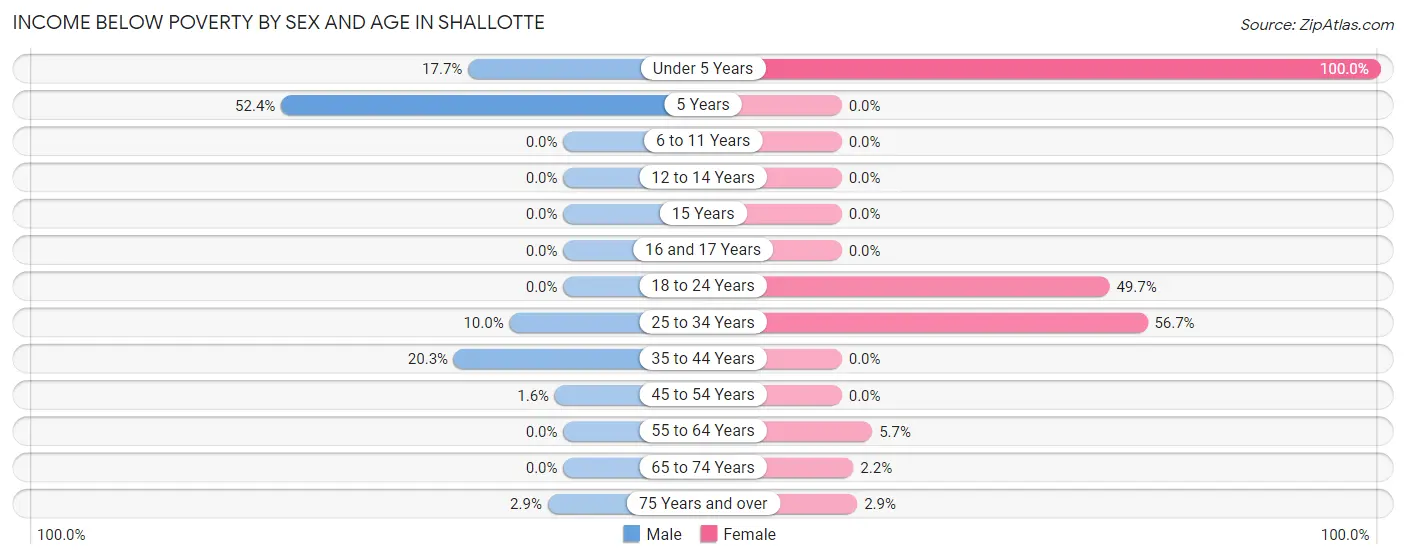
| Age Bracket | Male | Female |
| Under 5 Years | 38 (17.7%) | 79 (100.0%) |
| 5 Years | 11 (52.4%) | 0 (0.0%) |
| 6 to 11 Years | 0 (0.0%) | 0 (0.0%) |
| 12 to 14 Years | 0 (0.0%) | 0 (0.0%) |
| 15 Years | 0 (0.0%) | 0 (0.0%) |
| 16 and 17 Years | 0 (0.0%) | 0 (0.0%) |
| 18 to 24 Years | 0 (0.0%) | 80 (49.7%) |
| 25 to 34 Years | 16 (10.0%) | 97 (56.7%) |
| 35 to 44 Years | 65 (20.3%) | 0 (0.0%) |
| 45 to 54 Years | 3 (1.6%) | 0 (0.0%) |
| 55 to 64 Years | 0 (0.0%) | 20 (5.7%) |
| 65 to 74 Years | 0 (0.0%) | 6 (2.2%) |
| 75 Years and over | 6 (2.9%) | 5 (2.9%) |
| Total | 139 (7.1%) | 287 (13.4%) |
Income Above Poverty by Sex and Age in Shallotte
According to the poverty statistics in Shallotte, males aged 6 to 11 years and females aged 5 years are the age groups that are most secure financially, with 100.0% of males and 100.0% of females in these age groups living above the poverty line.
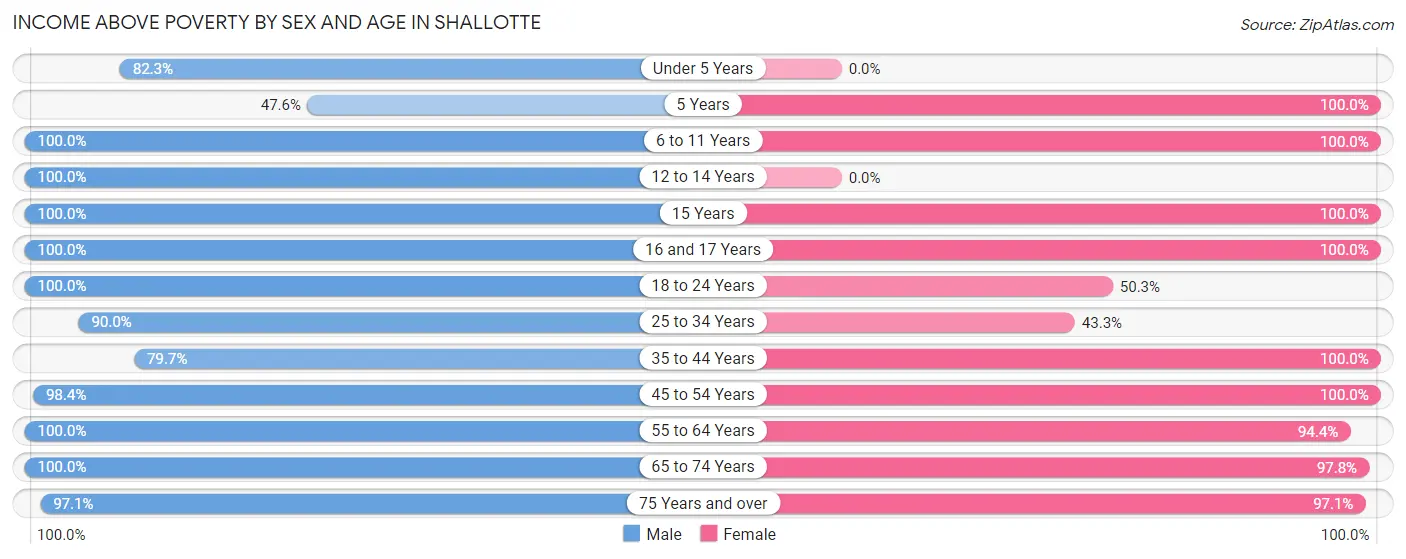
| Age Bracket | Male | Female |
| Under 5 Years | 177 (82.3%) | 0 (0.0%) |
| 5 Years | 10 (47.6%) | 14 (100.0%) |
| 6 to 11 Years | 84 (100.0%) | 91 (100.0%) |
| 12 to 14 Years | 13 (100.0%) | 0 (0.0%) |
| 15 Years | 8 (100.0%) | 68 (100.0%) |
| 16 and 17 Years | 78 (100.0%) | 101 (100.0%) |
| 18 to 24 Years | 72 (100.0%) | 81 (50.3%) |
| 25 to 34 Years | 144 (90.0%) | 74 (43.3%) |
| 35 to 44 Years | 255 (79.7%) | 343 (100.0%) |
| 45 to 54 Years | 189 (98.4%) | 304 (100.0%) |
| 55 to 64 Years | 306 (100.0%) | 334 (94.4%) |
| 65 to 74 Years | 291 (100.0%) | 272 (97.8%) |
| 75 Years and over | 201 (97.1%) | 170 (97.1%) |
| Total | 1,828 (92.9%) | 1,852 (86.6%) |
Income Below Poverty Among Married-Couple Families in Shallotte
The poverty statistics for married-couple families in Shallotte show that 2.1% or 22 of the total 1,033 families live below the poverty line. Families with 1 or 2 children have the highest poverty rate of 6.3%, comprising of 16 families. On the other hand, families with 3 or 4 children have the lowest poverty rate of 0.0%, which includes 0 families.
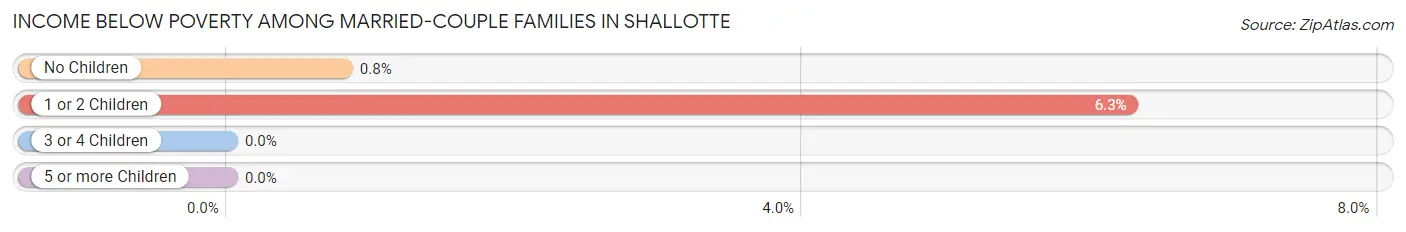
| Children | Above Poverty | Below Poverty |
| No Children | 747 (99.2%) | 6 (0.8%) |
| 1 or 2 Children | 239 (93.7%) | 16 (6.3%) |
| 3 or 4 Children | 25 (100.0%) | 0 (0.0%) |
| 5 or more Children | 0 (0.0%) | 0 (0.0%) |
| Total | 1,011 (97.9%) | 22 (2.1%) |
Income Below Poverty Among Single-Parent Households in Shallotte
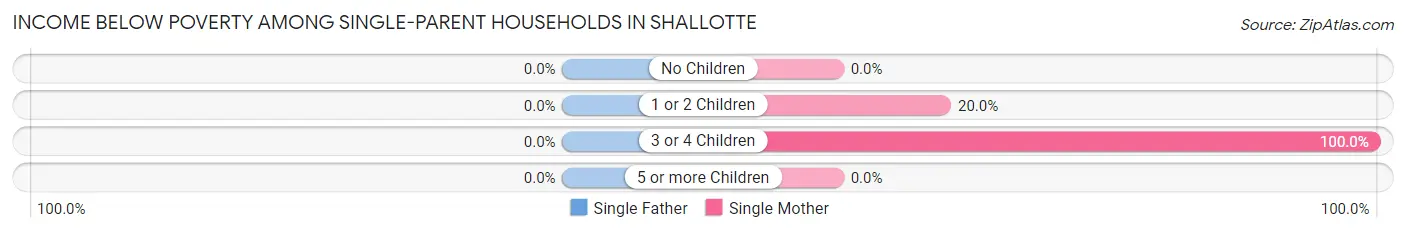
| Children | Single Father | Single Mother |
| No Children | 0 (0.0%) | 0 (0.0%) |
| 1 or 2 Children | 0 (0.0%) | 13 (20.0%) |
| 3 or 4 Children | 0 (0.0%) | 81 (100.0%) |
| 5 or more Children | 0 (0.0%) | 0 (0.0%) |
| Total | 0 (0.0%) | 94 (55.6%) |
Income Below Poverty Among Married-Couple vs Single-Parent Households in Shallotte
The poverty data for Shallotte shows that 22 of the married-couple family households (2.1%) and 94 of the single-parent households (36.6%) are living below the poverty level. Within the married-couple family households, those with 1 or 2 children have the highest poverty rate, with 16 households (6.3%) falling below the poverty line. Among the single-parent households, those with 3 or 4 children have the highest poverty rate, with 81 household (100.0%) living below poverty.
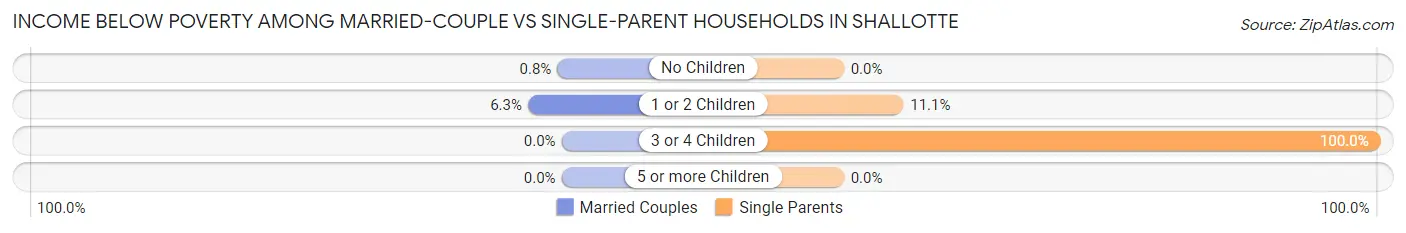
| Children | Married-Couple Families | Single-Parent Households |
| No Children | 6 (0.8%) | 0 (0.0%) |
| 1 or 2 Children | 16 (6.3%) | 13 (11.1%) |
| 3 or 4 Children | 0 (0.0%) | 81 (100.0%) |
| 5 or more Children | 0 (0.0%) | 0 (0.0%) |
| Total | 22 (2.1%) | 94 (36.6%) |
Race in Shallotte
The most populous races in Shallotte are White / Caucasian (2,975 | 70.6%), Black / African American (649 | 15.4%), and Two or more Races (478 | 11.4%).
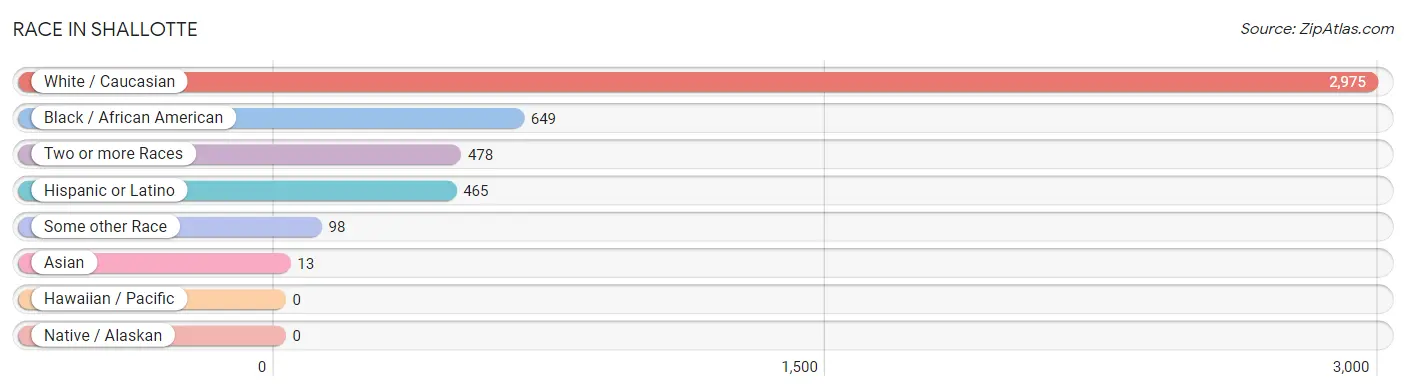
| Race | # Population | % Population |
| Asian | 13 | 0.3% |
| Black / African American | 649 | 15.4% |
| Hawaiian / Pacific | 0 | 0.0% |
| Hispanic or Latino | 465 | 11.0% |
| Native / Alaskan | 0 | 0.0% |
| White / Caucasian | 2,975 | 70.6% |
| Two or more Races | 478 | 11.4% |
| Some other Race | 98 | 2.3% |
| Total | 4,213 | 100.0% |
Ancestry in Shallotte
The most populous ancestries reported in Shallotte are American (580 | 13.8%), German (504 | 12.0%), English (487 | 11.6%), Irish (479 | 11.4%), and Italian (302 | 7.2%), together accounting for 55.8% of all Shallotte residents.
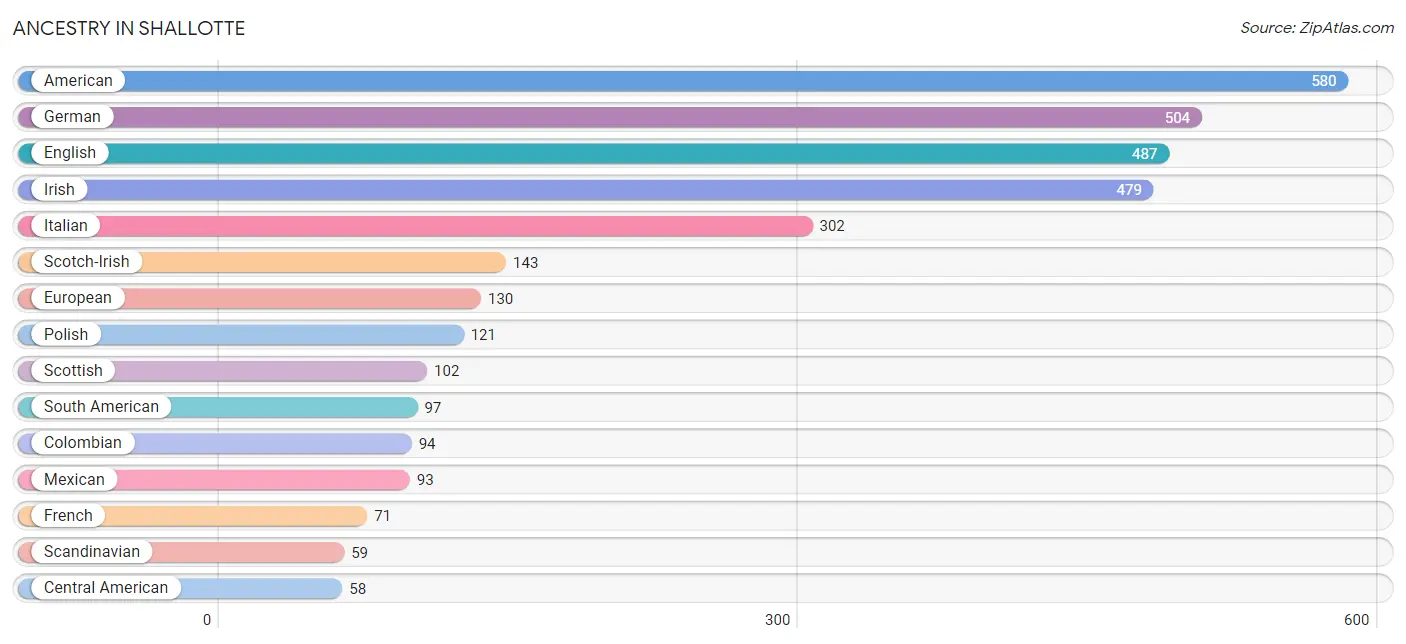
| Ancestry | # Population | % Population |
| American | 580 | 13.8% |
| Arab | 10 | 0.2% |
| Canadian | 19 | 0.4% |
| Central American | 58 | 1.4% |
| Colombian | 94 | 2.2% |
| Cuban | 21 | 0.5% |
| Czech | 6 | 0.1% |
| Danish | 25 | 0.6% |
| Dutch | 51 | 1.2% |
| English | 487 | 11.6% |
| European | 130 | 3.1% |
| French | 71 | 1.7% |
| German | 504 | 12.0% |
| Hungarian | 36 | 0.9% |
| Irish | 479 | 11.4% |
| Italian | 302 | 7.2% |
| Korean | 7 | 0.2% |
| Lebanese | 10 | 0.2% |
| Lithuanian | 8 | 0.2% |
| Malaysian | 16 | 0.4% |
| Maltese | 10 | 0.2% |
| Mexican | 93 | 2.2% |
| Norwegian | 18 | 0.4% |
| Peruvian | 3 | 0.1% |
| Polish | 121 | 2.9% |
| Portuguese | 8 | 0.2% |
| Puerto Rican | 16 | 0.4% |
| Russian | 8 | 0.2% |
| Salvadoran | 58 | 1.4% |
| Scandinavian | 59 | 1.4% |
| Scotch-Irish | 143 | 3.4% |
| Scottish | 102 | 2.4% |
| Slovak | 11 | 0.3% |
| South African | 6 | 0.1% |
| South American | 97 | 2.3% |
| Subsaharan African | 6 | 0.1% |
| Swedish | 18 | 0.4% |
| Swiss | 6 | 0.1% |
| Thai | 11 | 0.3% |
| Welsh | 49 | 1.2% | View All 40 Rows |
Immigrants in Shallotte
The most numerous immigrant groups reported in Shallotte came from Latin America (176 | 4.2%), South America (97 | 2.3%), Colombia (94 | 2.2%), Central America (79 | 1.9%), and El Salvador (58 | 1.4%), together accounting for 12.0% of all Shallotte residents.
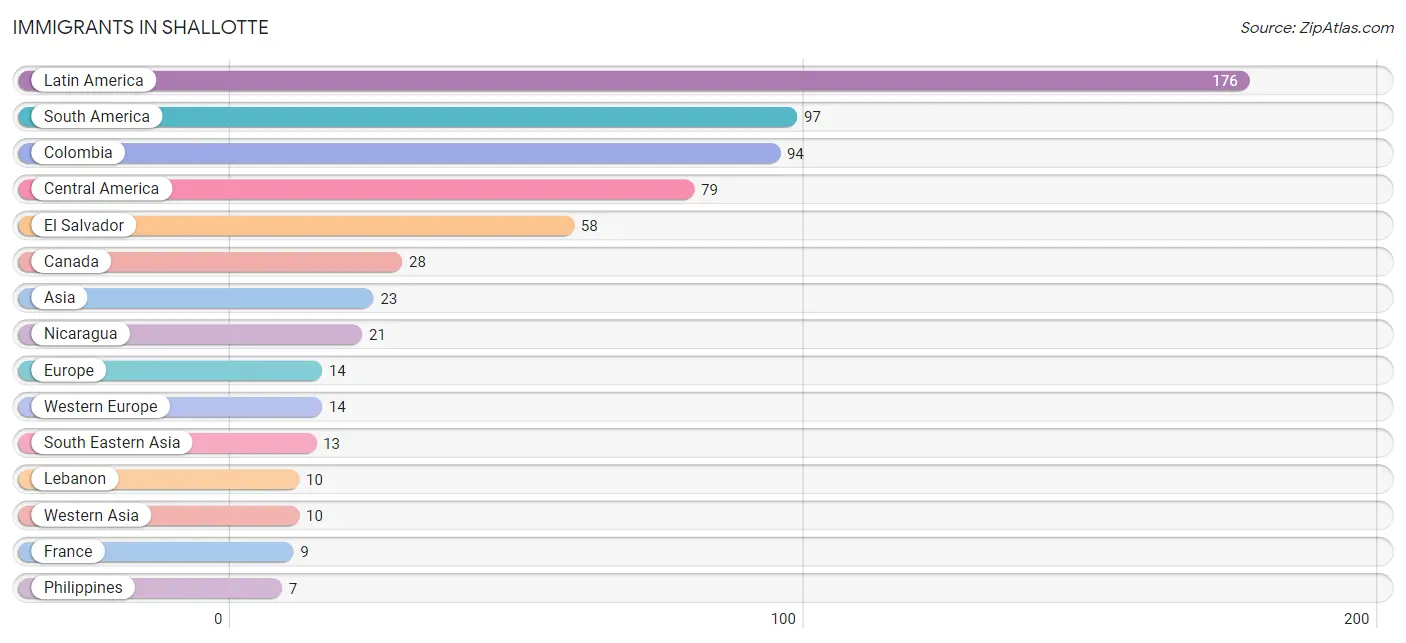
| Immigration Origin | # Population | % Population |
| Asia | 23 | 0.5% |
| Canada | 28 | 0.7% |
| Central America | 79 | 1.9% |
| Colombia | 94 | 2.2% |
| El Salvador | 58 | 1.4% |
| Europe | 14 | 0.3% |
| France | 9 | 0.2% |
| Germany | 5 | 0.1% |
| Latin America | 176 | 4.2% |
| Lebanon | 10 | 0.2% |
| Nicaragua | 21 | 0.5% |
| Peru | 3 | 0.1% |
| Philippines | 7 | 0.2% |
| South America | 97 | 2.3% |
| South Eastern Asia | 13 | 0.3% |
| Thailand | 6 | 0.1% |
| Western Asia | 10 | 0.2% |
| Western Europe | 14 | 0.3% | View All 18 Rows |
Sex and Age in Shallotte
Sex and Age in Shallotte
The most populous age groups in Shallotte are 55 to 59 Years (237 | 11.9%) for men and 40 to 44 Years (249 | 11.3%) for women.
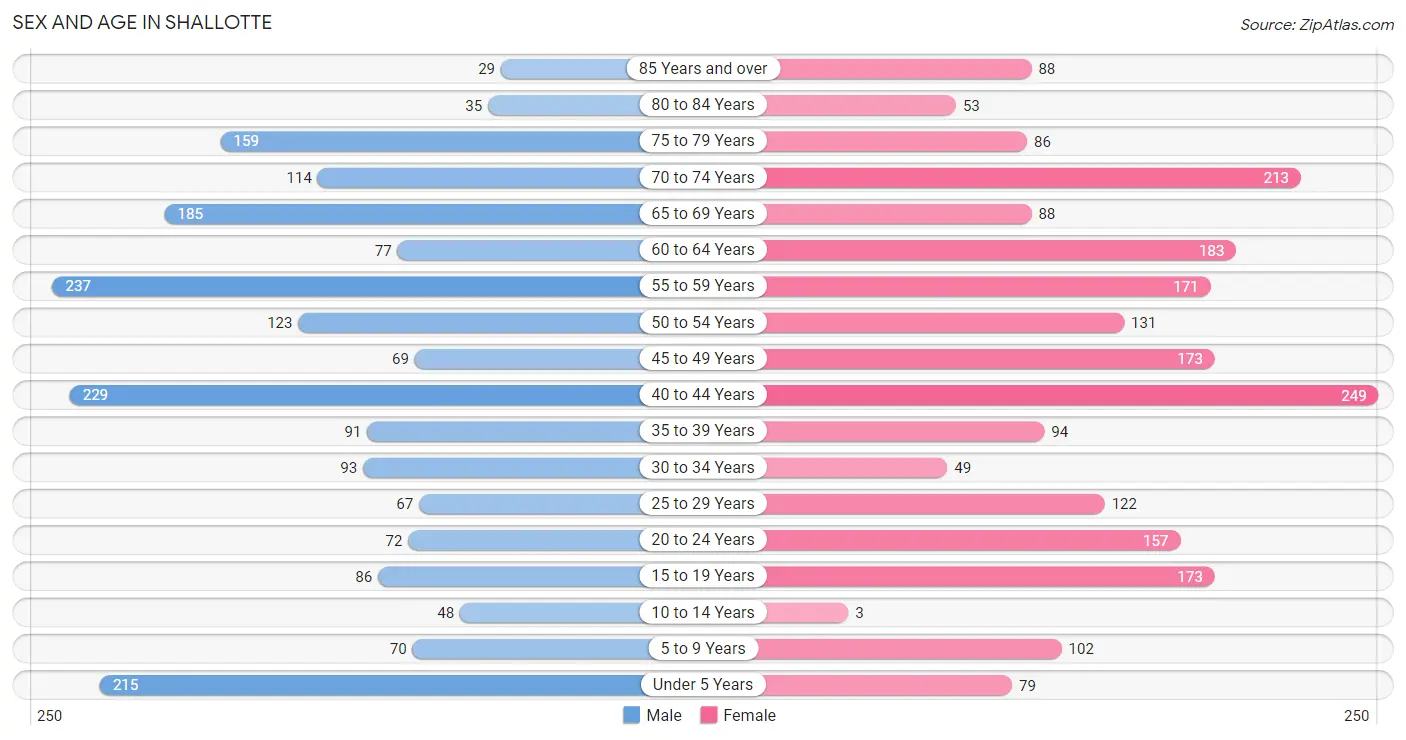
| Age Bracket | Male | Female |
| Under 5 Years | 215 (10.8%) | 79 (3.6%) |
| 5 to 9 Years | 70 (3.5%) | 102 (4.6%) |
| 10 to 14 Years | 48 (2.4%) | 3 (0.1%) |
| 15 to 19 Years | 86 (4.3%) | 173 (7.8%) |
| 20 to 24 Years | 72 (3.6%) | 157 (7.1%) |
| 25 to 29 Years | 67 (3.4%) | 122 (5.5%) |
| 30 to 34 Years | 93 (4.6%) | 49 (2.2%) |
| 35 to 39 Years | 91 (4.5%) | 94 (4.3%) |
| 40 to 44 Years | 229 (11.5%) | 249 (11.3%) |
| 45 to 49 Years | 69 (3.5%) | 173 (7.8%) |
| 50 to 54 Years | 123 (6.1%) | 131 (5.9%) |
| 55 to 59 Years | 237 (11.9%) | 171 (7.7%) |
| 60 to 64 Years | 77 (3.8%) | 183 (8.3%) |
| 65 to 69 Years | 185 (9.2%) | 88 (4.0%) |
| 70 to 74 Years | 114 (5.7%) | 213 (9.6%) |
| 75 to 79 Years | 159 (8.0%) | 86 (3.9%) |
| 80 to 84 Years | 35 (1.8%) | 53 (2.4%) |
| 85 Years and over | 29 (1.5%) | 88 (4.0%) |
| Total | 1,999 (100.0%) | 2,214 (100.0%) |
Families and Households in Shallotte
Median Family Size in Shallotte
The median family size in Shallotte is 2.64 persons per family, with single male/father families (88 | 6.8%) accounting for the largest median family size of 4.89 persons per family. On the other hand, single female/mother families (169 | 13.1%) represent the smallest median family size with 2.22 persons per family.
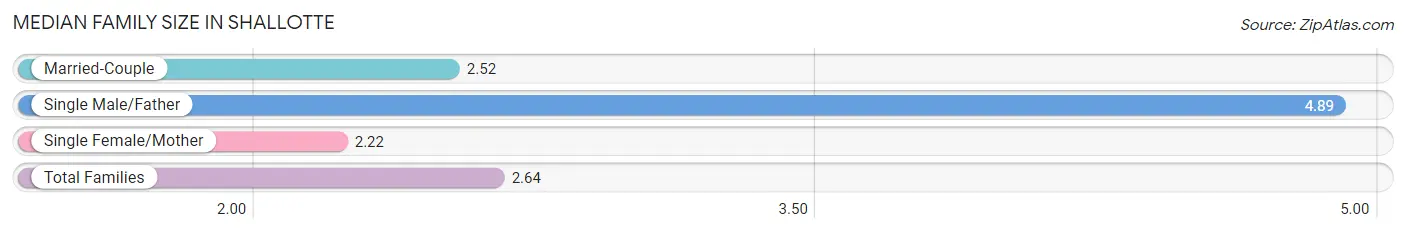
| Family Type | # Families | Family Size |
| Married-Couple | 1,033 (80.1%) | 2.52 |
| Single Male/Father | 88 (6.8%) | 4.89 |
| Single Female/Mother | 169 (13.1%) | 2.22 |
| Total Families | 1,290 (100.0%) | 2.64 |
Median Household Size in Shallotte
The median household size in Shallotte is 2.15 persons per household, with single male/father households (88 | 4.6%) accounting for the largest median household size of 5.65 persons per household. non-family households (613 | 32.2%) represent the smallest median household size with 1.01 persons per household.
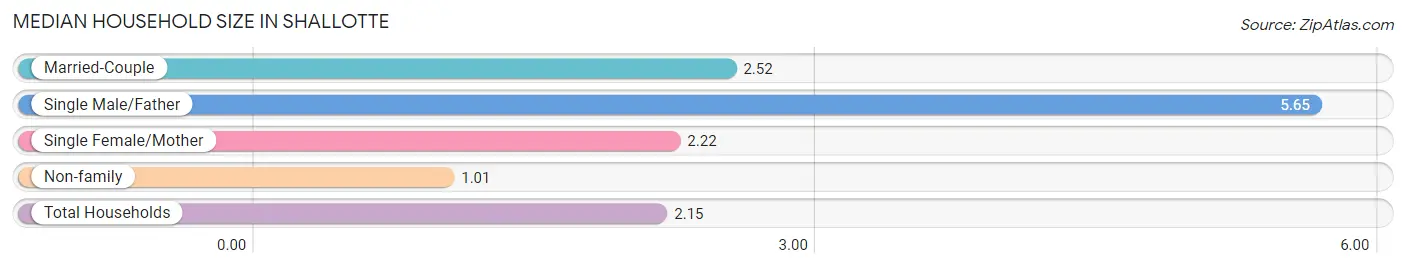
| Household Type | # Households | Household Size |
| Married-Couple | 1,033 (54.3%) | 2.52 |
| Single Male/Father | 88 (4.6%) | 5.65 |
| Single Female/Mother | 169 (8.9%) | 2.22 |
| Non-family | 613 (32.2%) | 1.01 |
| Total Households | 1,903 (100.0%) | 2.15 |
Household Size by Marriage Status in Shallotte
Out of a total of 1,903 households in Shallotte, 1,290 (67.8%) are family households, while 613 (32.2%) are nonfamily households. The most numerous type of family households are 2-person households, comprising 811, and the most common type of nonfamily households are 1-person households, comprising 579.
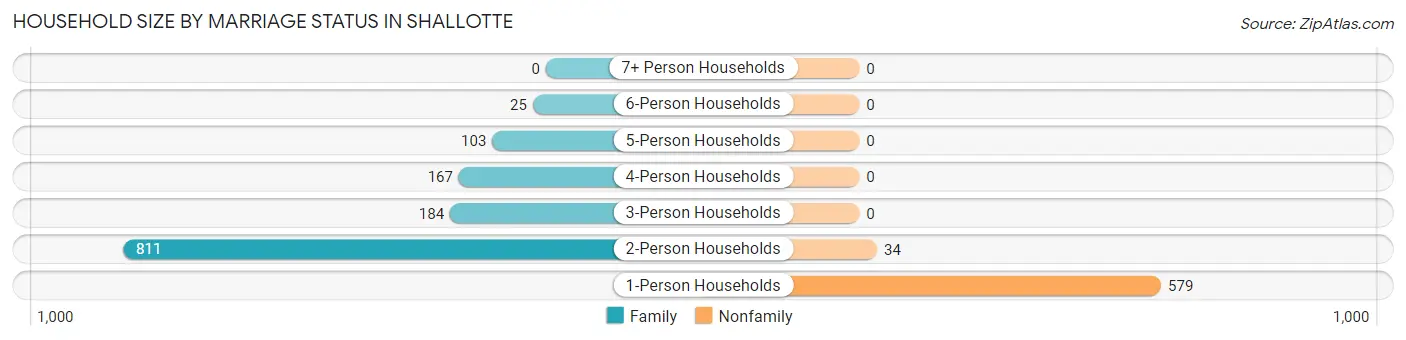
| Household Size | Family Households | Nonfamily Households |
| 1-Person Households | - | 579 (30.4%) |
| 2-Person Households | 811 (42.6%) | 34 (1.8%) |
| 3-Person Households | 184 (9.7%) | 0 (0.0%) |
| 4-Person Households | 167 (8.8%) | 0 (0.0%) |
| 5-Person Households | 103 (5.4%) | 0 (0.0%) |
| 6-Person Households | 25 (1.3%) | 0 (0.0%) |
| 7+ Person Households | 0 (0.0%) | 0 (0.0%) |
| Total | 1,290 (67.8%) | 613 (32.2%) |
Female Fertility in Shallotte
Fertility by Age in Shallotte
Average fertility rate in Shallotte is 112.0 births per 1,000 women. Women in the age bracket of 20 to 34 years have the highest fertility rate with 335.0 births per 1,000 women. Women in the age bracket of 20 to 34 years acount for 96.5% of all women with births.
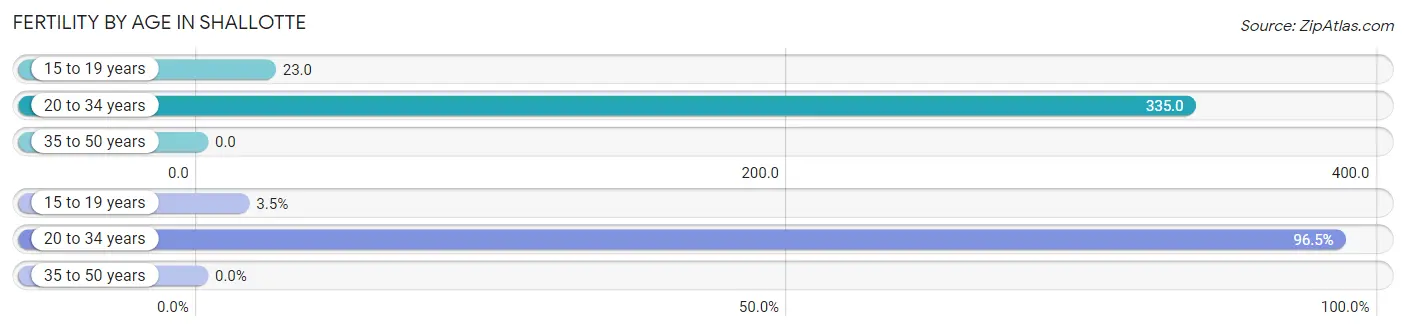
| Age Bracket | Women with Births | Births / 1,000 Women |
| 15 to 19 years | 4 (3.5%) | 23.0 |
| 20 to 34 years | 110 (96.5%) | 335.0 |
| 35 to 50 years | 0 (0.0%) | 0.0 |
| Total | 114 (100.0%) | 112.0 |
Fertility by Age by Marriage Status in Shallotte
14.0% of women with births (114) in Shallotte are married. The highest percentage of unmarried women with births falls into 15 to 19 years age bracket with 100.0% of them unmarried at the time of birth, while the lowest percentage of unmarried women with births belong to 20 to 34 years age bracket with 85.5% of them unmarried.
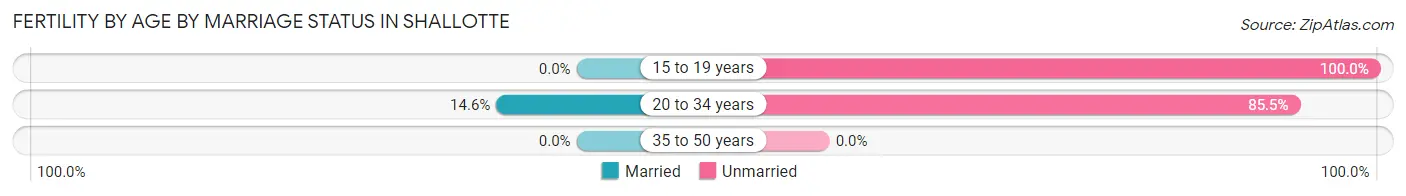
| Age Bracket | Married | Unmarried |
| 15 to 19 years | 0 (0.0%) | 4 (100.0%) |
| 20 to 34 years | 16 (14.5%) | 94 (85.5%) |
| 35 to 50 years | 0 (0.0%) | 0 (0.0%) |
| Total | 16 (14.0%) | 98 (86.0%) |
Fertility by Education in Shallotte
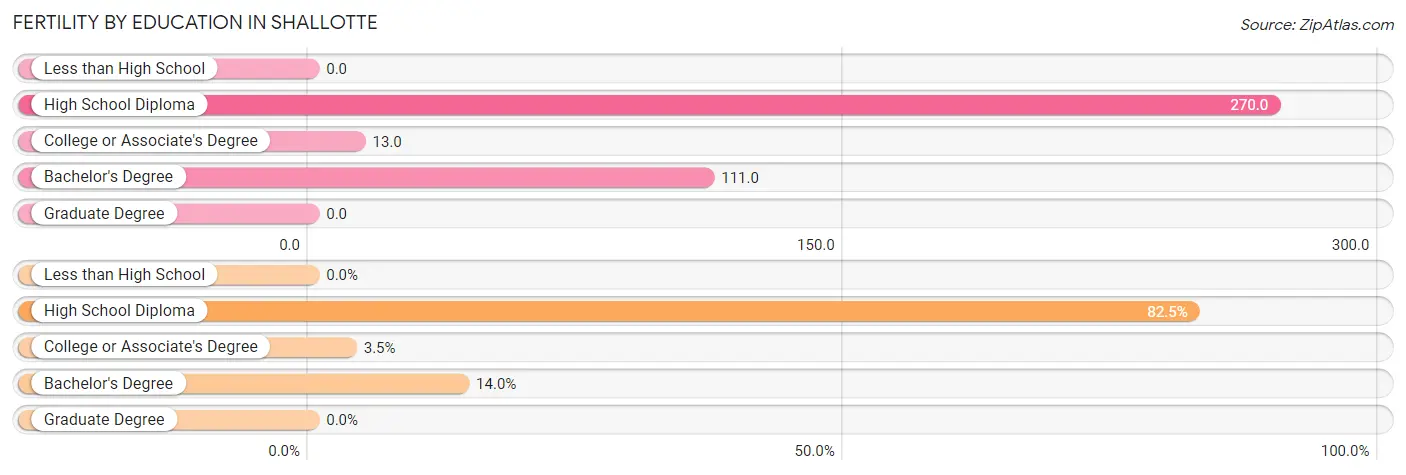
| Educational Attainment | Women with Births | Births / 1,000 Women |
| Less than High School | 0 (0.0%) | 0.0 |
| High School Diploma | 94 (82.5%) | 270.0 |
| College or Associate's Degree | 4 (3.5%) | 13.0 |
| Bachelor's Degree | 16 (14.0%) | 111.0 |
| Graduate Degree | 0 (0.0%) | 0.0 |
| Total | 114 (100.0%) | 112.0 |
Fertility by Education by Marriage Status in Shallotte
86.0% of women with births in Shallotte are unmarried. Women with the educational attainment of bachelor's degree are most likely to be married with 100.0% of them married at childbirth, while women with the educational attainment of high school diploma are least likely to be married with 100.0% of them unmarried at childbirth.
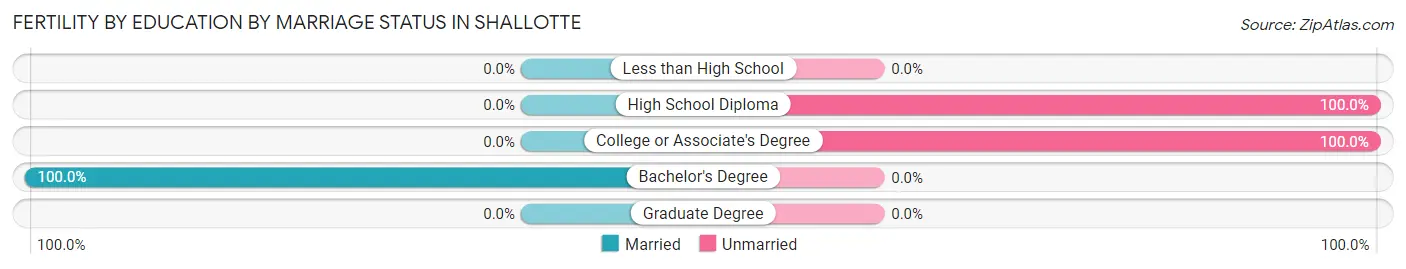
| Educational Attainment | Married | Unmarried |
| Less than High School | 0 (0.0%) | 0 (0.0%) |
| High School Diploma | 0 (0.0%) | 94 (100.0%) |
| College or Associate's Degree | 0 (0.0%) | 4 (100.0%) |
| Bachelor's Degree | 16 (100.0%) | 0 (0.0%) |
| Graduate Degree | 0 (0.0%) | 0 (0.0%) |
| Total | 16 (14.0%) | 98 (86.0%) |
Employment Characteristics in Shallotte
Employment by Class of Employer in Shallotte
Among the 2,026 employed individuals in Shallotte, private company employees (1,293 | 63.8%), local government employees (158 | 7.8%), and self-employed (incorporated) (147 | 7.3%) make up the most common classes of employment.
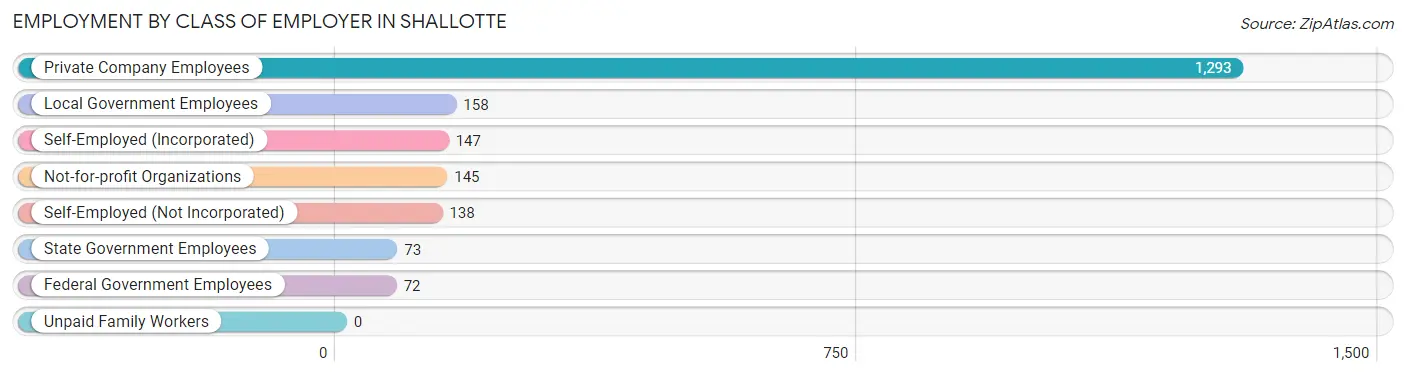
| Employer Class | # Employees | % Employees |
| Private Company Employees | 1,293 | 63.8% |
| Self-Employed (Incorporated) | 147 | 7.3% |
| Self-Employed (Not Incorporated) | 138 | 6.8% |
| Not-for-profit Organizations | 145 | 7.2% |
| Local Government Employees | 158 | 7.8% |
| State Government Employees | 73 | 3.6% |
| Federal Government Employees | 72 | 3.5% |
| Unpaid Family Workers | 0 | 0.0% |
| Total | 2,026 | 100.0% |
Employment Status by Age in Shallotte
According to the labor force statistics for Shallotte, out of the total population over 16 years of age (3,620), 57.6% or 2,085 individuals are in the labor force, with 1.3% or 27 of them unemployed. The age group with the highest labor force participation rate is 35 to 44 years, with 98.6% or 654 individuals in the labor force. Within the labor force, the 25 to 29 years age range has the highest percentage of unemployed individuals, with 20.0% or 22 of them being unemployed.
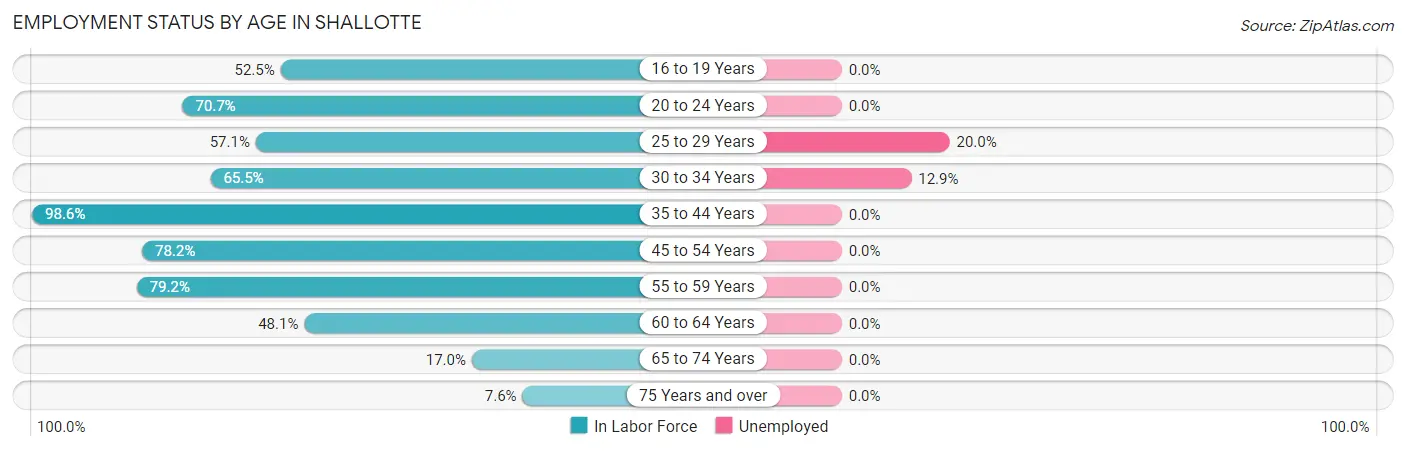
| Age Bracket | In Labor Force | Unemployed |
| 16 to 19 Years | 96 (52.5%) | 0 (0.0%) |
| 20 to 24 Years | 162 (70.7%) | 0 (0.0%) |
| 25 to 29 Years | 108 (57.1%) | 22 (20.0%) |
| 30 to 34 Years | 93 (65.5%) | 12 (12.9%) |
| 35 to 44 Years | 654 (98.6%) | 0 (0.0%) |
| 45 to 54 Years | 388 (78.2%) | 0 (0.0%) |
| 55 to 59 Years | 323 (79.2%) | 0 (0.0%) |
| 60 to 64 Years | 125 (48.1%) | 0 (0.0%) |
| 65 to 74 Years | 102 (17.0%) | 0 (0.0%) |
| 75 Years and over | 34 (7.6%) | 0 (0.0%) |
| Total | 2,085 (57.6%) | 27 (1.3%) |
Employment Status by Educational Attainment in Shallotte
According to labor force statistics for Shallotte, 78.4% of individuals (1,692) out of the total population between 25 and 64 years of age (2,158) are in the labor force, with 1.6% or 27 of them being unemployed. The group with the highest labor force participation rate are those with the educational attainment of bachelor's degree or higher, with 87.0% or 435 individuals in the labor force. Within the labor force, individuals with bachelor's degree or higher education have the highest percentage of unemployment, with 3.4% or 15 of them being unemployed.
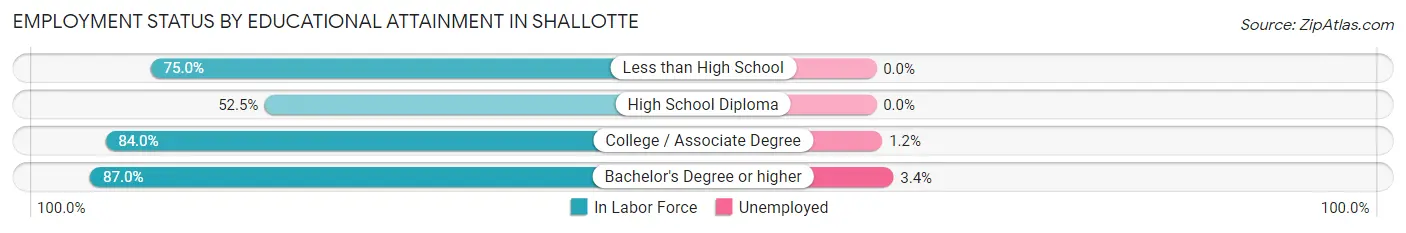
| Educational Attainment | In Labor Force | Unemployed |
| Less than High School | 27 (75.0%) | 0 (0.0%) |
| High School Diploma | 223 (52.5%) | 0 (0.0%) |
| College / Associate Degree | 1,005 (84.0%) | 14 (1.2%) |
| Bachelor's Degree or higher | 435 (87.0%) | 17 (3.4%) |
| Total | 1,692 (78.4%) | 35 (1.6%) |
Employment Occupations by Sex in Shallotte
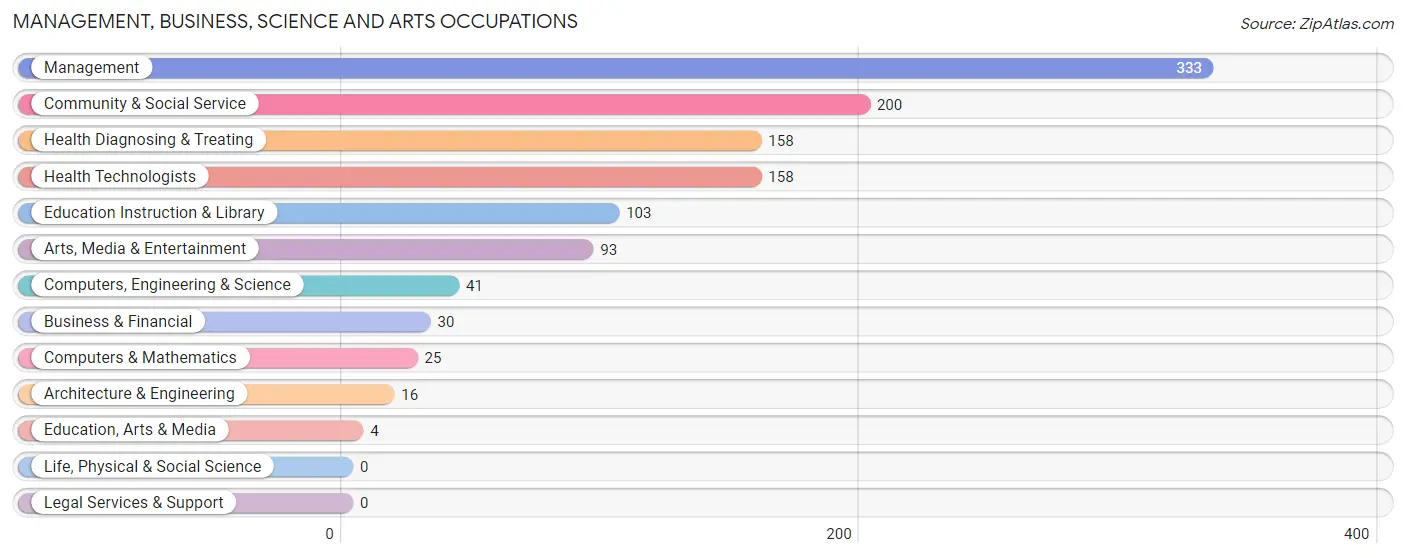
Management, Business, Science and Arts Occupations
The most common Management, Business, Science and Arts occupations in Shallotte are Management (333 | 16.6%), Community & Social Service (200 | 10.0%), Health Diagnosing & Treating (158 | 7.9%), Health Technologists (158 | 7.9%), and Education Instruction & Library (103 | 5.1%).
Management, Business, Science and Arts Occupations by Sex
Within the Management, Business, Science and Arts occupations in Shallotte, the most male-oriented occupations are Architecture & Engineering (100.0%), Arts, Media & Entertainment (93.5%), and Business & Financial (70.0%), while the most female-oriented occupations are Education, Arts & Media (100.0%), Education Instruction & Library (78.6%), and Health Diagnosing & Treating (75.9%).
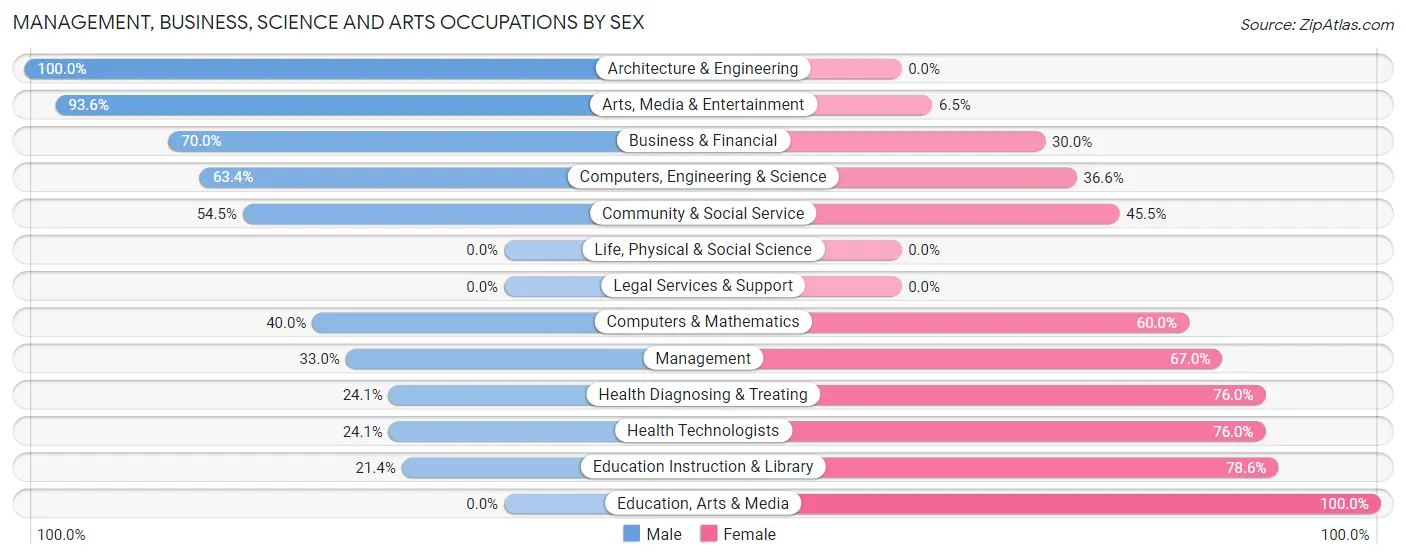
| Occupation | Male | Female |
| Management | 110 (33.0%) | 223 (67.0%) |
| Business & Financial | 21 (70.0%) | 9 (30.0%) |
| Computers, Engineering & Science | 26 (63.4%) | 15 (36.6%) |
| Computers & Mathematics | 10 (40.0%) | 15 (60.0%) |
| Architecture & Engineering | 16 (100.0%) | 0 (0.0%) |
| Life, Physical & Social Science | 0 (0.0%) | 0 (0.0%) |
| Community & Social Service | 109 (54.5%) | 91 (45.5%) |
| Education, Arts & Media | 0 (0.0%) | 4 (100.0%) |
| Legal Services & Support | 0 (0.0%) | 0 (0.0%) |
| Education Instruction & Library | 22 (21.4%) | 81 (78.6%) |
| Arts, Media & Entertainment | 87 (93.5%) | 6 (6.5%) |
| Health Diagnosing & Treating | 38 (24.0%) | 120 (75.9%) |
| Health Technologists | 38 (24.0%) | 120 (75.9%) |
| Total (Category) | 304 (39.9%) | 458 (60.1%) |
| Total (Overall) | 941 (46.9%) | 1,064 (53.1%) |
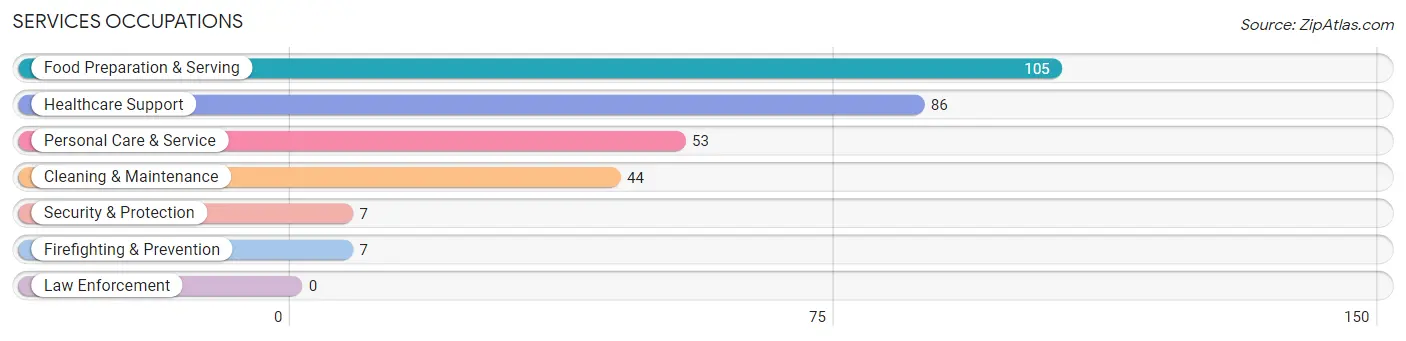
Services Occupations
The most common Services occupations in Shallotte are Food Preparation & Serving (105 | 5.2%), Healthcare Support (86 | 4.3%), Personal Care & Service (53 | 2.6%), Cleaning & Maintenance (44 | 2.2%), and Security & Protection (7 | 0.4%).
Services Occupations by Sex
Within the Services occupations in Shallotte, the most male-oriented occupations are Security & Protection (100.0%), Firefighting & Prevention (100.0%), and Cleaning & Maintenance (75.0%), while the most female-oriented occupations are Personal Care & Service (83.0%), Food Preparation & Serving (73.3%), and Healthcare Support (41.9%).
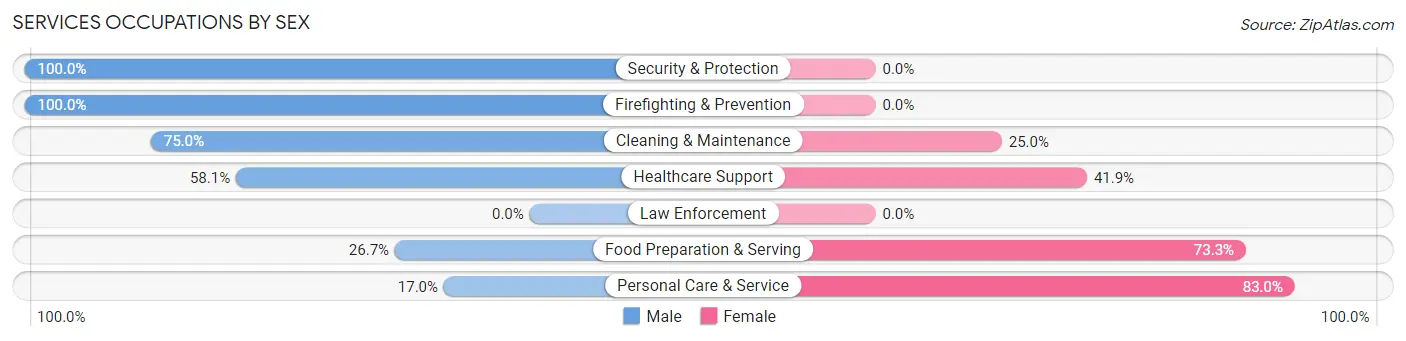
| Occupation | Male | Female |
| Healthcare Support | 50 (58.1%) | 36 (41.9%) |
| Security & Protection | 7 (100.0%) | 0 (0.0%) |
| Firefighting & Prevention | 7 (100.0%) | 0 (0.0%) |
| Law Enforcement | 0 (0.0%) | 0 (0.0%) |
| Food Preparation & Serving | 28 (26.7%) | 77 (73.3%) |
| Cleaning & Maintenance | 33 (75.0%) | 11 (25.0%) |
| Personal Care & Service | 9 (17.0%) | 44 (83.0%) |
| Total (Category) | 127 (43.0%) | 168 (57.0%) |
| Total (Overall) | 941 (46.9%) | 1,064 (53.1%) |
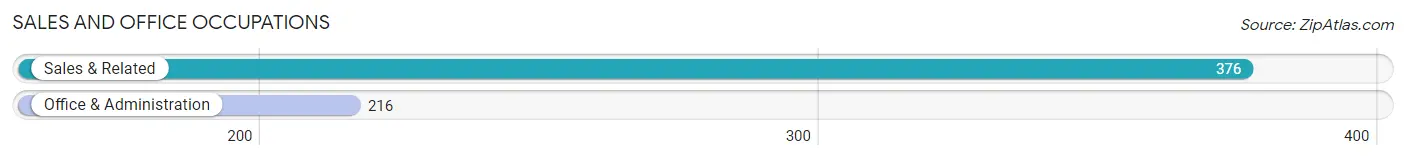
Sales and Office Occupations
The most common Sales and Office occupations in Shallotte are Sales & Related (376 | 18.8%), and Office & Administration (216 | 10.8%).
Sales and Office Occupations by Sex
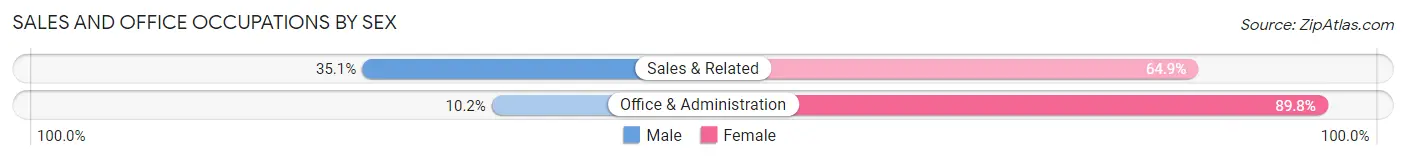
| Occupation | Male | Female |
| Sales & Related | 132 (35.1%) | 244 (64.9%) |
| Office & Administration | 22 (10.2%) | 194 (89.8%) |
| Total (Category) | 154 (26.0%) | 438 (74.0%) |
| Total (Overall) | 941 (46.9%) | 1,064 (53.1%) |
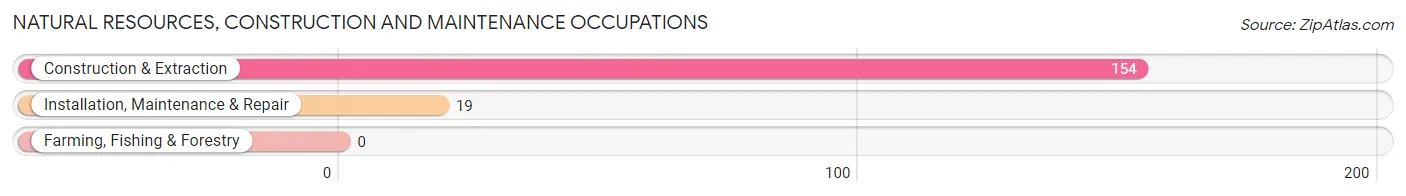
Natural Resources, Construction and Maintenance Occupations
The most common Natural Resources, Construction and Maintenance occupations in Shallotte are Construction & Extraction (154 | 7.7%), and Installation, Maintenance & Repair (19 | 0.9%).
Natural Resources, Construction and Maintenance Occupations by Sex
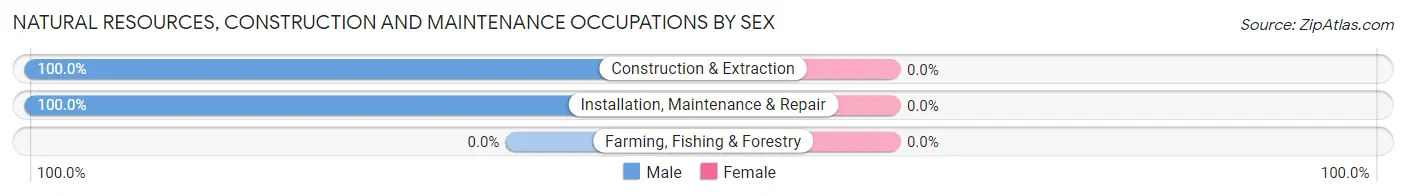
| Occupation | Male | Female |
| Farming, Fishing & Forestry | 0 (0.0%) | 0 (0.0%) |
| Construction & Extraction | 154 (100.0%) | 0 (0.0%) |
| Installation, Maintenance & Repair | 19 (100.0%) | 0 (0.0%) |
| Total (Category) | 173 (100.0%) | 0 (0.0%) |
| Total (Overall) | 941 (46.9%) | 1,064 (53.1%) |
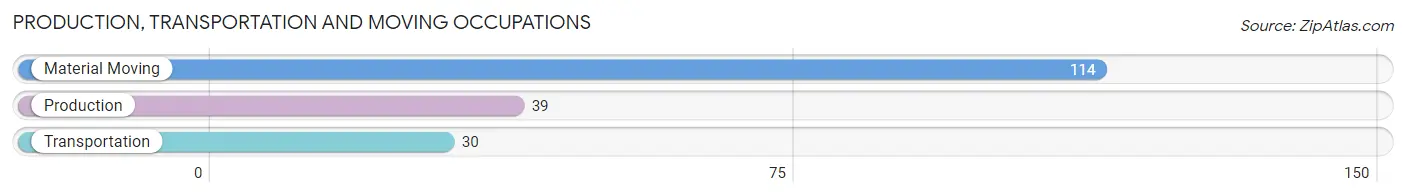
Production, Transportation and Moving Occupations
The most common Production, Transportation and Moving occupations in Shallotte are Material Moving (114 | 5.7%), Production (39 | 1.9%), and Transportation (30 | 1.5%).
Production, Transportation and Moving Occupations by Sex
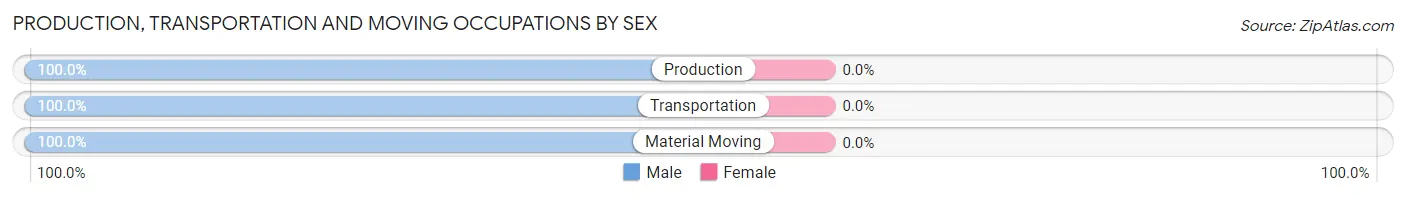
| Occupation | Male | Female |
| Production | 39 (100.0%) | 0 (0.0%) |
| Transportation | 30 (100.0%) | 0 (0.0%) |
| Material Moving | 114 (100.0%) | 0 (0.0%) |
| Total (Category) | 183 (100.0%) | 0 (0.0%) |
| Total (Overall) | 941 (46.9%) | 1,064 (53.1%) |
Employment Industries by Sex in Shallotte
Employment Industries in Shallotte
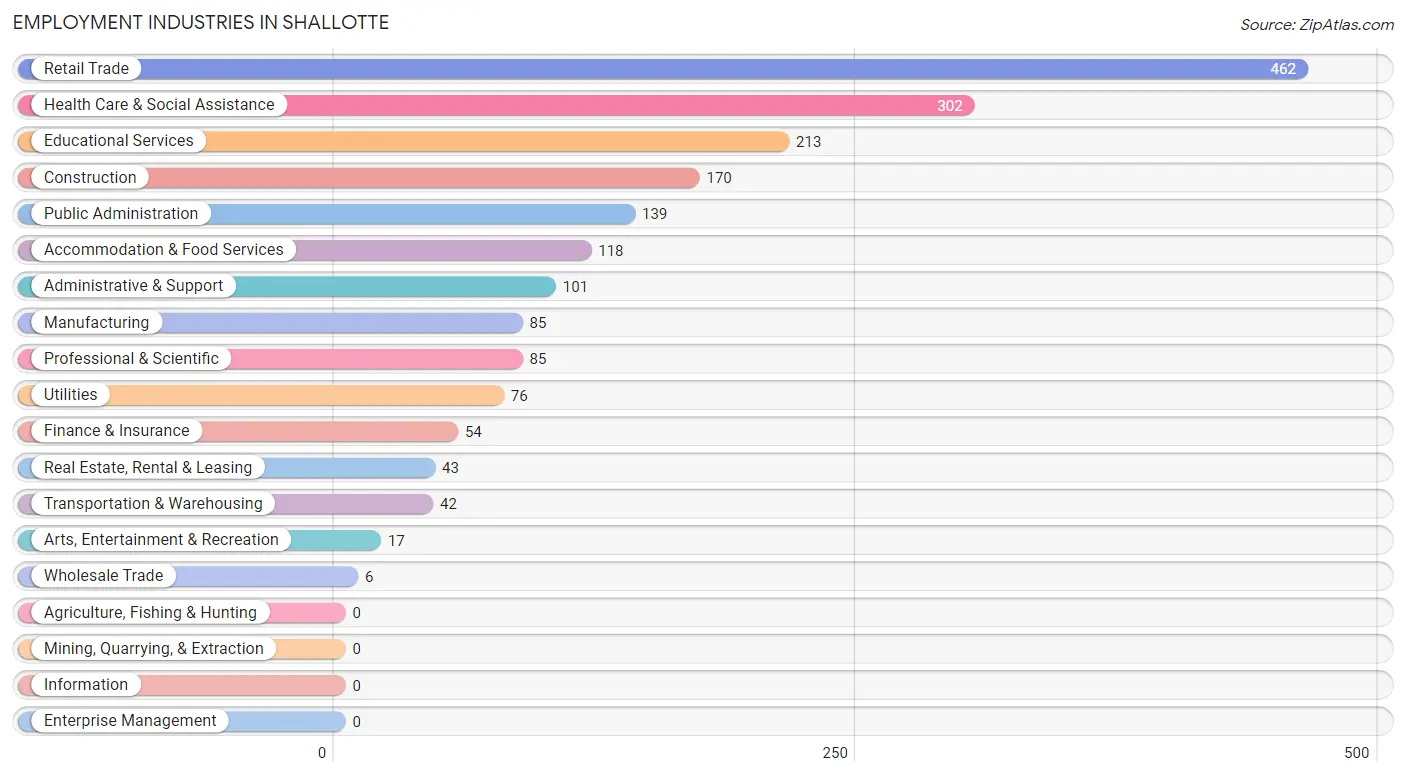
The major employment industries in Shallotte include Retail Trade (462 | 23.0%), Health Care & Social Assistance (302 | 15.1%), Educational Services (213 | 10.6%), Construction (170 | 8.5%), and Public Administration (139 | 6.9%).
Employment Industries by Sex in Shallotte
The Shallotte industries that see more men than women are Construction (100.0%), Manufacturing (100.0%), and Wholesale Trade (100.0%), whereas the industries that tend to have a higher number of women are Public Administration (95.0%), Real Estate, Rental & Leasing (79.1%), and Administrative & Support (77.2%).
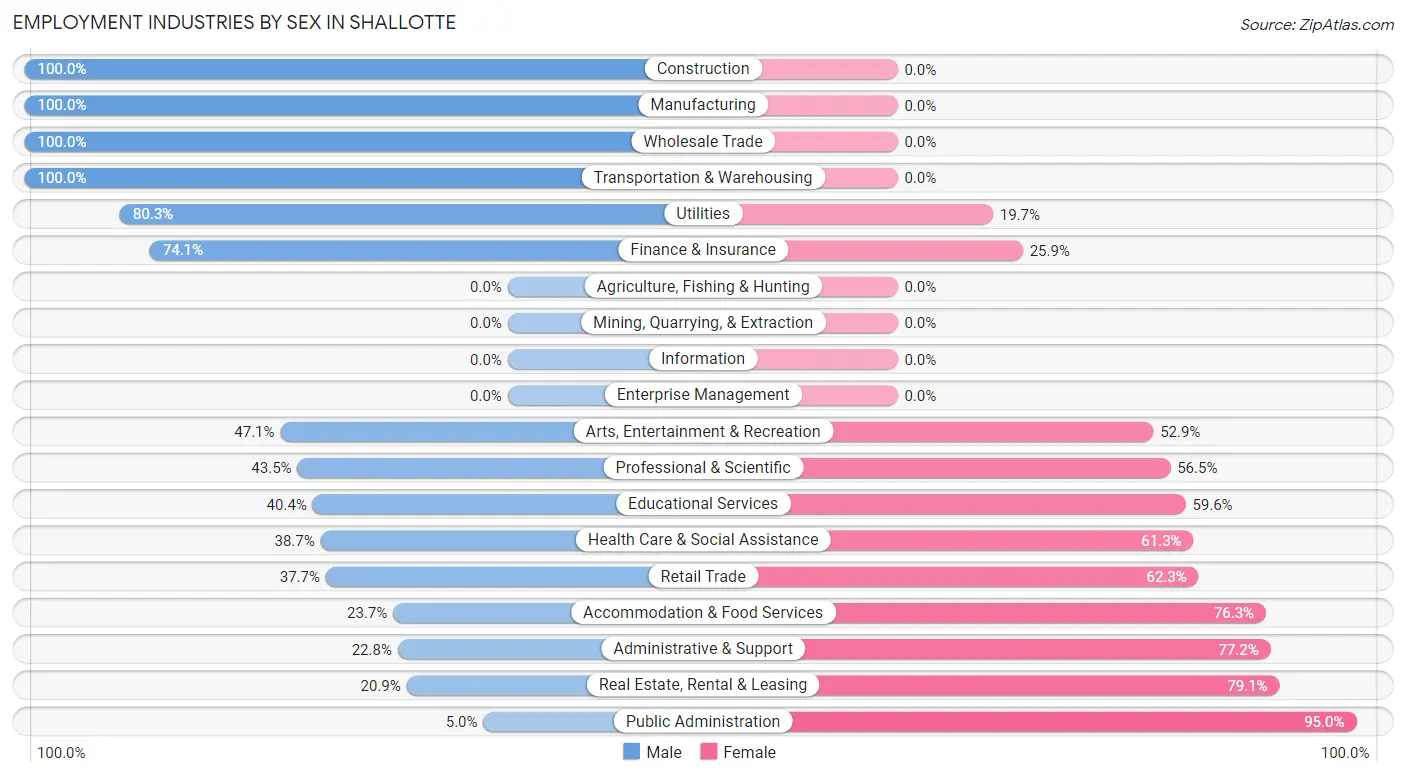
| Industry | Male | Female |
| Agriculture, Fishing & Hunting | 0 (0.0%) | 0 (0.0%) |
| Mining, Quarrying, & Extraction | 0 (0.0%) | 0 (0.0%) |
| Construction | 170 (100.0%) | 0 (0.0%) |
| Manufacturing | 85 (100.0%) | 0 (0.0%) |
| Wholesale Trade | 6 (100.0%) | 0 (0.0%) |
| Retail Trade | 174 (37.7%) | 288 (62.3%) |
| Transportation & Warehousing | 42 (100.0%) | 0 (0.0%) |
| Utilities | 61 (80.3%) | 15 (19.7%) |
| Information | 0 (0.0%) | 0 (0.0%) |
| Finance & Insurance | 40 (74.1%) | 14 (25.9%) |
| Real Estate, Rental & Leasing | 9 (20.9%) | 34 (79.1%) |
| Professional & Scientific | 37 (43.5%) | 48 (56.5%) |
| Enterprise Management | 0 (0.0%) | 0 (0.0%) |
| Administrative & Support | 23 (22.8%) | 78 (77.2%) |
| Educational Services | 86 (40.4%) | 127 (59.6%) |
| Health Care & Social Assistance | 117 (38.7%) | 185 (61.3%) |
| Arts, Entertainment & Recreation | 8 (47.1%) | 9 (52.9%) |
| Accommodation & Food Services | 28 (23.7%) | 90 (76.3%) |
| Public Administration | 7 (5.0%) | 132 (95.0%) |
| Total | 941 (46.9%) | 1,064 (53.1%) |
Education in Shallotte
School Enrollment in Shallotte
The most common levels of schooling among the 538 students in Shallotte are high school (244 | 45.4%), elementary school (132 | 24.5%), and college / undergraduate (64 | 11.9%).
| School Level | # Students | % Students |
| Nursery / Preschool | 16 | 3.0% |
| Kindergarten | 40 | 7.4% |
| Elementary School | 132 | 24.5% |
| Middle School | 17 | 3.2% |
| High School | 244 | 45.4% |
| College / Undergraduate | 64 | 11.9% |
| Graduate / Professional | 25 | 4.6% |
| Total | 538 | 100.0% |
School Enrollment by Age by Funding Source in Shallotte
Out of a total of 538 students who are enrolled in schools in Shallotte, 114 (21.2%) attend a private institution, while the remaining 424 (78.8%) are enrolled in public schools. The age group of 35 years and over has the highest likelihood of being enrolled in private schools, with 48 (56.5% in the age bracket) enrolled. Conversely, the age group of 3 to 4 year olds has the lowest likelihood of being enrolled in a private school, with 16 (100.0% in the age bracket) attending a public institution.
| Age Bracket | Public School | Private School |
| 3 to 4 Year Olds | 16 (100.0%) | 0 (0.0%) |
| 5 to 9 Year Old | 147 (85.5%) | 25 (14.5%) |
| 10 to 14 Year Olds | 17 (80.9%) | 4 (19.1%) |
| 15 to 17 Year Olds | 188 (83.6%) | 37 (16.4%) |
| 18 to 19 Year Olds | 4 (100.0%) | 0 (0.0%) |
| 20 to 24 Year Olds | 0 (0.0%) | 0 (0.0%) |
| 25 to 34 Year Olds | 15 (100.0%) | 0 (0.0%) |
| 35 Years and over | 37 (43.5%) | 48 (56.5%) |
| Total | 424 (78.8%) | 114 (21.2%) |
Educational Attainment by Field of Study in Shallotte
Business (267 | 29.2%), social sciences (91 | 10.0%), education (82 | 9.0%), liberal arts & history (82 | 9.0%), and arts & humanities (77 | 8.4%) are the most common fields of study among 914 individuals in Shallotte who have obtained a bachelor's degree or higher.
| Field of Study | # Graduates | % Graduates |
| Computers & Mathematics | 22 | 2.4% |
| Bio, Nature & Agricultural | 23 | 2.5% |
| Physical & Health Sciences | 25 | 2.7% |
| Psychology | 34 | 3.7% |
| Social Sciences | 91 | 10.0% |
| Engineering | 72 | 7.9% |
| Multidisciplinary Studies | 0 | 0.0% |
| Science & Technology | 60 | 6.6% |
| Business | 267 | 29.2% |
| Education | 82 | 9.0% |
| Literature & Languages | 9 | 1.0% |
| Liberal Arts & History | 82 | 9.0% |
| Visual & Performing Arts | 30 | 3.3% |
| Communications | 40 | 4.4% |
| Arts & Humanities | 77 | 8.4% |
| Total | 914 | 100.0% |
Transportation & Commute in Shallotte
Vehicle Availability by Sex in Shallotte
The most prevalent vehicle ownership categories in Shallotte are males with 2 vehicles (342, accounting for 35.1%) and females with 2 vehicles (369, making up 32.6%).
| Vehicles Available | Male | Female |
| No Vehicle | 41 (4.2%) | 14 (1.3%) |
| 1 Vehicle | 320 (32.9%) | 342 (32.6%) |
| 2 Vehicles | 342 (35.1%) | 369 (35.2%) |
| 3 Vehicles | 191 (19.6%) | 219 (20.9%) |
| 4 Vehicles | 79 (8.1%) | 105 (10.0%) |
| 5 or more Vehicles | 0 (0.0%) | 0 (0.0%) |
| Total | 973 (100.0%) | 1,049 (100.0%) |
Commute Time in Shallotte
The most frequently occuring commute durations in Shallotte are 10 to 14 minutes (438 commuters, 23.2%), 20 to 24 minutes (266 commuters, 14.1%), and 15 to 19 minutes (230 commuters, 12.2%).
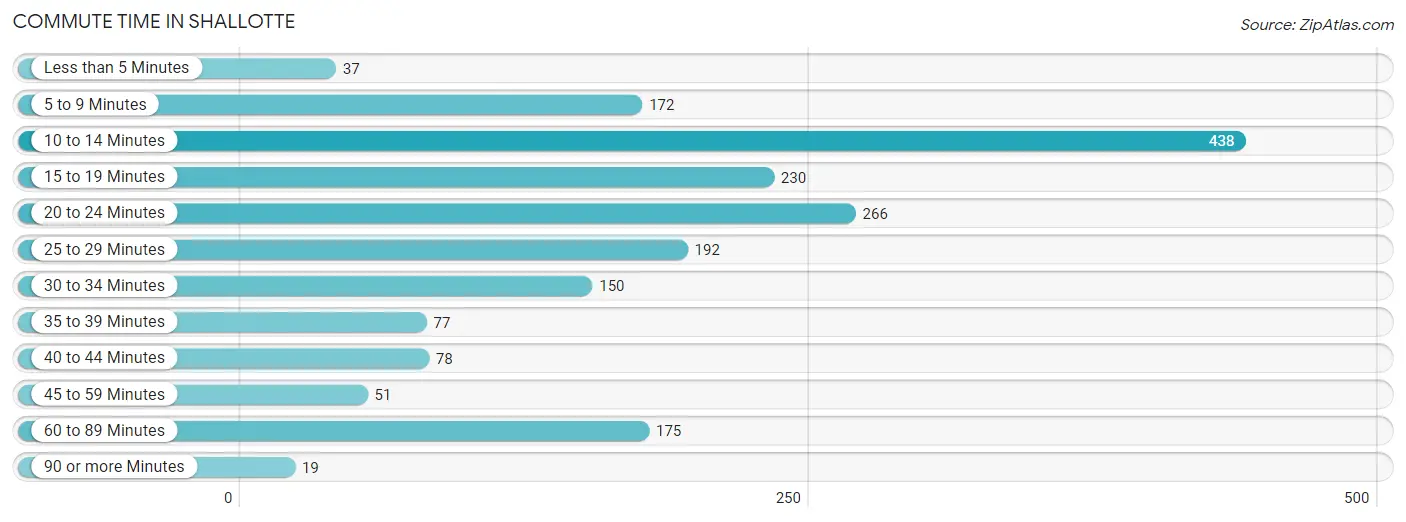
| Commute Time | # Commuters | % Commuters |
| Less than 5 Minutes | 37 | 2.0% |
| 5 to 9 Minutes | 172 | 9.1% |
| 10 to 14 Minutes | 438 | 23.2% |
| 15 to 19 Minutes | 230 | 12.2% |
| 20 to 24 Minutes | 266 | 14.1% |
| 25 to 29 Minutes | 192 | 10.2% |
| 30 to 34 Minutes | 150 | 8.0% |
| 35 to 39 Minutes | 77 | 4.1% |
| 40 to 44 Minutes | 78 | 4.1% |
| 45 to 59 Minutes | 51 | 2.7% |
| 60 to 89 Minutes | 175 | 9.3% |
| 90 or more Minutes | 19 | 1.0% |
Commute Time by Sex in Shallotte
The most common commute times in Shallotte are 10 to 14 minutes (197 commuters, 22.7%) for males and 10 to 14 minutes (241 commuters, 23.7%) for females.
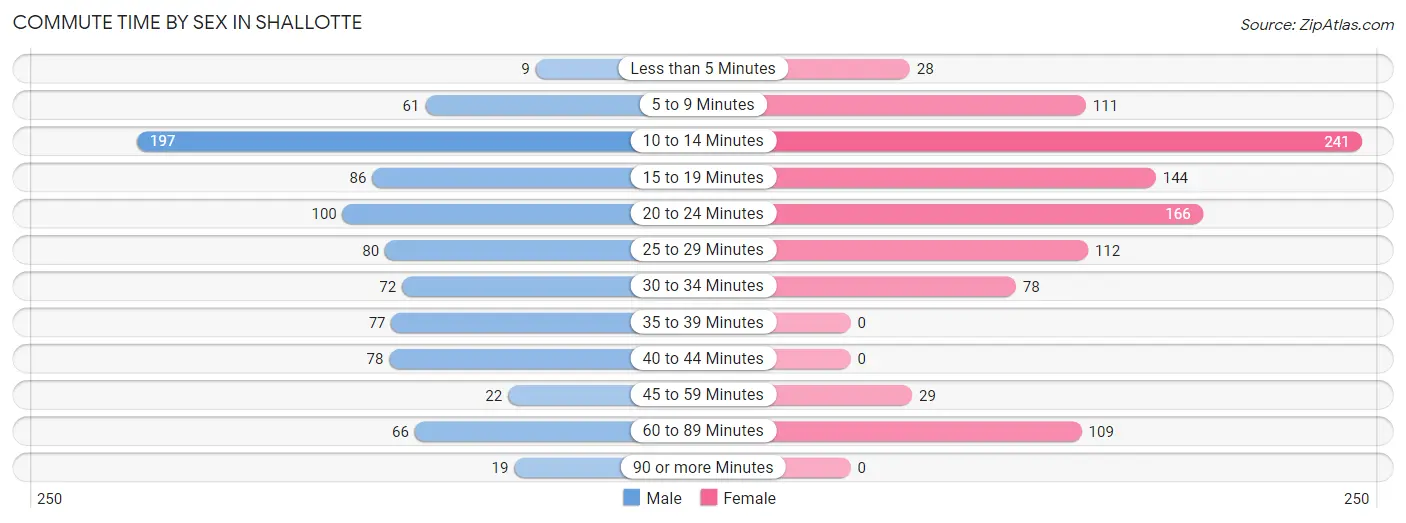
| Commute Time | Male | Female |
| Less than 5 Minutes | 9 (1.0%) | 28 (2.8%) |
| 5 to 9 Minutes | 61 (7.0%) | 111 (10.9%) |
| 10 to 14 Minutes | 197 (22.7%) | 241 (23.7%) |
| 15 to 19 Minutes | 86 (9.9%) | 144 (14.1%) |
| 20 to 24 Minutes | 100 (11.5%) | 166 (16.3%) |
| 25 to 29 Minutes | 80 (9.2%) | 112 (11.0%) |
| 30 to 34 Minutes | 72 (8.3%) | 78 (7.7%) |
| 35 to 39 Minutes | 77 (8.9%) | 0 (0.0%) |
| 40 to 44 Minutes | 78 (9.0%) | 0 (0.0%) |
| 45 to 59 Minutes | 22 (2.5%) | 29 (2.9%) |
| 60 to 89 Minutes | 66 (7.6%) | 109 (10.7%) |
| 90 or more Minutes | 19 (2.2%) | 0 (0.0%) |
Time of Departure to Work by Sex in Shallotte
The most frequent times of departure to work in Shallotte are 6:00 AM to 6:29 AM (144, 16.6%) for males and 7:30 AM to 7:59 AM (331, 32.5%) for females.
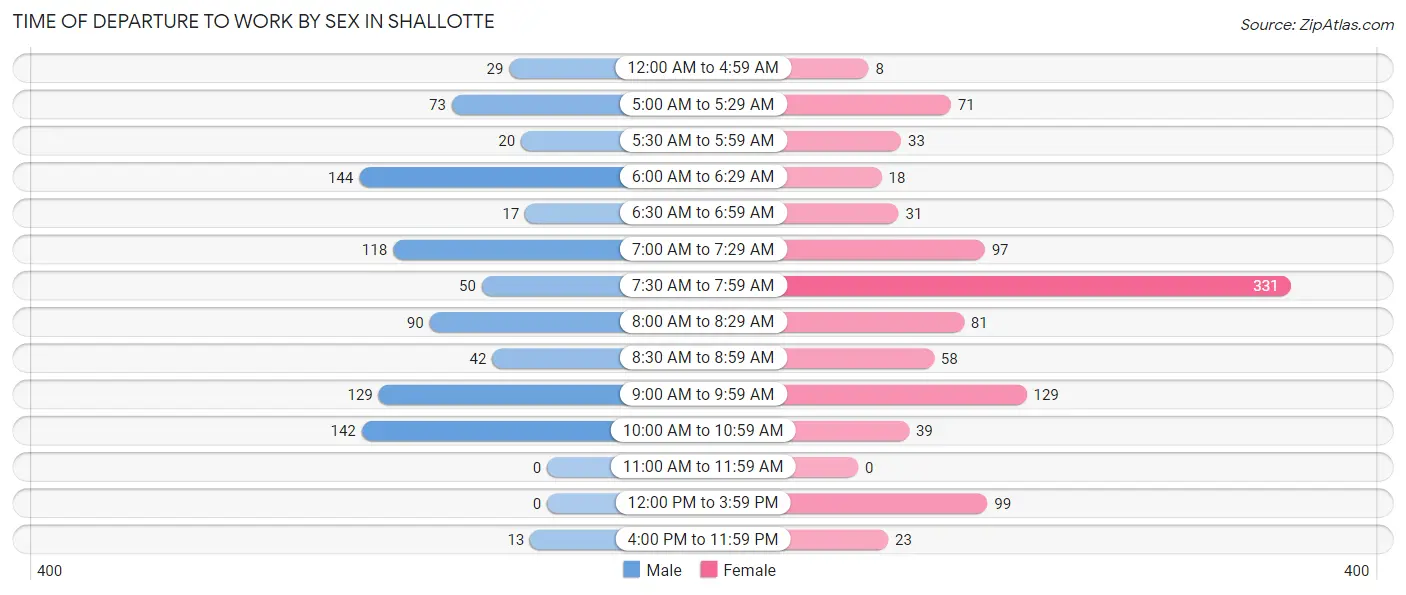
| Time of Departure | Male | Female |
| 12:00 AM to 4:59 AM | 29 (3.3%) | 8 (0.8%) |
| 5:00 AM to 5:29 AM | 73 (8.4%) | 71 (7.0%) |
| 5:30 AM to 5:59 AM | 20 (2.3%) | 33 (3.2%) |
| 6:00 AM to 6:29 AM | 144 (16.6%) | 18 (1.8%) |
| 6:30 AM to 6:59 AM | 17 (2.0%) | 31 (3.0%) |
| 7:00 AM to 7:29 AM | 118 (13.6%) | 97 (9.5%) |
| 7:30 AM to 7:59 AM | 50 (5.8%) | 331 (32.5%) |
| 8:00 AM to 8:29 AM | 90 (10.4%) | 81 (8.0%) |
| 8:30 AM to 8:59 AM | 42 (4.8%) | 58 (5.7%) |
| 9:00 AM to 9:59 AM | 129 (14.9%) | 129 (12.7%) |
| 10:00 AM to 10:59 AM | 142 (16.4%) | 39 (3.8%) |
| 11:00 AM to 11:59 AM | 0 (0.0%) | 0 (0.0%) |
| 12:00 PM to 3:59 PM | 0 (0.0%) | 99 (9.7%) |
| 4:00 PM to 11:59 PM | 13 (1.5%) | 23 (2.3%) |
| Total | 867 (100.0%) | 1,018 (100.0%) |
Housing Occupancy in Shallotte
Occupancy by Ownership in Shallotte
Of the total 1,903 dwellings in Shallotte, owner-occupied units account for 1,183 (62.2%), while renter-occupied units make up 720 (37.8%).
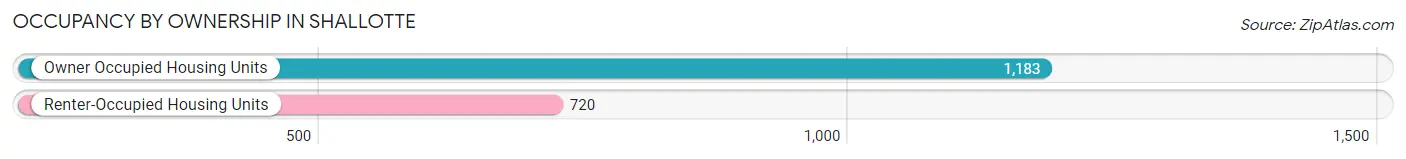
| Occupancy | # Housing Units | % Housing Units |
| Owner Occupied Housing Units | 1,183 | 62.2% |
| Renter-Occupied Housing Units | 720 | 37.8% |
| Total Occupied Housing Units | 1,903 | 100.0% |
Occupancy by Household Size in Shallotte
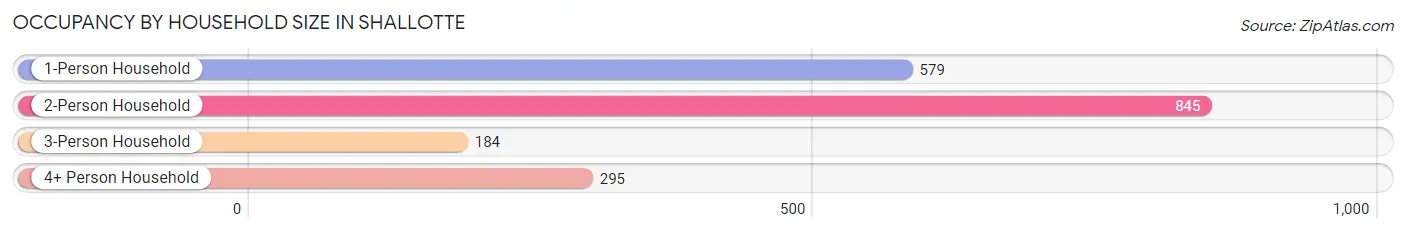
| Household Size | # Housing Units | % Housing Units |
| 1-Person Household | 579 | 30.4% |
| 2-Person Household | 845 | 44.4% |
| 3-Person Household | 184 | 9.7% |
| 4+ Person Household | 295 | 15.5% |
| Total Housing Units | 1,903 | 100.0% |
Occupancy by Ownership by Household Size in Shallotte
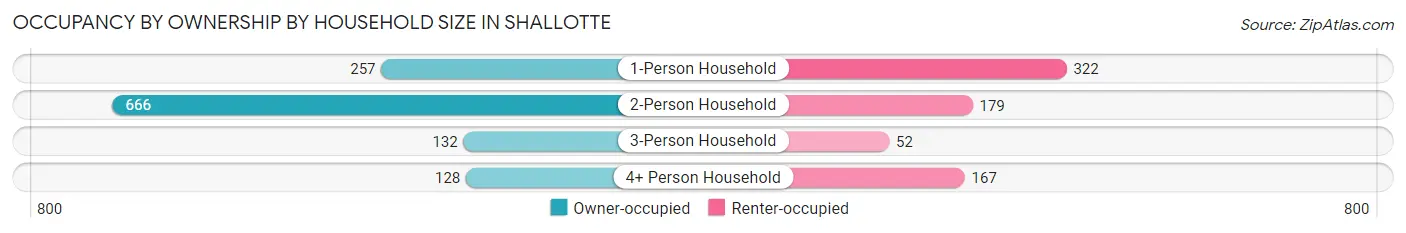
| Household Size | Owner-occupied | Renter-occupied |
| 1-Person Household | 257 (44.4%) | 322 (55.6%) |
| 2-Person Household | 666 (78.8%) | 179 (21.2%) |
| 3-Person Household | 132 (71.7%) | 52 (28.3%) |
| 4+ Person Household | 128 (43.4%) | 167 (56.6%) |
| Total Housing Units | 1,183 (62.2%) | 720 (37.8%) |
Occupancy by Educational Attainment in Shallotte
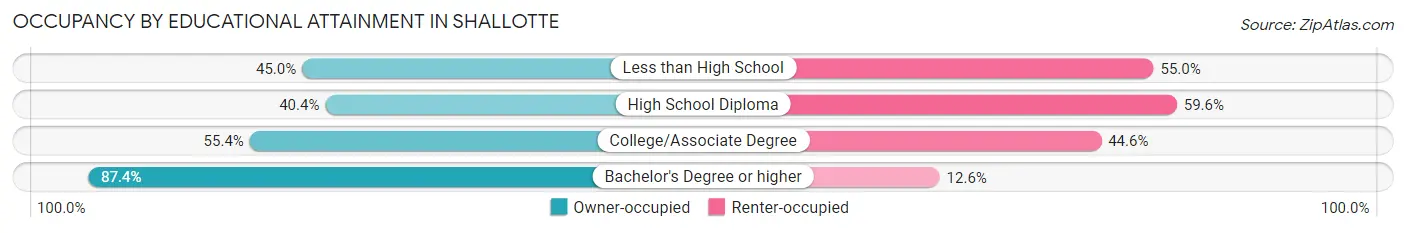
| Household Size | Owner-occupied | Renter-occupied |
| Less than High School | 27 (45.0%) | 33 (55.0%) |
| High School Diploma | 143 (40.4%) | 211 (59.6%) |
| College/Associate Degree | 499 (55.4%) | 402 (44.6%) |
| Bachelor's Degree or higher | 514 (87.4%) | 74 (12.6%) |
Occupancy by Age of Householder in Shallotte
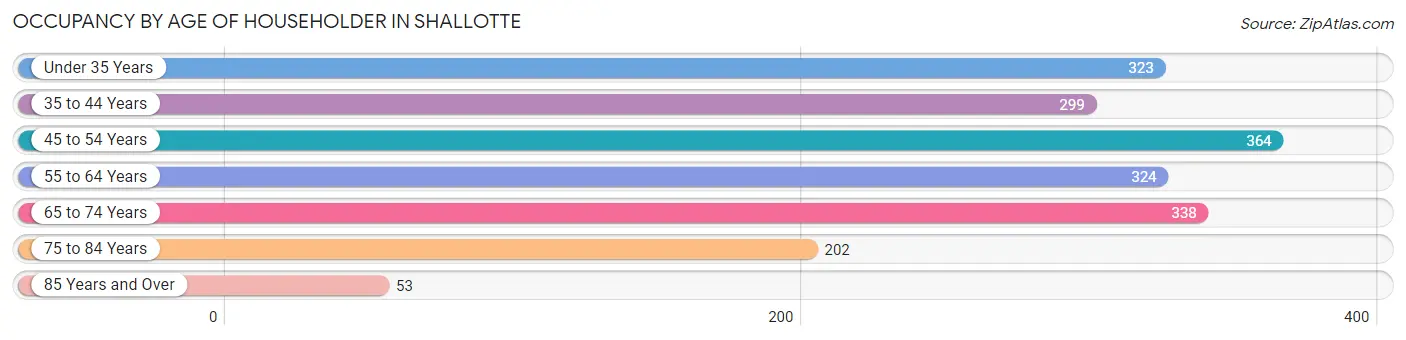
| Age Bracket | # Households | % Households |
| Under 35 Years | 323 | 17.0% |
| 35 to 44 Years | 299 | 15.7% |
| 45 to 54 Years | 364 | 19.1% |
| 55 to 64 Years | 324 | 17.0% |
| 65 to 74 Years | 338 | 17.8% |
| 75 to 84 Years | 202 | 10.6% |
| 85 Years and Over | 53 | 2.8% |
| Total | 1,903 | 100.0% |
Housing Finances in Shallotte
Median Income by Occupancy in Shallotte
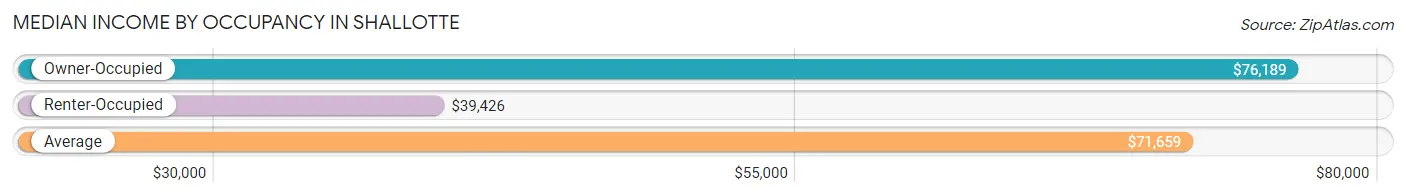
| Occupancy Type | # Households | Median Income |
| Owner-Occupied | 1,183 (62.2%) | $76,189 |
| Renter-Occupied | 720 (37.8%) | $39,426 |
| Average | 1,903 (100.0%) | $71,659 |
Occupancy by Householder Income Bracket in Shallotte
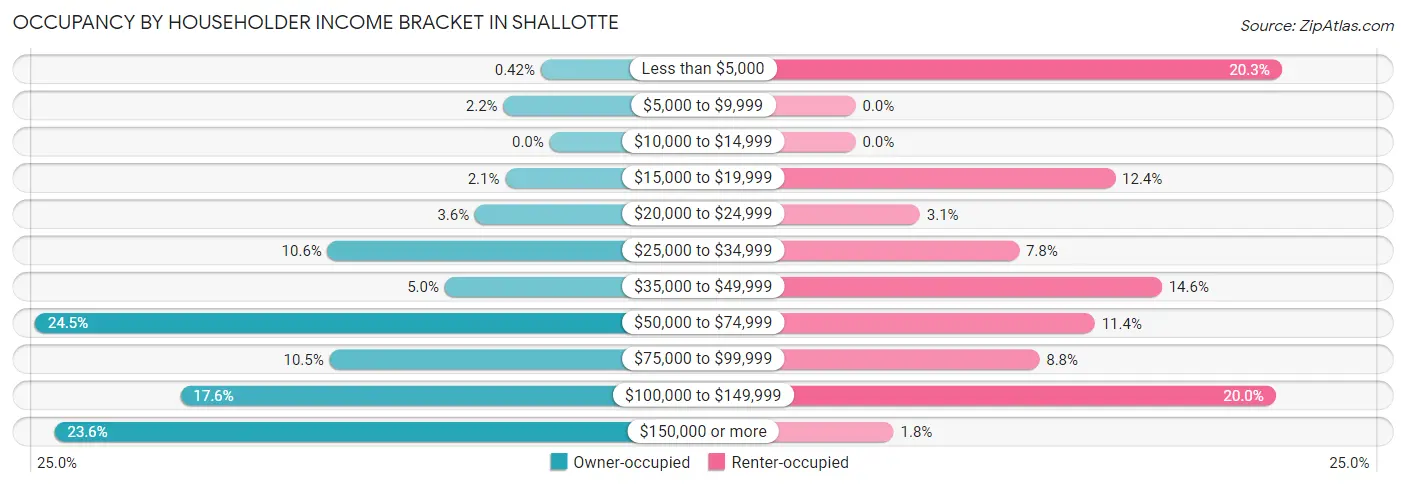
| Income Bracket | Owner-occupied | Renter-occupied |
| Less than $5,000 | 5 (0.4%) | 146 (20.3%) |
| $5,000 to $9,999 | 26 (2.2%) | 0 (0.0%) |
| $10,000 to $14,999 | 0 (0.0%) | 0 (0.0%) |
| $15,000 to $19,999 | 25 (2.1%) | 89 (12.4%) |
| $20,000 to $24,999 | 42 (3.5%) | 22 (3.1%) |
| $25,000 to $34,999 | 125 (10.6%) | 56 (7.8%) |
| $35,000 to $49,999 | 59 (5.0%) | 105 (14.6%) |
| $50,000 to $74,999 | 290 (24.5%) | 82 (11.4%) |
| $75,000 to $99,999 | 124 (10.5%) | 63 (8.7%) |
| $100,000 to $149,999 | 208 (17.6%) | 144 (20.0%) |
| $150,000 or more | 279 (23.6%) | 13 (1.8%) |
| Total | 1,183 (100.0%) | 720 (100.0%) |
Monthly Housing Cost Tiers in Shallotte
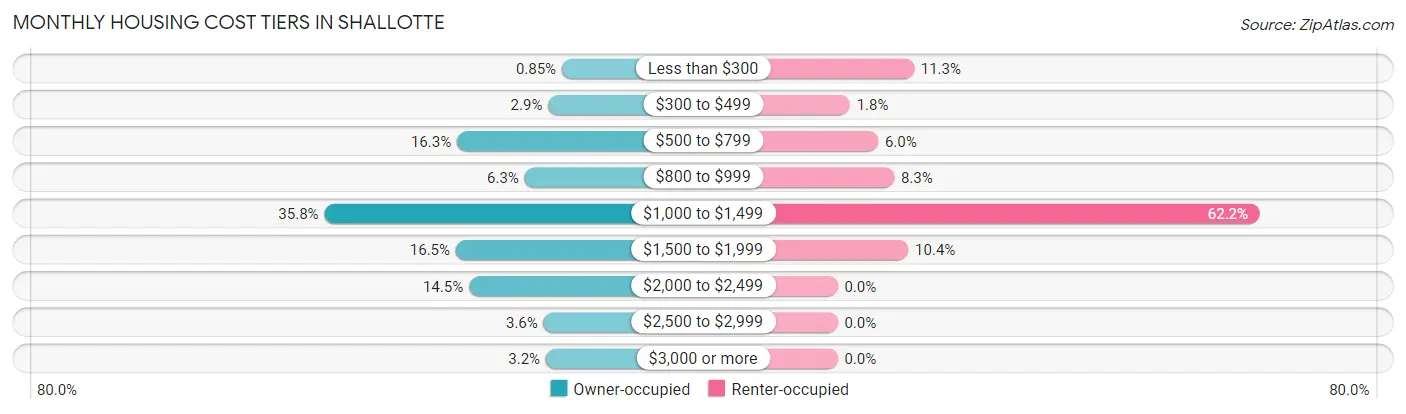
| Monthly Cost | Owner-occupied | Renter-occupied |
| Less than $300 | 10 (0.9%) | 81 (11.3%) |
| $300 to $499 | 34 (2.9%) | 13 (1.8%) |
| $500 to $799 | 193 (16.3%) | 43 (6.0%) |
| $800 to $999 | 75 (6.3%) | 60 (8.3%) |
| $1,000 to $1,499 | 424 (35.8%) | 448 (62.2%) |
| $1,500 to $1,999 | 195 (16.5%) | 75 (10.4%) |
| $2,000 to $2,499 | 172 (14.5%) | 0 (0.0%) |
| $2,500 to $2,999 | 42 (3.5%) | 0 (0.0%) |
| $3,000 or more | 38 (3.2%) | 0 (0.0%) |
| Total | 1,183 (100.0%) | 720 (100.0%) |
Physical Housing Characteristics in Shallotte
Housing Structures in Shallotte
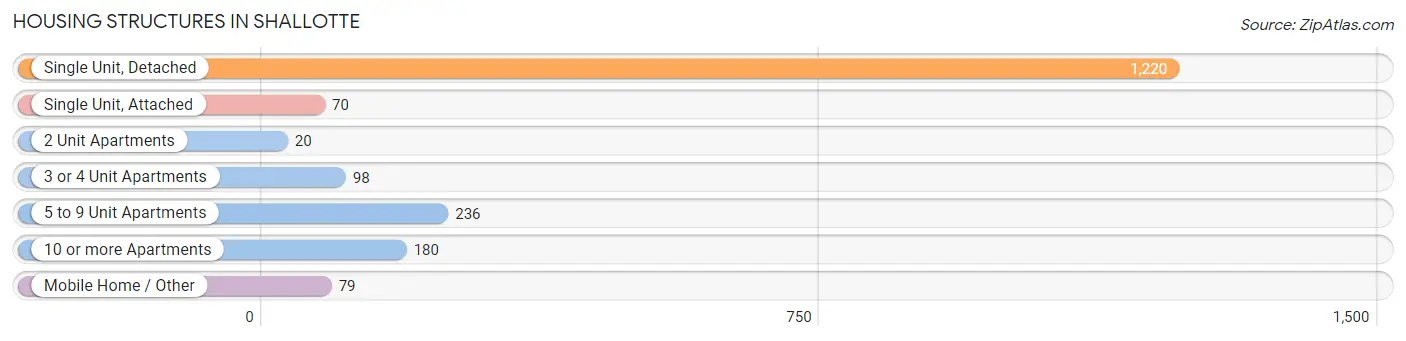
| Structure Type | # Housing Units | % Housing Units |
| Single Unit, Detached | 1,220 | 64.1% |
| Single Unit, Attached | 70 | 3.7% |
| 2 Unit Apartments | 20 | 1.1% |
| 3 or 4 Unit Apartments | 98 | 5.1% |
| 5 to 9 Unit Apartments | 236 | 12.4% |
| 10 or more Apartments | 180 | 9.5% |
| Mobile Home / Other | 79 | 4.2% |
| Total | 1,903 | 100.0% |
Housing Structures by Occupancy in Shallotte
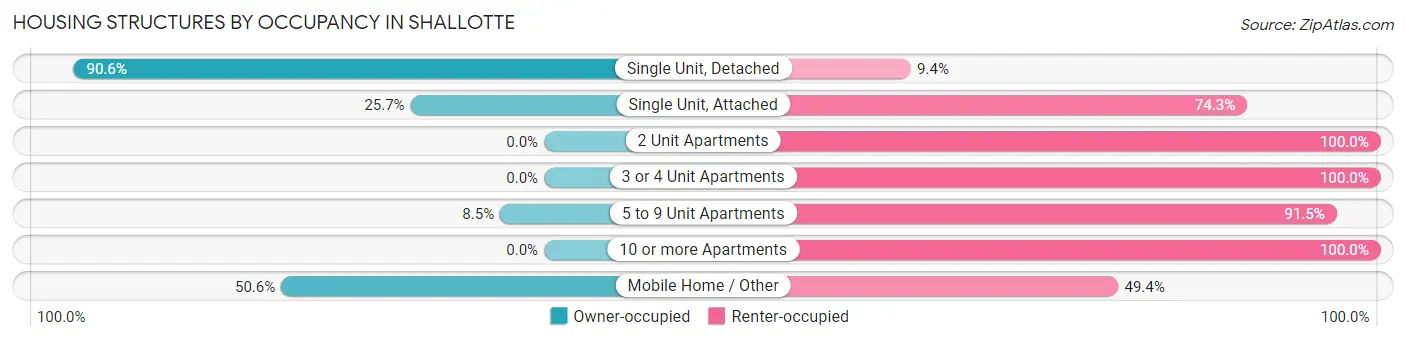
| Structure Type | Owner-occupied | Renter-occupied |
| Single Unit, Detached | 1,105 (90.6%) | 115 (9.4%) |
| Single Unit, Attached | 18 (25.7%) | 52 (74.3%) |
| 2 Unit Apartments | 0 (0.0%) | 20 (100.0%) |
| 3 or 4 Unit Apartments | 0 (0.0%) | 98 (100.0%) |
| 5 to 9 Unit Apartments | 20 (8.5%) | 216 (91.5%) |
| 10 or more Apartments | 0 (0.0%) | 180 (100.0%) |
| Mobile Home / Other | 40 (50.6%) | 39 (49.4%) |
| Total | 1,183 (62.2%) | 720 (37.8%) |
Housing Structures by Number of Rooms in Shallotte
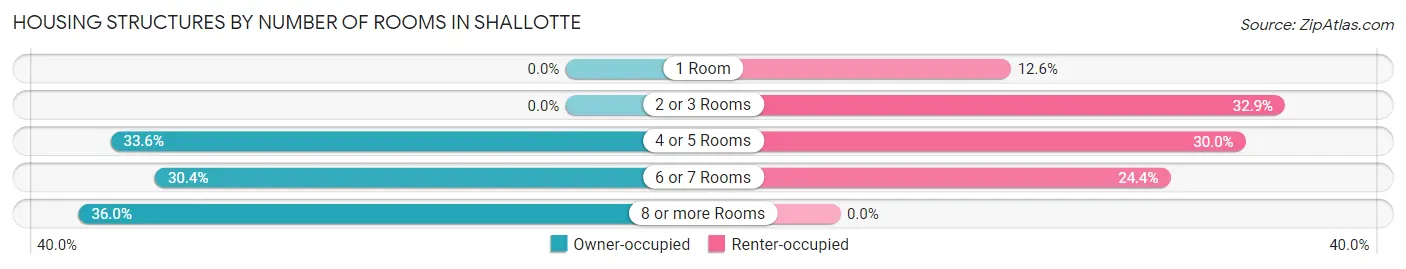
| Number of Rooms | Owner-occupied | Renter-occupied |
| 1 Room | 0 (0.0%) | 91 (12.6%) |
| 2 or 3 Rooms | 0 (0.0%) | 237 (32.9%) |
| 4 or 5 Rooms | 398 (33.6%) | 216 (30.0%) |
| 6 or 7 Rooms | 359 (30.3%) | 176 (24.4%) |
| 8 or more Rooms | 426 (36.0%) | 0 (0.0%) |
| Total | 1,183 (100.0%) | 720 (100.0%) |
Housing Structure by Heating Type in Shallotte
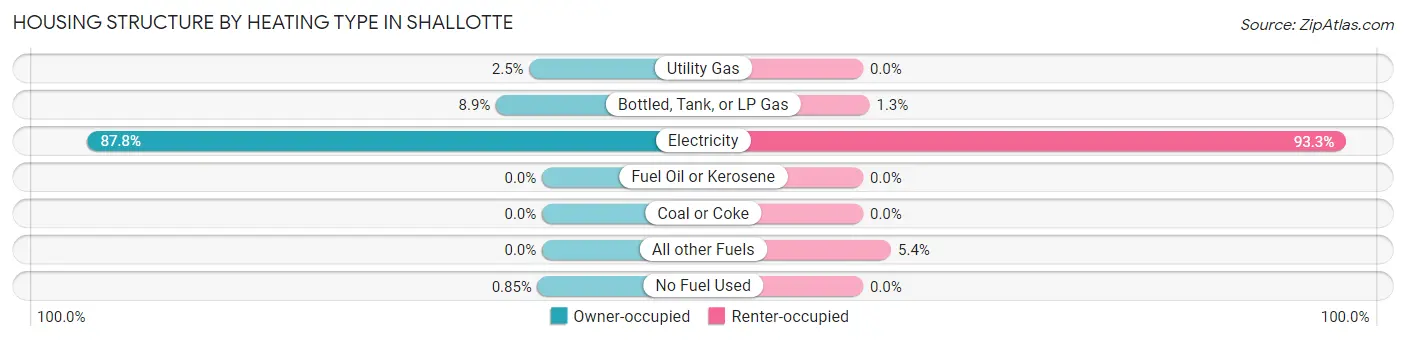
| Heating Type | Owner-occupied | Renter-occupied |
| Utility Gas | 29 (2.5%) | 0 (0.0%) |
| Bottled, Tank, or LP Gas | 105 (8.9%) | 9 (1.3%) |
| Electricity | 1,039 (87.8%) | 672 (93.3%) |
| Fuel Oil or Kerosene | 0 (0.0%) | 0 (0.0%) |
| Coal or Coke | 0 (0.0%) | 0 (0.0%) |
| All other Fuels | 0 (0.0%) | 39 (5.4%) |
| No Fuel Used | 10 (0.9%) | 0 (0.0%) |
| Total | 1,183 (100.0%) | 720 (100.0%) |
Household Vehicle Usage in Shallotte
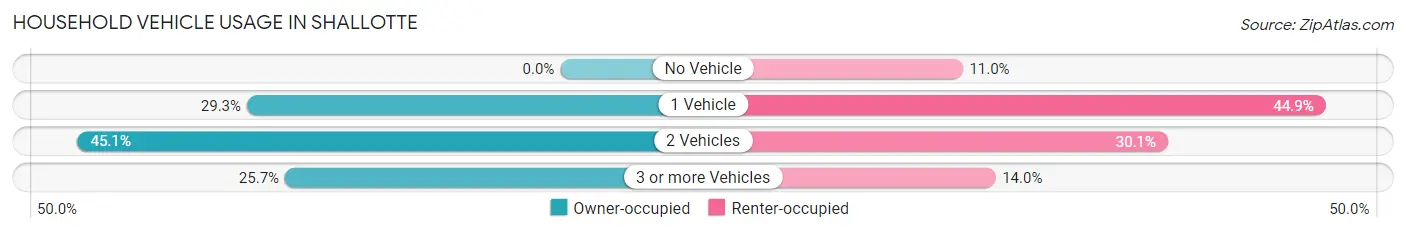
| Vehicles per Household | Owner-occupied | Renter-occupied |
| No Vehicle | 0 (0.0%) | 79 (11.0%) |
| 1 Vehicle | 346 (29.2%) | 323 (44.9%) |
| 2 Vehicles | 533 (45.1%) | 217 (30.1%) |
| 3 or more Vehicles | 304 (25.7%) | 101 (14.0%) |
| Total | 1,183 (100.0%) | 720 (100.0%) |
Real Estate & Mortgages in Shallotte
Real Estate and Mortgage Overview in Shallotte
| Characteristic | Without Mortgage | With Mortgage |
| Housing Units | 303 | 880 |
| Median Property Value | $318,100 | $257,700 |
| Median Household Income | $65,694 | $204 |
| Monthly Housing Costs | $677 | $38 |
| Real Estate Taxes | $2,218 | $10 |
Property Value by Mortgage Status in Shallotte
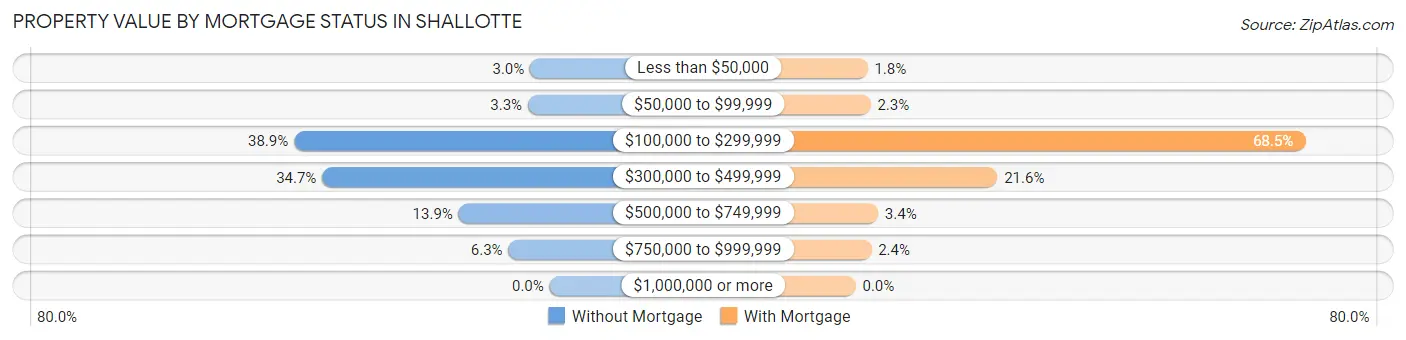
| Property Value | Without Mortgage | With Mortgage |
| Less than $50,000 | 9 (3.0%) | 16 (1.8%) |
| $50,000 to $99,999 | 10 (3.3%) | 20 (2.3%) |
| $100,000 to $299,999 | 118 (38.9%) | 603 (68.5%) |
| $300,000 to $499,999 | 105 (34.6%) | 190 (21.6%) |
| $500,000 to $749,999 | 42 (13.9%) | 30 (3.4%) |
| $750,000 to $999,999 | 19 (6.3%) | 21 (2.4%) |
| $1,000,000 or more | 0 (0.0%) | 0 (0.0%) |
| Total | 303 (100.0%) | 880 (100.0%) |
Household Income by Mortgage Status in Shallotte
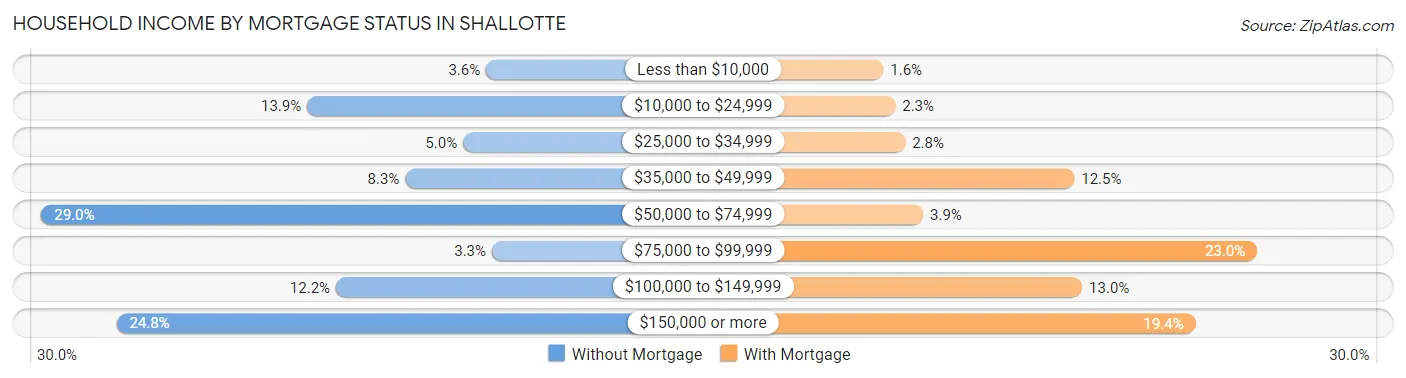
| Household Income | Without Mortgage | With Mortgage |
| Less than $10,000 | 11 (3.6%) | 14 (1.6%) |
| $10,000 to $24,999 | 42 (13.9%) | 20 (2.3%) |
| $25,000 to $34,999 | 15 (5.0%) | 25 (2.8%) |
| $35,000 to $49,999 | 25 (8.3%) | 110 (12.5%) |
| $50,000 to $74,999 | 88 (29.0%) | 34 (3.9%) |
| $75,000 to $99,999 | 10 (3.3%) | 202 (23.0%) |
| $100,000 to $149,999 | 37 (12.2%) | 114 (13.0%) |
| $150,000 or more | 75 (24.7%) | 171 (19.4%) |
| Total | 303 (100.0%) | 880 (100.0%) |
Property Value to Household Income Ratio in Shallotte
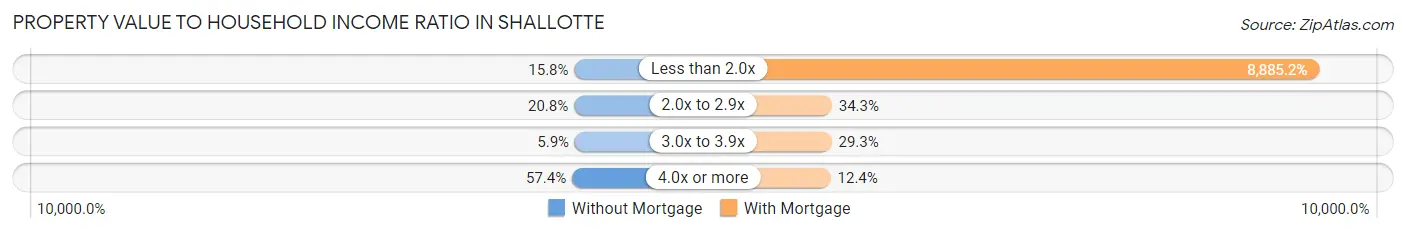
| Value-to-Income Ratio | Without Mortgage | With Mortgage |
| Less than 2.0x | 48 (15.8%) | 78,190 (8,885.2%) |
| 2.0x to 2.9x | 63 (20.8%) | 302 (34.3%) |
| 3.0x to 3.9x | 18 (5.9%) | 258 (29.3%) |
| 4.0x or more | 174 (57.4%) | 109 (12.4%) |
| Total | 303 (100.0%) | 880 (100.0%) |
Real Estate Taxes by Mortgage Status in Shallotte
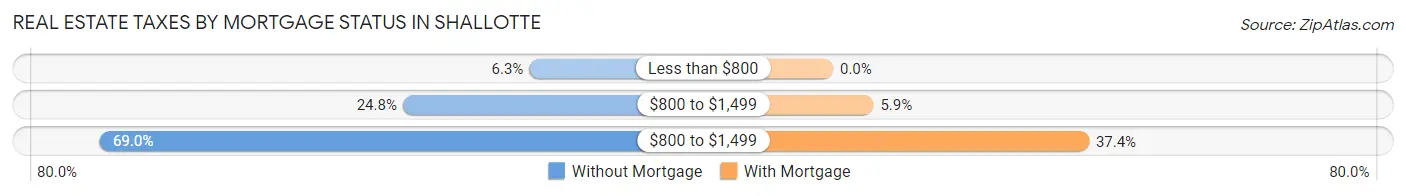
| Property Taxes | Without Mortgage | With Mortgage |
| Less than $800 | 19 (6.3%) | 0 (0.0%) |
| $800 to $1,499 | 75 (24.7%) | 52 (5.9%) |
| $800 to $1,499 | 209 (69.0%) | 329 (37.4%) |
| Total | 303 (100.0%) | 880 (100.0%) |
Health & Disability in Shallotte
Health Insurance Coverage by Age in Shallotte
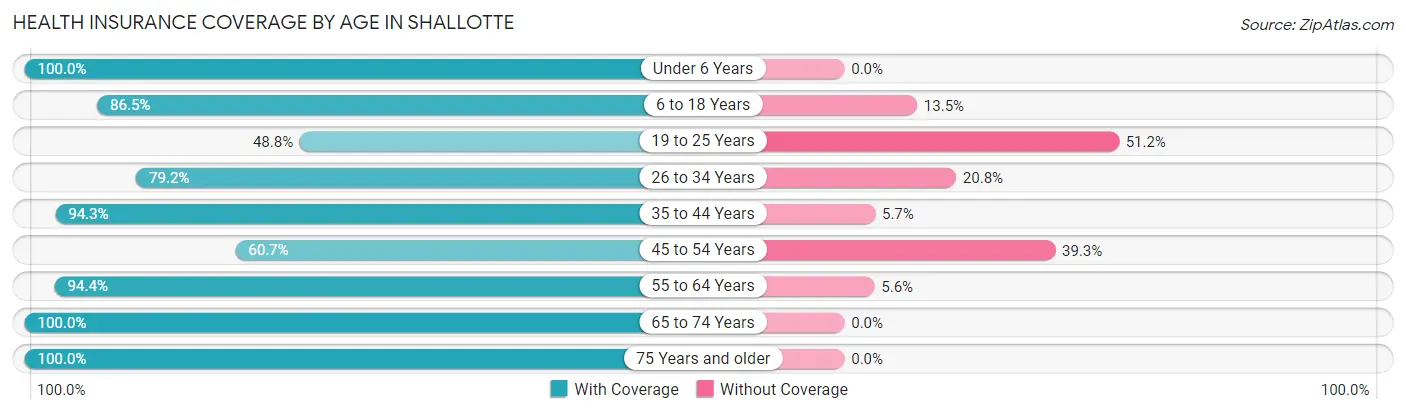
| Age Bracket | With Coverage | Without Coverage |
| Under 6 Years | 329 (100.0%) | 0 (0.0%) |
| 6 to 18 Years | 383 (86.5%) | 60 (13.5%) |
| 19 to 25 Years | 104 (48.8%) | 109 (51.2%) |
| 26 to 34 Years | 236 (79.2%) | 62 (20.8%) |
| 35 to 44 Years | 625 (94.3%) | 38 (5.7%) |
| 45 to 54 Years | 301 (60.7%) | 195 (39.3%) |
| 55 to 64 Years | 623 (94.4%) | 37 (5.6%) |
| 65 to 74 Years | 569 (100.0%) | 0 (0.0%) |
| 75 Years and older | 382 (100.0%) | 0 (0.0%) |
| Total | 3,552 (87.6%) | 501 (12.4%) |
Health Insurance Coverage by Citizenship Status in Shallotte
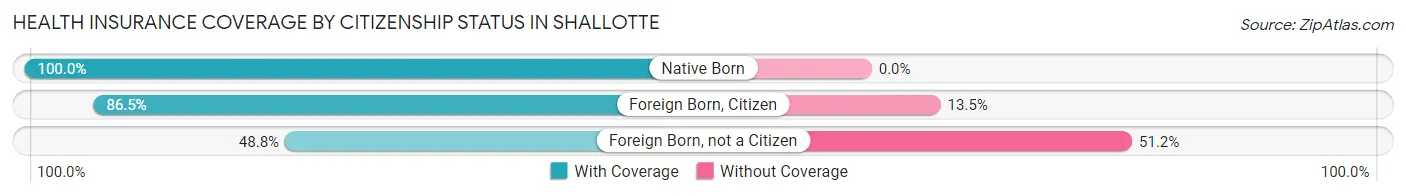
| Citizenship Status | With Coverage | Without Coverage |
| Native Born | 329 (100.0%) | 0 (0.0%) |
| Foreign Born, Citizen | 383 (86.5%) | 60 (13.5%) |
| Foreign Born, not a Citizen | 104 (48.8%) | 109 (51.2%) |
Health Insurance Coverage by Household Income in Shallotte
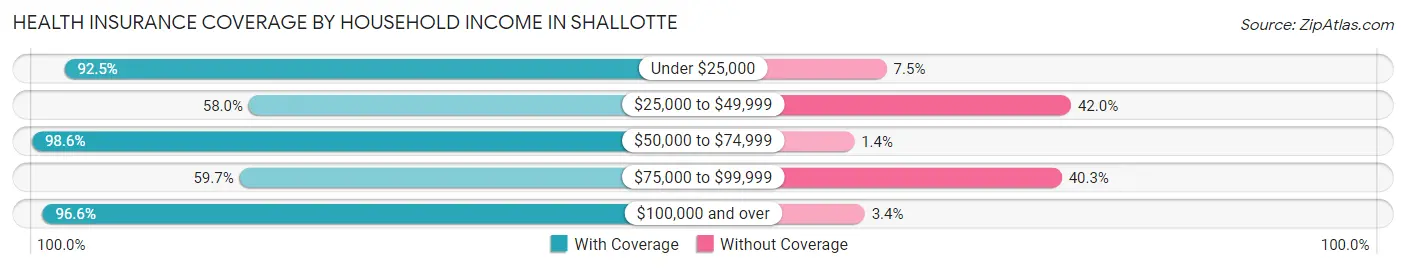
| Household Income | With Coverage | Without Coverage |
| Under $25,000 | 520 (92.5%) | 42 (7.5%) |
| $25,000 to $49,999 | 279 (58.0%) | 202 (42.0%) |
| $50,000 to $74,999 | 707 (98.6%) | 10 (1.4%) |
| $75,000 to $99,999 | 276 (59.7%) | 186 (40.3%) |
| $100,000 and over | 1,757 (96.6%) | 61 (3.4%) |
Public vs Private Health Insurance Coverage by Age in Shallotte
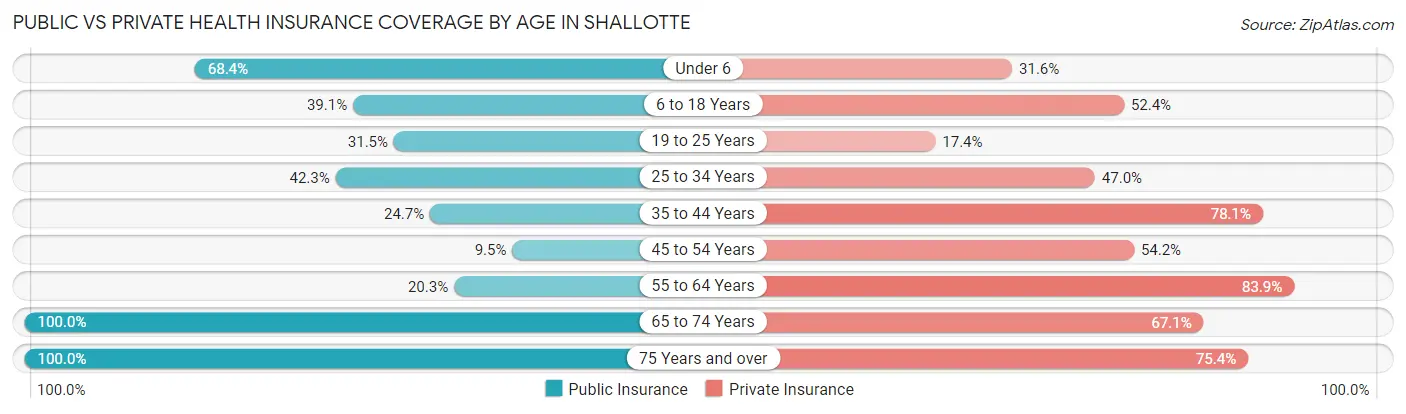
| Age Bracket | Public Insurance | Private Insurance |
| Under 6 | 225 (68.4%) | 104 (31.6%) |
| 6 to 18 Years | 173 (39.1%) | 232 (52.4%) |
| 19 to 25 Years | 67 (31.5%) | 37 (17.4%) |
| 25 to 34 Years | 126 (42.3%) | 140 (47.0%) |
| 35 to 44 Years | 164 (24.7%) | 518 (78.1%) |
| 45 to 54 Years | 47 (9.5%) | 269 (54.2%) |
| 55 to 64 Years | 134 (20.3%) | 554 (83.9%) |
| 65 to 74 Years | 569 (100.0%) | 382 (67.1%) |
| 75 Years and over | 382 (100.0%) | 288 (75.4%) |
| Total | 1,887 (46.6%) | 2,524 (62.3%) |
Disability Status by Sex by Age in Shallotte
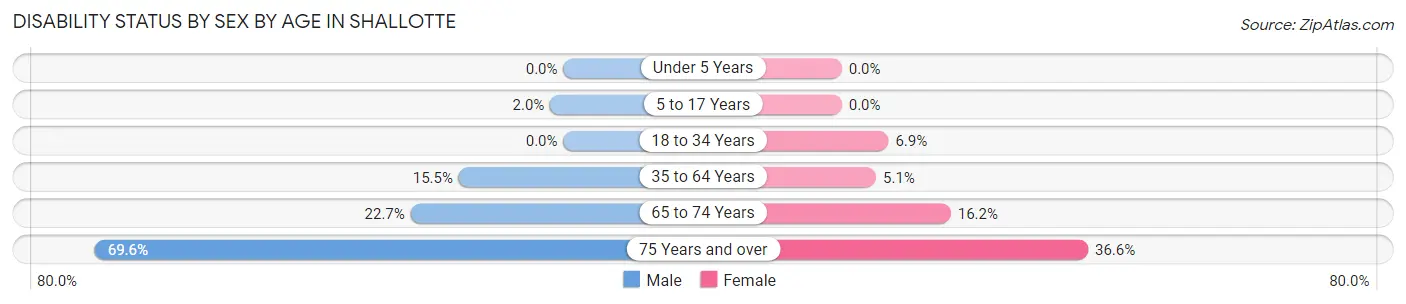
| Age Bracket | Male | Female |
| Under 5 Years | 0 (0.0%) | 0 (0.0%) |
| 5 to 17 Years | 4 (2.0%) | 0 (0.0%) |
| 18 to 34 Years | 0 (0.0%) | 23 (6.9%) |
| 35 to 64 Years | 127 (15.5%) | 51 (5.1%) |
| 65 to 74 Years | 66 (22.7%) | 45 (16.2%) |
| 75 Years and over | 144 (69.6%) | 64 (36.6%) |
Disability Class by Sex by Age in Shallotte
Disability Class: Hearing Difficulty
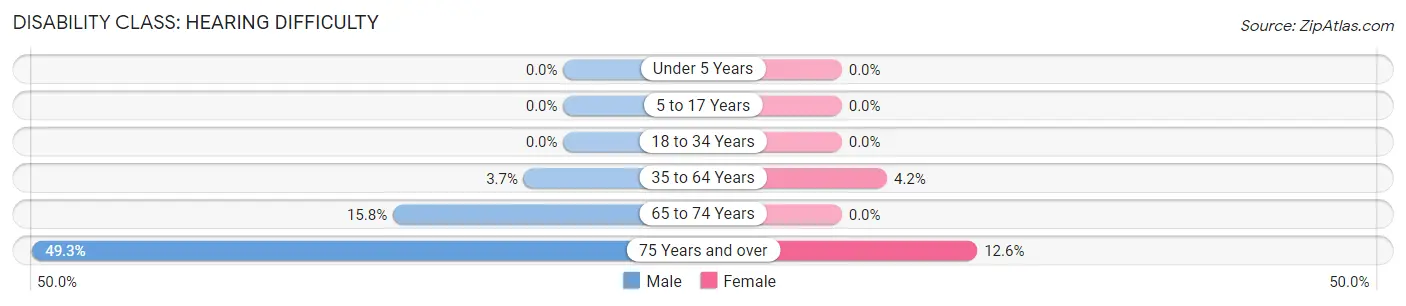
| Age Bracket | Male | Female |
| Under 5 Years | 0 (0.0%) | 0 (0.0%) |
| 5 to 17 Years | 0 (0.0%) | 0 (0.0%) |
| 18 to 34 Years | 0 (0.0%) | 0 (0.0%) |
| 35 to 64 Years | 30 (3.7%) | 42 (4.2%) |
| 65 to 74 Years | 46 (15.8%) | 0 (0.0%) |
| 75 Years and over | 102 (49.3%) | 22 (12.6%) |
Disability Class: Vision Difficulty
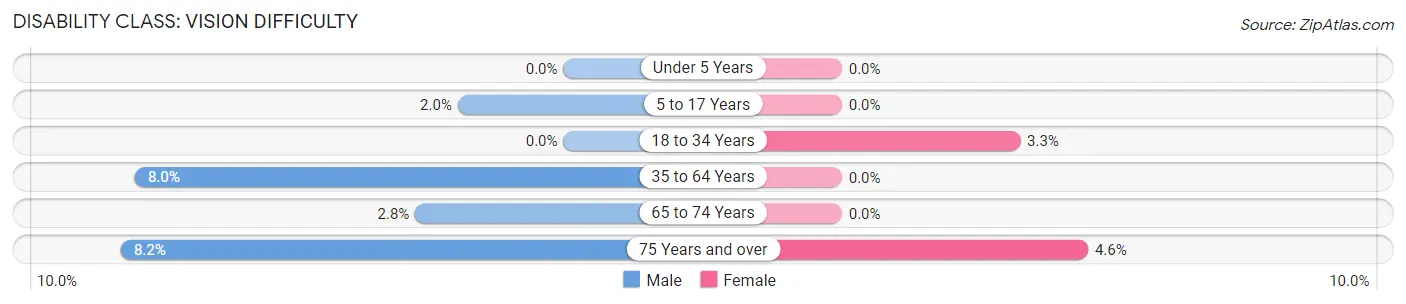
| Age Bracket | Male | Female |
| Under 5 Years | 0 (0.0%) | 0 (0.0%) |
| 5 to 17 Years | 4 (2.0%) | 0 (0.0%) |
| 18 to 34 Years | 0 (0.0%) | 11 (3.3%) |
| 35 to 64 Years | 65 (8.0%) | 0 (0.0%) |
| 65 to 74 Years | 8 (2.8%) | 0 (0.0%) |
| 75 Years and over | 17 (8.2%) | 8 (4.6%) |
Disability Class: Cognitive Difficulty
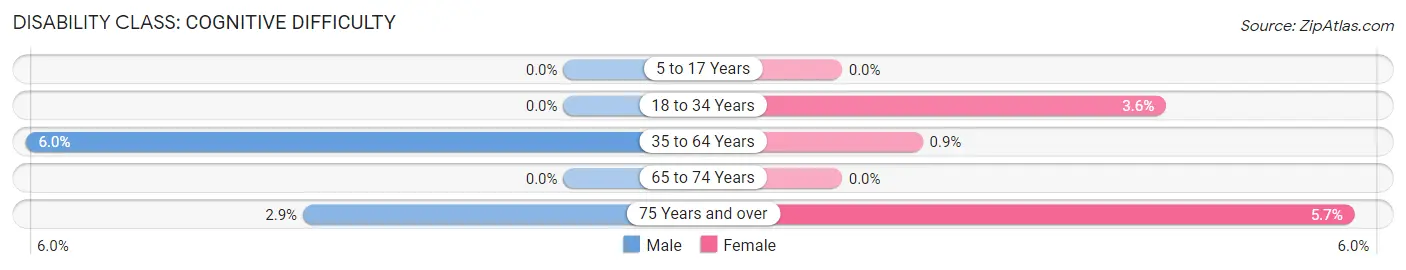
| Age Bracket | Male | Female |
| 5 to 17 Years | 0 (0.0%) | 0 (0.0%) |
| 18 to 34 Years | 0 (0.0%) | 12 (3.6%) |
| 35 to 64 Years | 49 (6.0%) | 9 (0.9%) |
| 65 to 74 Years | 0 (0.0%) | 0 (0.0%) |
| 75 Years and over | 6 (2.9%) | 10 (5.7%) |
Disability Class: Ambulatory Difficulty
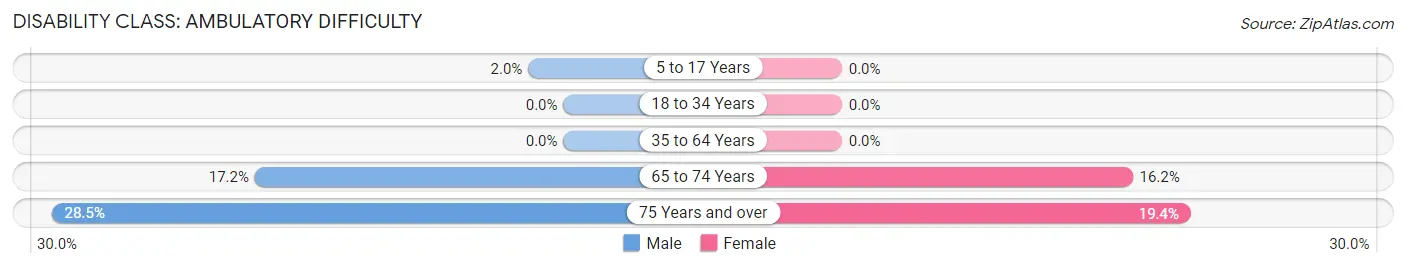
| Age Bracket | Male | Female |
| 5 to 17 Years | 4 (2.0%) | 0 (0.0%) |
| 18 to 34 Years | 0 (0.0%) | 0 (0.0%) |
| 35 to 64 Years | 0 (0.0%) | 0 (0.0%) |
| 65 to 74 Years | 50 (17.2%) | 45 (16.2%) |
| 75 Years and over | 59 (28.5%) | 34 (19.4%) |
Disability Class: Self-Care Difficulty
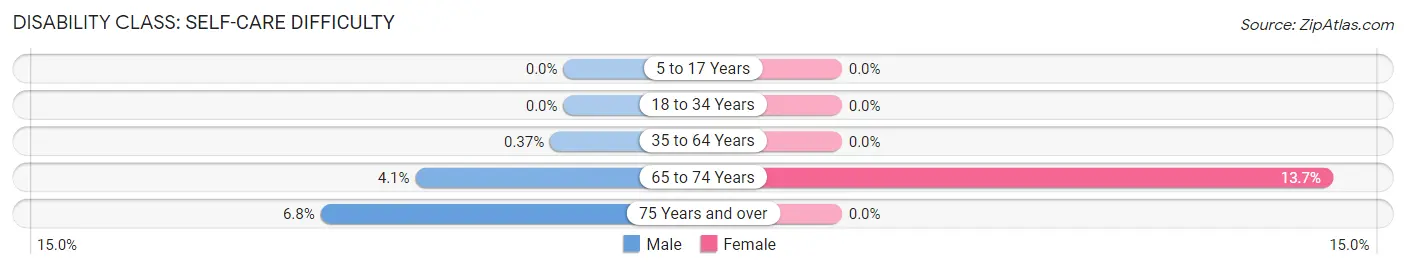
| Age Bracket | Male | Female |
| 5 to 17 Years | 0 (0.0%) | 0 (0.0%) |
| 18 to 34 Years | 0 (0.0%) | 0 (0.0%) |
| 35 to 64 Years | 3 (0.4%) | 0 (0.0%) |
| 65 to 74 Years | 12 (4.1%) | 38 (13.7%) |
| 75 Years and over | 14 (6.8%) | 0 (0.0%) |
Technology Access in Shallotte
Computing Device Access in Shallotte
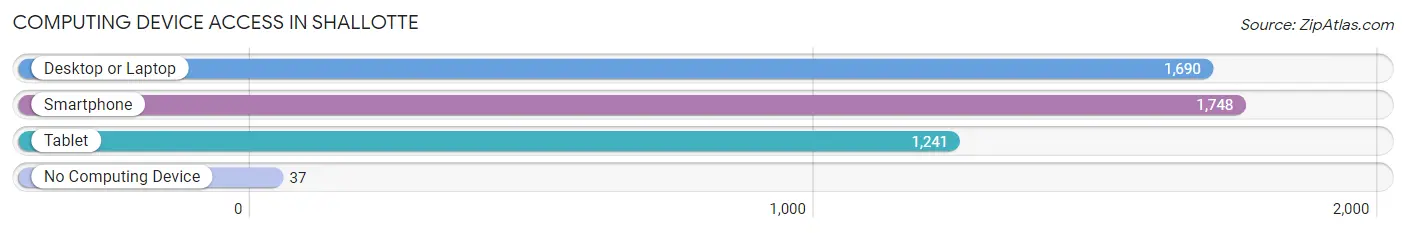
| Device Type | # Households | % Households |
| Desktop or Laptop | 1,690 | 88.8% |
| Smartphone | 1,748 | 91.8% |
| Tablet | 1,241 | 65.2% |
| No Computing Device | 37 | 1.9% |
| Total | 1,903 | 100.0% |
Internet Access in Shallotte
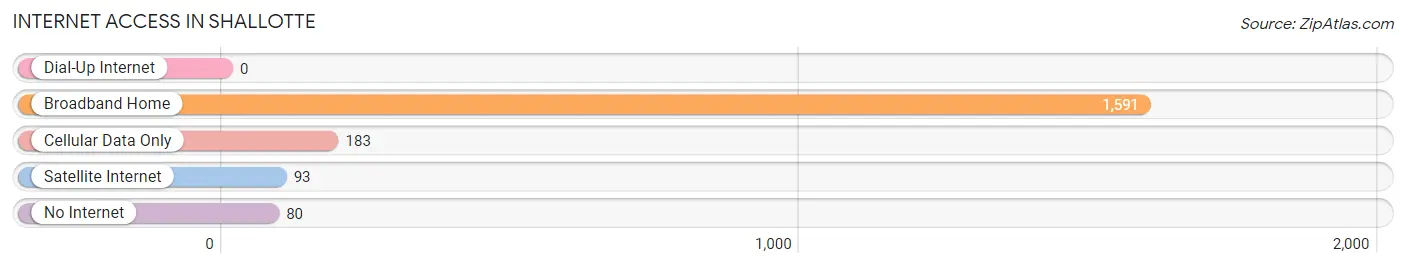
| Internet Type | # Households | % Households |
| Dial-Up Internet | 0 | 0.0% |
| Broadband Home | 1,591 | 83.6% |
| Cellular Data Only | 183 | 9.6% |
| Satellite Internet | 93 | 4.9% |
| No Internet | 80 | 4.2% |
| Total | 1,903 | 100.0% |
Shallotte Summary
Shallotte is a town located in Brunswick County, North Carolina, United States. It is situated along the Atlantic Ocean, approximately 30 miles south of Wilmington. The town was incorporated in 1899 and has a population of approximately 4,500 people.
Geography
Shallotte is located in the southeastern corner of Brunswick County, North Carolina, and is situated along the Atlantic Ocean. The town is bordered by the towns of Ocean Isle Beach to the north, Holden Beach to the south, and Sunset Beach to the east. Shallotte is located approximately 30 miles south of Wilmington and is part of the Wilmington Metropolitan Statistical Area. The town is situated on the Shallotte River, which flows into the Atlantic Ocean. Shallotte is located in a humid subtropical climate zone, with hot, humid summers and mild winters.
History
Shallotte was first settled in the late 1700s by a group of settlers from Scotland. The town was originally known as Shallotte Crossroads, and was named after the Shallotte River. The town was incorporated in 1899 and was originally a farming community. In the early 1900s, the town began to grow as a resort destination, and by the 1950s, it had become a popular beach destination.
Economy
Shallotte’s economy is largely based on tourism and retail. The town is home to several hotels, restaurants, and shops, as well as a variety of other businesses. The town is also home to a number of manufacturing companies, including a paper mill and a furniture factory. The town is also home to a number of agricultural businesses, including a number of farms and nurseries.
Demographics
As of the 2010 census, Shallotte had a population of 4,500 people. The racial makeup of the town was 79.2% White, 15.2% African American, 0.7% Native American, 0.7% Asian, 0.1% Pacific Islander, and 3.2% from other races. The median household income in Shallotte was $37,917, and the median family income was $45,917. The town’s population is largely made up of retirees, with a median age of 55.7 years.
Shallotte is a small town with a rich history and a vibrant economy. The town is a popular destination for tourists and retirees alike, and is home to a variety of businesses and industries. The town is also home to a diverse population, with a variety of racial and ethnic backgrounds. Shallotte is a great place to live, work, and play, and is sure to continue to grow and thrive in the years to come.
Common Questions
What is Per Capita Income in Shallotte?
Per Capita income in Shallotte is $42,745.
What is the Median Family Income in Shallotte?
Median Family Income in Shallotte is $85,284.
What is the Median Household income in Shallotte?
Median Household Income in Shallotte is $71,659.
What is Income or Wage Gap in Shallotte?
Income or Wage Gap in Shallotte is 9.0%.
Women in Shallotte earn 91.0 cents for every dollar earned by a man.
What is Inequality or Gini Index in Shallotte?
Inequality or Gini Index in Shallotte is 0.48.
What is the Total Population of Shallotte?
Total Population of Shallotte is 4,213.
What is the Total Male Population of Shallotte?
Total Male Population of Shallotte is 1,999.
What is the Total Female Population of Shallotte?
Total Female Population of Shallotte is 2,214.
What is the Ratio of Males per 100 Females in Shallotte?
There are 90.29 Males per 100 Females in Shallotte.
What is the Ratio of Females per 100 Males in Shallotte?
There are 110.76 Females per 100 Males in Shallotte.
What is the Median Population Age in Shallotte?
Median Population Age in Shallotte is 47.5 Years.
What is the Average Family Size in Shallotte
Average Family Size in Shallotte is 2.6 People.
What is the Average Household Size in Shallotte
Average Household Size in Shallotte is 2.1 People.
How Large is the Labor Force in Shallotte?
There are 2,085 People in the Labor Forcein in Shallotte.
What is the Percentage of People in the Labor Force in Shallotte?
57.6% of People are in the Labor Force in Shallotte.
What is the Unemployment Rate in Shallotte?
Unemployment Rate in Shallotte is 1.3%.