Mills River, NC Map & Demographics
Mills River Map
Mills River Overview
$38,303
PER CAPITA INCOME
$102,368
AVG FAMILY INCOME
$79,802
AVG HOUSEHOLD INCOME
37.1%
WAGE / INCOME GAP [ % ]
62.9¢/ $1
WAGE / INCOME GAP [ $ ]
$9,433
FAMILY INCOME DEFICIT
0.38
INEQUALITY / GINI INDEX
7,100
TOTAL POPULATION
3,554
MALE POPULATION
3,546
FEMALE POPULATION
100.23
MALES / 100 FEMALES
99.77
FEMALES / 100 MALES
43.5
MEDIAN AGE
3.1
AVG FAMILY SIZE
2.6
AVG HOUSEHOLD SIZE
3,630
LABOR FORCE [ PEOPLE ]
64.4%
PERCENT IN LABOR FORCE
5.2%
UNEMPLOYMENT RATE
Mills River Zip Codes
Mills River Area Codes
Income in Mills River
Income Overview in Mills River
Per Capita Income in Mills River is $38,303, while median incomes of families and households are $102,368 and $79,802 respectively.
| Characteristic | Number | Measure |
| Per Capita Income | 7,100 | $38,303 |
| Median Family Income | 1,946 | $102,368 |
| Mean Family Income | 1,946 | $114,822 |
| Median Household Income | 2,754 | $79,802 |
| Mean Household Income | 2,754 | $97,333 |
| Income Deficit | 1,946 | $9,433 |
| Wage / Income Gap (%) | 7,100 | 37.07% |
| Wage / Income Gap ($) | 7,100 | 62.93¢ per $1 |
| Gini / Inequality Index | 7,100 | 0.38 |
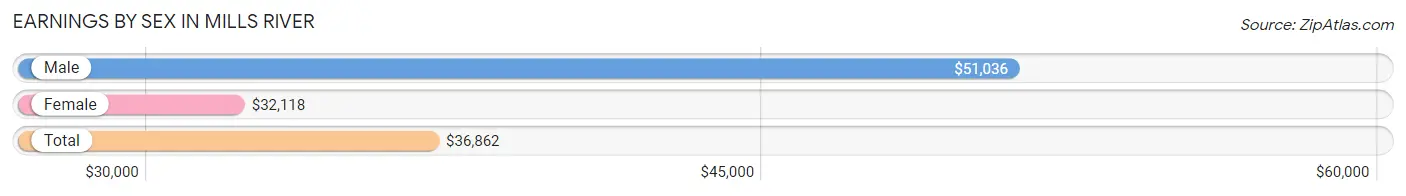
Earnings by Sex in Mills River
Average Earnings in Mills River are $36,862, $51,036 for men and $32,118 for women, a difference of 37.1%.
| Sex | Number | Average Earnings |
| Male | 1,966 (51.1%) | $51,036 |
| Female | 1,881 (48.9%) | $32,118 |
| Total | 3,847 (100.0%) | $36,862 |
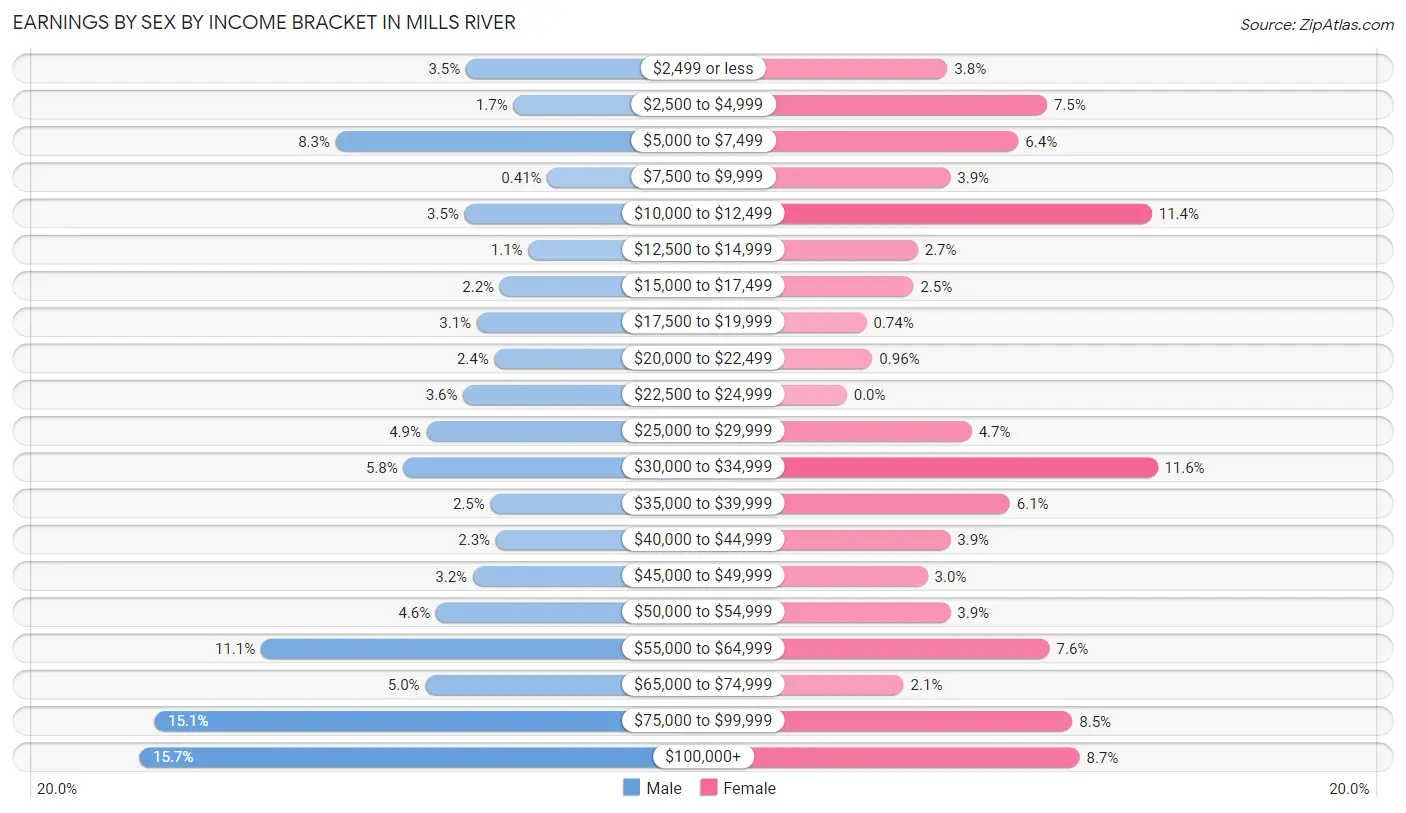
Earnings by Sex by Income Bracket in Mills River
The most common earnings brackets in Mills River are $100,000+ for men (308 | 15.7%) and $30,000 to $34,999 for women (219 | 11.6%).
| Income | Male | Female |
| $2,499 or less | 68 (3.5%) | 71 (3.8%) |
| $2,500 to $4,999 | 33 (1.7%) | 141 (7.5%) |
| $5,000 to $7,499 | 164 (8.3%) | 121 (6.4%) |
| $7,500 to $9,999 | 8 (0.4%) | 73 (3.9%) |
| $10,000 to $12,499 | 69 (3.5%) | 215 (11.4%) |
| $12,500 to $14,999 | 22 (1.1%) | 50 (2.7%) |
| $15,000 to $17,499 | 43 (2.2%) | 47 (2.5%) |
| $17,500 to $19,999 | 60 (3.0%) | 14 (0.7%) |
| $20,000 to $22,499 | 47 (2.4%) | 18 (1.0%) |
| $22,500 to $24,999 | 70 (3.6%) | 0 (0.0%) |
| $25,000 to $29,999 | 97 (4.9%) | 88 (4.7%) |
| $30,000 to $34,999 | 114 (5.8%) | 219 (11.6%) |
| $35,000 to $39,999 | 50 (2.5%) | 115 (6.1%) |
| $40,000 to $44,999 | 46 (2.3%) | 73 (3.9%) |
| $45,000 to $49,999 | 63 (3.2%) | 57 (3.0%) |
| $50,000 to $54,999 | 90 (4.6%) | 73 (3.9%) |
| $55,000 to $64,999 | 219 (11.1%) | 143 (7.6%) |
| $65,000 to $74,999 | 98 (5.0%) | 40 (2.1%) |
| $75,000 to $99,999 | 297 (15.1%) | 159 (8.5%) |
| $100,000+ | 308 (15.7%) | 164 (8.7%) |
| Total | 1,966 (100.0%) | 1,881 (100.0%) |
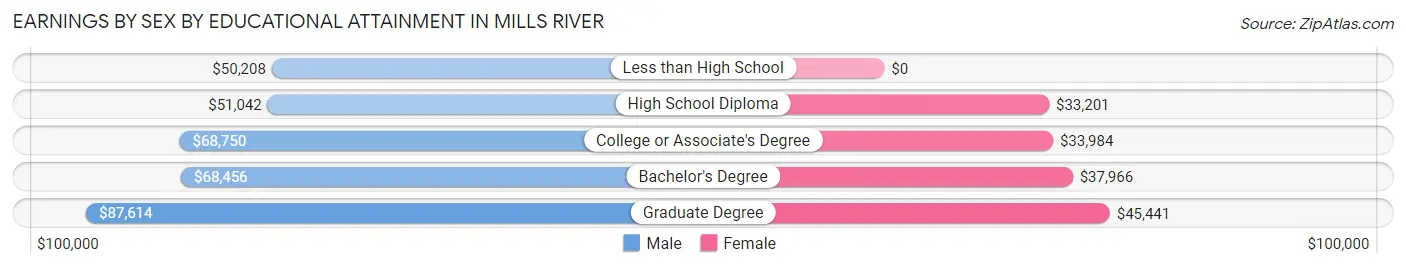
Earnings by Sex by Educational Attainment in Mills River
Average earnings in Mills River are $59,503 for men and $34,949 for women, a difference of 41.3%. Men with an educational attainment of graduate degree enjoy the highest average annual earnings of $87,614, while those with less than high school education earn the least with $50,208. Women with an educational attainment of graduate degree earn the most with the average annual earnings of $45,441, while those with high school diploma education have the smallest earnings of $33,201.
| Educational Attainment | Male Income | Female Income |
| Less than High School | $50,208 | $0 |
| High School Diploma | $51,042 | $33,201 |
| College or Associate's Degree | $68,750 | $33,984 |
| Bachelor's Degree | $68,456 | $37,966 |
| Graduate Degree | $87,614 | $45,441 |
| Total | $59,503 | $34,949 |
Family Income in Mills River
Family Income Brackets in Mills River
According to the Mills River family income data, there are 531 families falling into the $100,000 to $149,999 income range, which is the most common income bracket and makes up 27.3% of all families. Conversely, the $10,000 to $14,999 income bracket is the least frequent group with only 8 families (0.4%) belonging to this category.
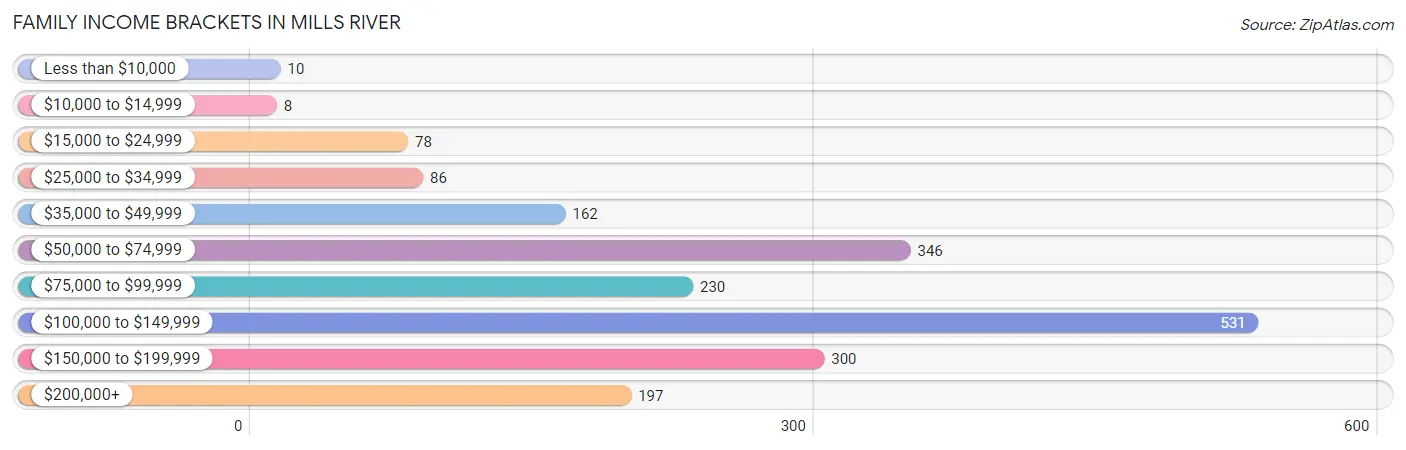
| Income Bracket | # Families | % Families |
| Less than $10,000 | 10 | 0.5% |
| $10,000 to $14,999 | 8 | 0.4% |
| $15,000 to $24,999 | 78 | 4.0% |
| $25,000 to $34,999 | 86 | 4.4% |
| $35,000 to $49,999 | 162 | 8.3% |
| $50,000 to $74,999 | 346 | 17.8% |
| $75,000 to $99,999 | 230 | 11.8% |
| $100,000 to $149,999 | 531 | 27.3% |
| $150,000 to $199,999 | 300 | 15.4% |
| $200,000+ | 197 | 10.1% |
Family Income by Famaliy Size in Mills River
5-person families (195 | 10.0%) account for the highest median family income in Mills River with $139,844 per family, while 2-person families (1,010 | 51.9%) have the highest median income of $42,708 per family member.
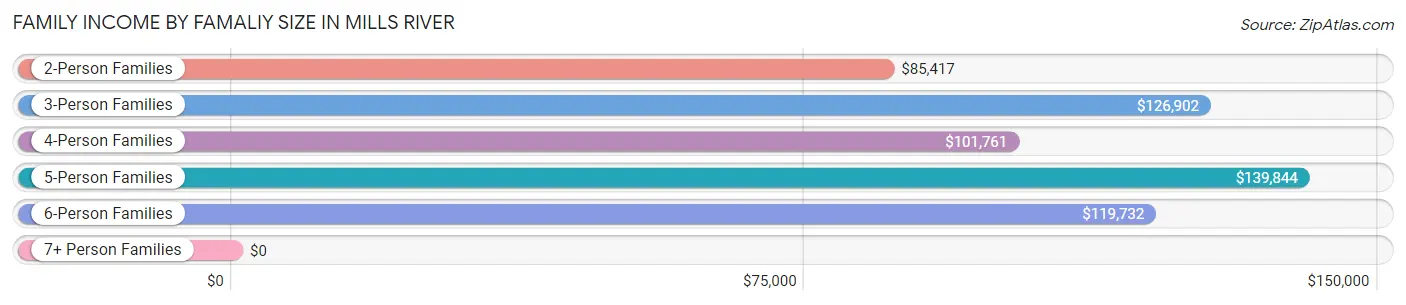
| Income Bracket | # Families | Median Income |
| 2-Person Families | 1,010 (51.9%) | $85,417 |
| 3-Person Families | 291 (14.9%) | $126,902 |
| 4-Person Families | 391 (20.1%) | $101,761 |
| 5-Person Families | 195 (10.0%) | $139,844 |
| 6-Person Families | 59 (3.0%) | $119,732 |
| 7+ Person Families | 0 (0.0%) | $0 |
| Total | 1,946 (100.0%) | $102,368 |
Family Income by Number of Earners in Mills River
The median family income in Mills River is $102,368, with families comprising 3+ earners (299) having the highest median family income of $136,587, while families with no earners (321) have the lowest median family income of $62,893, accounting for 15.4% and 16.5% of families, respectively.
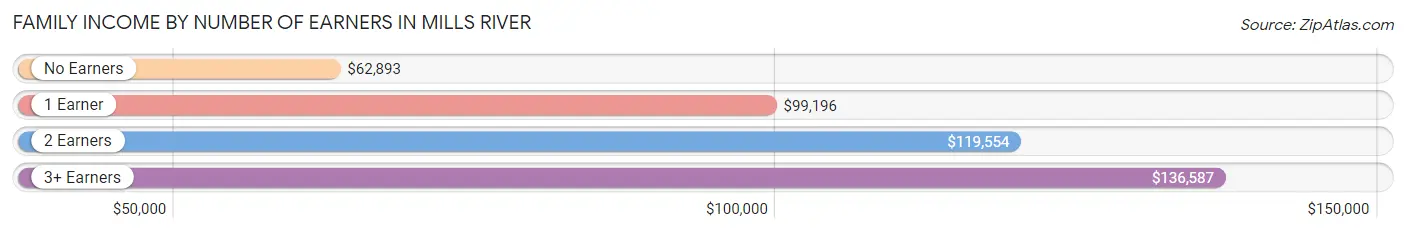
| Number of Earners | # Families | Median Income |
| No Earners | 321 (16.5%) | $62,893 |
| 1 Earner | 577 (29.6%) | $99,196 |
| 2 Earners | 749 (38.5%) | $119,554 |
| 3+ Earners | 299 (15.4%) | $136,587 |
| Total | 1,946 (100.0%) | $102,368 |
Household Income in Mills River
Household Income Brackets in Mills River
With 639 households falling in the category, the $100,000 to $149,999 income range is the most frequent in Mills River, accounting for 23.2% of all households. In contrast, only 25 households (0.9%) fall into the less than $10,000 income bracket, making it the least populous group.
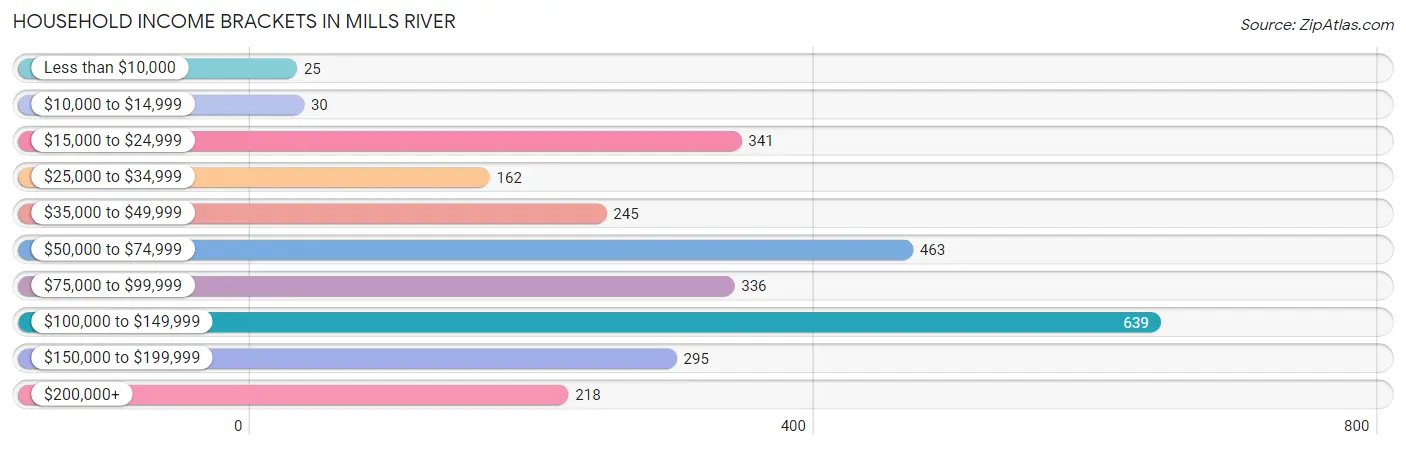
| Income Bracket | # Households | % Households |
| Less than $10,000 | 25 | 0.9% |
| $10,000 to $14,999 | 30 | 1.1% |
| $15,000 to $24,999 | 341 | 12.4% |
| $25,000 to $34,999 | 162 | 5.9% |
| $35,000 to $49,999 | 245 | 8.9% |
| $50,000 to $74,999 | 463 | 16.8% |
| $75,000 to $99,999 | 336 | 12.2% |
| $100,000 to $149,999 | 639 | 23.2% |
| $150,000 to $199,999 | 295 | 10.7% |
| $200,000+ | 218 | 7.9% |
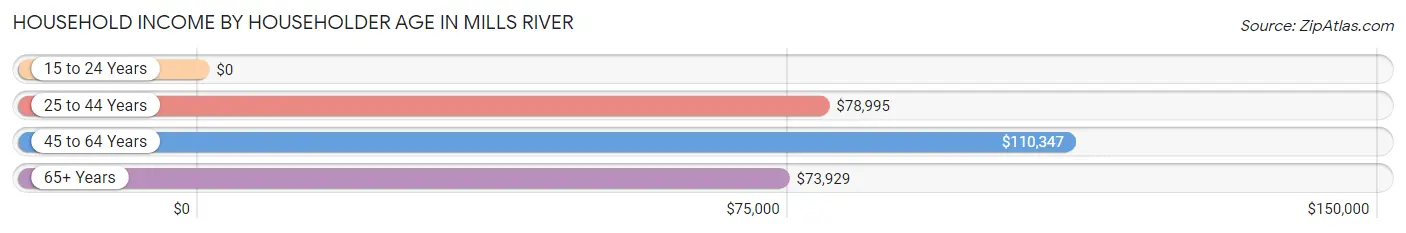
Household Income by Householder Age in Mills River
The median household income in Mills River is $79,802, with the highest median household income of $110,347 found in the 45 to 64 years age bracket for the primary householder. A total of 989 households (35.9%) fall into this category. Meanwhile, the 15 to 24 years age bracket for the primary householder has the lowest median household income of $0, with 26 households (0.9%) in this group.
| Income Bracket | # Households | Median Income |
| 15 to 24 Years | 26 (0.9%) | $0 |
| 25 to 44 Years | 735 (26.7%) | $78,995 |
| 45 to 64 Years | 989 (35.9%) | $110,347 |
| 65+ Years | 1,004 (36.5%) | $73,929 |
| Total | 2,754 (100.0%) | $79,802 |
Poverty in Mills River
Income Below Poverty by Sex and Age in Mills River
With 2.5% poverty level for males and 2.3% for females among the residents of Mills River, under 5 year old males and 25 to 34 year old females are the most vulnerable to poverty, with 20 males (12.5%) and 31 females (12.8%) in their respective age groups living below the poverty level.
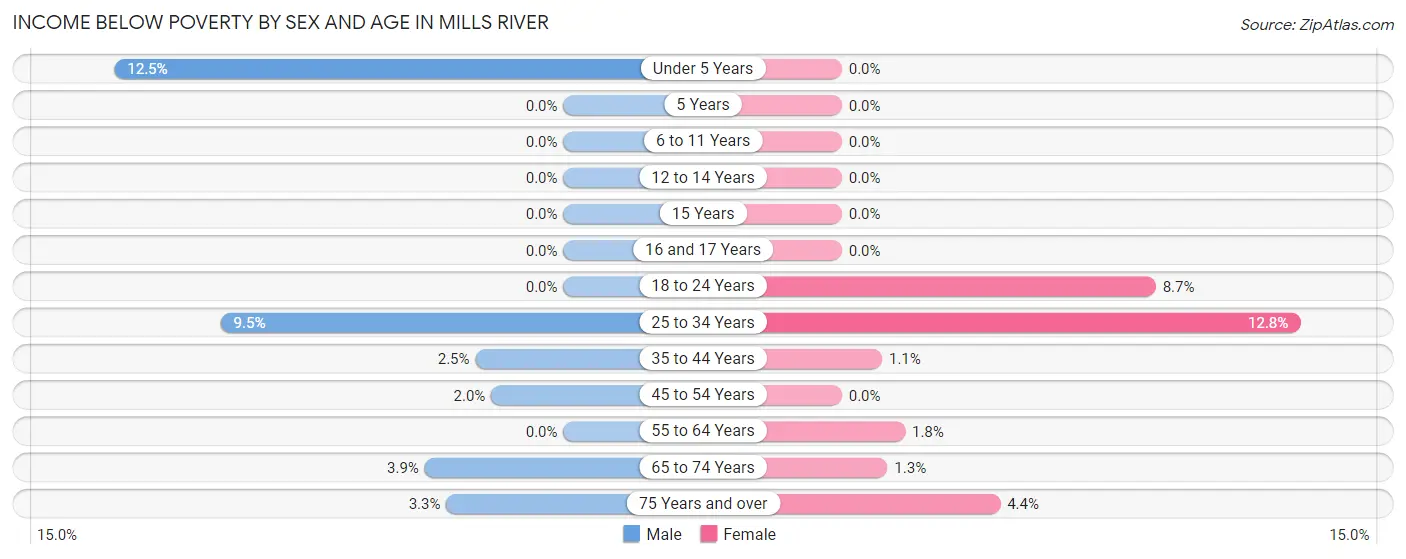
| Age Bracket | Male | Female |
| Under 5 Years | 20 (12.5%) | 0 (0.0%) |
| 5 Years | 0 (0.0%) | 0 (0.0%) |
| 6 to 11 Years | 0 (0.0%) | 0 (0.0%) |
| 12 to 14 Years | 0 (0.0%) | 0 (0.0%) |
| 15 Years | 0 (0.0%) | 0 (0.0%) |
| 16 and 17 Years | 0 (0.0%) | 0 (0.0%) |
| 18 to 24 Years | 0 (0.0%) | 16 (8.7%) |
| 25 to 34 Years | 27 (9.5%) | 31 (12.8%) |
| 35 to 44 Years | 9 (2.5%) | 6 (1.1%) |
| 45 to 54 Years | 7 (2.0%) | 0 (0.0%) |
| 55 to 64 Years | 0 (0.0%) | 7 (1.8%) |
| 65 to 74 Years | 20 (3.9%) | 8 (1.3%) |
| 75 Years and over | 7 (3.3%) | 12 (4.4%) |
| Total | 90 (2.5%) | 80 (2.3%) |
Income Above Poverty by Sex and Age in Mills River
According to the poverty statistics in Mills River, males aged 5 years and females aged under 5 years are the age groups that are most secure financially, with 100.0% of males and 100.0% of females in these age groups living above the poverty line.
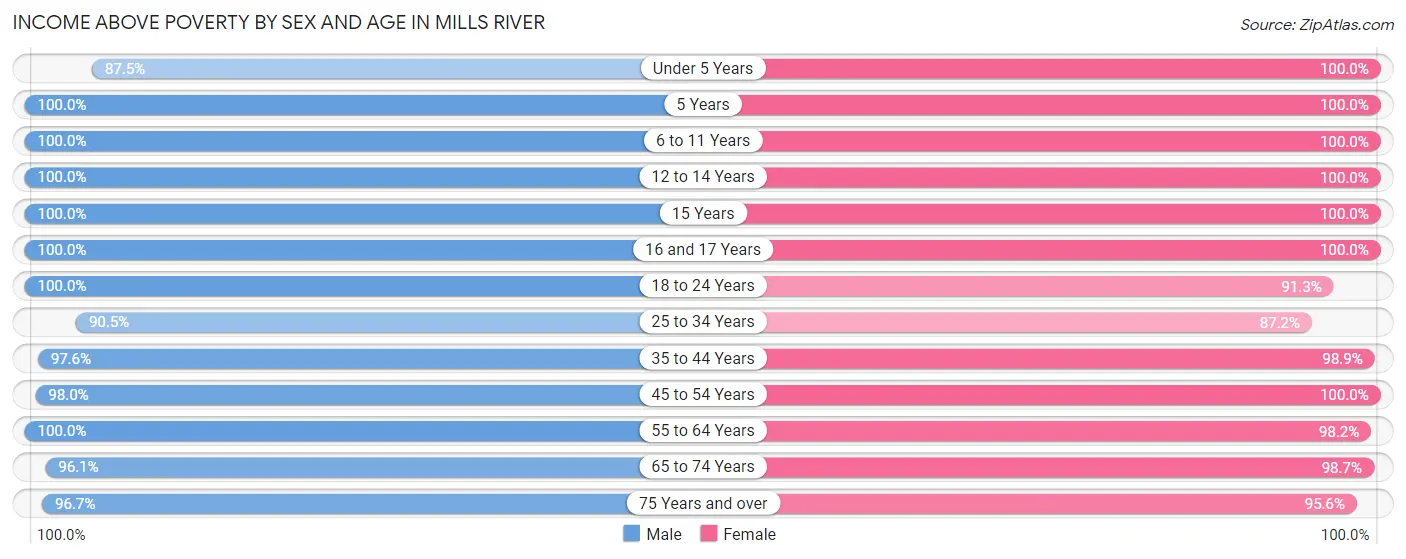
| Age Bracket | Male | Female |
| Under 5 Years | 140 (87.5%) | 176 (100.0%) |
| 5 Years | 25 (100.0%) | 21 (100.0%) |
| 6 to 11 Years | 365 (100.0%) | 195 (100.0%) |
| 12 to 14 Years | 133 (100.0%) | 152 (100.0%) |
| 15 Years | 172 (100.0%) | 64 (100.0%) |
| 16 and 17 Years | 149 (100.0%) | 119 (100.0%) |
| 18 to 24 Years | 324 (100.0%) | 167 (91.3%) |
| 25 to 34 Years | 256 (90.5%) | 212 (87.2%) |
| 35 to 44 Years | 358 (97.6%) | 528 (98.9%) |
| 45 to 54 Years | 341 (98.0%) | 559 (100.0%) |
| 55 to 64 Years | 495 (100.0%) | 390 (98.2%) |
| 65 to 74 Years | 498 (96.1%) | 623 (98.7%) |
| 75 Years and over | 208 (96.7%) | 260 (95.6%) |
| Total | 3,464 (97.5%) | 3,466 (97.7%) |
Income Below Poverty Among Married-Couple Families in Mills River
The poverty statistics for married-couple families in Mills River show that 2.0% or 33 of the total 1,651 families live below the poverty line. Families with 1 or 2 children have the highest poverty rate of 3.4%, comprising of 17 families. On the other hand, families with 3 or 4 children have the lowest poverty rate of 0.0%, which includes 0 families.
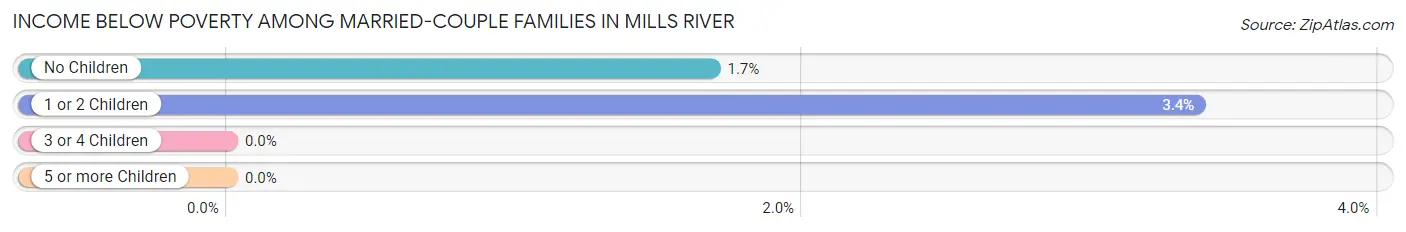
| Children | Above Poverty | Below Poverty |
| No Children | 934 (98.3%) | 16 (1.7%) |
| 1 or 2 Children | 487 (96.6%) | 17 (3.4%) |
| 3 or 4 Children | 197 (100.0%) | 0 (0.0%) |
| 5 or more Children | 0 (0.0%) | 0 (0.0%) |
| Total | 1,618 (98.0%) | 33 (2.0%) |
Income Below Poverty Among Single-Parent Households in Mills River
| Children | Single Father | Single Mother |
| No Children | 0 (0.0%) | 0 (0.0%) |
| 1 or 2 Children | 0 (0.0%) | 0 (0.0%) |
| 3 or 4 Children | 0 (0.0%) | 0 (0.0%) |
| 5 or more Children | 0 (0.0%) | 0 (0.0%) |
| Total | 0 (0.0%) | 0 (0.0%) |
Income Below Poverty Among Married-Couple vs Single-Parent Households in Mills River
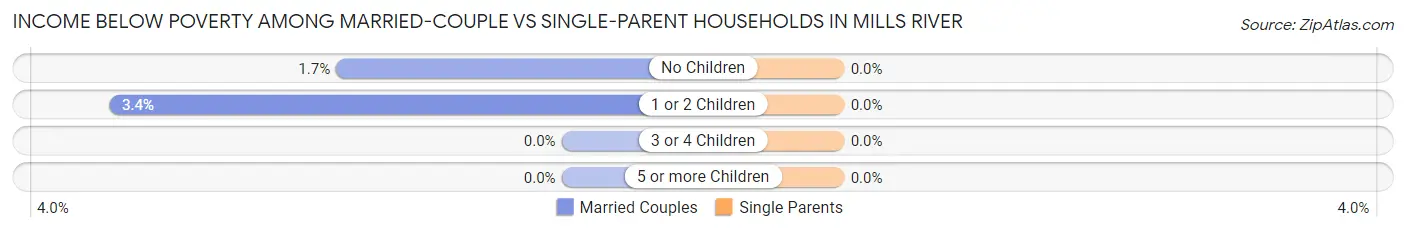
| Children | Married-Couple Families | Single-Parent Households |
| No Children | 16 (1.7%) | 0 (0.0%) |
| 1 or 2 Children | 17 (3.4%) | 0 (0.0%) |
| 3 or 4 Children | 0 (0.0%) | 0 (0.0%) |
| 5 or more Children | 0 (0.0%) | 0 (0.0%) |
| Total | 33 (2.0%) | 0 (0.0%) |
Race in Mills River
The most populous races in Mills River are White / Caucasian (6,216 | 87.5%), Asian (368 | 5.2%), and Hispanic or Latino (253 | 3.6%).
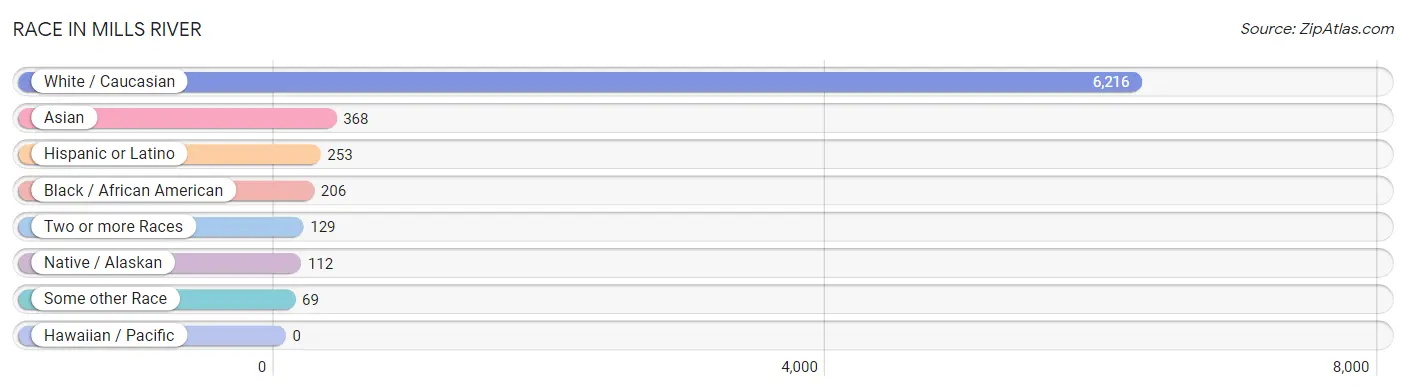
| Race | # Population | % Population |
| Asian | 368 | 5.2% |
| Black / African American | 206 | 2.9% |
| Hawaiian / Pacific | 0 | 0.0% |
| Hispanic or Latino | 253 | 3.6% |
| Native / Alaskan | 112 | 1.6% |
| White / Caucasian | 6,216 | 87.5% |
| Two or more Races | 129 | 1.8% |
| Some other Race | 69 | 1.0% |
| Total | 7,100 | 100.0% |
Ancestry in Mills River
The most populous ancestries reported in Mills River are German (1,382 | 19.5%), English (1,014 | 14.3%), Irish (963 | 13.6%), American (821 | 11.6%), and Italian (522 | 7.3%), together accounting for 66.2% of all Mills River residents.
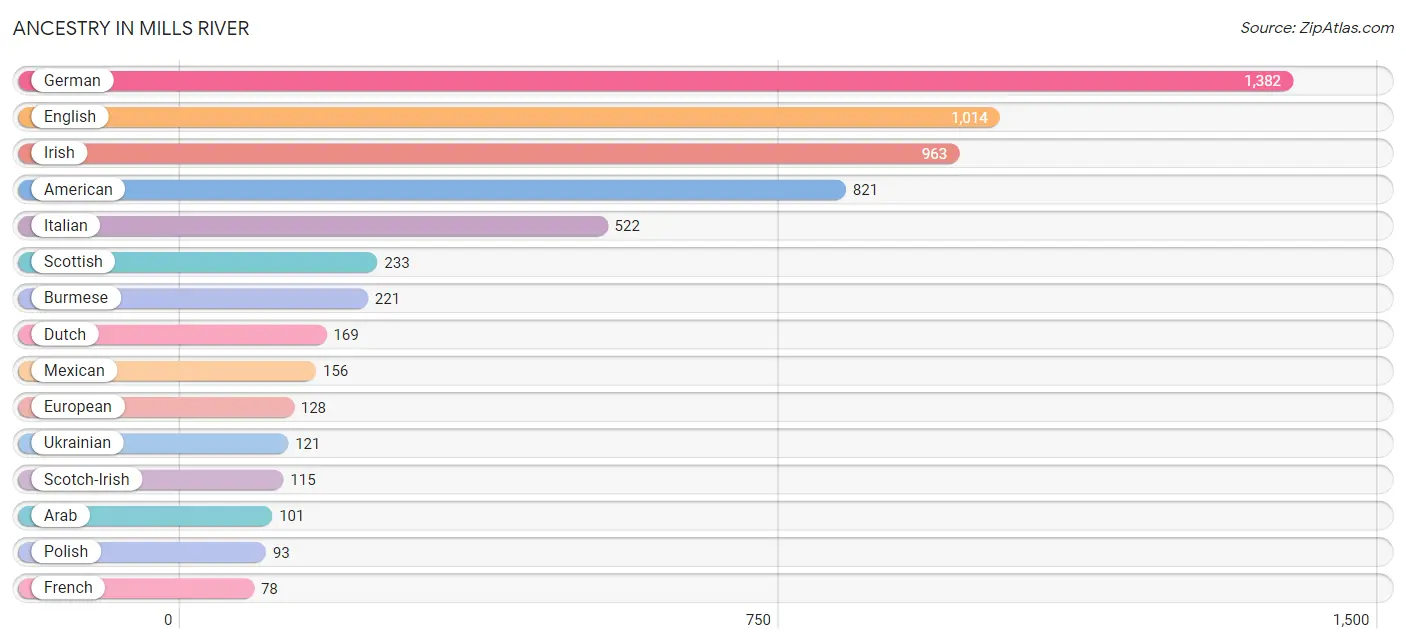
| Ancestry | # Population | % Population |
| American | 821 | 11.6% |
| Arab | 101 | 1.4% |
| Argentinean | 19 | 0.3% |
| Austrian | 40 | 0.6% |
| British | 74 | 1.0% |
| Burmese | 221 | 3.1% |
| Canadian | 18 | 0.3% |
| Central American | 34 | 0.5% |
| Cherokee | 4 | 0.1% |
| Colombian | 29 | 0.4% |
| Czech | 26 | 0.4% |
| Dominican | 14 | 0.2% |
| Dutch | 169 | 2.4% |
| Eastern European | 17 | 0.2% |
| English | 1,014 | 14.3% |
| European | 128 | 1.8% |
| French | 78 | 1.1% |
| French Canadian | 60 | 0.9% |
| German | 1,382 | 19.5% |
| Ghanaian | 44 | 0.6% |
| Greek | 17 | 0.2% |
| Guatemalan | 4 | 0.1% |
| Guyanese | 18 | 0.3% |
| Hungarian | 54 | 0.8% |
| Icelander | 25 | 0.4% |
| Indian (Asian) | 29 | 0.4% |
| Irish | 963 | 13.6% |
| Italian | 522 | 7.3% |
| Korean | 28 | 0.4% |
| Laotian | 38 | 0.5% |
| Lebanese | 37 | 0.5% |
| Lithuanian | 14 | 0.2% |
| Lumbee | 36 | 0.5% |
| Mexican | 156 | 2.2% |
| Norwegian | 8 | 0.1% |
| Panamanian | 30 | 0.4% |
| Polish | 93 | 1.3% |
| Portuguese | 15 | 0.2% |
| Romanian | 14 | 0.2% |
| Russian | 49 | 0.7% |
| Scandinavian | 11 | 0.2% |
| Scotch-Irish | 115 | 1.6% |
| Scottish | 233 | 3.3% |
| Shoshone | 53 | 0.7% |
| South American | 48 | 0.7% |
| Subsaharan African | 44 | 0.6% |
| Swedish | 34 | 0.5% |
| Swiss | 29 | 0.4% |
| Thai | 74 | 1.0% |
| Ukrainian | 121 | 1.7% |
| Welsh | 30 | 0.4% | View All 51 Rows |
Immigrants in Mills River
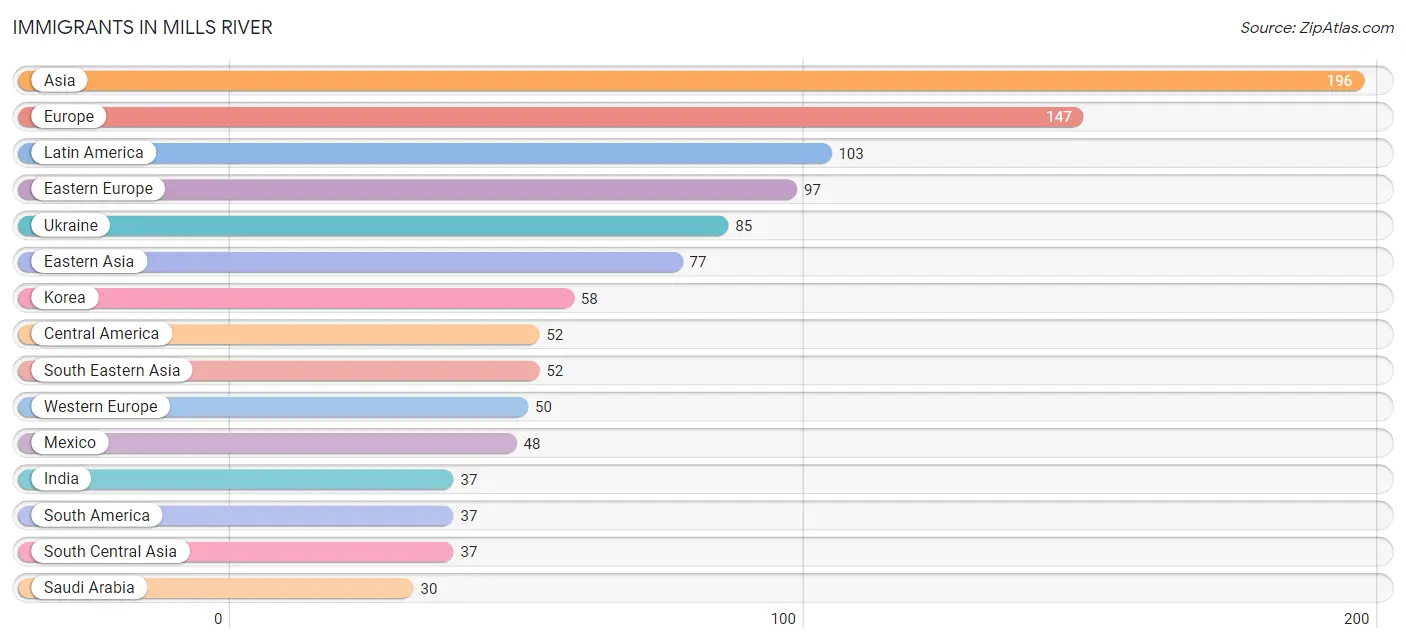
The most numerous immigrant groups reported in Mills River came from Asia (196 | 2.8%), Europe (147 | 2.1%), Latin America (103 | 1.5%), Eastern Europe (97 | 1.4%), and Ukraine (85 | 1.2%), together accounting for 8.8% of all Mills River residents.
| Immigration Origin | # Population | % Population |
| Africa | 17 | 0.2% |
| Argentina | 19 | 0.3% |
| Asia | 196 | 2.8% |
| Austria | 28 | 0.4% |
| Canada | 15 | 0.2% |
| Caribbean | 14 | 0.2% |
| Central America | 52 | 0.7% |
| China | 19 | 0.3% |
| Dominican Republic | 14 | 0.2% |
| Eastern Asia | 77 | 1.1% |
| Eastern Europe | 97 | 1.4% |
| Europe | 147 | 2.1% |
| Germany | 16 | 0.2% |
| Ghana | 17 | 0.2% |
| Guatemala | 4 | 0.1% |
| Guyana | 18 | 0.3% |
| India | 37 | 0.5% |
| Indonesia | 14 | 0.2% |
| Korea | 58 | 0.8% |
| Latin America | 103 | 1.5% |
| Mexico | 48 | 0.7% |
| Netherlands | 6 | 0.1% |
| Philippines | 28 | 0.4% |
| Poland | 12 | 0.2% |
| Saudi Arabia | 30 | 0.4% |
| South America | 37 | 0.5% |
| South Central Asia | 37 | 0.5% |
| South Eastern Asia | 52 | 0.7% |
| Thailand | 10 | 0.1% |
| Ukraine | 85 | 1.2% |
| Western Africa | 17 | 0.2% |
| Western Asia | 30 | 0.4% |
| Western Europe | 50 | 0.7% | View All 33 Rows |
Sex and Age in Mills River
Sex and Age in Mills River
The most populous age groups in Mills River are 15 to 19 Years (484 | 13.6%) for men and 35 to 39 Years (394 | 11.1%) for women.

| Age Bracket | Male | Female |
| Under 5 Years | 160 (4.5%) | 176 (5.0%) |
| 5 to 9 Years | 193 (5.4%) | 128 (3.6%) |
| 10 to 14 Years | 330 (9.3%) | 240 (6.8%) |
| 15 to 19 Years | 484 (13.6%) | 220 (6.2%) |
| 20 to 24 Years | 161 (4.5%) | 146 (4.1%) |
| 25 to 29 Years | 118 (3.3%) | 55 (1.5%) |
| 30 to 34 Years | 165 (4.6%) | 188 (5.3%) |
| 35 to 39 Years | 187 (5.3%) | 394 (11.1%) |
| 40 to 44 Years | 180 (5.1%) | 140 (4.0%) |
| 45 to 49 Years | 216 (6.1%) | 345 (9.7%) |
| 50 to 54 Years | 132 (3.7%) | 214 (6.0%) |
| 55 to 59 Years | 297 (8.4%) | 265 (7.5%) |
| 60 to 64 Years | 198 (5.6%) | 132 (3.7%) |
| 65 to 69 Years | 272 (7.6%) | 384 (10.8%) |
| 70 to 74 Years | 246 (6.9%) | 247 (7.0%) |
| 75 to 79 Years | 80 (2.2%) | 119 (3.4%) |
| 80 to 84 Years | 101 (2.8%) | 96 (2.7%) |
| 85 Years and over | 34 (1.0%) | 57 (1.6%) |
| Total | 3,554 (100.0%) | 3,546 (100.0%) |
Families and Households in Mills River
Median Family Size in Mills River
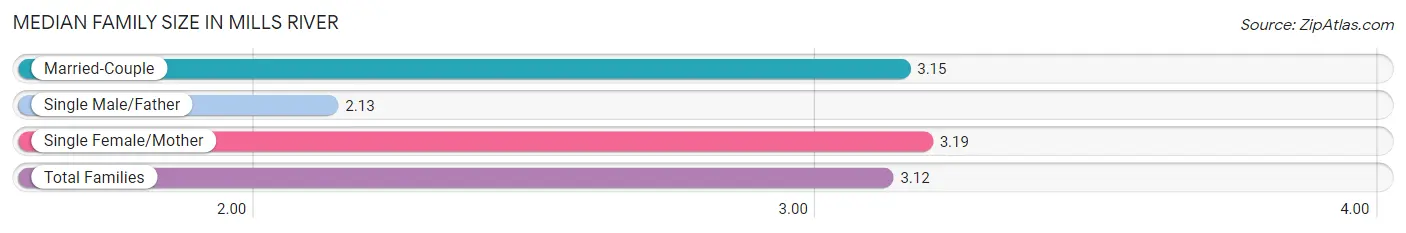
The median family size in Mills River is 3.12 persons per family, with single female/mother families (233 | 12.0%) accounting for the largest median family size of 3.19 persons per family. On the other hand, single male/father families (62 | 3.2%) represent the smallest median family size with 2.13 persons per family.
| Family Type | # Families | Family Size |
| Married-Couple | 1,651 (84.8%) | 3.15 |
| Single Male/Father | 62 (3.2%) | 2.13 |
| Single Female/Mother | 233 (12.0%) | 3.19 |
| Total Families | 1,946 (100.0%) | 3.12 |
Median Household Size in Mills River
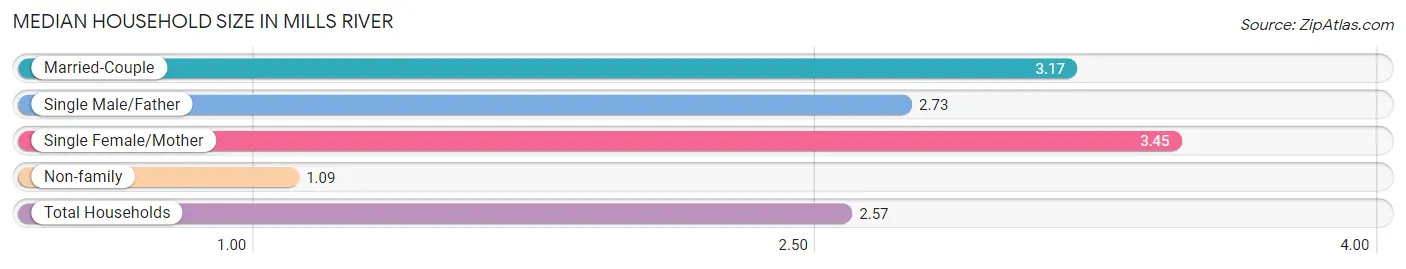
The median household size in Mills River is 2.57 persons per household, with single female/mother households (233 | 8.5%) accounting for the largest median household size of 3.45 persons per household. non-family households (808 | 29.3%) represent the smallest median household size with 1.09 persons per household.
| Household Type | # Households | Household Size |
| Married-Couple | 1,651 (60.0%) | 3.17 |
| Single Male/Father | 62 (2.2%) | 2.73 |
| Single Female/Mother | 233 (8.5%) | 3.45 |
| Non-family | 808 (29.3%) | 1.09 |
| Total Households | 2,754 (100.0%) | 2.57 |
Household Size by Marriage Status in Mills River
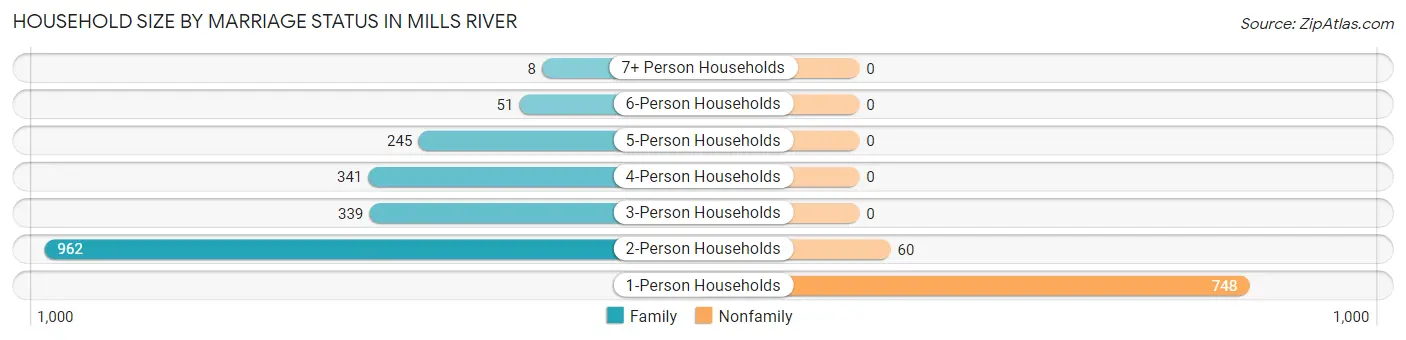
Out of a total of 2,754 households in Mills River, 1,946 (70.7%) are family households, while 808 (29.3%) are nonfamily households. The most numerous type of family households are 2-person households, comprising 962, and the most common type of nonfamily households are 1-person households, comprising 748.
| Household Size | Family Households | Nonfamily Households |
| 1-Person Households | - | 748 (27.2%) |
| 2-Person Households | 962 (34.9%) | 60 (2.2%) |
| 3-Person Households | 339 (12.3%) | 0 (0.0%) |
| 4-Person Households | 341 (12.4%) | 0 (0.0%) |
| 5-Person Households | 245 (8.9%) | 0 (0.0%) |
| 6-Person Households | 51 (1.8%) | 0 (0.0%) |
| 7+ Person Households | 8 (0.3%) | 0 (0.0%) |
| Total | 1,946 (70.7%) | 808 (29.3%) |
Female Fertility in Mills River
Fertility by Age in Mills River
Average fertility rate in Mills River is 84.0 births per 1,000 women. Women in the age bracket of 20 to 34 years have the highest fertility rate with 118.0 births per 1,000 women. Women in the age bracket of 35 to 50 years acount for 65.1% of all women with births.
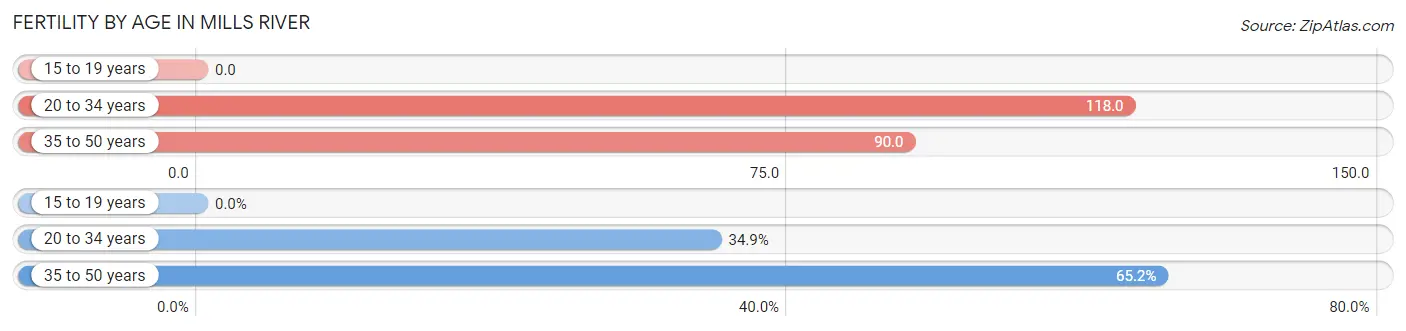
| Age Bracket | Women with Births | Births / 1,000 Women |
| 15 to 19 years | 0 (0.0%) | 0.0 |
| 20 to 34 years | 46 (34.8%) | 118.0 |
| 35 to 50 years | 86 (65.1%) | 90.0 |
| Total | 132 (100.0%) | 84.0 |
Fertility by Age by Marriage Status in Mills River
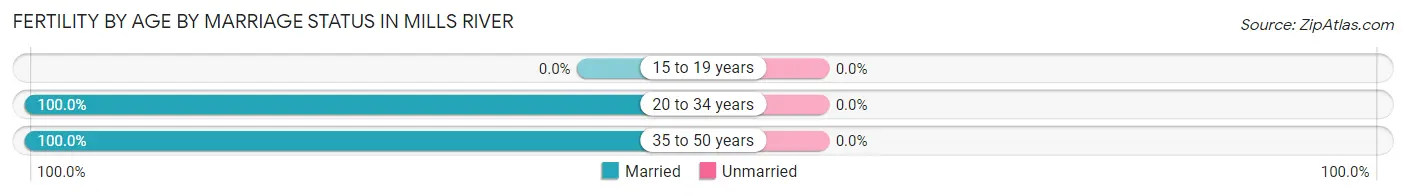
| Age Bracket | Married | Unmarried |
| 15 to 19 years | 0 (0.0%) | 0 (0.0%) |
| 20 to 34 years | 46 (100.0%) | 0 (0.0%) |
| 35 to 50 years | 86 (100.0%) | 0 (0.0%) |
| Total | 132 (100.0%) | 0 (0.0%) |
Fertility by Education in Mills River
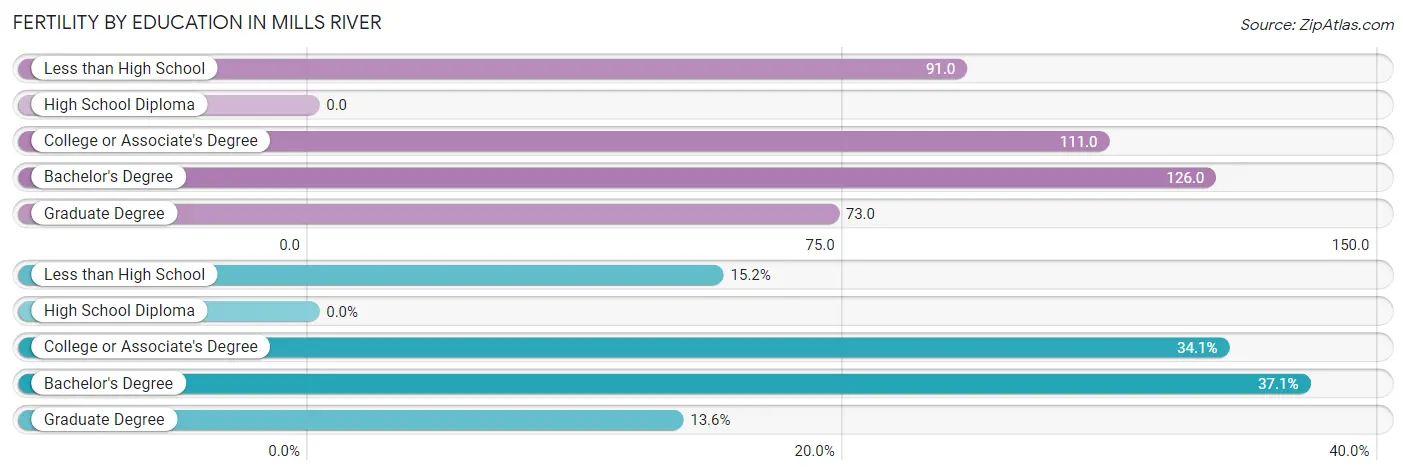
| Educational Attainment | Women with Births | Births / 1,000 Women |
| Less than High School | 20 (15.1%) | 91.0 |
| High School Diploma | 0 (0.0%) | 0.0 |
| College or Associate's Degree | 45 (34.1%) | 111.0 |
| Bachelor's Degree | 49 (37.1%) | 126.0 |
| Graduate Degree | 18 (13.6%) | 73.0 |
| Total | 132 (100.0%) | 84.0 |
Fertility by Education by Marriage Status in Mills River
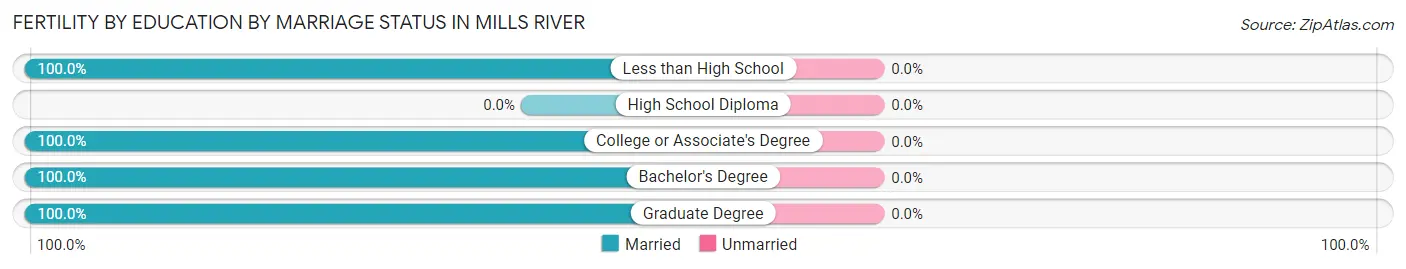
| Educational Attainment | Married | Unmarried |
| Less than High School | 20 (100.0%) | 0 (0.0%) |
| High School Diploma | 0 (0.0%) | 0 (0.0%) |
| College or Associate's Degree | 45 (100.0%) | 0 (0.0%) |
| Bachelor's Degree | 49 (100.0%) | 0 (0.0%) |
| Graduate Degree | 18 (100.0%) | 0 (0.0%) |
| Total | 132 (100.0%) | 0 (0.0%) |
Employment Characteristics in Mills River
Employment by Class of Employer in Mills River
Among the 3,367 employed individuals in Mills River, private company employees (2,199 | 65.3%), not-for-profit organizations (270 | 8.0%), and self-employed (not incorporated) (254 | 7.5%) make up the most common classes of employment.
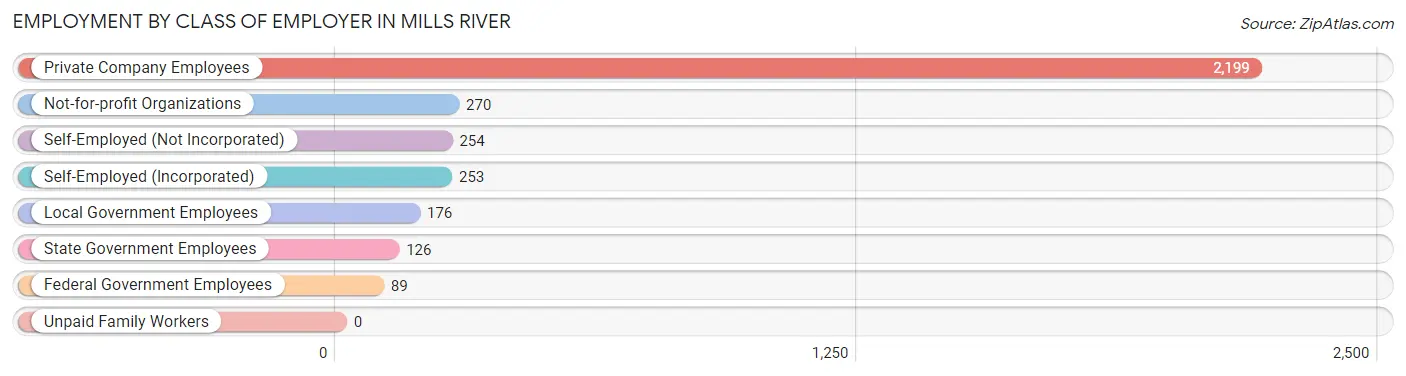
| Employer Class | # Employees | % Employees |
| Private Company Employees | 2,199 | 65.3% |
| Self-Employed (Incorporated) | 253 | 7.5% |
| Self-Employed (Not Incorporated) | 254 | 7.5% |
| Not-for-profit Organizations | 270 | 8.0% |
| Local Government Employees | 176 | 5.2% |
| State Government Employees | 126 | 3.7% |
| Federal Government Employees | 89 | 2.6% |
| Unpaid Family Workers | 0 | 0.0% |
| Total | 3,367 | 100.0% |
Employment Status by Age in Mills River
According to the labor force statistics for Mills River, out of the total population over 16 years of age (5,637), 64.4% or 3,630 individuals are in the labor force, with 5.2% or 189 of them unemployed. The age group with the highest labor force participation rate is 25 to 29 years, with 91.9% or 159 individuals in the labor force. Within the labor force, the 75 years and over age range has the highest percentage of unemployed individuals, with 22.2% or 8 of them being unemployed.
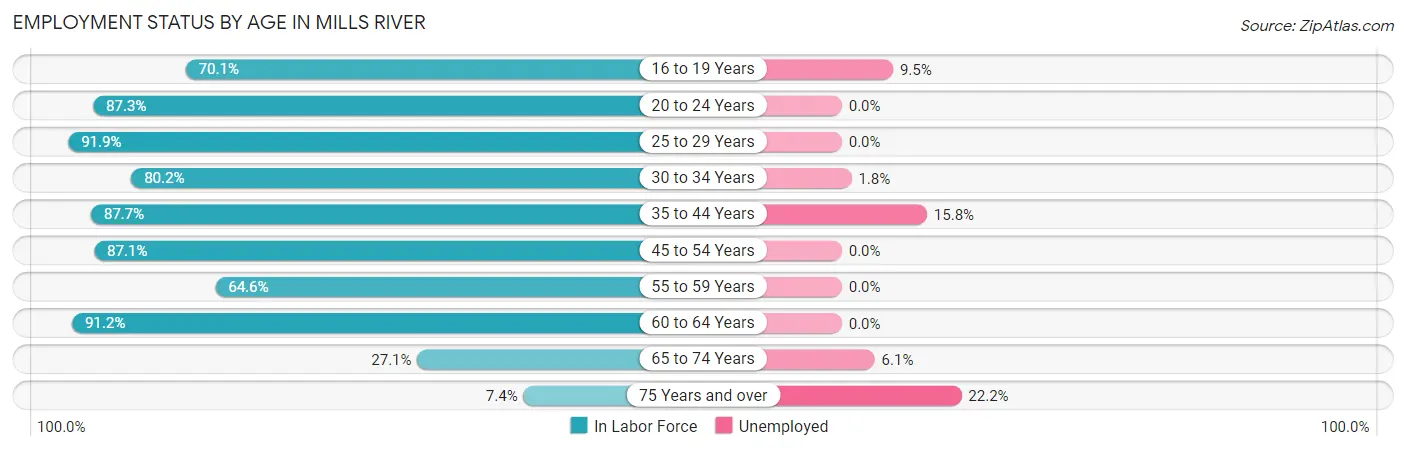
| Age Bracket | In Labor Force | Unemployed |
| 16 to 19 Years | 328 (70.1%) | 31 (9.5%) |
| 20 to 24 Years | 268 (87.3%) | 0 (0.0%) |
| 25 to 29 Years | 159 (91.9%) | 0 (0.0%) |
| 30 to 34 Years | 283 (80.2%) | 5 (1.8%) |
| 35 to 44 Years | 790 (87.7%) | 125 (15.8%) |
| 45 to 54 Years | 790 (87.1%) | 0 (0.0%) |
| 55 to 59 Years | 363 (64.6%) | 0 (0.0%) |
| 60 to 64 Years | 301 (91.2%) | 0 (0.0%) |
| 65 to 74 Years | 311 (27.1%) | 19 (6.1%) |
| 75 Years and over | 36 (7.4%) | 8 (22.2%) |
| Total | 3,630 (64.4%) | 189 (5.2%) |
Employment Status by Educational Attainment in Mills River
According to labor force statistics for Mills River, 83.3% of individuals (2,687) out of the total population between 25 and 64 years of age (3,226) are in the labor force, with 4.8% or 129 of them being unemployed. The group with the highest labor force participation rate are those with the educational attainment of college / associate degree, with 86.6% or 828 individuals in the labor force. Within the labor force, individuals with bachelor's degree or higher education have the highest percentage of unemployment, with 10.4% or 125 of them being unemployed.
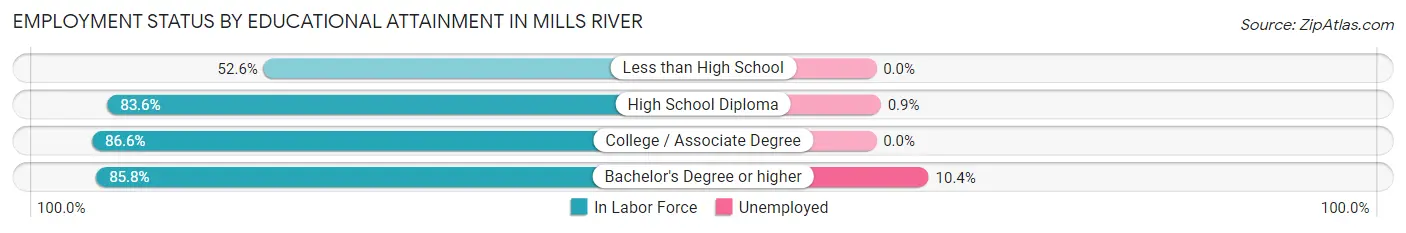
| Educational Attainment | In Labor Force | Unemployed |
| Less than High School | 120 (52.6%) | 0 (0.0%) |
| High School Diploma | 539 (83.6%) | 6 (0.9%) |
| College / Associate Degree | 828 (86.6%) | 0 (0.0%) |
| Bachelor's Degree or higher | 1,199 (85.8%) | 145 (10.4%) |
| Total | 2,687 (83.3%) | 155 (4.8%) |
Employment Occupations by Sex in Mills River
Management, Business, Science and Arts Occupations
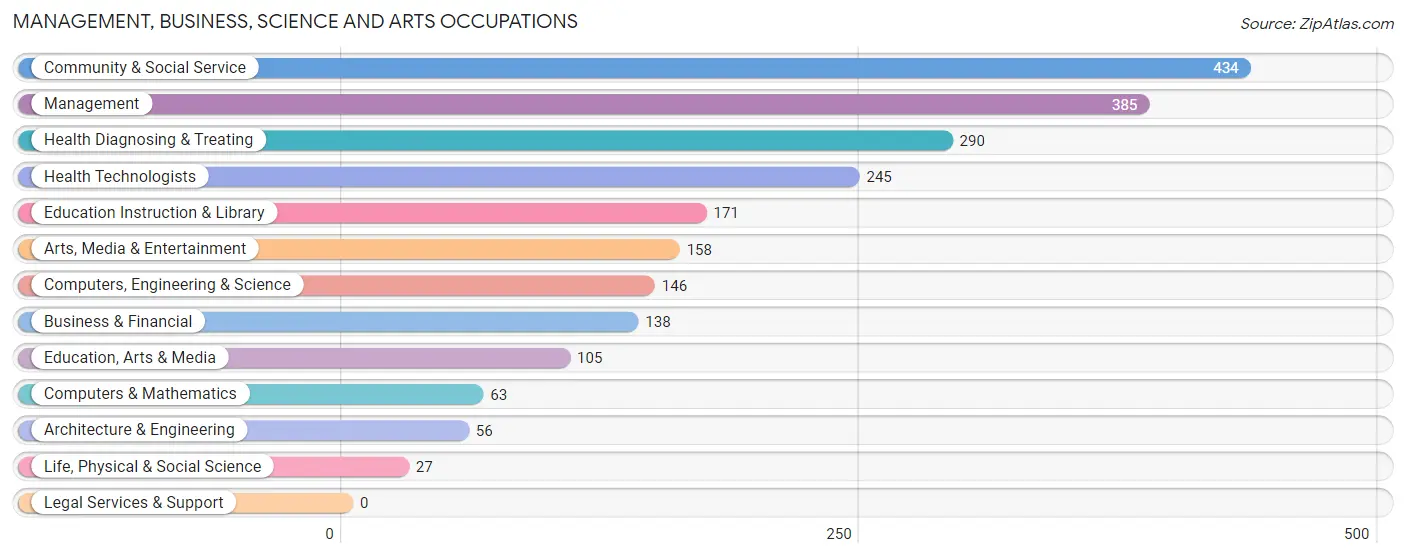
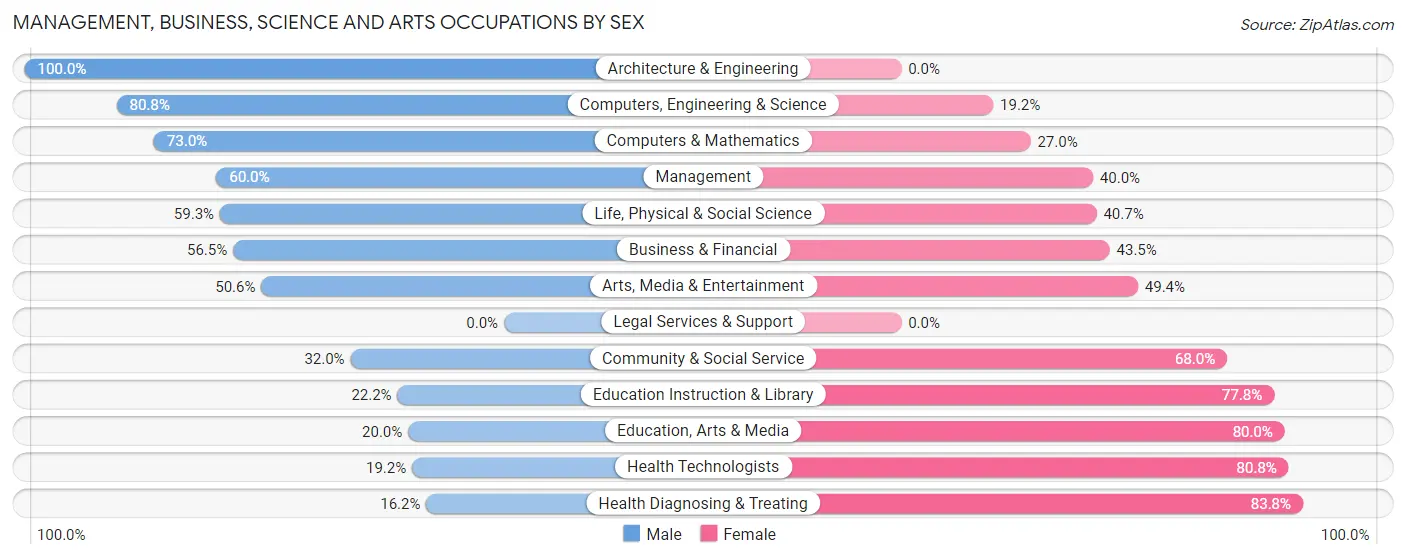
The most common Management, Business, Science and Arts occupations in Mills River are Community & Social Service (434 | 12.6%), Management (385 | 11.2%), Health Diagnosing & Treating (290 | 8.4%), Health Technologists (245 | 7.1%), and Education Instruction & Library (171 | 5.0%).
Management, Business, Science and Arts Occupations by Sex
Within the Management, Business, Science and Arts occupations in Mills River, the most male-oriented occupations are Architecture & Engineering (100.0%), Computers, Engineering & Science (80.8%), and Computers & Mathematics (73.0%), while the most female-oriented occupations are Health Diagnosing & Treating (83.8%), Health Technologists (80.8%), and Education, Arts & Media (80.0%).
| Occupation | Male | Female |
| Management | 231 (60.0%) | 154 (40.0%) |
| Business & Financial | 78 (56.5%) | 60 (43.5%) |
| Computers, Engineering & Science | 118 (80.8%) | 28 (19.2%) |
| Computers & Mathematics | 46 (73.0%) | 17 (27.0%) |
| Architecture & Engineering | 56 (100.0%) | 0 (0.0%) |
| Life, Physical & Social Science | 16 (59.3%) | 11 (40.7%) |
| Community & Social Service | 139 (32.0%) | 295 (68.0%) |
| Education, Arts & Media | 21 (20.0%) | 84 (80.0%) |
| Legal Services & Support | 0 (0.0%) | 0 (0.0%) |
| Education Instruction & Library | 38 (22.2%) | 133 (77.8%) |
| Arts, Media & Entertainment | 80 (50.6%) | 78 (49.4%) |
| Health Diagnosing & Treating | 47 (16.2%) | 243 (83.8%) |
| Health Technologists | 47 (19.2%) | 198 (80.8%) |
| Total (Category) | 613 (44.0%) | 780 (56.0%) |
| Total (Overall) | 1,831 (53.2%) | 1,610 (46.8%) |
Services Occupations
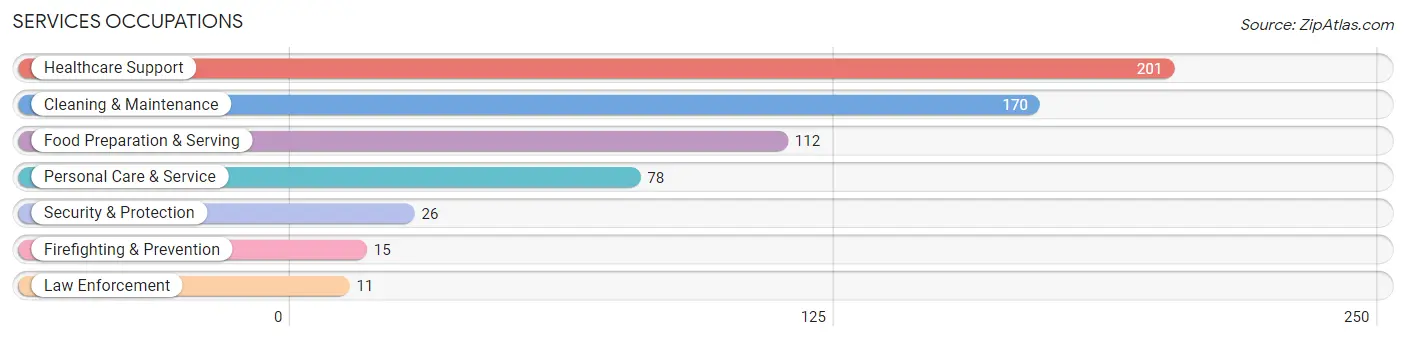
The most common Services occupations in Mills River are Healthcare Support (201 | 5.8%), Cleaning & Maintenance (170 | 4.9%), Food Preparation & Serving (112 | 3.3%), Personal Care & Service (78 | 2.3%), and Security & Protection (26 | 0.8%).
Services Occupations by Sex
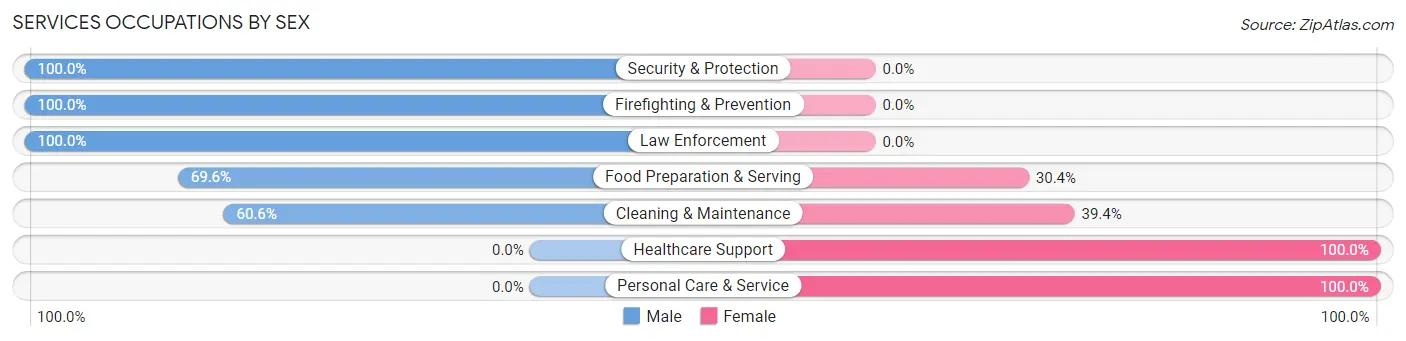
Within the Services occupations in Mills River, the most male-oriented occupations are Security & Protection (100.0%), Firefighting & Prevention (100.0%), and Law Enforcement (100.0%), while the most female-oriented occupations are Healthcare Support (100.0%), Personal Care & Service (100.0%), and Cleaning & Maintenance (39.4%).
| Occupation | Male | Female |
| Healthcare Support | 0 (0.0%) | 201 (100.0%) |
| Security & Protection | 26 (100.0%) | 0 (0.0%) |
| Firefighting & Prevention | 15 (100.0%) | 0 (0.0%) |
| Law Enforcement | 11 (100.0%) | 0 (0.0%) |
| Food Preparation & Serving | 78 (69.6%) | 34 (30.4%) |
| Cleaning & Maintenance | 103 (60.6%) | 67 (39.4%) |
| Personal Care & Service | 0 (0.0%) | 78 (100.0%) |
| Total (Category) | 207 (35.3%) | 380 (64.7%) |
| Total (Overall) | 1,831 (53.2%) | 1,610 (46.8%) |
Sales and Office Occupations
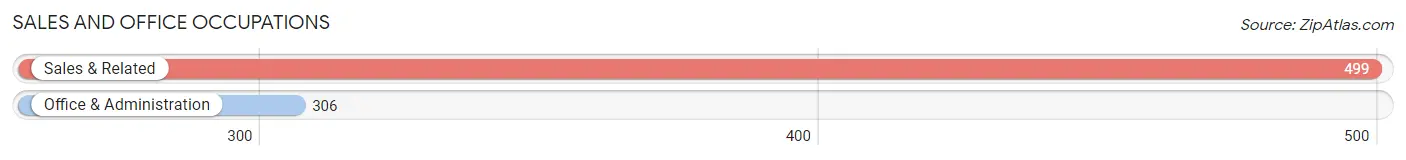
The most common Sales and Office occupations in Mills River are Sales & Related (499 | 14.5%), and Office & Administration (306 | 8.9%).
Sales and Office Occupations by Sex
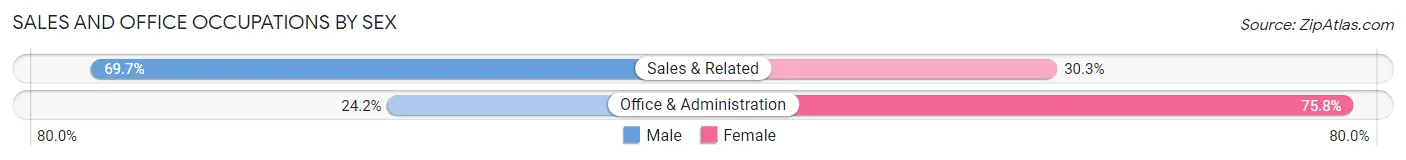
| Occupation | Male | Female |
| Sales & Related | 348 (69.7%) | 151 (30.3%) |
| Office & Administration | 74 (24.2%) | 232 (75.8%) |
| Total (Category) | 422 (52.4%) | 383 (47.6%) |
| Total (Overall) | 1,831 (53.2%) | 1,610 (46.8%) |
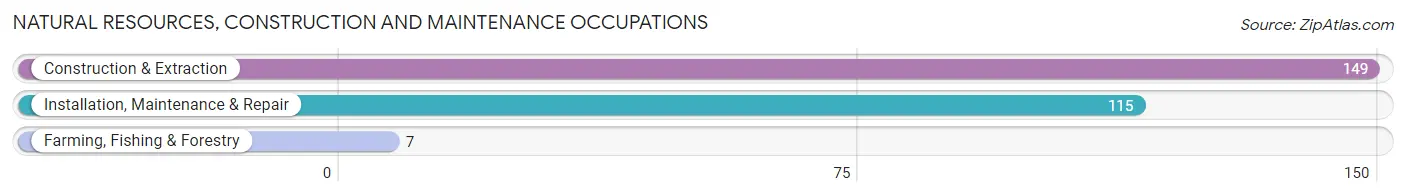
Natural Resources, Construction and Maintenance Occupations
The most common Natural Resources, Construction and Maintenance occupations in Mills River are Construction & Extraction (149 | 4.3%), Installation, Maintenance & Repair (115 | 3.3%), and Farming, Fishing & Forestry (7 | 0.2%).
Natural Resources, Construction and Maintenance Occupations by Sex
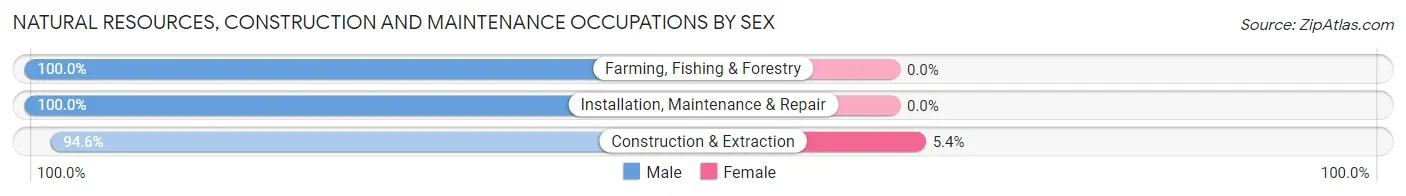
| Occupation | Male | Female |
| Farming, Fishing & Forestry | 7 (100.0%) | 0 (0.0%) |
| Construction & Extraction | 141 (94.6%) | 8 (5.4%) |
| Installation, Maintenance & Repair | 115 (100.0%) | 0 (0.0%) |
| Total (Category) | 263 (97.1%) | 8 (2.9%) |
| Total (Overall) | 1,831 (53.2%) | 1,610 (46.8%) |
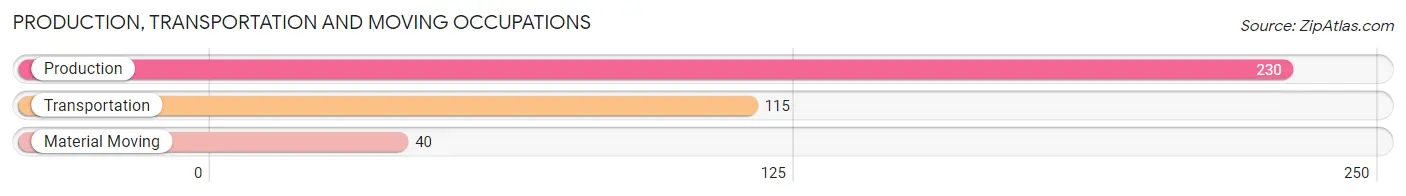
Production, Transportation and Moving Occupations
The most common Production, Transportation and Moving occupations in Mills River are Production (230 | 6.7%), Transportation (115 | 3.3%), and Material Moving (40 | 1.2%).
Production, Transportation and Moving Occupations by Sex
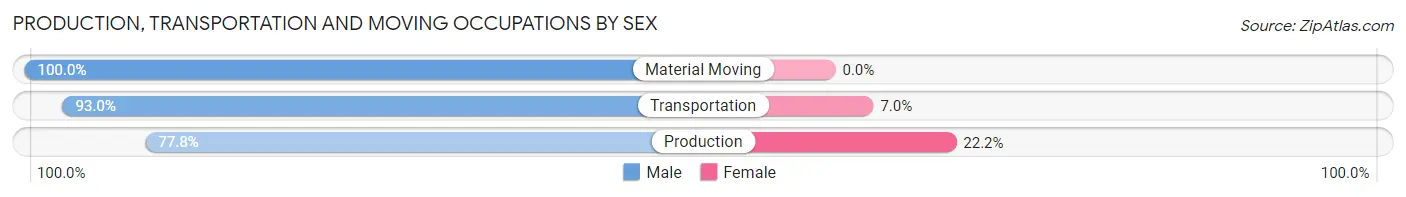
| Occupation | Male | Female |
| Production | 179 (77.8%) | 51 (22.2%) |
| Transportation | 107 (93.0%) | 8 (7.0%) |
| Material Moving | 40 (100.0%) | 0 (0.0%) |
| Total (Category) | 326 (84.7%) | 59 (15.3%) |
| Total (Overall) | 1,831 (53.2%) | 1,610 (46.8%) |
Employment Industries by Sex in Mills River
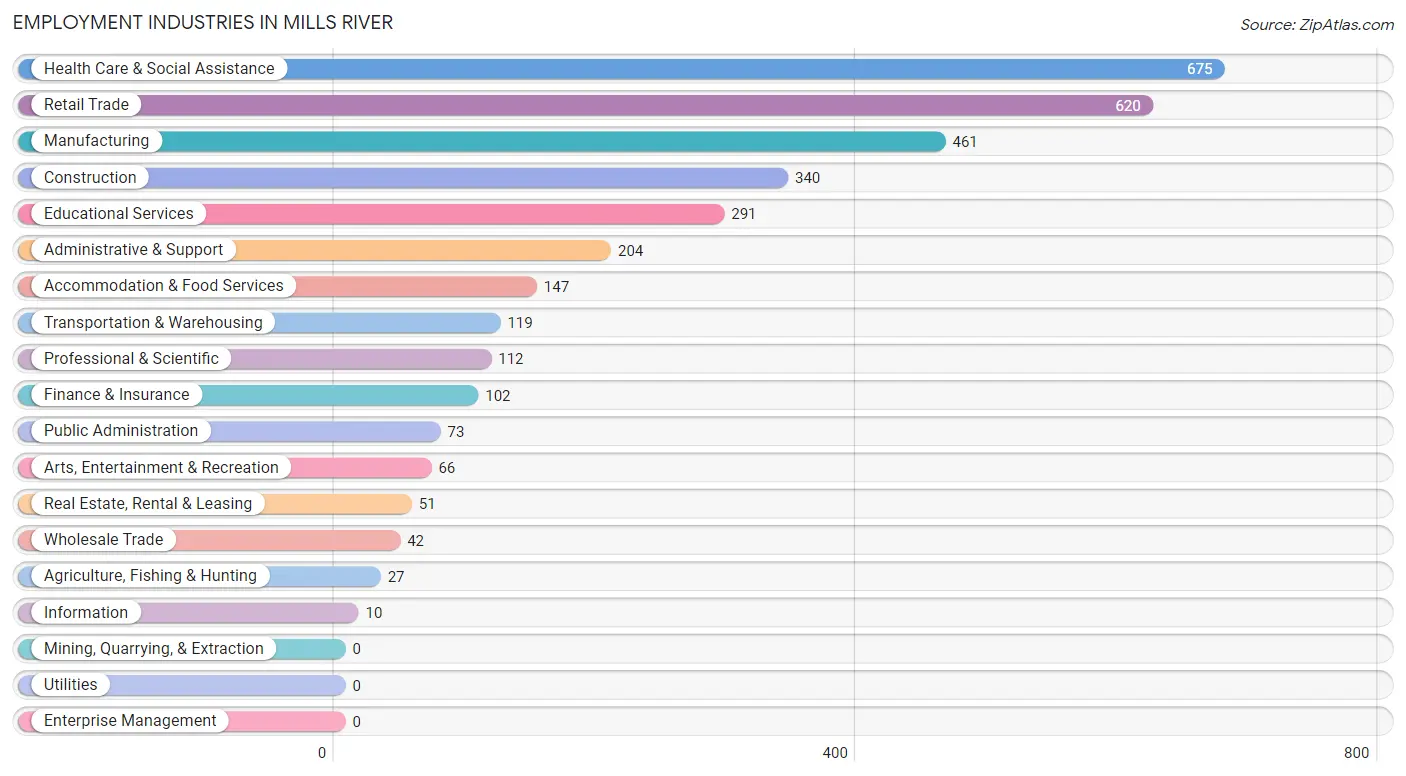
Employment Industries in Mills River
The major employment industries in Mills River include Health Care & Social Assistance (675 | 19.6%), Retail Trade (620 | 18.0%), Manufacturing (461 | 13.4%), Construction (340 | 9.9%), and Educational Services (291 | 8.5%).
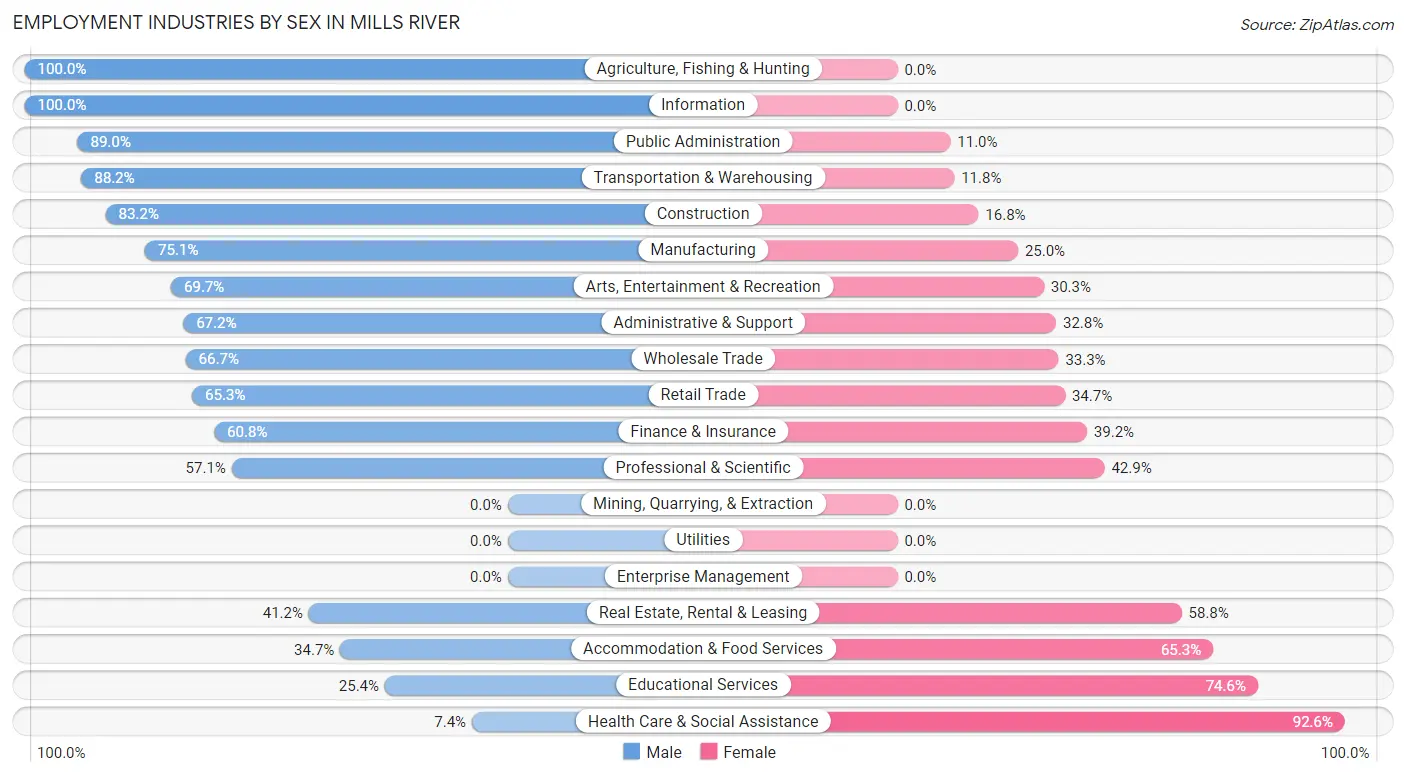
Employment Industries by Sex in Mills River
The Mills River industries that see more men than women are Agriculture, Fishing & Hunting (100.0%), Information (100.0%), and Public Administration (89.0%), whereas the industries that tend to have a higher number of women are Health Care & Social Assistance (92.6%), Educational Services (74.6%), and Accommodation & Food Services (65.3%).
| Industry | Male | Female |
| Agriculture, Fishing & Hunting | 27 (100.0%) | 0 (0.0%) |
| Mining, Quarrying, & Extraction | 0 (0.0%) | 0 (0.0%) |
| Construction | 283 (83.2%) | 57 (16.8%) |
| Manufacturing | 346 (75.0%) | 115 (24.9%) |
| Wholesale Trade | 28 (66.7%) | 14 (33.3%) |
| Retail Trade | 405 (65.3%) | 215 (34.7%) |
| Transportation & Warehousing | 105 (88.2%) | 14 (11.8%) |
| Utilities | 0 (0.0%) | 0 (0.0%) |
| Information | 10 (100.0%) | 0 (0.0%) |
| Finance & Insurance | 62 (60.8%) | 40 (39.2%) |
| Real Estate, Rental & Leasing | 21 (41.2%) | 30 (58.8%) |
| Professional & Scientific | 64 (57.1%) | 48 (42.9%) |
| Enterprise Management | 0 (0.0%) | 0 (0.0%) |
| Administrative & Support | 137 (67.2%) | 67 (32.8%) |
| Educational Services | 74 (25.4%) | 217 (74.6%) |
| Health Care & Social Assistance | 50 (7.4%) | 625 (92.6%) |
| Arts, Entertainment & Recreation | 46 (69.7%) | 20 (30.3%) |
| Accommodation & Food Services | 51 (34.7%) | 96 (65.3%) |
| Public Administration | 65 (89.0%) | 8 (11.0%) |
| Total | 1,831 (53.2%) | 1,610 (46.8%) |
Education in Mills River
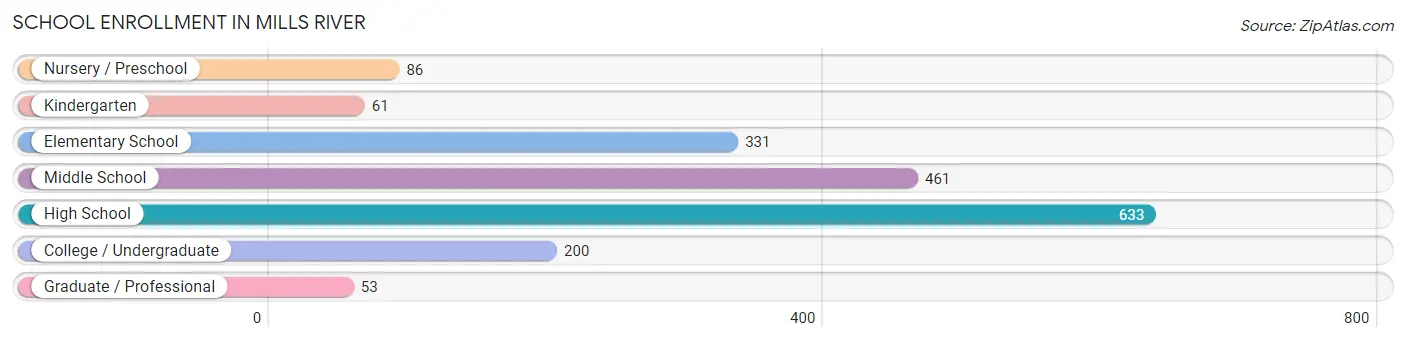
School Enrollment in Mills River
The most common levels of schooling among the 1,825 students in Mills River are high school (633 | 34.7%), middle school (461 | 25.3%), and elementary school (331 | 18.1%).
| School Level | # Students | % Students |
| Nursery / Preschool | 86 | 4.7% |
| Kindergarten | 61 | 3.3% |
| Elementary School | 331 | 18.1% |
| Middle School | 461 | 25.3% |
| High School | 633 | 34.7% |
| College / Undergraduate | 200 | 11.0% |
| Graduate / Professional | 53 | 2.9% |
| Total | 1,825 | 100.0% |
School Enrollment by Age by Funding Source in Mills River
Out of a total of 1,825 students who are enrolled in schools in Mills River, 518 (28.4%) attend a private institution, while the remaining 1,307 (71.6%) are enrolled in public schools. The age group of 3 to 4 year olds has the highest likelihood of being enrolled in private schools, with 64 (91.4% in the age bracket) enrolled. Conversely, the age group of 18 to 19 year olds has the lowest likelihood of being enrolled in a private school, with 181 (100.0% in the age bracket) attending a public institution.
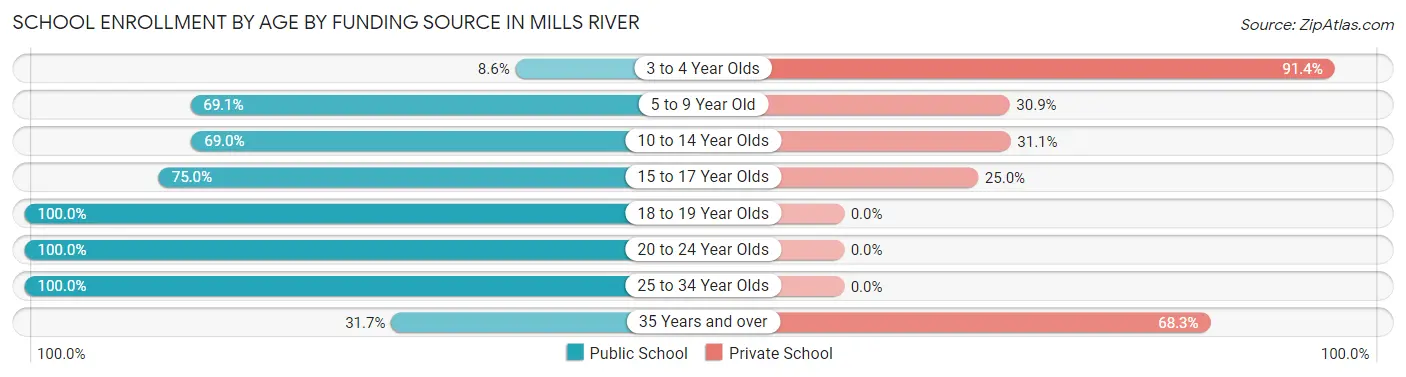
| Age Bracket | Public School | Private School |
| 3 to 4 Year Olds | 6 (8.6%) | 64 (91.4%) |
| 5 to 9 Year Old | 215 (69.1%) | 96 (30.9%) |
| 10 to 14 Year Olds | 393 (69.0%) | 177 (31.0%) |
| 15 to 17 Year Olds | 378 (75.0%) | 126 (25.0%) |
| 18 to 19 Year Olds | 181 (100.0%) | 0 (0.0%) |
| 20 to 24 Year Olds | 75 (100.0%) | 0 (0.0%) |
| 25 to 34 Year Olds | 32 (100.0%) | 0 (0.0%) |
| 35 Years and over | 26 (31.7%) | 56 (68.3%) |
| Total | 1,307 (71.6%) | 518 (28.4%) |
Educational Attainment by Field of Study in Mills River
Science & technology (403 | 18.2%), business (346 | 15.6%), education (255 | 11.5%), social sciences (161 | 7.3%), and literature & languages (143 | 6.5%) are the most common fields of study among 2,213 individuals in Mills River who have obtained a bachelor's degree or higher.
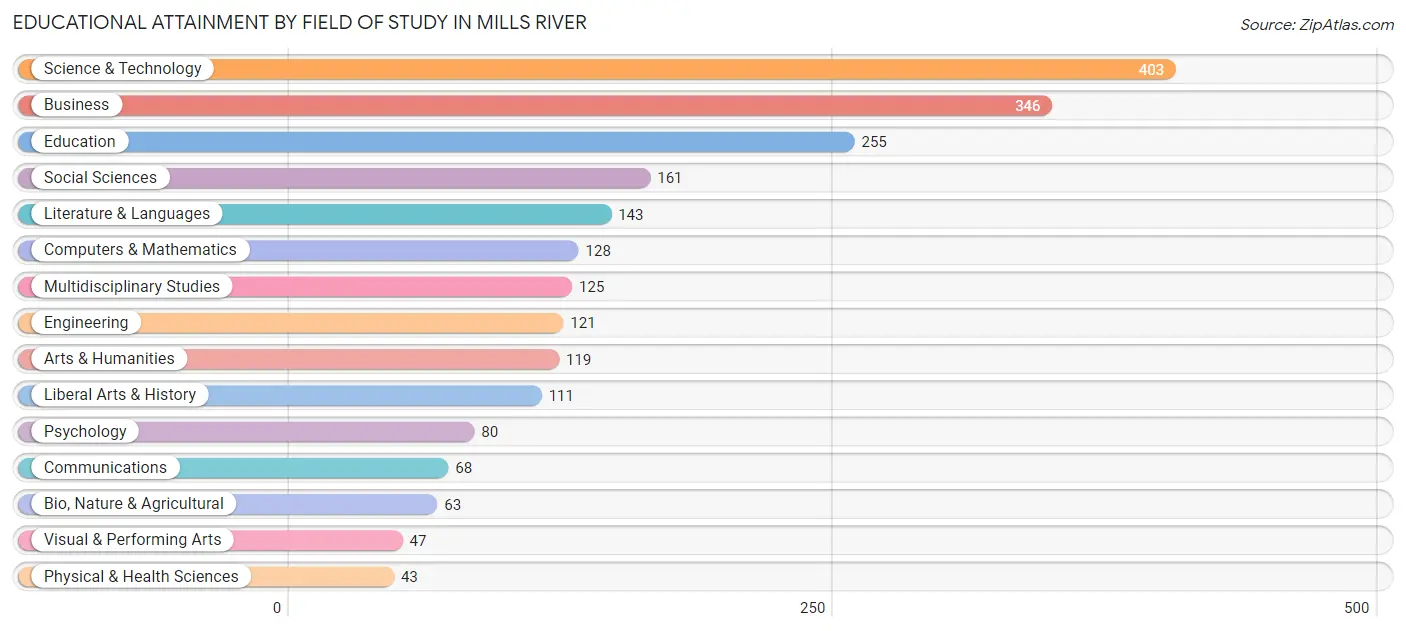
| Field of Study | # Graduates | % Graduates |
| Computers & Mathematics | 128 | 5.8% |
| Bio, Nature & Agricultural | 63 | 2.9% |
| Physical & Health Sciences | 43 | 1.9% |
| Psychology | 80 | 3.6% |
| Social Sciences | 161 | 7.3% |
| Engineering | 121 | 5.5% |
| Multidisciplinary Studies | 125 | 5.7% |
| Science & Technology | 403 | 18.2% |
| Business | 346 | 15.6% |
| Education | 255 | 11.5% |
| Literature & Languages | 143 | 6.5% |
| Liberal Arts & History | 111 | 5.0% |
| Visual & Performing Arts | 47 | 2.1% |
| Communications | 68 | 3.1% |
| Arts & Humanities | 119 | 5.4% |
| Total | 2,213 | 100.0% |
Transportation & Commute in Mills River
Vehicle Availability by Sex in Mills River
The most prevalent vehicle ownership categories in Mills River are males with 2 vehicles (592, accounting for 32.8%) and females with 2 vehicles (515, making up 37.9%).
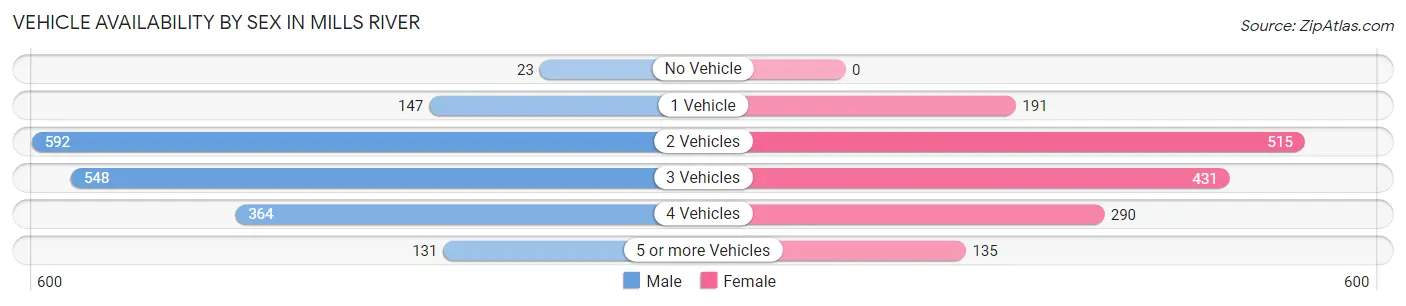
| Vehicles Available | Male | Female |
| No Vehicle | 23 (1.3%) | 0 (0.0%) |
| 1 Vehicle | 147 (8.1%) | 191 (12.2%) |
| 2 Vehicles | 592 (32.8%) | 515 (33.0%) |
| 3 Vehicles | 548 (30.4%) | 431 (27.6%) |
| 4 Vehicles | 364 (20.2%) | 290 (18.6%) |
| 5 or more Vehicles | 131 (7.3%) | 135 (8.6%) |
| Total | 1,805 (100.0%) | 1,562 (100.0%) |
Commute Time in Mills River
The most frequently occuring commute durations in Mills River are 30 to 34 minutes (572 commuters, 18.3%), 10 to 14 minutes (566 commuters, 18.1%), and 20 to 24 minutes (556 commuters, 17.8%).
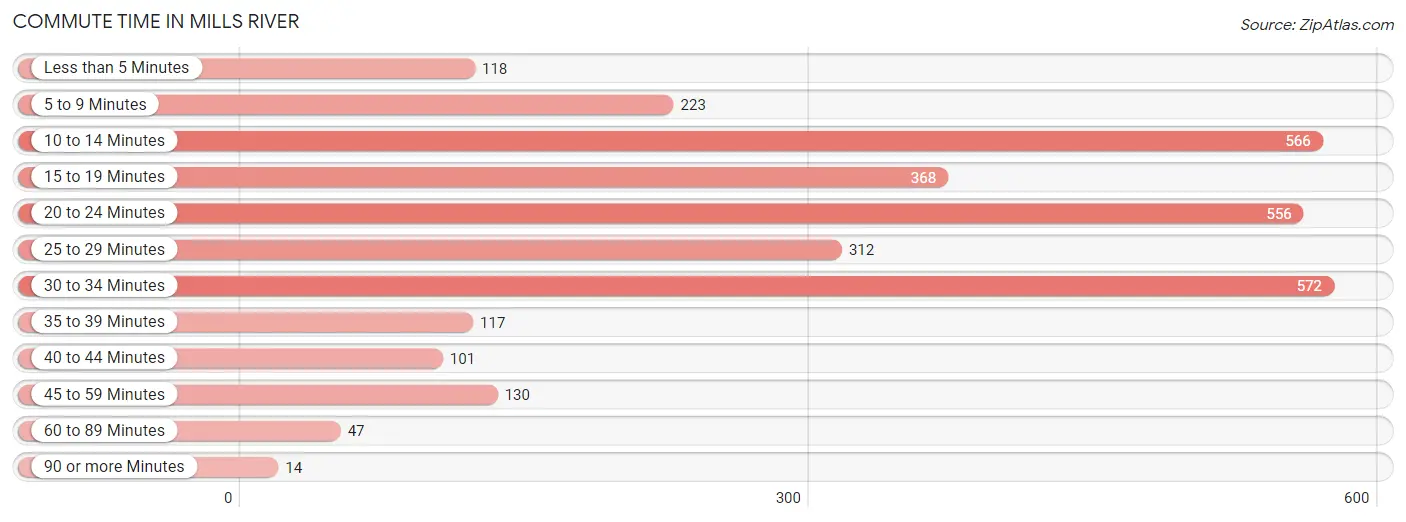
| Commute Time | # Commuters | % Commuters |
| Less than 5 Minutes | 118 | 3.8% |
| 5 to 9 Minutes | 223 | 7.1% |
| 10 to 14 Minutes | 566 | 18.1% |
| 15 to 19 Minutes | 368 | 11.8% |
| 20 to 24 Minutes | 556 | 17.8% |
| 25 to 29 Minutes | 312 | 10.0% |
| 30 to 34 Minutes | 572 | 18.3% |
| 35 to 39 Minutes | 117 | 3.7% |
| 40 to 44 Minutes | 101 | 3.2% |
| 45 to 59 Minutes | 130 | 4.2% |
| 60 to 89 Minutes | 47 | 1.5% |
| 90 or more Minutes | 14 | 0.4% |
Commute Time by Sex in Mills River
The most common commute times in Mills River are 10 to 14 minutes (390 commuters, 22.7%) for males and 20 to 24 minutes (349 commuters, 24.8%) for females.

| Commute Time | Male | Female |
| Less than 5 Minutes | 34 (2.0%) | 84 (6.0%) |
| 5 to 9 Minutes | 149 (8.7%) | 74 (5.3%) |
| 10 to 14 Minutes | 390 (22.7%) | 176 (12.5%) |
| 15 to 19 Minutes | 255 (14.8%) | 113 (8.0%) |
| 20 to 24 Minutes | 207 (12.0%) | 349 (24.8%) |
| 25 to 29 Minutes | 232 (13.5%) | 80 (5.7%) |
| 30 to 34 Minutes | 279 (16.2%) | 293 (20.8%) |
| 35 to 39 Minutes | 59 (3.4%) | 58 (4.1%) |
| 40 to 44 Minutes | 24 (1.4%) | 77 (5.5%) |
| 45 to 59 Minutes | 43 (2.5%) | 87 (6.2%) |
| 60 to 89 Minutes | 39 (2.3%) | 8 (0.6%) |
| 90 or more Minutes | 8 (0.5%) | 6 (0.4%) |
Time of Departure to Work by Sex in Mills River
The most frequent times of departure to work in Mills River are 6:30 AM to 6:59 AM (336, 19.6%) for males and 7:30 AM to 7:59 AM (227, 16.2%) for females.
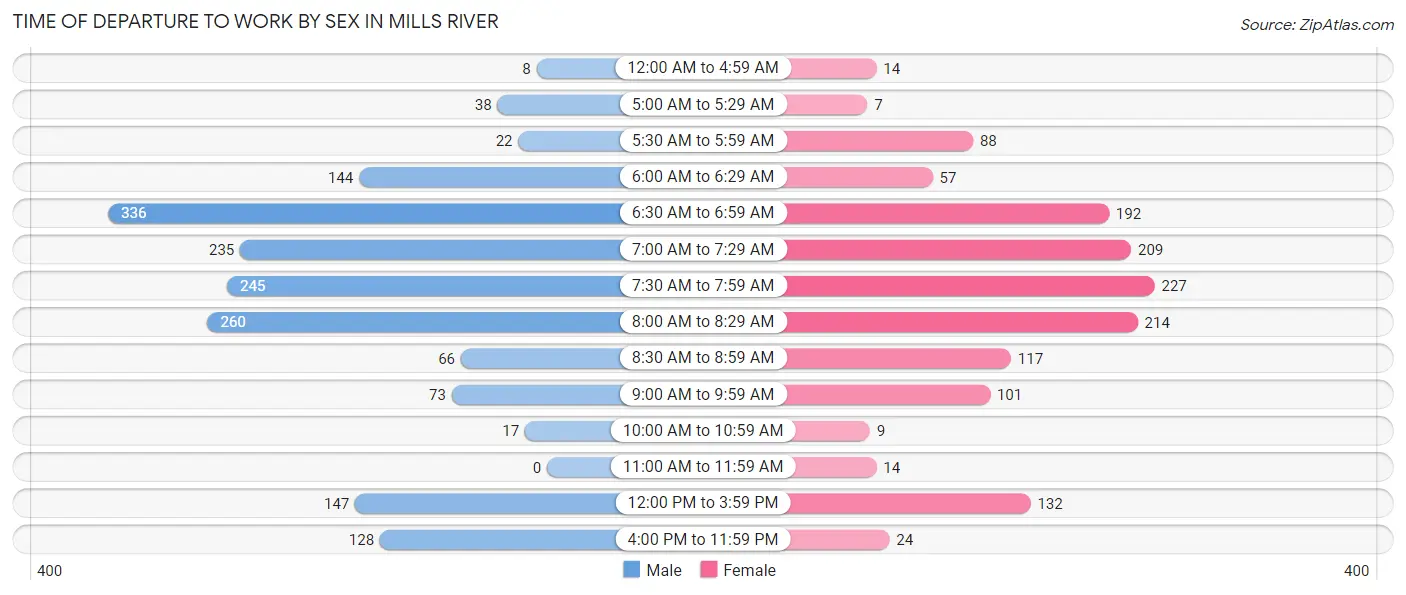
| Time of Departure | Male | Female |
| 12:00 AM to 4:59 AM | 8 (0.5%) | 14 (1.0%) |
| 5:00 AM to 5:29 AM | 38 (2.2%) | 7 (0.5%) |
| 5:30 AM to 5:59 AM | 22 (1.3%) | 88 (6.3%) |
| 6:00 AM to 6:29 AM | 144 (8.4%) | 57 (4.1%) |
| 6:30 AM to 6:59 AM | 336 (19.6%) | 192 (13.7%) |
| 7:00 AM to 7:29 AM | 235 (13.7%) | 209 (14.9%) |
| 7:30 AM to 7:59 AM | 245 (14.2%) | 227 (16.2%) |
| 8:00 AM to 8:29 AM | 260 (15.1%) | 214 (15.2%) |
| 8:30 AM to 8:59 AM | 66 (3.8%) | 117 (8.3%) |
| 9:00 AM to 9:59 AM | 73 (4.3%) | 101 (7.2%) |
| 10:00 AM to 10:59 AM | 17 (1.0%) | 9 (0.6%) |
| 11:00 AM to 11:59 AM | 0 (0.0%) | 14 (1.0%) |
| 12:00 PM to 3:59 PM | 147 (8.6%) | 132 (9.4%) |
| 4:00 PM to 11:59 PM | 128 (7.4%) | 24 (1.7%) |
| Total | 1,719 (100.0%) | 1,405 (100.0%) |
Housing Occupancy in Mills River
Occupancy by Ownership in Mills River
Of the total 2,754 dwellings in Mills River, owner-occupied units account for 2,331 (84.6%), while renter-occupied units make up 423 (15.4%).
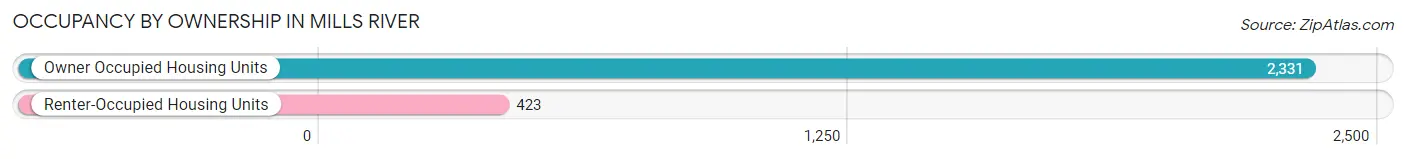
| Occupancy | # Housing Units | % Housing Units |
| Owner Occupied Housing Units | 2,331 | 84.6% |
| Renter-Occupied Housing Units | 423 | 15.4% |
| Total Occupied Housing Units | 2,754 | 100.0% |
Occupancy by Household Size in Mills River
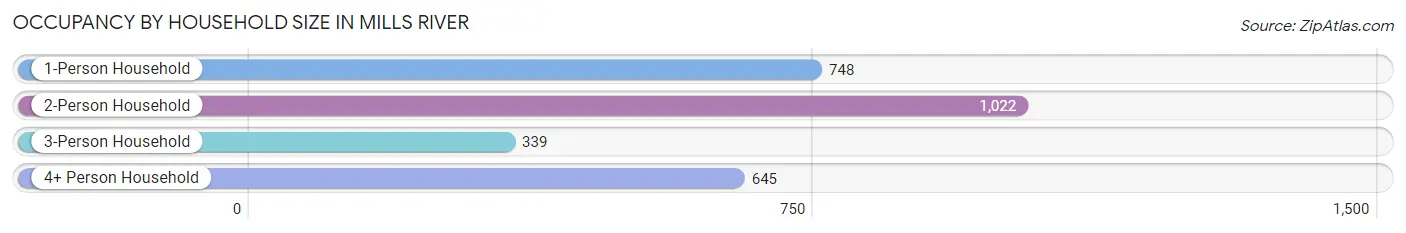
| Household Size | # Housing Units | % Housing Units |
| 1-Person Household | 748 | 27.2% |
| 2-Person Household | 1,022 | 37.1% |
| 3-Person Household | 339 | 12.3% |
| 4+ Person Household | 645 | 23.4% |
| Total Housing Units | 2,754 | 100.0% |
Occupancy by Ownership by Household Size in Mills River
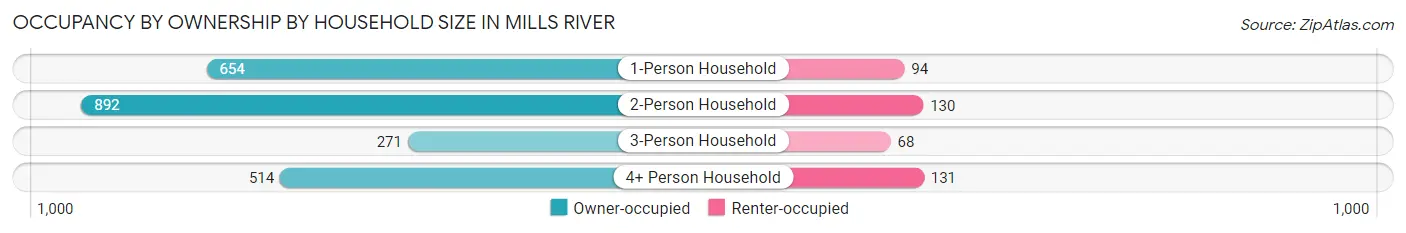
| Household Size | Owner-occupied | Renter-occupied |
| 1-Person Household | 654 (87.4%) | 94 (12.6%) |
| 2-Person Household | 892 (87.3%) | 130 (12.7%) |
| 3-Person Household | 271 (79.9%) | 68 (20.1%) |
| 4+ Person Household | 514 (79.7%) | 131 (20.3%) |
| Total Housing Units | 2,331 (84.6%) | 423 (15.4%) |
Occupancy by Educational Attainment in Mills River
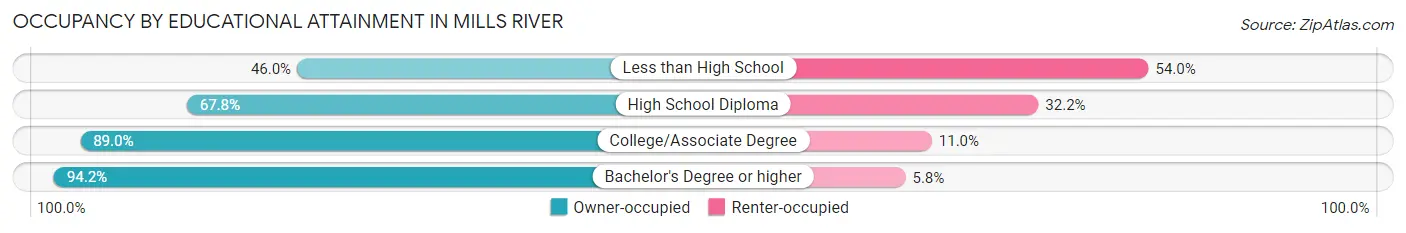
| Household Size | Owner-occupied | Renter-occupied |
| Less than High School | 69 (46.0%) | 81 (54.0%) |
| High School Diploma | 388 (67.8%) | 184 (32.2%) |
| College/Associate Degree | 677 (89.0%) | 84 (11.0%) |
| Bachelor's Degree or higher | 1,197 (94.2%) | 74 (5.8%) |
Occupancy by Age of Householder in Mills River
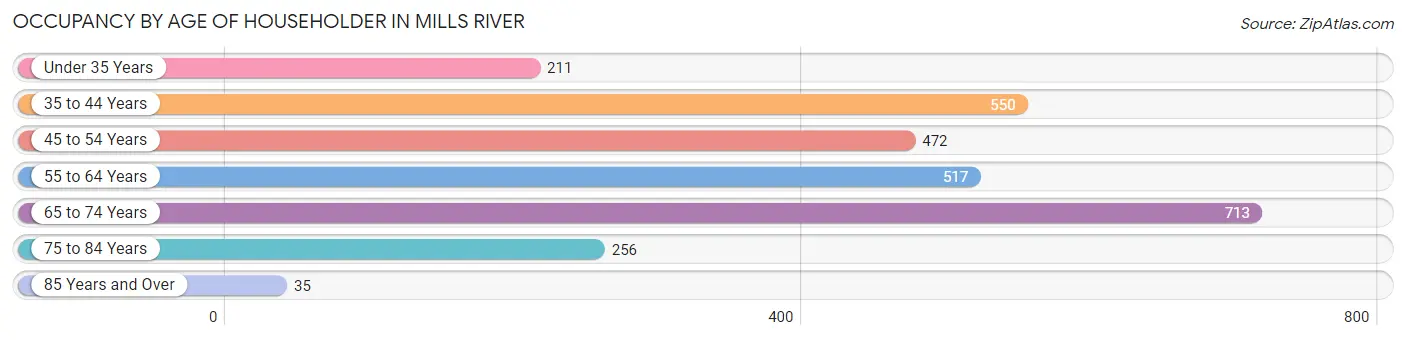
| Age Bracket | # Households | % Households |
| Under 35 Years | 211 | 7.7% |
| 35 to 44 Years | 550 | 20.0% |
| 45 to 54 Years | 472 | 17.1% |
| 55 to 64 Years | 517 | 18.8% |
| 65 to 74 Years | 713 | 25.9% |
| 75 to 84 Years | 256 | 9.3% |
| 85 Years and Over | 35 | 1.3% |
| Total | 2,754 | 100.0% |
Housing Finances in Mills River
Median Income by Occupancy in Mills River
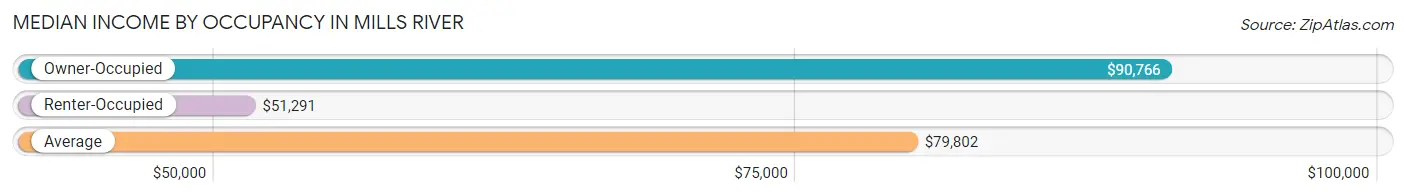
| Occupancy Type | # Households | Median Income |
| Owner-Occupied | 2,331 (84.6%) | $90,766 |
| Renter-Occupied | 423 (15.4%) | $51,291 |
| Average | 2,754 (100.0%) | $79,802 |
Occupancy by Householder Income Bracket in Mills River
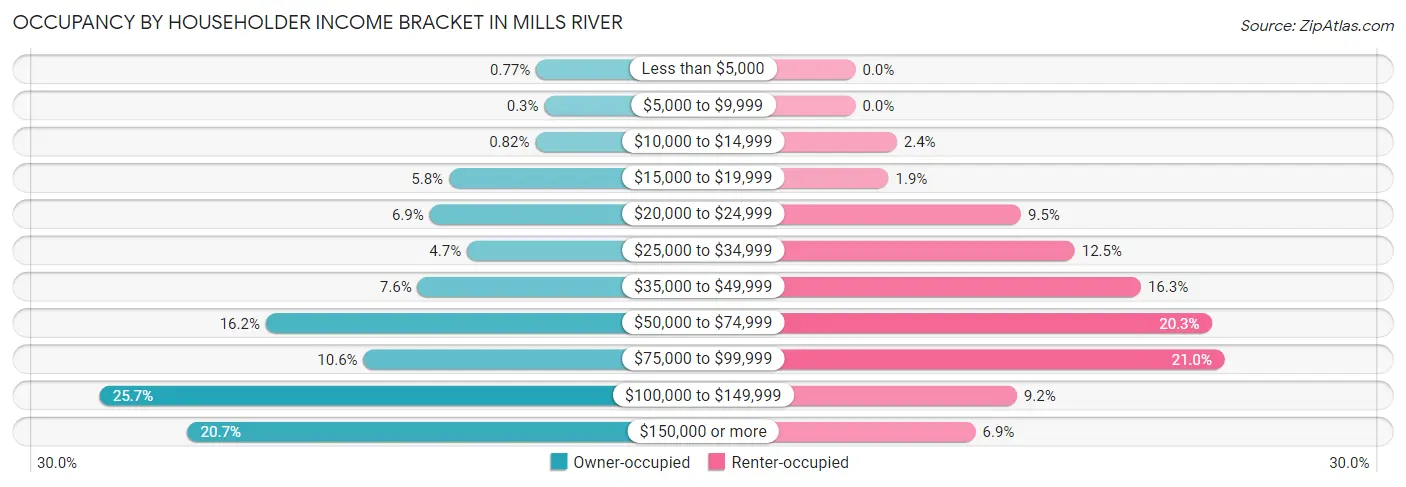
| Income Bracket | Owner-occupied | Renter-occupied |
| Less than $5,000 | 18 (0.8%) | 0 (0.0%) |
| $5,000 to $9,999 | 7 (0.3%) | 0 (0.0%) |
| $10,000 to $14,999 | 19 (0.8%) | 10 (2.4%) |
| $15,000 to $19,999 | 134 (5.8%) | 8 (1.9%) |
| $20,000 to $24,999 | 160 (6.9%) | 40 (9.5%) |
| $25,000 to $34,999 | 110 (4.7%) | 53 (12.5%) |
| $35,000 to $49,999 | 176 (7.5%) | 69 (16.3%) |
| $50,000 to $74,999 | 378 (16.2%) | 86 (20.3%) |
| $75,000 to $99,999 | 248 (10.6%) | 89 (21.0%) |
| $100,000 to $149,999 | 599 (25.7%) | 39 (9.2%) |
| $150,000 or more | 482 (20.7%) | 29 (6.9%) |
| Total | 2,331 (100.0%) | 423 (100.0%) |
Monthly Housing Cost Tiers in Mills River
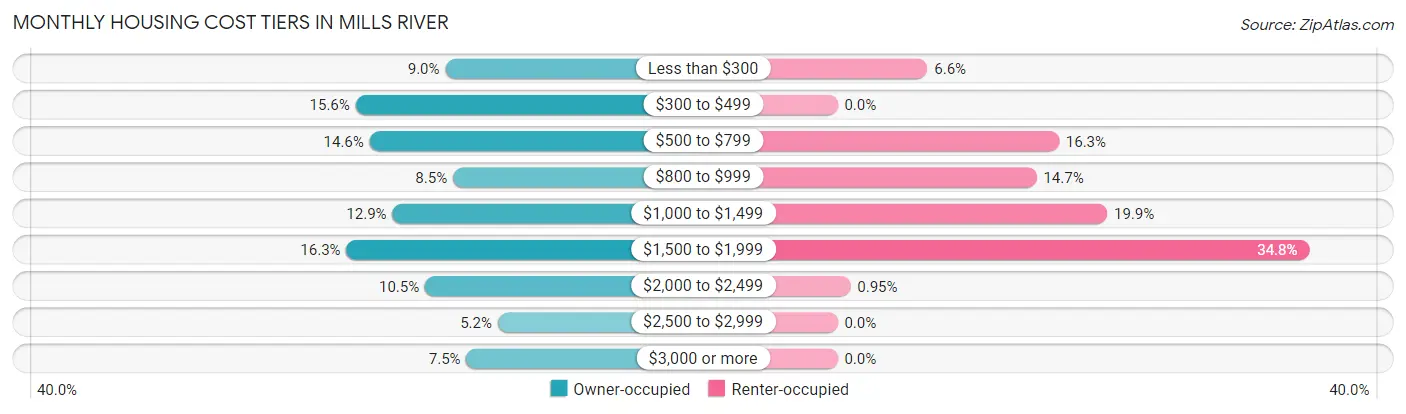
| Monthly Cost | Owner-occupied | Renter-occupied |
| Less than $300 | 210 (9.0%) | 28 (6.6%) |
| $300 to $499 | 364 (15.6%) | 0 (0.0%) |
| $500 to $799 | 340 (14.6%) | 69 (16.3%) |
| $800 to $999 | 197 (8.5%) | 62 (14.7%) |
| $1,000 to $1,499 | 301 (12.9%) | 84 (19.9%) |
| $1,500 to $1,999 | 380 (16.3%) | 147 (34.7%) |
| $2,000 to $2,499 | 245 (10.5%) | 4 (0.9%) |
| $2,500 to $2,999 | 120 (5.1%) | 0 (0.0%) |
| $3,000 or more | 174 (7.5%) | 0 (0.0%) |
| Total | 2,331 (100.0%) | 423 (100.0%) |
Physical Housing Characteristics in Mills River
Housing Structures in Mills River
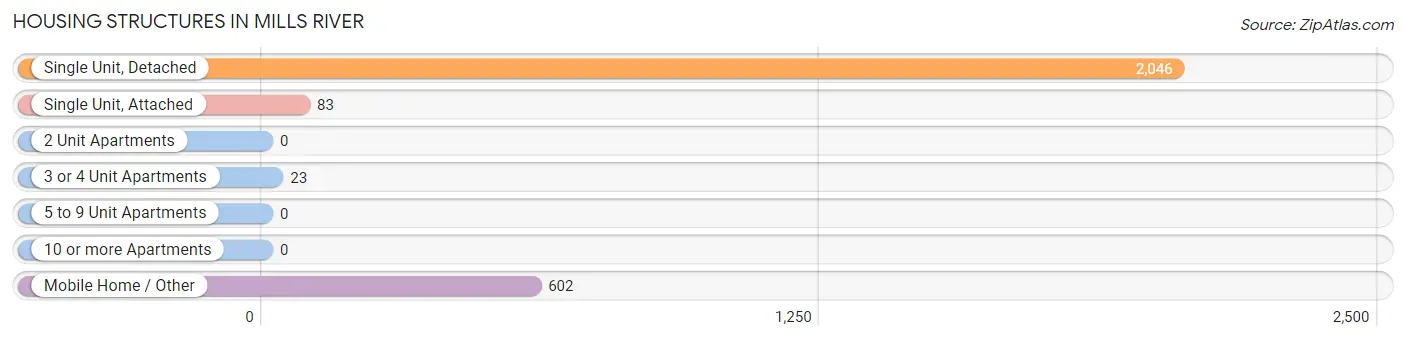
| Structure Type | # Housing Units | % Housing Units |
| Single Unit, Detached | 2,046 | 74.3% |
| Single Unit, Attached | 83 | 3.0% |
| 2 Unit Apartments | 0 | 0.0% |
| 3 or 4 Unit Apartments | 23 | 0.8% |
| 5 to 9 Unit Apartments | 0 | 0.0% |
| 10 or more Apartments | 0 | 0.0% |
| Mobile Home / Other | 602 | 21.9% |
| Total | 2,754 | 100.0% |
Housing Structures by Occupancy in Mills River
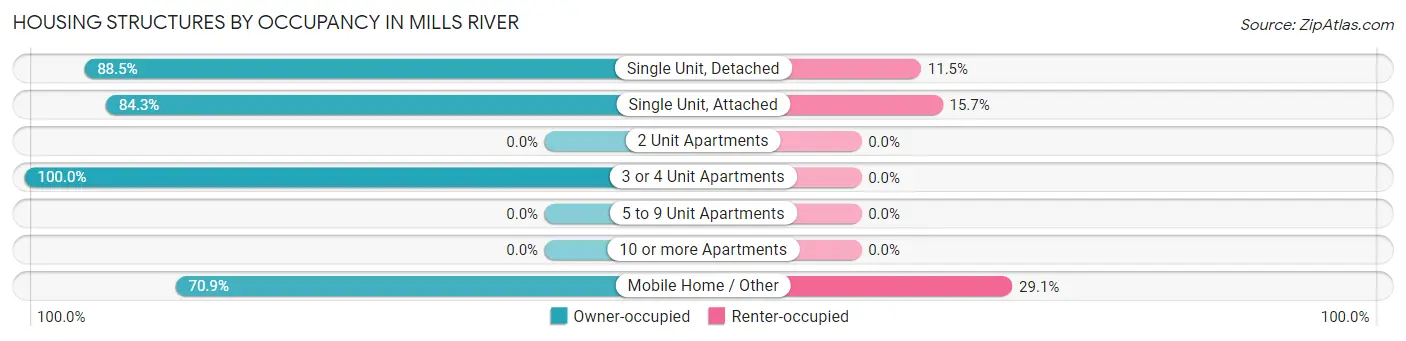
| Structure Type | Owner-occupied | Renter-occupied |
| Single Unit, Detached | 1,811 (88.5%) | 235 (11.5%) |
| Single Unit, Attached | 70 (84.3%) | 13 (15.7%) |
| 2 Unit Apartments | 0 (0.0%) | 0 (0.0%) |
| 3 or 4 Unit Apartments | 23 (100.0%) | 0 (0.0%) |
| 5 to 9 Unit Apartments | 0 (0.0%) | 0 (0.0%) |
| 10 or more Apartments | 0 (0.0%) | 0 (0.0%) |
| Mobile Home / Other | 427 (70.9%) | 175 (29.1%) |
| Total | 2,331 (84.6%) | 423 (15.4%) |
Housing Structures by Number of Rooms in Mills River
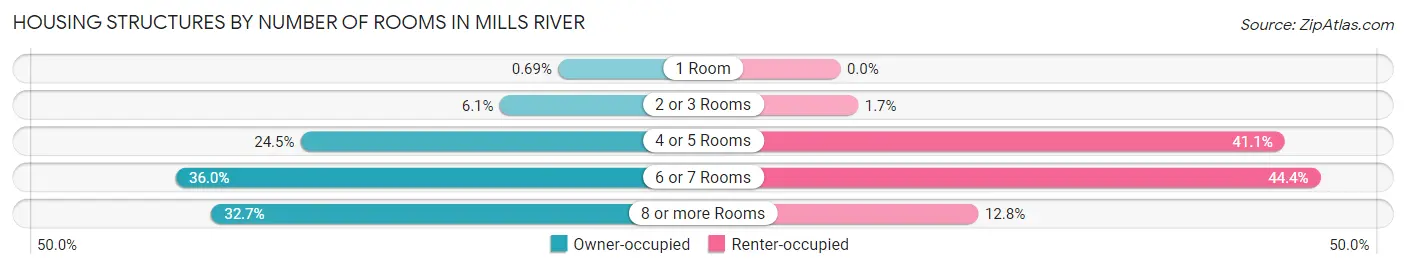
| Number of Rooms | Owner-occupied | Renter-occupied |
| 1 Room | 16 (0.7%) | 0 (0.0%) |
| 2 or 3 Rooms | 142 (6.1%) | 7 (1.7%) |
| 4 or 5 Rooms | 571 (24.5%) | 174 (41.1%) |
| 6 or 7 Rooms | 839 (36.0%) | 188 (44.4%) |
| 8 or more Rooms | 763 (32.7%) | 54 (12.8%) |
| Total | 2,331 (100.0%) | 423 (100.0%) |
Housing Structure by Heating Type in Mills River
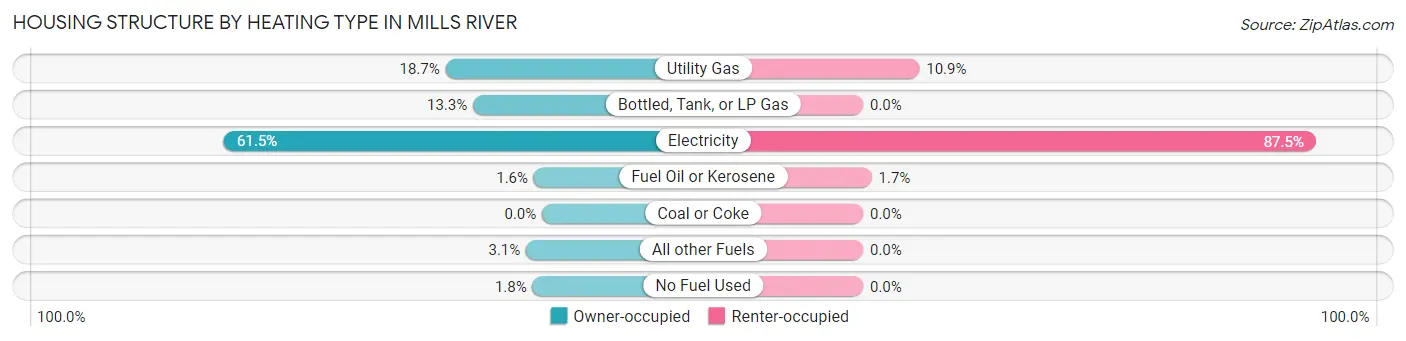
| Heating Type | Owner-occupied | Renter-occupied |
| Utility Gas | 435 (18.7%) | 46 (10.9%) |
| Bottled, Tank, or LP Gas | 311 (13.3%) | 0 (0.0%) |
| Electricity | 1,433 (61.5%) | 370 (87.5%) |
| Fuel Oil or Kerosene | 37 (1.6%) | 7 (1.7%) |
| Coal or Coke | 0 (0.0%) | 0 (0.0%) |
| All other Fuels | 72 (3.1%) | 0 (0.0%) |
| No Fuel Used | 43 (1.8%) | 0 (0.0%) |
| Total | 2,331 (100.0%) | 423 (100.0%) |
Household Vehicle Usage in Mills River
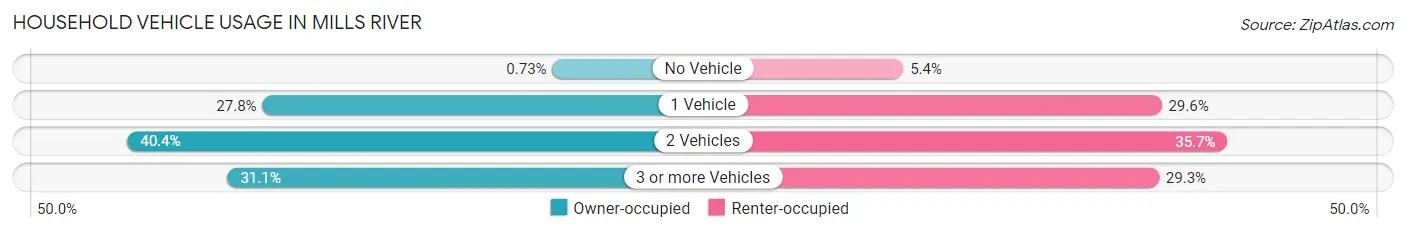
| Vehicles per Household | Owner-occupied | Renter-occupied |
| No Vehicle | 17 (0.7%) | 23 (5.4%) |
| 1 Vehicle | 648 (27.8%) | 125 (29.5%) |
| 2 Vehicles | 942 (40.4%) | 151 (35.7%) |
| 3 or more Vehicles | 724 (31.1%) | 124 (29.3%) |
| Total | 2,331 (100.0%) | 423 (100.0%) |
Real Estate & Mortgages in Mills River
Real Estate and Mortgage Overview in Mills River
| Characteristic | Without Mortgage | With Mortgage |
| Housing Units | 994 | 1,337 |
| Median Property Value | $231,100 | $410,900 |
| Median Household Income | $55,686 | $376 |
| Monthly Housing Costs | $464 | $166 |
| Real Estate Taxes | $1,208 | $12 |
Property Value by Mortgage Status in Mills River
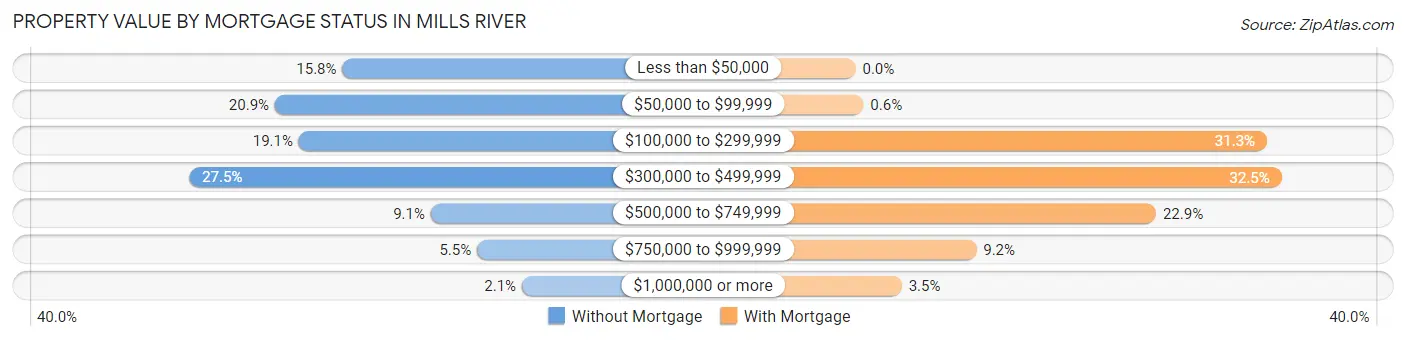
| Property Value | Without Mortgage | With Mortgage |
| Less than $50,000 | 157 (15.8%) | 0 (0.0%) |
| $50,000 to $99,999 | 208 (20.9%) | 8 (0.6%) |
| $100,000 to $299,999 | 190 (19.1%) | 419 (31.3%) |
| $300,000 to $499,999 | 273 (27.5%) | 434 (32.5%) |
| $500,000 to $749,999 | 90 (9.0%) | 306 (22.9%) |
| $750,000 to $999,999 | 55 (5.5%) | 123 (9.2%) |
| $1,000,000 or more | 21 (2.1%) | 47 (3.5%) |
| Total | 994 (100.0%) | 1,337 (100.0%) |
Household Income by Mortgage Status in Mills River
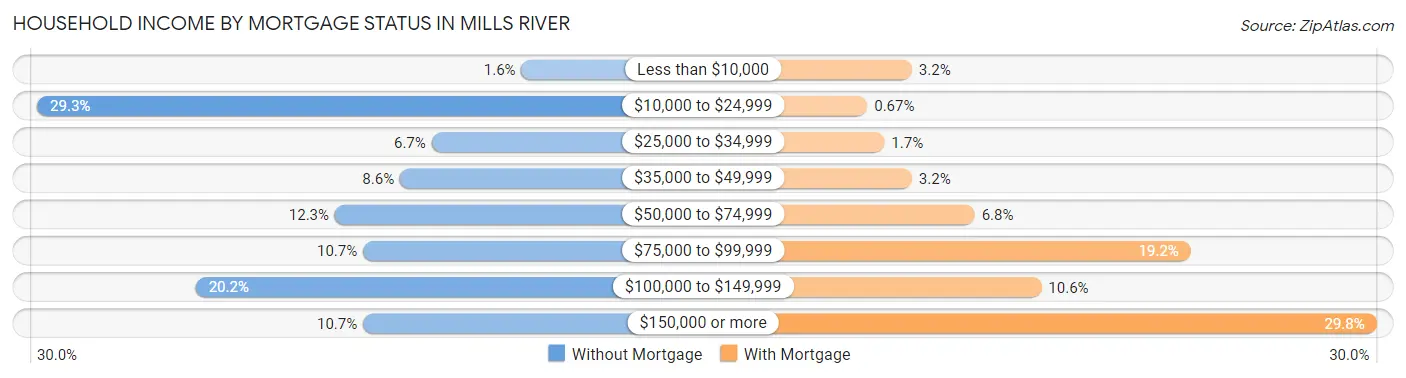
| Household Income | Without Mortgage | With Mortgage |
| Less than $10,000 | 16 (1.6%) | 43 (3.2%) |
| $10,000 to $24,999 | 291 (29.3%) | 9 (0.7%) |
| $25,000 to $34,999 | 67 (6.7%) | 22 (1.7%) |
| $35,000 to $49,999 | 85 (8.6%) | 43 (3.2%) |
| $50,000 to $74,999 | 122 (12.3%) | 91 (6.8%) |
| $75,000 to $99,999 | 106 (10.7%) | 256 (19.2%) |
| $100,000 to $149,999 | 201 (20.2%) | 142 (10.6%) |
| $150,000 or more | 106 (10.7%) | 398 (29.8%) |
| Total | 994 (100.0%) | 1,337 (100.0%) |
Property Value to Household Income Ratio in Mills River
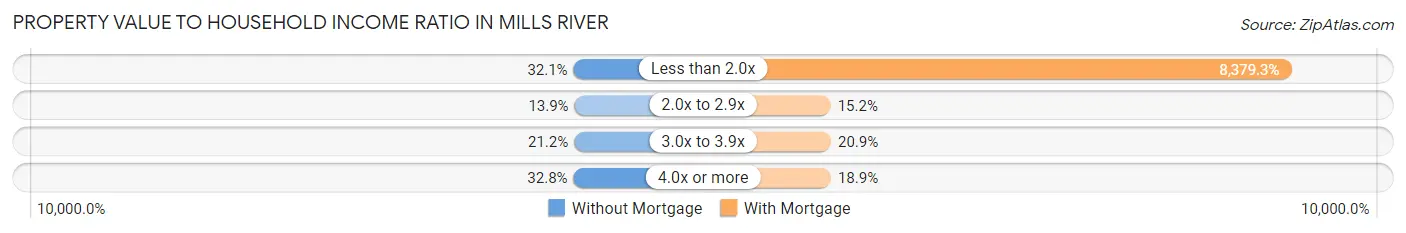
| Value-to-Income Ratio | Without Mortgage | With Mortgage |
| Less than 2.0x | 319 (32.1%) | 112,031 (8,379.3%) |
| 2.0x to 2.9x | 138 (13.9%) | 203 (15.2%) |
| 3.0x to 3.9x | 211 (21.2%) | 279 (20.9%) |
| 4.0x or more | 326 (32.8%) | 253 (18.9%) |
| Total | 994 (100.0%) | 1,337 (100.0%) |
Real Estate Taxes by Mortgage Status in Mills River
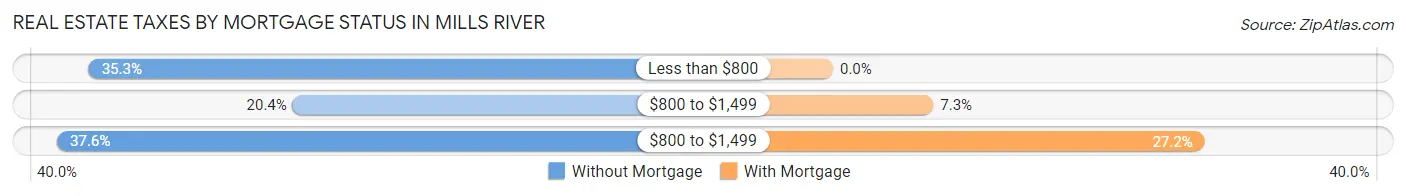
| Property Taxes | Without Mortgage | With Mortgage |
| Less than $800 | 351 (35.3%) | 0 (0.0%) |
| $800 to $1,499 | 203 (20.4%) | 98 (7.3%) |
| $800 to $1,499 | 374 (37.6%) | 363 (27.2%) |
| Total | 994 (100.0%) | 1,337 (100.0%) |
Health & Disability in Mills River
Health Insurance Coverage by Age in Mills River
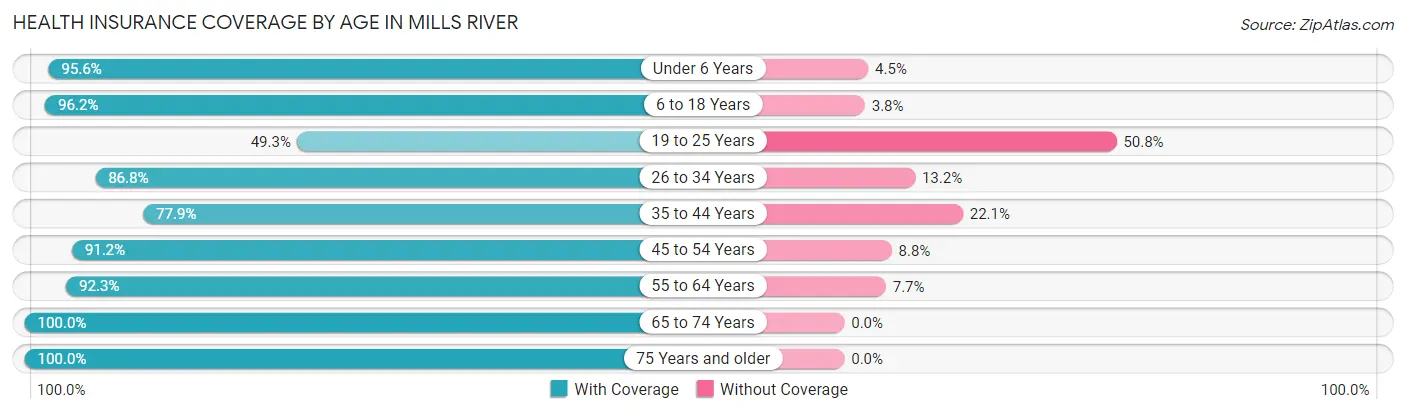
| Age Bracket | With Coverage | Without Coverage |
| Under 6 Years | 365 (95.6%) | 17 (4.4%) |
| 6 to 18 Years | 1,410 (96.2%) | 56 (3.8%) |
| 19 to 25 Years | 197 (49.2%) | 203 (50.7%) |
| 26 to 34 Years | 448 (86.8%) | 68 (13.2%) |
| 35 to 44 Years | 702 (77.9%) | 199 (22.1%) |
| 45 to 54 Years | 827 (91.2%) | 80 (8.8%) |
| 55 to 64 Years | 823 (92.3%) | 69 (7.7%) |
| 65 to 74 Years | 1,149 (100.0%) | 0 (0.0%) |
| 75 Years and older | 487 (100.0%) | 0 (0.0%) |
| Total | 6,408 (90.2%) | 692 (9.8%) |
Health Insurance Coverage by Citizenship Status in Mills River
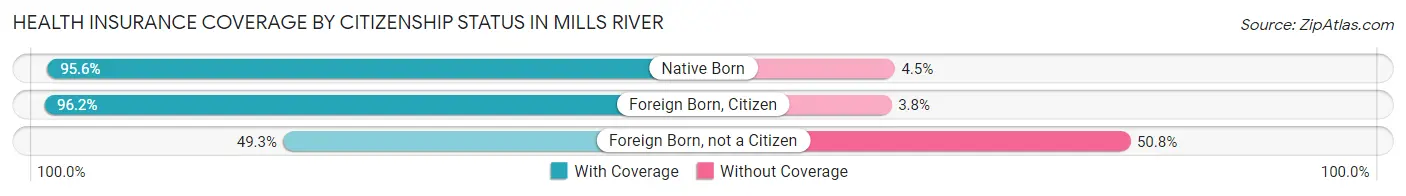
| Citizenship Status | With Coverage | Without Coverage |
| Native Born | 365 (95.6%) | 17 (4.4%) |
| Foreign Born, Citizen | 1,410 (96.2%) | 56 (3.8%) |
| Foreign Born, not a Citizen | 197 (49.2%) | 203 (50.7%) |
Health Insurance Coverage by Household Income in Mills River
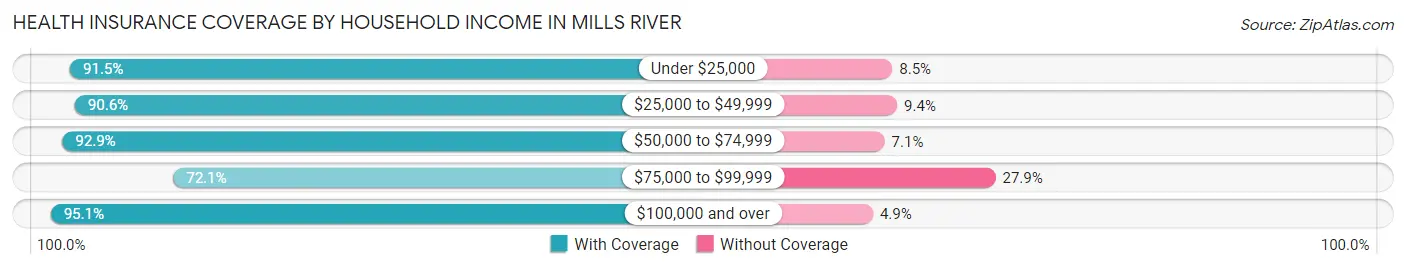
| Household Income | With Coverage | Without Coverage |
| Under $25,000 | 461 (91.5%) | 43 (8.5%) |
| $25,000 to $49,999 | 720 (90.6%) | 75 (9.4%) |
| $50,000 to $74,999 | 957 (92.9%) | 73 (7.1%) |
| $75,000 to $99,999 | 841 (72.1%) | 325 (27.9%) |
| $100,000 and over | 3,417 (95.1%) | 176 (4.9%) |
Public vs Private Health Insurance Coverage by Age in Mills River
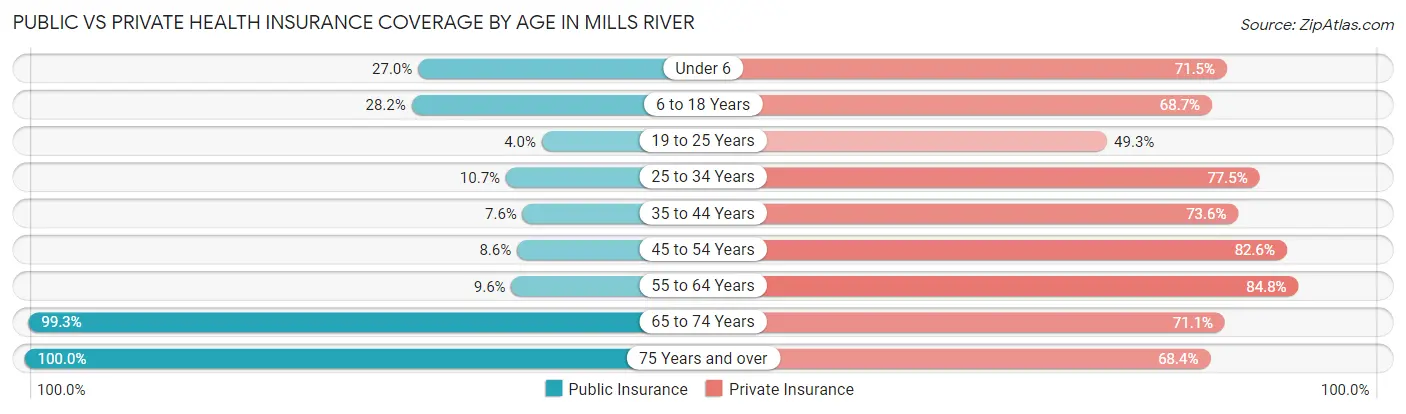
| Age Bracket | Public Insurance | Private Insurance |
| Under 6 | 103 (27.0%) | 273 (71.5%) |
| 6 to 18 Years | 413 (28.2%) | 1,007 (68.7%) |
| 19 to 25 Years | 16 (4.0%) | 197 (49.2%) |
| 25 to 34 Years | 55 (10.7%) | 400 (77.5%) |
| 35 to 44 Years | 68 (7.5%) | 663 (73.6%) |
| 45 to 54 Years | 78 (8.6%) | 749 (82.6%) |
| 55 to 64 Years | 86 (9.6%) | 756 (84.8%) |
| 65 to 74 Years | 1,141 (99.3%) | 817 (71.1%) |
| 75 Years and over | 487 (100.0%) | 333 (68.4%) |
| Total | 2,447 (34.5%) | 5,195 (73.2%) |
Disability Status by Sex by Age in Mills River
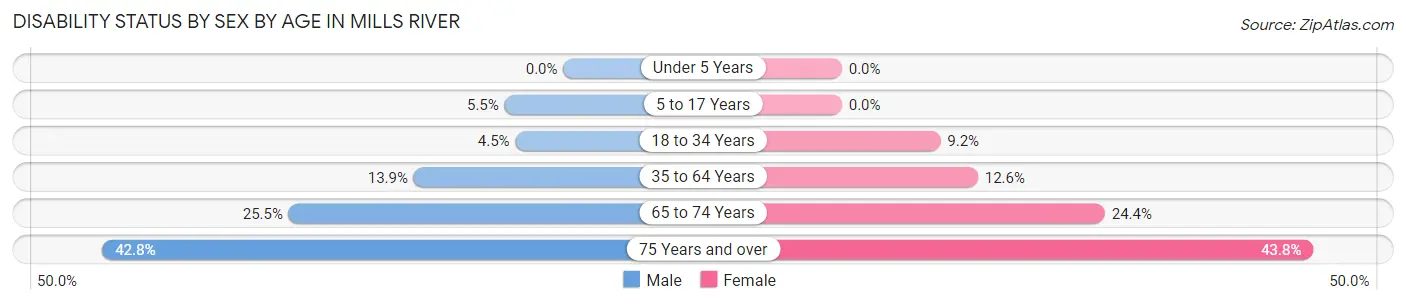
| Age Bracket | Male | Female |
| Under 5 Years | 0 (0.0%) | 0 (0.0%) |
| 5 to 17 Years | 46 (5.4%) | 0 (0.0%) |
| 18 to 34 Years | 27 (4.4%) | 39 (9.1%) |
| 35 to 64 Years | 168 (13.9%) | 188 (12.6%) |
| 65 to 74 Years | 132 (25.5%) | 154 (24.4%) |
| 75 Years and over | 92 (42.8%) | 119 (43.8%) |
Disability Class by Sex by Age in Mills River
Disability Class: Hearing Difficulty
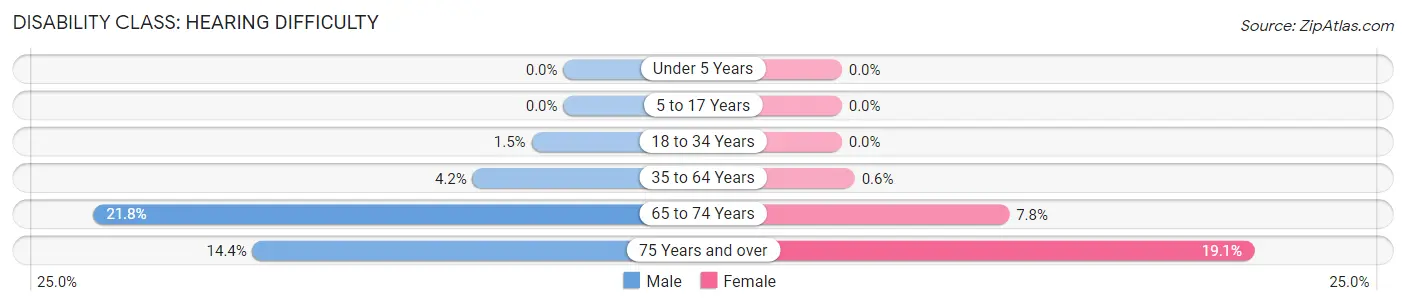
| Age Bracket | Male | Female |
| Under 5 Years | 0 (0.0%) | 0 (0.0%) |
| 5 to 17 Years | 0 (0.0%) | 0 (0.0%) |
| 18 to 34 Years | 9 (1.5%) | 0 (0.0%) |
| 35 to 64 Years | 51 (4.2%) | 9 (0.6%) |
| 65 to 74 Years | 113 (21.8%) | 49 (7.8%) |
| 75 Years and over | 31 (14.4%) | 52 (19.1%) |
Disability Class: Vision Difficulty
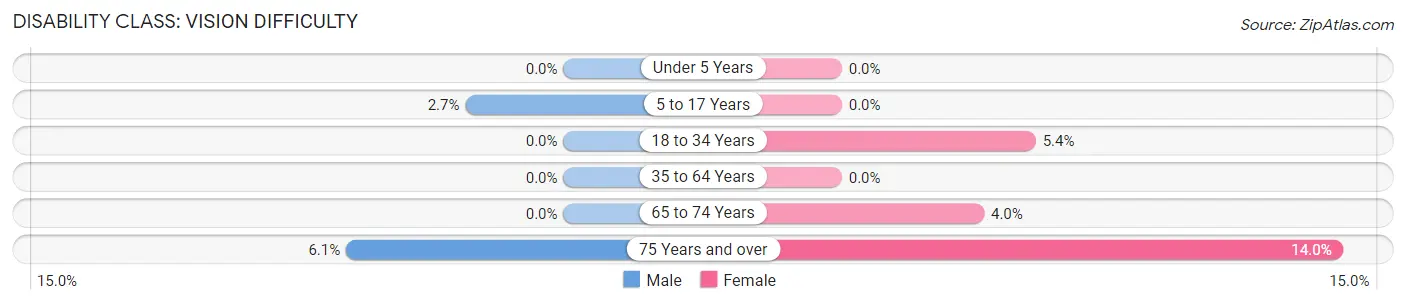
| Age Bracket | Male | Female |
| Under 5 Years | 0 (0.0%) | 0 (0.0%) |
| 5 to 17 Years | 23 (2.7%) | 0 (0.0%) |
| 18 to 34 Years | 0 (0.0%) | 23 (5.4%) |
| 35 to 64 Years | 0 (0.0%) | 0 (0.0%) |
| 65 to 74 Years | 0 (0.0%) | 25 (4.0%) |
| 75 Years and over | 13 (6.0%) | 38 (14.0%) |
Disability Class: Cognitive Difficulty
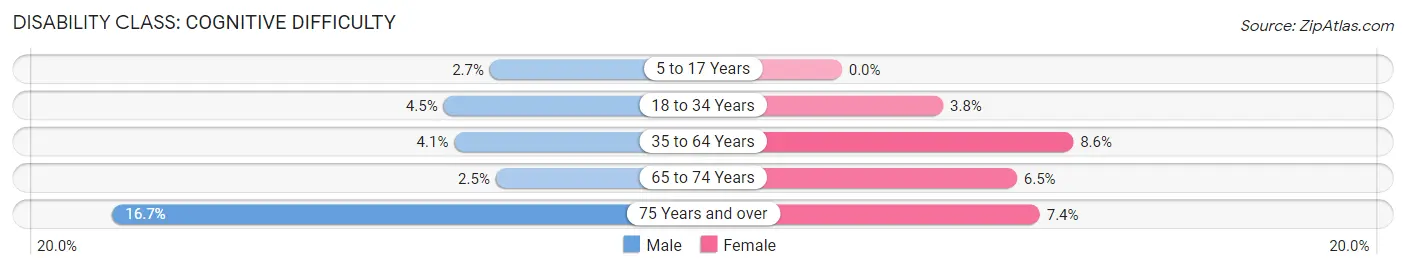
| Age Bracket | Male | Female |
| 5 to 17 Years | 23 (2.7%) | 0 (0.0%) |
| 18 to 34 Years | 27 (4.4%) | 16 (3.8%) |
| 35 to 64 Years | 49 (4.1%) | 128 (8.6%) |
| 65 to 74 Years | 13 (2.5%) | 41 (6.5%) |
| 75 Years and over | 36 (16.7%) | 20 (7.3%) |
Disability Class: Ambulatory Difficulty
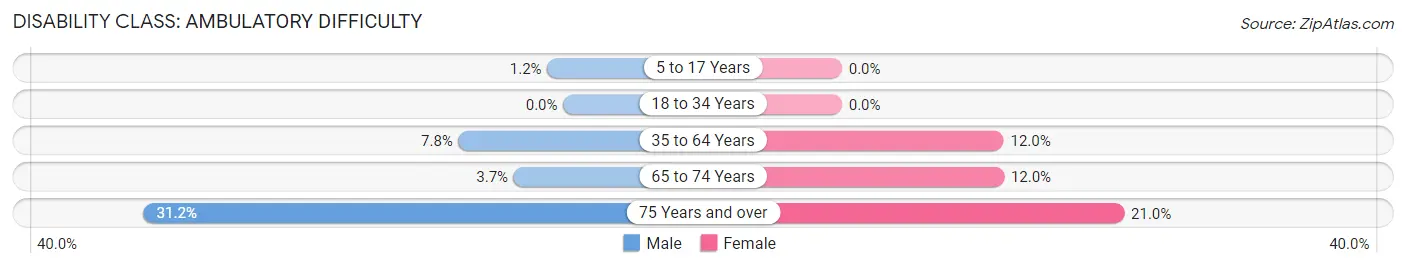
| Age Bracket | Male | Female |
| 5 to 17 Years | 10 (1.2%) | 0 (0.0%) |
| 18 to 34 Years | 0 (0.0%) | 0 (0.0%) |
| 35 to 64 Years | 94 (7.8%) | 179 (12.0%) |
| 65 to 74 Years | 19 (3.7%) | 76 (12.0%) |
| 75 Years and over | 67 (31.2%) | 57 (21.0%) |
Disability Class: Self-Care Difficulty
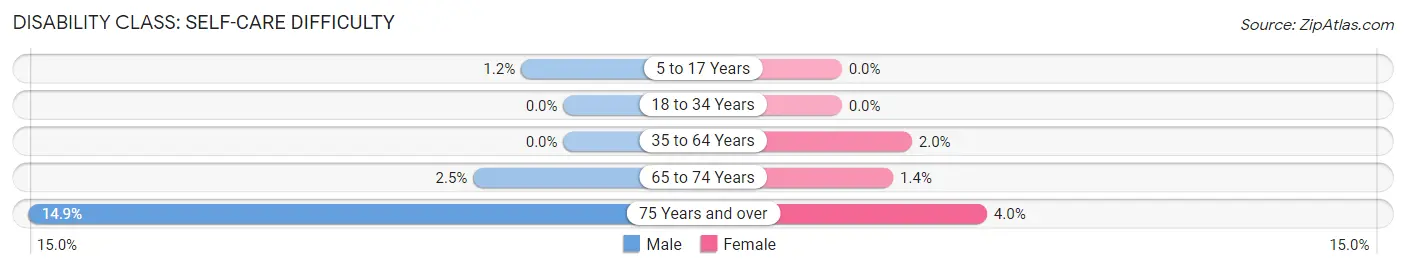
| Age Bracket | Male | Female |
| 5 to 17 Years | 10 (1.2%) | 0 (0.0%) |
| 18 to 34 Years | 0 (0.0%) | 0 (0.0%) |
| 35 to 64 Years | 0 (0.0%) | 29 (1.9%) |
| 65 to 74 Years | 13 (2.5%) | 9 (1.4%) |
| 75 Years and over | 32 (14.9%) | 11 (4.0%) |
Technology Access in Mills River
Computing Device Access in Mills River
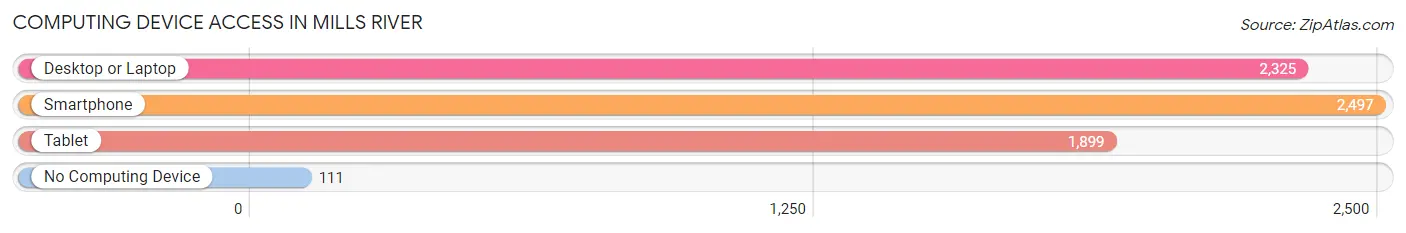
| Device Type | # Households | % Households |
| Desktop or Laptop | 2,325 | 84.4% |
| Smartphone | 2,497 | 90.7% |
| Tablet | 1,899 | 69.0% |
| No Computing Device | 111 | 4.0% |
| Total | 2,754 | 100.0% |
Internet Access in Mills River
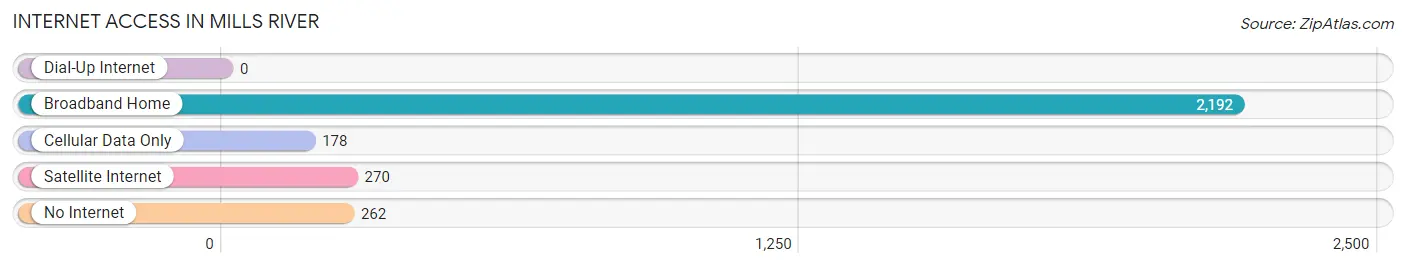
| Internet Type | # Households | % Households |
| Dial-Up Internet | 0 | 0.0% |
| Broadband Home | 2,192 | 79.6% |
| Cellular Data Only | 178 | 6.5% |
| Satellite Internet | 270 | 9.8% |
| No Internet | 262 | 9.5% |
| Total | 2,754 | 100.0% |
Mills River Summary
Mills River is a small town located in Henderson County, North Carolina. It is situated in the Blue Ridge Mountains, about 20 miles south of Asheville. The town was founded in 1837 and has a population of approximately 5,000 people.
Geography
Mills River is located in the Blue Ridge Mountains of western North Carolina. The town is situated in the French Broad River Valley, which is part of the Appalachian Mountains. The town is surrounded by the Pisgah National Forest and is close to the Great Smoky Mountains National Park. The town is located at an elevation of 1,400 feet and has a total area of 8.2 square miles.
Climate
Mills River has a humid subtropical climate, with hot summers and mild winters. The average annual temperature is around 60 degrees Fahrenheit, with an average high of around 80 degrees in the summer and an average low of around 40 degrees in the winter. The town receives an average of 45 inches of precipitation per year, with most of it falling in the form of rain.
Demographics
As of the 2010 census, the population of Mills River was 5,012. The racial makeup of the town was 94.3% White, 1.3% African American, 0.3% Native American, 0.7% Asian, 0.1% Pacific Islander, and 2.3% from other races. Hispanic or Latino of any race were 3.3% of the population.
Economy
Mills River is home to several businesses, including a number of small farms, a winery, and a brewery. The town is also home to a number of manufacturing companies, including a plastics manufacturer and a furniture manufacturer. The town is also home to a number of retail stores, restaurants, and other businesses.
The town is also home to a number of tourist attractions, including the Sierra Nevada Brewing Company, the Sierra Nevada Taproom, and the Sierra Nevada Adventure Center. The town is also home to a number of outdoor recreation areas, including the Mills River Recreation Area and the Pisgah National Forest.
History
Mills River was founded in 1837 by a group of settlers from South Carolina. The town was named after the nearby Mills River, which was named after a local miller. The town was originally a farming community, but it soon became a center for manufacturing and industry. In the late 19th century, the town was home to several mills, including a cotton mill, a paper mill, and a flour mill.
In the early 20th century, the town began to experience a period of growth and development. The town was home to several businesses, including a furniture factory, a plastics factory, and a number of retail stores. The town also became a popular tourist destination, with the opening of the Sierra Nevada Brewing Company in 1994.
Today, Mills River is a small town with a population of around 5,000 people. The town is home to a number of businesses, including a winery, a brewery, and a number of manufacturing companies. The town is also home to a number of tourist attractions, including the Sierra Nevada Brewing Company, the Sierra Nevada Taproom, and the Sierra Nevada Adventure Center. The town is also home to a number of outdoor recreation areas, including the Mills River Recreation Area and the Pisgah National Forest.
Common Questions
What is Per Capita Income in Mills River?
Per Capita income in Mills River is $38,303.
What is the Median Family Income in Mills River?
Median Family Income in Mills River is $102,368.
What is the Median Household income in Mills River?
Median Household Income in Mills River is $79,802.
What is Income or Wage Gap in Mills River?
Income or Wage Gap in Mills River is 37.1%.
Women in Mills River earn 62.9 cents for every dollar earned by a man.
What is Family Income Deficit in Mills River?
Family Income Deficit in Mills River is $9,433.
Families that are below poverty line in Mills River earn $9,433 less on average than the poverty threshold level.
What is Inequality or Gini Index in Mills River?
Inequality or Gini Index in Mills River is 0.38.
What is the Total Population of Mills River?
Total Population of Mills River is 7,100.
What is the Total Male Population of Mills River?
Total Male Population of Mills River is 3,554.
What is the Total Female Population of Mills River?
Total Female Population of Mills River is 3,546.
What is the Ratio of Males per 100 Females in Mills River?
There are 100.23 Males per 100 Females in Mills River.
What is the Ratio of Females per 100 Males in Mills River?
There are 99.77 Females per 100 Males in Mills River.
What is the Median Population Age in Mills River?
Median Population Age in Mills River is 43.5 Years.
What is the Average Family Size in Mills River
Average Family Size in Mills River is 3.1 People.
What is the Average Household Size in Mills River
Average Household Size in Mills River is 2.6 People.
How Large is the Labor Force in Mills River?
There are 3,630 People in the Labor Forcein in Mills River.
What is the Percentage of People in the Labor Force in Mills River?
64.4% of People are in the Labor Force in Mills River.
What is the Unemployment Rate in Mills River?
Unemployment Rate in Mills River is 5.2%.