Kings Grant, NC Map & Demographics
Kings Grant Map
Kings Grant Overview
$33,435
PER CAPITA INCOME
$83,051
AVG FAMILY INCOME
$60,964
AVG HOUSEHOLD INCOME
1.3%
WAGE / INCOME GAP [ % ]
98.7¢/ $1
WAGE / INCOME GAP [ $ ]
0.38
INEQUALITY / GINI INDEX
8,561
TOTAL POPULATION
4,265
MALE POPULATION
4,296
FEMALE POPULATION
99.28
MALES / 100 FEMALES
100.73
FEMALES / 100 MALES
39.6
MEDIAN AGE
2.8
AVG FAMILY SIZE
2.2
AVG HOUSEHOLD SIZE
5,134
LABOR FORCE [ PEOPLE ]
70.1%
PERCENT IN LABOR FORCE
2.3%
UNEMPLOYMENT RATE
Income in Kings Grant
Income Overview in Kings Grant
Per Capita Income in Kings Grant is $33,435, while median incomes of families and households are $83,051 and $60,964 respectively.
| Characteristic | Number | Measure |
| Per Capita Income | 8,561 | $33,435 |
| Median Family Income | 2,297 | $83,051 |
| Mean Family Income | 2,297 | $85,250 |
| Median Household Income | 3,941 | $60,964 |
| Mean Household Income | 3,941 | $71,306 |
| Income Deficit | 2,297 | $0 |
| Wage / Income Gap (%) | 8,561 | 1.32% |
| Wage / Income Gap ($) | 8,561 | 98.68¢ per $1 |
| Gini / Inequality Index | 8,561 | 0.38 |
Earnings by Sex in Kings Grant
Average Earnings in Kings Grant are $37,259, $37,487 for men and $36,991 for women, a difference of 1.3%.
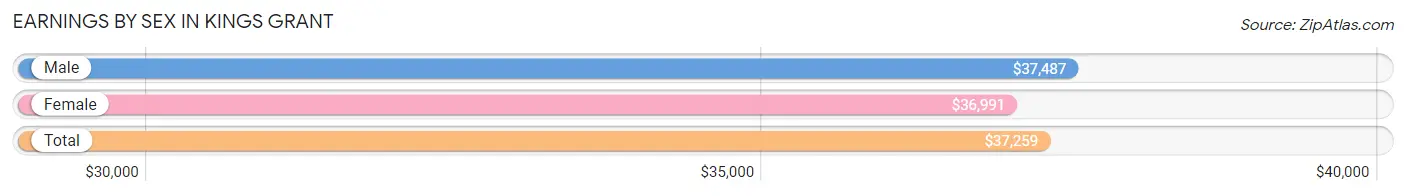
| Sex | Number | Average Earnings |
| Male | 2,675 (50.5%) | $37,487 |
| Female | 2,623 (49.5%) | $36,991 |
| Total | 5,298 (100.0%) | $37,259 |
Earnings by Sex by Income Bracket in Kings Grant
The most common earnings brackets in Kings Grant are $22,500 to $24,999 for men (571 | 21.3%) and $40,000 to $44,999 for women (304 | 11.6%).
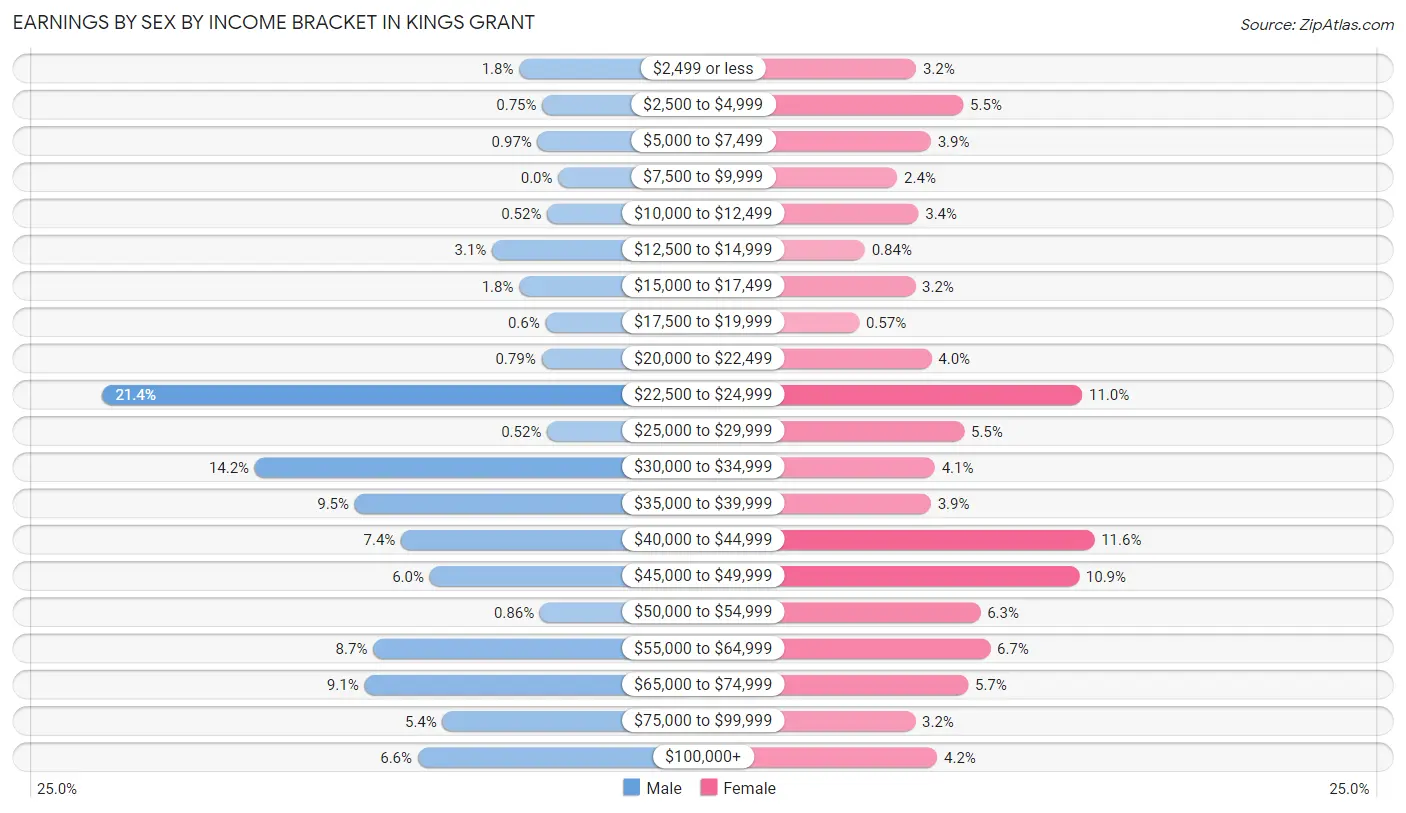
| Income | Male | Female |
| $2,499 or less | 49 (1.8%) | 85 (3.2%) |
| $2,500 to $4,999 | 20 (0.7%) | 143 (5.4%) |
| $5,000 to $7,499 | 26 (1.0%) | 103 (3.9%) |
| $7,500 to $9,999 | 0 (0.0%) | 62 (2.4%) |
| $10,000 to $12,499 | 14 (0.5%) | 88 (3.4%) |
| $12,500 to $14,999 | 83 (3.1%) | 22 (0.8%) |
| $15,000 to $17,499 | 49 (1.8%) | 84 (3.2%) |
| $17,500 to $19,999 | 16 (0.6%) | 15 (0.6%) |
| $20,000 to $22,499 | 21 (0.8%) | 104 (4.0%) |
| $22,500 to $24,999 | 571 (21.3%) | 289 (11.0%) |
| $25,000 to $29,999 | 14 (0.5%) | 144 (5.5%) |
| $30,000 to $34,999 | 380 (14.2%) | 108 (4.1%) |
| $35,000 to $39,999 | 255 (9.5%) | 103 (3.9%) |
| $40,000 to $44,999 | 197 (7.4%) | 304 (11.6%) |
| $45,000 to $49,999 | 161 (6.0%) | 285 (10.9%) |
| $50,000 to $54,999 | 23 (0.9%) | 164 (6.2%) |
| $55,000 to $64,999 | 232 (8.7%) | 176 (6.7%) |
| $65,000 to $74,999 | 243 (9.1%) | 149 (5.7%) |
| $75,000 to $99,999 | 145 (5.4%) | 84 (3.2%) |
| $100,000+ | 176 (6.6%) | 111 (4.2%) |
| Total | 2,675 (100.0%) | 2,623 (100.0%) |
Earnings by Sex by Educational Attainment in Kings Grant
Average earnings in Kings Grant are $38,320 for men and $42,123 for women, a difference of 9.0%. Men with an educational attainment of bachelor's degree enjoy the highest average annual earnings of $56,064, while those with less than high school education earn the least with $23,773. Women with an educational attainment of graduate degree earn the most with the average annual earnings of $51,818, while those with college or associate's degree education have the smallest earnings of $37,061.
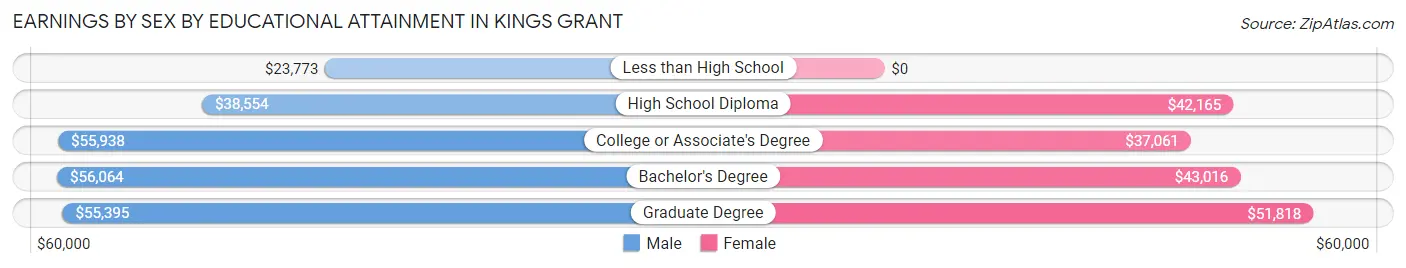
| Educational Attainment | Male Income | Female Income |
| Less than High School | $23,773 | $0 |
| High School Diploma | $38,554 | $42,165 |
| College or Associate's Degree | $55,938 | $37,061 |
| Bachelor's Degree | $56,064 | $43,016 |
| Graduate Degree | $55,395 | $51,818 |
| Total | $38,320 | $42,123 |
Family Income in Kings Grant
Family Income Brackets in Kings Grant
According to the Kings Grant family income data, there are 558 families falling into the $100,000 to $149,999 income range, which is the most common income bracket and makes up 24.3% of all families. Conversely, the $25,000 to $34,999 income bracket is the least frequent group with only 30 families (1.3%) belonging to this category.
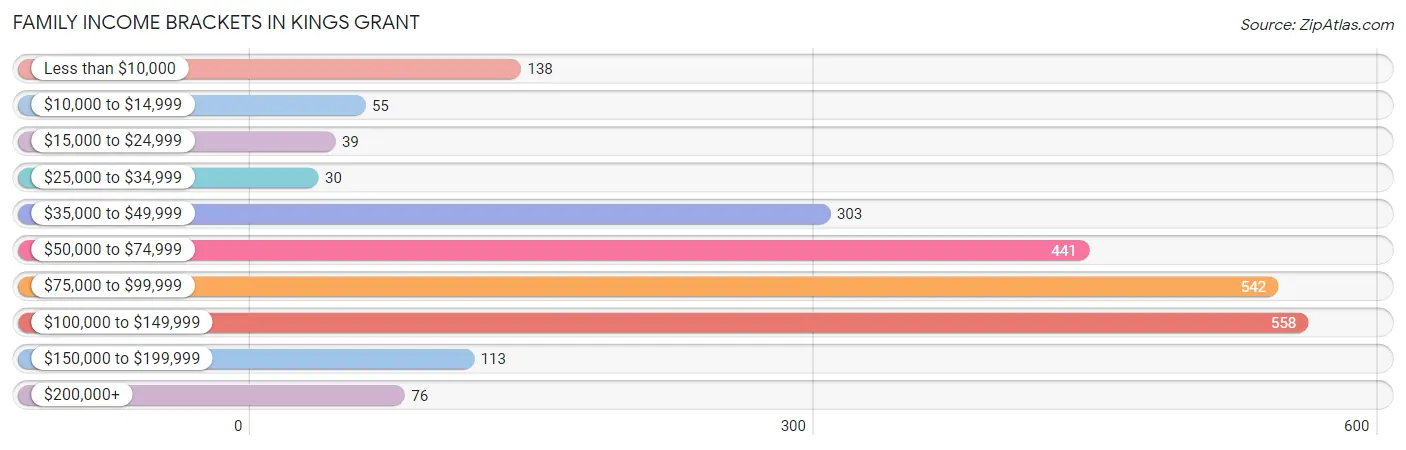
| Income Bracket | # Families | % Families |
| Less than $10,000 | 138 | 6.0% |
| $10,000 to $14,999 | 55 | 2.4% |
| $15,000 to $24,999 | 39 | 1.7% |
| $25,000 to $34,999 | 30 | 1.3% |
| $35,000 to $49,999 | 303 | 13.2% |
| $50,000 to $74,999 | 441 | 19.2% |
| $75,000 to $99,999 | 542 | 23.6% |
| $100,000 to $149,999 | 558 | 24.3% |
| $150,000 to $199,999 | 113 | 4.9% |
| $200,000+ | 76 | 3.3% |
Family Income by Famaliy Size in Kings Grant
5-person families (70 | 3.0%) account for the highest median family income in Kings Grant with $150,833 per family, while 2-person families (1,418 | 61.7%) have the highest median income of $38,311 per family member.
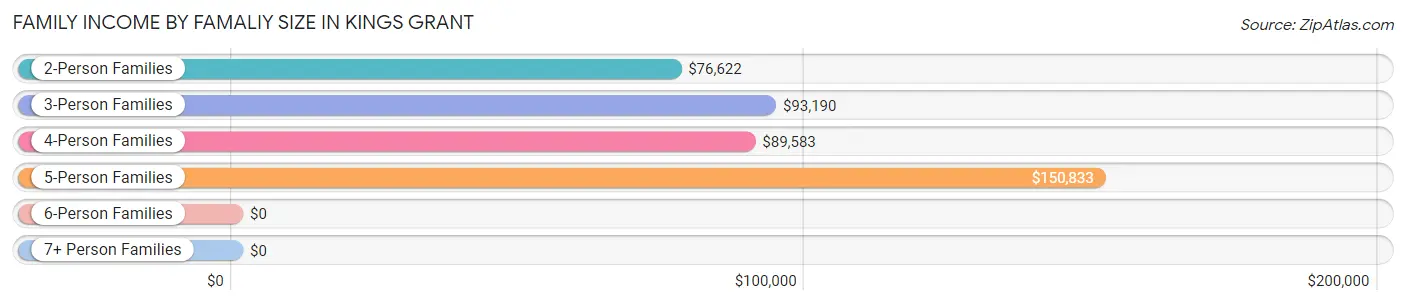
| Income Bracket | # Families | Median Income |
| 2-Person Families | 1,418 (61.7%) | $76,622 |
| 3-Person Families | 497 (21.6%) | $93,190 |
| 4-Person Families | 302 (13.2%) | $89,583 |
| 5-Person Families | 70 (3.0%) | $150,833 |
| 6-Person Families | 10 (0.4%) | $0 |
| 7+ Person Families | 0 (0.0%) | $0 |
| Total | 2,297 (100.0%) | $83,051 |
Family Income by Number of Earners in Kings Grant
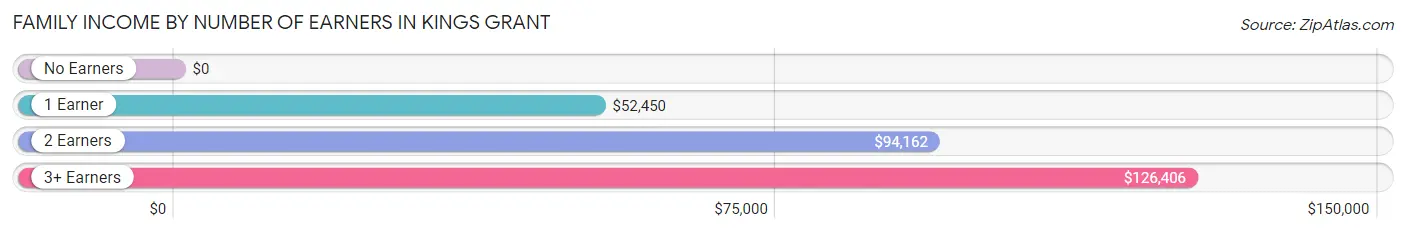
| Number of Earners | # Families | Median Income |
| No Earners | 305 (13.3%) | $0 |
| 1 Earner | 618 (26.9%) | $52,450 |
| 2 Earners | 1,182 (51.5%) | $94,162 |
| 3+ Earners | 192 (8.4%) | $126,406 |
| Total | 2,297 (100.0%) | $83,051 |
Household Income in Kings Grant
Household Income Brackets in Kings Grant
With 816 households falling in the category, the $15,000 to $24,999 income range is the most frequent in Kings Grant, accounting for 20.7% of all households. In contrast, only 67 households (1.7%) fall into the $10,000 to $14,999 income bracket, making it the least populous group.
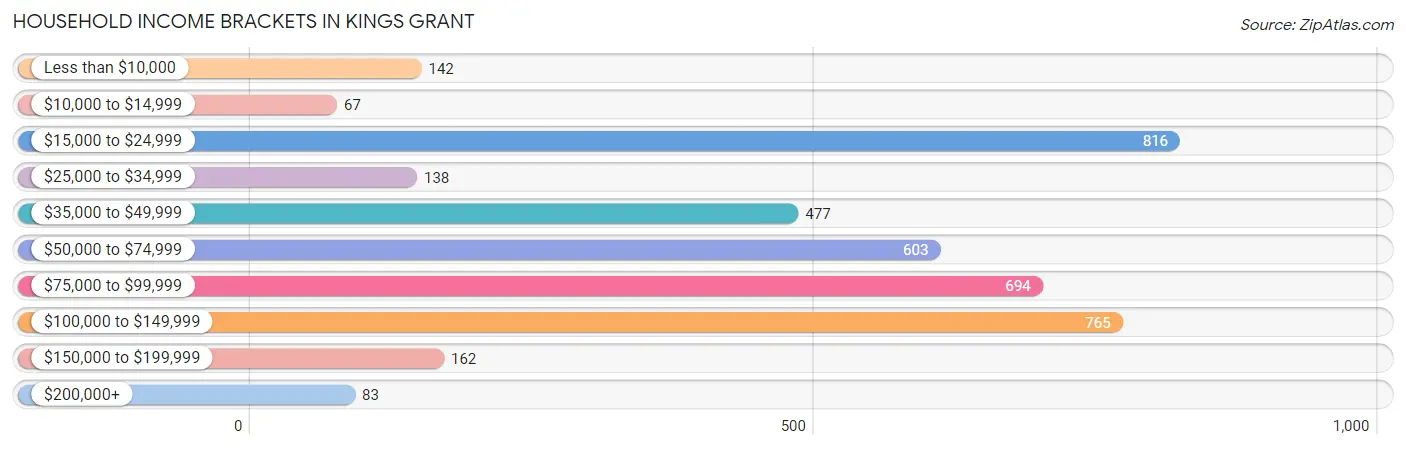
| Income Bracket | # Households | % Households |
| Less than $10,000 | 142 | 3.6% |
| $10,000 to $14,999 | 67 | 1.7% |
| $15,000 to $24,999 | 816 | 20.7% |
| $25,000 to $34,999 | 138 | 3.5% |
| $35,000 to $49,999 | 477 | 12.1% |
| $50,000 to $74,999 | 603 | 15.3% |
| $75,000 to $99,999 | 694 | 17.6% |
| $100,000 to $149,999 | 765 | 19.4% |
| $150,000 to $199,999 | 162 | 4.1% |
| $200,000+ | 83 | 2.1% |
Household Income by Householder Age in Kings Grant
The median household income in Kings Grant is $60,964, with the highest median household income of $93,991 found in the 45 to 64 years age bracket for the primary householder. A total of 1,295 households (32.9%) fall into this category. Meanwhile, the 15 to 24 years age bracket for the primary householder has the lowest median household income of $0, with 288 households (7.3%) in this group.
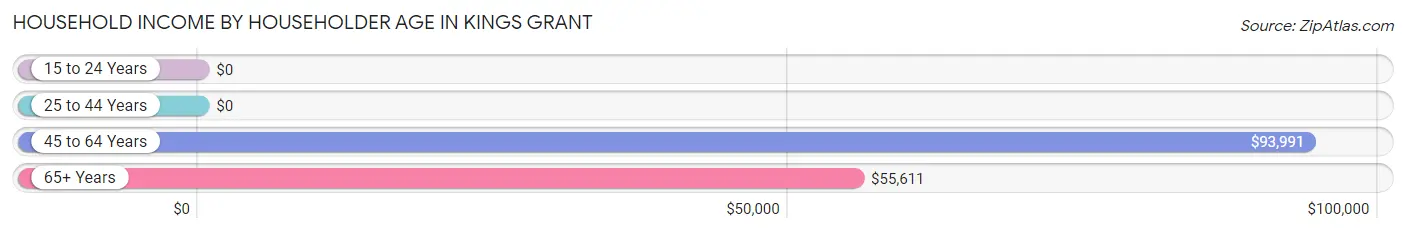
| Income Bracket | # Households | Median Income |
| 15 to 24 Years | 288 (7.3%) | $0 |
| 25 to 44 Years | 1,382 (35.1%) | $0 |
| 45 to 64 Years | 1,295 (32.9%) | $93,991 |
| 65+ Years | 976 (24.8%) | $55,611 |
| Total | 3,941 (100.0%) | $60,964 |
Poverty in Kings Grant
Income Below Poverty by Sex and Age in Kings Grant
With 7.2% poverty level for males and 9.3% for females among the residents of Kings Grant, 18 to 24 year old males and under 5 year old females are the most vulnerable to poverty, with 123 males (37.4%) and 91 females (25.4%) in their respective age groups living below the poverty level.
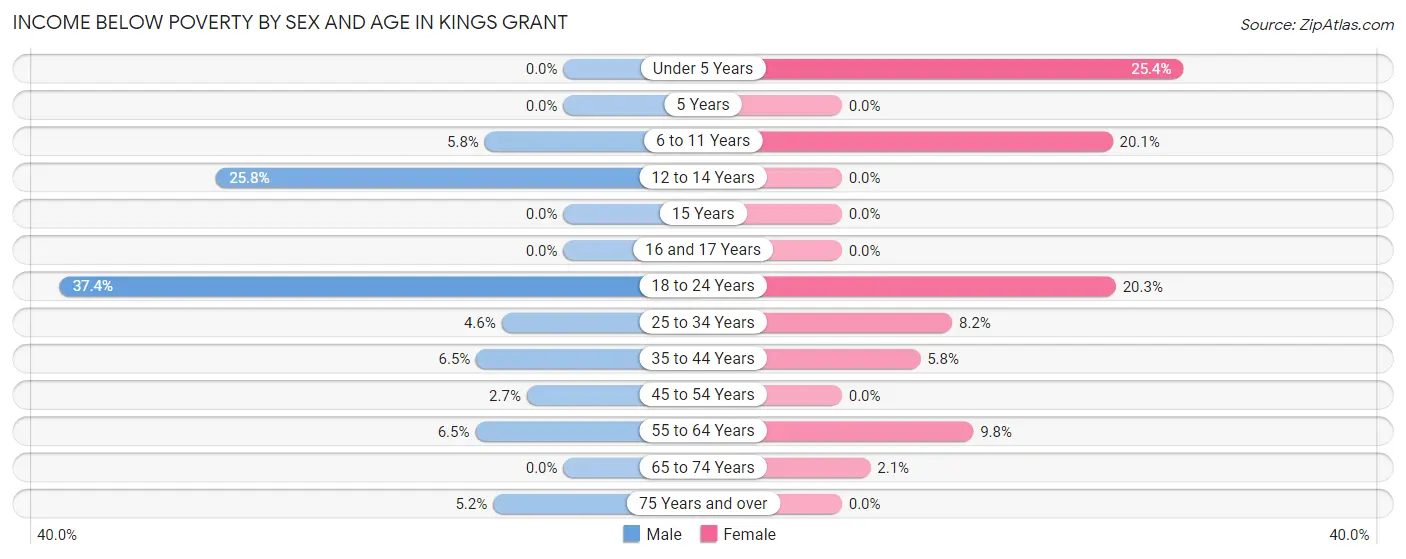
| Age Bracket | Male | Female |
| Under 5 Years | 0 (0.0%) | 91 (25.4%) |
| 5 Years | 0 (0.0%) | 0 (0.0%) |
| 6 to 11 Years | 16 (5.8%) | 42 (20.1%) |
| 12 to 14 Years | 25 (25.8%) | 0 (0.0%) |
| 15 Years | 0 (0.0%) | 0 (0.0%) |
| 16 and 17 Years | 0 (0.0%) | 0 (0.0%) |
| 18 to 24 Years | 123 (37.4%) | 121 (20.3%) |
| 25 to 34 Years | 40 (4.6%) | 42 (8.2%) |
| 35 to 44 Years | 40 (6.5%) | 33 (5.8%) |
| 45 to 54 Years | 16 (2.7%) | 0 (0.0%) |
| 55 to 64 Years | 34 (6.5%) | 57 (9.8%) |
| 65 to 74 Years | 0 (0.0%) | 12 (2.1%) |
| 75 Years and over | 13 (5.2%) | 0 (0.0%) |
| Total | 307 (7.2%) | 398 (9.3%) |
Income Above Poverty by Sex and Age in Kings Grant
According to the poverty statistics in Kings Grant, males aged under 5 years and females aged 12 to 14 years are the age groups that are most secure financially, with 100.0% of males and 100.0% of females in these age groups living above the poverty line.
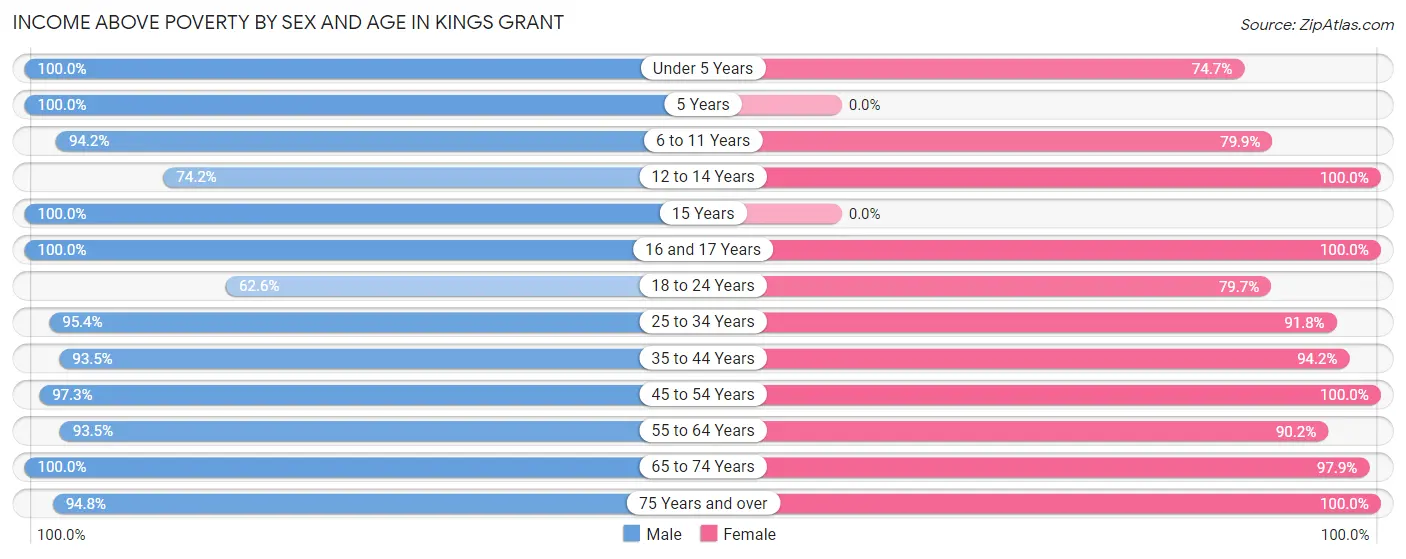
| Age Bracket | Male | Female |
| Under 5 Years | 151 (100.0%) | 268 (74.7%) |
| 5 Years | 19 (100.0%) | 0 (0.0%) |
| 6 to 11 Years | 258 (94.2%) | 167 (79.9%) |
| 12 to 14 Years | 72 (74.2%) | 80 (100.0%) |
| 15 Years | 39 (100.0%) | 0 (0.0%) |
| 16 and 17 Years | 50 (100.0%) | 75 (100.0%) |
| 18 to 24 Years | 206 (62.6%) | 474 (79.7%) |
| 25 to 34 Years | 832 (95.4%) | 471 (91.8%) |
| 35 to 44 Years | 578 (93.5%) | 534 (94.2%) |
| 45 to 54 Years | 572 (97.3%) | 527 (100.0%) |
| 55 to 64 Years | 486 (93.5%) | 527 (90.2%) |
| 65 to 74 Years | 458 (100.0%) | 553 (97.9%) |
| 75 Years and over | 236 (94.8%) | 213 (100.0%) |
| Total | 3,957 (92.8%) | 3,889 (90.7%) |
Income Below Poverty Among Married-Couple Families in Kings Grant
The poverty statistics for married-couple families in Kings Grant show that 4.9% or 79 of the total 1,623 families live below the poverty line. Families with 1 or 2 children have the highest poverty rate of 9.3%, comprising of 40 families. On the other hand, families with 3 or 4 children have the lowest poverty rate of 0.0%, which includes 0 families.
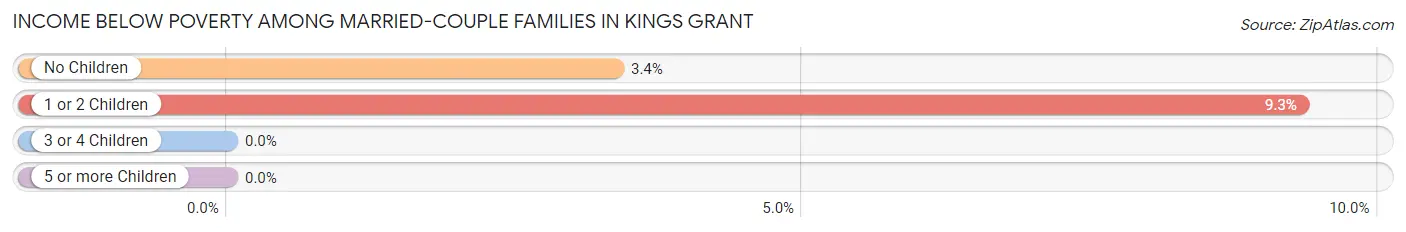
| Children | Above Poverty | Below Poverty |
| No Children | 1,123 (96.6%) | 39 (3.4%) |
| 1 or 2 Children | 389 (90.7%) | 40 (9.3%) |
| 3 or 4 Children | 32 (100.0%) | 0 (0.0%) |
| 5 or more Children | 0 (0.0%) | 0 (0.0%) |
| Total | 1,544 (95.1%) | 79 (4.9%) |
Income Below Poverty Among Single-Parent Households in Kings Grant
According to the poverty data in Kings Grant, 51.1% or 112 single-father households and 6.6% or 30 single-mother households are living below the poverty line. Among single-father households, those with 1 or 2 children have the highest poverty rate, with 112 households (61.2%) experiencing poverty. Likewise, among single-mother households, those with 1 or 2 children have the highest poverty rate, with 30 households (11.4%) falling below the poverty line.
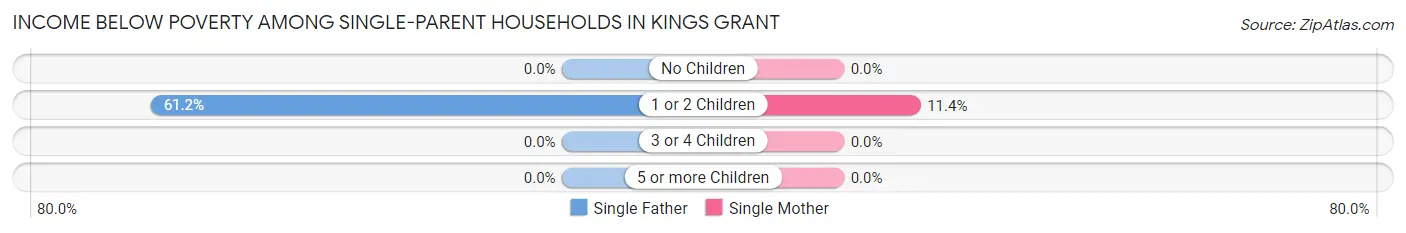
| Children | Single Father | Single Mother |
| No Children | 0 (0.0%) | 0 (0.0%) |
| 1 or 2 Children | 112 (61.2%) | 30 (11.4%) |
| 3 or 4 Children | 0 (0.0%) | 0 (0.0%) |
| 5 or more Children | 0 (0.0%) | 0 (0.0%) |
| Total | 112 (51.1%) | 30 (6.6%) |
Income Below Poverty Among Married-Couple vs Single-Parent Households in Kings Grant
The poverty data for Kings Grant shows that 79 of the married-couple family households (4.9%) and 142 of the single-parent households (21.1%) are living below the poverty level. Within the married-couple family households, those with 1 or 2 children have the highest poverty rate, with 40 households (9.3%) falling below the poverty line. Among the single-parent households, those with 1 or 2 children have the highest poverty rate, with 142 household (31.8%) living below poverty.
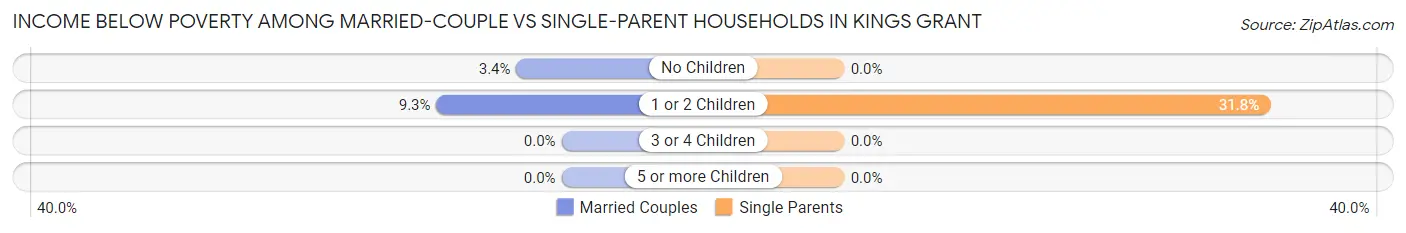
| Children | Married-Couple Families | Single-Parent Households |
| No Children | 39 (3.4%) | 0 (0.0%) |
| 1 or 2 Children | 40 (9.3%) | 142 (31.8%) |
| 3 or 4 Children | 0 (0.0%) | 0 (0.0%) |
| 5 or more Children | 0 (0.0%) | 0 (0.0%) |
| Total | 79 (4.9%) | 142 (21.1%) |
Race in Kings Grant
The most populous races in Kings Grant are White / Caucasian (6,712 | 78.4%), Black / African American (976 | 11.4%), and Hispanic or Latino (644 | 7.5%).
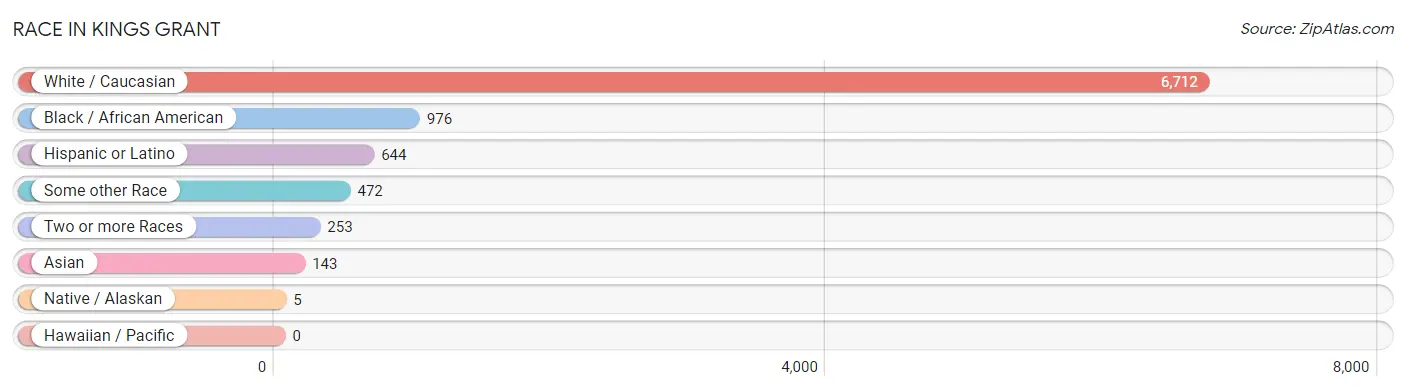
| Race | # Population | % Population |
| Asian | 143 | 1.7% |
| Black / African American | 976 | 11.4% |
| Hawaiian / Pacific | 0 | 0.0% |
| Hispanic or Latino | 644 | 7.5% |
| Native / Alaskan | 5 | 0.1% |
| White / Caucasian | 6,712 | 78.4% |
| Two or more Races | 253 | 3.0% |
| Some other Race | 472 | 5.5% |
| Total | 8,561 | 100.0% |
Ancestry in Kings Grant
The most populous ancestries reported in Kings Grant are English (995 | 11.6%), Irish (910 | 10.6%), German (765 | 8.9%), American (617 | 7.2%), and Central American (586 | 6.8%), together accounting for 45.2% of all Kings Grant residents.
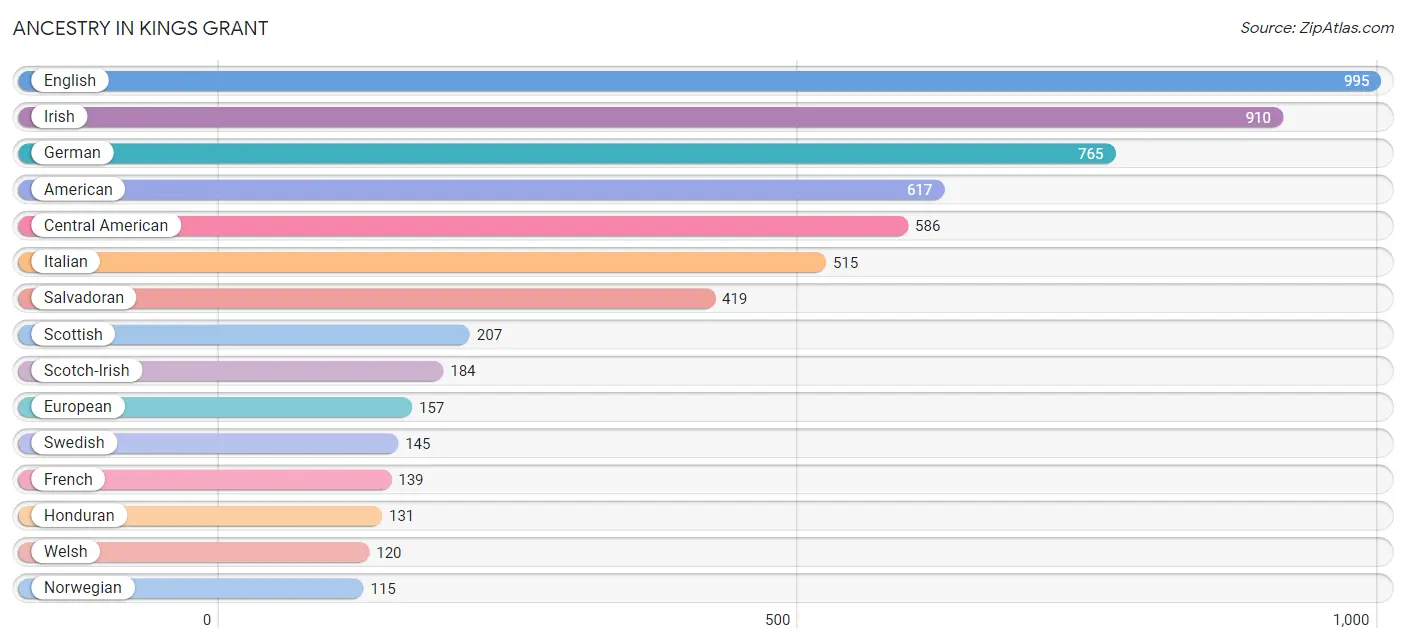
| Ancestry | # Population | % Population |
| African | 49 | 0.6% |
| American | 617 | 7.2% |
| Arab | 77 | 0.9% |
| Austrian | 9 | 0.1% |
| Blackfeet | 17 | 0.2% |
| Brazilian | 12 | 0.1% |
| Burmese | 73 | 0.9% |
| Central American | 586 | 6.8% |
| Cherokee | 5 | 0.1% |
| Czech | 13 | 0.2% |
| Danish | 73 | 0.9% |
| Dutch | 70 | 0.8% |
| Eastern European | 8 | 0.1% |
| Egyptian | 11 | 0.1% |
| English | 995 | 11.6% |
| European | 157 | 1.8% |
| Finnish | 23 | 0.3% |
| French | 139 | 1.6% |
| French Canadian | 34 | 0.4% |
| German | 765 | 8.9% |
| Guatemalan | 36 | 0.4% |
| Haitian | 67 | 0.8% |
| Honduran | 131 | 1.5% |
| Hungarian | 18 | 0.2% |
| Irish | 910 | 10.6% |
| Italian | 515 | 6.0% |
| Korean | 35 | 0.4% |
| Lebanese | 40 | 0.5% |
| Mexican | 58 | 0.7% |
| Norwegian | 115 | 1.3% |
| Osage | 7 | 0.1% |
| Palestinian | 26 | 0.3% |
| Polish | 105 | 1.2% |
| Portuguese | 32 | 0.4% |
| Salvadoran | 419 | 4.9% |
| Scandinavian | 9 | 0.1% |
| Scotch-Irish | 184 | 2.1% |
| Scottish | 207 | 2.4% |
| Slovak | 16 | 0.2% |
| Subsaharan African | 49 | 0.6% |
| Swedish | 145 | 1.7% |
| Syrian | 13 | 0.2% |
| Thai | 79 | 0.9% |
| Ukrainian | 9 | 0.1% |
| Welsh | 120 | 1.4% | View All 45 Rows |
Immigrants in Kings Grant
The most numerous immigrant groups reported in Kings Grant came from Latin America (410 | 4.8%), Central America (387 | 4.5%), El Salvador (252 | 2.9%), Asia (127 | 1.5%), and Honduras (92 | 1.1%), together accounting for 14.8% of all Kings Grant residents.
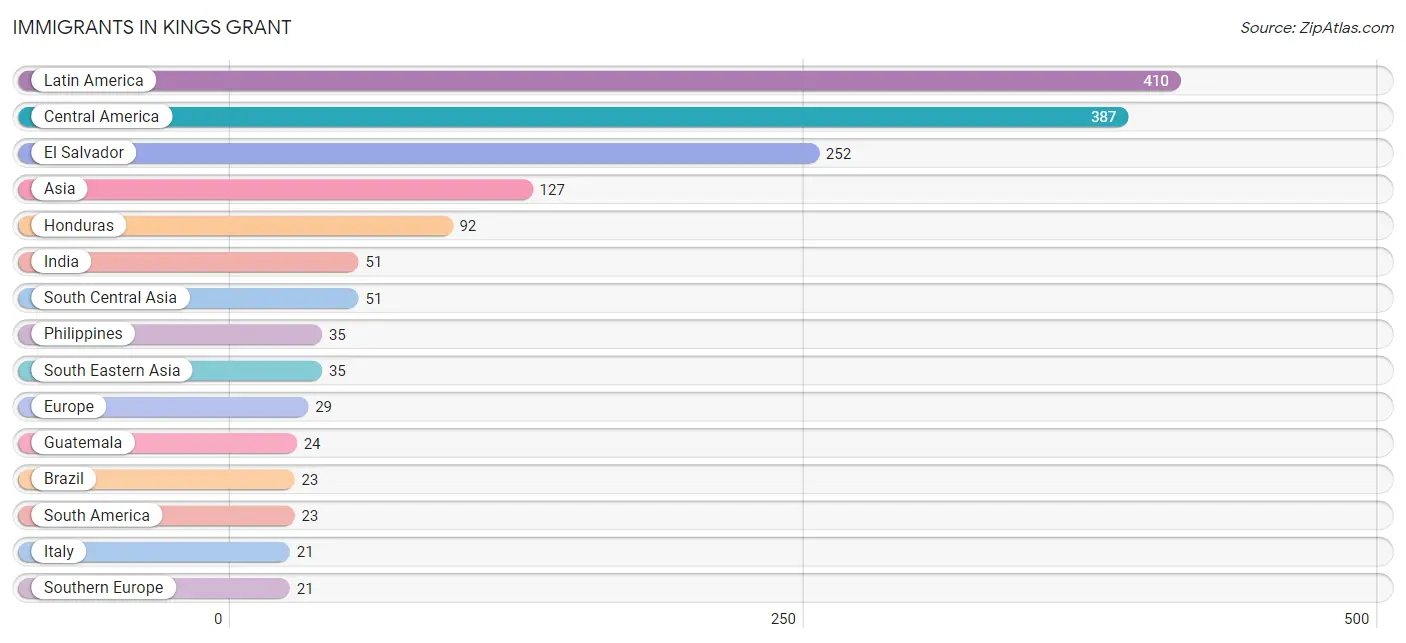
| Immigration Origin | # Population | % Population |
| Asia | 127 | 1.5% |
| Brazil | 23 | 0.3% |
| Central America | 387 | 4.5% |
| El Salvador | 252 | 2.9% |
| Europe | 29 | 0.3% |
| Guatemala | 24 | 0.3% |
| Honduras | 92 | 1.1% |
| India | 51 | 0.6% |
| Italy | 21 | 0.3% |
| Latin America | 410 | 4.8% |
| Mexico | 19 | 0.2% |
| Northern Europe | 8 | 0.1% |
| Philippines | 35 | 0.4% |
| South America | 23 | 0.3% |
| South Central Asia | 51 | 0.6% |
| South Eastern Asia | 35 | 0.4% |
| Southern Europe | 21 | 0.3% |
| Sweden | 8 | 0.1% | View All 18 Rows |
Sex and Age in Kings Grant
Sex and Age in Kings Grant
The most populous age groups in Kings Grant are 25 to 29 Years (685 | 16.1%) for men and 20 to 24 Years (548 | 12.8%) for women.
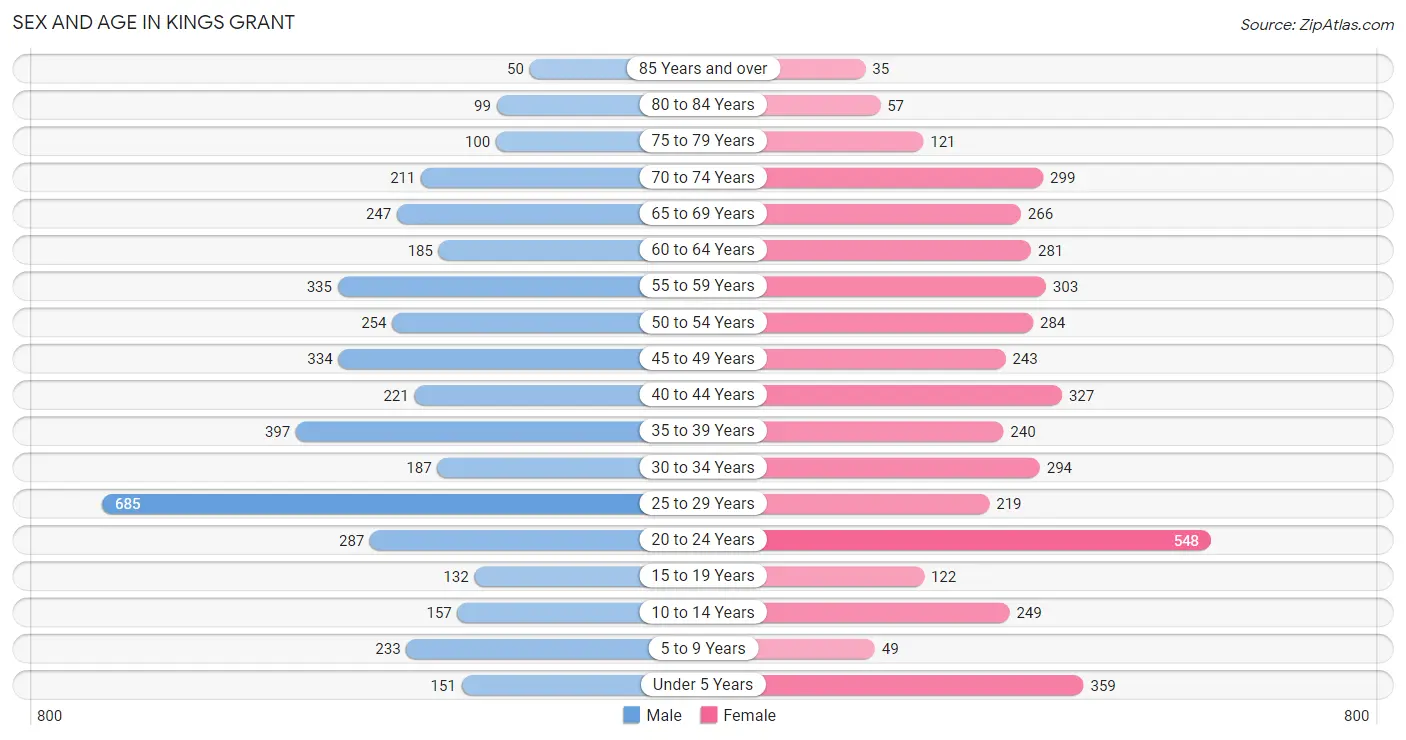
| Age Bracket | Male | Female |
| Under 5 Years | 151 (3.5%) | 359 (8.4%) |
| 5 to 9 Years | 233 (5.5%) | 49 (1.1%) |
| 10 to 14 Years | 157 (3.7%) | 249 (5.8%) |
| 15 to 19 Years | 132 (3.1%) | 122 (2.8%) |
| 20 to 24 Years | 287 (6.7%) | 548 (12.8%) |
| 25 to 29 Years | 685 (16.1%) | 219 (5.1%) |
| 30 to 34 Years | 187 (4.4%) | 294 (6.8%) |
| 35 to 39 Years | 397 (9.3%) | 240 (5.6%) |
| 40 to 44 Years | 221 (5.2%) | 327 (7.6%) |
| 45 to 49 Years | 334 (7.8%) | 243 (5.7%) |
| 50 to 54 Years | 254 (6.0%) | 284 (6.6%) |
| 55 to 59 Years | 335 (7.9%) | 303 (7.0%) |
| 60 to 64 Years | 185 (4.3%) | 281 (6.5%) |
| 65 to 69 Years | 247 (5.8%) | 266 (6.2%) |
| 70 to 74 Years | 211 (5.0%) | 299 (7.0%) |
| 75 to 79 Years | 100 (2.3%) | 121 (2.8%) |
| 80 to 84 Years | 99 (2.3%) | 57 (1.3%) |
| 85 Years and over | 50 (1.2%) | 35 (0.8%) |
| Total | 4,265 (100.0%) | 4,296 (100.0%) |
Families and Households in Kings Grant
Median Family Size in Kings Grant
The median family size in Kings Grant is 2.75 persons per family, with single male/father families (219 | 9.5%) accounting for the largest median family size of 3.27 persons per family. On the other hand, single female/mother families (455 | 19.8%) represent the smallest median family size with 2.55 persons per family.
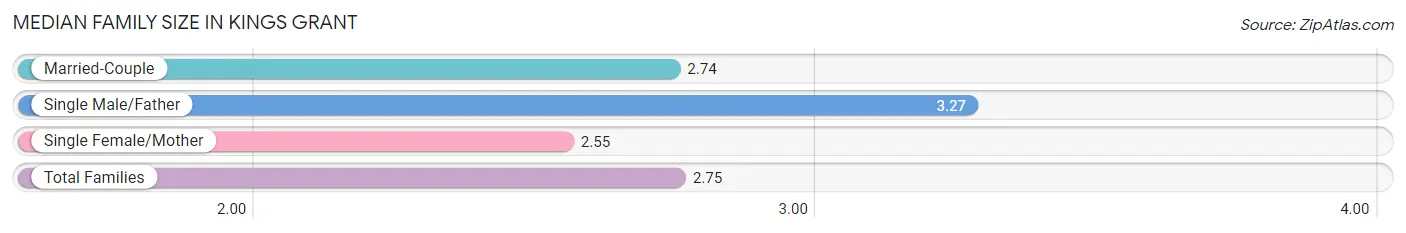
| Family Type | # Families | Family Size |
| Married-Couple | 1,623 (70.7%) | 2.74 |
| Single Male/Father | 219 (9.5%) | 3.27 |
| Single Female/Mother | 455 (19.8%) | 2.55 |
| Total Families | 2,297 (100.0%) | 2.75 |
Median Household Size in Kings Grant
The median household size in Kings Grant is 2.17 persons per household, with single male/father households (219 | 5.6%) accounting for the largest median household size of 4.17 persons per household. non-family households (1,644 | 41.7%) represent the smallest median household size with 1.18 persons per household.
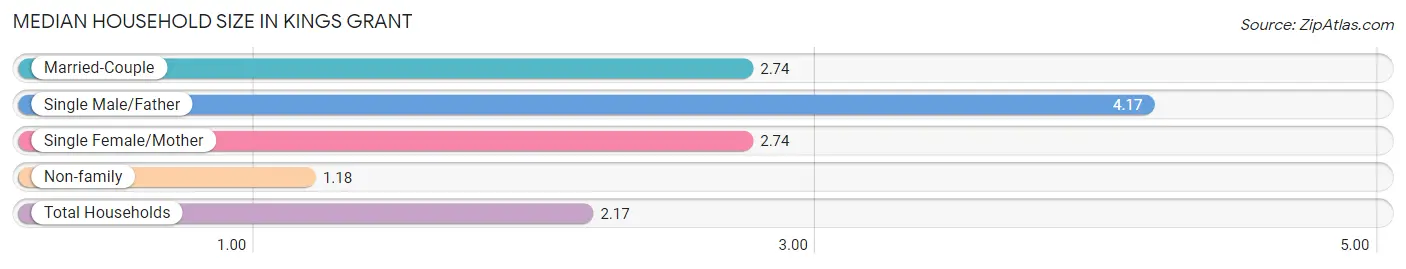
| Household Type | # Households | Household Size |
| Married-Couple | 1,623 (41.2%) | 2.74 |
| Single Male/Father | 219 (5.6%) | 4.17 |
| Single Female/Mother | 455 (11.6%) | 2.74 |
| Non-family | 1,644 (41.7%) | 1.18 |
| Total Households | 3,941 (100.0%) | 2.17 |
Household Size by Marriage Status in Kings Grant
Out of a total of 3,941 households in Kings Grant, 2,297 (58.3%) are family households, while 1,644 (41.7%) are nonfamily households. The most numerous type of family households are 2-person households, comprising 1,165, and the most common type of nonfamily households are 1-person households, comprising 1,383.
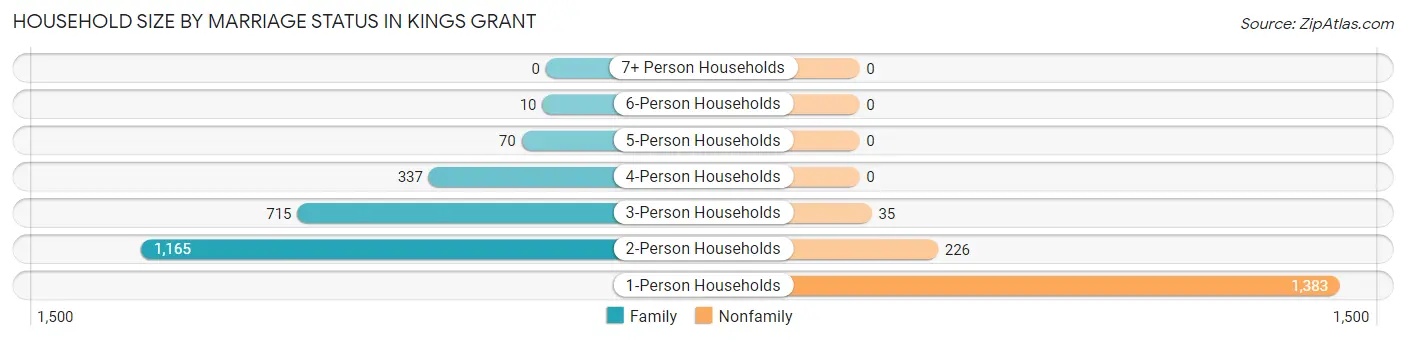
| Household Size | Family Households | Nonfamily Households |
| 1-Person Households | - | 1,383 (35.1%) |
| 2-Person Households | 1,165 (29.6%) | 226 (5.7%) |
| 3-Person Households | 715 (18.1%) | 35 (0.9%) |
| 4-Person Households | 337 (8.6%) | 0 (0.0%) |
| 5-Person Households | 70 (1.8%) | 0 (0.0%) |
| 6-Person Households | 10 (0.3%) | 0 (0.0%) |
| 7+ Person Households | 0 (0.0%) | 0 (0.0%) |
| Total | 2,297 (58.3%) | 1,644 (41.7%) |
Female Fertility in Kings Grant
Fertility by Age in Kings Grant
Average fertility rate in Kings Grant is 39.0 births per 1,000 women. Women in the age bracket of 20 to 34 years have the highest fertility rate with 53.0 births per 1,000 women. Women in the age bracket of 20 to 34 years acount for 67.5% of all women with births.
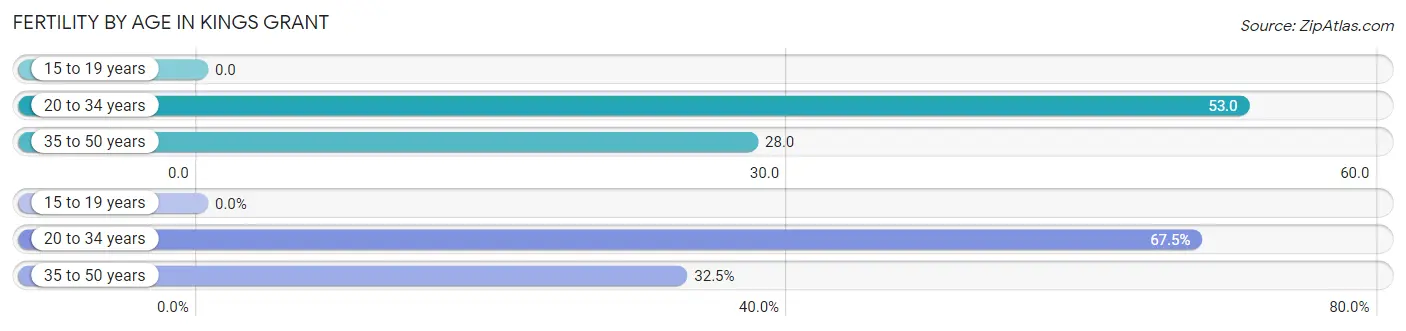
| Age Bracket | Women with Births | Births / 1,000 Women |
| 15 to 19 years | 0 (0.0%) | 0.0 |
| 20 to 34 years | 56 (67.5%) | 53.0 |
| 35 to 50 years | 27 (32.5%) | 28.0 |
| Total | 83 (100.0%) | 39.0 |
Fertility by Age by Marriage Status in Kings Grant
65.1% of women with births (83) in Kings Grant are married. The highest percentage of unmarried women with births falls into 35 to 50 years age bracket with 59.3% of them unmarried at the time of birth, while the lowest percentage of unmarried women with births belong to 20 to 34 years age bracket with 23.2% of them unmarried.
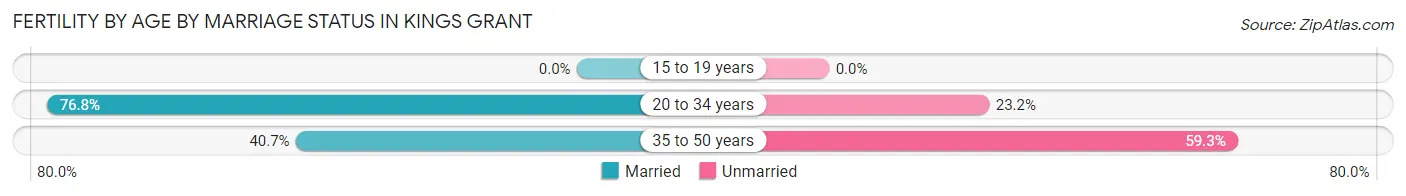
| Age Bracket | Married | Unmarried |
| 15 to 19 years | 0 (0.0%) | 0 (0.0%) |
| 20 to 34 years | 43 (76.8%) | 13 (23.2%) |
| 35 to 50 years | 11 (40.7%) | 16 (59.3%) |
| Total | 54 (65.1%) | 29 (34.9%) |
Fertility by Education in Kings Grant
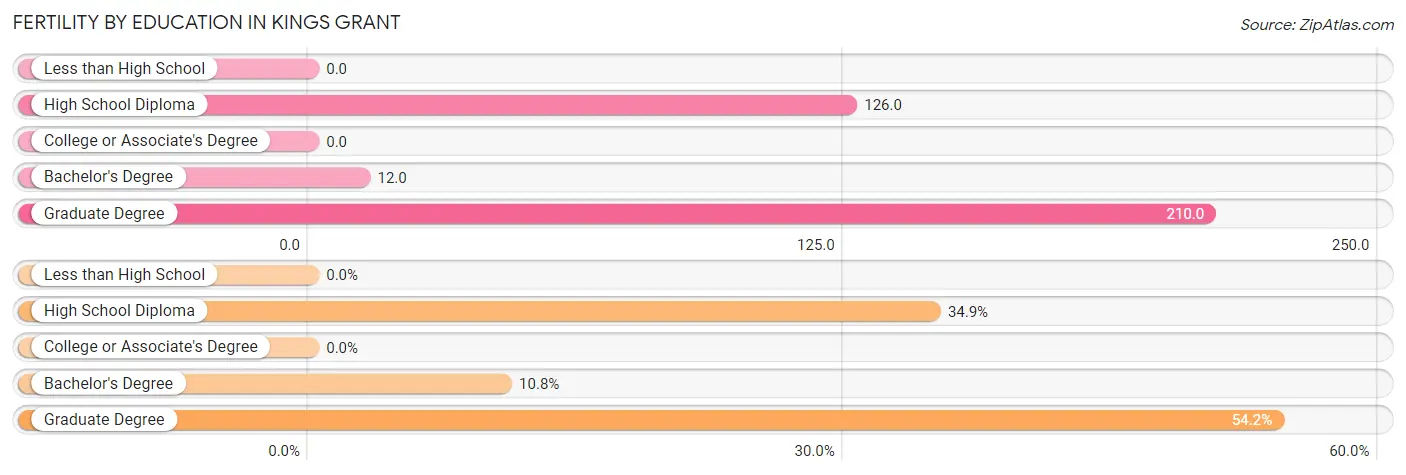
| Educational Attainment | Women with Births | Births / 1,000 Women |
| Less than High School | 0 (0.0%) | 0.0 |
| High School Diploma | 29 (34.9%) | 126.0 |
| College or Associate's Degree | 0 (0.0%) | 0.0 |
| Bachelor's Degree | 9 (10.8%) | 12.0 |
| Graduate Degree | 45 (54.2%) | 210.0 |
| Total | 83 (100.0%) | 39.0 |
Fertility by Education by Marriage Status in Kings Grant
34.9% of women with births in Kings Grant are unmarried. Women with the educational attainment of bachelor's degree are most likely to be married with 100.0% of them married at childbirth, while women with the educational attainment of high school diploma are least likely to be married with 100.0% of them unmarried at childbirth.
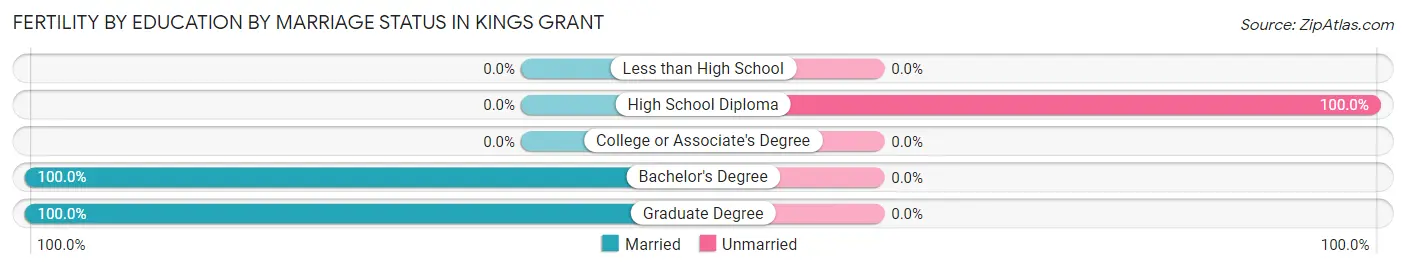
| Educational Attainment | Married | Unmarried |
| Less than High School | 0 (0.0%) | 0 (0.0%) |
| High School Diploma | 0 (0.0%) | 29 (100.0%) |
| College or Associate's Degree | 0 (0.0%) | 0 (0.0%) |
| Bachelor's Degree | 9 (100.0%) | 0 (0.0%) |
| Graduate Degree | 45 (100.0%) | 0 (0.0%) |
| Total | 54 (65.1%) | 29 (34.9%) |
Employment Characteristics in Kings Grant
Employment by Class of Employer in Kings Grant
Among the 4,935 employed individuals in Kings Grant, private company employees (2,980 | 60.4%), self-employed (not incorporated) (848 | 17.2%), and not-for-profit organizations (502 | 10.2%) make up the most common classes of employment.
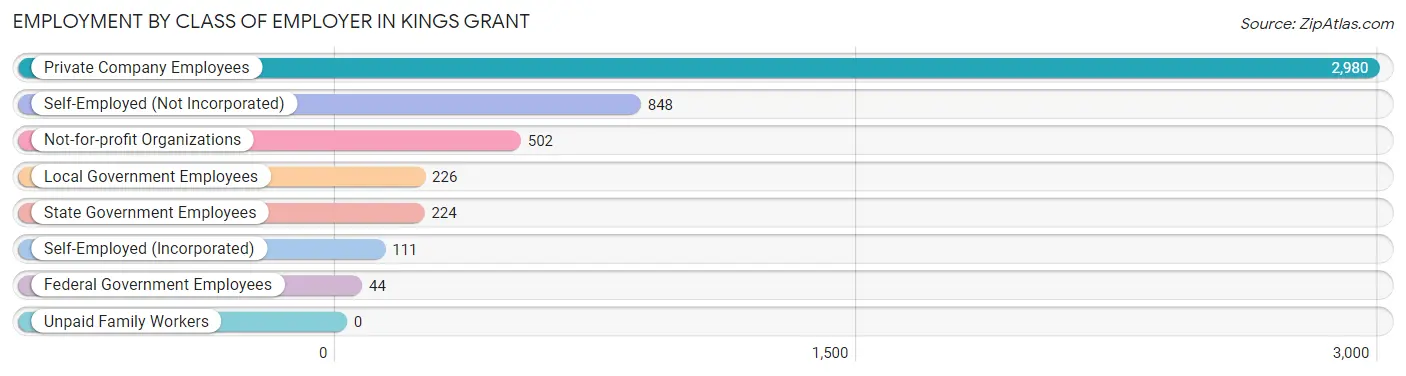
| Employer Class | # Employees | % Employees |
| Private Company Employees | 2,980 | 60.4% |
| Self-Employed (Incorporated) | 111 | 2.2% |
| Self-Employed (Not Incorporated) | 848 | 17.2% |
| Not-for-profit Organizations | 502 | 10.2% |
| Local Government Employees | 226 | 4.6% |
| State Government Employees | 224 | 4.5% |
| Federal Government Employees | 44 | 0.9% |
| Unpaid Family Workers | 0 | 0.0% |
| Total | 4,935 | 100.0% |
Employment Status by Age in Kings Grant
According to the labor force statistics for Kings Grant, out of the total population over 16 years of age (7,324), 70.1% or 5,134 individuals are in the labor force, with 2.3% or 118 of them unemployed. The age group with the highest labor force participation rate is 35 to 44 years, with 94.0% or 1,114 individuals in the labor force. Within the labor force, the 16 to 19 years age range has the highest percentage of unemployed individuals, with 26.6% or 17 of them being unemployed.
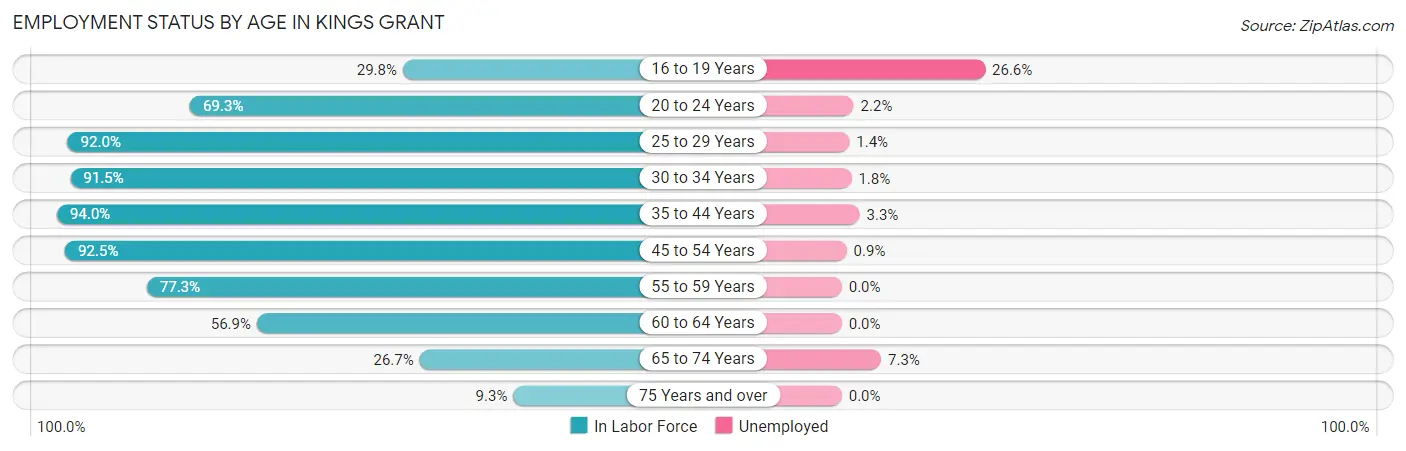
| Age Bracket | In Labor Force | Unemployed |
| 16 to 19 Years | 64 (29.8%) | 17 (26.6%) |
| 20 to 24 Years | 579 (69.3%) | 13 (2.2%) |
| 25 to 29 Years | 832 (92.0%) | 12 (1.4%) |
| 30 to 34 Years | 440 (91.5%) | 8 (1.8%) |
| 35 to 44 Years | 1,114 (94.0%) | 37 (3.3%) |
| 45 to 54 Years | 1,031 (92.5%) | 9 (0.9%) |
| 55 to 59 Years | 493 (77.3%) | 0 (0.0%) |
| 60 to 64 Years | 265 (56.9%) | 0 (0.0%) |
| 65 to 74 Years | 273 (26.7%) | 20 (7.3%) |
| 75 Years and over | 43 (9.3%) | 0 (0.0%) |
| Total | 5,134 (70.1%) | 118 (2.3%) |
Employment Status by Educational Attainment in Kings Grant
According to labor force statistics for Kings Grant, 87.2% of individuals (4,176) out of the total population between 25 and 64 years of age (4,789) are in the labor force, with 1.6% or 67 of them being unemployed. The group with the highest labor force participation rate are those with the educational attainment of bachelor's degree or higher, with 95.2% or 1,336 individuals in the labor force. Within the labor force, individuals with college / associate degree education have the highest percentage of unemployment, with 3.4% or 45 of them being unemployed.
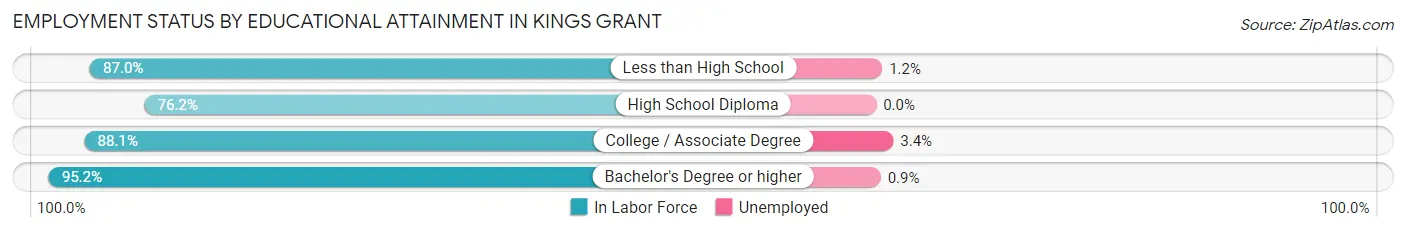
| Educational Attainment | In Labor Force | Unemployed |
| Less than High School | 641 (87.0%) | 9 (1.2%) |
| High School Diploma | 863 (76.2%) | 0 (0.0%) |
| College / Associate Degree | 1,336 (88.1%) | 52 (3.4%) |
| Bachelor's Degree or higher | 1,336 (95.2%) | 13 (0.9%) |
| Total | 4,176 (87.2%) | 77 (1.6%) |
Employment Occupations by Sex in Kings Grant
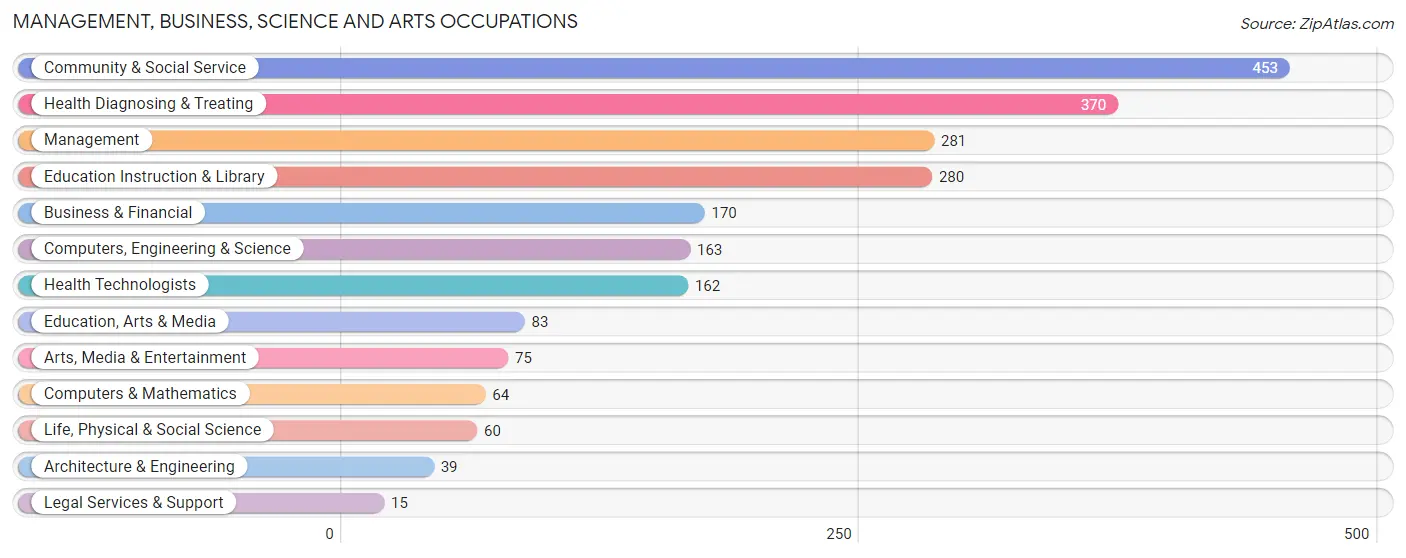
Management, Business, Science and Arts Occupations
The most common Management, Business, Science and Arts occupations in Kings Grant are Community & Social Service (453 | 9.0%), Health Diagnosing & Treating (370 | 7.4%), Management (281 | 5.6%), Education Instruction & Library (280 | 5.6%), and Business & Financial (170 | 3.4%).
Management, Business, Science and Arts Occupations by Sex
Within the Management, Business, Science and Arts occupations in Kings Grant, the most male-oriented occupations are Architecture & Engineering (100.0%), Computers, Engineering & Science (66.9%), and Management (58.4%), while the most female-oriented occupations are Legal Services & Support (100.0%), Health Technologists (100.0%), and Health Diagnosing & Treating (94.9%).
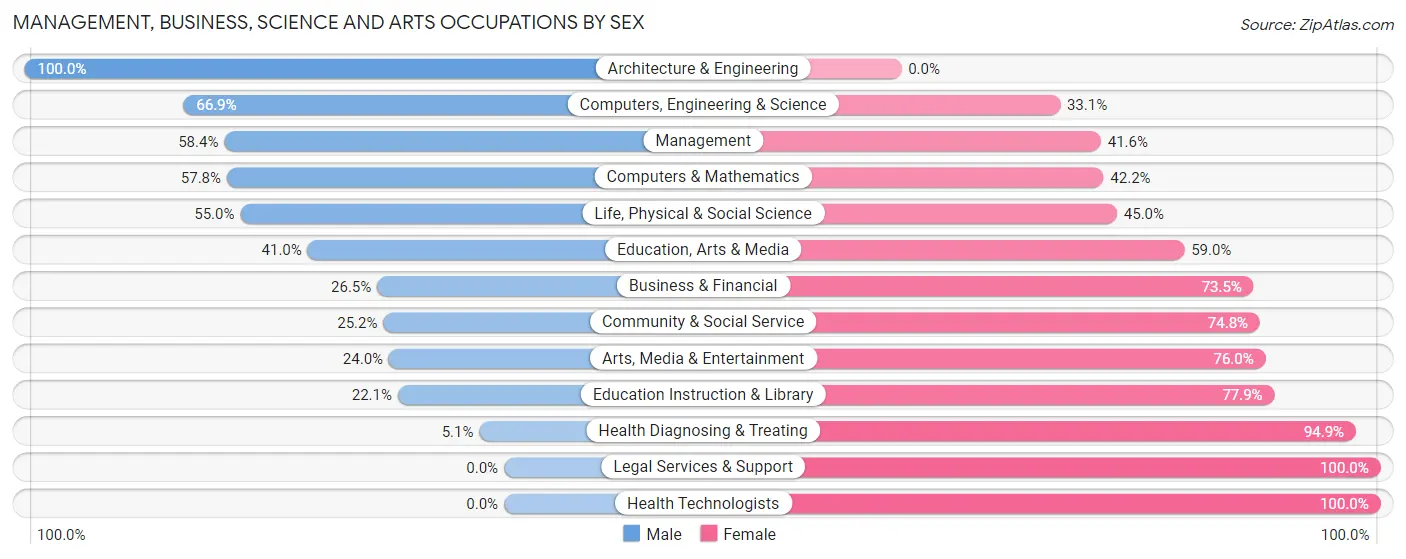
| Occupation | Male | Female |
| Management | 164 (58.4%) | 117 (41.6%) |
| Business & Financial | 45 (26.5%) | 125 (73.5%) |
| Computers, Engineering & Science | 109 (66.9%) | 54 (33.1%) |
| Computers & Mathematics | 37 (57.8%) | 27 (42.2%) |
| Architecture & Engineering | 39 (100.0%) | 0 (0.0%) |
| Life, Physical & Social Science | 33 (55.0%) | 27 (45.0%) |
| Community & Social Service | 114 (25.2%) | 339 (74.8%) |
| Education, Arts & Media | 34 (41.0%) | 49 (59.0%) |
| Legal Services & Support | 0 (0.0%) | 15 (100.0%) |
| Education Instruction & Library | 62 (22.1%) | 218 (77.9%) |
| Arts, Media & Entertainment | 18 (24.0%) | 57 (76.0%) |
| Health Diagnosing & Treating | 19 (5.1%) | 351 (94.9%) |
| Health Technologists | 0 (0.0%) | 162 (100.0%) |
| Total (Category) | 451 (31.4%) | 986 (68.6%) |
| Total (Overall) | 2,560 (51.0%) | 2,458 (49.0%) |
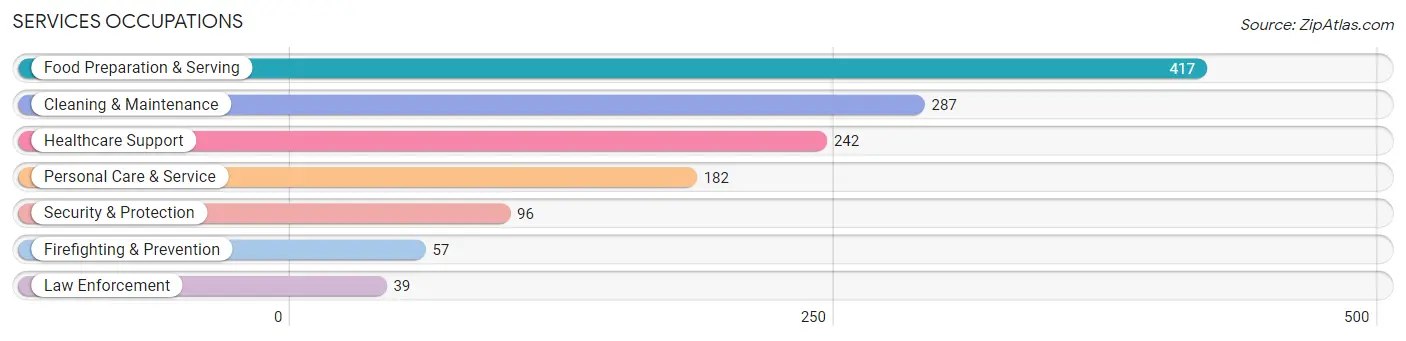
Services Occupations
The most common Services occupations in Kings Grant are Food Preparation & Serving (417 | 8.3%), Cleaning & Maintenance (287 | 5.7%), Healthcare Support (242 | 4.8%), Personal Care & Service (182 | 3.6%), and Security & Protection (96 | 1.9%).
Services Occupations by Sex
Within the Services occupations in Kings Grant, the most male-oriented occupations are Security & Protection (100.0%), Firefighting & Prevention (100.0%), and Law Enforcement (100.0%), while the most female-oriented occupations are Healthcare Support (91.7%), Food Preparation & Serving (83.2%), and Personal Care & Service (58.8%).
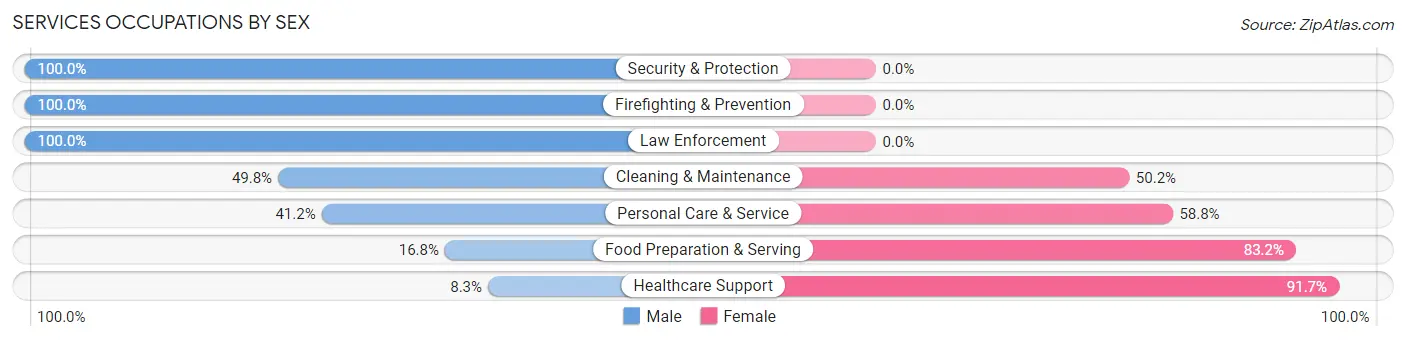
| Occupation | Male | Female |
| Healthcare Support | 20 (8.3%) | 222 (91.7%) |
| Security & Protection | 96 (100.0%) | 0 (0.0%) |
| Firefighting & Prevention | 57 (100.0%) | 0 (0.0%) |
| Law Enforcement | 39 (100.0%) | 0 (0.0%) |
| Food Preparation & Serving | 70 (16.8%) | 347 (83.2%) |
| Cleaning & Maintenance | 143 (49.8%) | 144 (50.2%) |
| Personal Care & Service | 75 (41.2%) | 107 (58.8%) |
| Total (Category) | 404 (33.0%) | 820 (67.0%) |
| Total (Overall) | 2,560 (51.0%) | 2,458 (49.0%) |
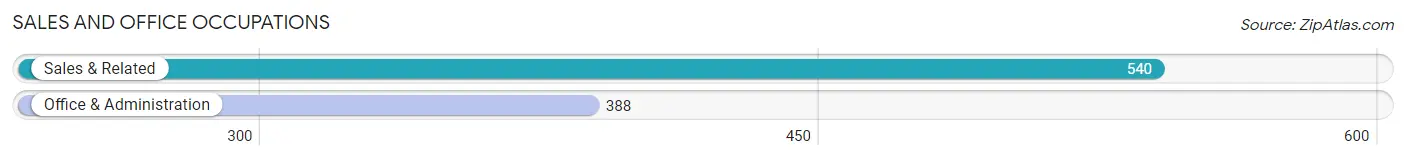
Sales and Office Occupations
The most common Sales and Office occupations in Kings Grant are Sales & Related (540 | 10.8%), and Office & Administration (388 | 7.7%).
Sales and Office Occupations by Sex
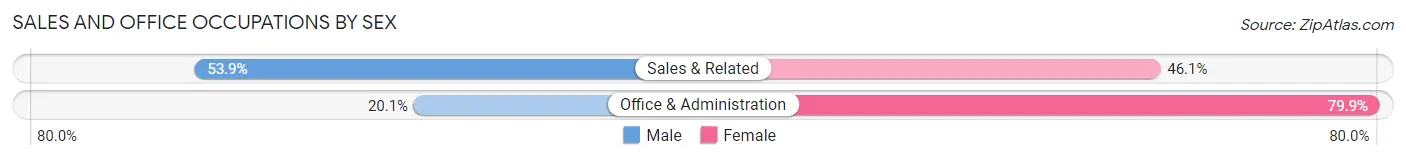
| Occupation | Male | Female |
| Sales & Related | 291 (53.9%) | 249 (46.1%) |
| Office & Administration | 78 (20.1%) | 310 (79.9%) |
| Total (Category) | 369 (39.8%) | 559 (60.2%) |
| Total (Overall) | 2,560 (51.0%) | 2,458 (49.0%) |
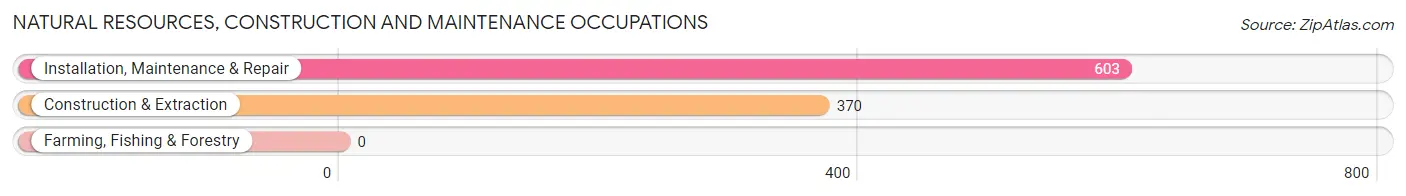
Natural Resources, Construction and Maintenance Occupations
The most common Natural Resources, Construction and Maintenance occupations in Kings Grant are Installation, Maintenance & Repair (603 | 12.0%), and Construction & Extraction (370 | 7.4%).
Natural Resources, Construction and Maintenance Occupations by Sex
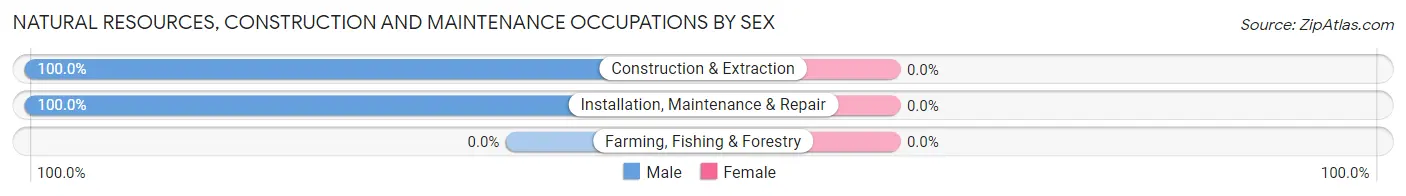
| Occupation | Male | Female |
| Farming, Fishing & Forestry | 0 (0.0%) | 0 (0.0%) |
| Construction & Extraction | 370 (100.0%) | 0 (0.0%) |
| Installation, Maintenance & Repair | 603 (100.0%) | 0 (0.0%) |
| Total (Category) | 973 (100.0%) | 0 (0.0%) |
| Total (Overall) | 2,560 (51.0%) | 2,458 (49.0%) |
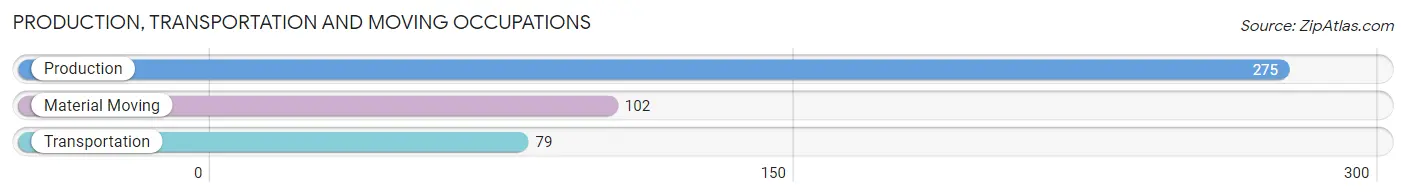
Production, Transportation and Moving Occupations
The most common Production, Transportation and Moving occupations in Kings Grant are Production (275 | 5.5%), Material Moving (102 | 2.0%), and Transportation (79 | 1.6%).
Production, Transportation and Moving Occupations by Sex
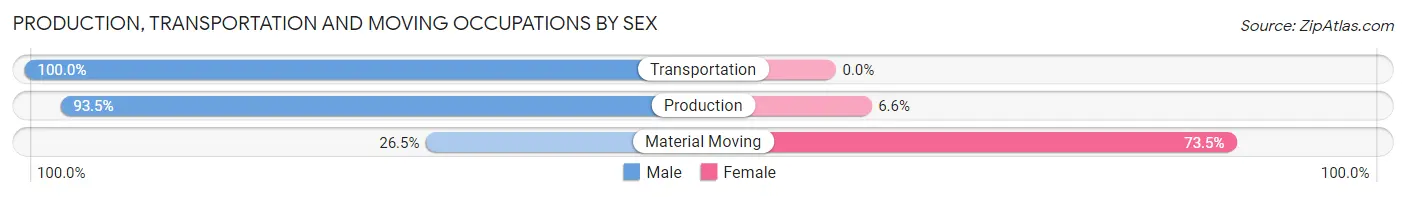
| Occupation | Male | Female |
| Production | 257 (93.4%) | 18 (6.6%) |
| Transportation | 79 (100.0%) | 0 (0.0%) |
| Material Moving | 27 (26.5%) | 75 (73.5%) |
| Total (Category) | 363 (79.6%) | 93 (20.4%) |
| Total (Overall) | 2,560 (51.0%) | 2,458 (49.0%) |
Employment Industries by Sex in Kings Grant
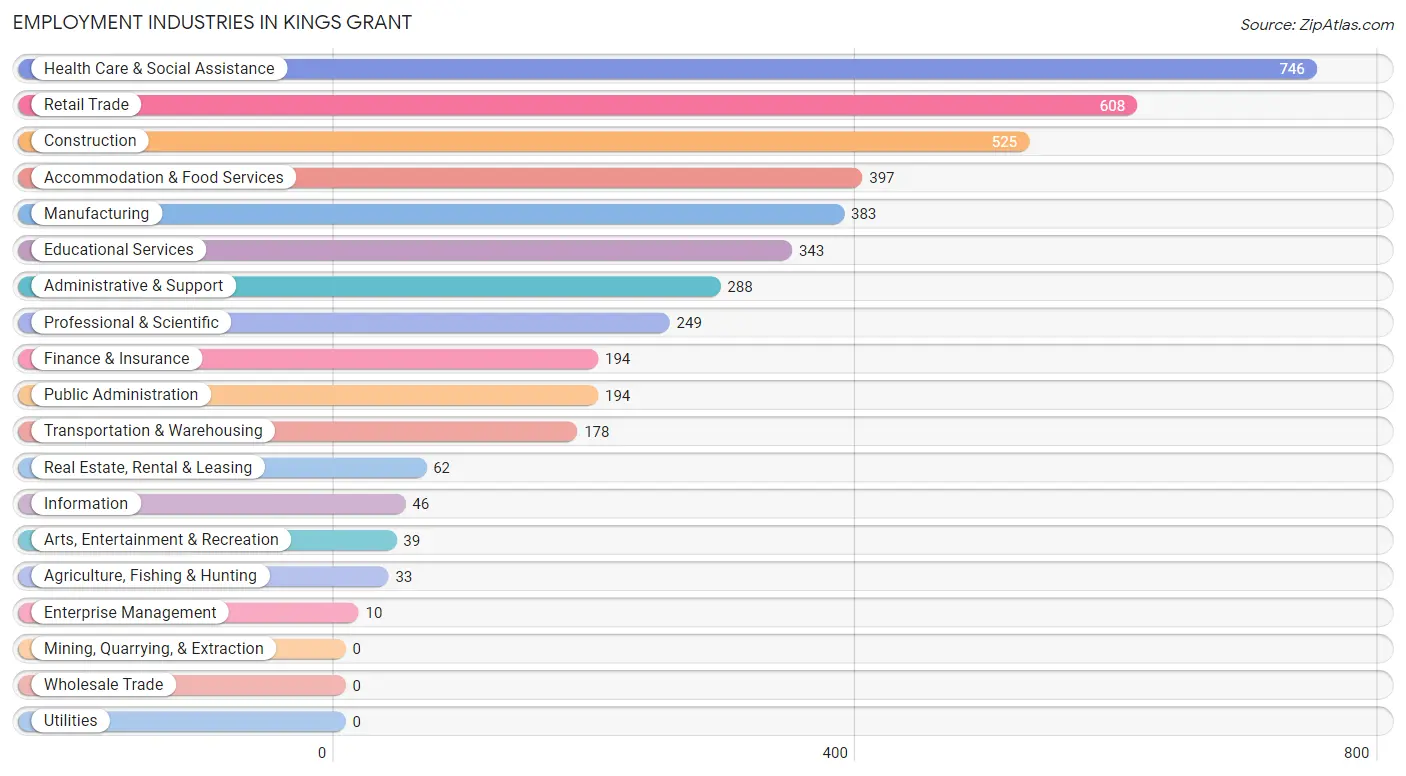
Employment Industries in Kings Grant
The major employment industries in Kings Grant include Health Care & Social Assistance (746 | 14.9%), Retail Trade (608 | 12.1%), Construction (525 | 10.5%), Accommodation & Food Services (397 | 7.9%), and Manufacturing (383 | 7.6%).
Employment Industries by Sex in Kings Grant
The Kings Grant industries that see more men than women are Agriculture, Fishing & Hunting (100.0%), Arts, Entertainment & Recreation (100.0%), and Construction (83.6%), whereas the industries that tend to have a higher number of women are Enterprise Management (100.0%), Health Care & Social Assistance (86.9%), and Finance & Insurance (79.9%).
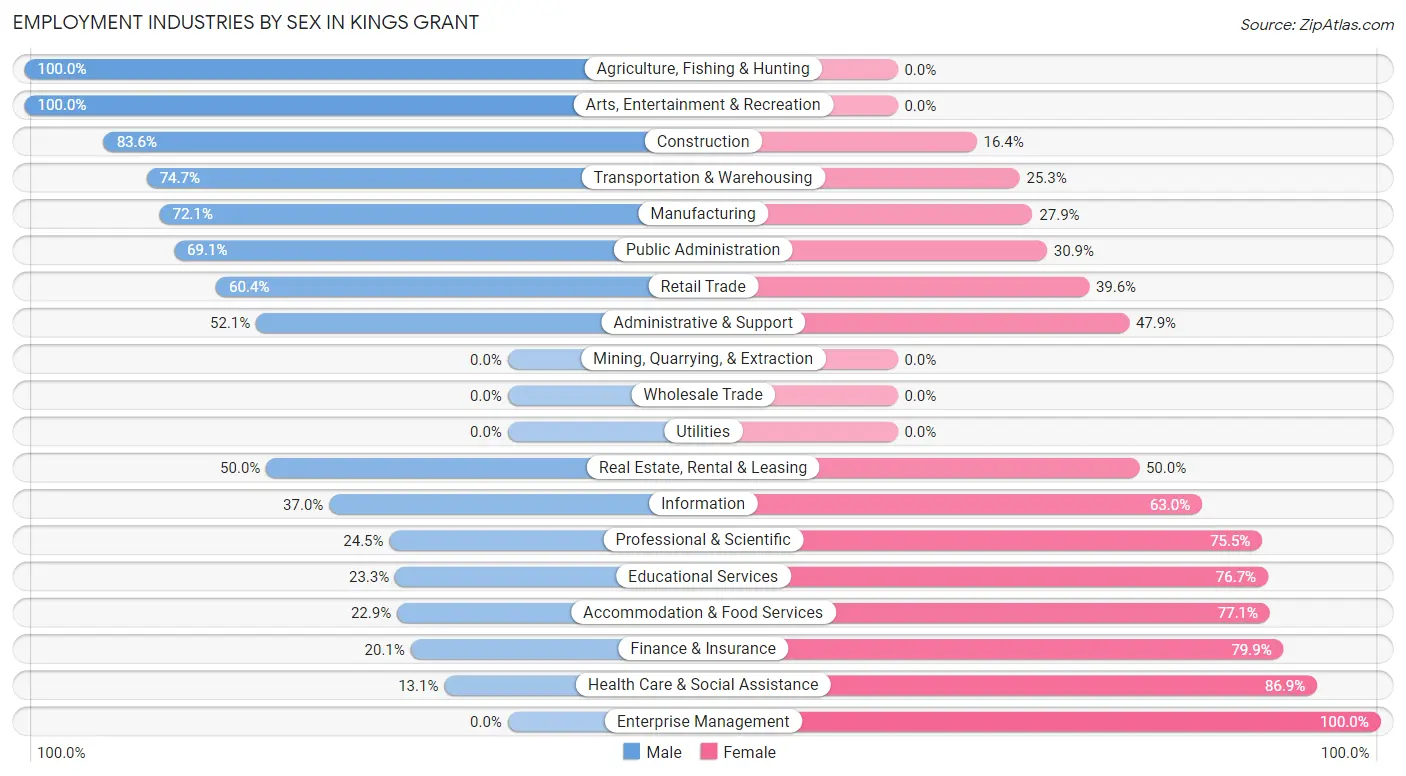
| Industry | Male | Female |
| Agriculture, Fishing & Hunting | 33 (100.0%) | 0 (0.0%) |
| Mining, Quarrying, & Extraction | 0 (0.0%) | 0 (0.0%) |
| Construction | 439 (83.6%) | 86 (16.4%) |
| Manufacturing | 276 (72.1%) | 107 (27.9%) |
| Wholesale Trade | 0 (0.0%) | 0 (0.0%) |
| Retail Trade | 367 (60.4%) | 241 (39.6%) |
| Transportation & Warehousing | 133 (74.7%) | 45 (25.3%) |
| Utilities | 0 (0.0%) | 0 (0.0%) |
| Information | 17 (37.0%) | 29 (63.0%) |
| Finance & Insurance | 39 (20.1%) | 155 (79.9%) |
| Real Estate, Rental & Leasing | 31 (50.0%) | 31 (50.0%) |
| Professional & Scientific | 61 (24.5%) | 188 (75.5%) |
| Enterprise Management | 0 (0.0%) | 10 (100.0%) |
| Administrative & Support | 150 (52.1%) | 138 (47.9%) |
| Educational Services | 80 (23.3%) | 263 (76.7%) |
| Health Care & Social Assistance | 98 (13.1%) | 648 (86.9%) |
| Arts, Entertainment & Recreation | 39 (100.0%) | 0 (0.0%) |
| Accommodation & Food Services | 91 (22.9%) | 306 (77.1%) |
| Public Administration | 134 (69.1%) | 60 (30.9%) |
| Total | 2,560 (51.0%) | 2,458 (49.0%) |
Education in Kings Grant
School Enrollment in Kings Grant
The most common levels of schooling among the 1,617 students in Kings Grant are college / undergraduate (553 | 34.2%), middle school (399 | 24.7%), and high school (246 | 15.2%).
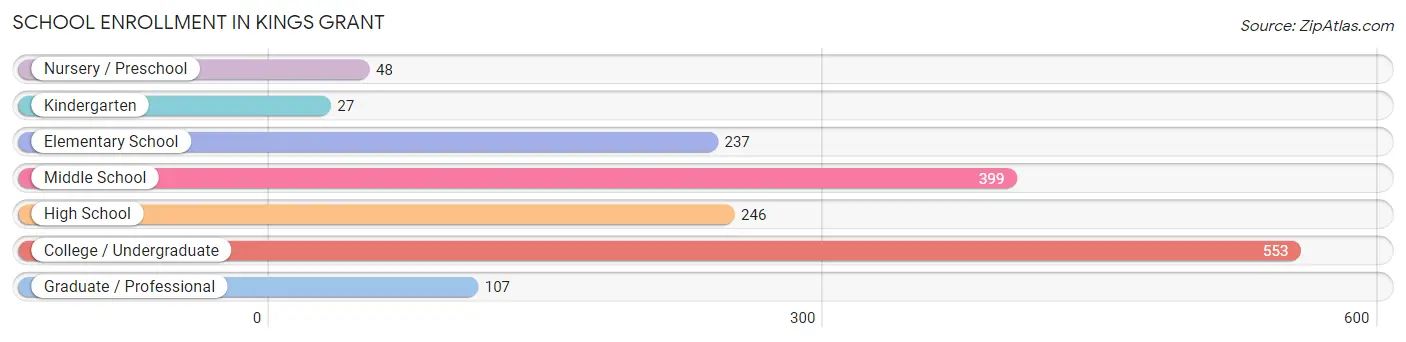
| School Level | # Students | % Students |
| Nursery / Preschool | 48 | 3.0% |
| Kindergarten | 27 | 1.7% |
| Elementary School | 237 | 14.7% |
| Middle School | 399 | 24.7% |
| High School | 246 | 15.2% |
| College / Undergraduate | 553 | 34.2% |
| Graduate / Professional | 107 | 6.6% |
| Total | 1,617 | 100.0% |
School Enrollment by Age by Funding Source in Kings Grant
Out of a total of 1,617 students who are enrolled in schools in Kings Grant, 184 (11.4%) attend a private institution, while the remaining 1,433 (88.6%) are enrolled in public schools. The age group of 3 to 4 year olds has the highest likelihood of being enrolled in private schools, with 32 (66.7% in the age bracket) enrolled. Conversely, the age group of 20 to 24 year olds has the lowest likelihood of being enrolled in a private school, with 358 (100.0% in the age bracket) attending a public institution.
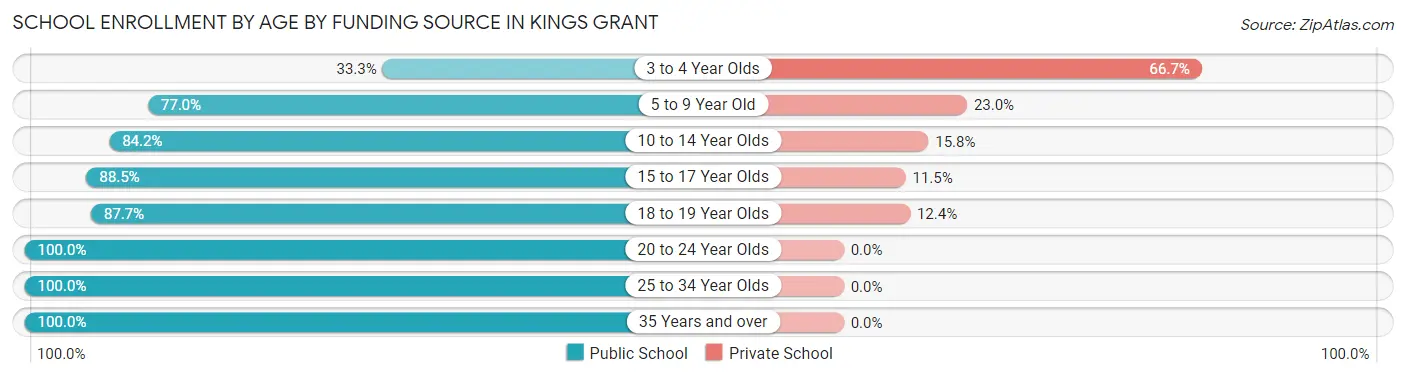
| Age Bracket | Public School | Private School |
| 3 to 4 Year Olds | 16 (33.3%) | 32 (66.7%) |
| 5 to 9 Year Old | 198 (77.0%) | 59 (23.0%) |
| 10 to 14 Year Olds | 342 (84.2%) | 64 (15.8%) |
| 15 to 17 Year Olds | 146 (88.5%) | 19 (11.5%) |
| 18 to 19 Year Olds | 71 (87.6%) | 10 (12.3%) |
| 20 to 24 Year Olds | 358 (100.0%) | 0 (0.0%) |
| 25 to 34 Year Olds | 68 (100.0%) | 0 (0.0%) |
| 35 Years and over | 234 (100.0%) | 0 (0.0%) |
| Total | 1,433 (88.6%) | 184 (11.4%) |
Educational Attainment by Field of Study in Kings Grant
Education (292 | 16.2%), business (230 | 12.8%), arts & humanities (214 | 11.9%), science & technology (207 | 11.5%), and engineering (129 | 7.2%) are the most common fields of study among 1,802 individuals in Kings Grant who have obtained a bachelor's degree or higher.
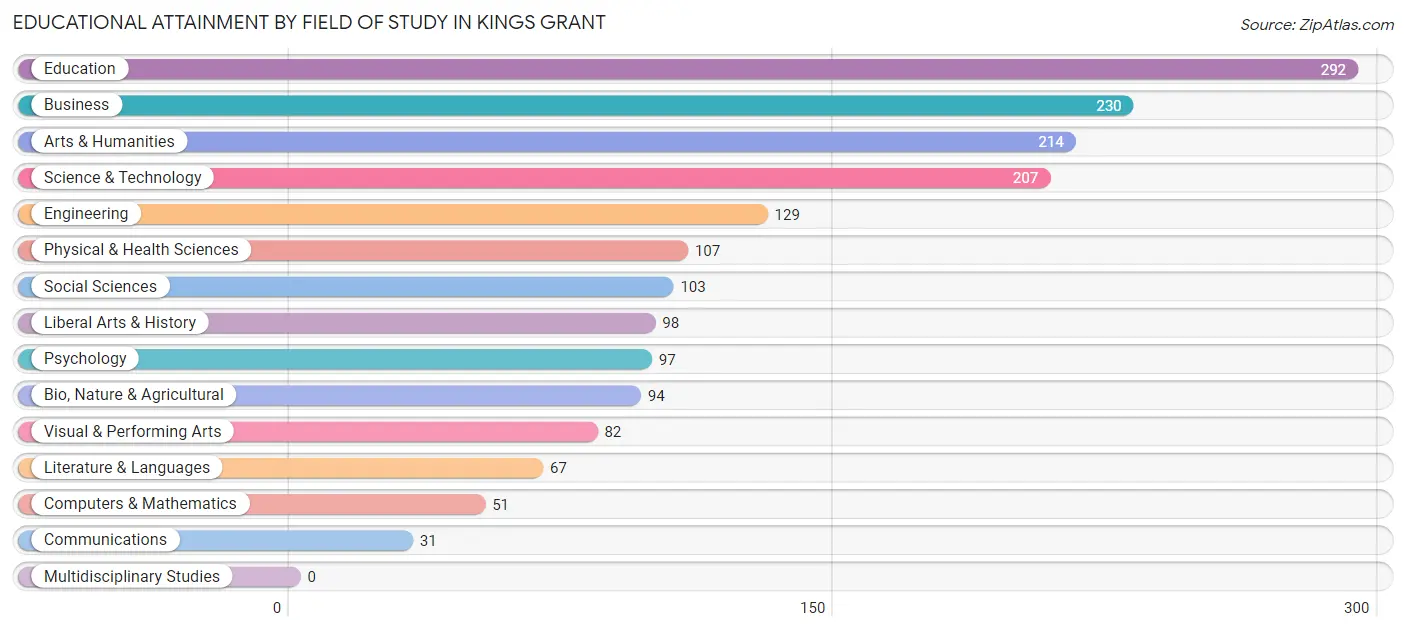
| Field of Study | # Graduates | % Graduates |
| Computers & Mathematics | 51 | 2.8% |
| Bio, Nature & Agricultural | 94 | 5.2% |
| Physical & Health Sciences | 107 | 5.9% |
| Psychology | 97 | 5.4% |
| Social Sciences | 103 | 5.7% |
| Engineering | 129 | 7.2% |
| Multidisciplinary Studies | 0 | 0.0% |
| Science & Technology | 207 | 11.5% |
| Business | 230 | 12.8% |
| Education | 292 | 16.2% |
| Literature & Languages | 67 | 3.7% |
| Liberal Arts & History | 98 | 5.4% |
| Visual & Performing Arts | 82 | 4.5% |
| Communications | 31 | 1.7% |
| Arts & Humanities | 214 | 11.9% |
| Total | 1,802 | 100.0% |
Transportation & Commute in Kings Grant
Vehicle Availability by Sex in Kings Grant
The most prevalent vehicle ownership categories in Kings Grant are males with 2 vehicles (1,406, accounting for 55.8%) and females with 2 vehicles (1,047, making up 58.2%).
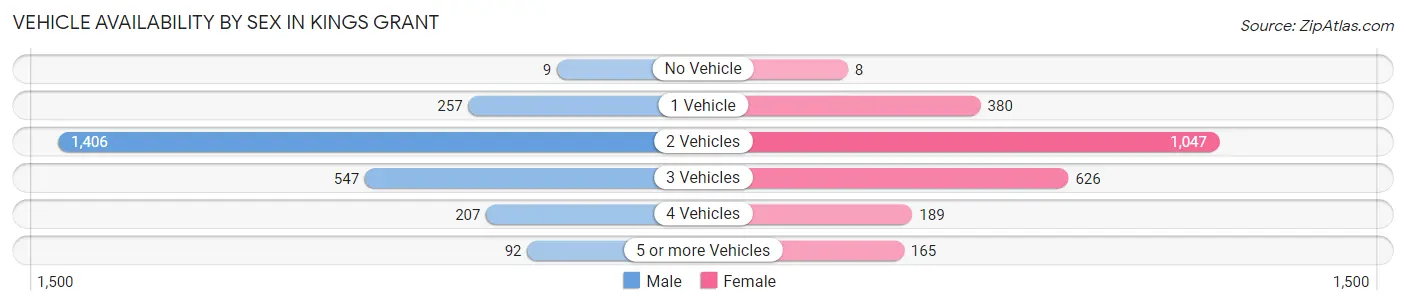
| Vehicles Available | Male | Female |
| No Vehicle | 9 (0.4%) | 8 (0.3%) |
| 1 Vehicle | 257 (10.2%) | 380 (15.7%) |
| 2 Vehicles | 1,406 (55.8%) | 1,047 (43.3%) |
| 3 Vehicles | 547 (21.7%) | 626 (25.9%) |
| 4 Vehicles | 207 (8.2%) | 189 (7.8%) |
| 5 or more Vehicles | 92 (3.6%) | 165 (6.8%) |
| Total | 2,518 (100.0%) | 2,415 (100.0%) |
Commute Time in Kings Grant
The most frequently occuring commute durations in Kings Grant are 10 to 14 minutes (1,146 commuters, 28.0%), 15 to 19 minutes (944 commuters, 23.1%), and 20 to 24 minutes (740 commuters, 18.1%).
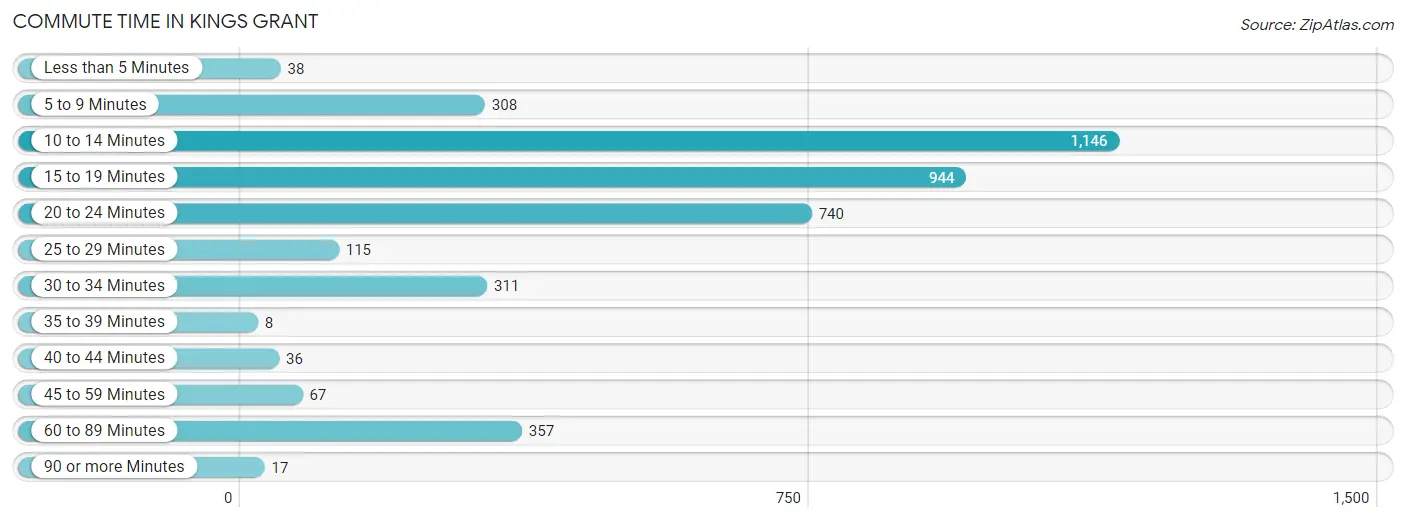
| Commute Time | # Commuters | % Commuters |
| Less than 5 Minutes | 38 | 0.9% |
| 5 to 9 Minutes | 308 | 7.5% |
| 10 to 14 Minutes | 1,146 | 28.0% |
| 15 to 19 Minutes | 944 | 23.1% |
| 20 to 24 Minutes | 740 | 18.1% |
| 25 to 29 Minutes | 115 | 2.8% |
| 30 to 34 Minutes | 311 | 7.6% |
| 35 to 39 Minutes | 8 | 0.2% |
| 40 to 44 Minutes | 36 | 0.9% |
| 45 to 59 Minutes | 67 | 1.6% |
| 60 to 89 Minutes | 357 | 8.7% |
| 90 or more Minutes | 17 | 0.4% |
Commute Time by Sex in Kings Grant
The most common commute times in Kings Grant are 10 to 14 minutes (523 commuters, 27.1%) for males and 10 to 14 minutes (623 commuters, 28.9%) for females.
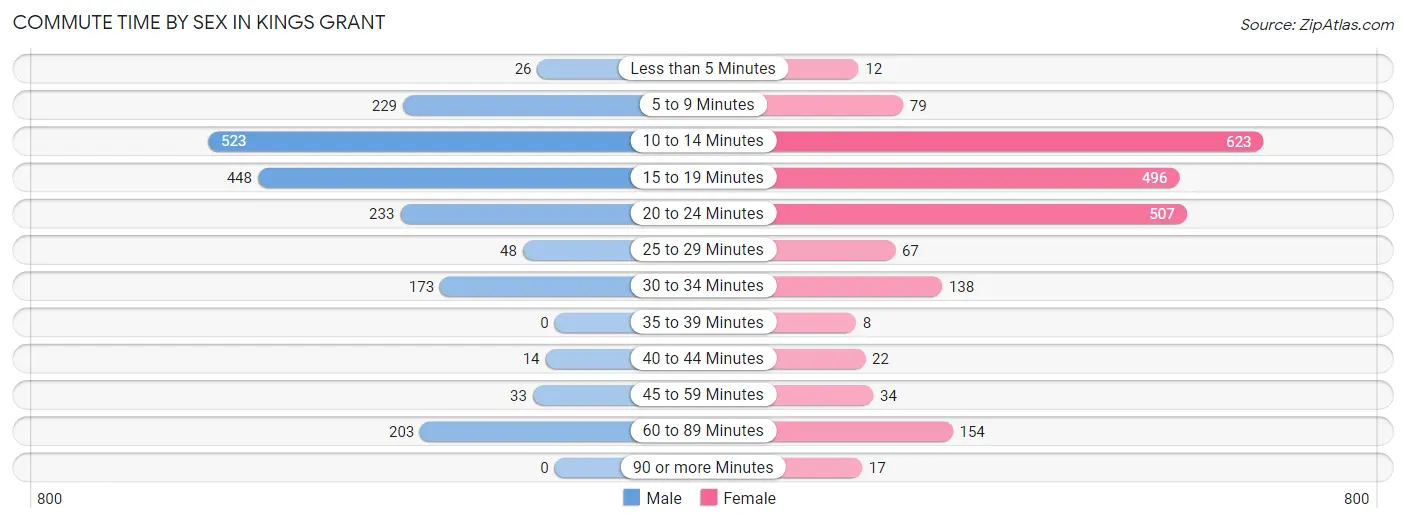
| Commute Time | Male | Female |
| Less than 5 Minutes | 26 (1.3%) | 12 (0.6%) |
| 5 to 9 Minutes | 229 (11.9%) | 79 (3.7%) |
| 10 to 14 Minutes | 523 (27.1%) | 623 (28.9%) |
| 15 to 19 Minutes | 448 (23.2%) | 496 (23.0%) |
| 20 to 24 Minutes | 233 (12.1%) | 507 (23.5%) |
| 25 to 29 Minutes | 48 (2.5%) | 67 (3.1%) |
| 30 to 34 Minutes | 173 (9.0%) | 138 (6.4%) |
| 35 to 39 Minutes | 0 (0.0%) | 8 (0.4%) |
| 40 to 44 Minutes | 14 (0.7%) | 22 (1.0%) |
| 45 to 59 Minutes | 33 (1.7%) | 34 (1.6%) |
| 60 to 89 Minutes | 203 (10.5%) | 154 (7.1%) |
| 90 or more Minutes | 0 (0.0%) | 17 (0.8%) |
Time of Departure to Work by Sex in Kings Grant
The most frequent times of departure to work in Kings Grant are 8:00 AM to 8:29 AM (371, 19.2%) for males and 8:00 AM to 8:29 AM (413, 19.2%) for females.
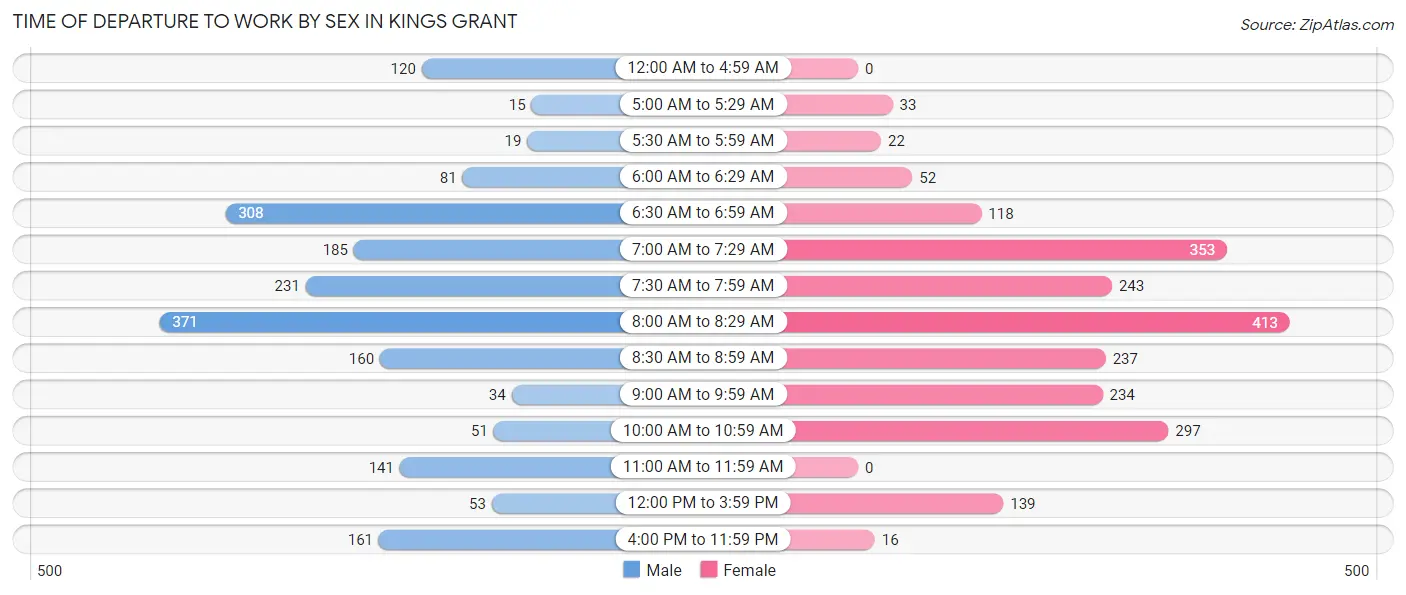
| Time of Departure | Male | Female |
| 12:00 AM to 4:59 AM | 120 (6.2%) | 0 (0.0%) |
| 5:00 AM to 5:29 AM | 15 (0.8%) | 33 (1.5%) |
| 5:30 AM to 5:59 AM | 19 (1.0%) | 22 (1.0%) |
| 6:00 AM to 6:29 AM | 81 (4.2%) | 52 (2.4%) |
| 6:30 AM to 6:59 AM | 308 (16.0%) | 118 (5.5%) |
| 7:00 AM to 7:29 AM | 185 (9.6%) | 353 (16.4%) |
| 7:30 AM to 7:59 AM | 231 (12.0%) | 243 (11.3%) |
| 8:00 AM to 8:29 AM | 371 (19.2%) | 413 (19.2%) |
| 8:30 AM to 8:59 AM | 160 (8.3%) | 237 (11.0%) |
| 9:00 AM to 9:59 AM | 34 (1.8%) | 234 (10.8%) |
| 10:00 AM to 10:59 AM | 51 (2.6%) | 297 (13.8%) |
| 11:00 AM to 11:59 AM | 141 (7.3%) | 0 (0.0%) |
| 12:00 PM to 3:59 PM | 53 (2.8%) | 139 (6.4%) |
| 4:00 PM to 11:59 PM | 161 (8.3%) | 16 (0.7%) |
| Total | 1,930 (100.0%) | 2,157 (100.0%) |
Housing Occupancy in Kings Grant
Occupancy by Ownership in Kings Grant
Of the total 3,941 dwellings in Kings Grant, owner-occupied units account for 2,597 (65.9%), while renter-occupied units make up 1,344 (34.1%).
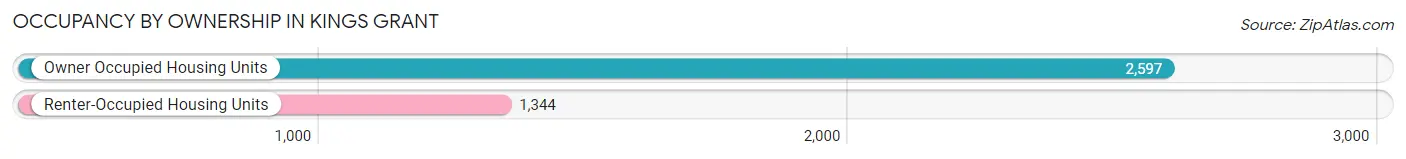
| Occupancy | # Housing Units | % Housing Units |
| Owner Occupied Housing Units | 2,597 | 65.9% |
| Renter-Occupied Housing Units | 1,344 | 34.1% |
| Total Occupied Housing Units | 3,941 | 100.0% |
Occupancy by Household Size in Kings Grant
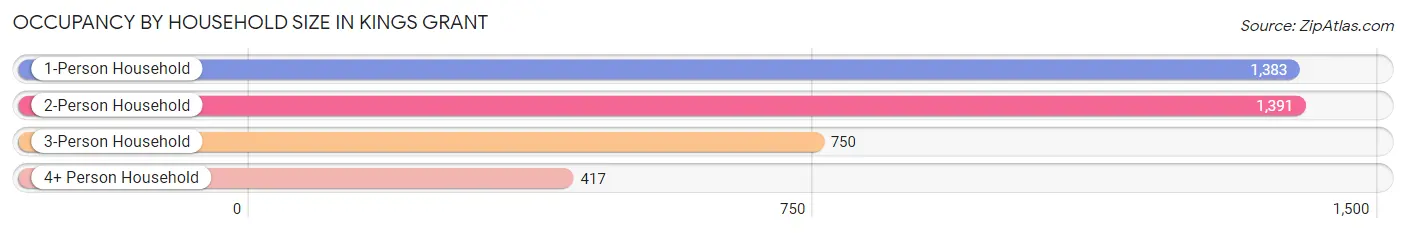
| Household Size | # Housing Units | % Housing Units |
| 1-Person Household | 1,383 | 35.1% |
| 2-Person Household | 1,391 | 35.3% |
| 3-Person Household | 750 | 19.0% |
| 4+ Person Household | 417 | 10.6% |
| Total Housing Units | 3,941 | 100.0% |
Occupancy by Ownership by Household Size in Kings Grant
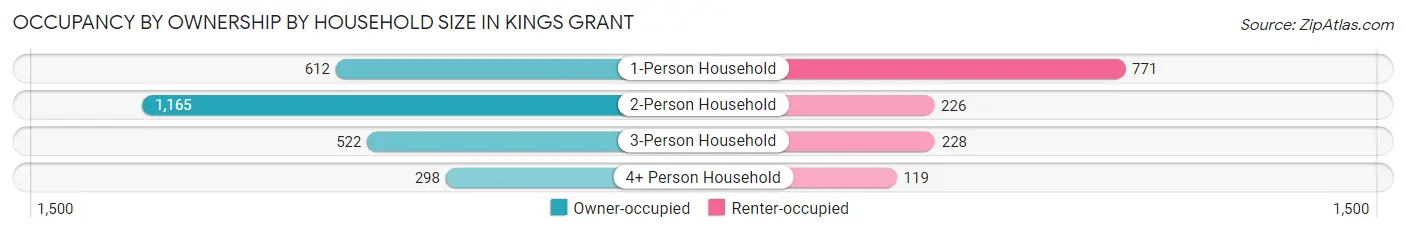
| Household Size | Owner-occupied | Renter-occupied |
| 1-Person Household | 612 (44.3%) | 771 (55.7%) |
| 2-Person Household | 1,165 (83.8%) | 226 (16.3%) |
| 3-Person Household | 522 (69.6%) | 228 (30.4%) |
| 4+ Person Household | 298 (71.5%) | 119 (28.5%) |
| Total Housing Units | 2,597 (65.9%) | 1,344 (34.1%) |
Occupancy by Educational Attainment in Kings Grant
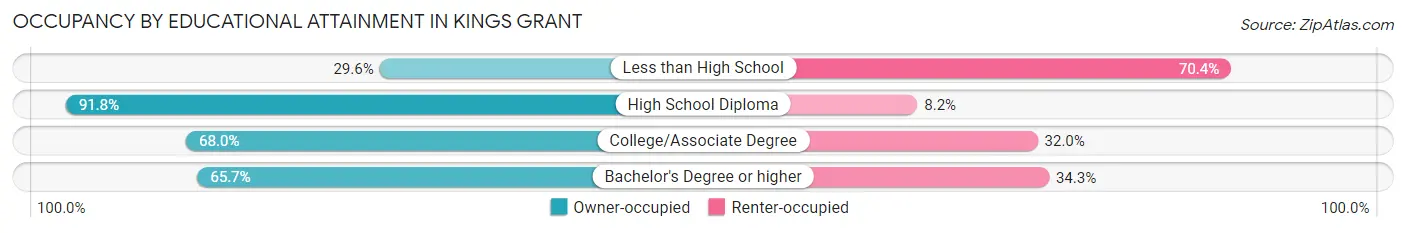
| Household Size | Owner-occupied | Renter-occupied |
| Less than High School | 195 (29.6%) | 463 (70.4%) |
| High School Diploma | 742 (91.8%) | 66 (8.2%) |
| College/Associate Degree | 996 (68.0%) | 469 (32.0%) |
| Bachelor's Degree or higher | 664 (65.7%) | 346 (34.3%) |
Occupancy by Age of Householder in Kings Grant
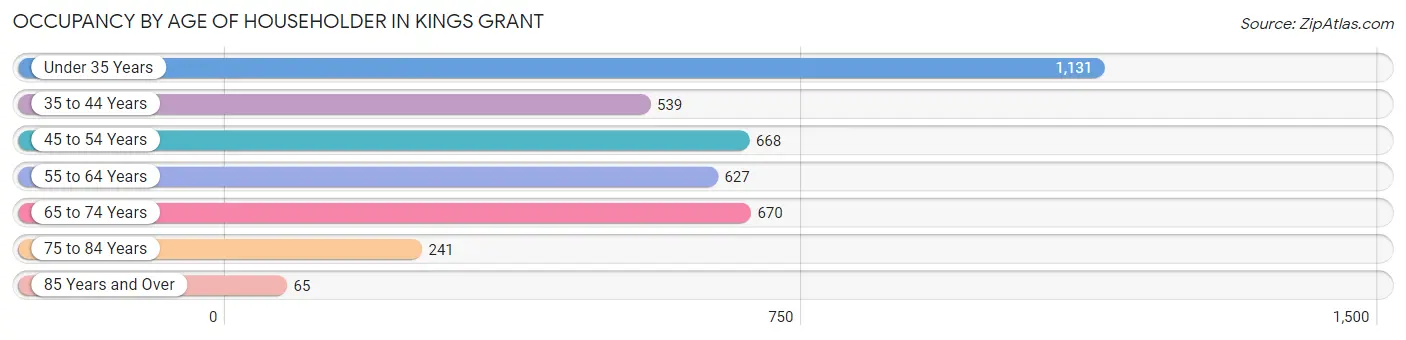
| Age Bracket | # Households | % Households |
| Under 35 Years | 1,131 | 28.7% |
| 35 to 44 Years | 539 | 13.7% |
| 45 to 54 Years | 668 | 17.0% |
| 55 to 64 Years | 627 | 15.9% |
| 65 to 74 Years | 670 | 17.0% |
| 75 to 84 Years | 241 | 6.1% |
| 85 Years and Over | 65 | 1.7% |
| Total | 3,941 | 100.0% |
Housing Finances in Kings Grant
Median Income by Occupancy in Kings Grant
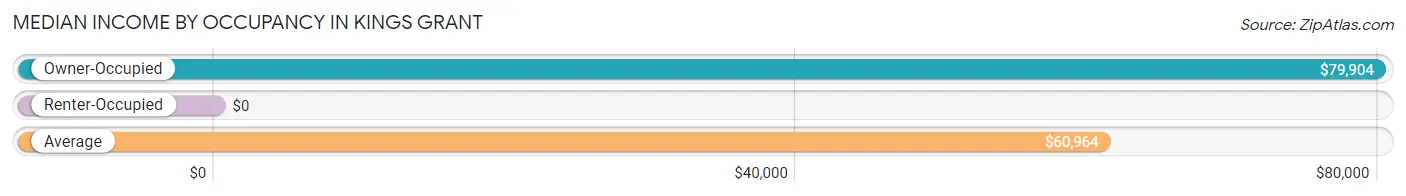
| Occupancy Type | # Households | Median Income |
| Owner-Occupied | 2,597 (65.9%) | $79,904 |
| Renter-Occupied | 1,344 (34.1%) | $0 |
| Average | 3,941 (100.0%) | $60,964 |
Occupancy by Householder Income Bracket in Kings Grant
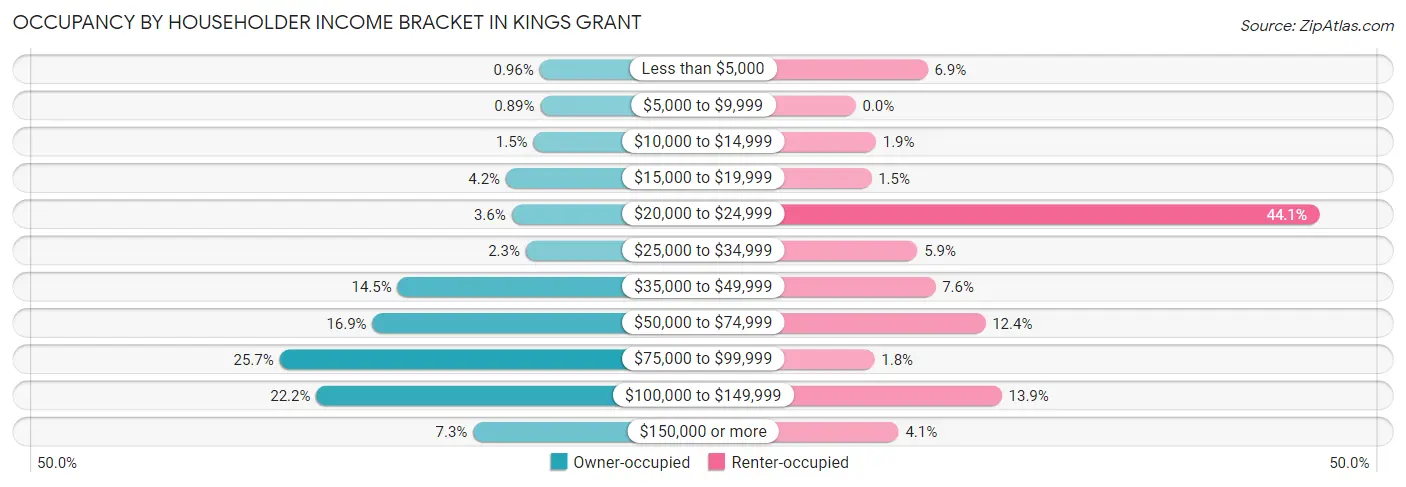
| Income Bracket | Owner-occupied | Renter-occupied |
| Less than $5,000 | 25 (1.0%) | 92 (6.9%) |
| $5,000 to $9,999 | 23 (0.9%) | 0 (0.0%) |
| $10,000 to $14,999 | 40 (1.5%) | 26 (1.9%) |
| $15,000 to $19,999 | 108 (4.2%) | 20 (1.5%) |
| $20,000 to $24,999 | 94 (3.6%) | 593 (44.1%) |
| $25,000 to $34,999 | 59 (2.3%) | 79 (5.9%) |
| $35,000 to $49,999 | 376 (14.5%) | 102 (7.6%) |
| $50,000 to $74,999 | 438 (16.9%) | 166 (12.3%) |
| $75,000 to $99,999 | 668 (25.7%) | 24 (1.8%) |
| $100,000 to $149,999 | 577 (22.2%) | 187 (13.9%) |
| $150,000 or more | 189 (7.3%) | 55 (4.1%) |
| Total | 2,597 (100.0%) | 1,344 (100.0%) |
Monthly Housing Cost Tiers in Kings Grant
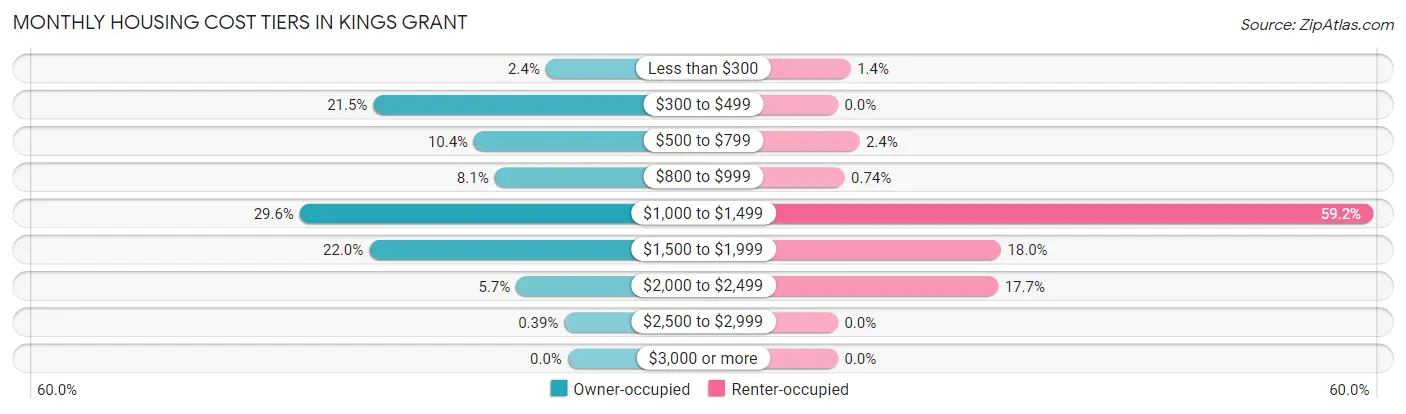
| Monthly Cost | Owner-occupied | Renter-occupied |
| Less than $300 | 63 (2.4%) | 19 (1.4%) |
| $300 to $499 | 558 (21.5%) | 0 (0.0%) |
| $500 to $799 | 269 (10.4%) | 32 (2.4%) |
| $800 to $999 | 210 (8.1%) | 10 (0.7%) |
| $1,000 to $1,499 | 769 (29.6%) | 795 (59.2%) |
| $1,500 to $1,999 | 570 (22.0%) | 242 (18.0%) |
| $2,000 to $2,499 | 148 (5.7%) | 238 (17.7%) |
| $2,500 to $2,999 | 10 (0.4%) | 0 (0.0%) |
| $3,000 or more | 0 (0.0%) | 0 (0.0%) |
| Total | 2,597 (100.0%) | 1,344 (100.0%) |
Physical Housing Characteristics in Kings Grant
Housing Structures in Kings Grant
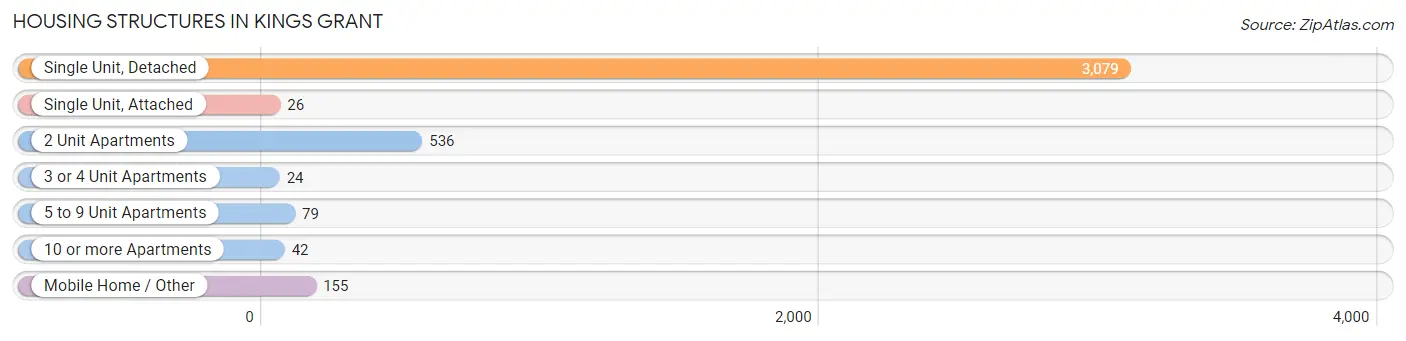
| Structure Type | # Housing Units | % Housing Units |
| Single Unit, Detached | 3,079 | 78.1% |
| Single Unit, Attached | 26 | 0.7% |
| 2 Unit Apartments | 536 | 13.6% |
| 3 or 4 Unit Apartments | 24 | 0.6% |
| 5 to 9 Unit Apartments | 79 | 2.0% |
| 10 or more Apartments | 42 | 1.1% |
| Mobile Home / Other | 155 | 3.9% |
| Total | 3,941 | 100.0% |
Housing Structures by Occupancy in Kings Grant
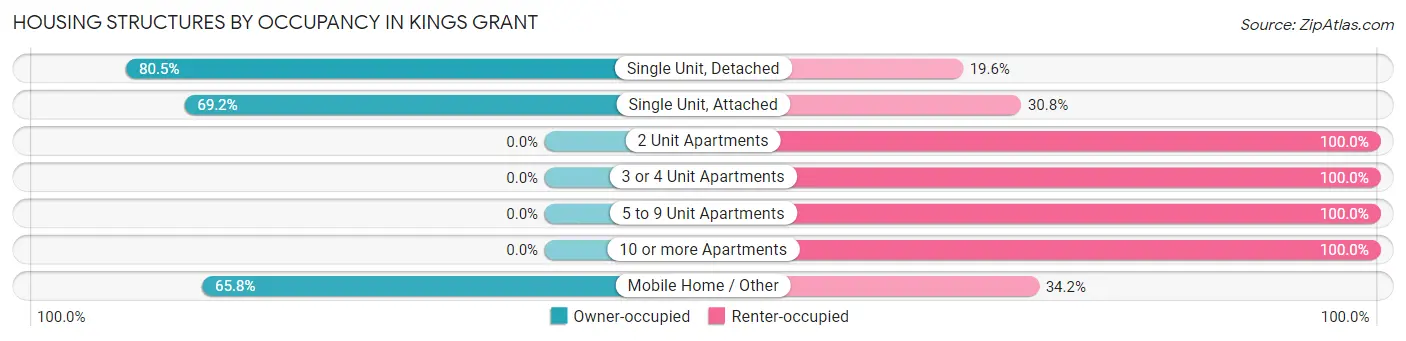
| Structure Type | Owner-occupied | Renter-occupied |
| Single Unit, Detached | 2,477 (80.4%) | 602 (19.6%) |
| Single Unit, Attached | 18 (69.2%) | 8 (30.8%) |
| 2 Unit Apartments | 0 (0.0%) | 536 (100.0%) |
| 3 or 4 Unit Apartments | 0 (0.0%) | 24 (100.0%) |
| 5 to 9 Unit Apartments | 0 (0.0%) | 79 (100.0%) |
| 10 or more Apartments | 0 (0.0%) | 42 (100.0%) |
| Mobile Home / Other | 102 (65.8%) | 53 (34.2%) |
| Total | 2,597 (65.9%) | 1,344 (34.1%) |
Housing Structures by Number of Rooms in Kings Grant
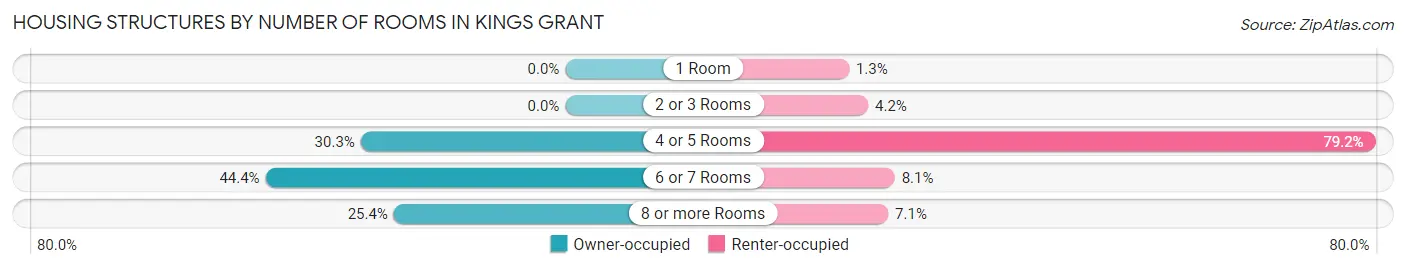
| Number of Rooms | Owner-occupied | Renter-occupied |
| 1 Room | 0 (0.0%) | 18 (1.3%) |
| 2 or 3 Rooms | 0 (0.0%) | 56 (4.2%) |
| 4 or 5 Rooms | 786 (30.3%) | 1,065 (79.2%) |
| 6 or 7 Rooms | 1,152 (44.4%) | 109 (8.1%) |
| 8 or more Rooms | 659 (25.4%) | 96 (7.1%) |
| Total | 2,597 (100.0%) | 1,344 (100.0%) |
Housing Structure by Heating Type in Kings Grant
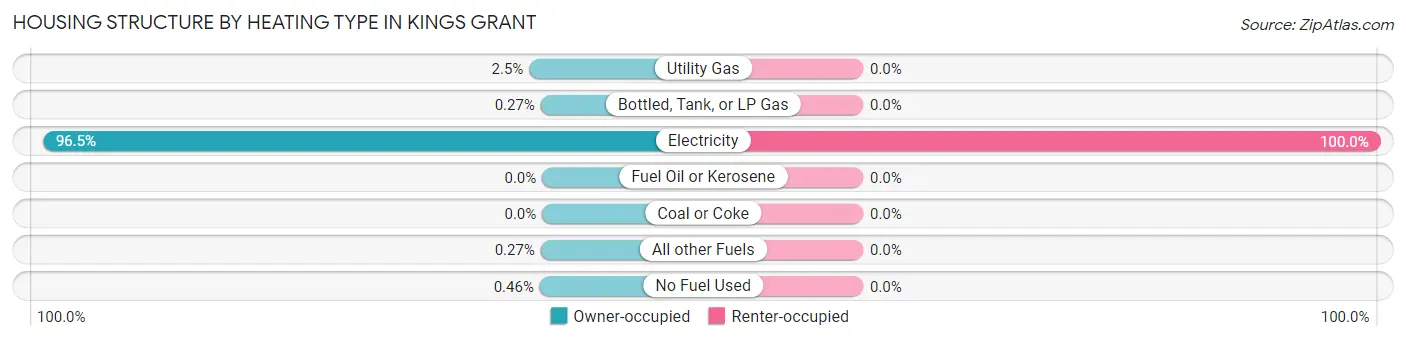
| Heating Type | Owner-occupied | Renter-occupied |
| Utility Gas | 65 (2.5%) | 0 (0.0%) |
| Bottled, Tank, or LP Gas | 7 (0.3%) | 0 (0.0%) |
| Electricity | 2,506 (96.5%) | 1,344 (100.0%) |
| Fuel Oil or Kerosene | 0 (0.0%) | 0 (0.0%) |
| Coal or Coke | 0 (0.0%) | 0 (0.0%) |
| All other Fuels | 7 (0.3%) | 0 (0.0%) |
| No Fuel Used | 12 (0.5%) | 0 (0.0%) |
| Total | 2,597 (100.0%) | 1,344 (100.0%) |
Household Vehicle Usage in Kings Grant
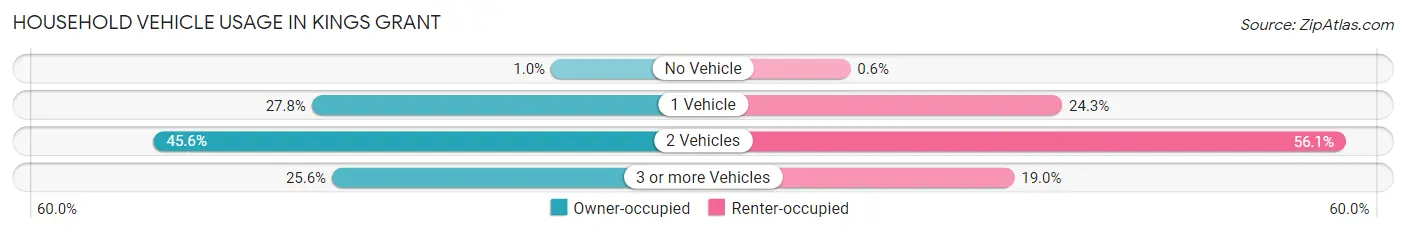
| Vehicles per Household | Owner-occupied | Renter-occupied |
| No Vehicle | 27 (1.0%) | 8 (0.6%) |
| 1 Vehicle | 723 (27.8%) | 327 (24.3%) |
| 2 Vehicles | 1,183 (45.6%) | 754 (56.1%) |
| 3 or more Vehicles | 664 (25.6%) | 255 (19.0%) |
| Total | 2,597 (100.0%) | 1,344 (100.0%) |
Real Estate & Mortgages in Kings Grant
Real Estate and Mortgage Overview in Kings Grant
| Characteristic | Without Mortgage | With Mortgage |
| Housing Units | 807 | 1,790 |
| Median Property Value | $226,800 | $239,400 |
| Median Household Income | $47,425 | $162 |
| Monthly Housing Costs | $443 | $0 |
| Real Estate Taxes | $1,236 | $0 |
Property Value by Mortgage Status in Kings Grant
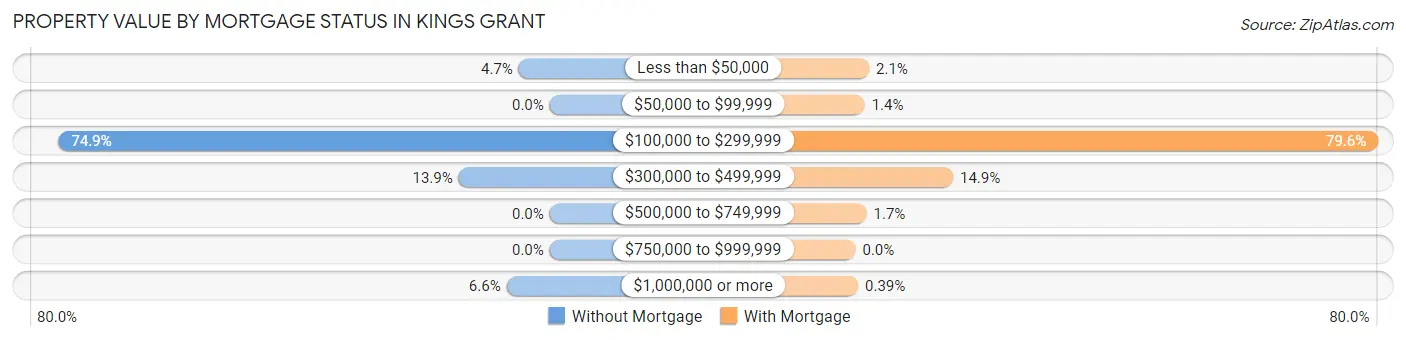
| Property Value | Without Mortgage | With Mortgage |
| Less than $50,000 | 38 (4.7%) | 37 (2.1%) |
| $50,000 to $99,999 | 0 (0.0%) | 25 (1.4%) |
| $100,000 to $299,999 | 604 (74.9%) | 1,425 (79.6%) |
| $300,000 to $499,999 | 112 (13.9%) | 266 (14.9%) |
| $500,000 to $749,999 | 0 (0.0%) | 30 (1.7%) |
| $750,000 to $999,999 | 0 (0.0%) | 0 (0.0%) |
| $1,000,000 or more | 53 (6.6%) | 7 (0.4%) |
| Total | 807 (100.0%) | 1,790 (100.0%) |
Household Income by Mortgage Status in Kings Grant
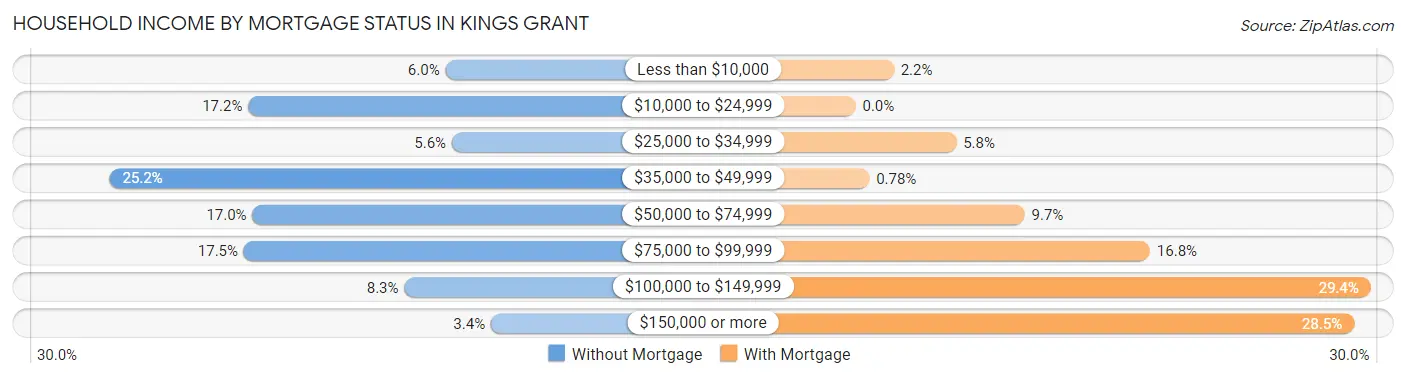
| Household Income | Without Mortgage | With Mortgage |
| Less than $10,000 | 48 (5.9%) | 39 (2.2%) |
| $10,000 to $24,999 | 139 (17.2%) | 0 (0.0%) |
| $25,000 to $34,999 | 45 (5.6%) | 103 (5.8%) |
| $35,000 to $49,999 | 203 (25.2%) | 14 (0.8%) |
| $50,000 to $74,999 | 137 (17.0%) | 173 (9.7%) |
| $75,000 to $99,999 | 141 (17.5%) | 301 (16.8%) |
| $100,000 to $149,999 | 67 (8.3%) | 527 (29.4%) |
| $150,000 or more | 27 (3.4%) | 510 (28.5%) |
| Total | 807 (100.0%) | 1,790 (100.0%) |
Property Value to Household Income Ratio in Kings Grant
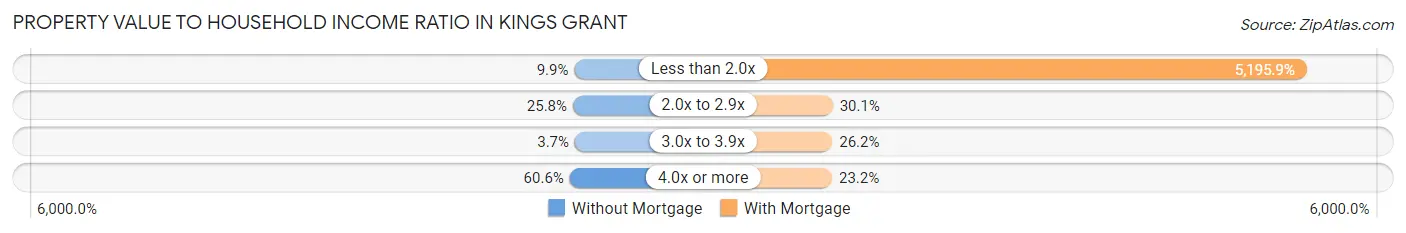
| Value-to-Income Ratio | Without Mortgage | With Mortgage |
| Less than 2.0x | 80 (9.9%) | 93,006 (5,195.9%) |
| 2.0x to 2.9x | 208 (25.8%) | 538 (30.1%) |
| 3.0x to 3.9x | 30 (3.7%) | 469 (26.2%) |
| 4.0x or more | 489 (60.6%) | 415 (23.2%) |
| Total | 807 (100.0%) | 1,790 (100.0%) |
Real Estate Taxes by Mortgage Status in Kings Grant
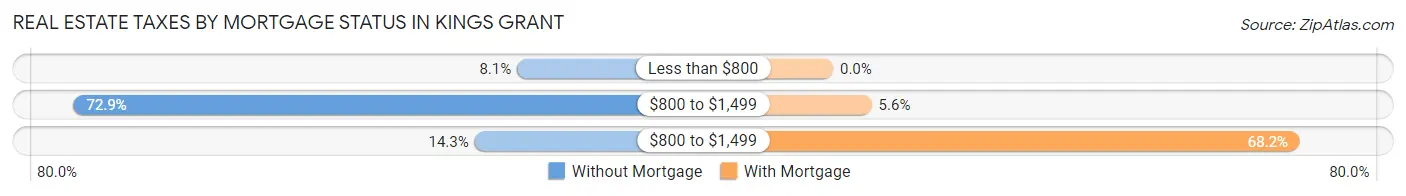
| Property Taxes | Without Mortgage | With Mortgage |
| Less than $800 | 65 (8.1%) | 0 (0.0%) |
| $800 to $1,499 | 588 (72.9%) | 101 (5.6%) |
| $800 to $1,499 | 115 (14.2%) | 1,221 (68.2%) |
| Total | 807 (100.0%) | 1,790 (100.0%) |
Health & Disability in Kings Grant
Health Insurance Coverage by Age in Kings Grant
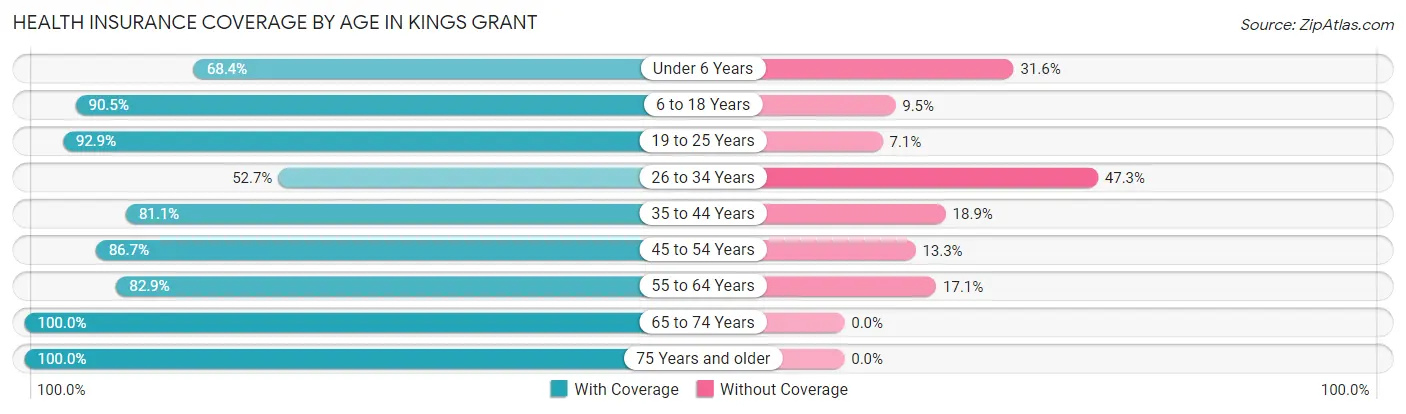
| Age Bracket | With Coverage | Without Coverage |
| Under 6 Years | 362 (68.4%) | 167 (31.6%) |
| 6 to 18 Years | 818 (90.5%) | 86 (9.5%) |
| 19 to 25 Years | 847 (92.9%) | 65 (7.1%) |
| 26 to 34 Years | 699 (52.7%) | 627 (47.3%) |
| 35 to 44 Years | 961 (81.1%) | 224 (18.9%) |
| 45 to 54 Years | 967 (86.7%) | 148 (13.3%) |
| 55 to 64 Years | 915 (82.9%) | 189 (17.1%) |
| 65 to 74 Years | 1,023 (100.0%) | 0 (0.0%) |
| 75 Years and older | 462 (100.0%) | 0 (0.0%) |
| Total | 7,054 (82.4%) | 1,506 (17.6%) |
Health Insurance Coverage by Citizenship Status in Kings Grant
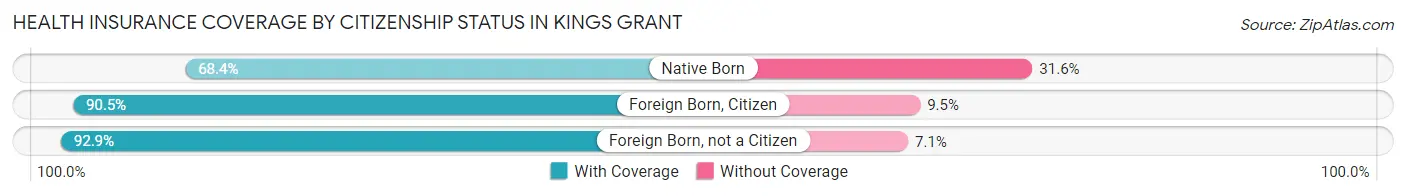
| Citizenship Status | With Coverage | Without Coverage |
| Native Born | 362 (68.4%) | 167 (31.6%) |
| Foreign Born, Citizen | 818 (90.5%) | 86 (9.5%) |
| Foreign Born, not a Citizen | 847 (92.9%) | 65 (7.1%) |
Health Insurance Coverage by Household Income in Kings Grant
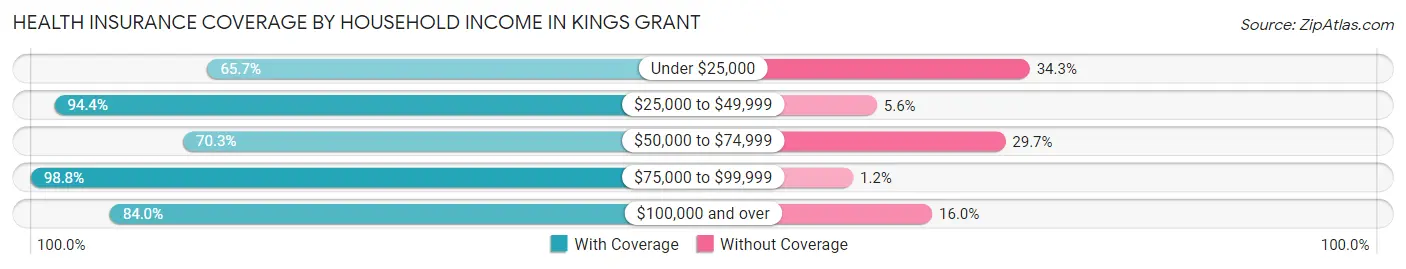
| Household Income | With Coverage | Without Coverage |
| Under $25,000 | 915 (65.7%) | 477 (34.3%) |
| $25,000 to $49,999 | 956 (94.4%) | 57 (5.6%) |
| $50,000 to $74,999 | 1,164 (70.3%) | 492 (29.7%) |
| $75,000 to $99,999 | 1,590 (98.8%) | 19 (1.2%) |
| $100,000 and over | 2,423 (84.0%) | 461 (16.0%) |
Public vs Private Health Insurance Coverage by Age in Kings Grant
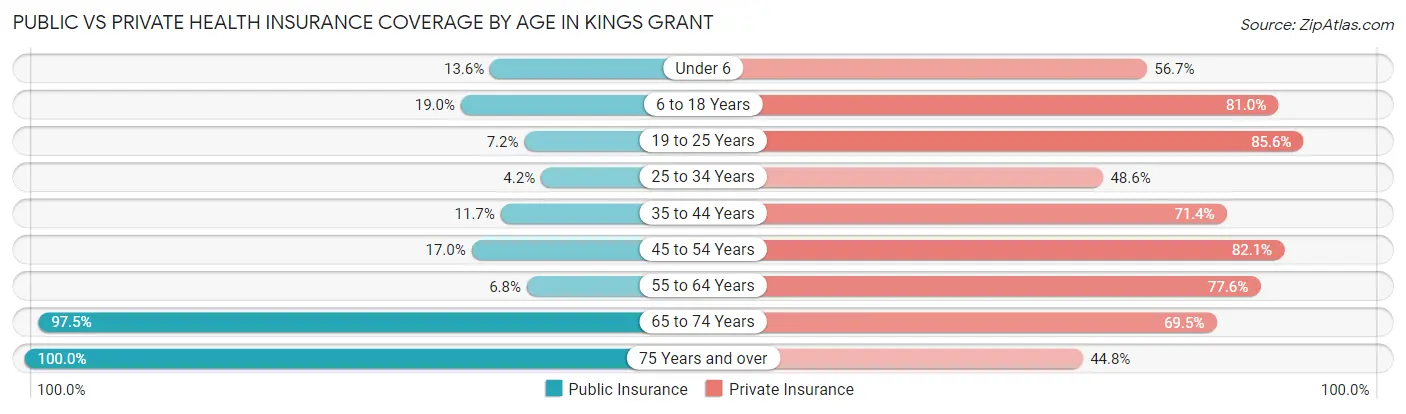
| Age Bracket | Public Insurance | Private Insurance |
| Under 6 | 72 (13.6%) | 300 (56.7%) |
| 6 to 18 Years | 172 (19.0%) | 732 (81.0%) |
| 19 to 25 Years | 66 (7.2%) | 781 (85.6%) |
| 25 to 34 Years | 55 (4.2%) | 644 (48.6%) |
| 35 to 44 Years | 138 (11.7%) | 846 (71.4%) |
| 45 to 54 Years | 190 (17.0%) | 915 (82.1%) |
| 55 to 64 Years | 75 (6.8%) | 857 (77.6%) |
| 65 to 74 Years | 997 (97.5%) | 711 (69.5%) |
| 75 Years and over | 462 (100.0%) | 207 (44.8%) |
| Total | 2,227 (26.0%) | 5,993 (70.0%) |
Disability Status by Sex by Age in Kings Grant
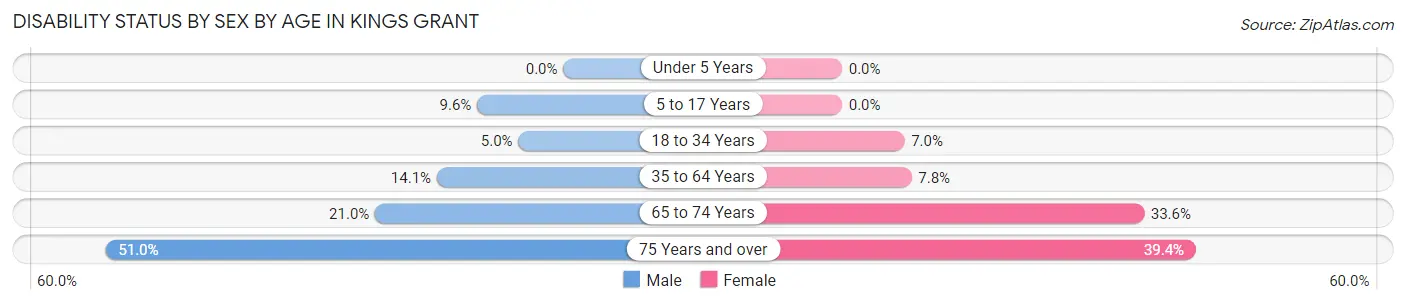
| Age Bracket | Male | Female |
| Under 5 Years | 0 (0.0%) | 0 (0.0%) |
| 5 to 17 Years | 46 (9.6%) | 0 (0.0%) |
| 18 to 34 Years | 60 (5.0%) | 77 (7.0%) |
| 35 to 64 Years | 243 (14.1%) | 130 (7.7%) |
| 65 to 74 Years | 96 (21.0%) | 190 (33.6%) |
| 75 Years and over | 127 (51.0%) | 84 (39.4%) |
Disability Class by Sex by Age in Kings Grant
Disability Class: Hearing Difficulty
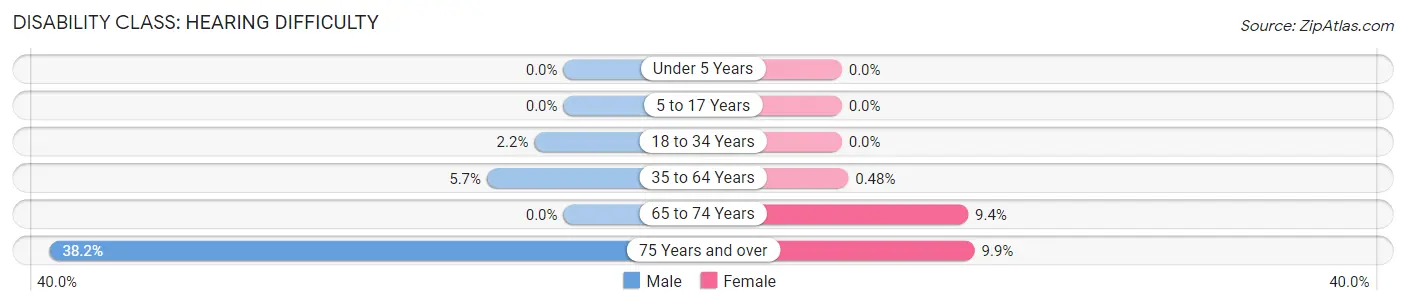
| Age Bracket | Male | Female |
| Under 5 Years | 0 (0.0%) | 0 (0.0%) |
| 5 to 17 Years | 0 (0.0%) | 0 (0.0%) |
| 18 to 34 Years | 26 (2.2%) | 0 (0.0%) |
| 35 to 64 Years | 98 (5.7%) | 8 (0.5%) |
| 65 to 74 Years | 0 (0.0%) | 53 (9.4%) |
| 75 Years and over | 95 (38.2%) | 21 (9.9%) |
Disability Class: Vision Difficulty
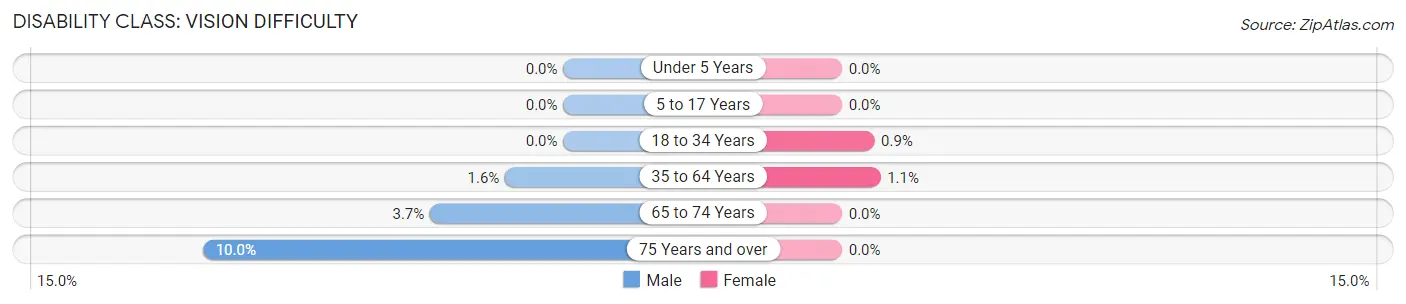
| Age Bracket | Male | Female |
| Under 5 Years | 0 (0.0%) | 0 (0.0%) |
| 5 to 17 Years | 0 (0.0%) | 0 (0.0%) |
| 18 to 34 Years | 0 (0.0%) | 10 (0.9%) |
| 35 to 64 Years | 28 (1.6%) | 18 (1.1%) |
| 65 to 74 Years | 17 (3.7%) | 0 (0.0%) |
| 75 Years and over | 25 (10.0%) | 0 (0.0%) |
Disability Class: Cognitive Difficulty
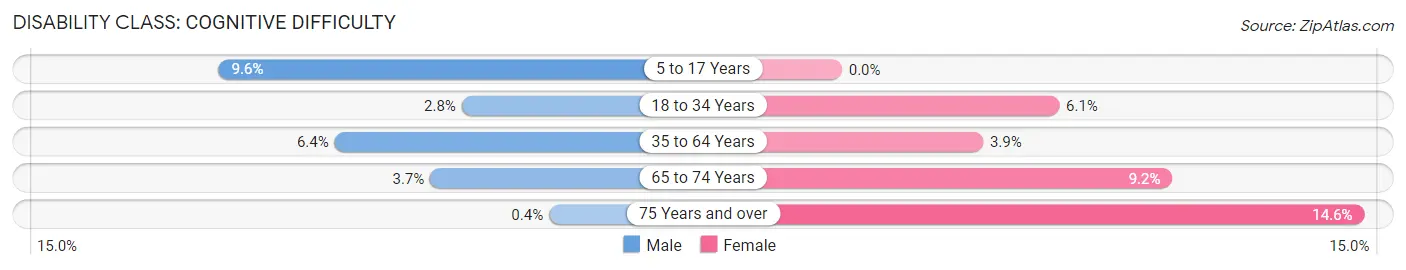
| Age Bracket | Male | Female |
| 5 to 17 Years | 46 (9.6%) | 0 (0.0%) |
| 18 to 34 Years | 34 (2.8%) | 67 (6.0%) |
| 35 to 64 Years | 110 (6.4%) | 66 (3.9%) |
| 65 to 74 Years | 17 (3.7%) | 52 (9.2%) |
| 75 Years and over | 1 (0.4%) | 31 (14.5%) |
Disability Class: Ambulatory Difficulty
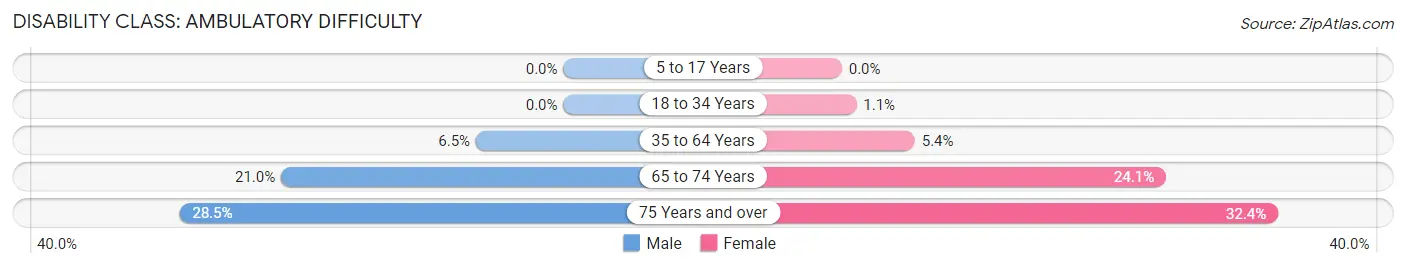
| Age Bracket | Male | Female |
| 5 to 17 Years | 0 (0.0%) | 0 (0.0%) |
| 18 to 34 Years | 0 (0.0%) | 12 (1.1%) |
| 35 to 64 Years | 112 (6.5%) | 91 (5.4%) |
| 65 to 74 Years | 96 (21.0%) | 136 (24.1%) |
| 75 Years and over | 71 (28.5%) | 69 (32.4%) |
Disability Class: Self-Care Difficulty
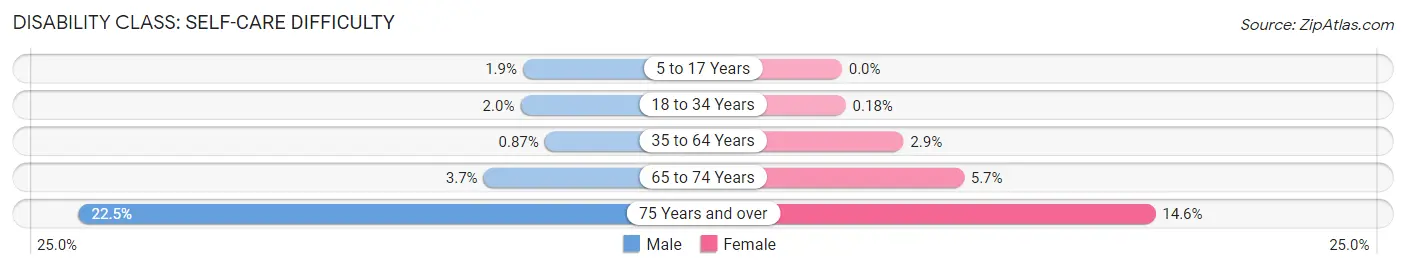
| Age Bracket | Male | Female |
| 5 to 17 Years | 9 (1.9%) | 0 (0.0%) |
| 18 to 34 Years | 24 (2.0%) | 2 (0.2%) |
| 35 to 64 Years | 15 (0.9%) | 48 (2.9%) |
| 65 to 74 Years | 17 (3.7%) | 32 (5.7%) |
| 75 Years and over | 56 (22.5%) | 31 (14.5%) |
Technology Access in Kings Grant
Computing Device Access in Kings Grant
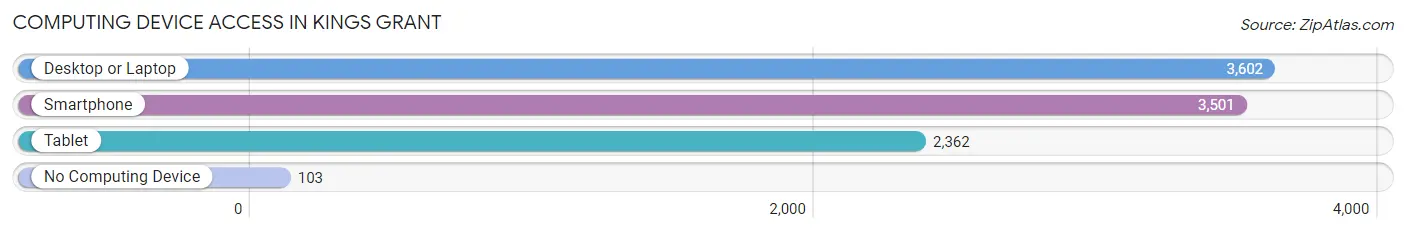
| Device Type | # Households | % Households |
| Desktop or Laptop | 3,602 | 91.4% |
| Smartphone | 3,501 | 88.8% |
| Tablet | 2,362 | 59.9% |
| No Computing Device | 103 | 2.6% |
| Total | 3,941 | 100.0% |
Internet Access in Kings Grant
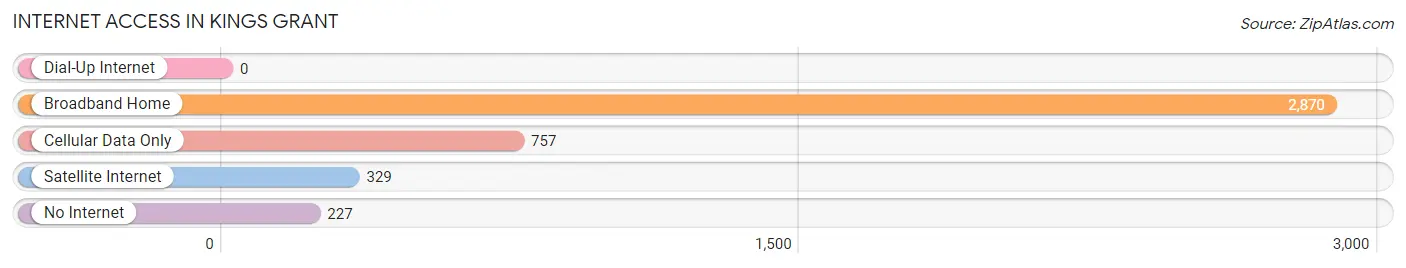
| Internet Type | # Households | % Households |
| Dial-Up Internet | 0 | 0.0% |
| Broadband Home | 2,870 | 72.8% |
| Cellular Data Only | 757 | 19.2% |
| Satellite Internet | 329 | 8.4% |
| No Internet | 227 | 5.8% |
| Total | 3,941 | 100.0% |
Kings Grant Summary
History
Kings Grant is a small unincorporated community located in the northeastern corner of North Carolina, in the county of Currituck. It is situated on the Currituck Sound, just south of the Virginia border. The area was first settled in the early 1700s by English colonists, who named it after King George II. The community was originally a farming and fishing village, and it remained relatively small until the late 19th century, when it began to grow as a resort destination.
The area was popular with wealthy vacationers from the North, who built large summer homes along the waterfront. The community also became a popular spot for fishing and hunting, and it was home to several large hunting lodges. In the early 20th century, the area began to attract more permanent residents, and the population began to grow.
In the 1950s, the area was incorporated as the town of Kings Grant. The town was named after the original settlers, and it was designed to be a self-governing community. The town was home to a variety of businesses, including a post office, a general store, a bank, and a movie theater.
Geography
Kings Grant is located in the northeastern corner of North Carolina, in the county of Currituck. It is situated on the Currituck Sound, just south of the Virginia border. The area is mostly flat, with some rolling hills and marshlands. The climate is mild, with temperatures ranging from the mid-50s in the winter to the mid-80s in the summer.
The town is home to several parks and recreational areas, including the Kings Grant Nature Preserve, which is a protected area of wetlands and forests. The town also has several public beaches, including the popular Kings Grant Beach.
Economy
The economy of Kings Grant is largely based on tourism and recreation. The town is home to several resorts and hotels, as well as a variety of restaurants and shops. The town also has a marina, which is popular with boaters and fishermen.
The town is also home to several businesses, including a post office, a general store, a bank, and a movie theater. The town is also home to a number of small businesses, including a boat repair shop, a bait and tackle shop, and a seafood market.
Demographics
As of the 2010 census, the population of Kings Grant was 1,845. The racial makeup of the town was 94.3% White, 2.2% African American, 0.7% Native American, 0.7% Asian, 0.2% Pacific Islander, and 1.1% from other races. The median household income was $45,938, and the median family income was $50,938. The per capita income was $21,938.
Conclusion
Kings Grant is a small unincorporated community located in the northeastern corner of North Carolina, in the county of Currituck. It is situated on the Currituck Sound, just south of the Virginia border. The area was first settled in the early 1700s by English colonists, and it has since grown into a popular resort destination. The economy of Kings Grant is largely based on tourism and recreation, and the town is home to several resorts and hotels, as well as a variety of restaurants and shops. As of the 2010 census, the population of Kings Grant was 1,845, and the median household income was $45,938.
Common Questions
What is Per Capita Income in Kings Grant?
Per Capita income in Kings Grant is $33,435.
What is the Median Family Income in Kings Grant?
Median Family Income in Kings Grant is $83,051.
What is the Median Household income in Kings Grant?
Median Household Income in Kings Grant is $60,964.
What is Income or Wage Gap in Kings Grant?
Income or Wage Gap in Kings Grant is 1.3%.
Women in Kings Grant earn 98.7 cents for every dollar earned by a man.
What is Inequality or Gini Index in Kings Grant?
Inequality or Gini Index in Kings Grant is 0.38.
What is the Total Population of Kings Grant?
Total Population of Kings Grant is 8,561.
What is the Total Male Population of Kings Grant?
Total Male Population of Kings Grant is 4,265.
What is the Total Female Population of Kings Grant?
Total Female Population of Kings Grant is 4,296.
What is the Ratio of Males per 100 Females in Kings Grant?
There are 99.28 Males per 100 Females in Kings Grant.
What is the Ratio of Females per 100 Males in Kings Grant?
There are 100.73 Females per 100 Males in Kings Grant.
What is the Median Population Age in Kings Grant?
Median Population Age in Kings Grant is 39.6 Years.
What is the Average Family Size in Kings Grant
Average Family Size in Kings Grant is 2.8 People.
What is the Average Household Size in Kings Grant
Average Household Size in Kings Grant is 2.2 People.
How Large is the Labor Force in Kings Grant?
There are 5,134 People in the Labor Forcein in Kings Grant.
What is the Percentage of People in the Labor Force in Kings Grant?
70.1% of People are in the Labor Force in Kings Grant.
What is the Unemployment Rate in Kings Grant?
Unemployment Rate in Kings Grant is 2.3%.