Lake Norman of Catawba, NC Map & Demographics
Lake Norman of Catawba Map
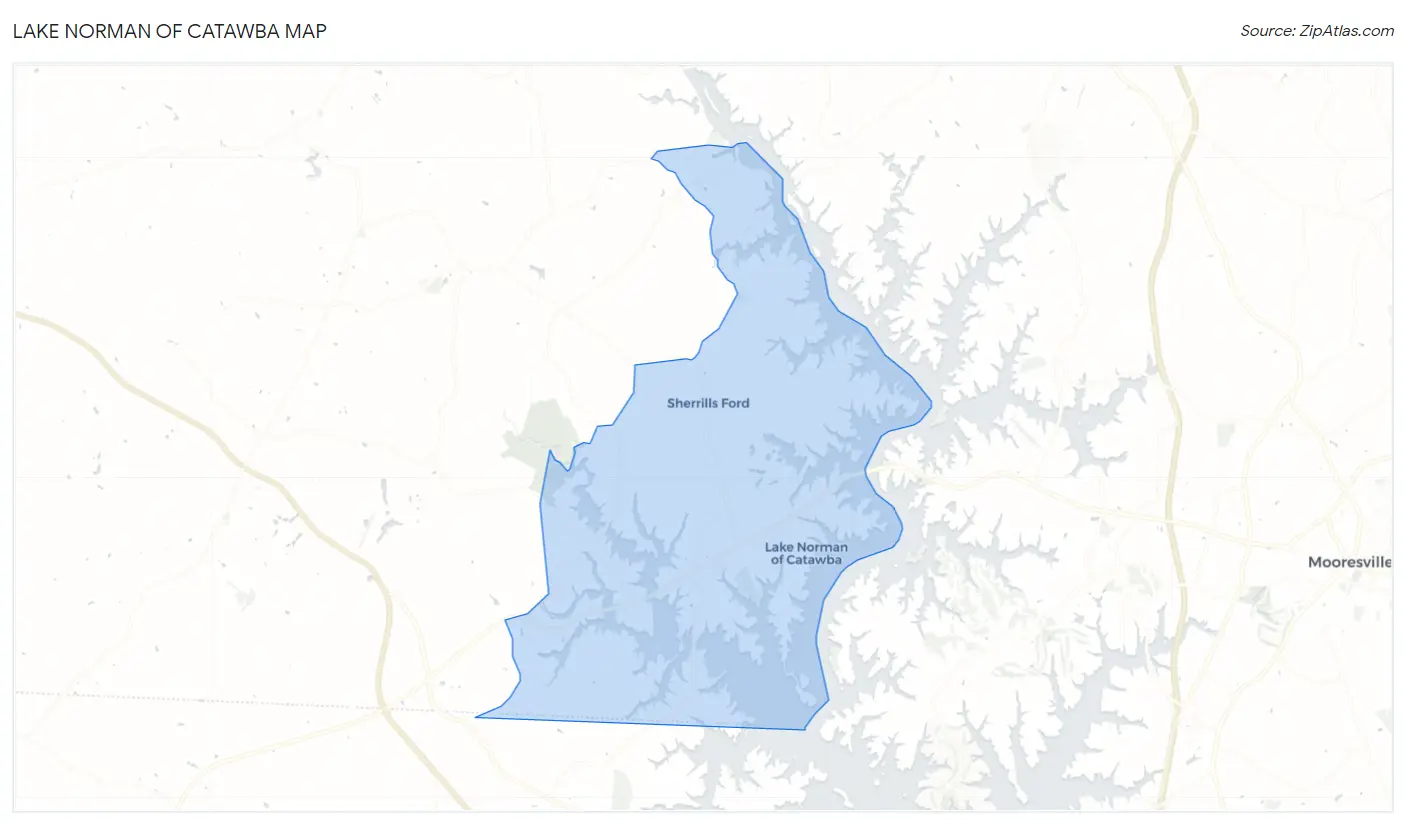
Lake Norman of Catawba Overview
$84,167
PER CAPITA INCOME
$192,302
AVG FAMILY INCOME
$171,583
AVG HOUSEHOLD INCOME
27.3%
WAGE / INCOME GAP [ % ]
72.7¢/ $1
WAGE / INCOME GAP [ $ ]
$9,124
FAMILY INCOME DEFICIT
0.47
INEQUALITY / GINI INDEX
12,526
TOTAL POPULATION
6,385
MALE POPULATION
6,141
FEMALE POPULATION
103.97
MALES / 100 FEMALES
96.18
FEMALES / 100 MALES
47.7
MEDIAN AGE
3.1
AVG FAMILY SIZE
2.9
AVG HOUSEHOLD SIZE
6,040
LABOR FORCE [ PEOPLE ]
60.6%
PERCENT IN LABOR FORCE
2.0%
UNEMPLOYMENT RATE
Income in Lake Norman of Catawba
Income Overview in Lake Norman of Catawba
Per Capita Income in Lake Norman of Catawba is $84,167, while median incomes of families and households are $192,302 and $171,583 respectively.
| Characteristic | Number | Measure |
| Per Capita Income | 12,526 | $84,167 |
| Median Family Income | 3,733 | $192,302 |
| Mean Family Income | 3,733 | $259,255 |
| Median Household Income | 4,363 | $171,583 |
| Mean Household Income | 4,363 | $236,337 |
| Income Deficit | 3,733 | $9,124 |
| Wage / Income Gap (%) | 12,526 | 27.29% |
| Wage / Income Gap ($) | 12,526 | 72.71¢ per $1 |
| Gini / Inequality Index | 12,526 | 0.47 |
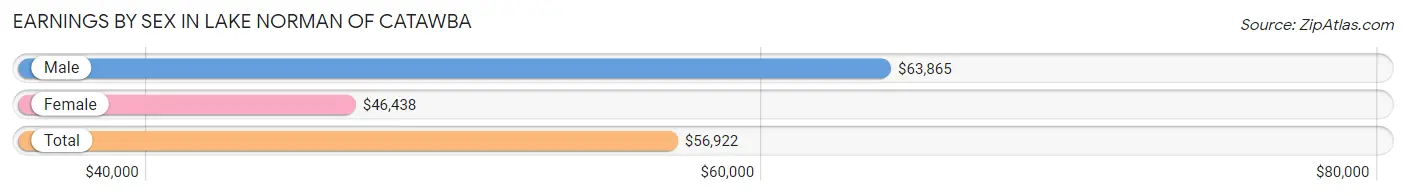
Earnings by Sex in Lake Norman of Catawba
Average Earnings in Lake Norman of Catawba are $56,922, $63,865 for men and $46,438 for women, a difference of 27.3%.
| Sex | Number | Average Earnings |
| Male | 3,838 (58.0%) | $63,865 |
| Female | 2,778 (42.0%) | $46,438 |
| Total | 6,616 (100.0%) | $56,922 |
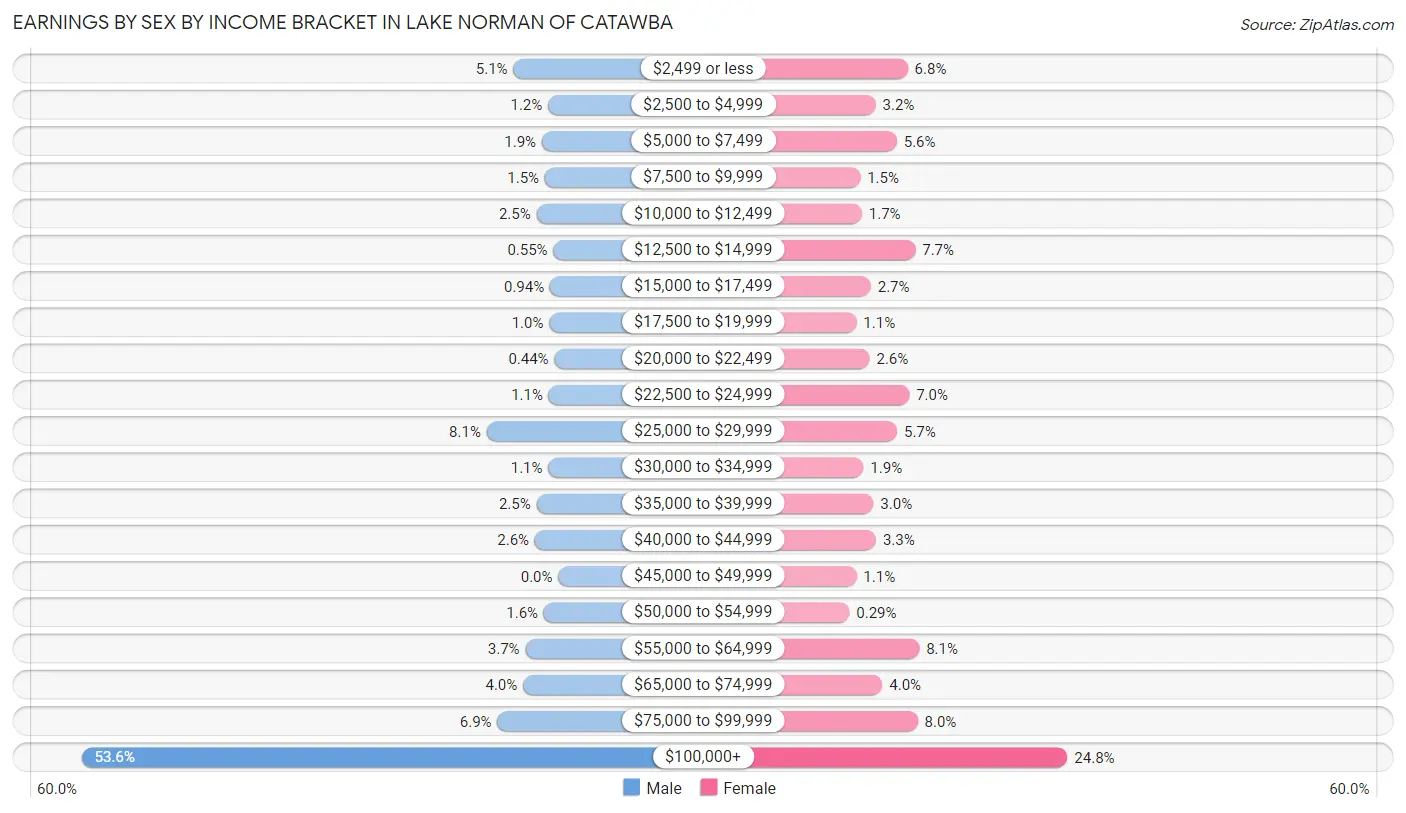
Earnings by Sex by Income Bracket in Lake Norman of Catawba
The most common earnings brackets in Lake Norman of Catawba are $100,000+ for men (2,057 | 53.6%) and $100,000+ for women (689 | 24.8%).
| Income | Male | Female |
| $2,499 or less | 194 (5.1%) | 190 (6.8%) |
| $2,500 to $4,999 | 44 (1.1%) | 90 (3.2%) |
| $5,000 to $7,499 | 71 (1.8%) | 156 (5.6%) |
| $7,500 to $9,999 | 58 (1.5%) | 42 (1.5%) |
| $10,000 to $12,499 | 94 (2.5%) | 47 (1.7%) |
| $12,500 to $14,999 | 21 (0.5%) | 214 (7.7%) |
| $15,000 to $17,499 | 36 (0.9%) | 75 (2.7%) |
| $17,500 to $19,999 | 39 (1.0%) | 30 (1.1%) |
| $20,000 to $22,499 | 17 (0.4%) | 71 (2.6%) |
| $22,500 to $24,999 | 41 (1.1%) | 195 (7.0%) |
| $25,000 to $29,999 | 309 (8.1%) | 157 (5.7%) |
| $30,000 to $34,999 | 43 (1.1%) | 52 (1.9%) |
| $35,000 to $39,999 | 94 (2.5%) | 83 (3.0%) |
| $40,000 to $44,999 | 101 (2.6%) | 91 (3.3%) |
| $45,000 to $49,999 | 0 (0.0%) | 30 (1.1%) |
| $50,000 to $54,999 | 62 (1.6%) | 8 (0.3%) |
| $55,000 to $64,999 | 142 (3.7%) | 226 (8.1%) |
| $65,000 to $74,999 | 152 (4.0%) | 111 (4.0%) |
| $75,000 to $99,999 | 263 (6.9%) | 221 (8.0%) |
| $100,000+ | 2,057 (53.6%) | 689 (24.8%) |
| Total | 3,838 (100.0%) | 2,778 (100.0%) |
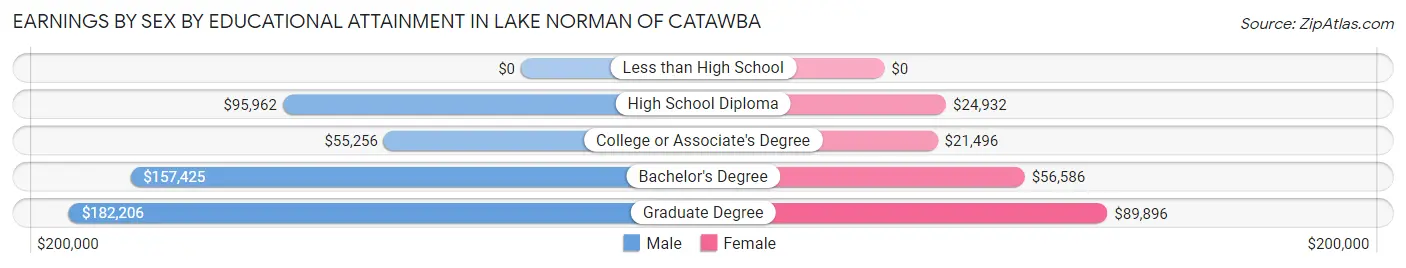
Earnings by Sex by Educational Attainment in Lake Norman of Catawba
Average earnings in Lake Norman of Catawba are $118,944 for men and $49,830 for women, a difference of 58.1%. Men with an educational attainment of graduate degree enjoy the highest average annual earnings of $182,206, while those with college or associate's degree education earn the least with $55,256. Women with an educational attainment of graduate degree earn the most with the average annual earnings of $89,896, while those with college or associate's degree education have the smallest earnings of $21,496.
| Educational Attainment | Male Income | Female Income |
| Less than High School | - | - |
| High School Diploma | $95,962 | $24,932 |
| College or Associate's Degree | $55,256 | $21,496 |
| Bachelor's Degree | $157,425 | $56,586 |
| Graduate Degree | $182,206 | $89,896 |
| Total | $118,944 | $49,830 |
Family Income in Lake Norman of Catawba
Family Income Brackets in Lake Norman of Catawba
According to the Lake Norman of Catawba family income data, there are 1,811 families falling into the $200,000+ income range, which is the most common income bracket and makes up 48.5% of all families.
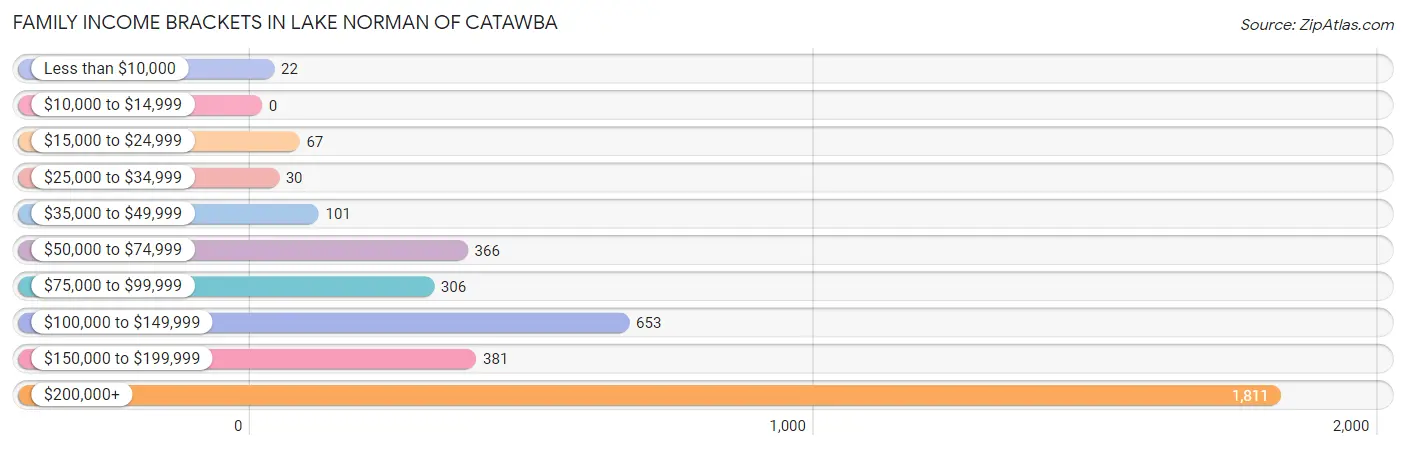
| Income Bracket | # Families | % Families |
| Less than $10,000 | 22 | 0.6% |
| $10,000 to $14,999 | 0 | 0.0% |
| $15,000 to $24,999 | 67 | 1.8% |
| $25,000 to $34,999 | 30 | 0.8% |
| $35,000 to $49,999 | 101 | 2.7% |
| $50,000 to $74,999 | 366 | 9.8% |
| $75,000 to $99,999 | 306 | 8.2% |
| $100,000 to $149,999 | 653 | 17.5% |
| $150,000 to $199,999 | 381 | 10.2% |
| $200,000+ | 1,811 | 48.5% |
Family Income by Famaliy Size in Lake Norman of Catawba
4-person families (798 | 21.4%) account for the highest median family income in Lake Norman of Catawba with $250,001 per family, while 3-person families (549 | 14.7%) have the highest median income of $69,383 per family member.
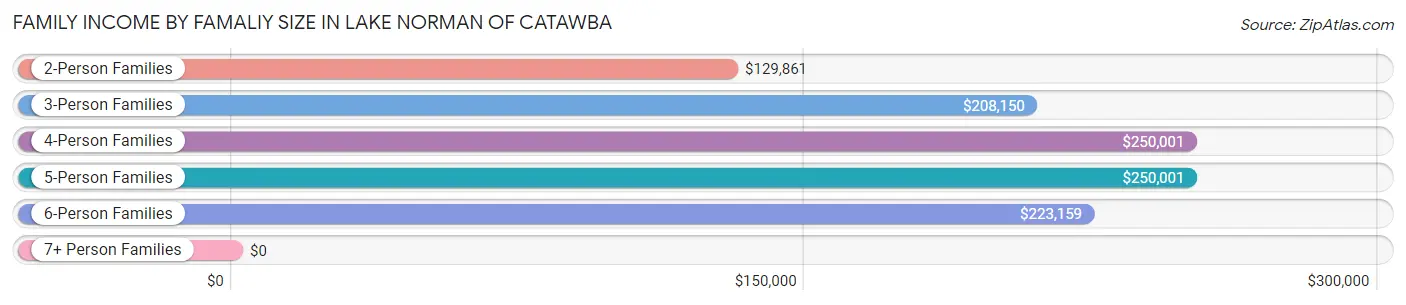
| Income Bracket | # Families | Median Income |
| 2-Person Families | 1,735 (46.5%) | $129,861 |
| 3-Person Families | 549 (14.7%) | $208,150 |
| 4-Person Families | 798 (21.4%) | $250,001 |
| 5-Person Families | 472 (12.6%) | $250,001 |
| 6-Person Families | 171 (4.6%) | $223,159 |
| 7+ Person Families | 8 (0.2%) | $0 |
| Total | 3,733 (100.0%) | $192,302 |
Family Income by Number of Earners in Lake Norman of Catawba
The median family income in Lake Norman of Catawba is $192,302, with families comprising 3+ earners (486) having the highest median family income of $245,449, while families with no earners (422) have the lowest median family income of $113,333, accounting for 13.0% and 11.3% of families, respectively.
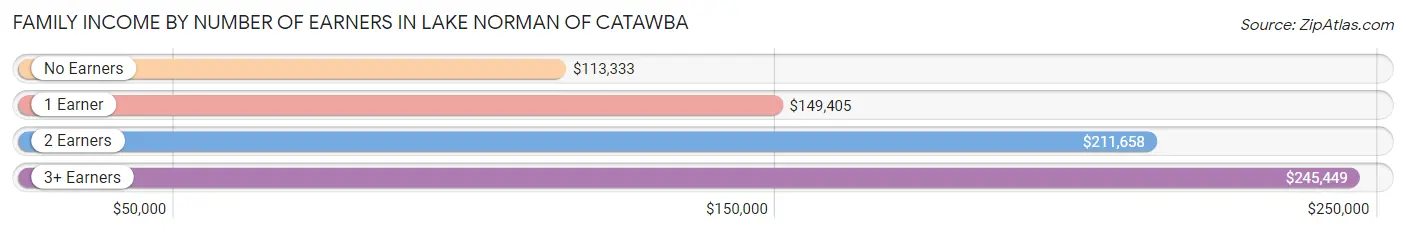
| Number of Earners | # Families | Median Income |
| No Earners | 422 (11.3%) | $113,333 |
| 1 Earner | 1,132 (30.3%) | $149,405 |
| 2 Earners | 1,693 (45.4%) | $211,658 |
| 3+ Earners | 486 (13.0%) | $245,449 |
| Total | 3,733 (100.0%) | $192,302 |
Household Income in Lake Norman of Catawba
Household Income Brackets in Lake Norman of Catawba
With 1,907 households falling in the category, the $200,000+ income range is the most frequent in Lake Norman of Catawba, accounting for 43.7% of all households. In contrast, only 22 households (0.5%) fall into the $10,000 to $14,999 income bracket, making it the least populous group.
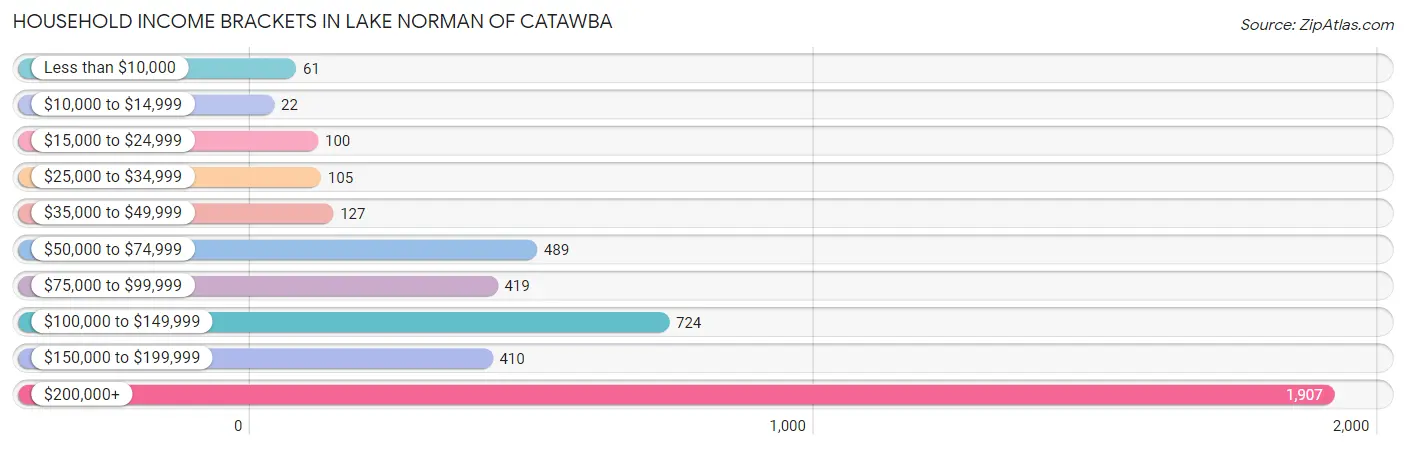
| Income Bracket | # Households | % Households |
| Less than $10,000 | 61 | 1.4% |
| $10,000 to $14,999 | 22 | 0.5% |
| $15,000 to $24,999 | 100 | 2.3% |
| $25,000 to $34,999 | 105 | 2.4% |
| $35,000 to $49,999 | 127 | 2.9% |
| $50,000 to $74,999 | 489 | 11.2% |
| $75,000 to $99,999 | 419 | 9.6% |
| $100,000 to $149,999 | 724 | 16.6% |
| $150,000 to $199,999 | 410 | 9.4% |
| $200,000+ | 1,907 | 43.7% |
Household Income by Householder Age in Lake Norman of Catawba
The median household income in Lake Norman of Catawba is $171,583, with the highest median household income of $214,167 found in the 45 to 64 years age bracket for the primary householder. A total of 2,450 households (56.1%) fall into this category. Meanwhile, the 15 to 24 years age bracket for the primary householder has the lowest median household income of $0, with 23 households (0.5%) in this group.
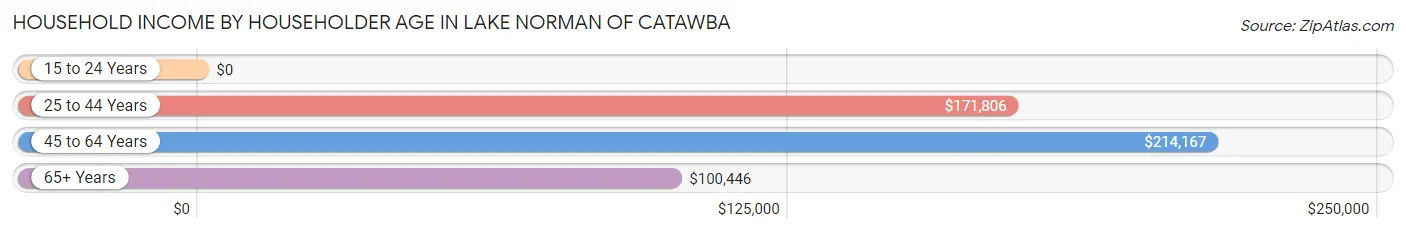
| Income Bracket | # Households | Median Income |
| 15 to 24 Years | 23 (0.5%) | $0 |
| 25 to 44 Years | 715 (16.4%) | $171,806 |
| 45 to 64 Years | 2,450 (56.1%) | $214,167 |
| 65+ Years | 1,175 (26.9%) | $100,446 |
| Total | 4,363 (100.0%) | $171,583 |
Poverty in Lake Norman of Catawba
Income Below Poverty by Sex and Age in Lake Norman of Catawba
With 1.8% poverty level for males and 3.3% for females among the residents of Lake Norman of Catawba, 15 year old males and 18 to 24 year old females are the most vulnerable to poverty, with 10 males (7.6%) and 49 females (13.4%) in their respective age groups living below the poverty level.
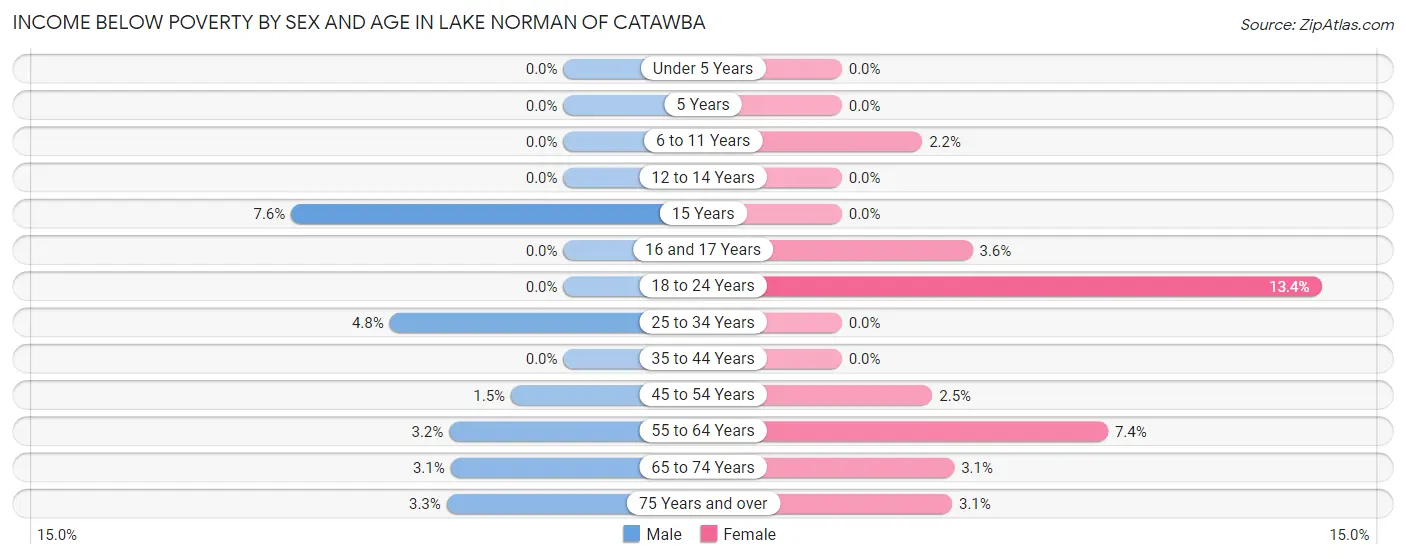
| Age Bracket | Male | Female |
| Under 5 Years | 0 (0.0%) | 0 (0.0%) |
| 5 Years | 0 (0.0%) | 0 (0.0%) |
| 6 to 11 Years | 0 (0.0%) | 8 (2.2%) |
| 12 to 14 Years | 0 (0.0%) | 0 (0.0%) |
| 15 Years | 10 (7.6%) | 0 (0.0%) |
| 16 and 17 Years | 0 (0.0%) | 9 (3.6%) |
| 18 to 24 Years | 0 (0.0%) | 49 (13.4%) |
| 25 to 34 Years | 14 (4.8%) | 0 (0.0%) |
| 35 to 44 Years | 0 (0.0%) | 0 (0.0%) |
| 45 to 54 Years | 20 (1.5%) | 29 (2.5%) |
| 55 to 64 Years | 38 (3.2%) | 70 (7.4%) |
| 65 to 74 Years | 24 (3.1%) | 20 (3.1%) |
| 75 Years and over | 11 (3.3%) | 18 (3.1%) |
| Total | 117 (1.8%) | 203 (3.3%) |
Income Above Poverty by Sex and Age in Lake Norman of Catawba
According to the poverty statistics in Lake Norman of Catawba, males aged under 5 years and females aged under 5 years are the age groups that are most secure financially, with 100.0% of males and 100.0% of females in these age groups living above the poverty line.
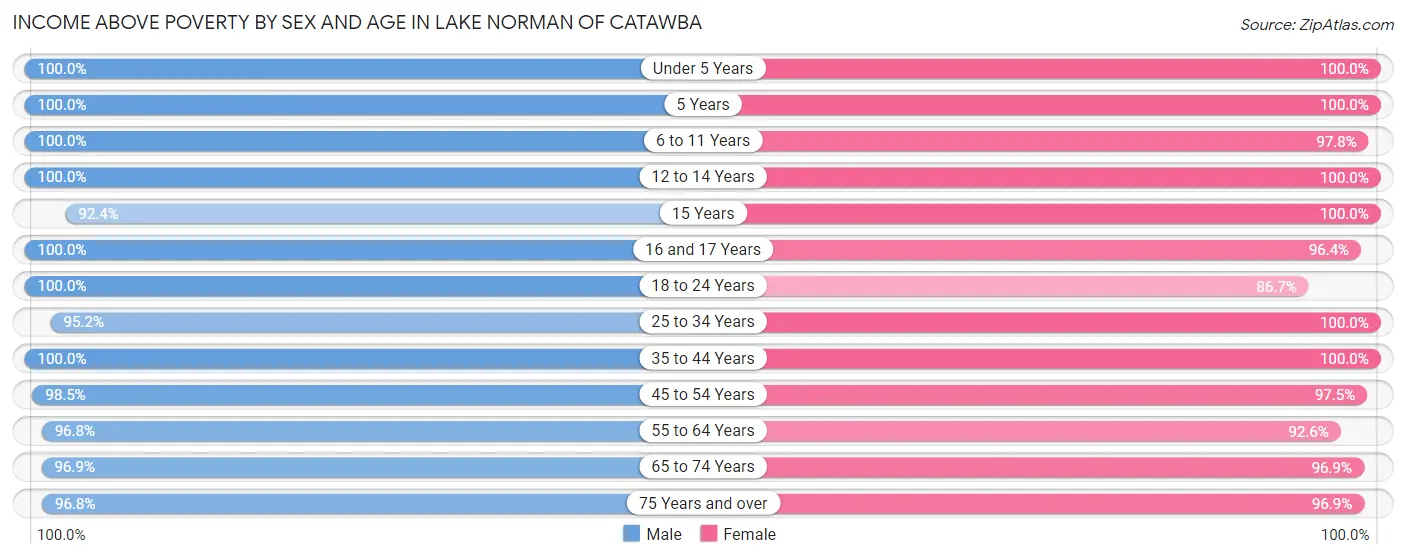
| Age Bracket | Male | Female |
| Under 5 Years | 250 (100.0%) | 194 (100.0%) |
| 5 Years | 63 (100.0%) | 65 (100.0%) |
| 6 to 11 Years | 567 (100.0%) | 349 (97.8%) |
| 12 to 14 Years | 296 (100.0%) | 334 (100.0%) |
| 15 Years | 122 (92.4%) | 252 (100.0%) |
| 16 and 17 Years | 171 (100.0%) | 238 (96.4%) |
| 18 to 24 Years | 473 (100.0%) | 318 (86.7%) |
| 25 to 34 Years | 275 (95.2%) | 274 (100.0%) |
| 35 to 44 Years | 424 (100.0%) | 729 (100.0%) |
| 45 to 54 Years | 1,354 (98.5%) | 1,123 (97.5%) |
| 55 to 64 Years | 1,156 (96.8%) | 875 (92.6%) |
| 65 to 74 Years | 741 (96.9%) | 619 (96.9%) |
| 75 Years and over | 327 (96.8%) | 568 (96.9%) |
| Total | 6,219 (98.2%) | 5,938 (96.7%) |
Income Below Poverty Among Married-Couple Families in Lake Norman of Catawba
The poverty statistics for married-couple families in Lake Norman of Catawba show that 1.8% or 62 of the total 3,515 families live below the poverty line. Families with 1 or 2 children have the highest poverty rate of 2.2%, comprising of 25 families. On the other hand, families with 3 or 4 children have the lowest poverty rate of 0.0%, which includes 0 families.
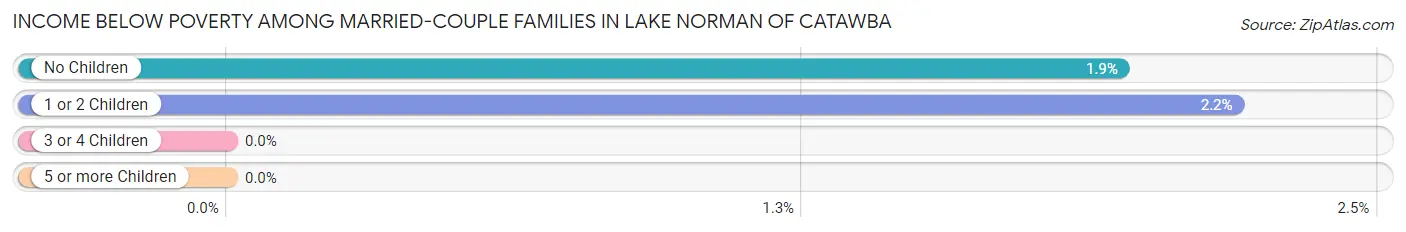
| Children | Above Poverty | Below Poverty |
| No Children | 1,870 (98.1%) | 37 (1.9%) |
| 1 or 2 Children | 1,117 (97.8%) | 25 (2.2%) |
| 3 or 4 Children | 466 (100.0%) | 0 (0.0%) |
| 5 or more Children | 0 (0.0%) | 0 (0.0%) |
| Total | 3,453 (98.2%) | 62 (1.8%) |
Income Below Poverty Among Single-Parent Households in Lake Norman of Catawba
| Children | Single Father | Single Mother |
| No Children | 0 (0.0%) | 0 (0.0%) |
| 1 or 2 Children | 0 (0.0%) | 0 (0.0%) |
| 3 or 4 Children | 0 (0.0%) | 0 (0.0%) |
| 5 or more Children | 0 (0.0%) | 0 (0.0%) |
| Total | 0 (0.0%) | 0 (0.0%) |
Income Below Poverty Among Married-Couple vs Single-Parent Households in Lake Norman of Catawba
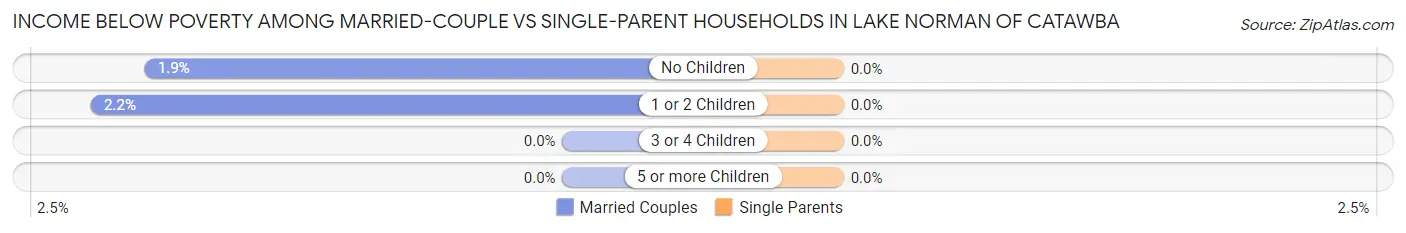
| Children | Married-Couple Families | Single-Parent Households |
| No Children | 37 (1.9%) | 0 (0.0%) |
| 1 or 2 Children | 25 (2.2%) | 0 (0.0%) |
| 3 or 4 Children | 0 (0.0%) | 0 (0.0%) |
| 5 or more Children | 0 (0.0%) | 0 (0.0%) |
| Total | 62 (1.8%) | 0 (0.0%) |
Race in Lake Norman of Catawba
The most populous races in Lake Norman of Catawba are White / Caucasian (11,197 | 89.4%), Two or more Races (863 | 6.9%), and Hispanic or Latino (811 | 6.5%).
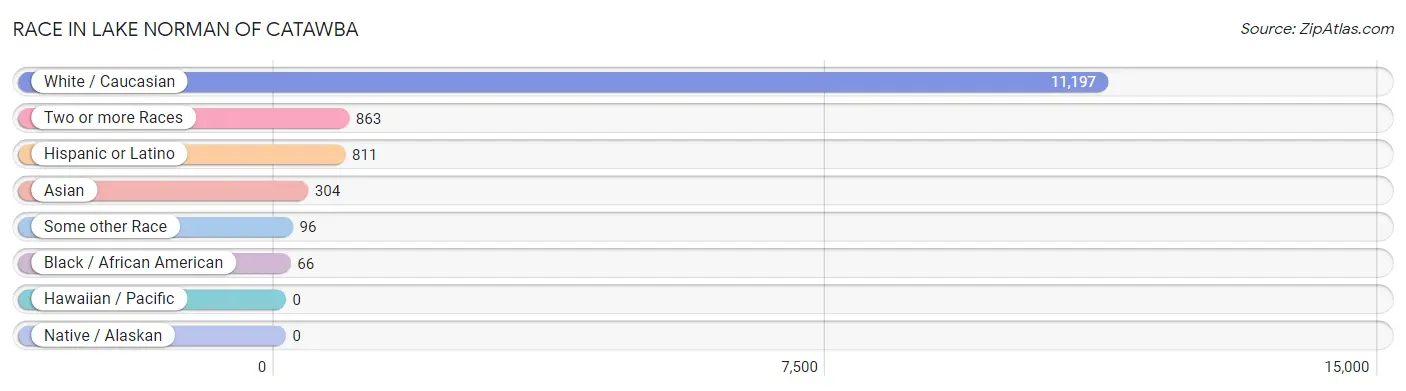
| Race | # Population | % Population |
| Asian | 304 | 2.4% |
| Black / African American | 66 | 0.5% |
| Hawaiian / Pacific | 0 | 0.0% |
| Hispanic or Latino | 811 | 6.5% |
| Native / Alaskan | 0 | 0.0% |
| White / Caucasian | 11,197 | 89.4% |
| Two or more Races | 863 | 6.9% |
| Some other Race | 96 | 0.8% |
| Total | 12,526 | 100.0% |
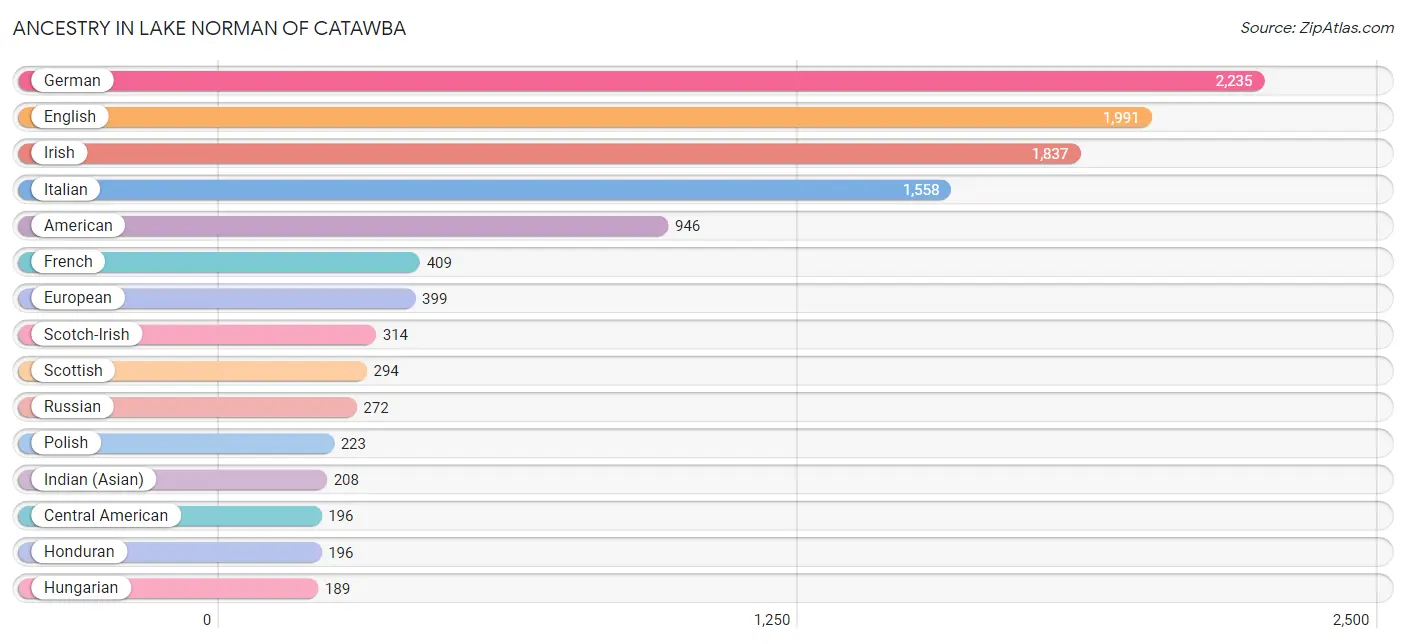
Ancestry in Lake Norman of Catawba
The most populous ancestries reported in Lake Norman of Catawba are German (2,235 | 17.8%), English (1,991 | 15.9%), Irish (1,837 | 14.7%), Italian (1,558 | 12.4%), and American (946 | 7.5%), together accounting for 68.4% of all Lake Norman of Catawba residents.
| Ancestry | # Population | % Population |
| American | 946 | 7.5% |
| Arab | 92 | 0.7% |
| Australian | 11 | 0.1% |
| Austrian | 16 | 0.1% |
| Bangladeshi | 49 | 0.4% |
| Bhutanese | 37 | 0.3% |
| Brazilian | 64 | 0.5% |
| British | 126 | 1.0% |
| Burmese | 48 | 0.4% |
| Canadian | 50 | 0.4% |
| Central American | 196 | 1.6% |
| Central American Indian | 107 | 0.9% |
| Cherokee | 31 | 0.3% |
| Colombian | 127 | 1.0% |
| Croatian | 15 | 0.1% |
| Cuban | 39 | 0.3% |
| Czech | 38 | 0.3% |
| Czechoslovakian | 10 | 0.1% |
| Danish | 28 | 0.2% |
| Dominican | 107 | 0.9% |
| Dutch | 105 | 0.8% |
| Eastern European | 15 | 0.1% |
| English | 1,991 | 15.9% |
| European | 399 | 3.2% |
| Finnish | 7 | 0.1% |
| French | 409 | 3.3% |
| French Canadian | 90 | 0.7% |
| German | 2,235 | 17.8% |
| Greek | 41 | 0.3% |
| Haitian | 32 | 0.3% |
| Honduran | 196 | 1.6% |
| Hungarian | 189 | 1.5% |
| Indian (Asian) | 208 | 1.7% |
| Irish | 1,837 | 14.7% |
| Iroquois | 17 | 0.1% |
| Italian | 1,558 | 12.4% |
| Korean | 87 | 0.7% |
| Latvian | 12 | 0.1% |
| Lebanese | 45 | 0.4% |
| Lithuanian | 18 | 0.1% |
| Mexican | 187 | 1.5% |
| Native Hawaiian | 18 | 0.1% |
| Norwegian | 45 | 0.4% |
| Polish | 223 | 1.8% |
| Portuguese | 7 | 0.1% |
| Puerto Rican | 104 | 0.8% |
| Russian | 272 | 2.2% |
| Scandinavian | 34 | 0.3% |
| Scotch-Irish | 314 | 2.5% |
| Scottish | 294 | 2.4% |
| Slovak | 66 | 0.5% |
| South African | 60 | 0.5% |
| South American | 127 | 1.0% |
| Spanish | 51 | 0.4% |
| Sri Lankan | 6 | 0.1% |
| Subsaharan African | 60 | 0.5% |
| Swedish | 104 | 0.8% |
| Swiss | 109 | 0.9% |
| Syrian | 47 | 0.4% |
| Thai | 102 | 0.8% |
| Ukrainian | 13 | 0.1% |
| Welsh | 66 | 0.5% | View All 62 Rows |
Immigrants in Lake Norman of Catawba
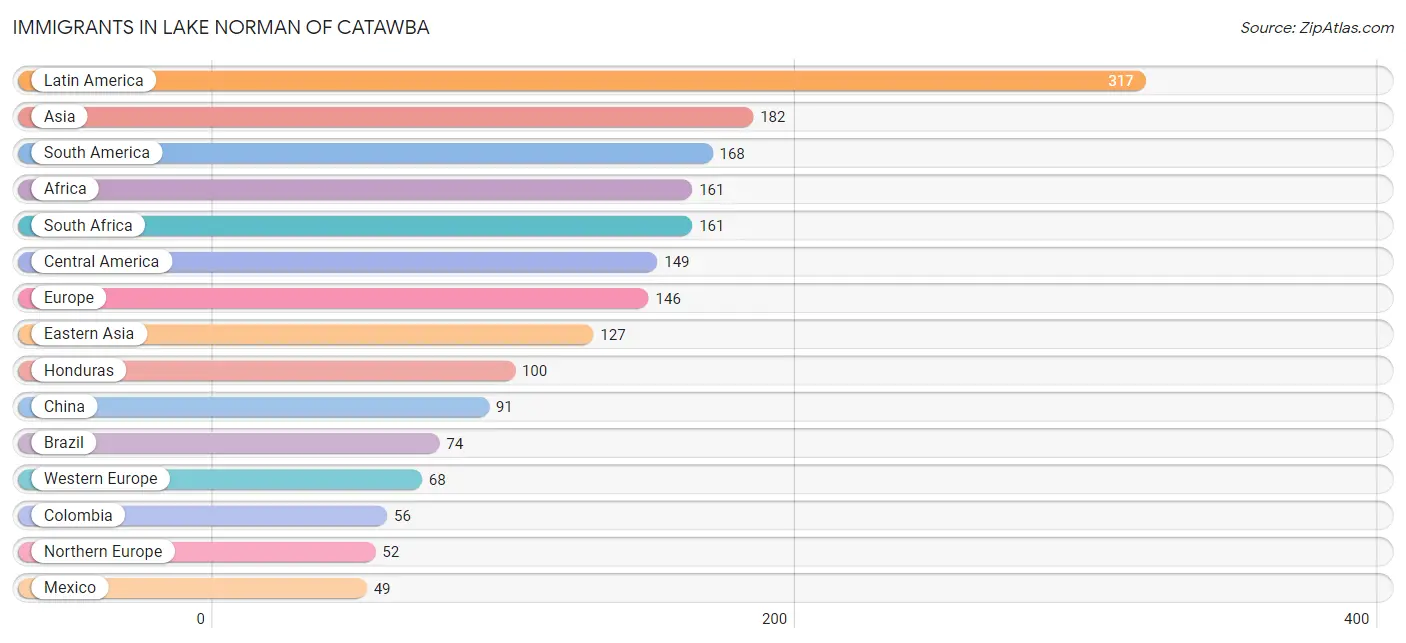
The most numerous immigrant groups reported in Lake Norman of Catawba came from Latin America (317 | 2.5%), Asia (182 | 1.5%), South America (168 | 1.3%), Africa (161 | 1.3%), and South Africa (161 | 1.3%), together accounting for 7.9% of all Lake Norman of Catawba residents.
| Immigration Origin | # Population | % Population |
| Africa | 161 | 1.3% |
| Asia | 182 | 1.5% |
| Australia | 21 | 0.2% |
| Belgium | 12 | 0.1% |
| Brazil | 74 | 0.6% |
| Canada | 45 | 0.4% |
| Central America | 149 | 1.2% |
| China | 91 | 0.7% |
| Colombia | 56 | 0.4% |
| Eastern Asia | 127 | 1.0% |
| England | 8 | 0.1% |
| Europe | 146 | 1.2% |
| Germany | 32 | 0.3% |
| Greece | 17 | 0.1% |
| Honduras | 100 | 0.8% |
| Hong Kong | 13 | 0.1% |
| Korea | 36 | 0.3% |
| Latin America | 317 | 2.5% |
| Lebanon | 10 | 0.1% |
| Mexico | 49 | 0.4% |
| Northern Europe | 52 | 0.4% |
| Oceania | 41 | 0.3% |
| Peru | 38 | 0.3% |
| South Africa | 161 | 1.3% |
| South America | 168 | 1.3% |
| South Central Asia | 14 | 0.1% |
| Southern Europe | 26 | 0.2% |
| Spain | 9 | 0.1% |
| Sri Lanka | 14 | 0.1% |
| Switzerland | 24 | 0.2% |
| Syria | 21 | 0.2% |
| Turkey | 10 | 0.1% |
| Western Asia | 41 | 0.3% |
| Western Europe | 68 | 0.5% | View All 34 Rows |
Sex and Age in Lake Norman of Catawba
Sex and Age in Lake Norman of Catawba
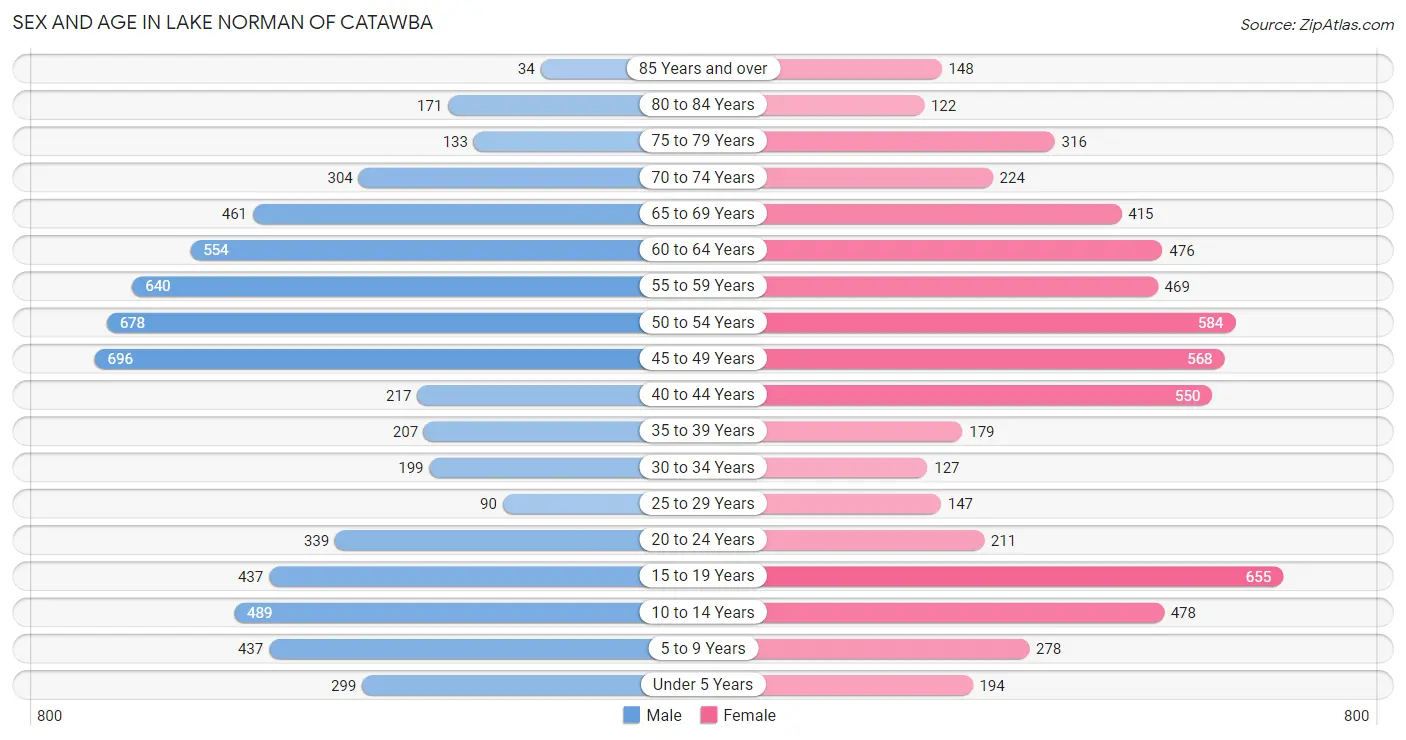
The most populous age groups in Lake Norman of Catawba are 45 to 49 Years (696 | 10.9%) for men and 15 to 19 Years (655 | 10.7%) for women.
| Age Bracket | Male | Female |
| Under 5 Years | 299 (4.7%) | 194 (3.2%) |
| 5 to 9 Years | 437 (6.8%) | 278 (4.5%) |
| 10 to 14 Years | 489 (7.7%) | 478 (7.8%) |
| 15 to 19 Years | 437 (6.8%) | 655 (10.7%) |
| 20 to 24 Years | 339 (5.3%) | 211 (3.4%) |
| 25 to 29 Years | 90 (1.4%) | 147 (2.4%) |
| 30 to 34 Years | 199 (3.1%) | 127 (2.1%) |
| 35 to 39 Years | 207 (3.2%) | 179 (2.9%) |
| 40 to 44 Years | 217 (3.4%) | 550 (9.0%) |
| 45 to 49 Years | 696 (10.9%) | 568 (9.2%) |
| 50 to 54 Years | 678 (10.6%) | 584 (9.5%) |
| 55 to 59 Years | 640 (10.0%) | 469 (7.6%) |
| 60 to 64 Years | 554 (8.7%) | 476 (7.7%) |
| 65 to 69 Years | 461 (7.2%) | 415 (6.8%) |
| 70 to 74 Years | 304 (4.8%) | 224 (3.6%) |
| 75 to 79 Years | 133 (2.1%) | 316 (5.1%) |
| 80 to 84 Years | 171 (2.7%) | 122 (2.0%) |
| 85 Years and over | 34 (0.5%) | 148 (2.4%) |
| Total | 6,385 (100.0%) | 6,141 (100.0%) |
Families and Households in Lake Norman of Catawba
Median Family Size in Lake Norman of Catawba
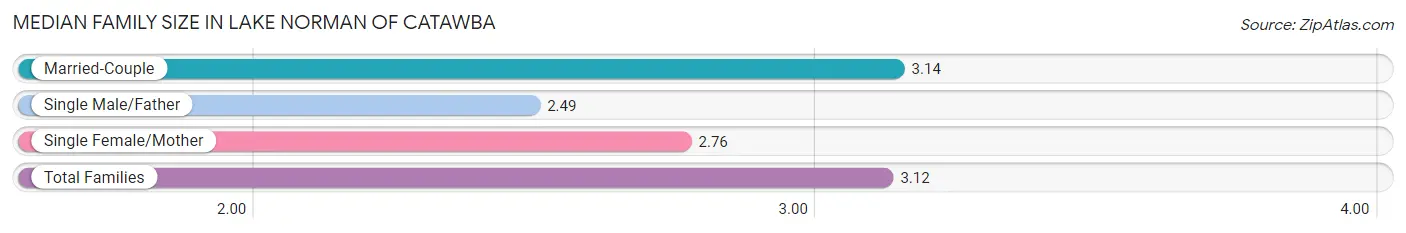
The median family size in Lake Norman of Catawba is 3.12 persons per family, with married-couple families (3,515 | 94.2%) accounting for the largest median family size of 3.14 persons per family. On the other hand, single male/father families (61 | 1.6%) represent the smallest median family size with 2.49 persons per family.
| Family Type | # Families | Family Size |
| Married-Couple | 3,515 (94.2%) | 3.14 |
| Single Male/Father | 61 (1.6%) | 2.49 |
| Single Female/Mother | 157 (4.2%) | 2.76 |
| Total Families | 3,733 (100.0%) | 3.12 |
Median Household Size in Lake Norman of Catawba
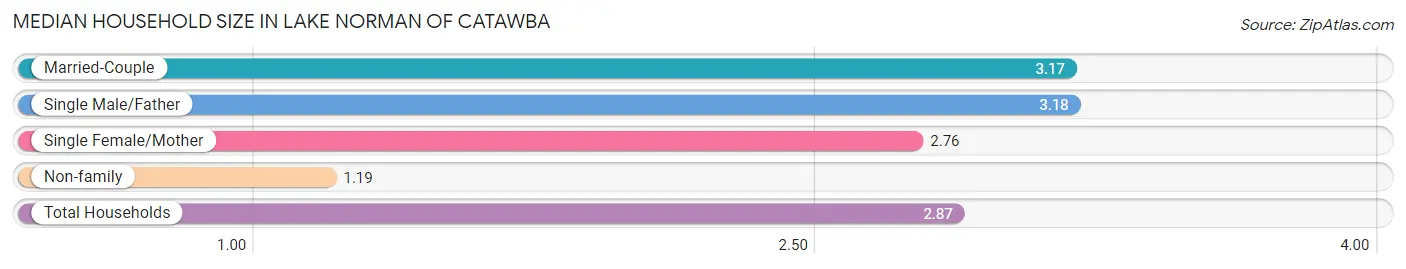
The median household size in Lake Norman of Catawba is 2.87 persons per household, with single male/father households (61 | 1.4%) accounting for the largest median household size of 3.18 persons per household. non-family households (630 | 14.4%) represent the smallest median household size with 1.19 persons per household.
| Household Type | # Households | Household Size |
| Married-Couple | 3,515 (80.6%) | 3.17 |
| Single Male/Father | 61 (1.4%) | 3.18 |
| Single Female/Mother | 157 (3.6%) | 2.76 |
| Non-family | 630 (14.4%) | 1.19 |
| Total Households | 4,363 (100.0%) | 2.87 |
Household Size by Marriage Status in Lake Norman of Catawba
Out of a total of 4,363 households in Lake Norman of Catawba, 3,733 (85.6%) are family households, while 630 (14.4%) are nonfamily households. The most numerous type of family households are 2-person households, comprising 1,663, and the most common type of nonfamily households are 1-person households, comprising 524.
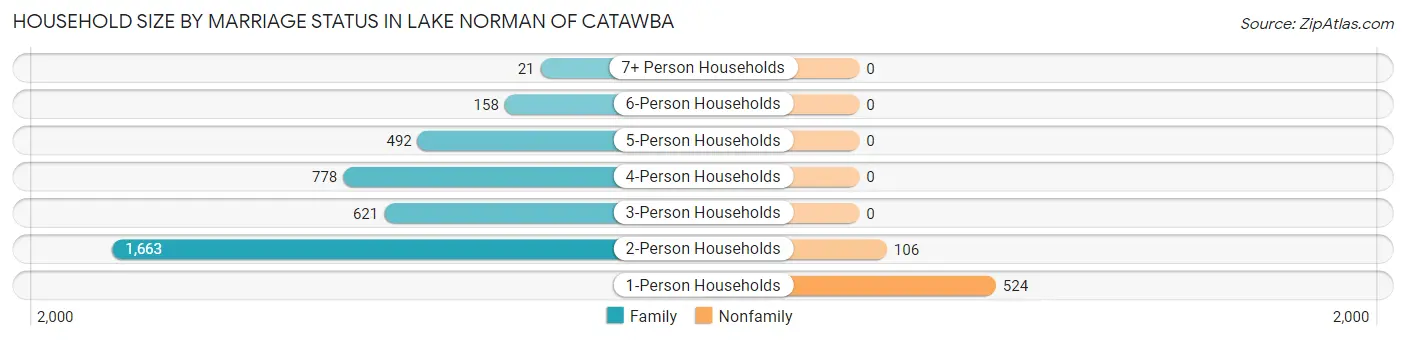
| Household Size | Family Households | Nonfamily Households |
| 1-Person Households | - | 524 (12.0%) |
| 2-Person Households | 1,663 (38.1%) | 106 (2.4%) |
| 3-Person Households | 621 (14.2%) | 0 (0.0%) |
| 4-Person Households | 778 (17.8%) | 0 (0.0%) |
| 5-Person Households | 492 (11.3%) | 0 (0.0%) |
| 6-Person Households | 158 (3.6%) | 0 (0.0%) |
| 7+ Person Households | 21 (0.5%) | 0 (0.0%) |
| Total | 3,733 (85.6%) | 630 (14.4%) |
Female Fertility in Lake Norman of Catawba
Fertility by Age in Lake Norman of Catawba
Average fertility rate in Lake Norman of Catawba is 43.0 births per 1,000 women. Women in the age bracket of 20 to 34 years have the highest fertility rate with 124.0 births per 1,000 women. Women in the age bracket of 20 to 34 years acount for 53.6% of all women with births.
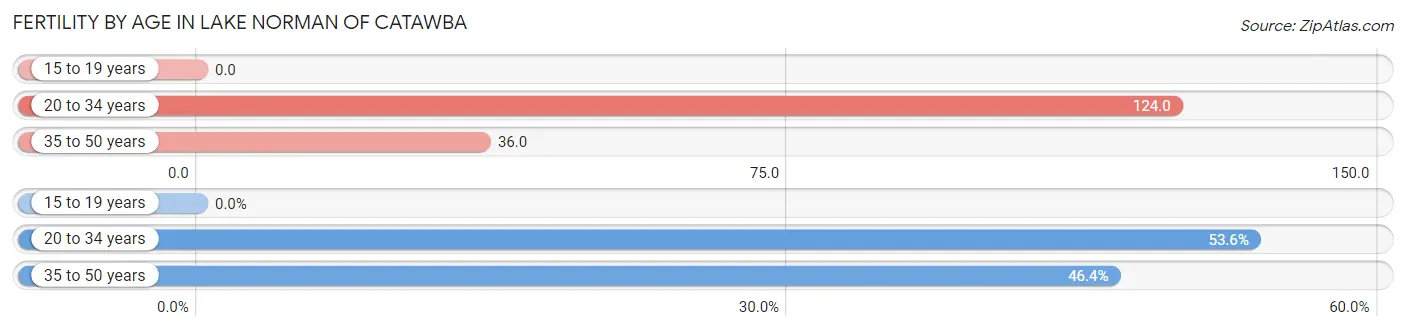
| Age Bracket | Women with Births | Births / 1,000 Women |
| 15 to 19 years | 0 (0.0%) | 0.0 |
| 20 to 34 years | 60 (53.6%) | 124.0 |
| 35 to 50 years | 52 (46.4%) | 36.0 |
| Total | 112 (100.0%) | 43.0 |
Fertility by Age by Marriage Status in Lake Norman of Catawba
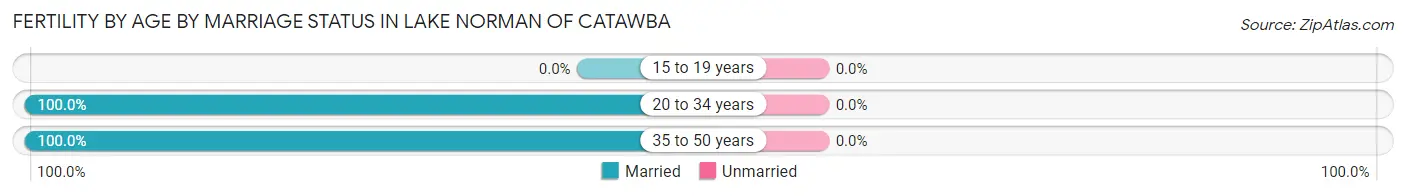
| Age Bracket | Married | Unmarried |
| 15 to 19 years | 0 (0.0%) | 0 (0.0%) |
| 20 to 34 years | 60 (100.0%) | 0 (0.0%) |
| 35 to 50 years | 52 (100.0%) | 0 (0.0%) |
| Total | 112 (100.0%) | 0 (0.0%) |
Fertility by Education in Lake Norman of Catawba
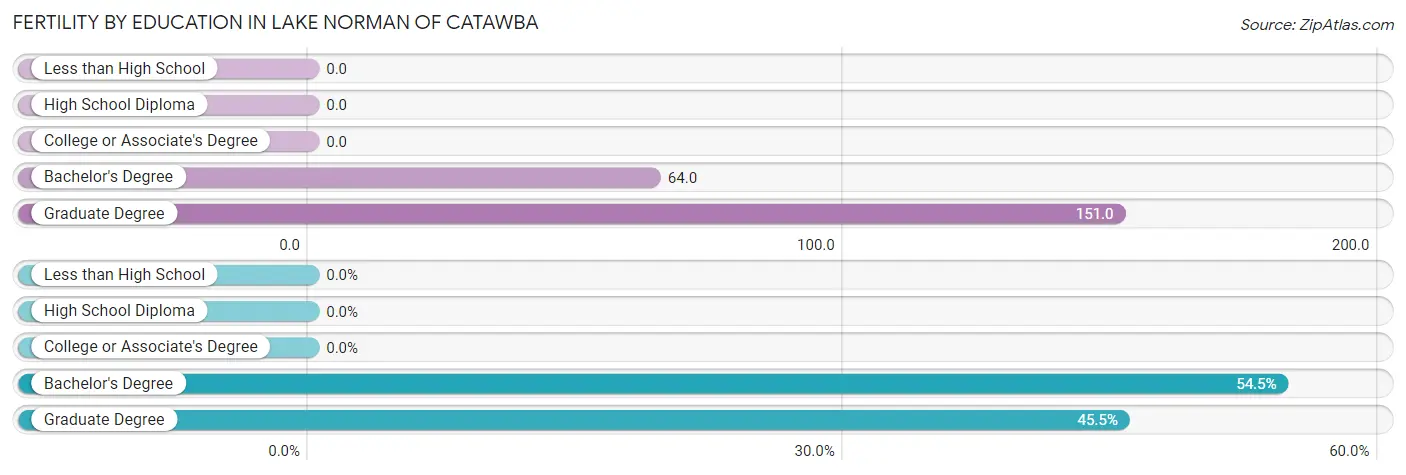
| Educational Attainment | Women with Births | Births / 1,000 Women |
| Less than High School | 0 (0.0%) | 0.0 |
| High School Diploma | 0 (0.0%) | 0.0 |
| College or Associate's Degree | 0 (0.0%) | 0.0 |
| Bachelor's Degree | 61 (54.5%) | 64.0 |
| Graduate Degree | 51 (45.5%) | 151.0 |
| Total | 112 (100.0%) | 43.0 |
Fertility by Education by Marriage Status in Lake Norman of Catawba
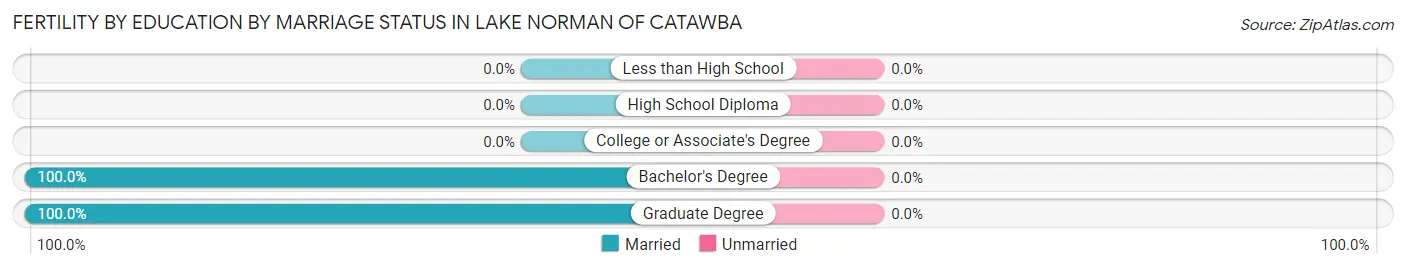
| Educational Attainment | Married | Unmarried |
| Less than High School | 0 (0.0%) | 0 (0.0%) |
| High School Diploma | 0 (0.0%) | 0 (0.0%) |
| College or Associate's Degree | 0 (0.0%) | 0 (0.0%) |
| Bachelor's Degree | 61 (100.0%) | 0 (0.0%) |
| Graduate Degree | 51 (100.0%) | 0 (0.0%) |
| Total | 112 (100.0%) | 0 (0.0%) |
Employment Characteristics in Lake Norman of Catawba
Employment by Class of Employer in Lake Norman of Catawba
Among the 5,838 employed individuals in Lake Norman of Catawba, private company employees (4,267 | 73.1%), self-employed (incorporated) (623 | 10.7%), and self-employed (not incorporated) (407 | 7.0%) make up the most common classes of employment.
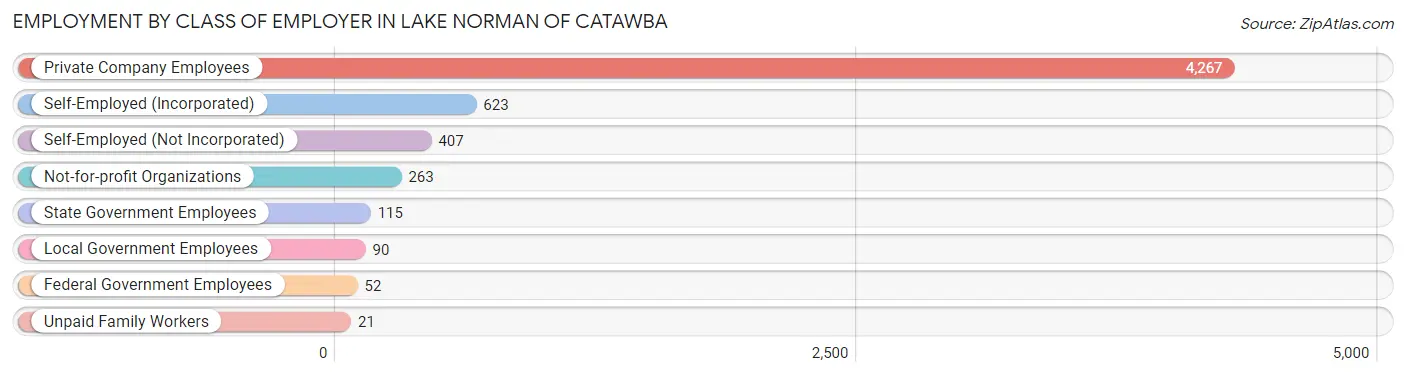
| Employer Class | # Employees | % Employees |
| Private Company Employees | 4,267 | 73.1% |
| Self-Employed (Incorporated) | 623 | 10.7% |
| Self-Employed (Not Incorporated) | 407 | 7.0% |
| Not-for-profit Organizations | 263 | 4.5% |
| Local Government Employees | 90 | 1.5% |
| State Government Employees | 115 | 2.0% |
| Federal Government Employees | 52 | 0.9% |
| Unpaid Family Workers | 21 | 0.4% |
| Total | 5,838 | 100.0% |
Employment Status by Age in Lake Norman of Catawba
According to the labor force statistics for Lake Norman of Catawba, out of the total population over 16 years of age (9,967), 60.6% or 6,040 individuals are in the labor force, with 2.0% or 121 of them unemployed. The age group with the highest labor force participation rate is 45 to 54 years, with 86.9% or 2,195 individuals in the labor force. Within the labor force, the 20 to 24 years age range has the highest percentage of unemployed individuals, with 13.6% or 48 of them being unemployed.
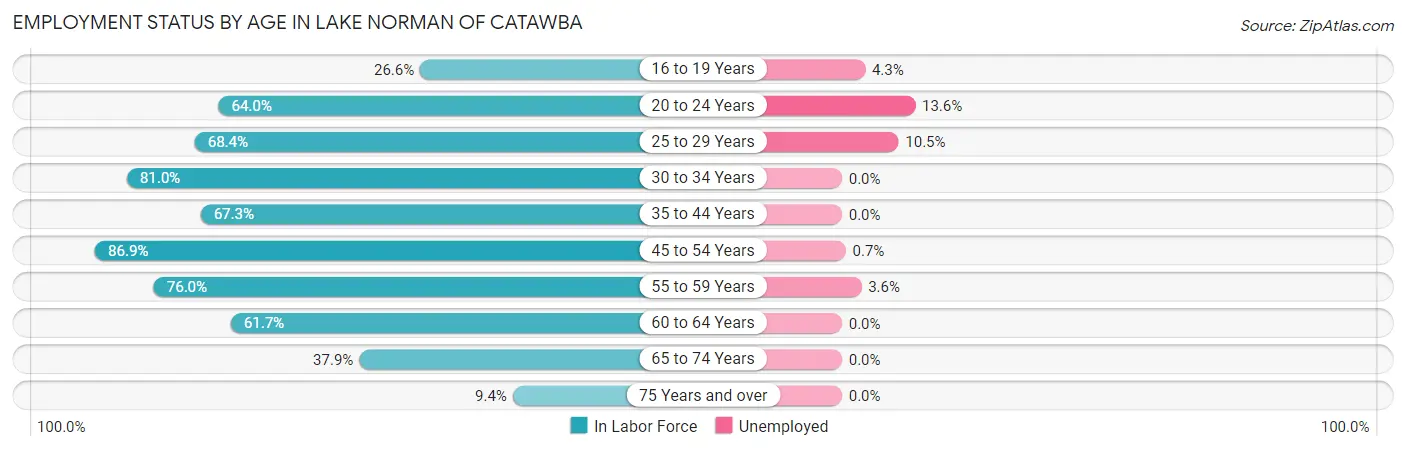
| Age Bracket | In Labor Force | Unemployed |
| 16 to 19 Years | 188 (26.6%) | 8 (4.3%) |
| 20 to 24 Years | 352 (64.0%) | 48 (13.6%) |
| 25 to 29 Years | 162 (68.4%) | 17 (10.5%) |
| 30 to 34 Years | 264 (81.0%) | 0 (0.0%) |
| 35 to 44 Years | 776 (67.3%) | 0 (0.0%) |
| 45 to 54 Years | 2,195 (86.9%) | 15 (0.7%) |
| 55 to 59 Years | 843 (76.0%) | 30 (3.6%) |
| 60 to 64 Years | 636 (61.7%) | 0 (0.0%) |
| 65 to 74 Years | 532 (37.9%) | 0 (0.0%) |
| 75 Years and over | 87 (9.4%) | 0 (0.0%) |
| Total | 6,040 (60.6%) | 121 (2.0%) |
Employment Status by Educational Attainment in Lake Norman of Catawba
According to labor force statistics for Lake Norman of Catawba, 76.4% of individuals (4,875) out of the total population between 25 and 64 years of age (6,381) are in the labor force, with 1.3% or 63 of them being unemployed. The group with the highest labor force participation rate are those with the educational attainment of bachelor's degree or higher, with 83.5% or 3,676 individuals in the labor force. Within the labor force, individuals with college / associate degree education have the highest percentage of unemployment, with 4.3% or 34 of them being unemployed.
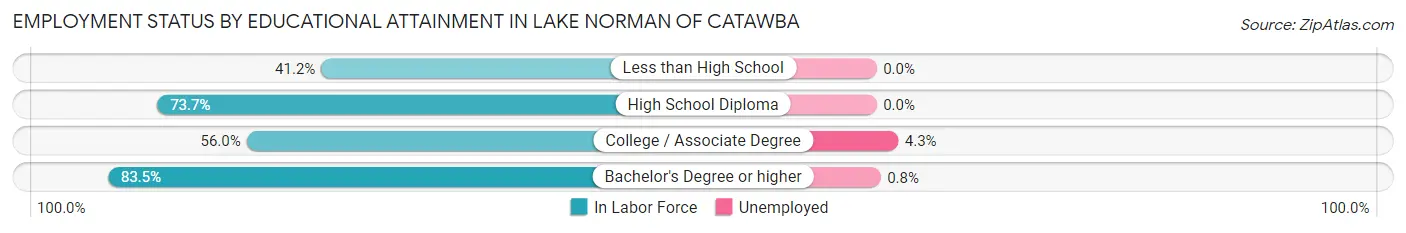
| Educational Attainment | In Labor Force | Unemployed |
| Less than High School | 7 (41.2%) | 0 (0.0%) |
| High School Diploma | 398 (73.7%) | 0 (0.0%) |
| College / Associate Degree | 796 (56.0%) | 61 (4.3%) |
| Bachelor's Degree or higher | 3,676 (83.5%) | 35 (0.8%) |
| Total | 4,875 (76.4%) | 83 (1.3%) |
Employment Occupations by Sex in Lake Norman of Catawba
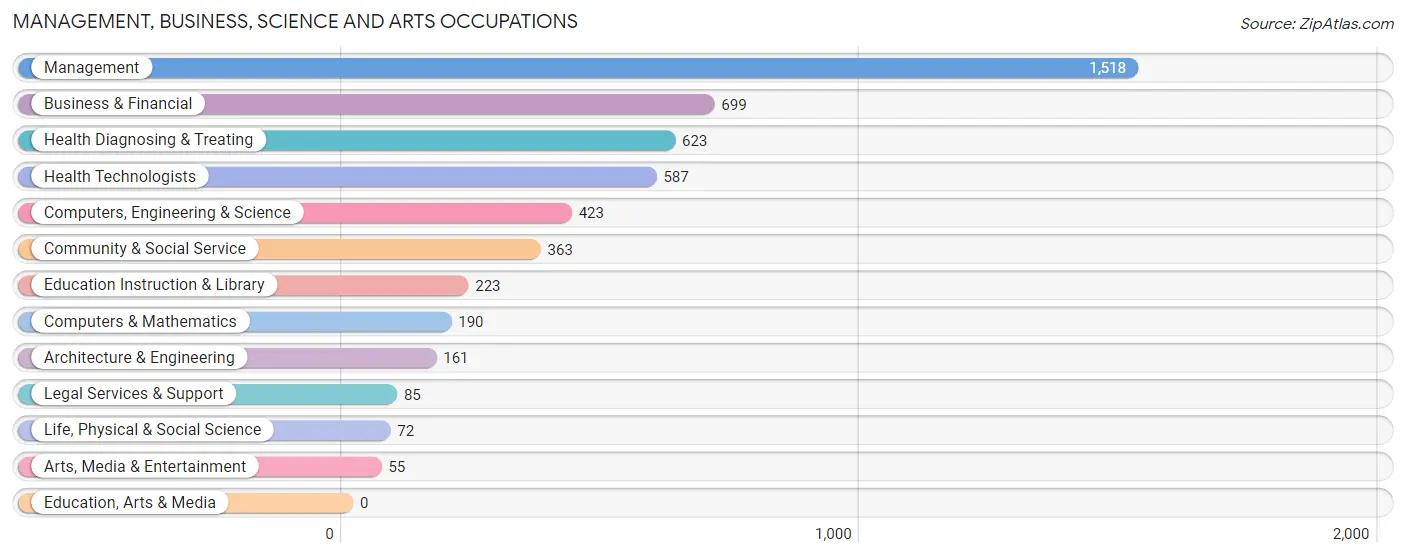
Management, Business, Science and Arts Occupations
The most common Management, Business, Science and Arts occupations in Lake Norman of Catawba are Management (1,518 | 25.7%), Business & Financial (699 | 11.8%), Health Diagnosing & Treating (623 | 10.5%), Health Technologists (587 | 9.9%), and Computers, Engineering & Science (423 | 7.1%).
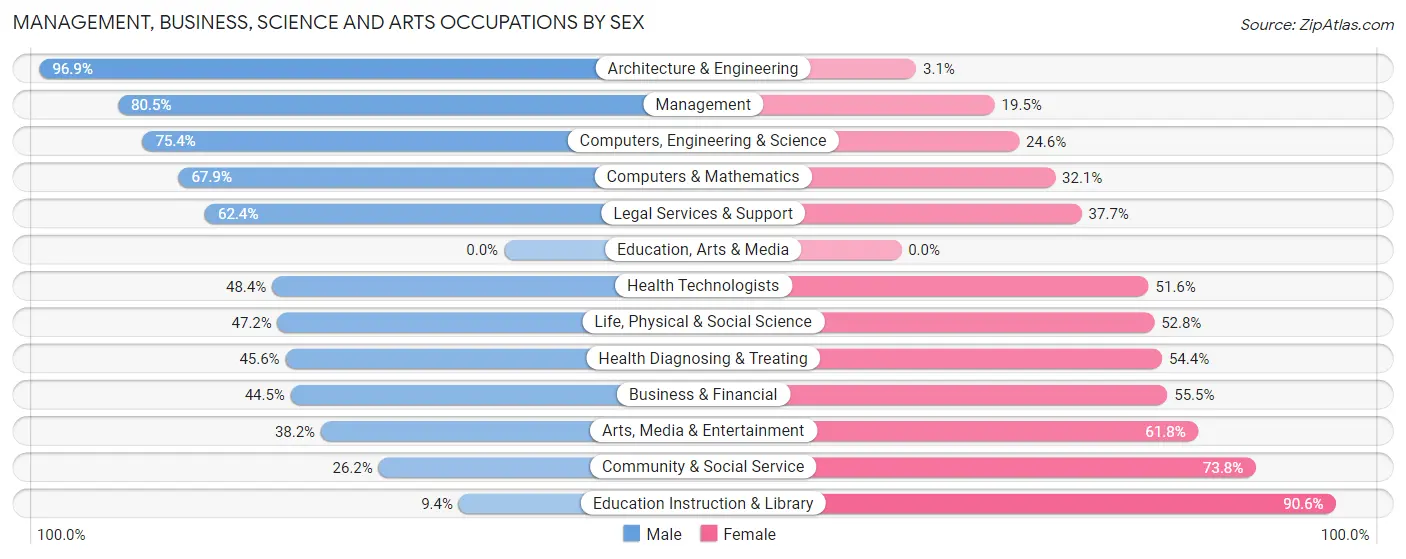
Management, Business, Science and Arts Occupations by Sex
Within the Management, Business, Science and Arts occupations in Lake Norman of Catawba, the most male-oriented occupations are Architecture & Engineering (96.9%), Management (80.5%), and Computers, Engineering & Science (75.4%), while the most female-oriented occupations are Education Instruction & Library (90.6%), Community & Social Service (73.8%), and Arts, Media & Entertainment (61.8%).
| Occupation | Male | Female |
| Management | 1,222 (80.5%) | 296 (19.5%) |
| Business & Financial | 311 (44.5%) | 388 (55.5%) |
| Computers, Engineering & Science | 319 (75.4%) | 104 (24.6%) |
| Computers & Mathematics | 129 (67.9%) | 61 (32.1%) |
| Architecture & Engineering | 156 (96.9%) | 5 (3.1%) |
| Life, Physical & Social Science | 34 (47.2%) | 38 (52.8%) |
| Community & Social Service | 95 (26.2%) | 268 (73.8%) |
| Education, Arts & Media | 0 (0.0%) | 0 (0.0%) |
| Legal Services & Support | 53 (62.4%) | 32 (37.7%) |
| Education Instruction & Library | 21 (9.4%) | 202 (90.6%) |
| Arts, Media & Entertainment | 21 (38.2%) | 34 (61.8%) |
| Health Diagnosing & Treating | 284 (45.6%) | 339 (54.4%) |
| Health Technologists | 284 (48.4%) | 303 (51.6%) |
| Total (Category) | 2,231 (61.5%) | 1,395 (38.5%) |
| Total (Overall) | 3,503 (59.2%) | 2,415 (40.8%) |
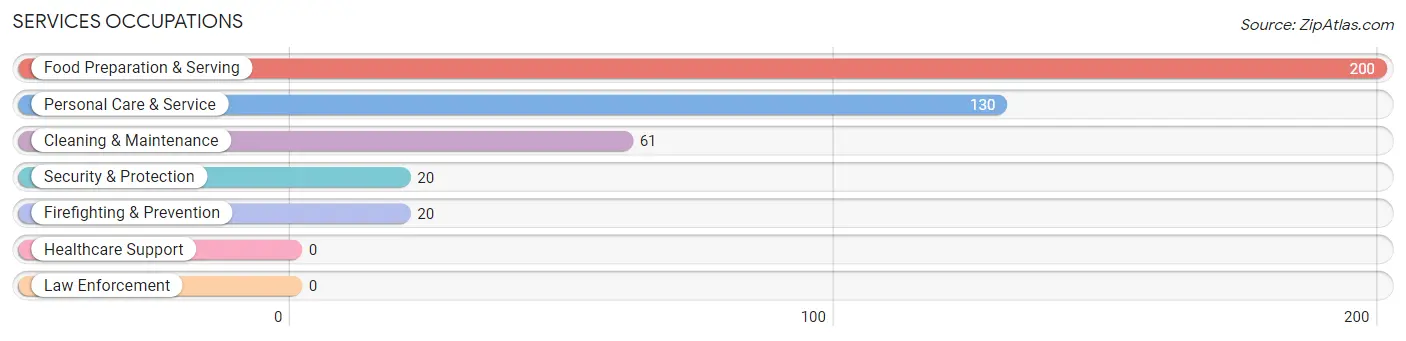
Services Occupations
The most common Services occupations in Lake Norman of Catawba are Food Preparation & Serving (200 | 3.4%), Personal Care & Service (130 | 2.2%), Cleaning & Maintenance (61 | 1.0%), Security & Protection (20 | 0.3%), and Firefighting & Prevention (20 | 0.3%).
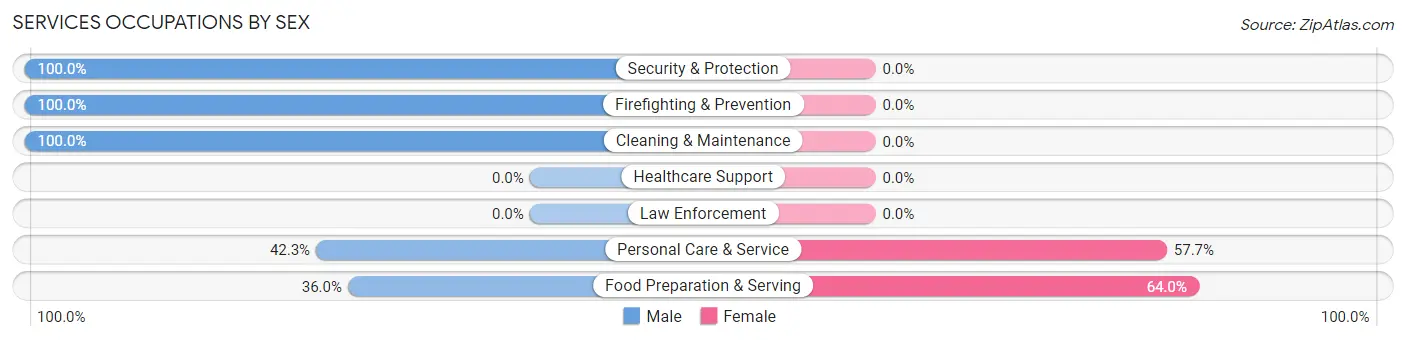
Services Occupations by Sex
Within the Services occupations in Lake Norman of Catawba, the most male-oriented occupations are Security & Protection (100.0%), Firefighting & Prevention (100.0%), and Cleaning & Maintenance (100.0%), while the most female-oriented occupations are Food Preparation & Serving (64.0%), and Personal Care & Service (57.7%).
| Occupation | Male | Female |
| Healthcare Support | 0 (0.0%) | 0 (0.0%) |
| Security & Protection | 20 (100.0%) | 0 (0.0%) |
| Firefighting & Prevention | 20 (100.0%) | 0 (0.0%) |
| Law Enforcement | 0 (0.0%) | 0 (0.0%) |
| Food Preparation & Serving | 72 (36.0%) | 128 (64.0%) |
| Cleaning & Maintenance | 61 (100.0%) | 0 (0.0%) |
| Personal Care & Service | 55 (42.3%) | 75 (57.7%) |
| Total (Category) | 208 (50.6%) | 203 (49.4%) |
| Total (Overall) | 3,503 (59.2%) | 2,415 (40.8%) |
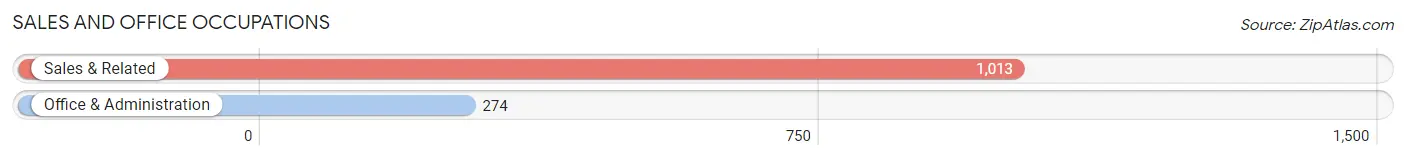
Sales and Office Occupations
The most common Sales and Office occupations in Lake Norman of Catawba are Sales & Related (1,013 | 17.1%), and Office & Administration (274 | 4.6%).
Sales and Office Occupations by Sex
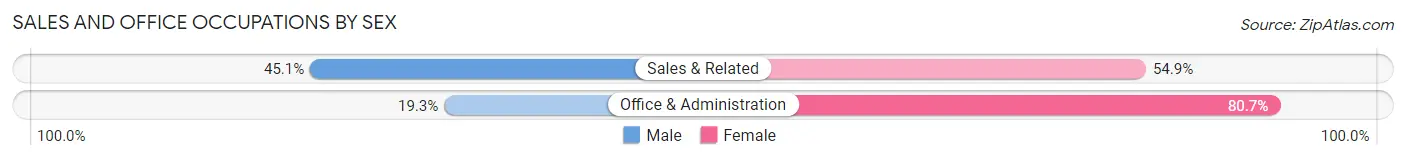
| Occupation | Male | Female |
| Sales & Related | 457 (45.1%) | 556 (54.9%) |
| Office & Administration | 53 (19.3%) | 221 (80.7%) |
| Total (Category) | 510 (39.6%) | 777 (60.4%) |
| Total (Overall) | 3,503 (59.2%) | 2,415 (40.8%) |
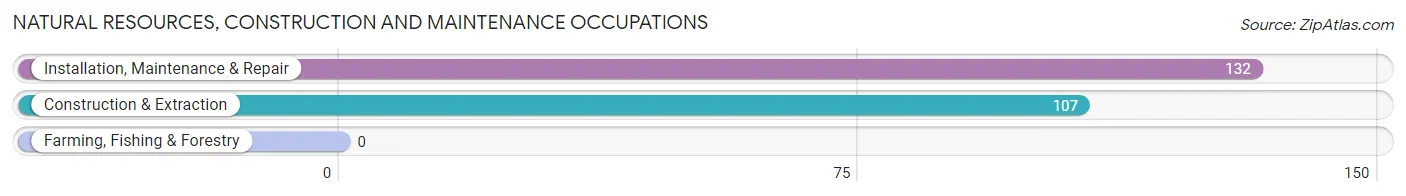
Natural Resources, Construction and Maintenance Occupations
The most common Natural Resources, Construction and Maintenance occupations in Lake Norman of Catawba are Installation, Maintenance & Repair (132 | 2.2%), and Construction & Extraction (107 | 1.8%).
Natural Resources, Construction and Maintenance Occupations by Sex
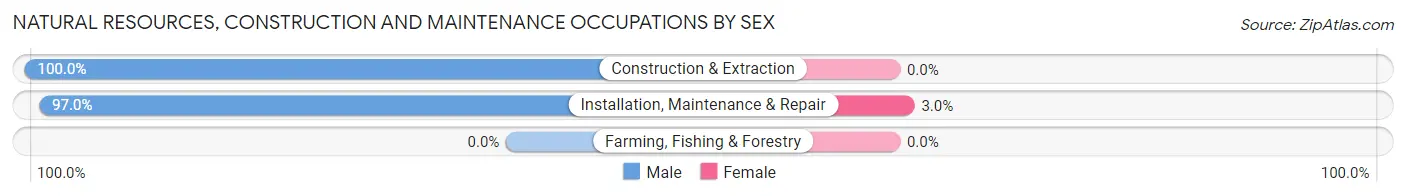
| Occupation | Male | Female |
| Farming, Fishing & Forestry | 0 (0.0%) | 0 (0.0%) |
| Construction & Extraction | 107 (100.0%) | 0 (0.0%) |
| Installation, Maintenance & Repair | 128 (97.0%) | 4 (3.0%) |
| Total (Category) | 235 (98.3%) | 4 (1.7%) |
| Total (Overall) | 3,503 (59.2%) | 2,415 (40.8%) |
Production, Transportation and Moving Occupations
The most common Production, Transportation and Moving occupations in Lake Norman of Catawba are Transportation (182 | 3.1%), Production (87 | 1.5%), and Material Moving (86 | 1.5%).
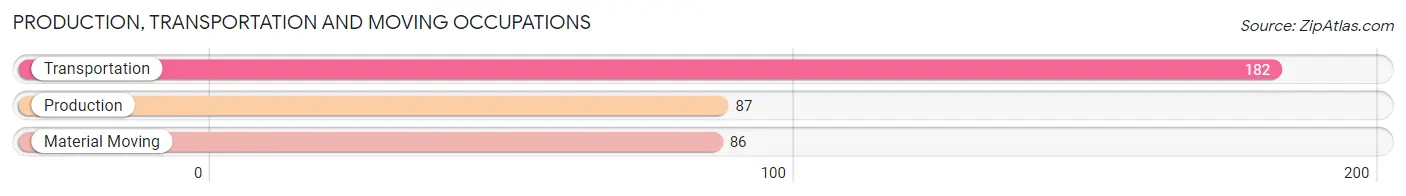
Production, Transportation and Moving Occupations by Sex
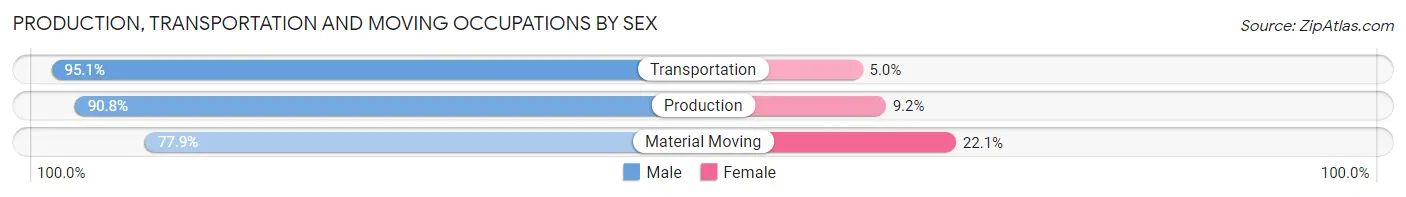
| Occupation | Male | Female |
| Production | 79 (90.8%) | 8 (9.2%) |
| Transportation | 173 (95.1%) | 9 (5.0%) |
| Material Moving | 67 (77.9%) | 19 (22.1%) |
| Total (Category) | 319 (89.9%) | 36 (10.1%) |
| Total (Overall) | 3,503 (59.2%) | 2,415 (40.8%) |
Employment Industries by Sex in Lake Norman of Catawba
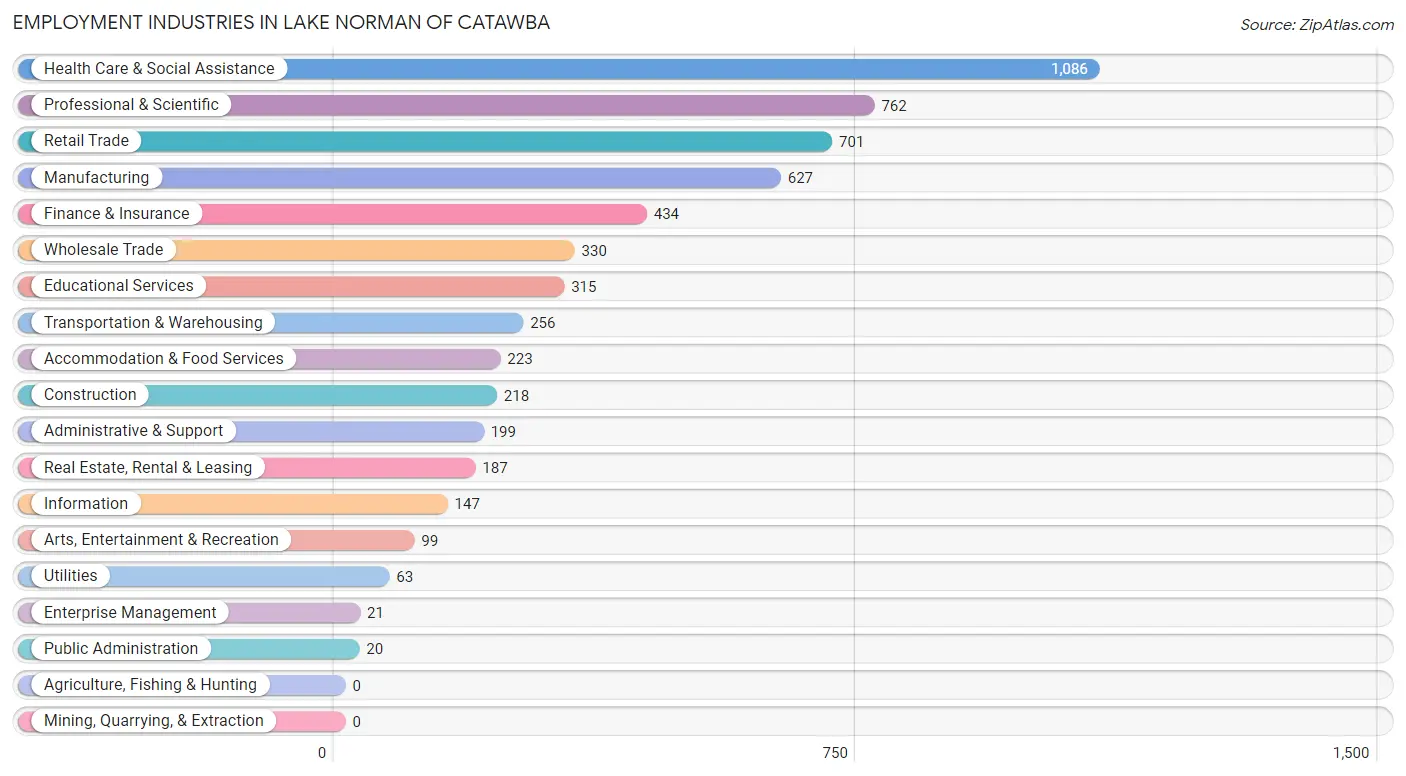
Employment Industries in Lake Norman of Catawba
The major employment industries in Lake Norman of Catawba include Health Care & Social Assistance (1,086 | 18.3%), Professional & Scientific (762 | 12.9%), Retail Trade (701 | 11.8%), Manufacturing (627 | 10.6%), and Finance & Insurance (434 | 7.3%).
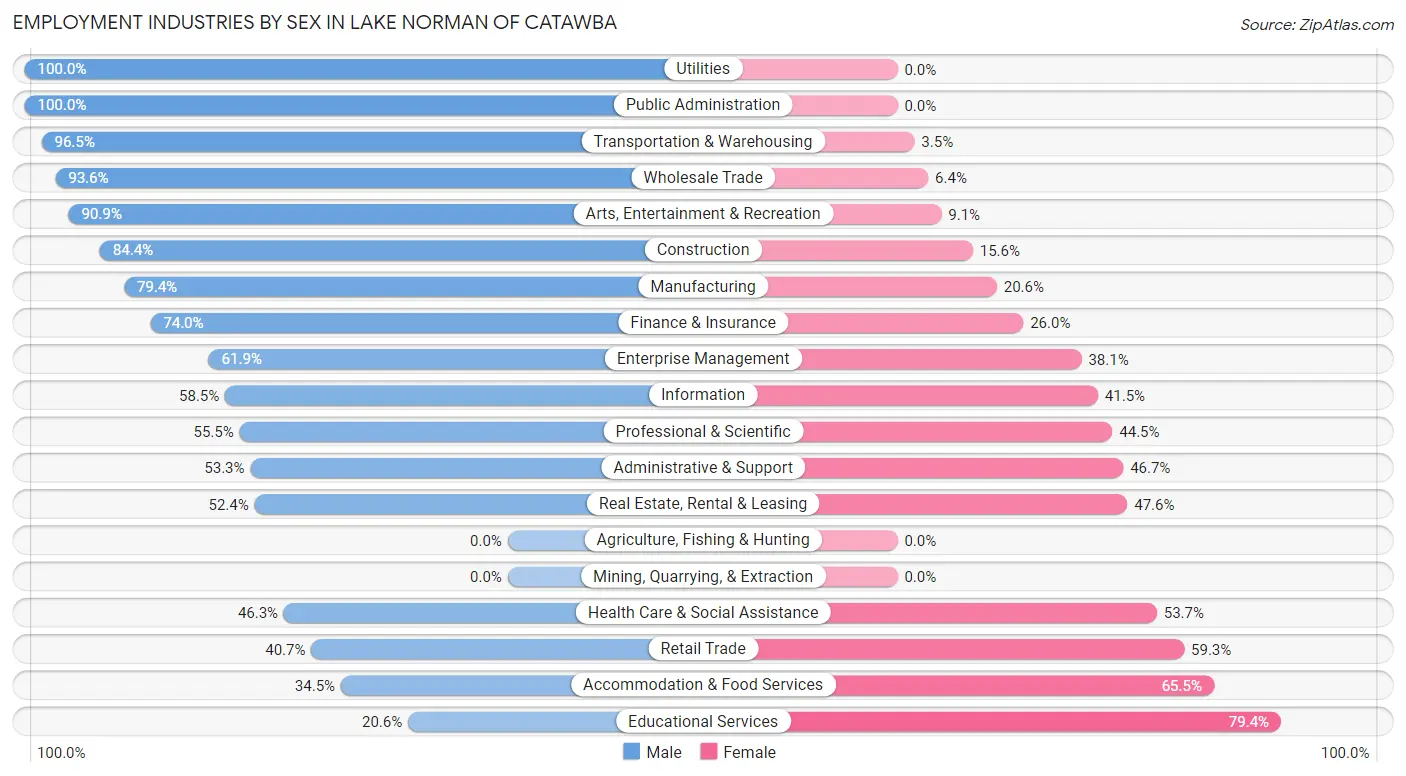
Employment Industries by Sex in Lake Norman of Catawba
The Lake Norman of Catawba industries that see more men than women are Utilities (100.0%), Public Administration (100.0%), and Transportation & Warehousing (96.5%), whereas the industries that tend to have a higher number of women are Educational Services (79.4%), Accommodation & Food Services (65.5%), and Retail Trade (59.3%).
| Industry | Male | Female |
| Agriculture, Fishing & Hunting | 0 (0.0%) | 0 (0.0%) |
| Mining, Quarrying, & Extraction | 0 (0.0%) | 0 (0.0%) |
| Construction | 184 (84.4%) | 34 (15.6%) |
| Manufacturing | 498 (79.4%) | 129 (20.6%) |
| Wholesale Trade | 309 (93.6%) | 21 (6.4%) |
| Retail Trade | 285 (40.7%) | 416 (59.3%) |
| Transportation & Warehousing | 247 (96.5%) | 9 (3.5%) |
| Utilities | 63 (100.0%) | 0 (0.0%) |
| Information | 86 (58.5%) | 61 (41.5%) |
| Finance & Insurance | 321 (74.0%) | 113 (26.0%) |
| Real Estate, Rental & Leasing | 98 (52.4%) | 89 (47.6%) |
| Professional & Scientific | 423 (55.5%) | 339 (44.5%) |
| Enterprise Management | 13 (61.9%) | 8 (38.1%) |
| Administrative & Support | 106 (53.3%) | 93 (46.7%) |
| Educational Services | 65 (20.6%) | 250 (79.4%) |
| Health Care & Social Assistance | 503 (46.3%) | 583 (53.7%) |
| Arts, Entertainment & Recreation | 90 (90.9%) | 9 (9.1%) |
| Accommodation & Food Services | 77 (34.5%) | 146 (65.5%) |
| Public Administration | 20 (100.0%) | 0 (0.0%) |
| Total | 3,503 (59.2%) | 2,415 (40.8%) |
Education in Lake Norman of Catawba
School Enrollment in Lake Norman of Catawba
The most common levels of schooling among the 3,292 students in Lake Norman of Catawba are high school (887 | 26.9%), middle school (838 | 25.5%), and elementary school (609 | 18.5%).
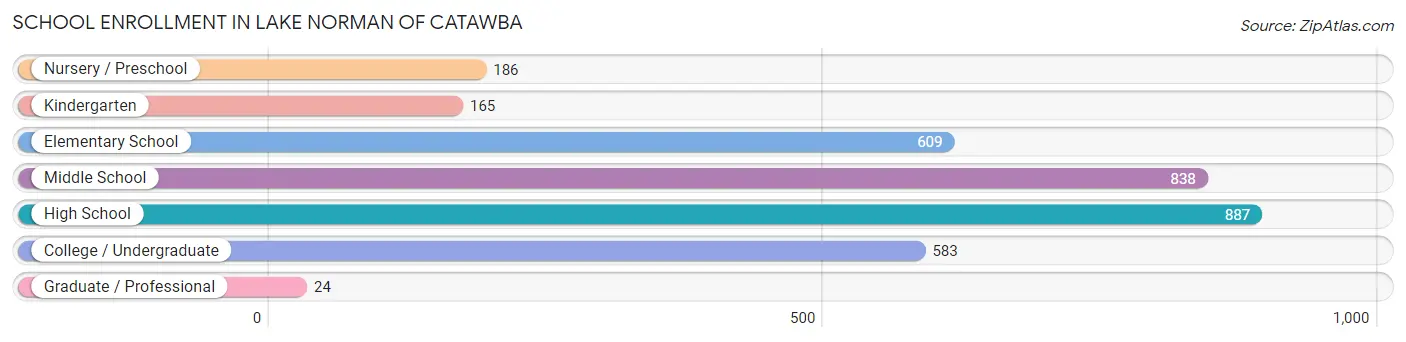
| School Level | # Students | % Students |
| Nursery / Preschool | 186 | 5.7% |
| Kindergarten | 165 | 5.0% |
| Elementary School | 609 | 18.5% |
| Middle School | 838 | 25.5% |
| High School | 887 | 26.9% |
| College / Undergraduate | 583 | 17.7% |
| Graduate / Professional | 24 | 0.7% |
| Total | 3,292 | 100.0% |
School Enrollment by Age by Funding Source in Lake Norman of Catawba
Out of a total of 3,292 students who are enrolled in schools in Lake Norman of Catawba, 540 (16.4%) attend a private institution, while the remaining 2,752 (83.6%) are enrolled in public schools. The age group of 3 to 4 year olds has the highest likelihood of being enrolled in private schools, with 123 (82.0% in the age bracket) enrolled. Conversely, the age group of 35 years and over has the lowest likelihood of being enrolled in a private school, with 75 (100.0% in the age bracket) attending a public institution.
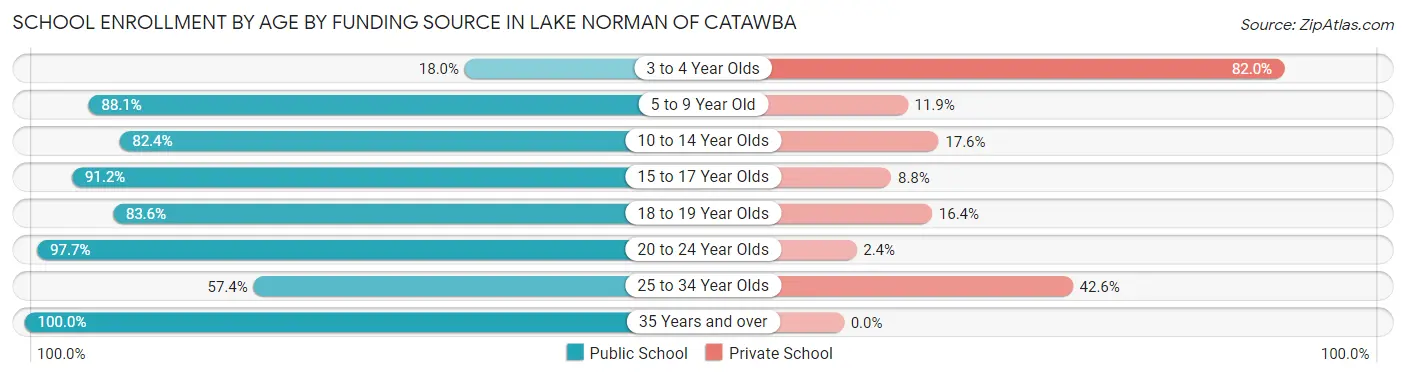
| Age Bracket | Public School | Private School |
| 3 to 4 Year Olds | 27 (18.0%) | 123 (82.0%) |
| 5 to 9 Year Old | 630 (88.1%) | 85 (11.9%) |
| 10 to 14 Year Olds | 789 (82.4%) | 169 (17.6%) |
| 15 to 17 Year Olds | 693 (91.2%) | 67 (8.8%) |
| 18 to 19 Year Olds | 173 (83.6%) | 34 (16.4%) |
| 20 to 24 Year Olds | 291 (97.7%) | 7 (2.4%) |
| 25 to 34 Year Olds | 74 (57.4%) | 55 (42.6%) |
| 35 Years and over | 75 (100.0%) | 0 (0.0%) |
| Total | 2,752 (83.6%) | 540 (16.4%) |
Educational Attainment by Field of Study in Lake Norman of Catawba
Business (1,799 | 28.5%), engineering (593 | 9.4%), science & technology (564 | 8.9%), social sciences (514 | 8.2%), and education (513 | 8.1%) are the most common fields of study among 6,303 individuals in Lake Norman of Catawba who have obtained a bachelor's degree or higher.
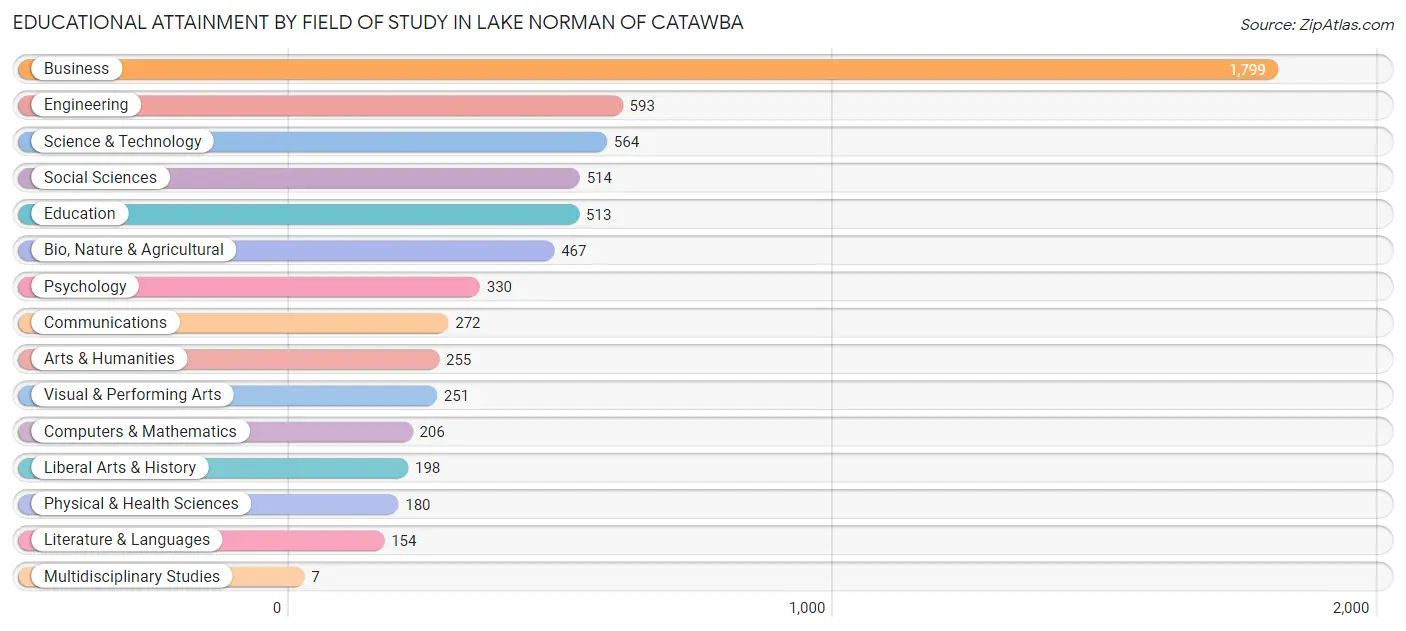
| Field of Study | # Graduates | % Graduates |
| Computers & Mathematics | 206 | 3.3% |
| Bio, Nature & Agricultural | 467 | 7.4% |
| Physical & Health Sciences | 180 | 2.9% |
| Psychology | 330 | 5.2% |
| Social Sciences | 514 | 8.2% |
| Engineering | 593 | 9.4% |
| Multidisciplinary Studies | 7 | 0.1% |
| Science & Technology | 564 | 8.9% |
| Business | 1,799 | 28.5% |
| Education | 513 | 8.1% |
| Literature & Languages | 154 | 2.4% |
| Liberal Arts & History | 198 | 3.1% |
| Visual & Performing Arts | 251 | 4.0% |
| Communications | 272 | 4.3% |
| Arts & Humanities | 255 | 4.1% |
| Total | 6,303 | 100.0% |
Transportation & Commute in Lake Norman of Catawba
Vehicle Availability by Sex in Lake Norman of Catawba
The most prevalent vehicle ownership categories in Lake Norman of Catawba are males with 2 vehicles (1,357, accounting for 39.2%) and females with 2 vehicles (1,126, making up 57.1%).
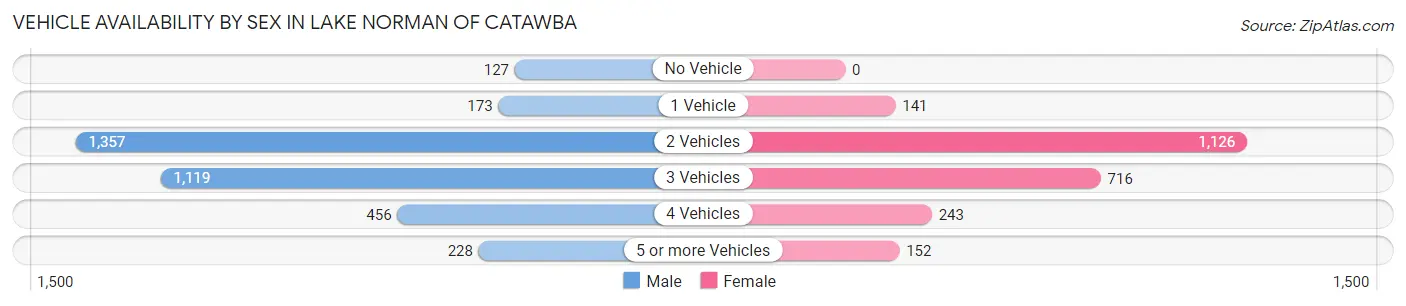
| Vehicles Available | Male | Female |
| No Vehicle | 127 (3.7%) | 0 (0.0%) |
| 1 Vehicle | 173 (5.0%) | 141 (5.9%) |
| 2 Vehicles | 1,357 (39.2%) | 1,126 (47.3%) |
| 3 Vehicles | 1,119 (32.3%) | 716 (30.1%) |
| 4 Vehicles | 456 (13.2%) | 243 (10.2%) |
| 5 or more Vehicles | 228 (6.6%) | 152 (6.4%) |
| Total | 3,460 (100.0%) | 2,378 (100.0%) |
Commute Time in Lake Norman of Catawba
The most frequently occuring commute durations in Lake Norman of Catawba are 15 to 19 minutes (726 commuters, 17.1%), 45 to 59 minutes (702 commuters, 16.5%), and 20 to 24 minutes (493 commuters, 11.6%).
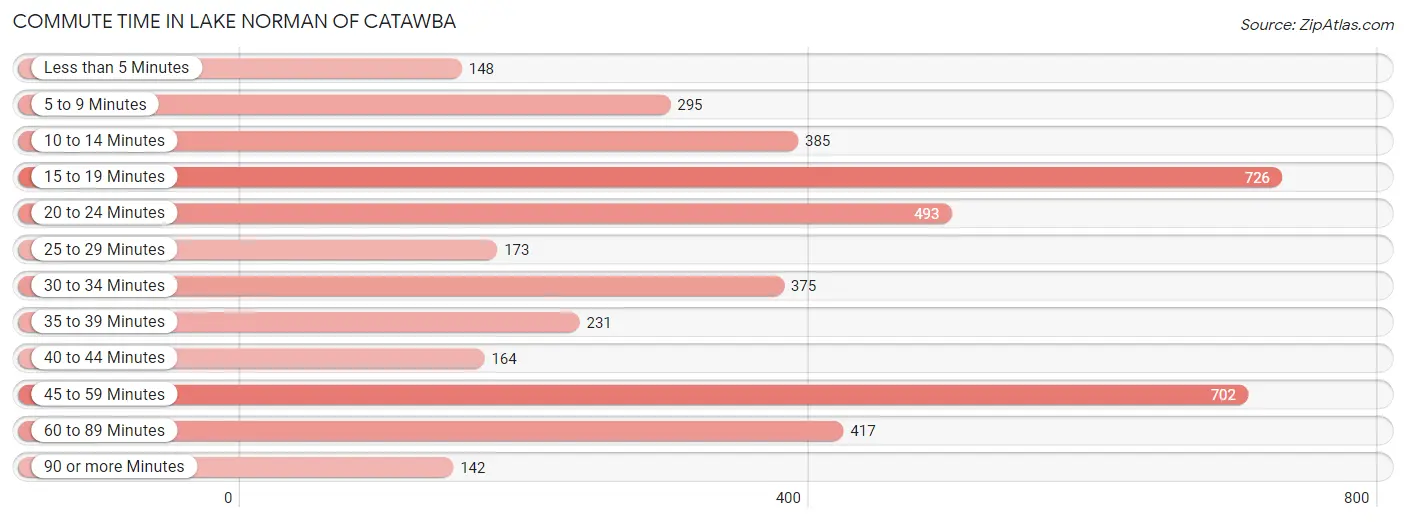
| Commute Time | # Commuters | % Commuters |
| Less than 5 Minutes | 148 | 3.5% |
| 5 to 9 Minutes | 295 | 6.9% |
| 10 to 14 Minutes | 385 | 9.1% |
| 15 to 19 Minutes | 726 | 17.1% |
| 20 to 24 Minutes | 493 | 11.6% |
| 25 to 29 Minutes | 173 | 4.1% |
| 30 to 34 Minutes | 375 | 8.8% |
| 35 to 39 Minutes | 231 | 5.4% |
| 40 to 44 Minutes | 164 | 3.9% |
| 45 to 59 Minutes | 702 | 16.5% |
| 60 to 89 Minutes | 417 | 9.8% |
| 90 or more Minutes | 142 | 3.3% |
Commute Time by Sex in Lake Norman of Catawba
The most common commute times in Lake Norman of Catawba are 45 to 59 minutes (499 commuters, 19.7%) for males and 15 to 19 minutes (407 commuters, 23.7%) for females.
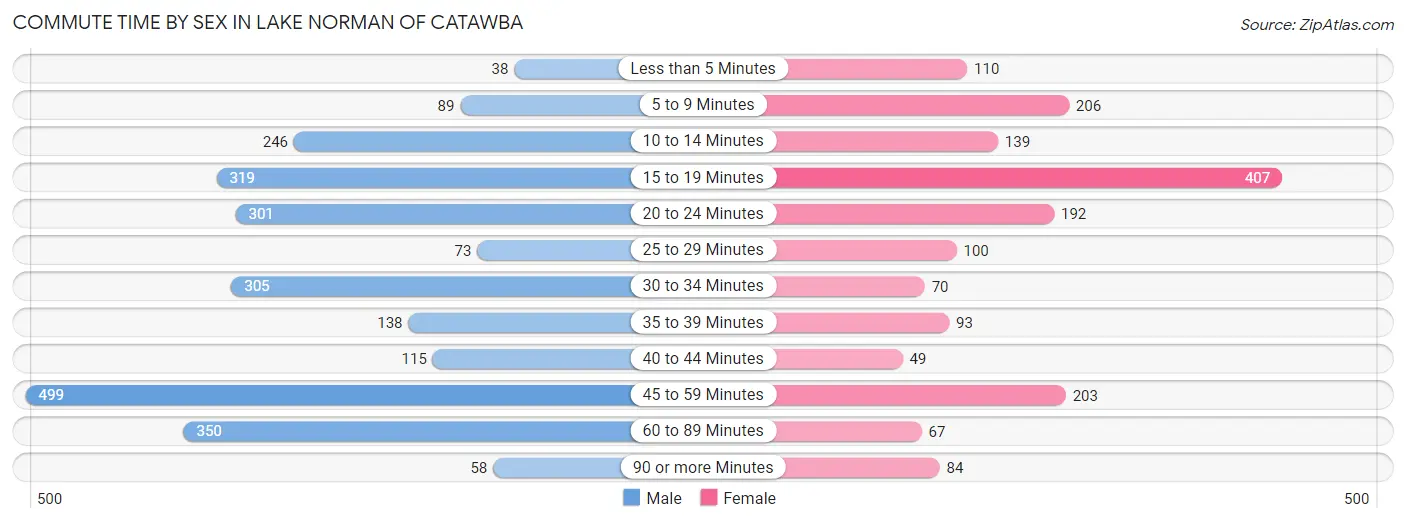
| Commute Time | Male | Female |
| Less than 5 Minutes | 38 (1.5%) | 110 (6.4%) |
| 5 to 9 Minutes | 89 (3.5%) | 206 (12.0%) |
| 10 to 14 Minutes | 246 (9.7%) | 139 (8.1%) |
| 15 to 19 Minutes | 319 (12.6%) | 407 (23.7%) |
| 20 to 24 Minutes | 301 (11.9%) | 192 (11.2%) |
| 25 to 29 Minutes | 73 (2.9%) | 100 (5.8%) |
| 30 to 34 Minutes | 305 (12.0%) | 70 (4.1%) |
| 35 to 39 Minutes | 138 (5.4%) | 93 (5.4%) |
| 40 to 44 Minutes | 115 (4.5%) | 49 (2.9%) |
| 45 to 59 Minutes | 499 (19.7%) | 203 (11.8%) |
| 60 to 89 Minutes | 350 (13.8%) | 67 (3.9%) |
| 90 or more Minutes | 58 (2.3%) | 84 (4.9%) |
Time of Departure to Work by Sex in Lake Norman of Catawba
The most frequent times of departure to work in Lake Norman of Catawba are 7:00 AM to 7:29 AM (554, 21.9%) for males and 8:00 AM to 8:29 AM (373, 21.7%) for females.
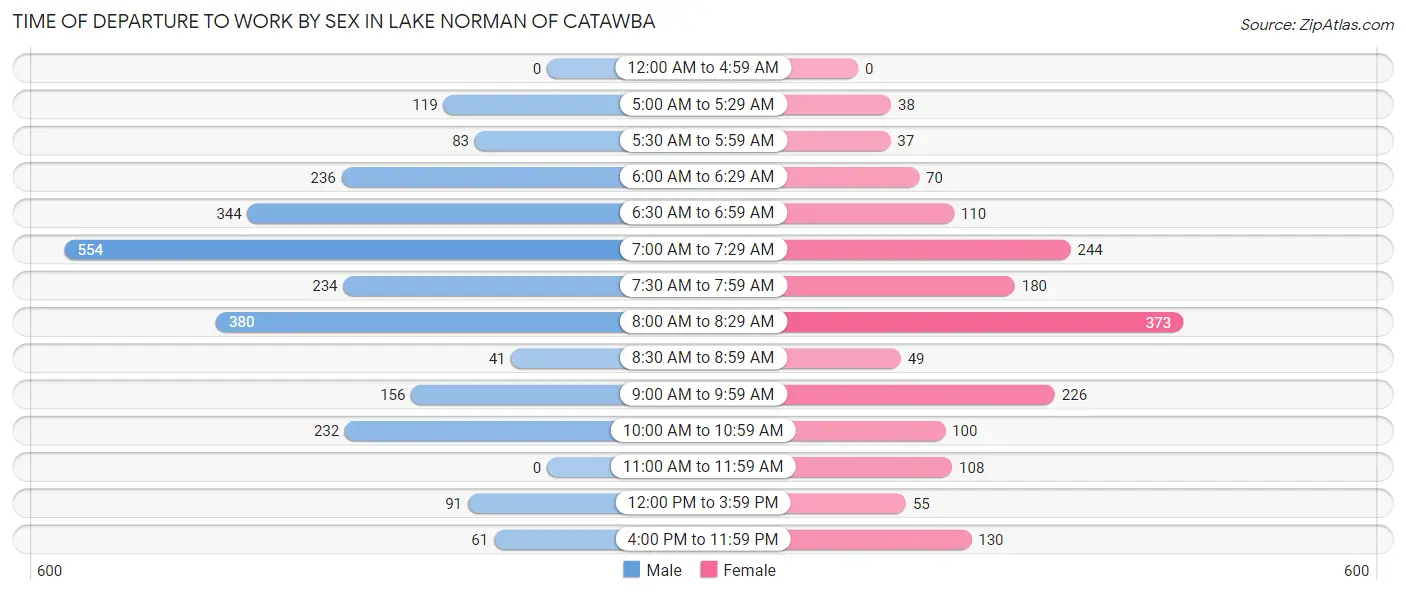
| Time of Departure | Male | Female |
| 12:00 AM to 4:59 AM | 0 (0.0%) | 0 (0.0%) |
| 5:00 AM to 5:29 AM | 119 (4.7%) | 38 (2.2%) |
| 5:30 AM to 5:59 AM | 83 (3.3%) | 37 (2.1%) |
| 6:00 AM to 6:29 AM | 236 (9.3%) | 70 (4.1%) |
| 6:30 AM to 6:59 AM | 344 (13.6%) | 110 (6.4%) |
| 7:00 AM to 7:29 AM | 554 (21.9%) | 244 (14.2%) |
| 7:30 AM to 7:59 AM | 234 (9.2%) | 180 (10.5%) |
| 8:00 AM to 8:29 AM | 380 (15.0%) | 373 (21.7%) |
| 8:30 AM to 8:59 AM | 41 (1.6%) | 49 (2.9%) |
| 9:00 AM to 9:59 AM | 156 (6.2%) | 226 (13.1%) |
| 10:00 AM to 10:59 AM | 232 (9.2%) | 100 (5.8%) |
| 11:00 AM to 11:59 AM | 0 (0.0%) | 108 (6.3%) |
| 12:00 PM to 3:59 PM | 91 (3.6%) | 55 (3.2%) |
| 4:00 PM to 11:59 PM | 61 (2.4%) | 130 (7.6%) |
| Total | 2,531 (100.0%) | 1,720 (100.0%) |
Housing Occupancy in Lake Norman of Catawba
Occupancy by Ownership in Lake Norman of Catawba
Of the total 3,773 dwellings in Lake Norman of Catawba, owner-occupied units account for 3,236 (85.8%), while renter-occupied units make up 537 (14.2%).
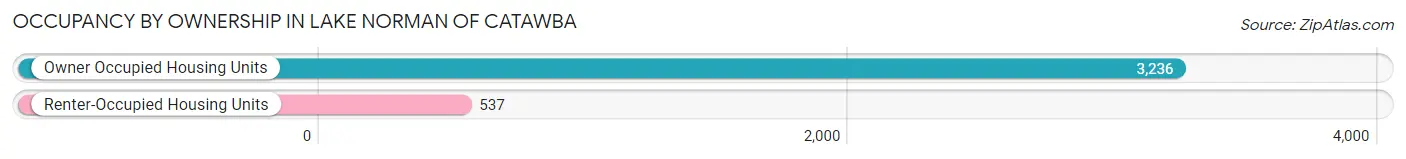
| Occupancy | # Housing Units | % Housing Units |
| Owner Occupied Housing Units | 3,236 | 85.8% |
| Renter-Occupied Housing Units | 537 | 14.2% |
| Total Occupied Housing Units | 3,773 | 100.0% |
Occupancy by Household Size in Lake Norman of Catawba
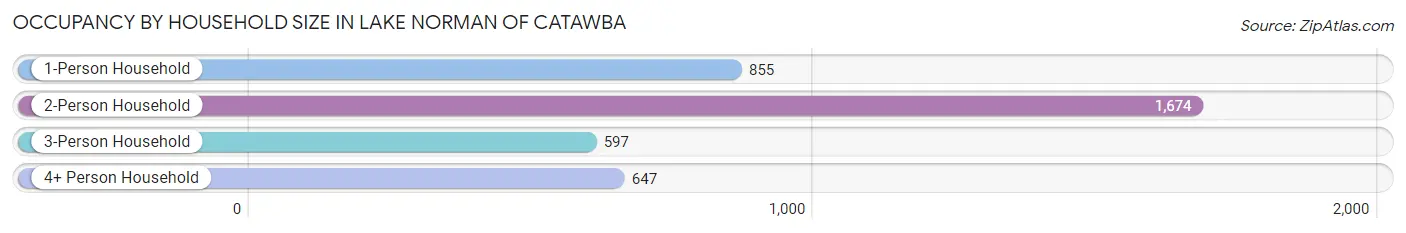
| Household Size | # Housing Units | % Housing Units |
| 1-Person Household | 855 | 22.7% |
| 2-Person Household | 1,674 | 44.4% |
| 3-Person Household | 597 | 15.8% |
| 4+ Person Household | 647 | 17.2% |
| Total Housing Units | 3,773 | 100.0% |
Occupancy by Ownership by Household Size in Lake Norman of Catawba
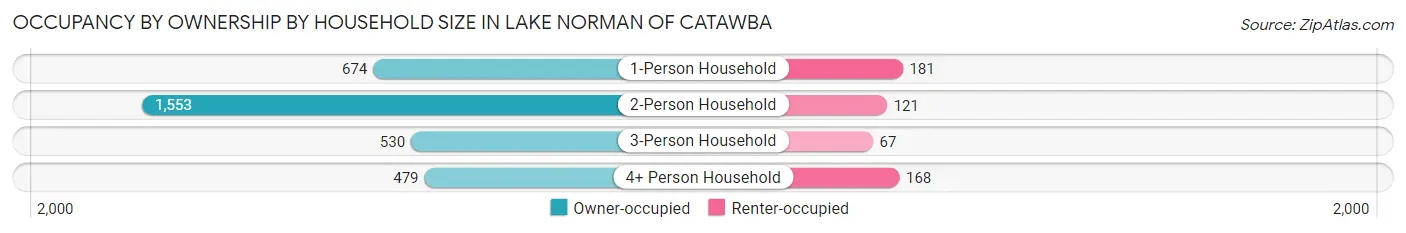
| Household Size | Owner-occupied | Renter-occupied |
| 1-Person Household | 674 (78.8%) | 181 (21.2%) |
| 2-Person Household | 1,553 (92.8%) | 121 (7.2%) |
| 3-Person Household | 530 (88.8%) | 67 (11.2%) |
| 4+ Person Household | 479 (74.0%) | 168 (26.0%) |
| Total Housing Units | 3,236 (85.8%) | 537 (14.2%) |
Occupancy by Educational Attainment in Lake Norman of Catawba
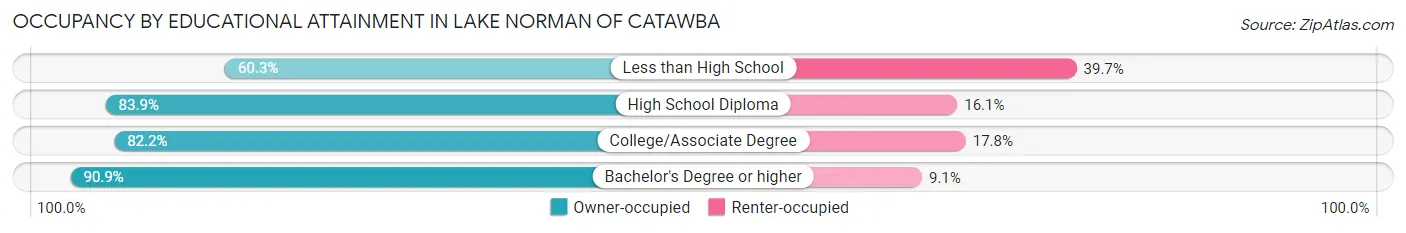
| Household Size | Owner-occupied | Renter-occupied |
| Less than High School | 94 (60.3%) | 62 (39.7%) |
| High School Diploma | 522 (83.9%) | 100 (16.1%) |
| College/Associate Degree | 972 (82.2%) | 210 (17.8%) |
| Bachelor's Degree or higher | 1,648 (90.9%) | 165 (9.1%) |
Occupancy by Age of Householder in Lake Norman of Catawba
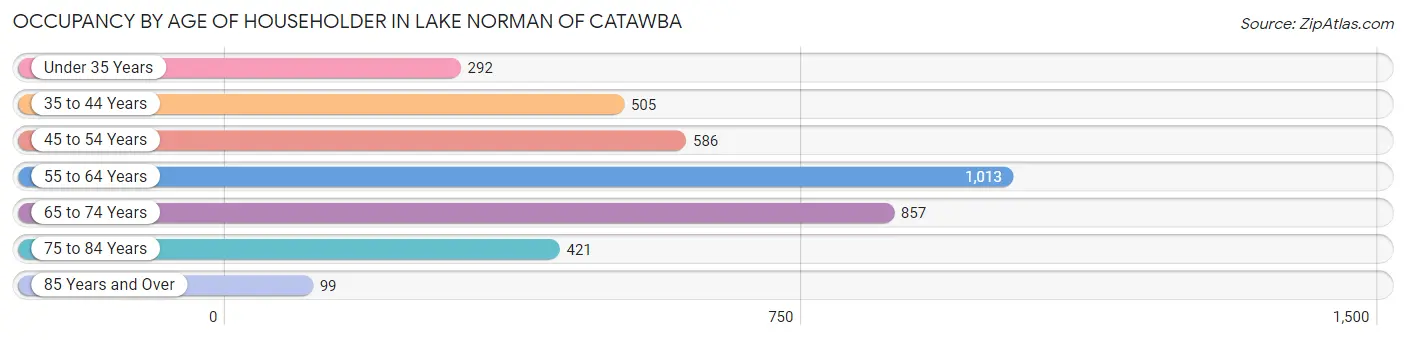
| Age Bracket | # Households | % Households |
| Under 35 Years | 292 | 7.7% |
| 35 to 44 Years | 505 | 13.4% |
| 45 to 54 Years | 586 | 15.5% |
| 55 to 64 Years | 1,013 | 26.9% |
| 65 to 74 Years | 857 | 22.7% |
| 75 to 84 Years | 421 | 11.2% |
| 85 Years and Over | 99 | 2.6% |
| Total | 3,773 | 100.0% |
Housing Finances in Lake Norman of Catawba
Median Income by Occupancy in Lake Norman of Catawba
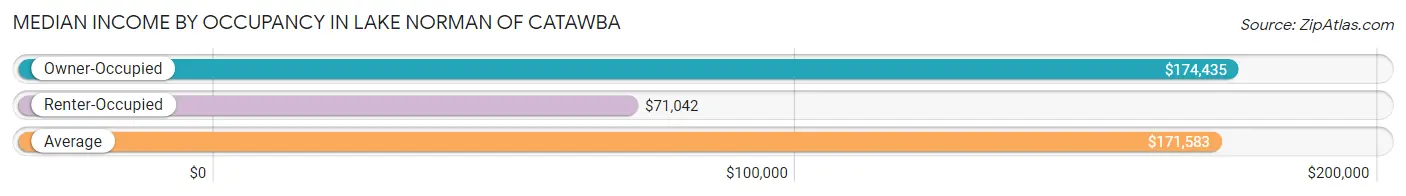
| Occupancy Type | # Households | Median Income |
| Owner-Occupied | 4,155 (95.2%) | $174,435 |
| Renter-Occupied | 208 (4.8%) | $71,042 |
| Average | 4,363 (100.0%) | $171,583 |
Occupancy by Householder Income Bracket in Lake Norman of Catawba
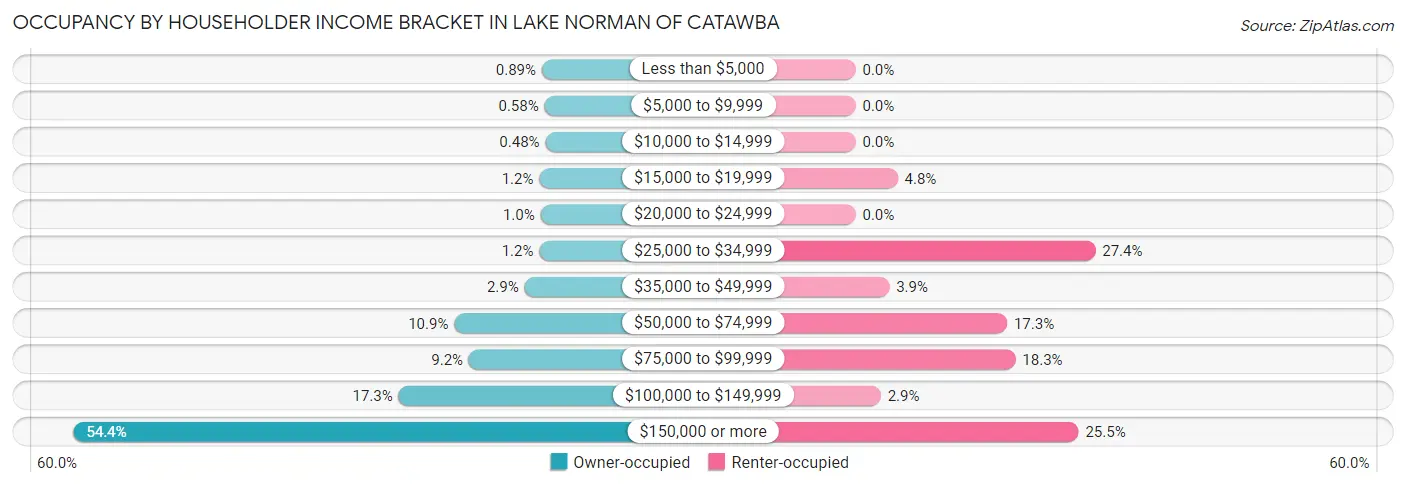
| Income Bracket | Owner-occupied | Renter-occupied |
| Less than $5,000 | 37 (0.9%) | 0 (0.0%) |
| $5,000 to $9,999 | 24 (0.6%) | 0 (0.0%) |
| $10,000 to $14,999 | 20 (0.5%) | 0 (0.0%) |
| $15,000 to $19,999 | 49 (1.2%) | 10 (4.8%) |
| $20,000 to $24,999 | 43 (1.0%) | 0 (0.0%) |
| $25,000 to $34,999 | 49 (1.2%) | 57 (27.4%) |
| $35,000 to $49,999 | 119 (2.9%) | 8 (3.8%) |
| $50,000 to $74,999 | 453 (10.9%) | 36 (17.3%) |
| $75,000 to $99,999 | 383 (9.2%) | 38 (18.3%) |
| $100,000 to $149,999 | 717 (17.3%) | 6 (2.9%) |
| $150,000 or more | 2,261 (54.4%) | 53 (25.5%) |
| Total | 4,155 (100.0%) | 208 (100.0%) |
Monthly Housing Cost Tiers in Lake Norman of Catawba
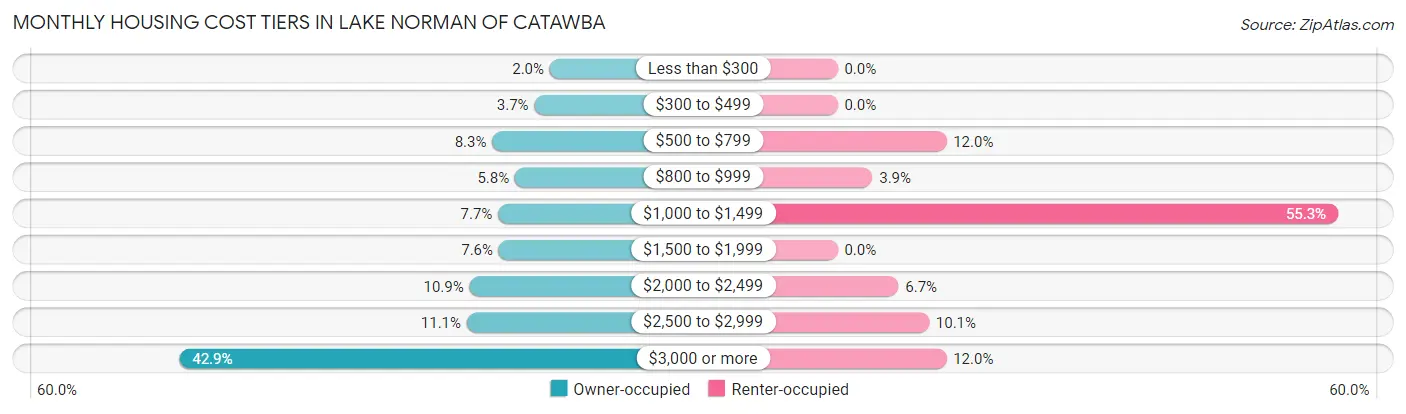
| Monthly Cost | Owner-occupied | Renter-occupied |
| Less than $300 | 82 (2.0%) | 0 (0.0%) |
| $300 to $499 | 153 (3.7%) | 0 (0.0%) |
| $500 to $799 | 346 (8.3%) | 25 (12.0%) |
| $800 to $999 | 242 (5.8%) | 8 (3.8%) |
| $1,000 to $1,499 | 319 (7.7%) | 115 (55.3%) |
| $1,500 to $1,999 | 316 (7.6%) | 0 (0.0%) |
| $2,000 to $2,499 | 451 (10.8%) | 14 (6.7%) |
| $2,500 to $2,999 | 463 (11.1%) | 21 (10.1%) |
| $3,000 or more | 1,783 (42.9%) | 25 (12.0%) |
| Total | 4,155 (100.0%) | 208 (100.0%) |
Physical Housing Characteristics in Lake Norman of Catawba
Housing Structures in Lake Norman of Catawba
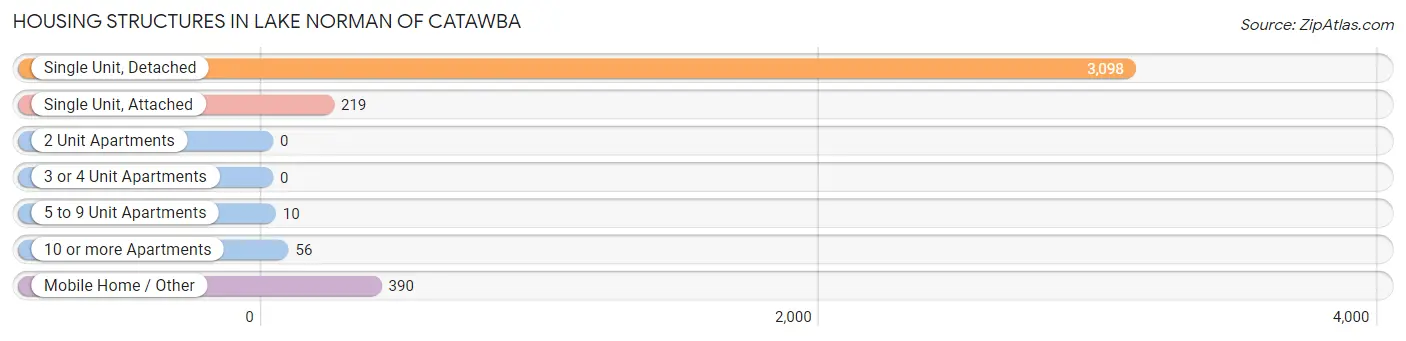
| Structure Type | # Housing Units | % Housing Units |
| Single Unit, Detached | 3,098 | 82.1% |
| Single Unit, Attached | 219 | 5.8% |
| 2 Unit Apartments | 0 | 0.0% |
| 3 or 4 Unit Apartments | 0 | 0.0% |
| 5 to 9 Unit Apartments | 10 | 0.3% |
| 10 or more Apartments | 56 | 1.5% |
| Mobile Home / Other | 390 | 10.3% |
| Total | 3,773 | 100.0% |
Housing Structures by Occupancy in Lake Norman of Catawba
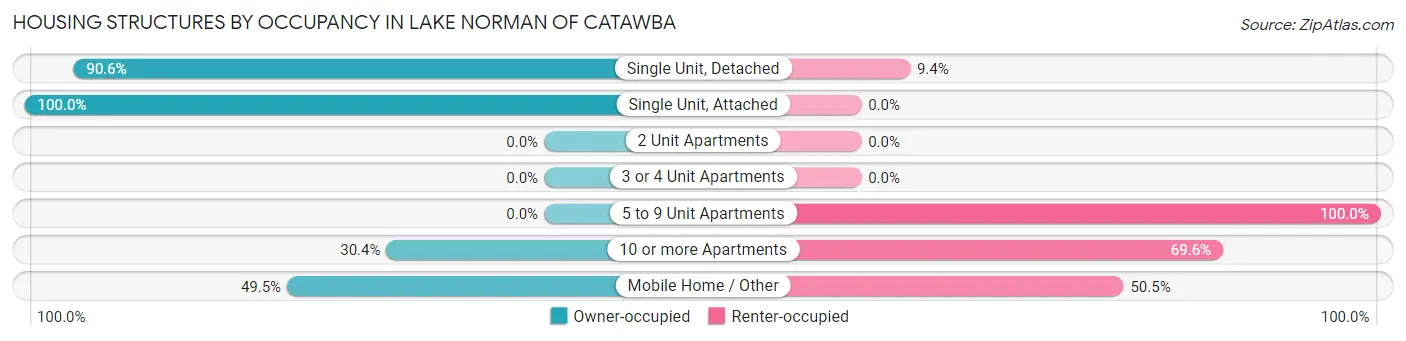
| Structure Type | Owner-occupied | Renter-occupied |
| Single Unit, Detached | 2,807 (90.6%) | 291 (9.4%) |
| Single Unit, Attached | 219 (100.0%) | 0 (0.0%) |
| 2 Unit Apartments | 0 (0.0%) | 0 (0.0%) |
| 3 or 4 Unit Apartments | 0 (0.0%) | 0 (0.0%) |
| 5 to 9 Unit Apartments | 0 (0.0%) | 10 (100.0%) |
| 10 or more Apartments | 17 (30.4%) | 39 (69.6%) |
| Mobile Home / Other | 193 (49.5%) | 197 (50.5%) |
| Total | 3,236 (85.8%) | 537 (14.2%) |
Housing Structures by Number of Rooms in Lake Norman of Catawba
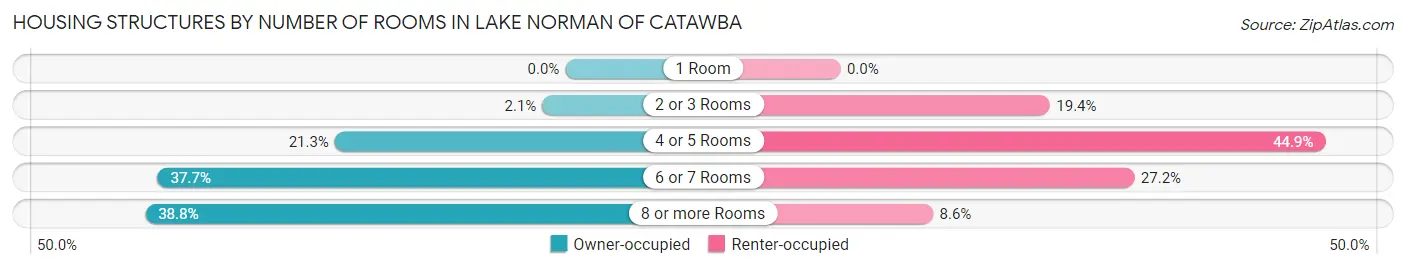
| Number of Rooms | Owner-occupied | Renter-occupied |
| 1 Room | 0 (0.0%) | 0 (0.0%) |
| 2 or 3 Rooms | 69 (2.1%) | 104 (19.4%) |
| 4 or 5 Rooms | 690 (21.3%) | 241 (44.9%) |
| 6 or 7 Rooms | 1,220 (37.7%) | 146 (27.2%) |
| 8 or more Rooms | 1,257 (38.8%) | 46 (8.6%) |
| Total | 3,236 (100.0%) | 537 (100.0%) |
Housing Structure by Heating Type in Lake Norman of Catawba
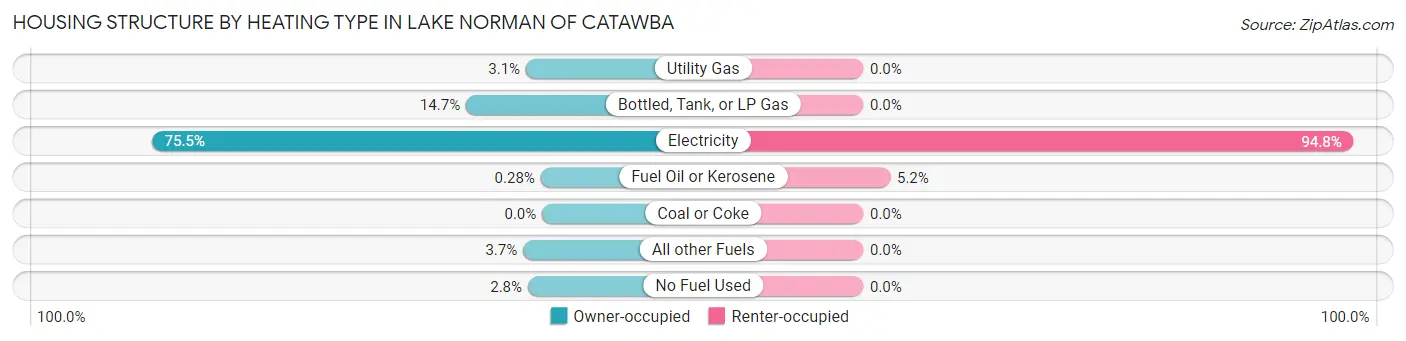
| Heating Type | Owner-occupied | Renter-occupied |
| Utility Gas | 101 (3.1%) | 0 (0.0%) |
| Bottled, Tank, or LP Gas | 476 (14.7%) | 0 (0.0%) |
| Electricity | 2,442 (75.5%) | 509 (94.8%) |
| Fuel Oil or Kerosene | 9 (0.3%) | 28 (5.2%) |
| Coal or Coke | 0 (0.0%) | 0 (0.0%) |
| All other Fuels | 119 (3.7%) | 0 (0.0%) |
| No Fuel Used | 89 (2.8%) | 0 (0.0%) |
| Total | 3,236 (100.0%) | 537 (100.0%) |
Household Vehicle Usage in Lake Norman of Catawba
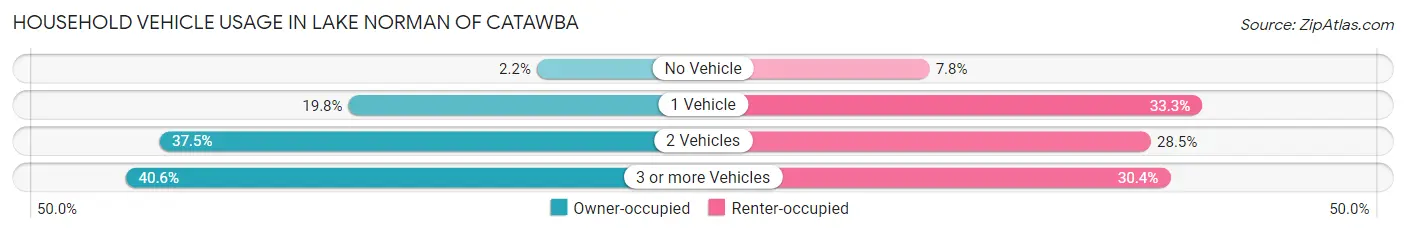
| Vehicles per Household | Owner-occupied | Renter-occupied |
| No Vehicle | 71 (2.2%) | 42 (7.8%) |
| 1 Vehicle | 640 (19.8%) | 179 (33.3%) |
| 2 Vehicles | 1,212 (37.4%) | 153 (28.5%) |
| 3 or more Vehicles | 1,313 (40.6%) | 163 (30.3%) |
| Total | 3,236 (100.0%) | 537 (100.0%) |
Real Estate & Mortgages in Lake Norman of Catawba
Real Estate and Mortgage Overview in Lake Norman of Catawba
| Characteristic | Without Mortgage | With Mortgage |
| Housing Units | 1,482 | 3,143 |
| Median Property Value | $451,800 | $771,700 |
| Median Household Income | $74,231 | $1,875 |
| Monthly Housing Costs | $406 | $1,783 |
| Real Estate Taxes | $1,933 | $91 |
Property Value by Mortgage Status in Lake Norman of Catawba
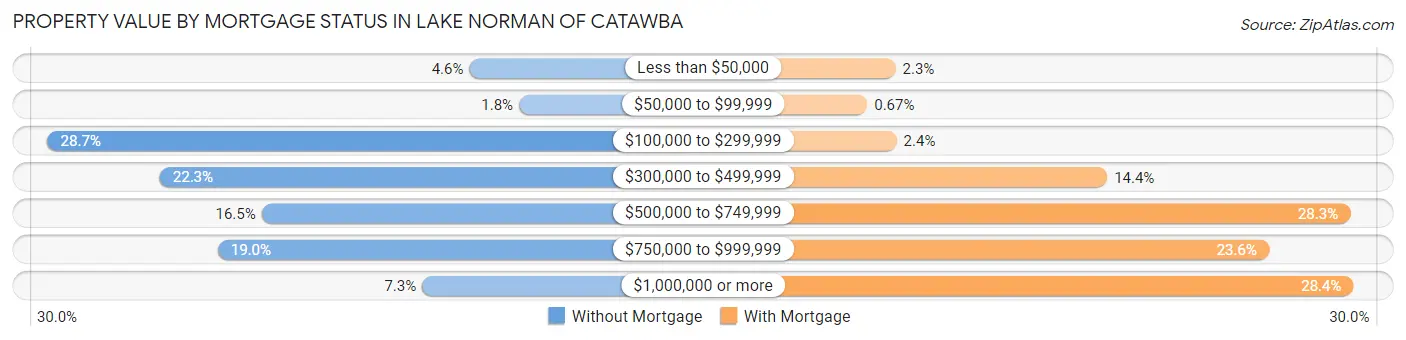
| Property Value | Without Mortgage | With Mortgage |
| Less than $50,000 | 68 (4.6%) | 72 (2.3%) |
| $50,000 to $99,999 | 26 (1.8%) | 21 (0.7%) |
| $100,000 to $299,999 | 425 (28.7%) | 74 (2.4%) |
| $300,000 to $499,999 | 330 (22.3%) | 452 (14.4%) |
| $500,000 to $749,999 | 244 (16.5%) | 888 (28.2%) |
| $750,000 to $999,999 | 281 (19.0%) | 742 (23.6%) |
| $1,000,000 or more | 108 (7.3%) | 894 (28.4%) |
| Total | 1,482 (100.0%) | 3,143 (100.0%) |
Household Income by Mortgage Status in Lake Norman of Catawba
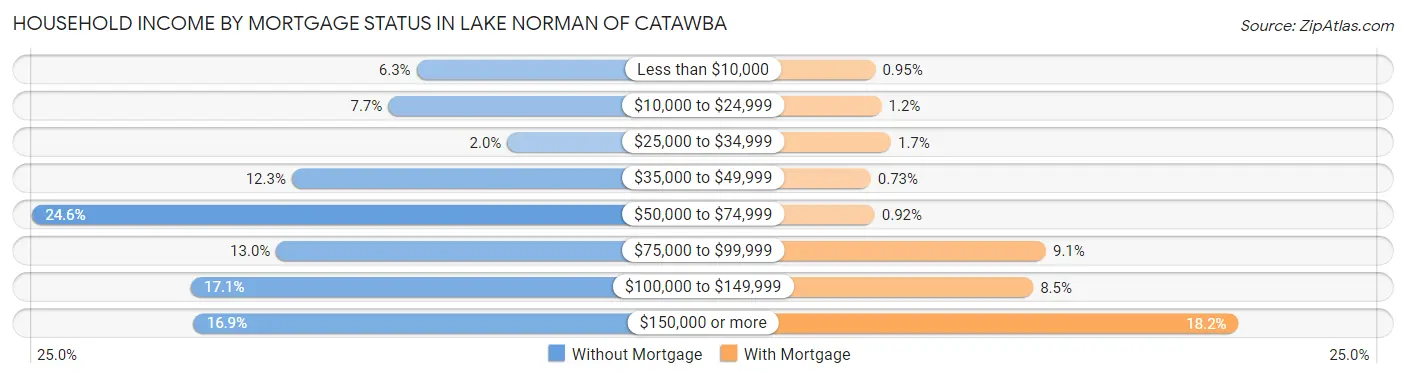
| Household Income | Without Mortgage | With Mortgage |
| Less than $10,000 | 94 (6.3%) | 30 (0.9%) |
| $10,000 to $24,999 | 114 (7.7%) | 39 (1.2%) |
| $25,000 to $34,999 | 30 (2.0%) | 53 (1.7%) |
| $35,000 to $49,999 | 182 (12.3%) | 23 (0.7%) |
| $50,000 to $74,999 | 365 (24.6%) | 29 (0.9%) |
| $75,000 to $99,999 | 193 (13.0%) | 285 (9.1%) |
| $100,000 to $149,999 | 253 (17.1%) | 266 (8.5%) |
| $150,000 or more | 251 (16.9%) | 573 (18.2%) |
| Total | 1,482 (100.0%) | 3,143 (100.0%) |
Property Value to Household Income Ratio in Lake Norman of Catawba
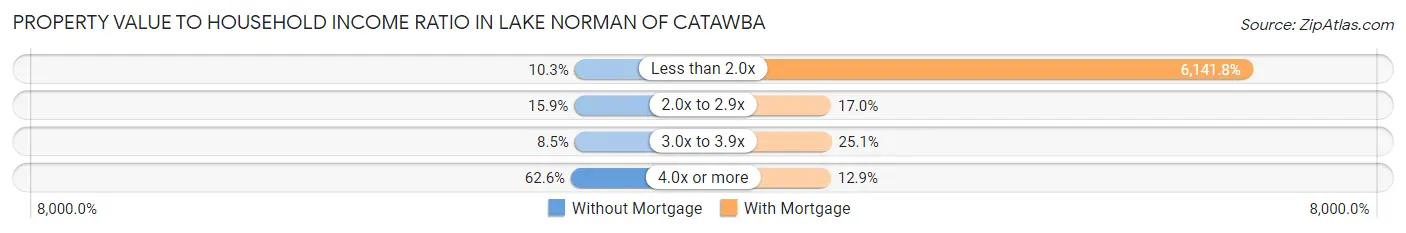
| Value-to-Income Ratio | Without Mortgage | With Mortgage |
| Less than 2.0x | 153 (10.3%) | 193,036 (6,141.8%) |
| 2.0x to 2.9x | 235 (15.9%) | 534 (17.0%) |
| 3.0x to 3.9x | 126 (8.5%) | 789 (25.1%) |
| 4.0x or more | 927 (62.5%) | 406 (12.9%) |
| Total | 1,482 (100.0%) | 3,143 (100.0%) |
Real Estate Taxes by Mortgage Status in Lake Norman of Catawba
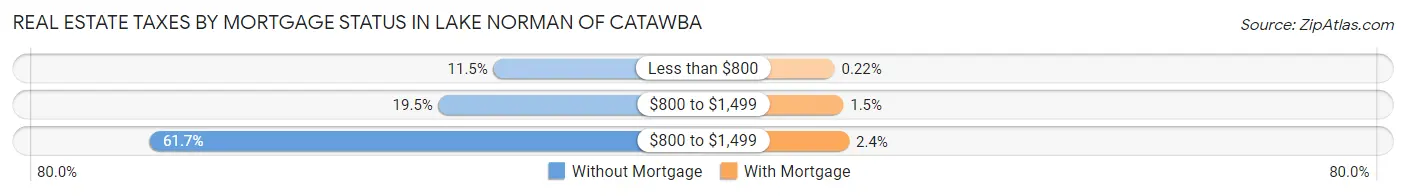
| Property Taxes | Without Mortgage | With Mortgage |
| Less than $800 | 170 (11.5%) | 7 (0.2%) |
| $800 to $1,499 | 289 (19.5%) | 47 (1.5%) |
| $800 to $1,499 | 914 (61.7%) | 74 (2.4%) |
| Total | 1,482 (100.0%) | 3,143 (100.0%) |
Health & Disability in Lake Norman of Catawba
Health Insurance Coverage by Age in Lake Norman of Catawba
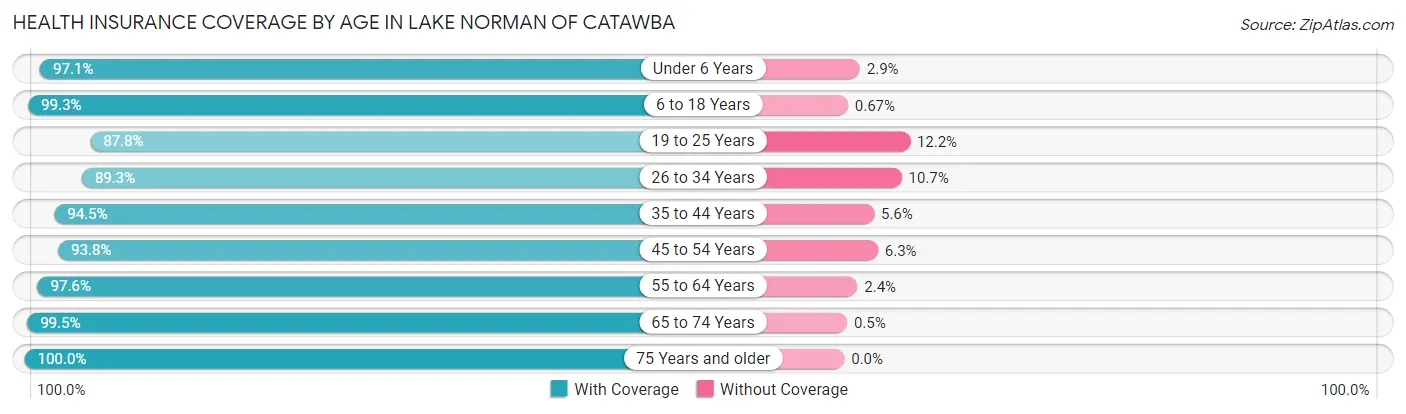
| Age Bracket | With Coverage | Without Coverage |
| Under 6 Years | 603 (97.1%) | 18 (2.9%) |
| 6 to 18 Years | 2,517 (99.3%) | 17 (0.7%) |
| 19 to 25 Years | 631 (87.8%) | 88 (12.2%) |
| 26 to 34 Years | 452 (89.3%) | 54 (10.7%) |
| 35 to 44 Years | 1,089 (94.5%) | 64 (5.6%) |
| 45 to 54 Years | 2,368 (93.8%) | 158 (6.2%) |
| 55 to 64 Years | 2,087 (97.6%) | 52 (2.4%) |
| 65 to 74 Years | 1,397 (99.5%) | 7 (0.5%) |
| 75 Years and older | 924 (100.0%) | 0 (0.0%) |
| Total | 12,068 (96.3%) | 458 (3.7%) |
Health Insurance Coverage by Citizenship Status in Lake Norman of Catawba
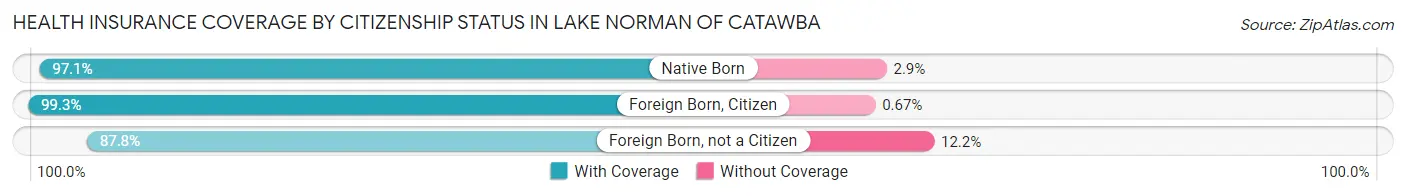
| Citizenship Status | With Coverage | Without Coverage |
| Native Born | 603 (97.1%) | 18 (2.9%) |
| Foreign Born, Citizen | 2,517 (99.3%) | 17 (0.7%) |
| Foreign Born, not a Citizen | 631 (87.8%) | 88 (12.2%) |
Health Insurance Coverage by Household Income in Lake Norman of Catawba
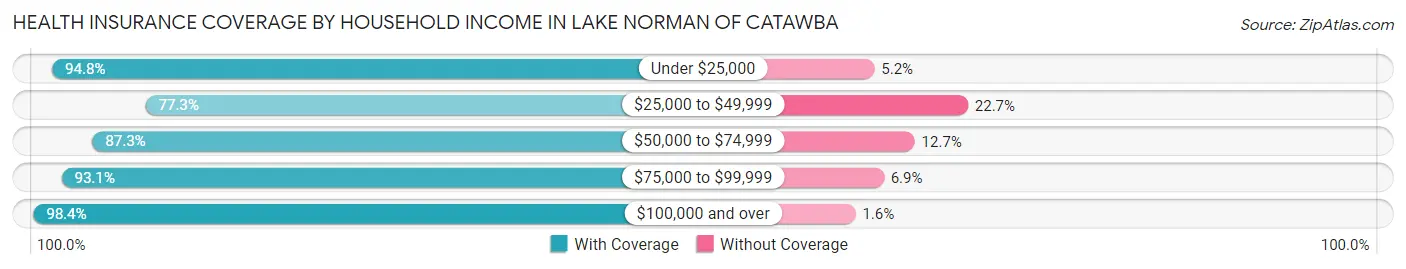
| Household Income | With Coverage | Without Coverage |
| Under $25,000 | 330 (94.8%) | 18 (5.2%) |
| $25,000 to $49,999 | 283 (77.3%) | 83 (22.7%) |
| $50,000 to $74,999 | 865 (87.3%) | 126 (12.7%) |
| $75,000 to $99,999 | 955 (93.1%) | 71 (6.9%) |
| $100,000 and over | 9,635 (98.4%) | 160 (1.6%) |
Public vs Private Health Insurance Coverage by Age in Lake Norman of Catawba
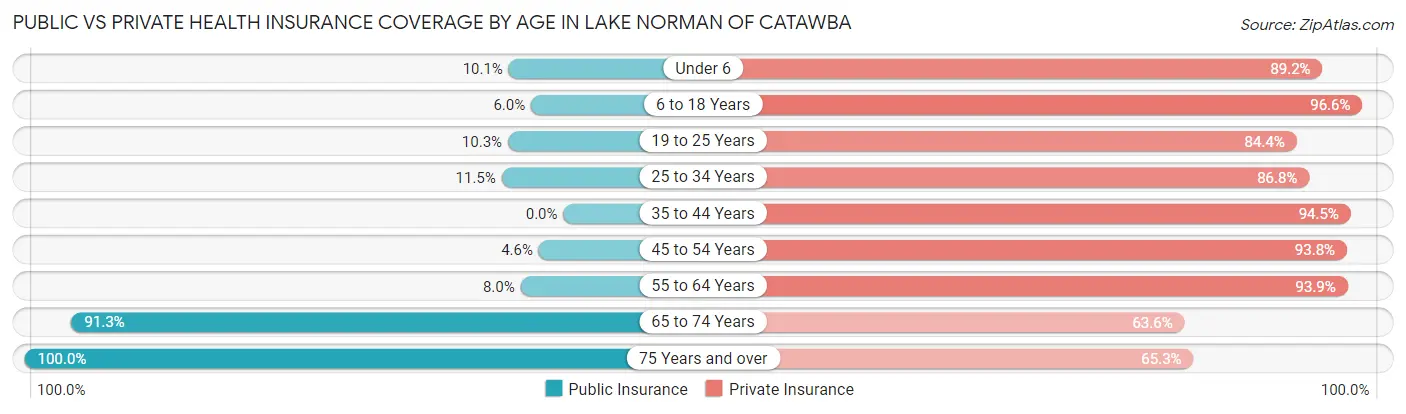
| Age Bracket | Public Insurance | Private Insurance |
| Under 6 | 63 (10.1%) | 554 (89.2%) |
| 6 to 18 Years | 152 (6.0%) | 2,448 (96.6%) |
| 19 to 25 Years | 74 (10.3%) | 607 (84.4%) |
| 25 to 34 Years | 58 (11.5%) | 439 (86.8%) |
| 35 to 44 Years | 0 (0.0%) | 1,089 (94.5%) |
| 45 to 54 Years | 115 (4.5%) | 2,368 (93.8%) |
| 55 to 64 Years | 170 (8.0%) | 2,008 (93.9%) |
| 65 to 74 Years | 1,282 (91.3%) | 893 (63.6%) |
| 75 Years and over | 924 (100.0%) | 603 (65.3%) |
| Total | 2,838 (22.7%) | 11,009 (87.9%) |
Disability Status by Sex by Age in Lake Norman of Catawba
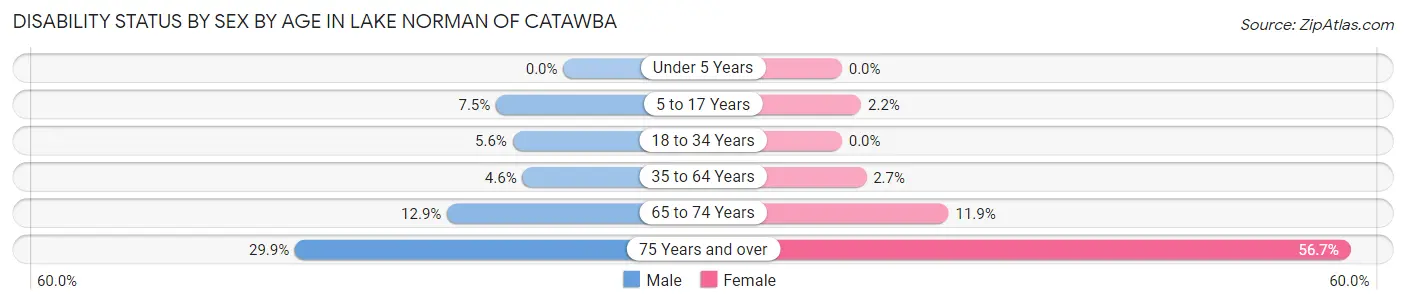
| Age Bracket | Male | Female |
| Under 5 Years | 0 (0.0%) | 0 (0.0%) |
| 5 to 17 Years | 92 (7.5%) | 27 (2.1%) |
| 18 to 34 Years | 43 (5.6%) | 0 (0.0%) |
| 35 to 64 Years | 136 (4.5%) | 77 (2.7%) |
| 65 to 74 Years | 99 (12.9%) | 76 (11.9%) |
| 75 Years and over | 101 (29.9%) | 332 (56.7%) |
Disability Class by Sex by Age in Lake Norman of Catawba
Disability Class: Hearing Difficulty
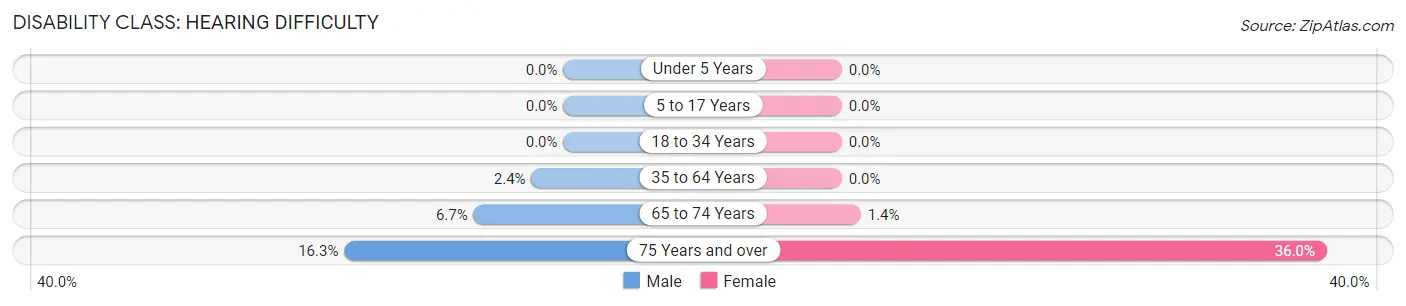
| Age Bracket | Male | Female |
| Under 5 Years | 0 (0.0%) | 0 (0.0%) |
| 5 to 17 Years | 0 (0.0%) | 0 (0.0%) |
| 18 to 34 Years | 0 (0.0%) | 0 (0.0%) |
| 35 to 64 Years | 71 (2.4%) | 0 (0.0%) |
| 65 to 74 Years | 51 (6.7%) | 9 (1.4%) |
| 75 Years and over | 55 (16.3%) | 211 (36.0%) |
Disability Class: Vision Difficulty
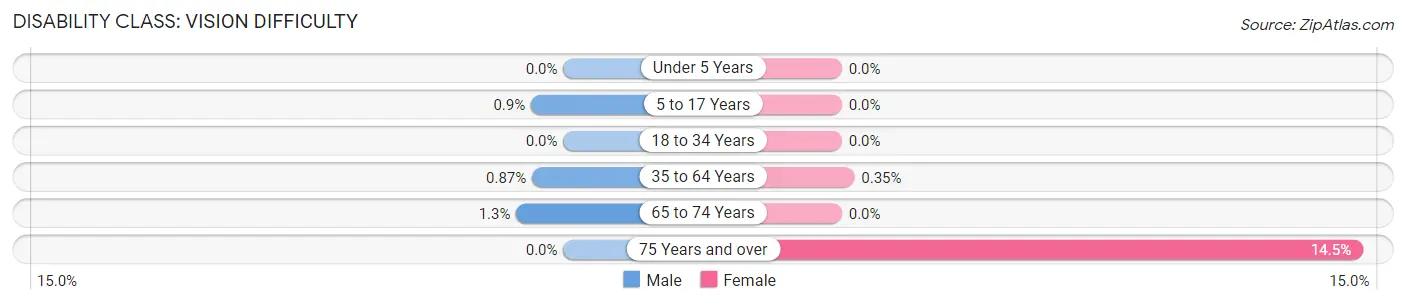
| Age Bracket | Male | Female |
| Under 5 Years | 0 (0.0%) | 0 (0.0%) |
| 5 to 17 Years | 11 (0.9%) | 0 (0.0%) |
| 18 to 34 Years | 0 (0.0%) | 0 (0.0%) |
| 35 to 64 Years | 26 (0.9%) | 10 (0.4%) |
| 65 to 74 Years | 10 (1.3%) | 0 (0.0%) |
| 75 Years and over | 0 (0.0%) | 85 (14.5%) |
Disability Class: Cognitive Difficulty
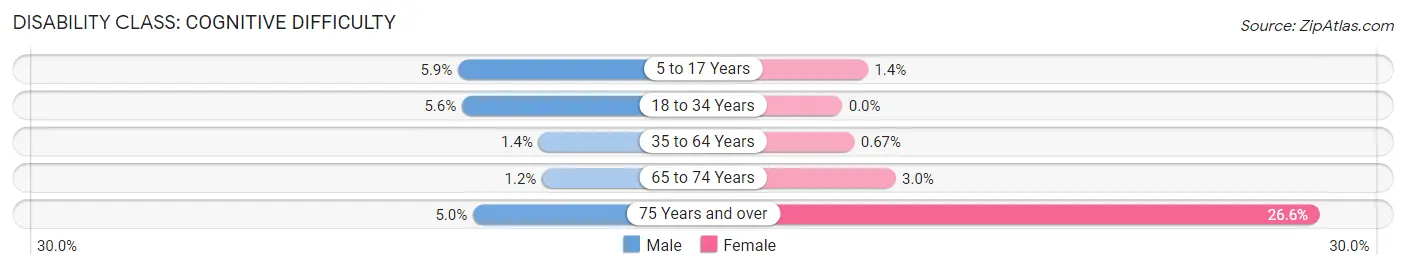
| Age Bracket | Male | Female |
| 5 to 17 Years | 72 (5.9%) | 18 (1.4%) |
| 18 to 34 Years | 43 (5.6%) | 0 (0.0%) |
| 35 to 64 Years | 41 (1.4%) | 19 (0.7%) |
| 65 to 74 Years | 9 (1.2%) | 19 (3.0%) |
| 75 Years and over | 17 (5.0%) | 156 (26.6%) |
Disability Class: Ambulatory Difficulty
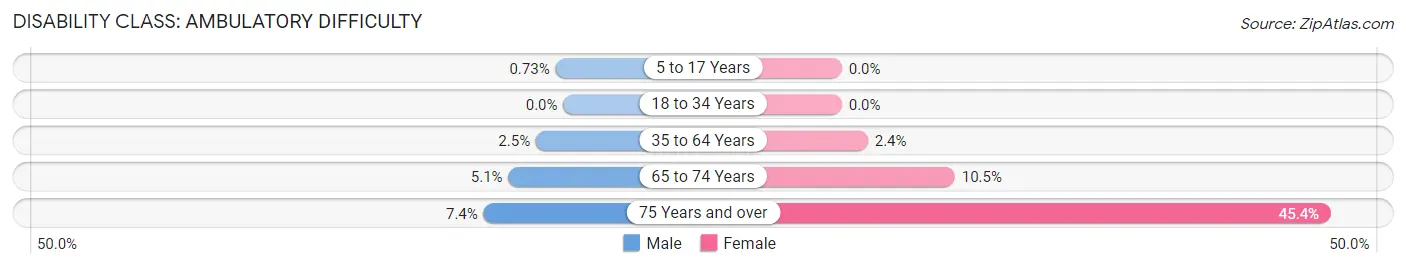
| Age Bracket | Male | Female |
| 5 to 17 Years | 9 (0.7%) | 0 (0.0%) |
| 18 to 34 Years | 0 (0.0%) | 0 (0.0%) |
| 35 to 64 Years | 76 (2.5%) | 68 (2.4%) |
| 65 to 74 Years | 39 (5.1%) | 67 (10.5%) |
| 75 Years and over | 25 (7.4%) | 266 (45.4%) |
Disability Class: Self-Care Difficulty
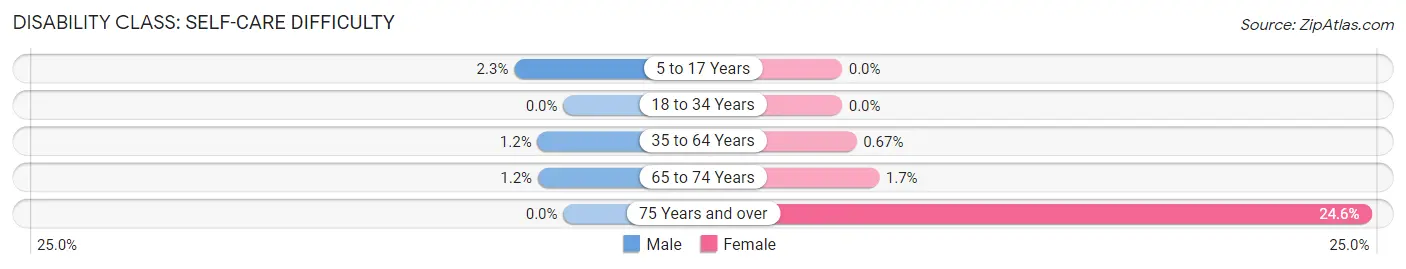
| Age Bracket | Male | Female |
| 5 to 17 Years | 28 (2.3%) | 0 (0.0%) |
| 18 to 34 Years | 0 (0.0%) | 0 (0.0%) |
| 35 to 64 Years | 36 (1.2%) | 19 (0.7%) |
| 65 to 74 Years | 9 (1.2%) | 11 (1.7%) |
| 75 Years and over | 0 (0.0%) | 144 (24.6%) |
Technology Access in Lake Norman of Catawba
Computing Device Access in Lake Norman of Catawba
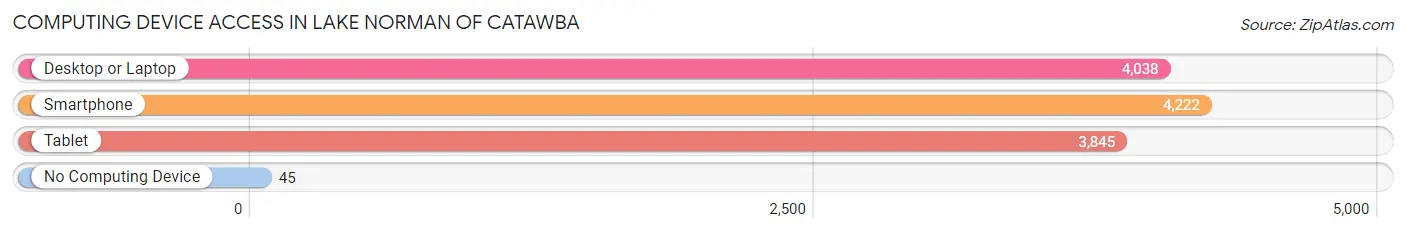
| Device Type | # Households | % Households |
| Desktop or Laptop | 4,038 | 92.5% |
| Smartphone | 4,222 | 96.8% |
| Tablet | 3,845 | 88.1% |
| No Computing Device | 45 | 1.0% |
| Total | 4,363 | 100.0% |
Internet Access in Lake Norman of Catawba
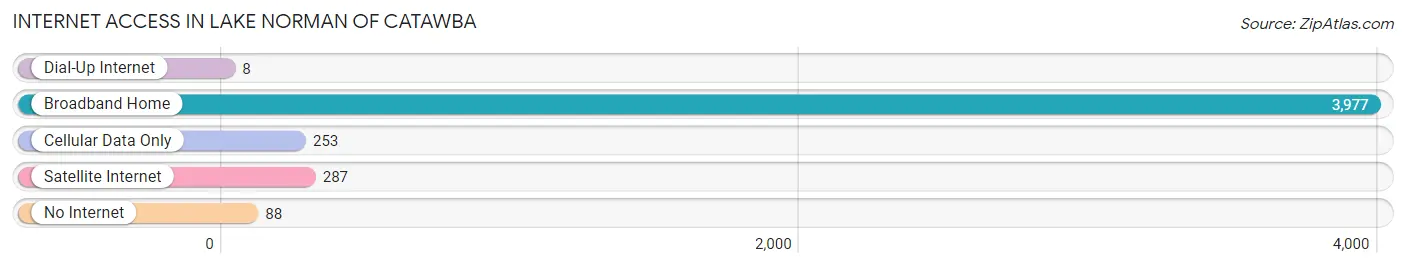
| Internet Type | # Households | % Households |
| Dial-Up Internet | 8 | 0.2% |
| Broadband Home | 3,977 | 91.1% |
| Cellular Data Only | 253 | 5.8% |
| Satellite Internet | 287 | 6.6% |
| No Internet | 88 | 2.0% |
| Total | 4,363 | 100.0% |
Lake Norman of Catawba Summary
History
Lake Norman of Catawba, NC is a man-made lake located in the Catawba River Basin in North Carolina. It was created in 1963 by Duke Energy, formerly known as Duke Power, when they built the Cowans Ford Dam on the Catawba River. The lake was named after former Duke Power president Norman Cocke. The lake is the largest man-made lake in North Carolina and is the centerpiece of the Lake Norman State Park.
The area around Lake Norman has a long history of human habitation. The Catawba Indians were the first known inhabitants of the area, and they lived in the area for centuries before the arrival of European settlers. The Catawba were a powerful tribe that controlled much of the area around the lake. They were known for their pottery and their skill in fishing and hunting.
The first European settlers arrived in the area in the late 1700s. They were mostly farmers and traders who were attracted to the area by its fertile soil and abundant natural resources. The area around the lake was also attractive to the settlers because of its proximity to the Catawba River, which provided a convenient transportation route.
The area around Lake Norman began to develop in the late 1800s when the Charlotte and South Carolina Railroad was built through the area. This allowed for the development of towns and cities in the area, such as Mooresville, Davidson, and Cornelius. The railroad also allowed for the development of industries in the area, such as textile mills and furniture factories.
The area around Lake Norman continued to grow in the early 1900s. The lake was used for recreational activities such as fishing and boating, and the area around the lake became a popular vacation destination. The lake was also used for hydroelectric power, and Duke Energy built the Cowans Ford Dam in 1963 to generate electricity.
Geography
Lake Norman of Catawba, NC is located in the Catawba River Basin in North Carolina. The lake is the largest man-made lake in the state and is the centerpiece of the Lake Norman State Park. The lake is 32 miles long and covers an area of over 520 square miles. The lake has a maximum depth of over 100 feet and is fed by the Catawba River.
The lake is surrounded by the towns of Mooresville, Davidson, Cornelius, and Huntersville. The lake is also close to the cities of Charlotte and Hickory. The lake is bordered by the towns of Denver, Sherrills Ford, and Terrell.
The lake is a popular destination for recreational activities such as fishing, boating, swimming, and camping. The lake is also home to several marinas and boat launches. The lake is also popular for its scenic views and is a popular destination for photographers.
Economy
The economy of Lake Norman of Catawba, NC is largely driven by tourism and recreation. The lake is a popular destination for recreational activities such as fishing, boating, swimming, and camping. The lake is also home to several marinas and boat launches. The lake is also popular for its scenic views and is a popular destination for photographers.
The area around the lake is also home to several businesses and industries. The towns of Mooresville, Davidson, Cornelius, and Huntersville are home to a variety of businesses, including retail stores, restaurants, and hotels. The area is also home to several manufacturing companies, such as furniture factories and textile mills.
The area around the lake is also home to several educational institutions, including Davidson College, the University of North Carolina at Charlotte, and Central Piedmont Community College. The area is also home to several medical facilities, including Lake Norman Regional Medical Center and Novant Health Huntersville Medical Center.
Demographics
As of the 2010 census, the population of Lake Norman of Catawba, NC was approximately 5,000. The population is largely white (90.3%) and the median age is 44. The median household income is $68,000 and the median home value is $250,000.
The area around the lake is home to a variety of religious denominations, including Baptist, Methodist, Presbyterian, and Catholic. The area is also home to a variety of ethnicities, including African American (4.3%), Hispanic (2.2%), and Asian (1.2%).
Conclusion
Lake Norman of Catawba, NC is a man-made lake located in the Catawba River Basin in North Carolina. The lake was created in 1963 by Duke Energy and is the largest man-made lake in the state. The lake is a popular destination for recreational activities such as fishing, boating, swimming, and camping. The area around the lake is also home to several businesses and industries, as well as educational institutions and medical facilities. The population of the area is largely white and the median age is 44. The median household income is $68,000 and the median home value is $250,000.
Common Questions
What is Per Capita Income in Lake Norman of Catawba?
Per Capita income in Lake Norman of Catawba is $84,167.
What is the Median Family Income in Lake Norman of Catawba?
Median Family Income in Lake Norman of Catawba is $192,302.
What is the Median Household income in Lake Norman of Catawba?
Median Household Income in Lake Norman of Catawba is $171,583.
What is Income or Wage Gap in Lake Norman of Catawba?
Income or Wage Gap in Lake Norman of Catawba is 27.3%.
Women in Lake Norman of Catawba earn 72.7 cents for every dollar earned by a man.
What is Family Income Deficit in Lake Norman of Catawba?
Family Income Deficit in Lake Norman of Catawba is $9,124.
Families that are below poverty line in Lake Norman of Catawba earn $9,124 less on average than the poverty threshold level.
What is Inequality or Gini Index in Lake Norman of Catawba?
Inequality or Gini Index in Lake Norman of Catawba is 0.47.
What is the Total Population of Lake Norman of Catawba?
Total Population of Lake Norman of Catawba is 12,526.
What is the Total Male Population of Lake Norman of Catawba?
Total Male Population of Lake Norman of Catawba is 6,385.
What is the Total Female Population of Lake Norman of Catawba?
Total Female Population of Lake Norman of Catawba is 6,141.
What is the Ratio of Males per 100 Females in Lake Norman of Catawba?
There are 103.97 Males per 100 Females in Lake Norman of Catawba.
What is the Ratio of Females per 100 Males in Lake Norman of Catawba?
There are 96.18 Females per 100 Males in Lake Norman of Catawba.
What is the Median Population Age in Lake Norman of Catawba?
Median Population Age in Lake Norman of Catawba is 47.7 Years.
What is the Average Family Size in Lake Norman of Catawba
Average Family Size in Lake Norman of Catawba is 3.1 People.
What is the Average Household Size in Lake Norman of Catawba
Average Household Size in Lake Norman of Catawba is 2.9 People.
How Large is the Labor Force in Lake Norman of Catawba?
There are 6,040 People in the Labor Forcein in Lake Norman of Catawba.
What is the Percentage of People in the Labor Force in Lake Norman of Catawba?
60.6% of People are in the Labor Force in Lake Norman of Catawba.
What is the Unemployment Rate in Lake Norman of Catawba?
Unemployment Rate in Lake Norman of Catawba is 2.0%.