Leland, NC Map & Demographics
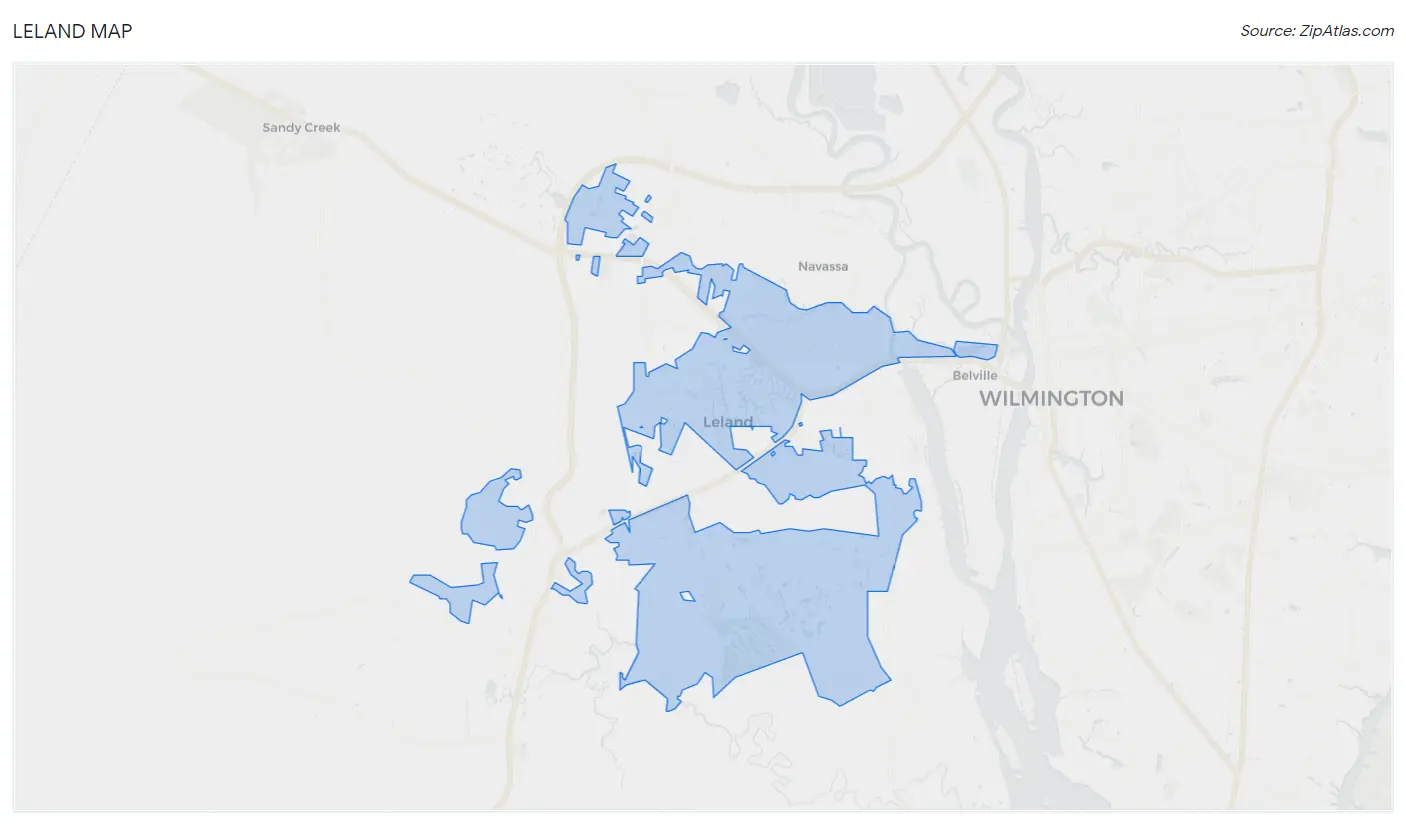
Leland Map
Leland Overview
$44,407
PER CAPITA INCOME
$97,806
AVG FAMILY INCOME
$82,651
AVG HOUSEHOLD INCOME
16.9%
WAGE / INCOME GAP [ % ]
83.1¢/ $1
WAGE / INCOME GAP [ $ ]
$8,505
FAMILY INCOME DEFICIT
0.38
INEQUALITY / GINI INDEX
24,473
TOTAL POPULATION
12,090
MALE POPULATION
12,383
FEMALE POPULATION
97.63
MALES / 100 FEMALES
102.42
FEMALES / 100 MALES
47.1
MEDIAN AGE
2.8
AVG FAMILY SIZE
2.4
AVG HOUSEHOLD SIZE
11,410
LABOR FORCE [ PEOPLE ]
54.8%
PERCENT IN LABOR FORCE
3.8%
UNEMPLOYMENT RATE
Leland Zip Codes
Leland Area Codes
Income in Leland
Income Overview in Leland
Per Capita Income in Leland is $44,407, while median incomes of families and households are $97,806 and $82,651 respectively.
| Characteristic | Number | Measure |
| Per Capita Income | 24,473 | $44,407 |
| Median Family Income | 7,144 | $97,806 |
| Mean Family Income | 7,144 | $115,823 |
| Median Household Income | 10,423 | $82,651 |
| Mean Household Income | 10,423 | $101,278 |
| Income Deficit | 7,144 | $8,505 |
| Wage / Income Gap (%) | 24,473 | 16.89% |
| Wage / Income Gap ($) | 24,473 | 83.11¢ per $1 |
| Gini / Inequality Index | 24,473 | 0.38 |
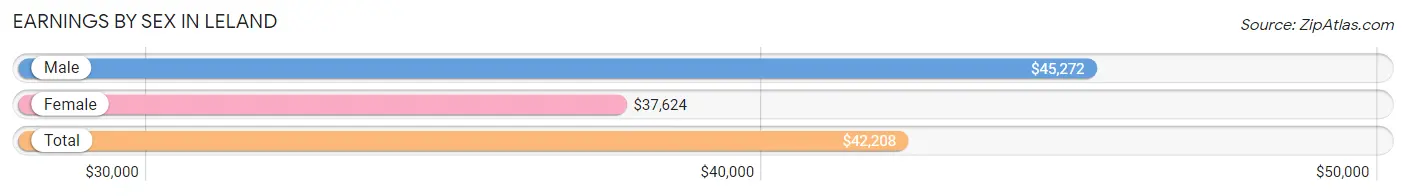
Earnings by Sex in Leland
Average Earnings in Leland are $42,208, $45,272 for men and $37,624 for women, a difference of 16.9%.
| Sex | Number | Average Earnings |
| Male | 6,014 (49.5%) | $45,272 |
| Female | 6,126 (50.5%) | $37,624 |
| Total | 12,140 (100.0%) | $42,208 |
Earnings by Sex by Income Bracket in Leland
The most common earnings brackets in Leland are $100,000+ for men (682 | 11.3%) and $55,000 to $64,999 for women (583 | 9.5%).
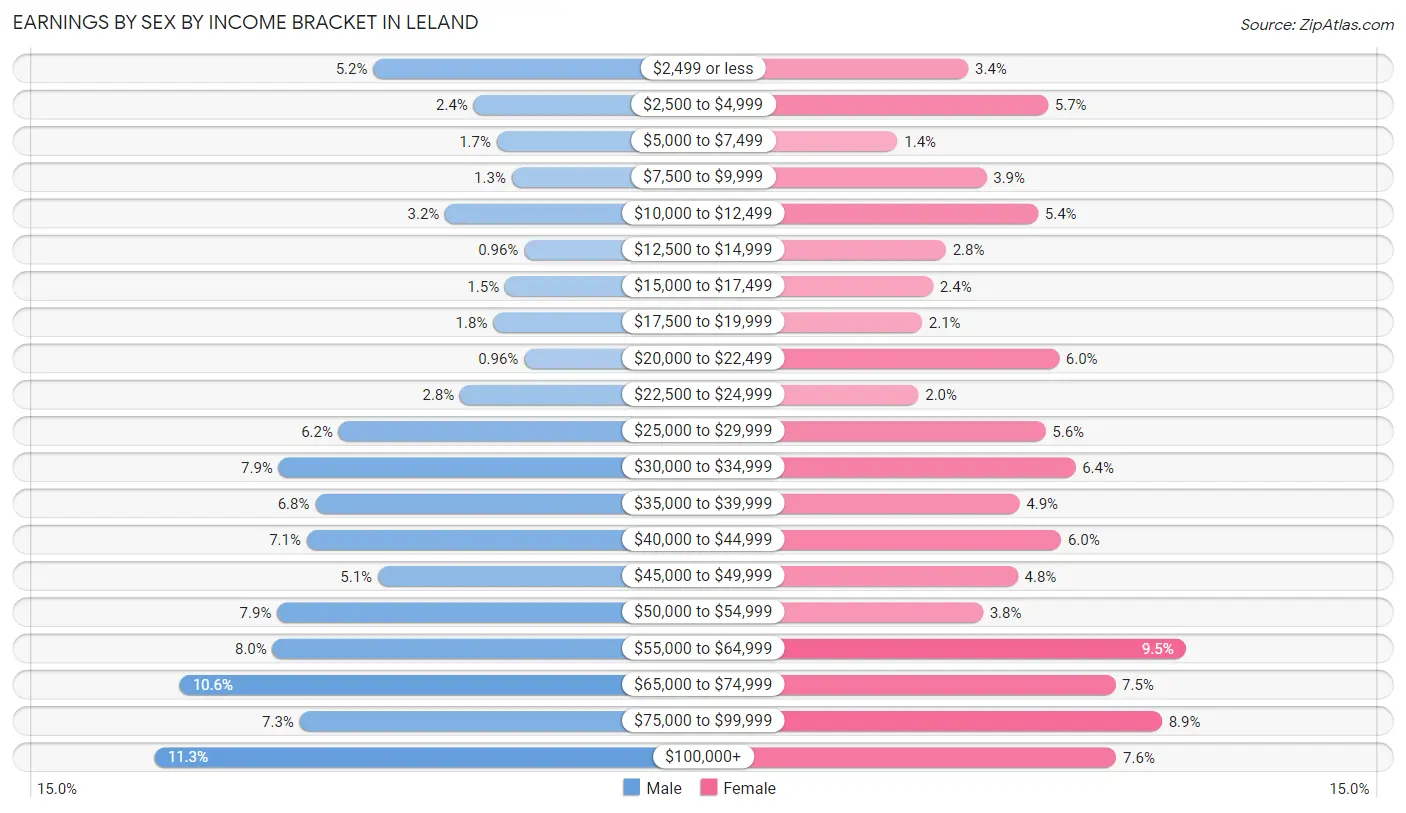
| Income | Male | Female |
| $2,499 or less | 313 (5.2%) | 209 (3.4%) |
| $2,500 to $4,999 | 143 (2.4%) | 346 (5.7%) |
| $5,000 to $7,499 | 104 (1.7%) | 87 (1.4%) |
| $7,500 to $9,999 | 79 (1.3%) | 240 (3.9%) |
| $10,000 to $12,499 | 191 (3.2%) | 329 (5.4%) |
| $12,500 to $14,999 | 58 (1.0%) | 170 (2.8%) |
| $15,000 to $17,499 | 90 (1.5%) | 148 (2.4%) |
| $17,500 to $19,999 | 110 (1.8%) | 129 (2.1%) |
| $20,000 to $22,499 | 58 (1.0%) | 365 (6.0%) |
| $22,500 to $24,999 | 166 (2.8%) | 123 (2.0%) |
| $25,000 to $29,999 | 371 (6.2%) | 342 (5.6%) |
| $30,000 to $34,999 | 473 (7.9%) | 393 (6.4%) |
| $35,000 to $39,999 | 411 (6.8%) | 297 (4.9%) |
| $40,000 to $44,999 | 425 (7.1%) | 369 (6.0%) |
| $45,000 to $49,999 | 305 (5.1%) | 294 (4.8%) |
| $50,000 to $54,999 | 475 (7.9%) | 234 (3.8%) |
| $55,000 to $64,999 | 483 (8.0%) | 583 (9.5%) |
| $65,000 to $74,999 | 640 (10.6%) | 462 (7.5%) |
| $75,000 to $99,999 | 437 (7.3%) | 542 (8.8%) |
| $100,000+ | 682 (11.3%) | 464 (7.6%) |
| Total | 6,014 (100.0%) | 6,126 (100.0%) |
Earnings by Sex by Educational Attainment in Leland
Average earnings in Leland are $50,237 for men and $43,249 for women, a difference of 13.9%. Men with an educational attainment of graduate degree enjoy the highest average annual earnings of $58,266, while those with high school diploma education earn the least with $44,028. Women with an educational attainment of graduate degree earn the most with the average annual earnings of $81,433, while those with high school diploma education have the smallest earnings of $35,443.
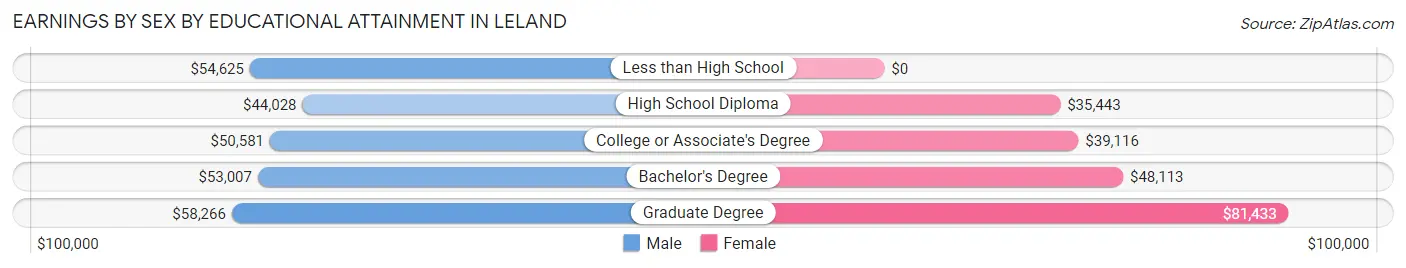
| Educational Attainment | Male Income | Female Income |
| Less than High School | $54,625 | $0 |
| High School Diploma | $44,028 | $35,443 |
| College or Associate's Degree | $50,581 | $39,116 |
| Bachelor's Degree | $53,007 | $48,113 |
| Graduate Degree | $58,266 | $81,433 |
| Total | $50,237 | $43,249 |
Family Income in Leland
Family Income Brackets in Leland
According to the Leland family income data, there are 1,907 families falling into the $100,000 to $149,999 income range, which is the most common income bracket and makes up 26.7% of all families. Conversely, the less than $10,000 income bracket is the least frequent group with only 64 families (0.9%) belonging to this category.
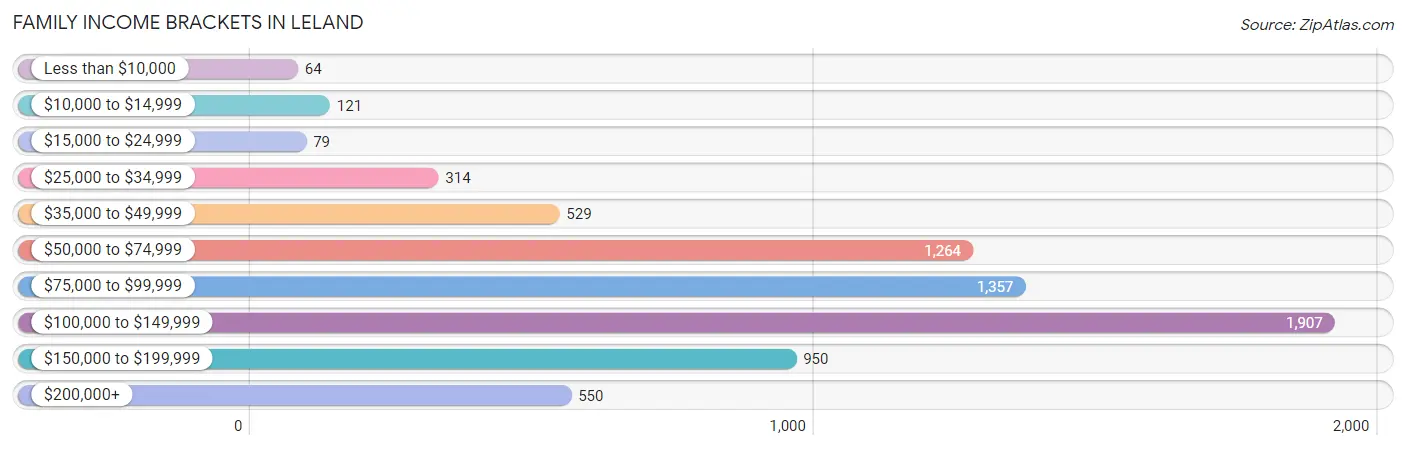
| Income Bracket | # Families | % Families |
| Less than $10,000 | 64 | 0.9% |
| $10,000 to $14,999 | 121 | 1.7% |
| $15,000 to $24,999 | 79 | 1.1% |
| $25,000 to $34,999 | 314 | 4.4% |
| $35,000 to $49,999 | 529 | 7.4% |
| $50,000 to $74,999 | 1,264 | 17.7% |
| $75,000 to $99,999 | 1,357 | 19.0% |
| $100,000 to $149,999 | 1,907 | 26.7% |
| $150,000 to $199,999 | 950 | 13.3% |
| $200,000+ | 550 | 7.7% |
Family Income by Famaliy Size in Leland
6-person families (265 | 3.7%) account for the highest median family income in Leland with $174,308 per family, while 2-person families (4,454 | 62.4%) have the highest median income of $45,059 per family member.
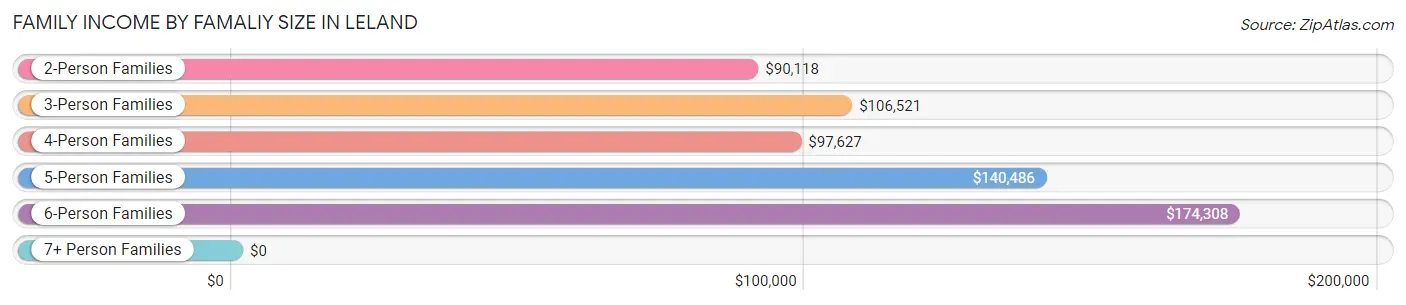
| Income Bracket | # Families | Median Income |
| 2-Person Families | 4,454 (62.4%) | $90,118 |
| 3-Person Families | 1,209 (16.9%) | $106,521 |
| 4-Person Families | 845 (11.8%) | $97,627 |
| 5-Person Families | 339 (4.8%) | $140,486 |
| 6-Person Families | 265 (3.7%) | $174,308 |
| 7+ Person Families | 32 (0.4%) | $0 |
| Total | 7,144 (100.0%) | $97,806 |
Family Income by Number of Earners in Leland
The median family income in Leland is $97,806, with families comprising 3+ earners (531) having the highest median family income of $149,732, while families with 1 earner (1,951) have the lowest median family income of $73,862, accounting for 7.4% and 27.3% of families, respectively.
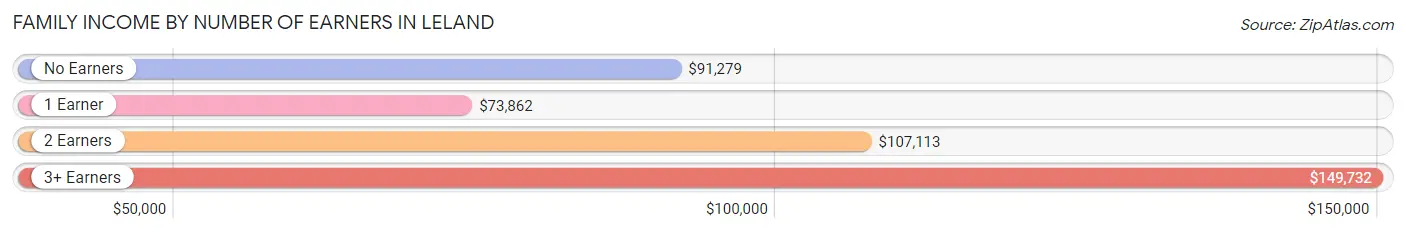
| Number of Earners | # Families | Median Income |
| No Earners | 2,131 (29.8%) | $91,279 |
| 1 Earner | 1,951 (27.3%) | $73,862 |
| 2 Earners | 2,531 (35.4%) | $107,113 |
| 3+ Earners | 531 (7.4%) | $149,732 |
| Total | 7,144 (100.0%) | $97,806 |
Household Income in Leland
Household Income Brackets in Leland
With 2,439 households falling in the category, the $50,000 to $74,999 income range is the most frequent in Leland, accounting for 23.4% of all households. In contrast, only 135 households (1.3%) fall into the $10,000 to $14,999 income bracket, making it the least populous group.
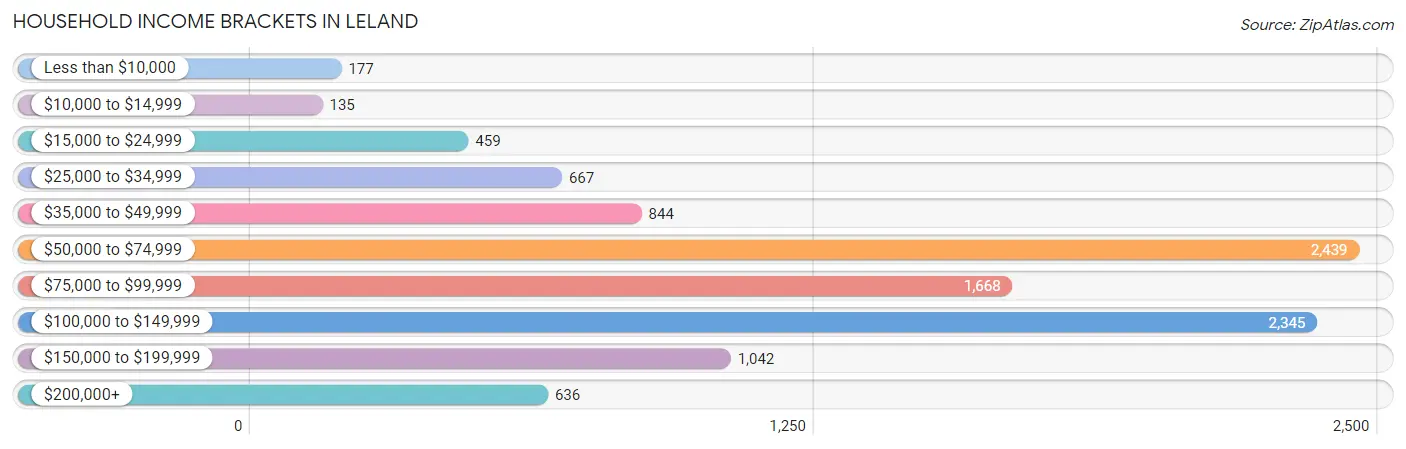
| Income Bracket | # Households | % Households |
| Less than $10,000 | 177 | 1.7% |
| $10,000 to $14,999 | 135 | 1.3% |
| $15,000 to $24,999 | 459 | 4.4% |
| $25,000 to $34,999 | 667 | 6.4% |
| $35,000 to $49,999 | 844 | 8.1% |
| $50,000 to $74,999 | 2,439 | 23.4% |
| $75,000 to $99,999 | 1,668 | 16.0% |
| $100,000 to $149,999 | 2,345 | 22.5% |
| $150,000 to $199,999 | 1,042 | 10.0% |
| $200,000+ | 636 | 6.1% |
Household Income by Householder Age in Leland
The median household income in Leland is $82,651, with the highest median household income of $91,375 found in the 45 to 64 years age bracket for the primary householder. A total of 3,529 households (33.9%) fall into this category. Meanwhile, the 15 to 24 years age bracket for the primary householder has the lowest median household income of $45,208, with 155 households (1.5%) in this group.
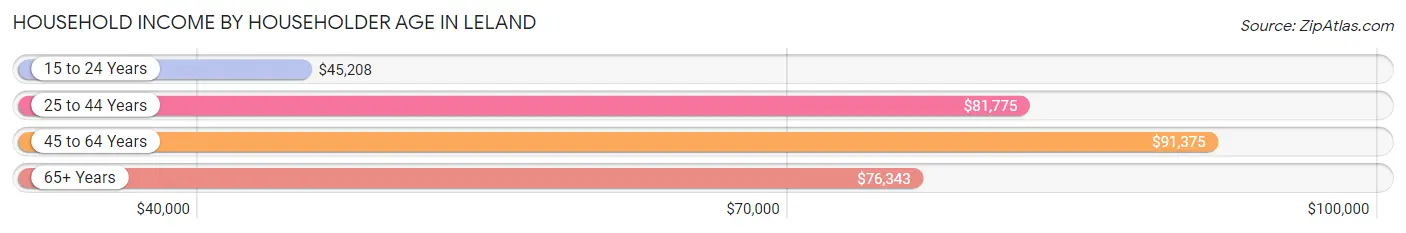
| Income Bracket | # Households | Median Income |
| 15 to 24 Years | 155 (1.5%) | $45,208 |
| 25 to 44 Years | 2,446 (23.5%) | $81,775 |
| 45 to 64 Years | 3,529 (33.9%) | $91,375 |
| 65+ Years | 4,293 (41.2%) | $76,343 |
| Total | 10,423 (100.0%) | $82,651 |
Poverty in Leland
Income Below Poverty by Sex and Age in Leland
With 4.6% poverty level for males and 4.6% for females among the residents of Leland, 15 year old males and under 5 year old females are the most vulnerable to poverty, with 37 males (33.3%) and 55 females (11.3%) in their respective age groups living below the poverty level.
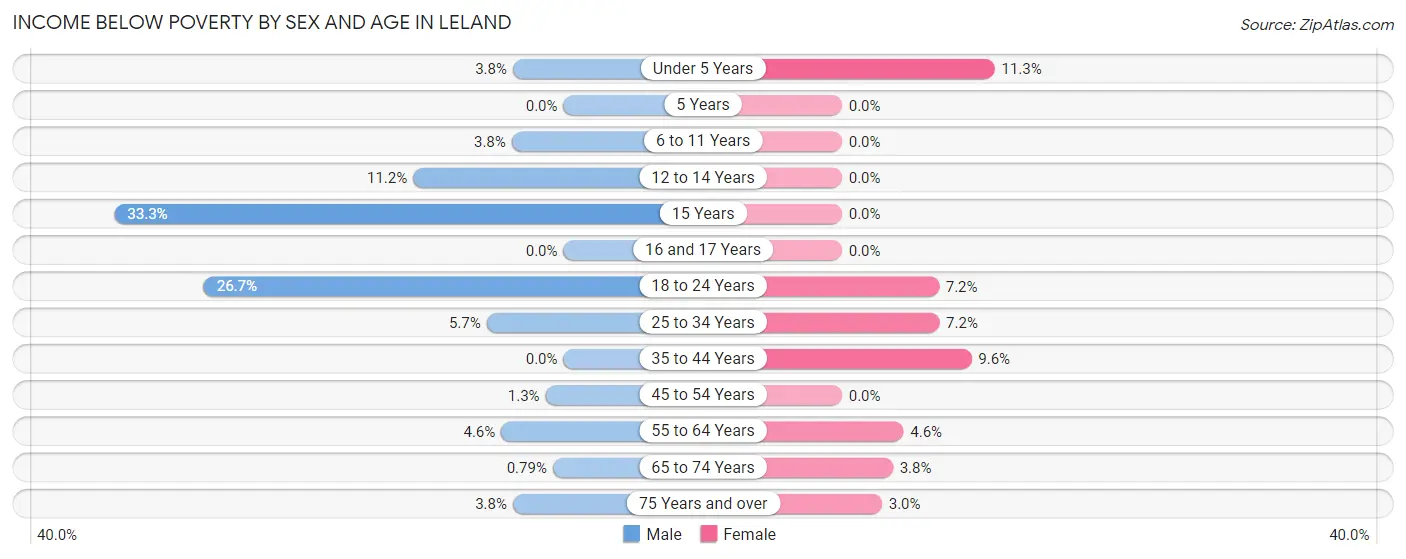
| Age Bracket | Male | Female |
| Under 5 Years | 27 (3.7%) | 55 (11.3%) |
| 5 Years | 0 (0.0%) | 0 (0.0%) |
| 6 to 11 Years | 23 (3.8%) | 0 (0.0%) |
| 12 to 14 Years | 48 (11.2%) | 0 (0.0%) |
| 15 Years | 37 (33.3%) | 0 (0.0%) |
| 16 and 17 Years | 0 (0.0%) | 0 (0.0%) |
| 18 to 24 Years | 182 (26.7%) | 50 (7.2%) |
| 25 to 34 Years | 95 (5.7%) | 108 (7.2%) |
| 35 to 44 Years | 0 (0.0%) | 139 (9.6%) |
| 45 to 54 Years | 17 (1.3%) | 0 (0.0%) |
| 55 to 64 Years | 73 (4.6%) | 92 (4.6%) |
| 65 to 74 Years | 19 (0.8%) | 95 (3.8%) |
| 75 Years and over | 36 (3.7%) | 30 (3.0%) |
| Total | 557 (4.6%) | 569 (4.6%) |
Income Above Poverty by Sex and Age in Leland
According to the poverty statistics in Leland, males aged 5 years and females aged 5 years are the age groups that are most secure financially, with 100.0% of males and 100.0% of females in these age groups living above the poverty line.
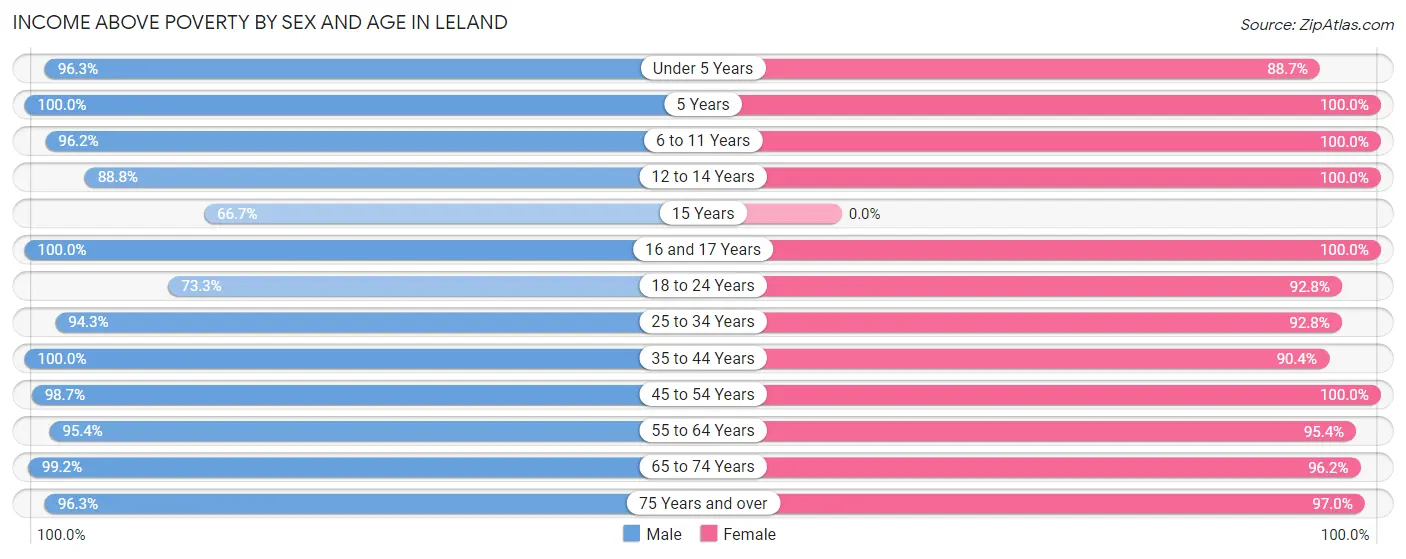
| Age Bracket | Male | Female |
| Under 5 Years | 693 (96.3%) | 430 (88.7%) |
| 5 Years | 80 (100.0%) | 122 (100.0%) |
| 6 to 11 Years | 576 (96.2%) | 644 (100.0%) |
| 12 to 14 Years | 382 (88.8%) | 377 (100.0%) |
| 15 Years | 74 (66.7%) | 0 (0.0%) |
| 16 and 17 Years | 253 (100.0%) | 256 (100.0%) |
| 18 to 24 Years | 500 (73.3%) | 644 (92.8%) |
| 25 to 34 Years | 1,572 (94.3%) | 1,386 (92.8%) |
| 35 to 44 Years | 1,304 (100.0%) | 1,306 (90.4%) |
| 45 to 54 Years | 1,258 (98.7%) | 1,273 (100.0%) |
| 55 to 64 Years | 1,506 (95.4%) | 1,919 (95.4%) |
| 65 to 74 Years | 2,388 (99.2%) | 2,416 (96.2%) |
| 75 Years and over | 924 (96.3%) | 981 (97.0%) |
| Total | 11,510 (95.4%) | 11,754 (95.4%) |
Income Below Poverty Among Married-Couple Families in Leland
The poverty statistics for married-couple families in Leland show that 2.0% or 119 of the total 5,974 families live below the poverty line. Families with 1 or 2 children have the highest poverty rate of 2.8%, comprising of 44 families. On the other hand, families with 3 or 4 children have the lowest poverty rate of 0.0%, which includes 0 families.
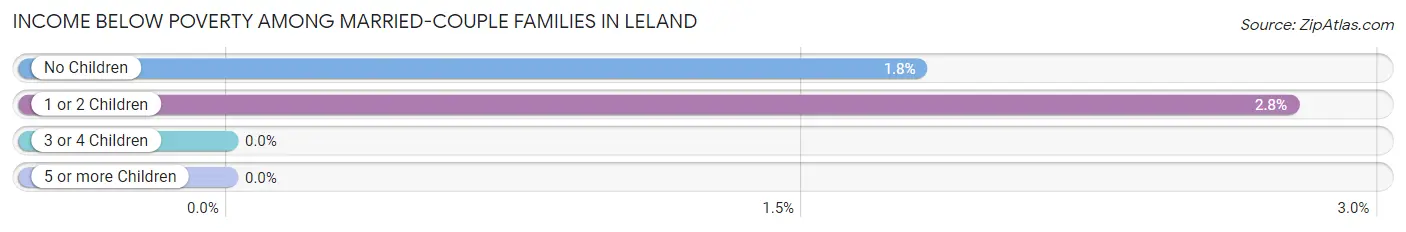
| Children | Above Poverty | Below Poverty |
| No Children | 4,102 (98.2%) | 75 (1.8%) |
| 1 or 2 Children | 1,547 (97.2%) | 44 (2.8%) |
| 3 or 4 Children | 192 (100.0%) | 0 (0.0%) |
| 5 or more Children | 14 (100.0%) | 0 (0.0%) |
| Total | 5,855 (98.0%) | 119 (2.0%) |
Income Below Poverty Among Single-Parent Households in Leland
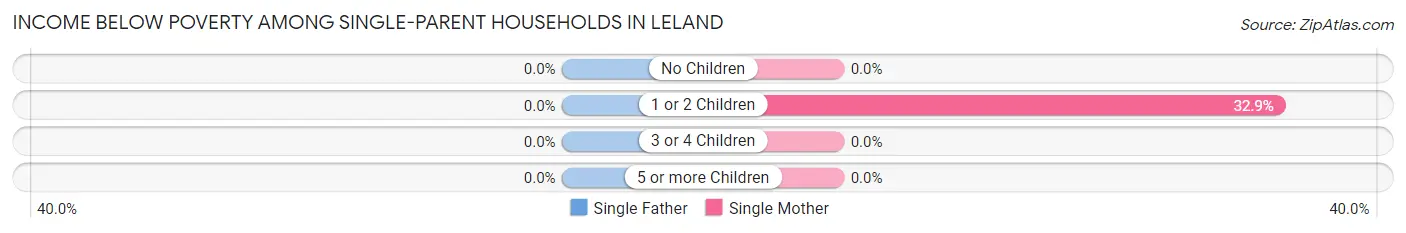
| Children | Single Father | Single Mother |
| No Children | 0 (0.0%) | 0 (0.0%) |
| 1 or 2 Children | 0 (0.0%) | 136 (32.9%) |
| 3 or 4 Children | 0 (0.0%) | 0 (0.0%) |
| 5 or more Children | 0 (0.0%) | 0 (0.0%) |
| Total | 0 (0.0%) | 136 (19.9%) |
Income Below Poverty Among Married-Couple vs Single-Parent Households in Leland
The poverty data for Leland shows that 119 of the married-couple family households (2.0%) and 136 of the single-parent households (11.6%) are living below the poverty level. Within the married-couple family households, those with 1 or 2 children have the highest poverty rate, with 44 households (2.8%) falling below the poverty line. Among the single-parent households, those with 1 or 2 children have the highest poverty rate, with 136 household (23.4%) living below poverty.
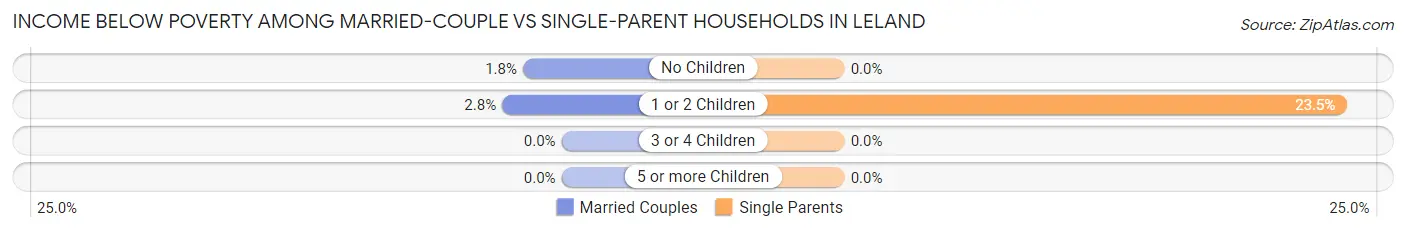
| Children | Married-Couple Families | Single-Parent Households |
| No Children | 75 (1.8%) | 0 (0.0%) |
| 1 or 2 Children | 44 (2.8%) | 136 (23.4%) |
| 3 or 4 Children | 0 (0.0%) | 0 (0.0%) |
| 5 or more Children | 0 (0.0%) | 0 (0.0%) |
| Total | 119 (2.0%) | 136 (11.6%) |
Race in Leland
The most populous races in Leland are White / Caucasian (20,587 | 84.1%), Black / African American (2,140 | 8.7%), and Two or more Races (1,172 | 4.8%).
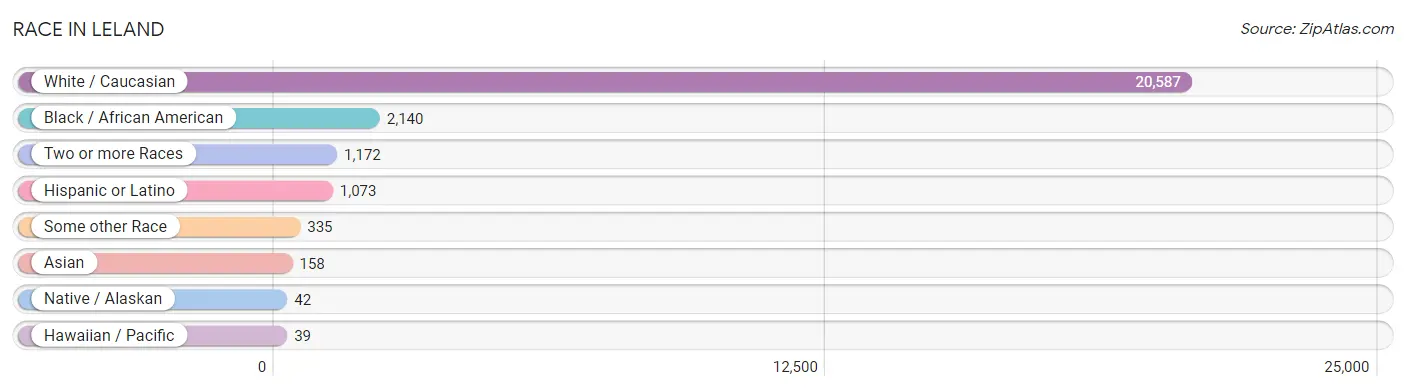
| Race | # Population | % Population |
| Asian | 158 | 0.6% |
| Black / African American | 2,140 | 8.7% |
| Hawaiian / Pacific | 39 | 0.2% |
| Hispanic or Latino | 1,073 | 4.4% |
| Native / Alaskan | 42 | 0.2% |
| White / Caucasian | 20,587 | 84.1% |
| Two or more Races | 1,172 | 4.8% |
| Some other Race | 335 | 1.4% |
| Total | 24,473 | 100.0% |
Ancestry in Leland
The most populous ancestries reported in Leland are English (4,200 | 17.2%), German (4,036 | 16.5%), Irish (3,745 | 15.3%), Italian (1,892 | 7.7%), and American (1,300 | 5.3%), together accounting for 62.0% of all Leland residents.
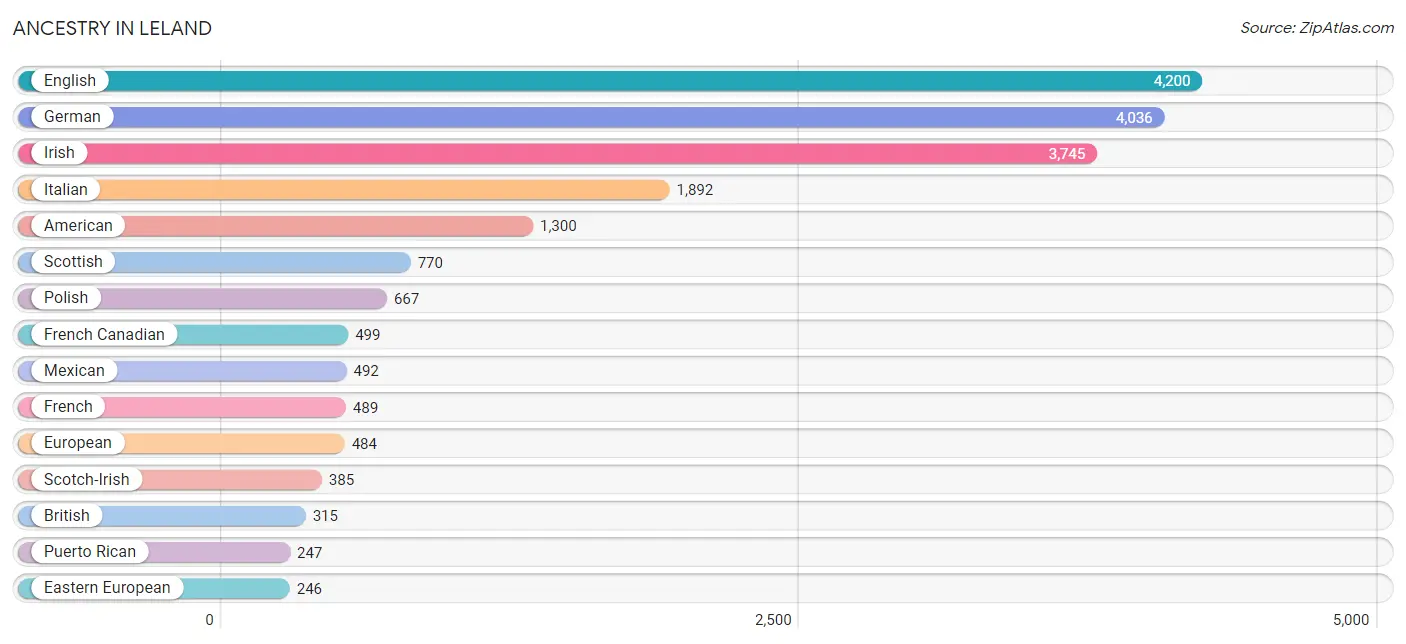
| Ancestry | # Population | % Population |
| African | 90 | 0.4% |
| American | 1,300 | 5.3% |
| Arab | 150 | 0.6% |
| Argentinean | 10 | 0.0% |
| Armenian | 15 | 0.1% |
| Austrian | 54 | 0.2% |
| Bhutanese | 15 | 0.1% |
| British | 315 | 1.3% |
| Bulgarian | 46 | 0.2% |
| Burmese | 14 | 0.1% |
| Canadian | 42 | 0.2% |
| Cape Verdean | 19 | 0.1% |
| Central American | 13 | 0.1% |
| Central American Indian | 9 | 0.0% |
| Cherokee | 69 | 0.3% |
| Chippewa | 141 | 0.6% |
| Cuban | 149 | 0.6% |
| Czech | 237 | 1.0% |
| Czechoslovakian | 15 | 0.1% |
| Danish | 73 | 0.3% |
| Dominican | 90 | 0.4% |
| Dutch | 186 | 0.8% |
| Eastern European | 246 | 1.0% |
| English | 4,200 | 17.2% |
| European | 484 | 2.0% |
| Finnish | 26 | 0.1% |
| French | 489 | 2.0% |
| French Canadian | 499 | 2.0% |
| German | 4,036 | 16.5% |
| Greek | 68 | 0.3% |
| Honduran | 13 | 0.1% |
| Hungarian | 236 | 1.0% |
| Indian (Asian) | 63 | 0.3% |
| Irish | 3,745 | 15.3% |
| Iroquois | 4 | 0.0% |
| Italian | 1,892 | 7.7% |
| Jamaican | 30 | 0.1% |
| Korean | 131 | 0.5% |
| Latvian | 15 | 0.1% |
| Lebanese | 72 | 0.3% |
| Lithuanian | 144 | 0.6% |
| Lumbee | 19 | 0.1% |
| Macedonian | 19 | 0.1% |
| Mexican | 492 | 2.0% |
| Native Hawaiian | 16 | 0.1% |
| Norwegian | 170 | 0.7% |
| Palestinian | 78 | 0.3% |
| Pennsylvania German | 31 | 0.1% |
| Peruvian | 17 | 0.1% |
| Polish | 667 | 2.7% |
| Portuguese | 37 | 0.2% |
| Puerto Rican | 247 | 1.0% |
| Romanian | 14 | 0.1% |
| Russian | 176 | 0.7% |
| Scandinavian | 98 | 0.4% |
| Scotch-Irish | 385 | 1.6% |
| Scottish | 770 | 3.2% |
| Slovak | 45 | 0.2% |
| South American | 82 | 0.3% |
| Subsaharan African | 109 | 0.4% |
| Swedish | 181 | 0.7% |
| Swiss | 23 | 0.1% |
| Turkish | 46 | 0.2% |
| Ukrainian | 178 | 0.7% |
| Venezuelan | 55 | 0.2% |
| Welsh | 229 | 0.9% |
| West Indian | 32 | 0.1% |
| Yugoslavian | 7 | 0.0% | View All 68 Rows |
Immigrants in Leland
The most numerous immigrant groups reported in Leland came from Europe (515 | 2.1%), Latin America (315 | 1.3%), Central America (161 | 0.7%), Eastern Europe (161 | 0.7%), and Western Europe (155 | 0.6%), together accounting for 5.3% of all Leland residents.
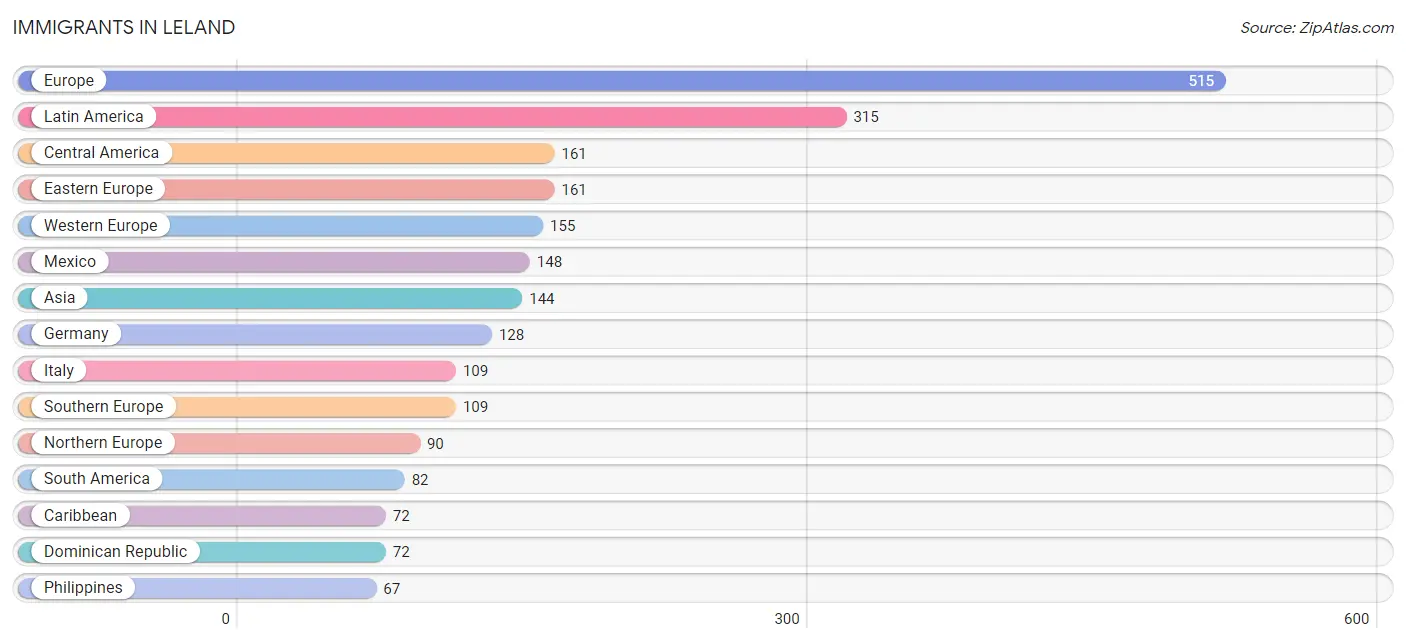
| Immigration Origin | # Population | % Population |
| Argentina | 10 | 0.0% |
| Asia | 144 | 0.6% |
| Bosnia and Herzegovina | 7 | 0.0% |
| Canada | 43 | 0.2% |
| Caribbean | 72 | 0.3% |
| Central America | 161 | 0.7% |
| China | 47 | 0.2% |
| Czechoslovakia | 24 | 0.1% |
| Dominican Republic | 72 | 0.3% |
| Eastern Asia | 54 | 0.2% |
| Eastern Europe | 161 | 0.7% |
| El Salvador | 13 | 0.1% |
| England | 18 | 0.1% |
| Europe | 515 | 2.1% |
| France | 27 | 0.1% |
| Germany | 128 | 0.5% |
| Hungary | 11 | 0.0% |
| Italy | 109 | 0.4% |
| Korea | 7 | 0.0% |
| Latin America | 315 | 1.3% |
| Lebanon | 23 | 0.1% |
| Mexico | 148 | 0.6% |
| Northern Europe | 90 | 0.4% |
| Peru | 17 | 0.1% |
| Philippines | 67 | 0.3% |
| Poland | 64 | 0.3% |
| Russia | 11 | 0.0% |
| Scotland | 13 | 0.1% |
| South America | 82 | 0.3% |
| South Eastern Asia | 67 | 0.3% |
| Southern Europe | 109 | 0.4% |
| Sweden | 15 | 0.1% |
| Ukraine | 44 | 0.2% |
| Venezuela | 55 | 0.2% |
| Western Asia | 23 | 0.1% |
| Western Europe | 155 | 0.6% | View All 36 Rows |
Sex and Age in Leland
Sex and Age in Leland
The most populous age groups in Leland are 65 to 69 Years (1,243 | 10.3%) for men and 65 to 69 Years (1,444 | 11.7%) for women.
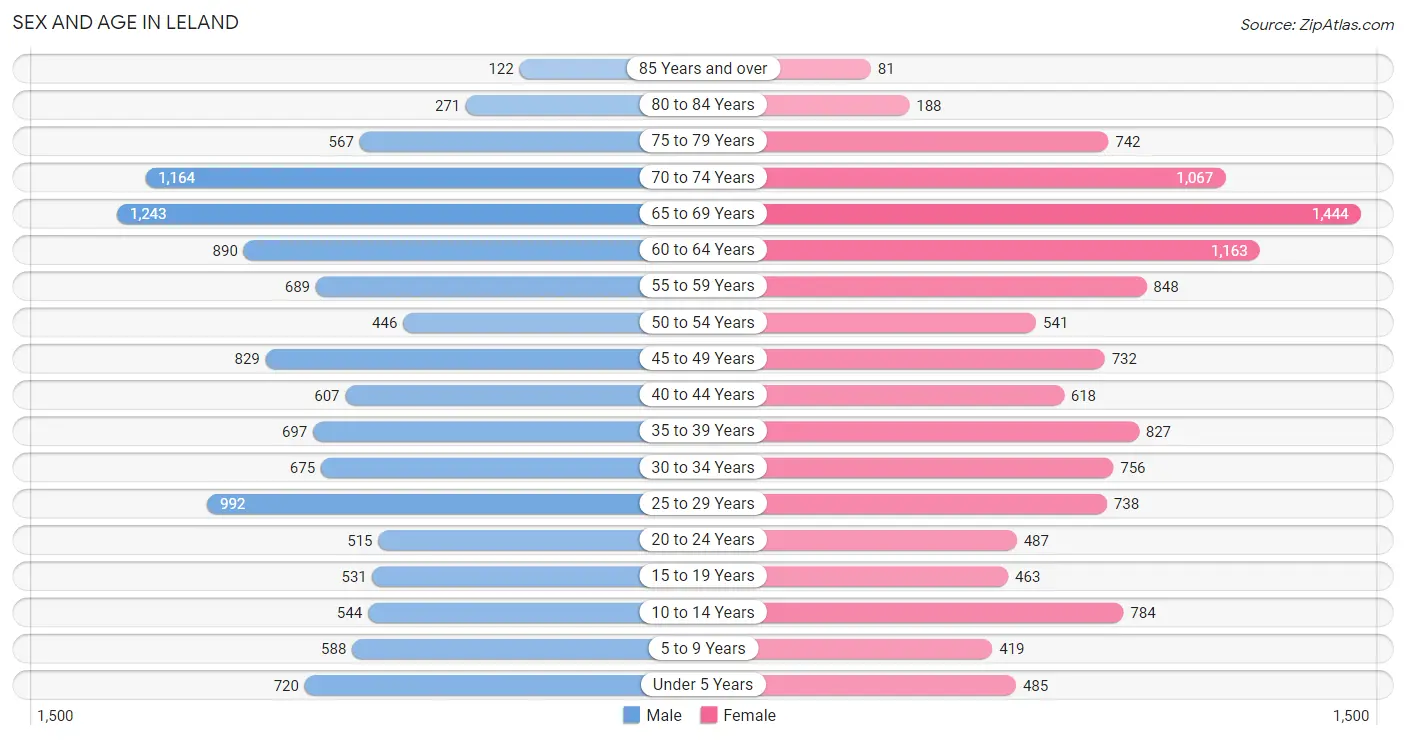
| Age Bracket | Male | Female |
| Under 5 Years | 720 (6.0%) | 485 (3.9%) |
| 5 to 9 Years | 588 (4.9%) | 419 (3.4%) |
| 10 to 14 Years | 544 (4.5%) | 784 (6.3%) |
| 15 to 19 Years | 531 (4.4%) | 463 (3.7%) |
| 20 to 24 Years | 515 (4.3%) | 487 (3.9%) |
| 25 to 29 Years | 992 (8.2%) | 738 (6.0%) |
| 30 to 34 Years | 675 (5.6%) | 756 (6.1%) |
| 35 to 39 Years | 697 (5.8%) | 827 (6.7%) |
| 40 to 44 Years | 607 (5.0%) | 618 (5.0%) |
| 45 to 49 Years | 829 (6.9%) | 732 (5.9%) |
| 50 to 54 Years | 446 (3.7%) | 541 (4.4%) |
| 55 to 59 Years | 689 (5.7%) | 848 (6.9%) |
| 60 to 64 Years | 890 (7.4%) | 1,163 (9.4%) |
| 65 to 69 Years | 1,243 (10.3%) | 1,444 (11.7%) |
| 70 to 74 Years | 1,164 (9.6%) | 1,067 (8.6%) |
| 75 to 79 Years | 567 (4.7%) | 742 (6.0%) |
| 80 to 84 Years | 271 (2.2%) | 188 (1.5%) |
| 85 Years and over | 122 (1.0%) | 81 (0.6%) |
| Total | 12,090 (100.0%) | 12,383 (100.0%) |
Families and Households in Leland
Median Family Size in Leland
The median family size in Leland is 2.79 persons per family, with single female/mother families (682 | 9.6%) accounting for the largest median family size of 2.87 persons per family. On the other hand, married-couple families (5,974 | 83.6%) represent the smallest median family size with 2.78 persons per family.
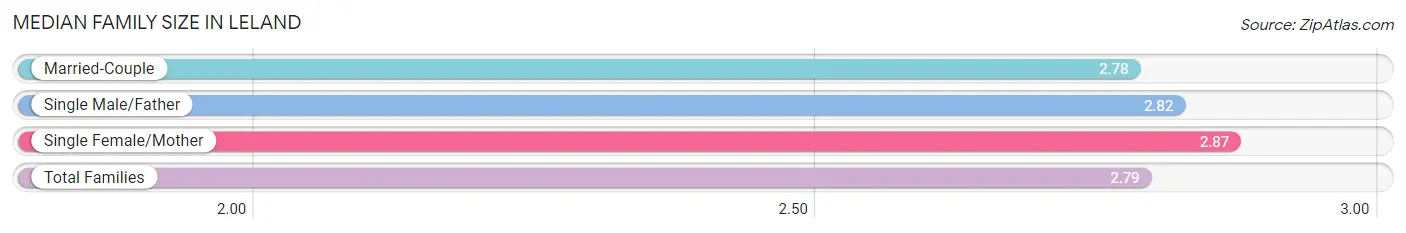
| Family Type | # Families | Family Size |
| Married-Couple | 5,974 (83.6%) | 2.78 |
| Single Male/Father | 488 (6.8%) | 2.82 |
| Single Female/Mother | 682 (9.6%) | 2.87 |
| Total Families | 7,144 (100.0%) | 2.79 |
Median Household Size in Leland
The median household size in Leland is 2.35 persons per household, with single male/father households (488 | 4.7%) accounting for the largest median household size of 3.36 persons per household. non-family households (3,279 | 31.5%) represent the smallest median household size with 1.23 persons per household.
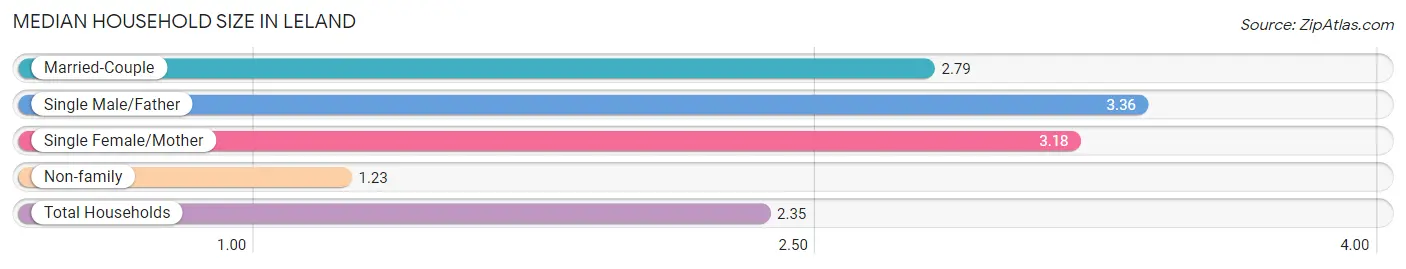
| Household Type | # Households | Household Size |
| Married-Couple | 5,974 (57.3%) | 2.79 |
| Single Male/Father | 488 (4.7%) | 3.36 |
| Single Female/Mother | 682 (6.5%) | 3.18 |
| Non-family | 3,279 (31.5%) | 1.23 |
| Total Households | 10,423 (100.0%) | 2.35 |
Household Size by Marriage Status in Leland
Out of a total of 10,423 households in Leland, 7,144 (68.5%) are family households, while 3,279 (31.5%) are nonfamily households. The most numerous type of family households are 2-person households, comprising 4,186, and the most common type of nonfamily households are 1-person households, comprising 2,765.
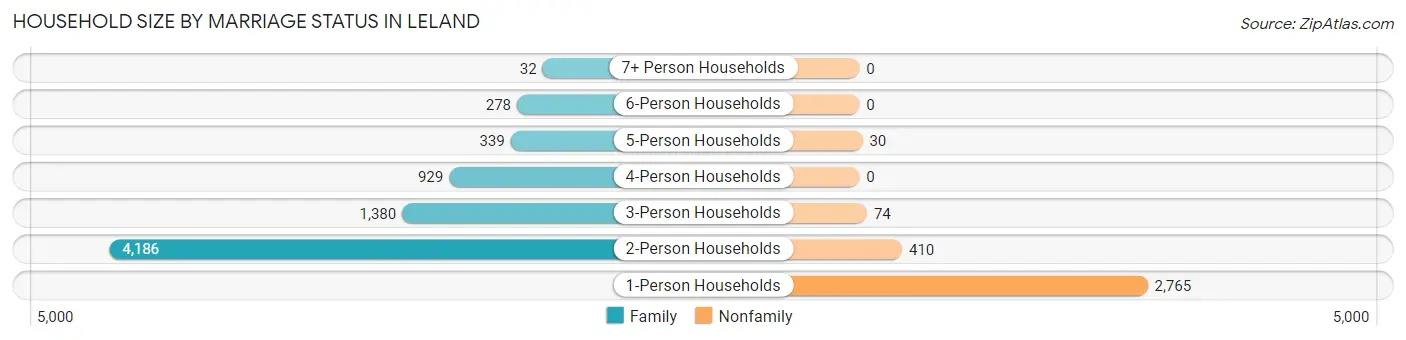
| Household Size | Family Households | Nonfamily Households |
| 1-Person Households | - | 2,765 (26.5%) |
| 2-Person Households | 4,186 (40.2%) | 410 (3.9%) |
| 3-Person Households | 1,380 (13.2%) | 74 (0.7%) |
| 4-Person Households | 929 (8.9%) | 0 (0.0%) |
| 5-Person Households | 339 (3.3%) | 30 (0.3%) |
| 6-Person Households | 278 (2.7%) | 0 (0.0%) |
| 7+ Person Households | 32 (0.3%) | 0 (0.0%) |
| Total | 7,144 (68.5%) | 3,279 (31.5%) |
Female Fertility in Leland
Fertility by Age in Leland
Average fertility rate in Leland is 23.0 births per 1,000 women. Women in the age bracket of 20 to 34 years have the highest fertility rate with 42.0 births per 1,000 women. Women in the age bracket of 20 to 34 years acount for 79.2% of all women with births.
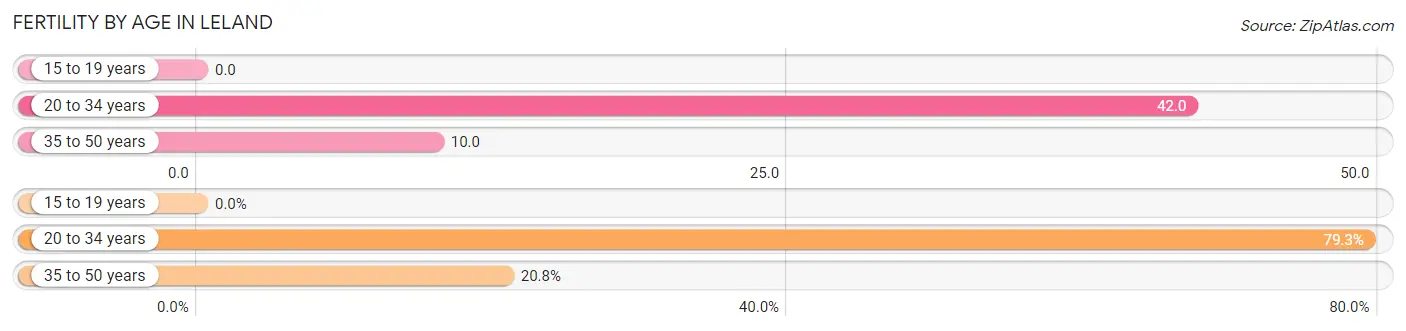
| Age Bracket | Women with Births | Births / 1,000 Women |
| 15 to 19 years | 0 (0.0%) | 0.0 |
| 20 to 34 years | 84 (79.2%) | 42.0 |
| 35 to 50 years | 22 (20.7%) | 10.0 |
| Total | 106 (100.0%) | 23.0 |
Fertility by Age by Marriage Status in Leland
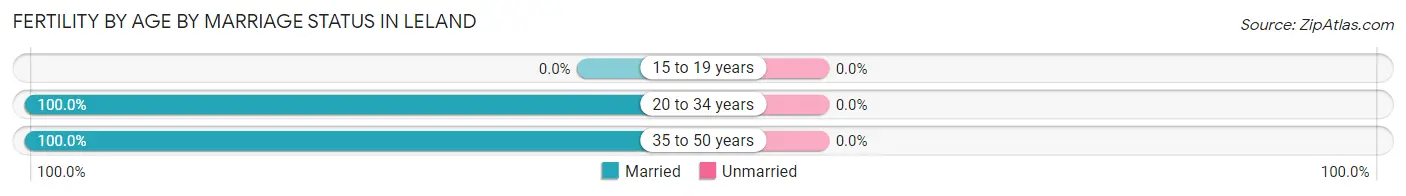
| Age Bracket | Married | Unmarried |
| 15 to 19 years | 0 (0.0%) | 0 (0.0%) |
| 20 to 34 years | 84 (100.0%) | 0 (0.0%) |
| 35 to 50 years | 22 (100.0%) | 0 (0.0%) |
| Total | 106 (100.0%) | 0 (0.0%) |
Fertility by Education in Leland
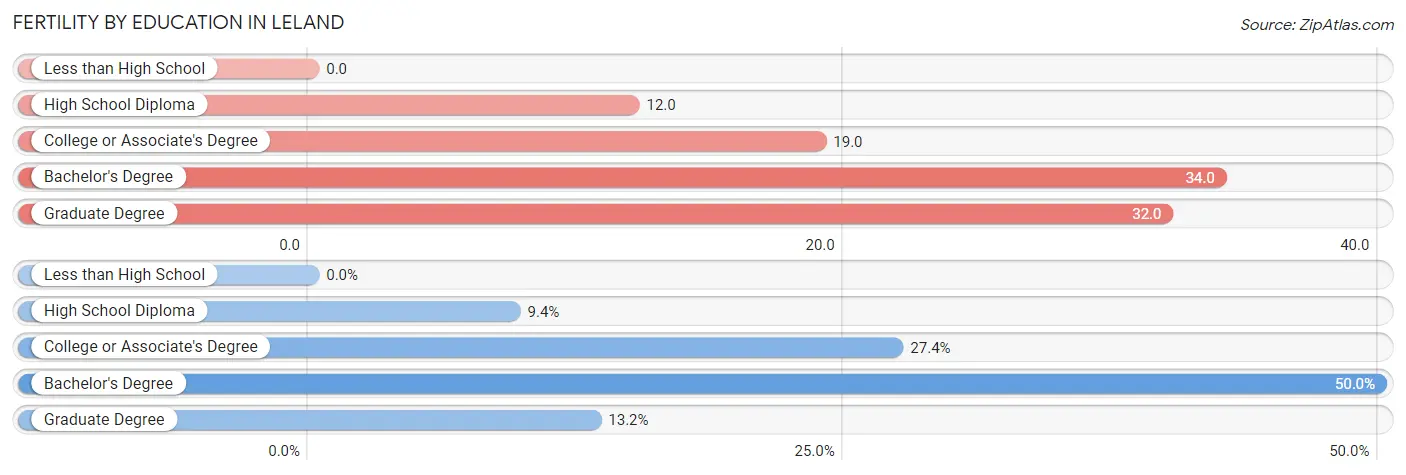
| Educational Attainment | Women with Births | Births / 1,000 Women |
| Less than High School | 0 (0.0%) | 0.0 |
| High School Diploma | 10 (9.4%) | 12.0 |
| College or Associate's Degree | 29 (27.4%) | 19.0 |
| Bachelor's Degree | 53 (50.0%) | 34.0 |
| Graduate Degree | 14 (13.2%) | 32.0 |
| Total | 106 (100.0%) | 23.0 |
Fertility by Education by Marriage Status in Leland
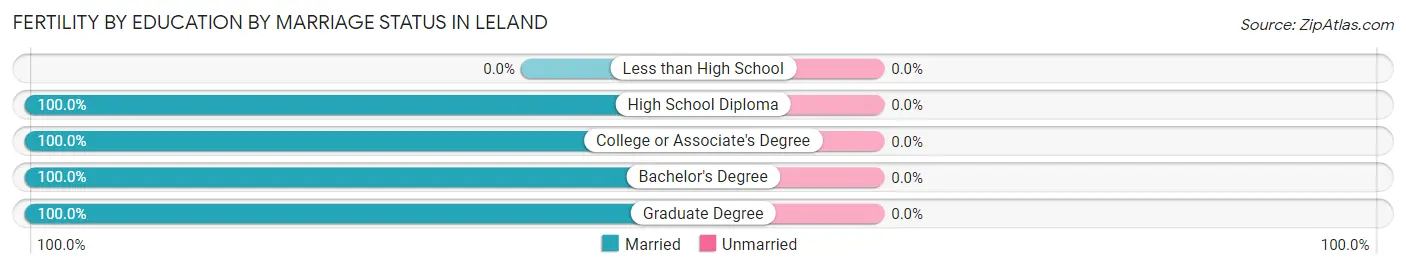
| Educational Attainment | Married | Unmarried |
| Less than High School | 0 (0.0%) | 0 (0.0%) |
| High School Diploma | 10 (100.0%) | 0 (0.0%) |
| College or Associate's Degree | 29 (100.0%) | 0 (0.0%) |
| Bachelor's Degree | 53 (100.0%) | 0 (0.0%) |
| Graduate Degree | 14 (100.0%) | 0 (0.0%) |
| Total | 106 (100.0%) | 0 (0.0%) |
Employment Characteristics in Leland
Employment by Class of Employer in Leland
Among the 10,860 employed individuals in Leland, private company employees (7,272 | 67.0%), local government employees (1,135 | 10.4%), and not-for-profit organizations (779 | 7.2%) make up the most common classes of employment.
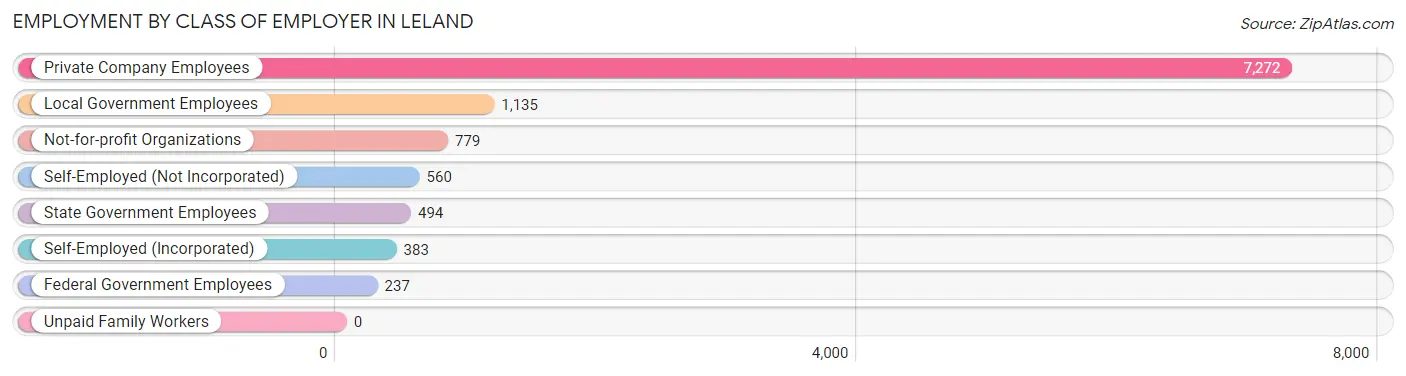
| Employer Class | # Employees | % Employees |
| Private Company Employees | 7,272 | 67.0% |
| Self-Employed (Incorporated) | 383 | 3.5% |
| Self-Employed (Not Incorporated) | 560 | 5.2% |
| Not-for-profit Organizations | 779 | 7.2% |
| Local Government Employees | 1,135 | 10.4% |
| State Government Employees | 494 | 4.5% |
| Federal Government Employees | 237 | 2.2% |
| Unpaid Family Workers | 0 | 0.0% |
| Total | 10,860 | 100.0% |
Employment Status by Age in Leland
According to the labor force statistics for Leland, out of the total population over 16 years of age (20,822), 54.8% or 11,410 individuals are in the labor force, with 3.8% or 434 of them unemployed. The age group with the highest labor force participation rate is 45 to 54 years, with 93.3% or 2,377 individuals in the labor force. Within the labor force, the 16 to 19 years age range has the highest percentage of unemployed individuals, with 10.5% or 47 of them being unemployed.
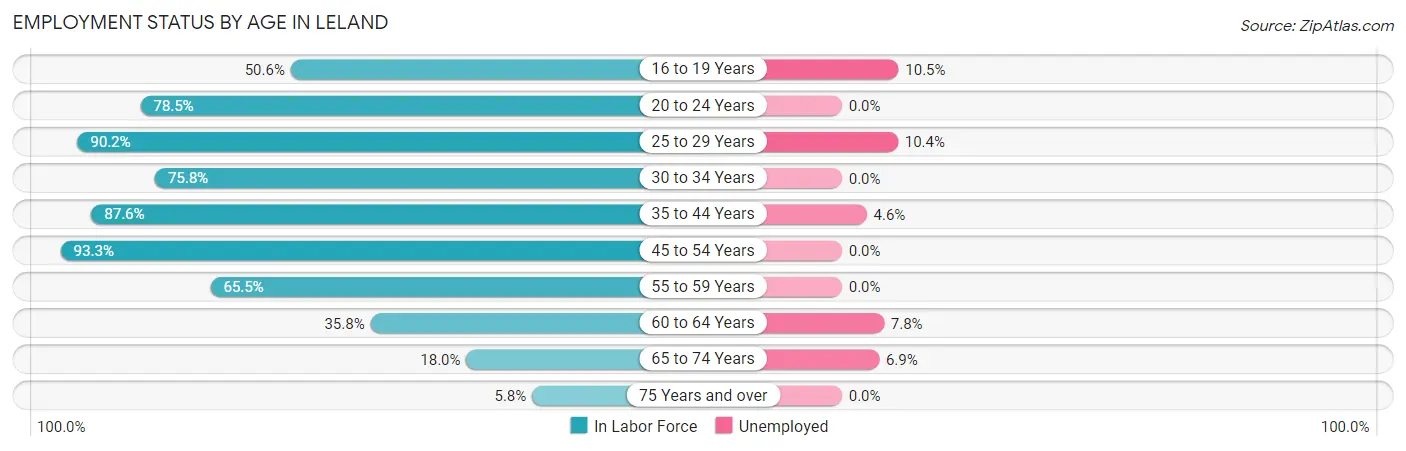
| Age Bracket | In Labor Force | Unemployed |
| 16 to 19 Years | 447 (50.6%) | 47 (10.5%) |
| 20 to 24 Years | 787 (78.5%) | 0 (0.0%) |
| 25 to 29 Years | 1,560 (90.2%) | 162 (10.4%) |
| 30 to 34 Years | 1,085 (75.8%) | 0 (0.0%) |
| 35 to 44 Years | 2,408 (87.6%) | 111 (4.6%) |
| 45 to 54 Years | 2,377 (93.3%) | 0 (0.0%) |
| 55 to 59 Years | 1,007 (65.5%) | 0 (0.0%) |
| 60 to 64 Years | 735 (35.8%) | 57 (7.8%) |
| 65 to 74 Years | 885 (18.0%) | 61 (6.9%) |
| 75 Years and over | 114 (5.8%) | 0 (0.0%) |
| Total | 11,410 (54.8%) | 434 (3.8%) |
Employment Status by Educational Attainment in Leland
According to labor force statistics for Leland, 76.1% of individuals (9,169) out of the total population between 25 and 64 years of age (12,048) are in the labor force, with 3.6% or 330 of them being unemployed. The group with the highest labor force participation rate are those with the educational attainment of less than high school, with 84.9% or 286 individuals in the labor force. Within the labor force, individuals with high school diploma education have the highest percentage of unemployment, with 9.7% or 176 of them being unemployed.
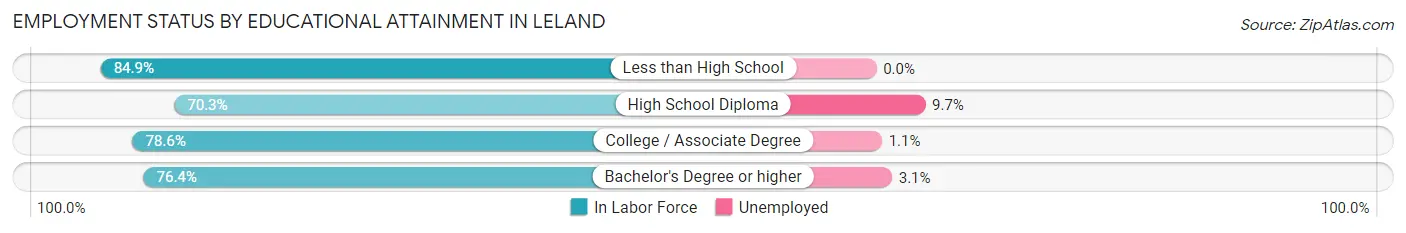
| Educational Attainment | In Labor Force | Unemployed |
| Less than High School | 286 (84.9%) | 0 (0.0%) |
| High School Diploma | 1,819 (70.3%) | 251 (9.7%) |
| College / Associate Degree | 3,509 (78.6%) | 49 (1.1%) |
| Bachelor's Degree or higher | 3,559 (76.4%) | 144 (3.1%) |
| Total | 9,169 (76.1%) | 434 (3.6%) |
Employment Occupations by Sex in Leland
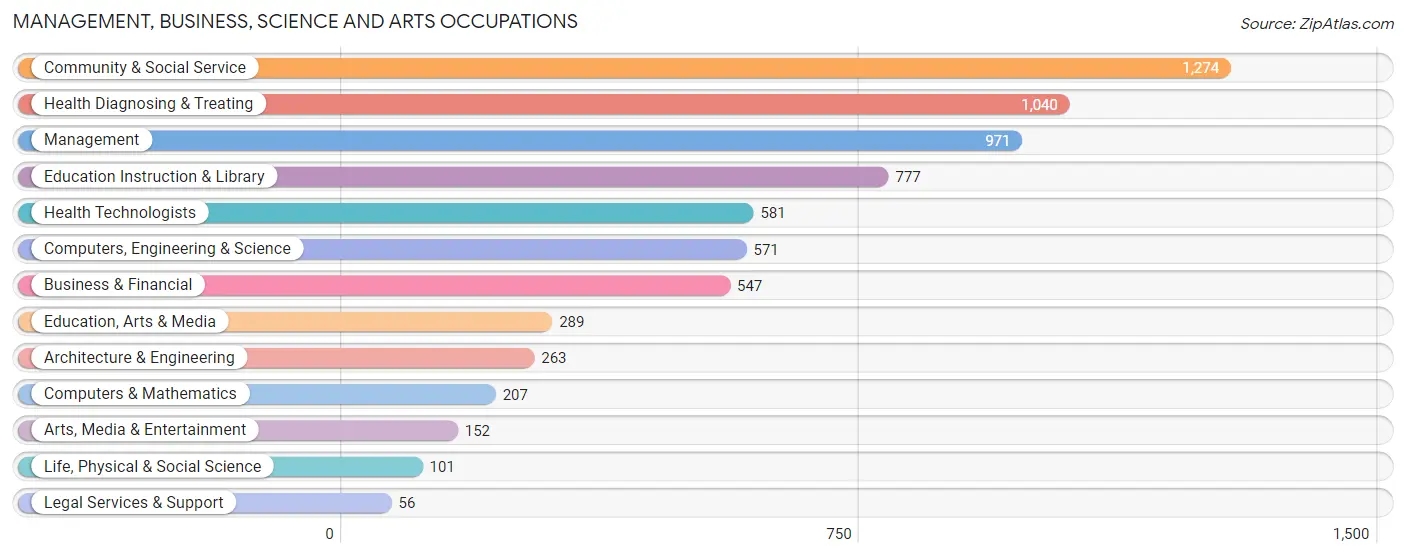
Management, Business, Science and Arts Occupations
The most common Management, Business, Science and Arts occupations in Leland are Community & Social Service (1,274 | 11.6%), Health Diagnosing & Treating (1,040 | 9.5%), Management (971 | 8.9%), Education Instruction & Library (777 | 7.1%), and Health Technologists (581 | 5.3%).
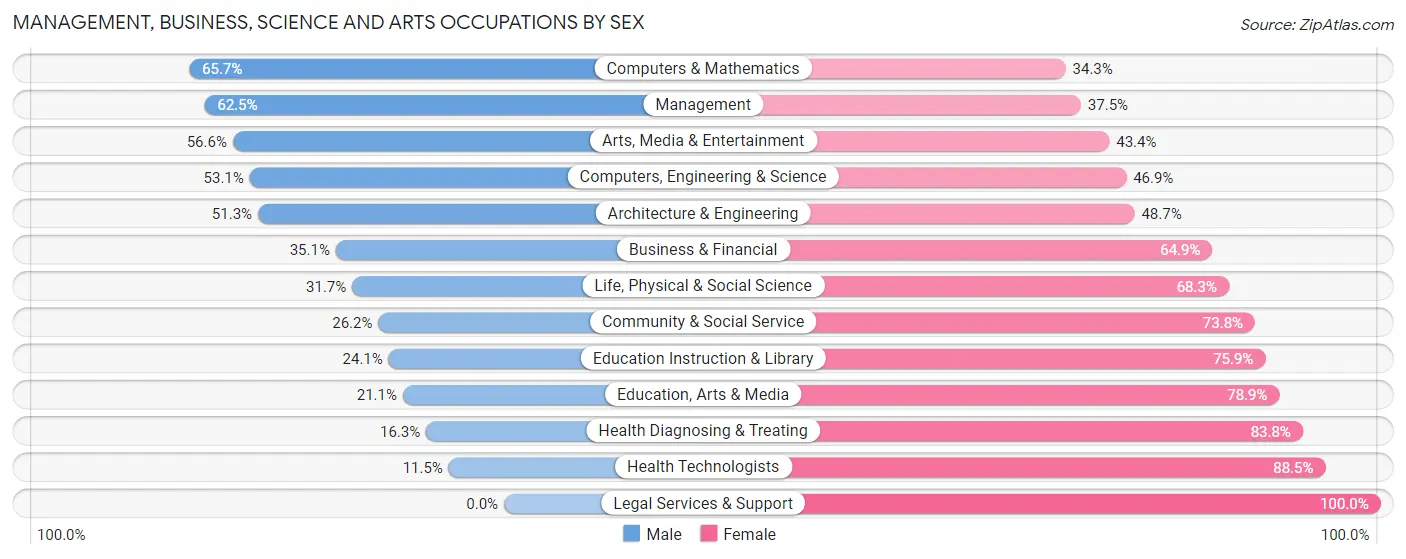
Management, Business, Science and Arts Occupations by Sex
Within the Management, Business, Science and Arts occupations in Leland, the most male-oriented occupations are Computers & Mathematics (65.7%), Management (62.5%), and Arts, Media & Entertainment (56.6%), while the most female-oriented occupations are Legal Services & Support (100.0%), Health Technologists (88.5%), and Health Diagnosing & Treating (83.8%).
| Occupation | Male | Female |
| Management | 607 (62.5%) | 364 (37.5%) |
| Business & Financial | 192 (35.1%) | 355 (64.9%) |
| Computers, Engineering & Science | 303 (53.1%) | 268 (46.9%) |
| Computers & Mathematics | 136 (65.7%) | 71 (34.3%) |
| Architecture & Engineering | 135 (51.3%) | 128 (48.7%) |
| Life, Physical & Social Science | 32 (31.7%) | 69 (68.3%) |
| Community & Social Service | 334 (26.2%) | 940 (73.8%) |
| Education, Arts & Media | 61 (21.1%) | 228 (78.9%) |
| Legal Services & Support | 0 (0.0%) | 56 (100.0%) |
| Education Instruction & Library | 187 (24.1%) | 590 (75.9%) |
| Arts, Media & Entertainment | 86 (56.6%) | 66 (43.4%) |
| Health Diagnosing & Treating | 169 (16.3%) | 871 (83.8%) |
| Health Technologists | 67 (11.5%) | 514 (88.5%) |
| Total (Category) | 1,605 (36.4%) | 2,798 (63.5%) |
| Total (Overall) | 5,413 (49.4%) | 5,537 (50.6%) |
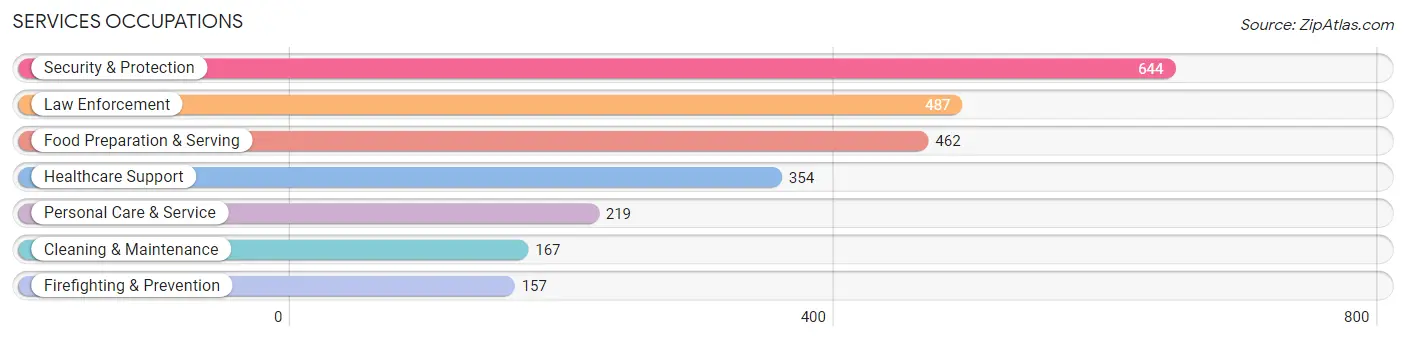
Services Occupations
The most common Services occupations in Leland are Security & Protection (644 | 5.9%), Law Enforcement (487 | 4.4%), Food Preparation & Serving (462 | 4.2%), Healthcare Support (354 | 3.2%), and Personal Care & Service (219 | 2.0%).
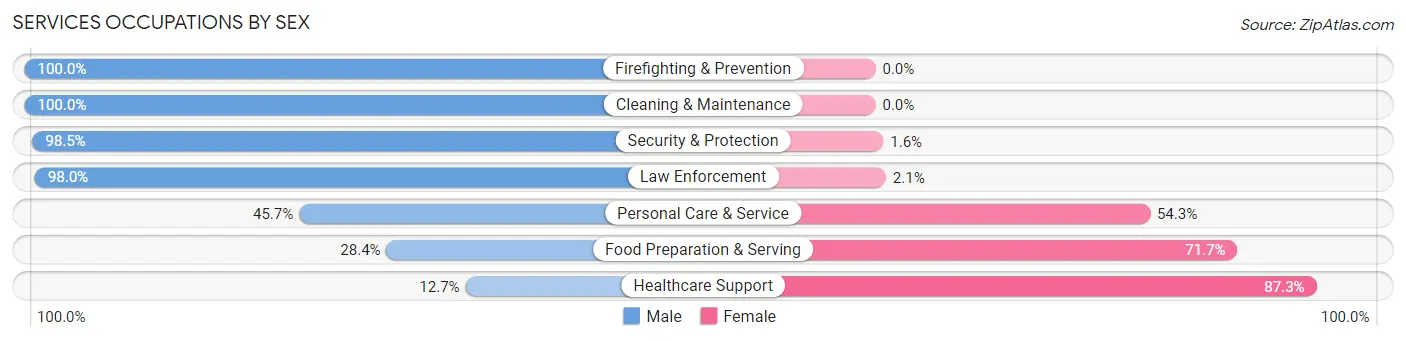
Services Occupations by Sex
Within the Services occupations in Leland, the most male-oriented occupations are Firefighting & Prevention (100.0%), Cleaning & Maintenance (100.0%), and Security & Protection (98.5%), while the most female-oriented occupations are Healthcare Support (87.3%), Food Preparation & Serving (71.7%), and Personal Care & Service (54.3%).
| Occupation | Male | Female |
| Healthcare Support | 45 (12.7%) | 309 (87.3%) |
| Security & Protection | 634 (98.5%) | 10 (1.5%) |
| Firefighting & Prevention | 157 (100.0%) | 0 (0.0%) |
| Law Enforcement | 477 (98.0%) | 10 (2.1%) |
| Food Preparation & Serving | 131 (28.3%) | 331 (71.7%) |
| Cleaning & Maintenance | 167 (100.0%) | 0 (0.0%) |
| Personal Care & Service | 100 (45.7%) | 119 (54.3%) |
| Total (Category) | 1,077 (58.3%) | 769 (41.7%) |
| Total (Overall) | 5,413 (49.4%) | 5,537 (50.6%) |
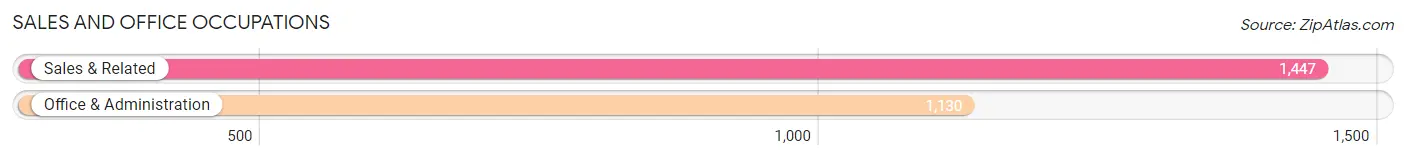
Sales and Office Occupations
The most common Sales and Office occupations in Leland are Sales & Related (1,447 | 13.2%), and Office & Administration (1,130 | 10.3%).
Sales and Office Occupations by Sex
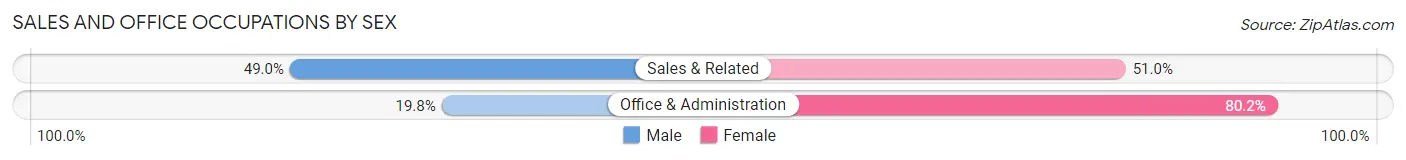
| Occupation | Male | Female |
| Sales & Related | 709 (49.0%) | 738 (51.0%) |
| Office & Administration | 224 (19.8%) | 906 (80.2%) |
| Total (Category) | 933 (36.2%) | 1,644 (63.8%) |
| Total (Overall) | 5,413 (49.4%) | 5,537 (50.6%) |
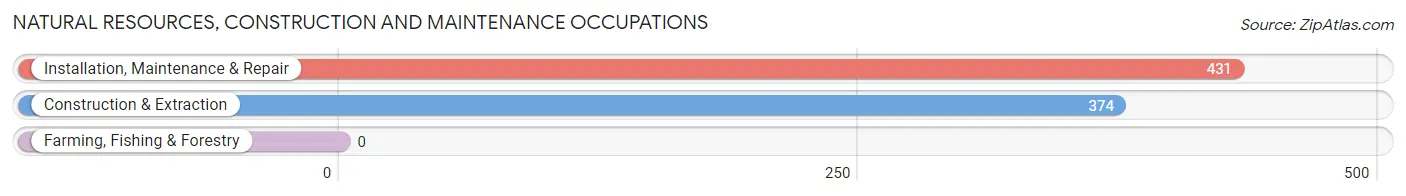
Natural Resources, Construction and Maintenance Occupations
The most common Natural Resources, Construction and Maintenance occupations in Leland are Installation, Maintenance & Repair (431 | 3.9%), and Construction & Extraction (374 | 3.4%).
Natural Resources, Construction and Maintenance Occupations by Sex
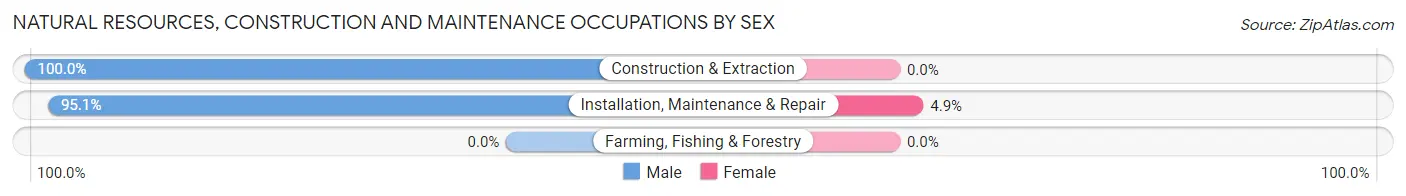
| Occupation | Male | Female |
| Farming, Fishing & Forestry | 0 (0.0%) | 0 (0.0%) |
| Construction & Extraction | 374 (100.0%) | 0 (0.0%) |
| Installation, Maintenance & Repair | 410 (95.1%) | 21 (4.9%) |
| Total (Category) | 784 (97.4%) | 21 (2.6%) |
| Total (Overall) | 5,413 (49.4%) | 5,537 (50.6%) |
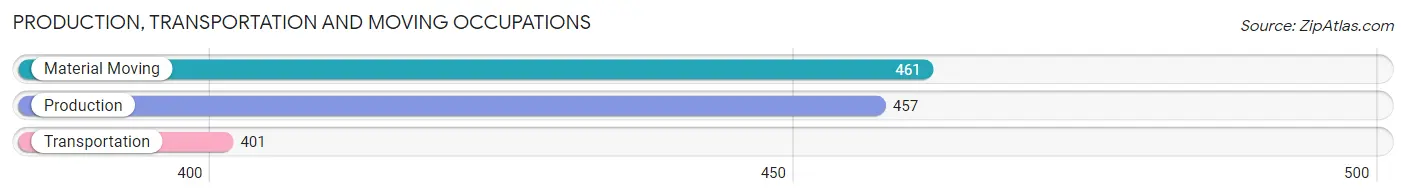
Production, Transportation and Moving Occupations
The most common Production, Transportation and Moving occupations in Leland are Material Moving (461 | 4.2%), Production (457 | 4.2%), and Transportation (401 | 3.7%).
Production, Transportation and Moving Occupations by Sex
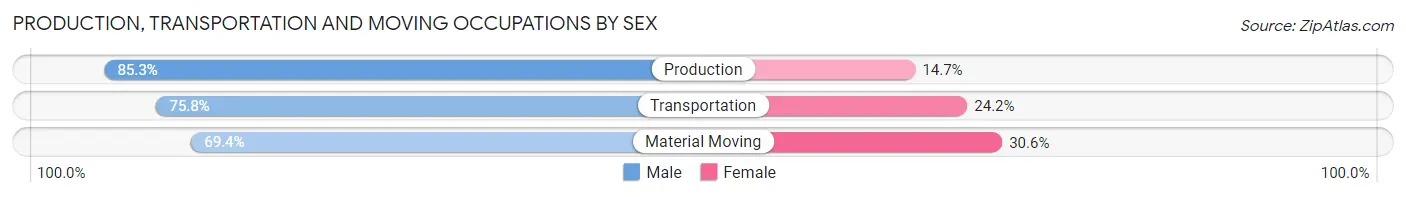
| Occupation | Male | Female |
| Production | 390 (85.3%) | 67 (14.7%) |
| Transportation | 304 (75.8%) | 97 (24.2%) |
| Material Moving | 320 (69.4%) | 141 (30.6%) |
| Total (Category) | 1,014 (76.9%) | 305 (23.1%) |
| Total (Overall) | 5,413 (49.4%) | 5,537 (50.6%) |
Employment Industries by Sex in Leland
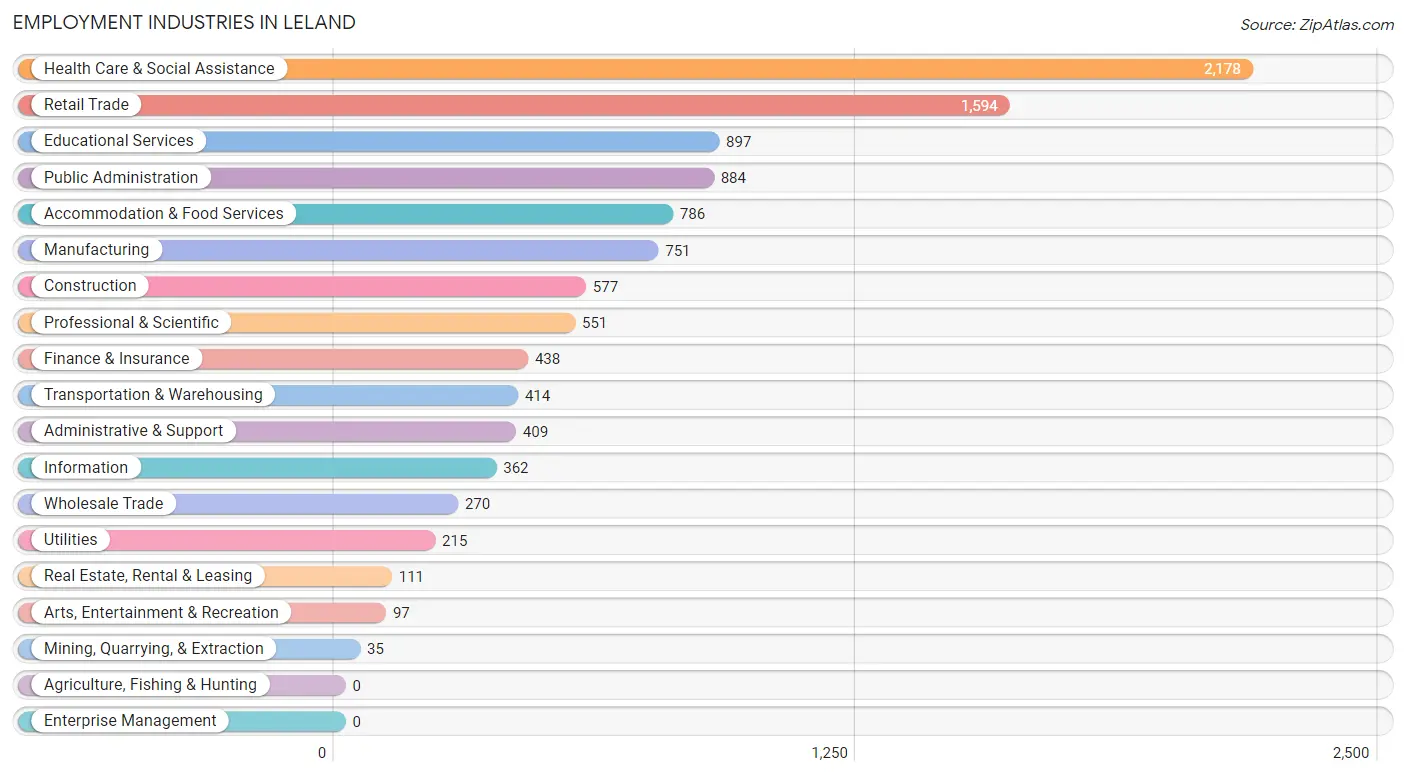
Employment Industries in Leland
The major employment industries in Leland include Health Care & Social Assistance (2,178 | 19.9%), Retail Trade (1,594 | 14.6%), Educational Services (897 | 8.2%), Public Administration (884 | 8.1%), and Accommodation & Food Services (786 | 7.2%).
Employment Industries by Sex in Leland
The Leland industries that see more men than women are Mining, Quarrying, & Extraction (100.0%), Administrative & Support (84.8%), and Construction (83.9%), whereas the industries that tend to have a higher number of women are Health Care & Social Assistance (77.6%), Educational Services (77.6%), and Accommodation & Food Services (74.8%).
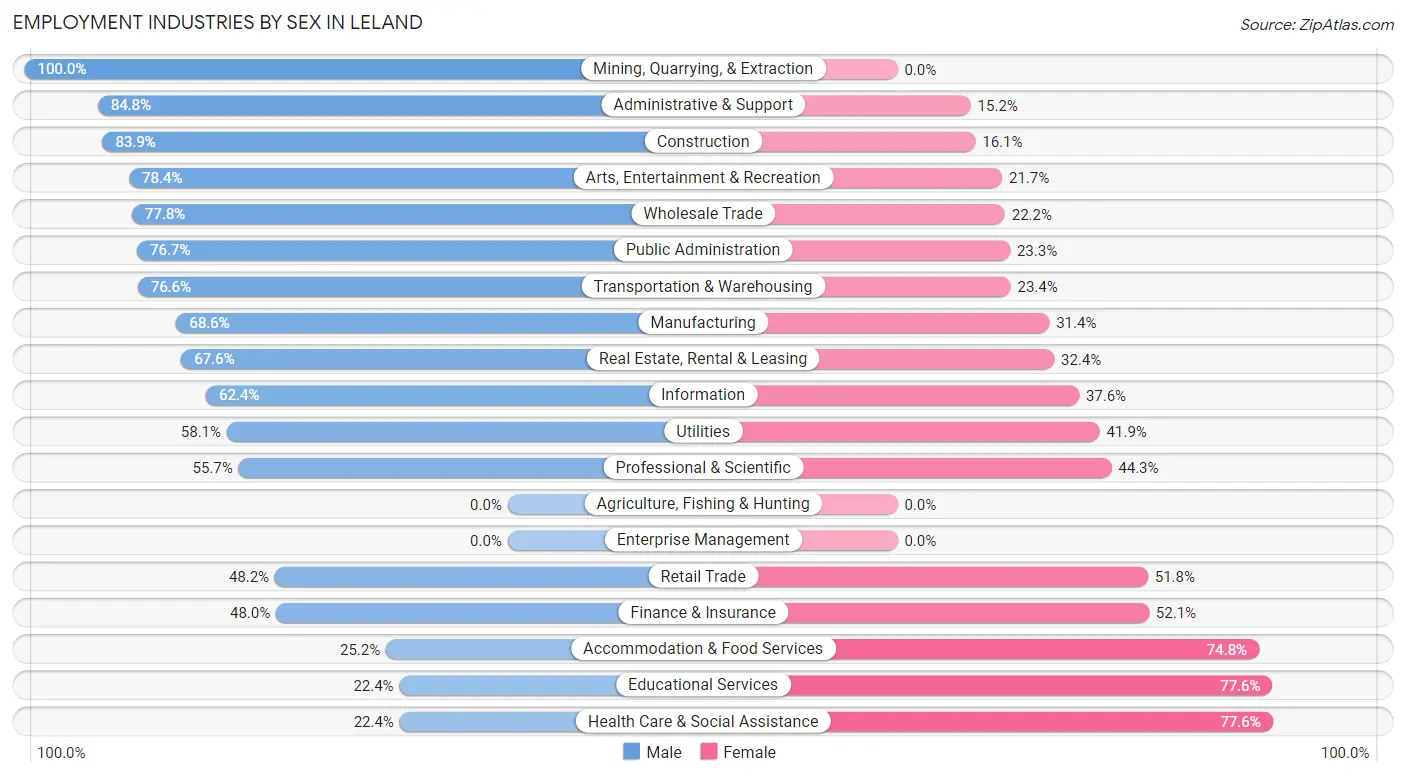
| Industry | Male | Female |
| Agriculture, Fishing & Hunting | 0 (0.0%) | 0 (0.0%) |
| Mining, Quarrying, & Extraction | 35 (100.0%) | 0 (0.0%) |
| Construction | 484 (83.9%) | 93 (16.1%) |
| Manufacturing | 515 (68.6%) | 236 (31.4%) |
| Wholesale Trade | 210 (77.8%) | 60 (22.2%) |
| Retail Trade | 768 (48.2%) | 826 (51.8%) |
| Transportation & Warehousing | 317 (76.6%) | 97 (23.4%) |
| Utilities | 125 (58.1%) | 90 (41.9%) |
| Information | 226 (62.4%) | 136 (37.6%) |
| Finance & Insurance | 210 (47.9%) | 228 (52.0%) |
| Real Estate, Rental & Leasing | 75 (67.6%) | 36 (32.4%) |
| Professional & Scientific | 307 (55.7%) | 244 (44.3%) |
| Enterprise Management | 0 (0.0%) | 0 (0.0%) |
| Administrative & Support | 347 (84.8%) | 62 (15.2%) |
| Educational Services | 201 (22.4%) | 696 (77.6%) |
| Health Care & Social Assistance | 487 (22.4%) | 1,691 (77.6%) |
| Arts, Entertainment & Recreation | 76 (78.3%) | 21 (21.6%) |
| Accommodation & Food Services | 198 (25.2%) | 588 (74.8%) |
| Public Administration | 678 (76.7%) | 206 (23.3%) |
| Total | 5,413 (49.4%) | 5,537 (50.6%) |
Education in Leland
School Enrollment in Leland
The most common levels of schooling among the 4,478 students in Leland are college / undergraduate (1,074 | 24.0%), high school (965 | 21.5%), and middle school (939 | 21.0%).
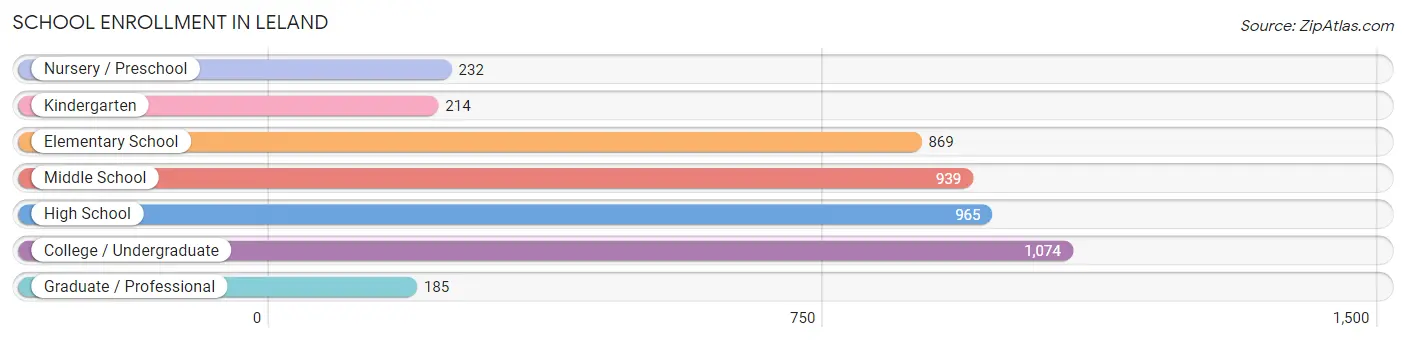
| School Level | # Students | % Students |
| Nursery / Preschool | 232 | 5.2% |
| Kindergarten | 214 | 4.8% |
| Elementary School | 869 | 19.4% |
| Middle School | 939 | 21.0% |
| High School | 965 | 21.5% |
| College / Undergraduate | 1,074 | 24.0% |
| Graduate / Professional | 185 | 4.1% |
| Total | 4,478 | 100.0% |
School Enrollment by Age by Funding Source in Leland
Out of a total of 4,478 students who are enrolled in schools in Leland, 748 (16.7%) attend a private institution, while the remaining 3,730 (83.3%) are enrolled in public schools. The age group of 3 to 4 year olds has the highest likelihood of being enrolled in private schools, with 110 (60.4% in the age bracket) enrolled. Conversely, the age group of 18 to 19 year olds has the lowest likelihood of being enrolled in a private school, with 321 (100.0% in the age bracket) attending a public institution.
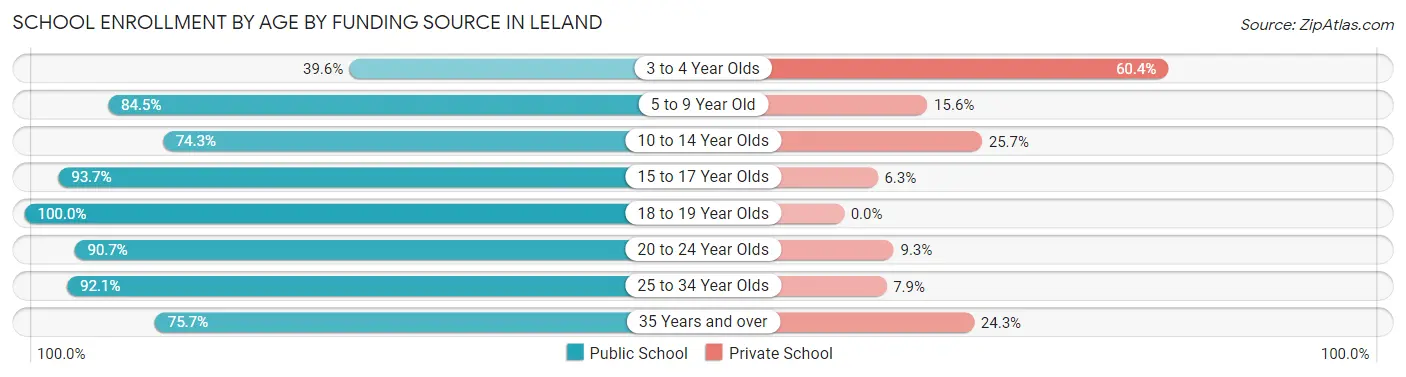
| Age Bracket | Public School | Private School |
| 3 to 4 Year Olds | 72 (39.6%) | 110 (60.4%) |
| 5 to 9 Year Old | 809 (84.5%) | 149 (15.5%) |
| 10 to 14 Year Olds | 935 (74.3%) | 324 (25.7%) |
| 15 to 17 Year Olds | 581 (93.7%) | 39 (6.3%) |
| 18 to 19 Year Olds | 321 (100.0%) | 0 (0.0%) |
| 20 to 24 Year Olds | 410 (90.7%) | 42 (9.3%) |
| 25 to 34 Year Olds | 476 (92.1%) | 41 (7.9%) |
| 35 Years and over | 128 (75.7%) | 41 (24.3%) |
| Total | 3,730 (83.3%) | 748 (16.7%) |
Educational Attainment by Field of Study in Leland
Business (1,616 | 20.3%), education (1,328 | 16.6%), arts & humanities (1,004 | 12.6%), science & technology (915 | 11.5%), and social sciences (594 | 7.4%) are the most common fields of study among 7,982 individuals in Leland who have obtained a bachelor's degree or higher.
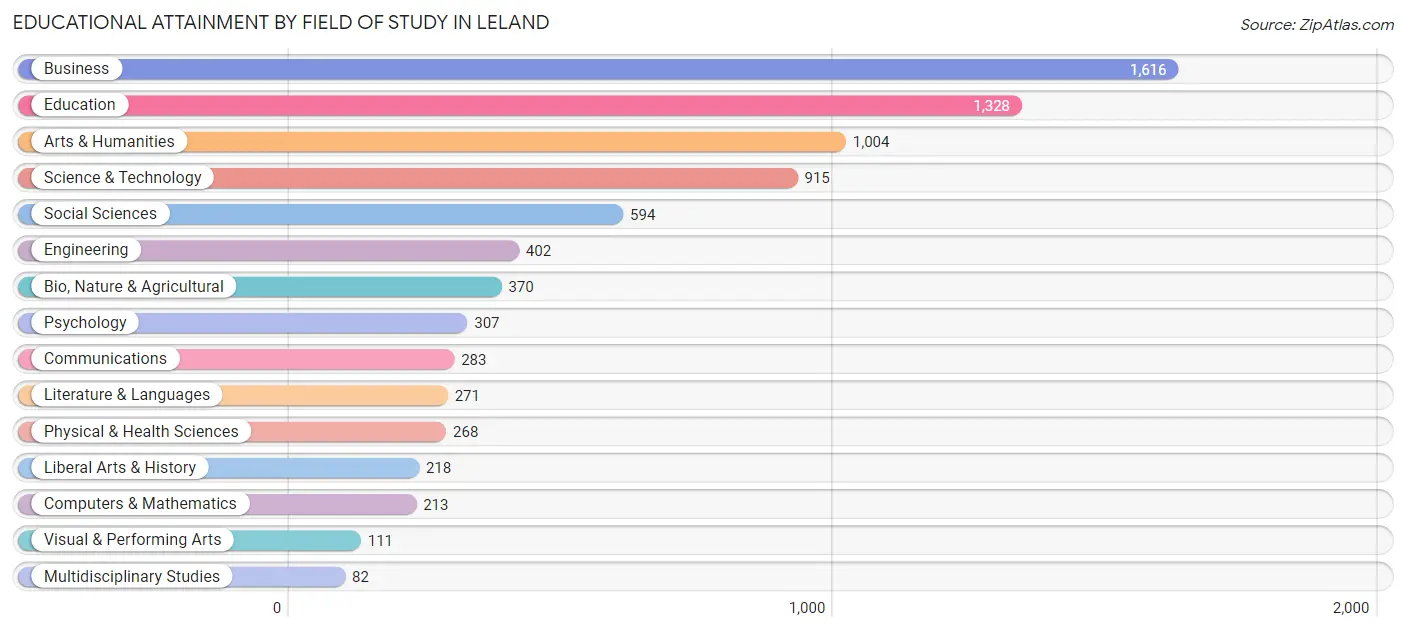
| Field of Study | # Graduates | % Graduates |
| Computers & Mathematics | 213 | 2.7% |
| Bio, Nature & Agricultural | 370 | 4.6% |
| Physical & Health Sciences | 268 | 3.4% |
| Psychology | 307 | 3.8% |
| Social Sciences | 594 | 7.4% |
| Engineering | 402 | 5.0% |
| Multidisciplinary Studies | 82 | 1.0% |
| Science & Technology | 915 | 11.5% |
| Business | 1,616 | 20.3% |
| Education | 1,328 | 16.6% |
| Literature & Languages | 271 | 3.4% |
| Liberal Arts & History | 218 | 2.7% |
| Visual & Performing Arts | 111 | 1.4% |
| Communications | 283 | 3.5% |
| Arts & Humanities | 1,004 | 12.6% |
| Total | 7,982 | 100.0% |
Transportation & Commute in Leland
Vehicle Availability by Sex in Leland
The most prevalent vehicle ownership categories in Leland are males with 2 vehicles (2,444, accounting for 45.4%) and females with 2 vehicles (1,996, making up 44.6%).
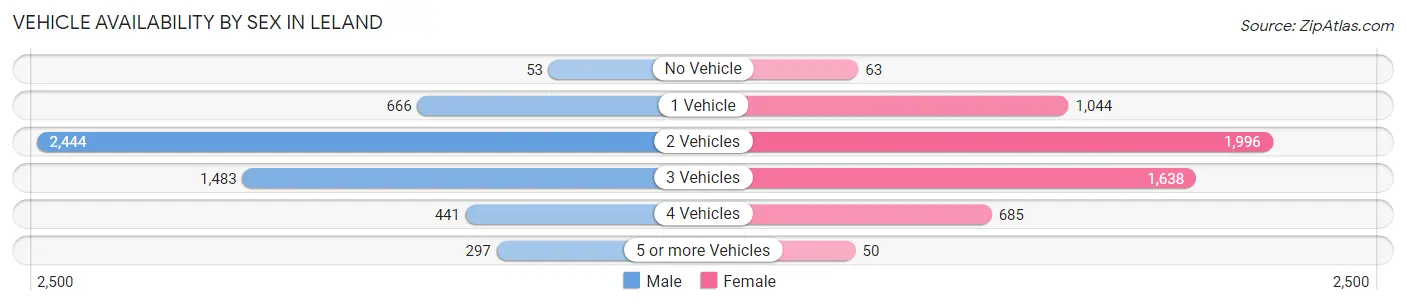
| Vehicles Available | Male | Female |
| No Vehicle | 53 (1.0%) | 63 (1.1%) |
| 1 Vehicle | 666 (12.4%) | 1,044 (19.1%) |
| 2 Vehicles | 2,444 (45.4%) | 1,996 (36.4%) |
| 3 Vehicles | 1,483 (27.5%) | 1,638 (29.9%) |
| 4 Vehicles | 441 (8.2%) | 685 (12.5%) |
| 5 or more Vehicles | 297 (5.5%) | 50 (0.9%) |
| Total | 5,384 (100.0%) | 5,476 (100.0%) |
Commute Time in Leland
The most frequently occuring commute durations in Leland are 30 to 34 minutes (2,063 commuters, 21.1%), 20 to 24 minutes (1,999 commuters, 20.4%), and 15 to 19 minutes (1,998 commuters, 20.4%).
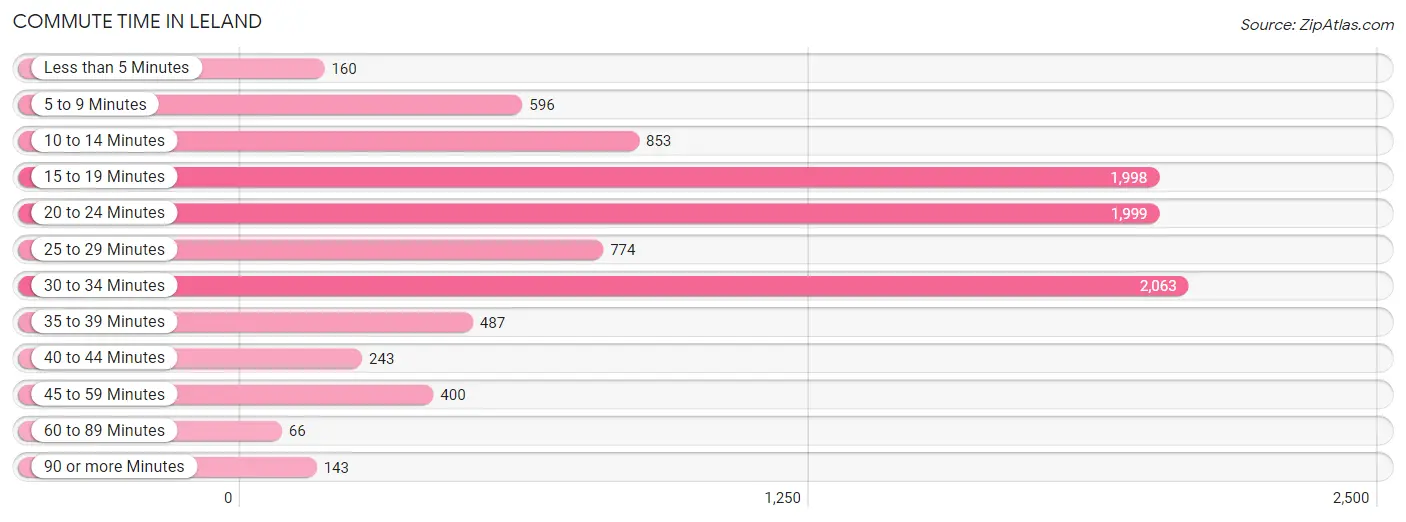
| Commute Time | # Commuters | % Commuters |
| Less than 5 Minutes | 160 | 1.6% |
| 5 to 9 Minutes | 596 | 6.1% |
| 10 to 14 Minutes | 853 | 8.7% |
| 15 to 19 Minutes | 1,998 | 20.4% |
| 20 to 24 Minutes | 1,999 | 20.4% |
| 25 to 29 Minutes | 774 | 7.9% |
| 30 to 34 Minutes | 2,063 | 21.1% |
| 35 to 39 Minutes | 487 | 5.0% |
| 40 to 44 Minutes | 243 | 2.5% |
| 45 to 59 Minutes | 400 | 4.1% |
| 60 to 89 Minutes | 66 | 0.7% |
| 90 or more Minutes | 143 | 1.5% |
Commute Time by Sex in Leland
The most common commute times in Leland are 30 to 34 minutes (1,143 commuters, 23.3%) for males and 20 to 24 minutes (1,078 commuters, 22.1%) for females.
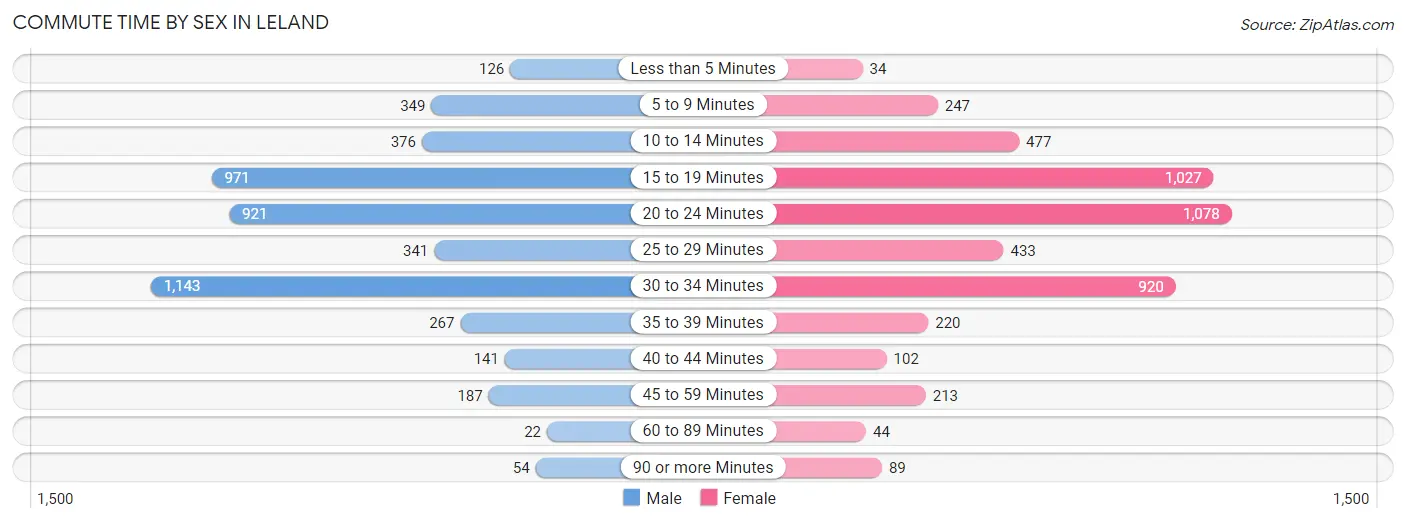
| Commute Time | Male | Female |
| Less than 5 Minutes | 126 (2.6%) | 34 (0.7%) |
| 5 to 9 Minutes | 349 (7.1%) | 247 (5.1%) |
| 10 to 14 Minutes | 376 (7.7%) | 477 (9.8%) |
| 15 to 19 Minutes | 971 (19.8%) | 1,027 (21.0%) |
| 20 to 24 Minutes | 921 (18.8%) | 1,078 (22.1%) |
| 25 to 29 Minutes | 341 (7.0%) | 433 (8.9%) |
| 30 to 34 Minutes | 1,143 (23.3%) | 920 (18.8%) |
| 35 to 39 Minutes | 267 (5.4%) | 220 (4.5%) |
| 40 to 44 Minutes | 141 (2.9%) | 102 (2.1%) |
| 45 to 59 Minutes | 187 (3.8%) | 213 (4.4%) |
| 60 to 89 Minutes | 22 (0.4%) | 44 (0.9%) |
| 90 or more Minutes | 54 (1.1%) | 89 (1.8%) |
Time of Departure to Work by Sex in Leland
The most frequent times of departure to work in Leland are 8:00 AM to 8:29 AM (775, 15.8%) for males and 7:00 AM to 7:29 AM (1,097, 22.5%) for females.
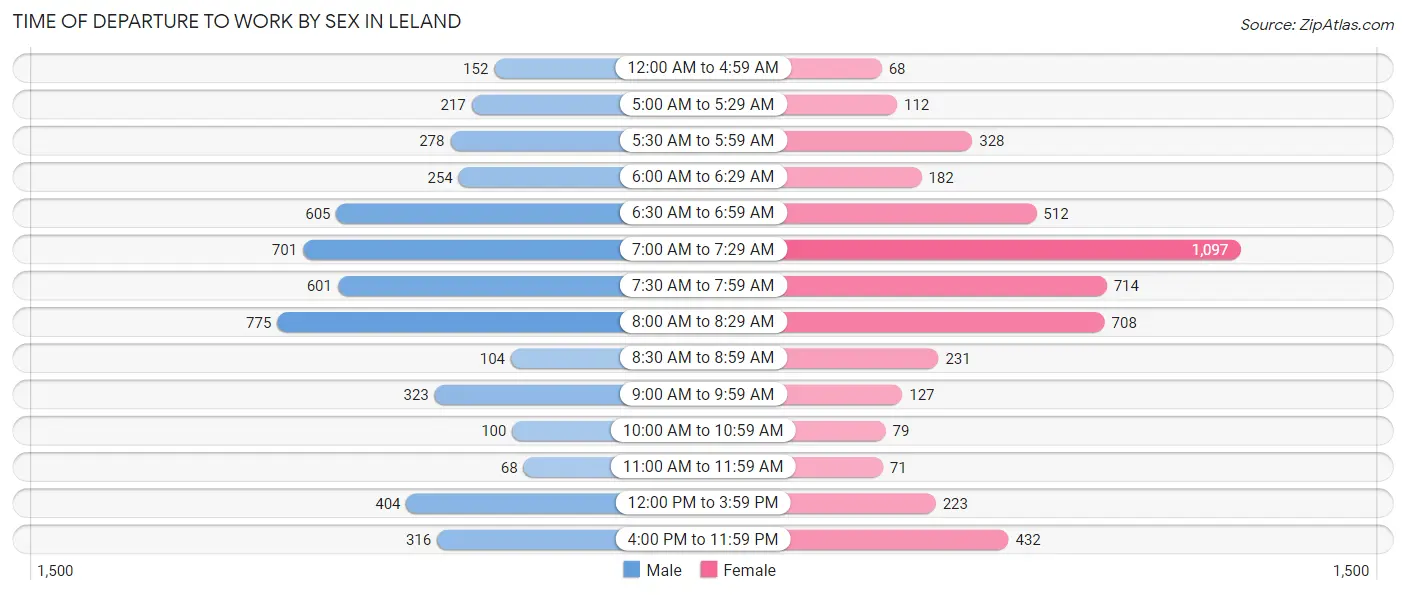
| Time of Departure | Male | Female |
| 12:00 AM to 4:59 AM | 152 (3.1%) | 68 (1.4%) |
| 5:00 AM to 5:29 AM | 217 (4.4%) | 112 (2.3%) |
| 5:30 AM to 5:59 AM | 278 (5.7%) | 328 (6.7%) |
| 6:00 AM to 6:29 AM | 254 (5.2%) | 182 (3.7%) |
| 6:30 AM to 6:59 AM | 605 (12.3%) | 512 (10.5%) |
| 7:00 AM to 7:29 AM | 701 (14.3%) | 1,097 (22.5%) |
| 7:30 AM to 7:59 AM | 601 (12.3%) | 714 (14.6%) |
| 8:00 AM to 8:29 AM | 775 (15.8%) | 708 (14.5%) |
| 8:30 AM to 8:59 AM | 104 (2.1%) | 231 (4.7%) |
| 9:00 AM to 9:59 AM | 323 (6.6%) | 127 (2.6%) |
| 10:00 AM to 10:59 AM | 100 (2.0%) | 79 (1.6%) |
| 11:00 AM to 11:59 AM | 68 (1.4%) | 71 (1.5%) |
| 12:00 PM to 3:59 PM | 404 (8.3%) | 223 (4.6%) |
| 4:00 PM to 11:59 PM | 316 (6.5%) | 432 (8.8%) |
| Total | 4,898 (100.0%) | 4,884 (100.0%) |
Housing Occupancy in Leland
Occupancy by Ownership in Leland
Of the total 10,423 dwellings in Leland, owner-occupied units account for 8,743 (83.9%), while renter-occupied units make up 1,680 (16.1%).
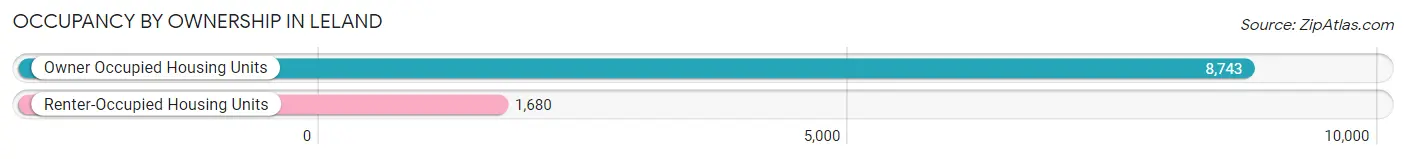
| Occupancy | # Housing Units | % Housing Units |
| Owner Occupied Housing Units | 8,743 | 83.9% |
| Renter-Occupied Housing Units | 1,680 | 16.1% |
| Total Occupied Housing Units | 10,423 | 100.0% |
Occupancy by Household Size in Leland
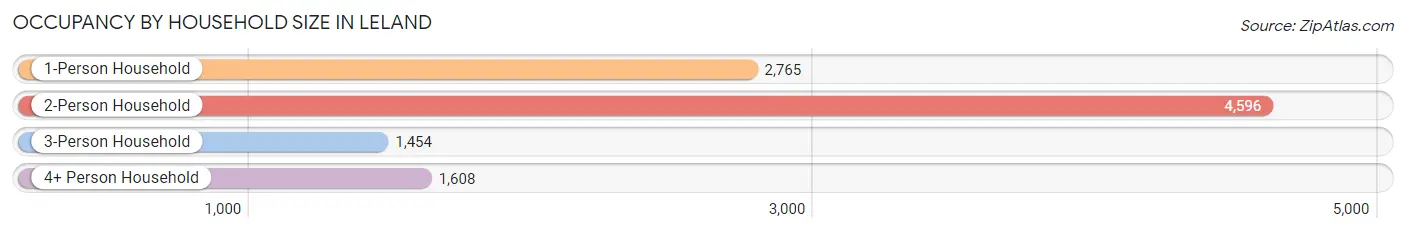
| Household Size | # Housing Units | % Housing Units |
| 1-Person Household | 2,765 | 26.5% |
| 2-Person Household | 4,596 | 44.1% |
| 3-Person Household | 1,454 | 14.0% |
| 4+ Person Household | 1,608 | 15.4% |
| Total Housing Units | 10,423 | 100.0% |
Occupancy by Ownership by Household Size in Leland
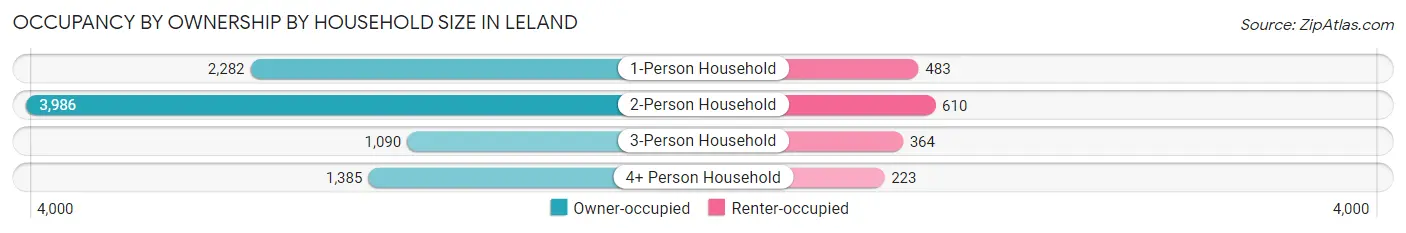
| Household Size | Owner-occupied | Renter-occupied |
| 1-Person Household | 2,282 (82.5%) | 483 (17.5%) |
| 2-Person Household | 3,986 (86.7%) | 610 (13.3%) |
| 3-Person Household | 1,090 (75.0%) | 364 (25.0%) |
| 4+ Person Household | 1,385 (86.1%) | 223 (13.9%) |
| Total Housing Units | 8,743 (83.9%) | 1,680 (16.1%) |
Occupancy by Educational Attainment in Leland
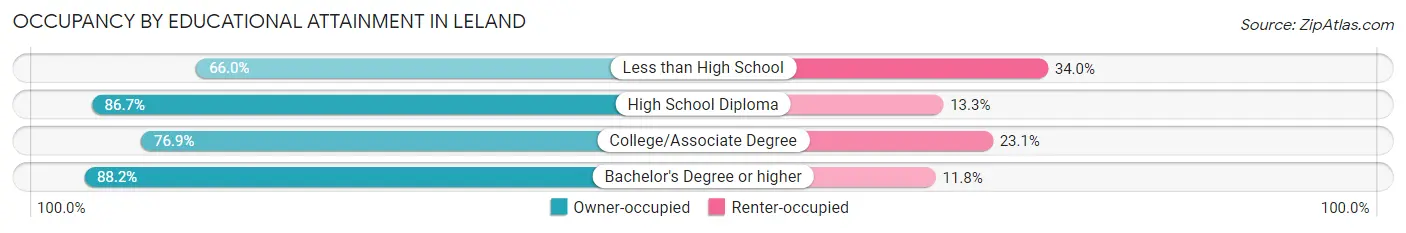
| Household Size | Owner-occupied | Renter-occupied |
| Less than High School | 126 (66.0%) | 65 (34.0%) |
| High School Diploma | 1,565 (86.7%) | 240 (13.3%) |
| College/Associate Degree | 2,600 (76.9%) | 781 (23.1%) |
| Bachelor's Degree or higher | 4,452 (88.2%) | 594 (11.8%) |
Occupancy by Age of Householder in Leland
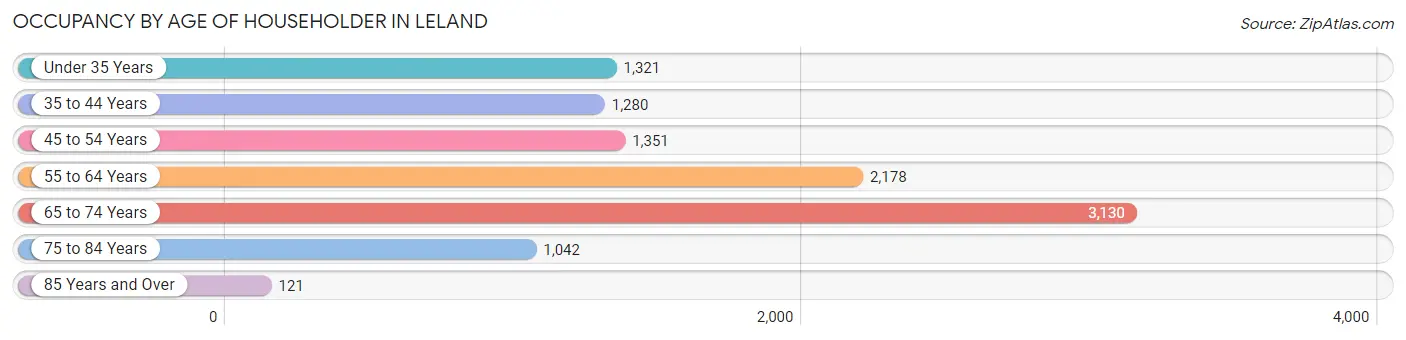
| Age Bracket | # Households | % Households |
| Under 35 Years | 1,321 | 12.7% |
| 35 to 44 Years | 1,280 | 12.3% |
| 45 to 54 Years | 1,351 | 13.0% |
| 55 to 64 Years | 2,178 | 20.9% |
| 65 to 74 Years | 3,130 | 30.0% |
| 75 to 84 Years | 1,042 | 10.0% |
| 85 Years and Over | 121 | 1.2% |
| Total | 10,423 | 100.0% |
Housing Finances in Leland
Median Income by Occupancy in Leland
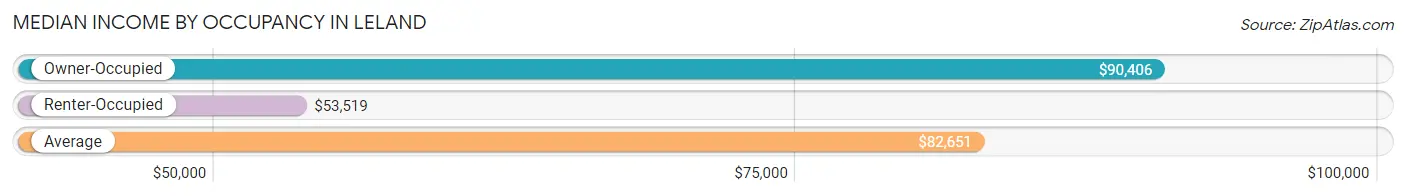
| Occupancy Type | # Households | Median Income |
| Owner-Occupied | 8,743 (83.9%) | $90,406 |
| Renter-Occupied | 1,680 (16.1%) | $53,519 |
| Average | 10,423 (100.0%) | $82,651 |
Occupancy by Householder Income Bracket in Leland
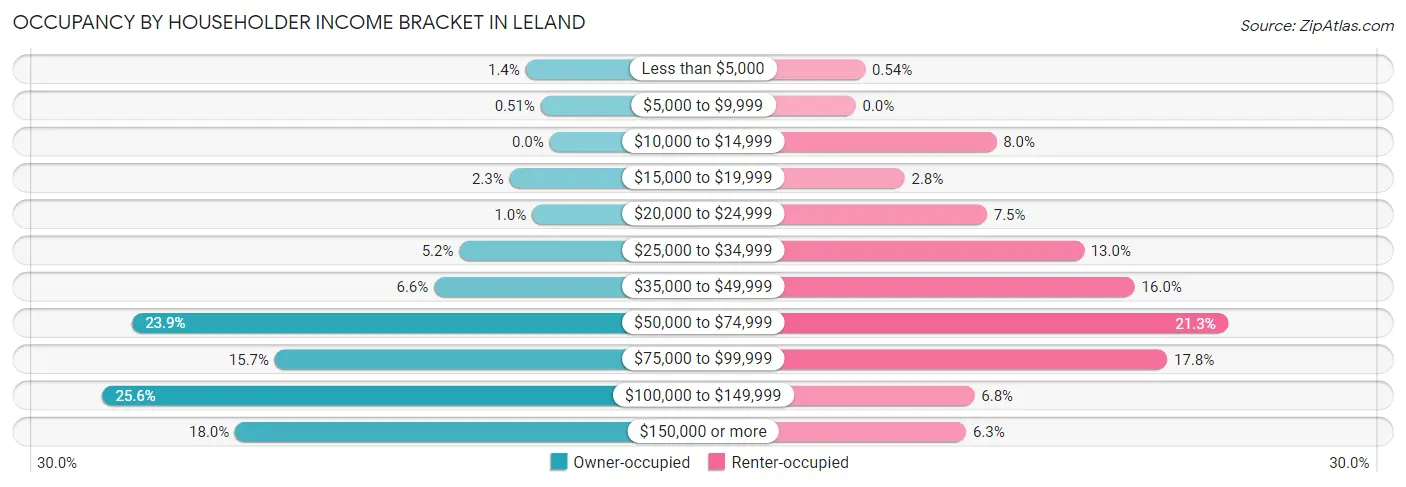
| Income Bracket | Owner-occupied | Renter-occupied |
| Less than $5,000 | 120 (1.4%) | 9 (0.5%) |
| $5,000 to $9,999 | 45 (0.5%) | 0 (0.0%) |
| $10,000 to $14,999 | 0 (0.0%) | 135 (8.0%) |
| $15,000 to $19,999 | 200 (2.3%) | 47 (2.8%) |
| $20,000 to $24,999 | 87 (1.0%) | 126 (7.5%) |
| $25,000 to $34,999 | 451 (5.2%) | 219 (13.0%) |
| $35,000 to $49,999 | 577 (6.6%) | 268 (16.0%) |
| $50,000 to $74,999 | 2,085 (23.8%) | 357 (21.2%) |
| $75,000 to $99,999 | 1,373 (15.7%) | 299 (17.8%) |
| $100,000 to $149,999 | 2,234 (25.6%) | 114 (6.8%) |
| $150,000 or more | 1,571 (18.0%) | 106 (6.3%) |
| Total | 8,743 (100.0%) | 1,680 (100.0%) |
Monthly Housing Cost Tiers in Leland
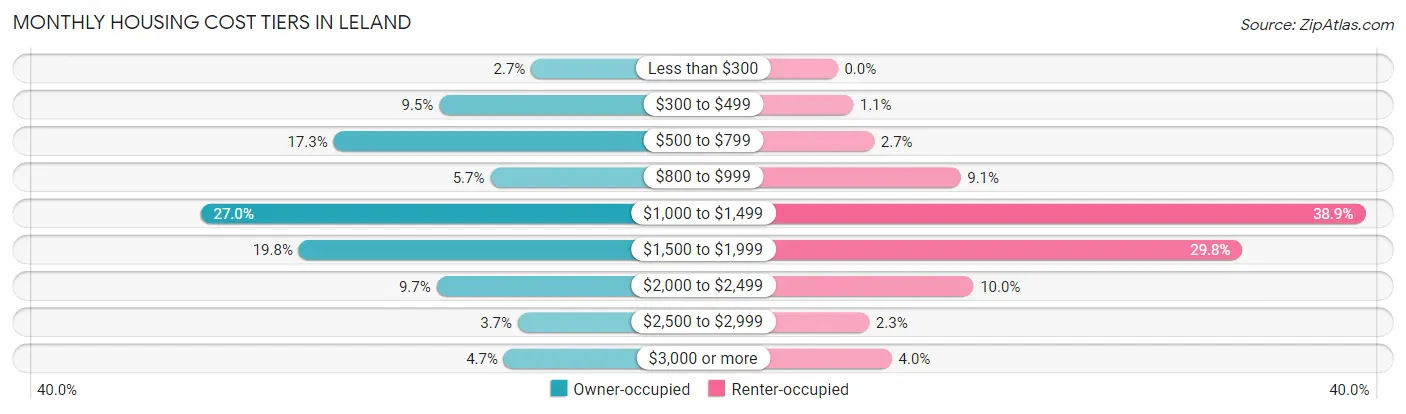
| Monthly Cost | Owner-occupied | Renter-occupied |
| Less than $300 | 235 (2.7%) | 0 (0.0%) |
| $300 to $499 | 828 (9.5%) | 19 (1.1%) |
| $500 to $799 | 1,508 (17.2%) | 45 (2.7%) |
| $800 to $999 | 498 (5.7%) | 152 (9.0%) |
| $1,000 to $1,499 | 2,364 (27.0%) | 653 (38.9%) |
| $1,500 to $1,999 | 1,732 (19.8%) | 501 (29.8%) |
| $2,000 to $2,499 | 845 (9.7%) | 168 (10.0%) |
| $2,500 to $2,999 | 321 (3.7%) | 39 (2.3%) |
| $3,000 or more | 412 (4.7%) | 67 (4.0%) |
| Total | 8,743 (100.0%) | 1,680 (100.0%) |
Physical Housing Characteristics in Leland
Housing Structures in Leland
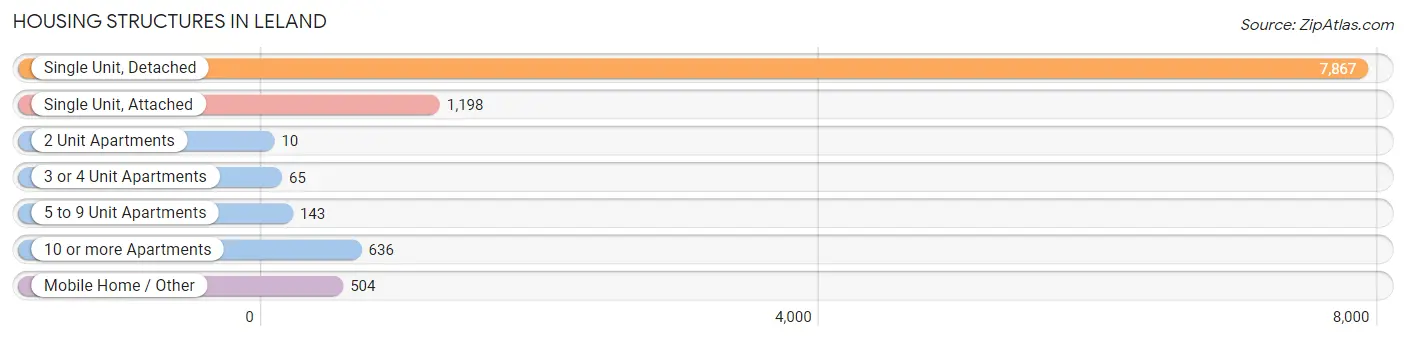
| Structure Type | # Housing Units | % Housing Units |
| Single Unit, Detached | 7,867 | 75.5% |
| Single Unit, Attached | 1,198 | 11.5% |
| 2 Unit Apartments | 10 | 0.1% |
| 3 or 4 Unit Apartments | 65 | 0.6% |
| 5 to 9 Unit Apartments | 143 | 1.4% |
| 10 or more Apartments | 636 | 6.1% |
| Mobile Home / Other | 504 | 4.8% |
| Total | 10,423 | 100.0% |
Housing Structures by Occupancy in Leland
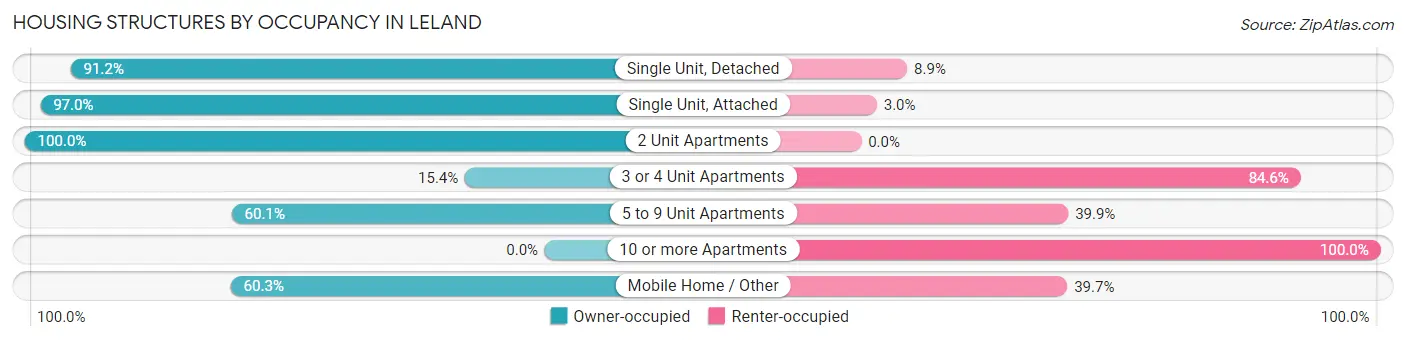
| Structure Type | Owner-occupied | Renter-occupied |
| Single Unit, Detached | 7,171 (91.1%) | 696 (8.8%) |
| Single Unit, Attached | 1,162 (97.0%) | 36 (3.0%) |
| 2 Unit Apartments | 10 (100.0%) | 0 (0.0%) |
| 3 or 4 Unit Apartments | 10 (15.4%) | 55 (84.6%) |
| 5 to 9 Unit Apartments | 86 (60.1%) | 57 (39.9%) |
| 10 or more Apartments | 0 (0.0%) | 636 (100.0%) |
| Mobile Home / Other | 304 (60.3%) | 200 (39.7%) |
| Total | 8,743 (83.9%) | 1,680 (16.1%) |
Housing Structures by Number of Rooms in Leland
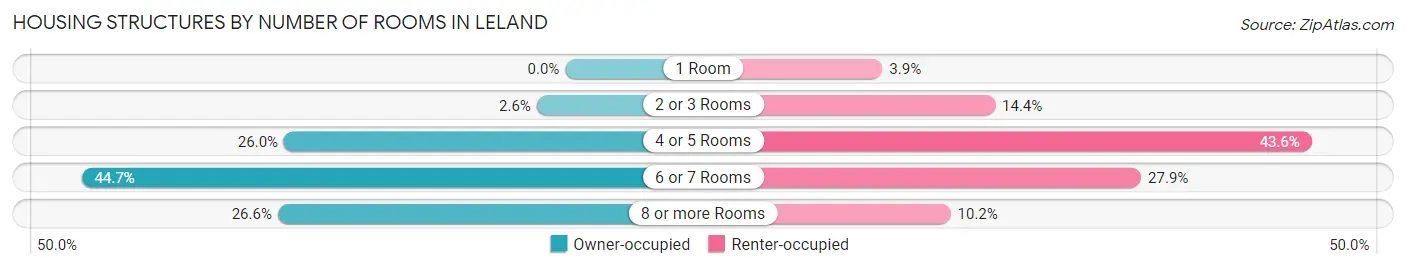
| Number of Rooms | Owner-occupied | Renter-occupied |
| 1 Room | 0 (0.0%) | 66 (3.9%) |
| 2 or 3 Rooms | 231 (2.6%) | 241 (14.3%) |
| 4 or 5 Rooms | 2,275 (26.0%) | 733 (43.6%) |
| 6 or 7 Rooms | 3,912 (44.7%) | 468 (27.9%) |
| 8 or more Rooms | 2,325 (26.6%) | 172 (10.2%) |
| Total | 8,743 (100.0%) | 1,680 (100.0%) |
Housing Structure by Heating Type in Leland
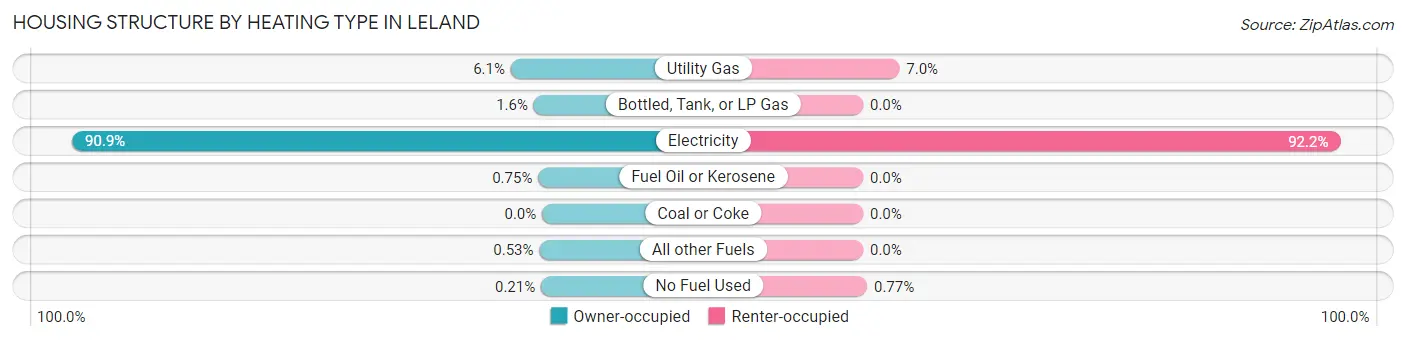
| Heating Type | Owner-occupied | Renter-occupied |
| Utility Gas | 529 (6.0%) | 118 (7.0%) |
| Bottled, Tank, or LP Gas | 141 (1.6%) | 0 (0.0%) |
| Electricity | 7,943 (90.8%) | 1,549 (92.2%) |
| Fuel Oil or Kerosene | 66 (0.7%) | 0 (0.0%) |
| Coal or Coke | 0 (0.0%) | 0 (0.0%) |
| All other Fuels | 46 (0.5%) | 0 (0.0%) |
| No Fuel Used | 18 (0.2%) | 13 (0.8%) |
| Total | 8,743 (100.0%) | 1,680 (100.0%) |
Household Vehicle Usage in Leland
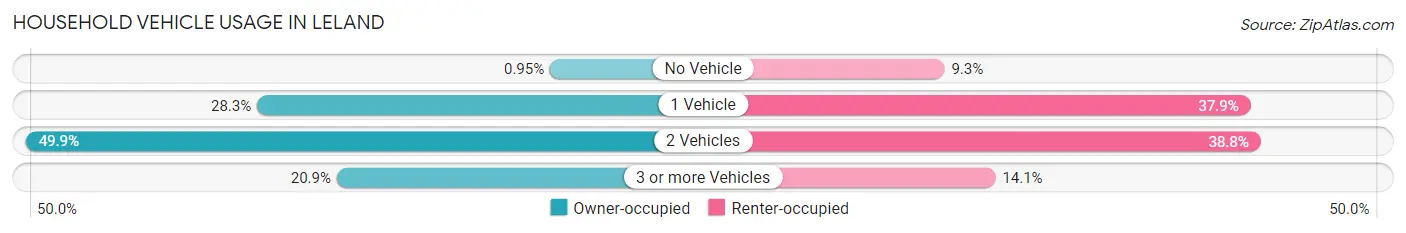
| Vehicles per Household | Owner-occupied | Renter-occupied |
| No Vehicle | 83 (0.9%) | 156 (9.3%) |
| 1 Vehicle | 2,474 (28.3%) | 636 (37.9%) |
| 2 Vehicles | 4,362 (49.9%) | 652 (38.8%) |
| 3 or more Vehicles | 1,824 (20.9%) | 236 (14.1%) |
| Total | 8,743 (100.0%) | 1,680 (100.0%) |
Real Estate & Mortgages in Leland
Real Estate and Mortgage Overview in Leland
| Characteristic | Without Mortgage | With Mortgage |
| Housing Units | 2,678 | 6,065 |
| Median Property Value | $355,900 | $307,900 |
| Median Household Income | $77,238 | $1,164 |
| Monthly Housing Costs | $554 | $412 |
| Real Estate Taxes | $2,193 | $84 |
Property Value by Mortgage Status in Leland
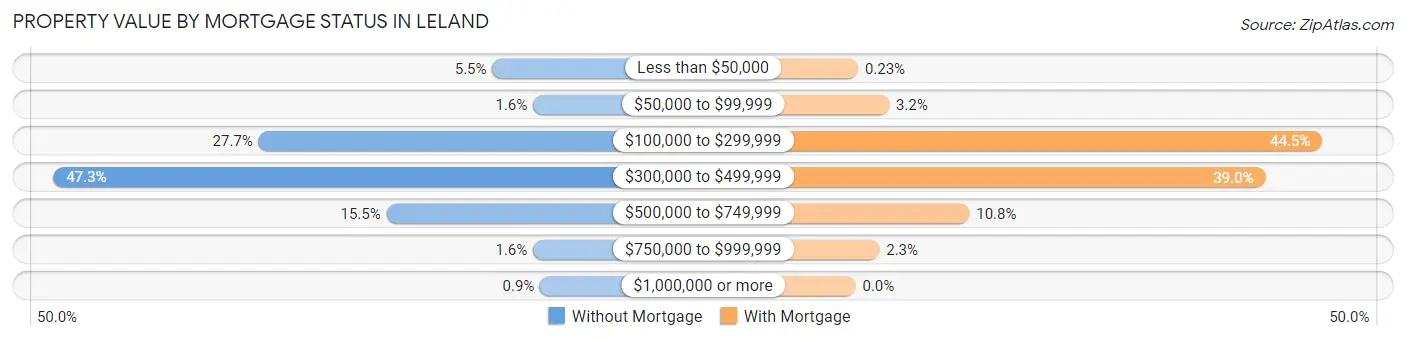
| Property Value | Without Mortgage | With Mortgage |
| Less than $50,000 | 146 (5.4%) | 14 (0.2%) |
| $50,000 to $99,999 | 42 (1.6%) | 193 (3.2%) |
| $100,000 to $299,999 | 742 (27.7%) | 2,696 (44.5%) |
| $300,000 to $499,999 | 1,266 (47.3%) | 2,368 (39.0%) |
| $500,000 to $749,999 | 416 (15.5%) | 657 (10.8%) |
| $750,000 to $999,999 | 42 (1.6%) | 137 (2.3%) |
| $1,000,000 or more | 24 (0.9%) | 0 (0.0%) |
| Total | 2,678 (100.0%) | 6,065 (100.0%) |
Household Income by Mortgage Status in Leland
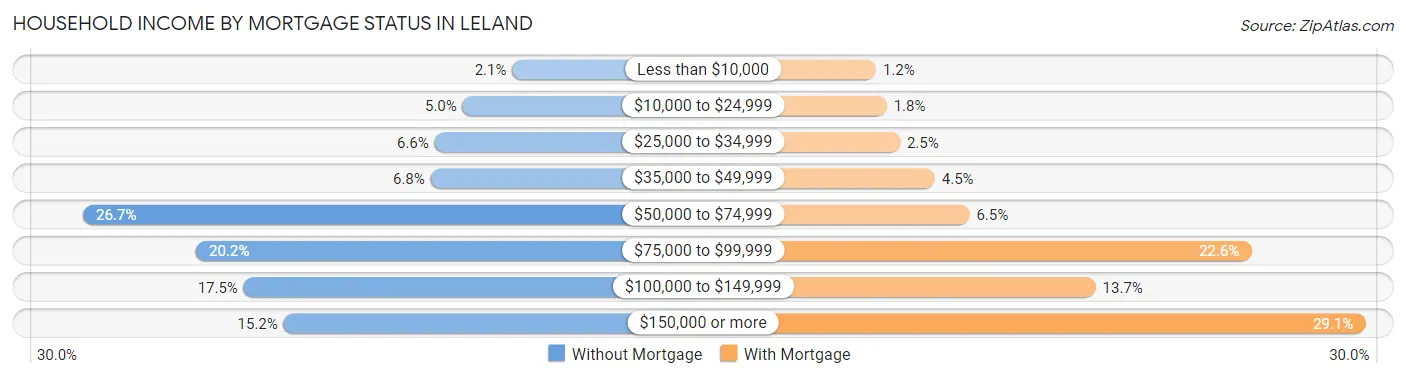
| Household Income | Without Mortgage | With Mortgage |
| Less than $10,000 | 57 (2.1%) | 71 (1.2%) |
| $10,000 to $24,999 | 133 (5.0%) | 108 (1.8%) |
| $25,000 to $34,999 | 176 (6.6%) | 154 (2.5%) |
| $35,000 to $49,999 | 182 (6.8%) | 275 (4.5%) |
| $50,000 to $74,999 | 714 (26.7%) | 395 (6.5%) |
| $75,000 to $99,999 | 541 (20.2%) | 1,371 (22.6%) |
| $100,000 to $149,999 | 468 (17.5%) | 832 (13.7%) |
| $150,000 or more | 407 (15.2%) | 1,766 (29.1%) |
| Total | 2,678 (100.0%) | 6,065 (100.0%) |
Property Value to Household Income Ratio in Leland
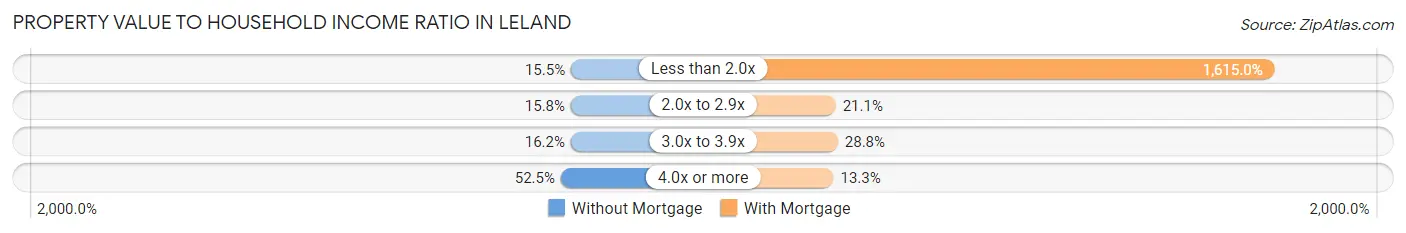
| Value-to-Income Ratio | Without Mortgage | With Mortgage |
| Less than 2.0x | 414 (15.5%) | 97,950 (1,615.0%) |
| 2.0x to 2.9x | 424 (15.8%) | 1,279 (21.1%) |
| 3.0x to 3.9x | 434 (16.2%) | 1,745 (28.8%) |
| 4.0x or more | 1,406 (52.5%) | 806 (13.3%) |
| Total | 2,678 (100.0%) | 6,065 (100.0%) |
Real Estate Taxes by Mortgage Status in Leland
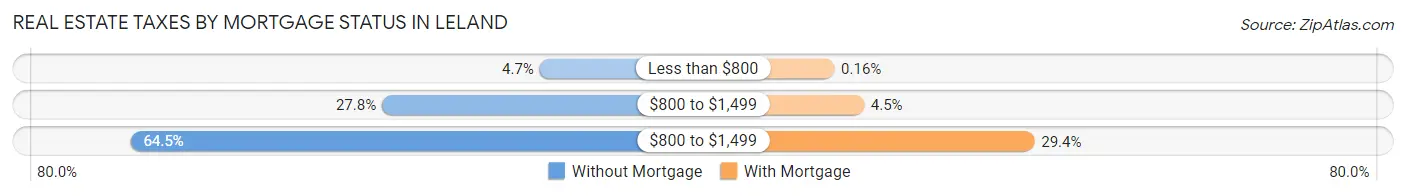
| Property Taxes | Without Mortgage | With Mortgage |
| Less than $800 | 127 (4.7%) | 10 (0.2%) |
| $800 to $1,499 | 744 (27.8%) | 273 (4.5%) |
| $800 to $1,499 | 1,728 (64.5%) | 1,784 (29.4%) |
| Total | 2,678 (100.0%) | 6,065 (100.0%) |
Health & Disability in Leland
Health Insurance Coverage by Age in Leland
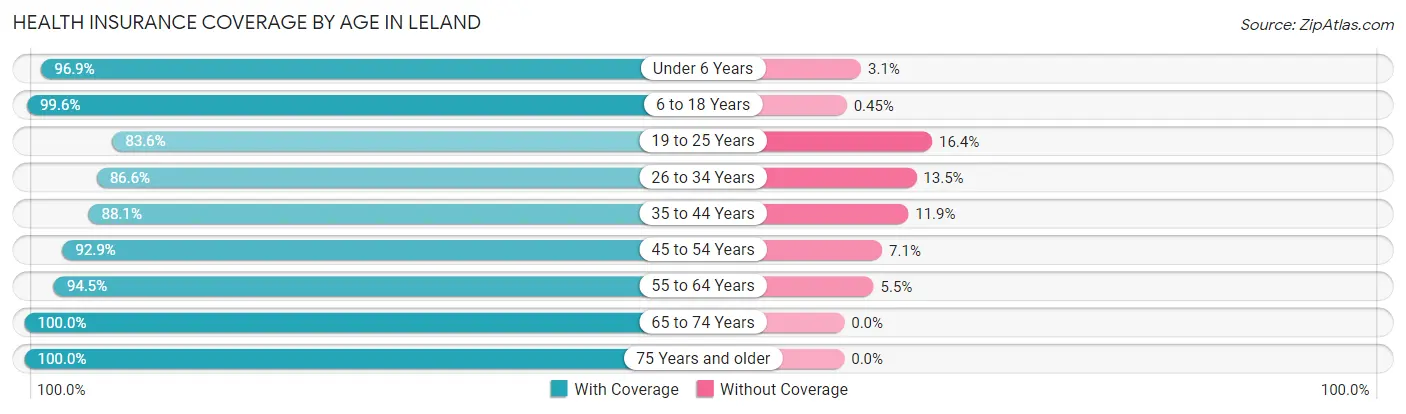
| Age Bracket | With Coverage | Without Coverage |
| Under 6 Years | 1,363 (96.9%) | 44 (3.1%) |
| 6 to 18 Years | 2,889 (99.6%) | 13 (0.4%) |
| 19 to 25 Years | 1,221 (83.6%) | 239 (16.4%) |
| 26 to 34 Years | 2,515 (86.6%) | 391 (13.5%) |
| 35 to 44 Years | 2,421 (88.1%) | 328 (11.9%) |
| 45 to 54 Years | 2,368 (92.9%) | 180 (7.1%) |
| 55 to 64 Years | 3,394 (94.5%) | 196 (5.5%) |
| 65 to 74 Years | 4,918 (100.0%) | 0 (0.0%) |
| 75 Years and older | 1,971 (100.0%) | 0 (0.0%) |
| Total | 23,060 (94.3%) | 1,391 (5.7%) |
Health Insurance Coverage by Citizenship Status in Leland
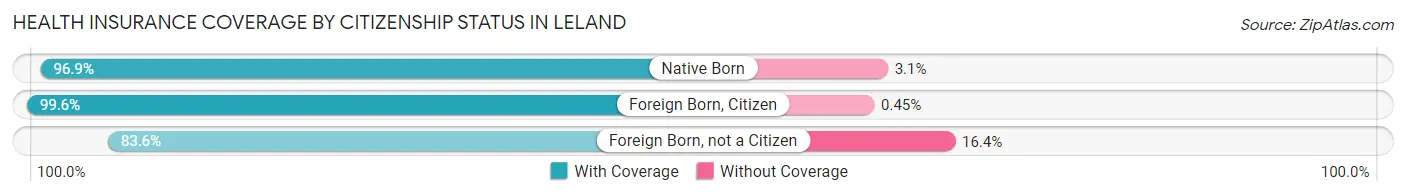
| Citizenship Status | With Coverage | Without Coverage |
| Native Born | 1,363 (96.9%) | 44 (3.1%) |
| Foreign Born, Citizen | 2,889 (99.6%) | 13 (0.4%) |
| Foreign Born, not a Citizen | 1,221 (83.6%) | 239 (16.4%) |
Health Insurance Coverage by Household Income in Leland
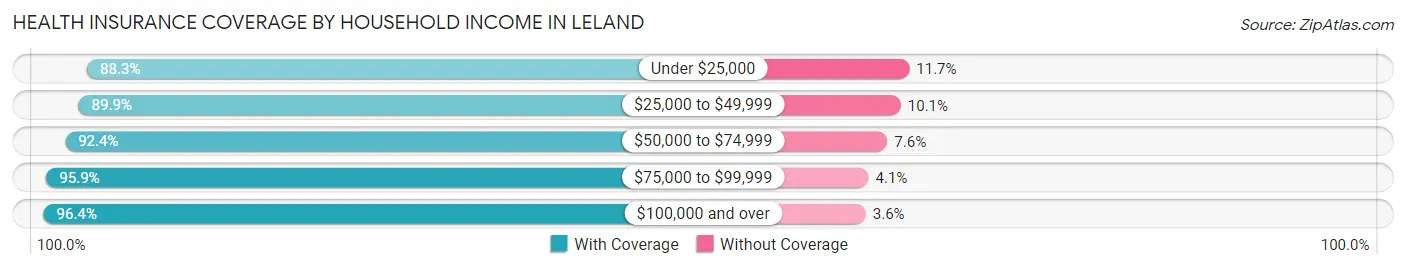
| Household Income | With Coverage | Without Coverage |
| Under $25,000 | 1,024 (88.3%) | 136 (11.7%) |
| $25,000 to $49,999 | 2,838 (89.9%) | 320 (10.1%) |
| $50,000 to $74,999 | 4,465 (92.4%) | 368 (7.6%) |
| $75,000 to $99,999 | 3,803 (95.9%) | 162 (4.1%) |
| $100,000 and over | 10,930 (96.4%) | 405 (3.6%) |
Public vs Private Health Insurance Coverage by Age in Leland
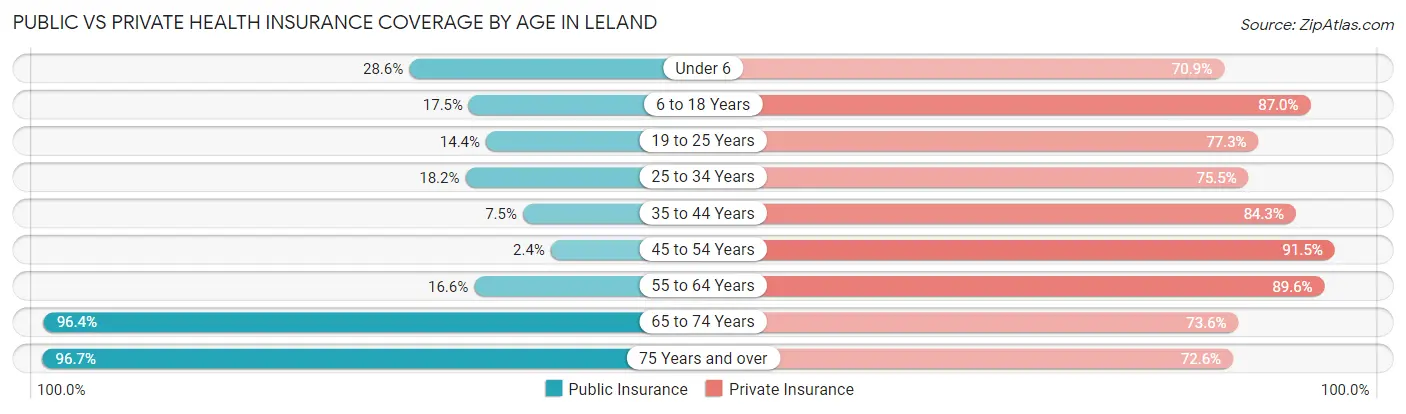
| Age Bracket | Public Insurance | Private Insurance |
| Under 6 | 403 (28.6%) | 998 (70.9%) |
| 6 to 18 Years | 509 (17.5%) | 2,524 (87.0%) |
| 19 to 25 Years | 210 (14.4%) | 1,129 (77.3%) |
| 25 to 34 Years | 529 (18.2%) | 2,194 (75.5%) |
| 35 to 44 Years | 207 (7.5%) | 2,316 (84.3%) |
| 45 to 54 Years | 60 (2.4%) | 2,331 (91.5%) |
| 55 to 64 Years | 595 (16.6%) | 3,216 (89.6%) |
| 65 to 74 Years | 4,743 (96.4%) | 3,620 (73.6%) |
| 75 Years and over | 1,905 (96.7%) | 1,431 (72.6%) |
| Total | 9,161 (37.5%) | 19,759 (80.8%) |
Disability Status by Sex by Age in Leland
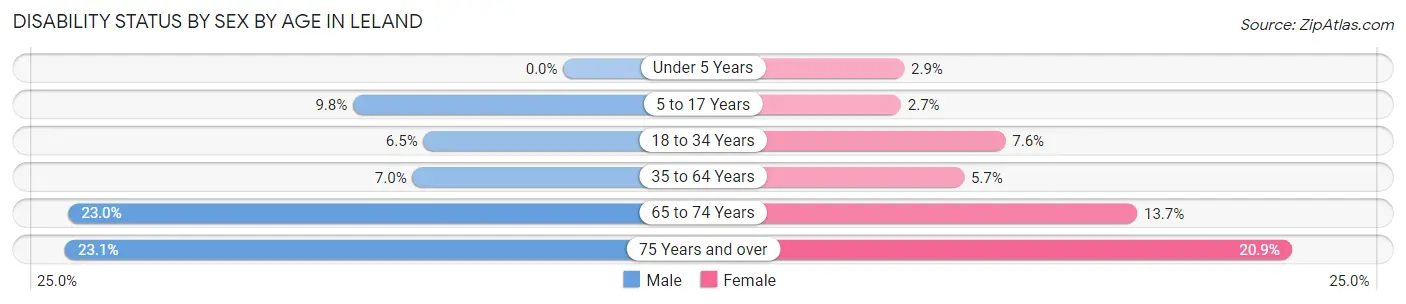
| Age Bracket | Male | Female |
| Under 5 Years | 0 (0.0%) | 14 (2.9%) |
| 5 to 17 Years | 146 (9.8%) | 40 (2.7%) |
| 18 to 34 Years | 151 (6.5%) | 166 (7.6%) |
| 35 to 64 Years | 291 (7.0%) | 268 (5.7%) |
| 65 to 74 Years | 553 (23.0%) | 344 (13.7%) |
| 75 Years and over | 222 (23.1%) | 211 (20.9%) |
Disability Class by Sex by Age in Leland
Disability Class: Hearing Difficulty
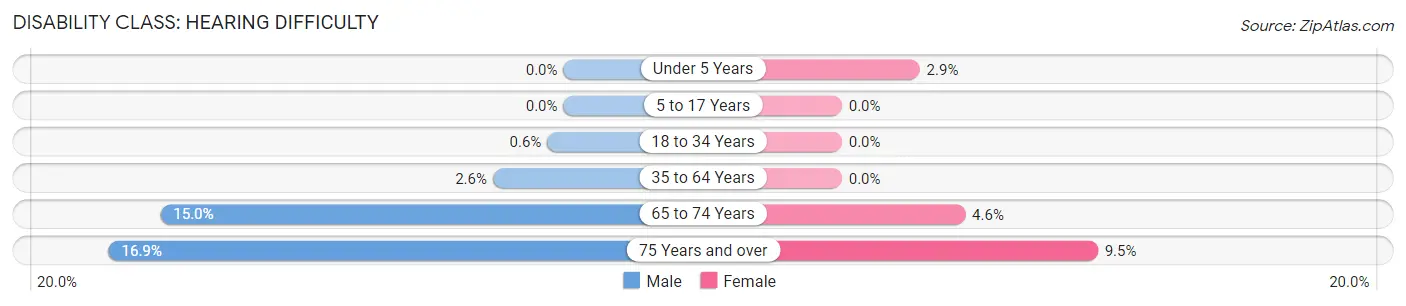
| Age Bracket | Male | Female |
| Under 5 Years | 0 (0.0%) | 14 (2.9%) |
| 5 to 17 Years | 0 (0.0%) | 0 (0.0%) |
| 18 to 34 Years | 14 (0.6%) | 0 (0.0%) |
| 35 to 64 Years | 109 (2.6%) | 0 (0.0%) |
| 65 to 74 Years | 360 (15.0%) | 115 (4.6%) |
| 75 Years and over | 162 (16.9%) | 96 (9.5%) |
Disability Class: Vision Difficulty
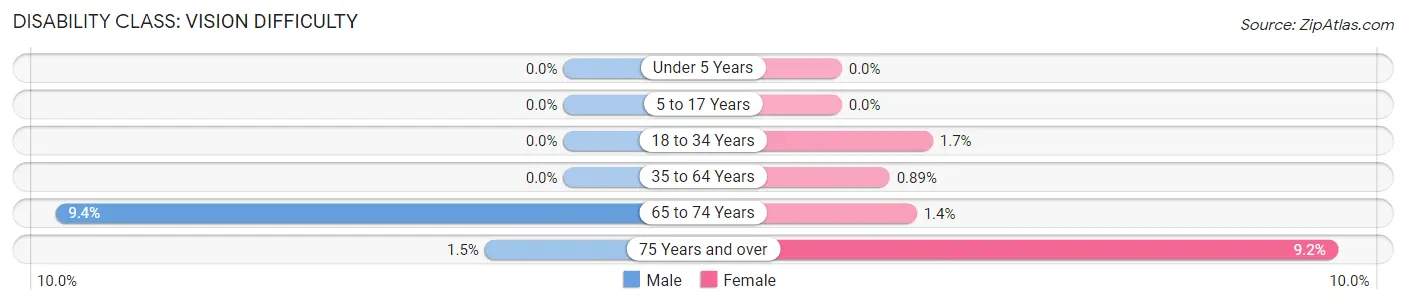
| Age Bracket | Male | Female |
| Under 5 Years | 0 (0.0%) | 0 (0.0%) |
| 5 to 17 Years | 0 (0.0%) | 0 (0.0%) |
| 18 to 34 Years | 0 (0.0%) | 37 (1.7%) |
| 35 to 64 Years | 0 (0.0%) | 42 (0.9%) |
| 65 to 74 Years | 227 (9.4%) | 35 (1.4%) |
| 75 Years and over | 14 (1.5%) | 93 (9.2%) |
Disability Class: Cognitive Difficulty
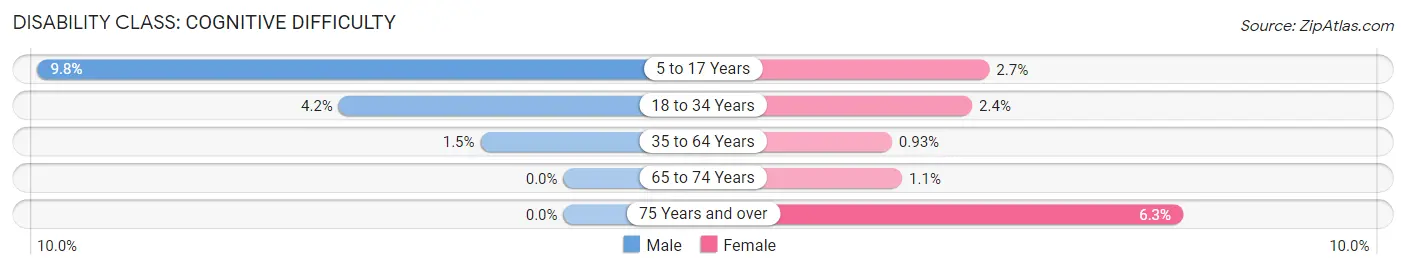
| Age Bracket | Male | Female |
| 5 to 17 Years | 146 (9.8%) | 40 (2.7%) |
| 18 to 34 Years | 97 (4.2%) | 53 (2.4%) |
| 35 to 64 Years | 64 (1.5%) | 44 (0.9%) |
| 65 to 74 Years | 0 (0.0%) | 28 (1.1%) |
| 75 Years and over | 0 (0.0%) | 64 (6.3%) |
Disability Class: Ambulatory Difficulty
| Age Bracket | Male | Female |
| 5 to 17 Years | 0 (0.0%) | 0 (0.0%) |
| 18 to 34 Years | 15 (0.6%) | 76 (3.5%) |
| 35 to 64 Years | 184 (4.4%) | 172 (3.6%) |
| 65 to 74 Years | 315 (13.1%) | 203 (8.1%) |
| 75 Years and over | 61 (6.4%) | 108 (10.7%) |
Disability Class: Self-Care Difficulty
| Age Bracket | Male | Female |
| 5 to 17 Years | 13 (0.9%) | 20 (1.4%) |
| 18 to 34 Years | 40 (1.7%) | 49 (2.2%) |
| 35 to 64 Years | 31 (0.7%) | 0 (0.0%) |
| 65 to 74 Years | 24 (1.0%) | 15 (0.6%) |
| 75 Years and over | 35 (3.6%) | 38 (3.8%) |
Technology Access in Leland
Computing Device Access in Leland
| Device Type | # Households | % Households |
| Desktop or Laptop | 9,396 | 90.1% |
| Smartphone | 9,665 | 92.7% |
| Tablet | 7,900 | 75.8% |
| No Computing Device | 77 | 0.7% |
| Total | 10,423 | 100.0% |
Internet Access in Leland
| Internet Type | # Households | % Households |
| Dial-Up Internet | 0 | 0.0% |
| Broadband Home | 9,423 | 90.4% |
| Cellular Data Only | 648 | 6.2% |
| Satellite Internet | 459 | 4.4% |
| No Internet | 257 | 2.5% |
| Total | 10,423 | 100.0% |
Leland Summary
Leland, North Carolina is a small town located in Brunswick County, North Carolina. It is situated on the banks of the Cape Fear River, approximately 20 miles north of Wilmington. The town was founded in 1887 and has a population of approximately 15,000 people.
Geography
Leland is located in the southeastern corner of North Carolina, in Brunswick County. It is situated on the banks of the Cape Fear River, approximately 20 miles north of Wilmington. The town is bordered by the towns of Belville, Navassa, and Winnabow. The town is located in the Coastal Plain region of North Carolina, and is characterized by flat terrain and sandy soils. The climate is humid subtropical, with hot, humid summers and mild winters.
Economy
Leland’s economy is largely based on tourism and manufacturing. The town is home to several large manufacturing companies, including Corning, Inc., which produces glass products, and Brunswick County Industries, which produces furniture and other wood products. The town is also home to several small businesses, including restaurants, retail stores, and service providers. Tourism is also an important part of the local economy, with visitors coming to the area to enjoy the beaches, fishing, and other outdoor activities.
Demographics
As of the 2010 census, the population of Leland was 15,068. The racial makeup of the town was 79.3% White, 14.2% African American, 0.7% Native American, 1.3% Asian, 0.1% Pacific Islander, and 4.4% from other races. The median household income was $41,945, and the median family income was $50,945. The per capita income was $20,945.
History
Leland was founded in 1887 by a group of settlers from the nearby town of Winnabow. The town was named after the Leland family, who were among the first settlers. The town grew quickly, and by the early 1900s, it had become a thriving community. The town was home to several businesses, including a sawmill, a grist mill, and a cotton gin. In the 1920s, the town was connected to the rest of the state by the Atlantic Coast Line Railroad.
In the 1950s, the town began to experience a period of growth and development. Several new businesses were established, and the town’s population increased. In the 1970s, the town was incorporated, and in the 1980s, the town began to experience a period of rapid growth. This growth was largely due to the influx of new residents from nearby Wilmington.
Today, Leland is a thriving community with a strong economy and a diverse population. The town is home to several businesses, including manufacturing companies, restaurants, retail stores, and service providers. The town is also home to several parks and recreational facilities, and is a popular destination for tourists.
Common Questions
What is Per Capita Income in Leland?
Per Capita income in Leland is $44,407.
What is the Median Family Income in Leland?
Median Family Income in Leland is $97,806.
What is the Median Household income in Leland?
Median Household Income in Leland is $82,651.
What is Income or Wage Gap in Leland?
Income or Wage Gap in Leland is 16.9%.
Women in Leland earn 83.1 cents for every dollar earned by a man.
What is Family Income Deficit in Leland?
Family Income Deficit in Leland is $8,505.
Families that are below poverty line in Leland earn $8,505 less on average than the poverty threshold level.
What is Inequality or Gini Index in Leland?
Inequality or Gini Index in Leland is 0.38.
What is the Total Population of Leland?
Total Population of Leland is 24,473.
What is the Total Male Population of Leland?
Total Male Population of Leland is 12,090.
What is the Total Female Population of Leland?
Total Female Population of Leland is 12,383.
What is the Ratio of Males per 100 Females in Leland?
There are 97.63 Males per 100 Females in Leland.
What is the Ratio of Females per 100 Males in Leland?
There are 102.42 Females per 100 Males in Leland.
What is the Median Population Age in Leland?
Median Population Age in Leland is 47.1 Years.
What is the Average Family Size in Leland
Average Family Size in Leland is 2.8 People.
What is the Average Household Size in Leland
Average Household Size in Leland is 2.4 People.
How Large is the Labor Force in Leland?
There are 11,410 People in the Labor Forcein in Leland.
What is the Percentage of People in the Labor Force in Leland?
54.8% of People are in the Labor Force in Leland.
What is the Unemployment Rate in Leland?
Unemployment Rate in Leland is 3.8%.