Fairfield Harbour, NC Map & Demographics
Fairfield Harbour Map
Fairfield Harbour Overview
$40,064
PER CAPITA INCOME
$74,922
AVG FAMILY INCOME
$68,723
AVG HOUSEHOLD INCOME
43.1%
WAGE / INCOME GAP [ % ]
56.9¢/ $1
WAGE / INCOME GAP [ $ ]
0.38
INEQUALITY / GINI INDEX
2,816
TOTAL POPULATION
1,222
MALE POPULATION
1,594
FEMALE POPULATION
76.66
MALES / 100 FEMALES
130.44
FEMALES / 100 MALES
64.0
MEDIAN AGE
2.3
AVG FAMILY SIZE
2.1
AVG HOUSEHOLD SIZE
935
LABOR FORCE [ PEOPLE ]
35.1%
PERCENT IN LABOR FORCE
9.4%
UNEMPLOYMENT RATE
Income in Fairfield Harbour
Income Overview in Fairfield Harbour
Per Capita Income in Fairfield Harbour is $40,064, while median incomes of families and households are $74,922 and $68,723 respectively.
| Characteristic | Number | Measure |
| Per Capita Income | 2,816 | $40,064 |
| Median Family Income | 997 | $74,922 |
| Mean Family Income | 997 | $94,497 |
| Median Household Income | 1,318 | $68,723 |
| Mean Household Income | 1,318 | $84,232 |
| Income Deficit | 997 | $0 |
| Wage / Income Gap (%) | 2,816 | 43.15% |
| Wage / Income Gap ($) | 2,816 | 56.85¢ per $1 |
| Gini / Inequality Index | 2,816 | 0.38 |
Earnings by Sex in Fairfield Harbour
Average Earnings in Fairfield Harbour are $33,510, $57,556 for men and $32,721 for women, a difference of 43.1%.
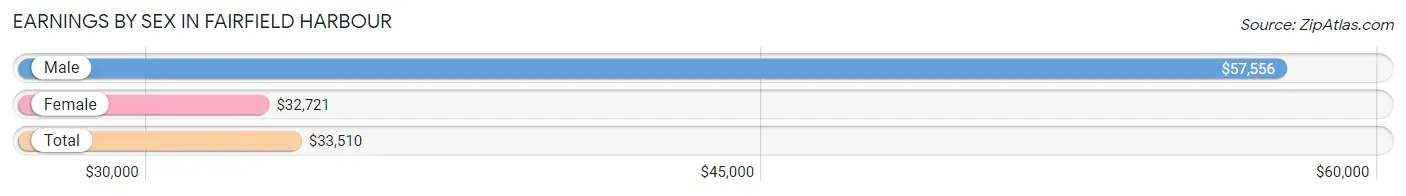
| Sex | Number | Average Earnings |
| Male | 442 (41.5%) | $57,556 |
| Female | 623 (58.5%) | $32,721 |
| Total | 1,065 (100.0%) | $33,510 |
Earnings by Sex by Income Bracket in Fairfield Harbour
The most common earnings brackets in Fairfield Harbour are $100,000+ for men (88 | 19.9%) and $30,000 to $34,999 for women (130 | 20.9%).
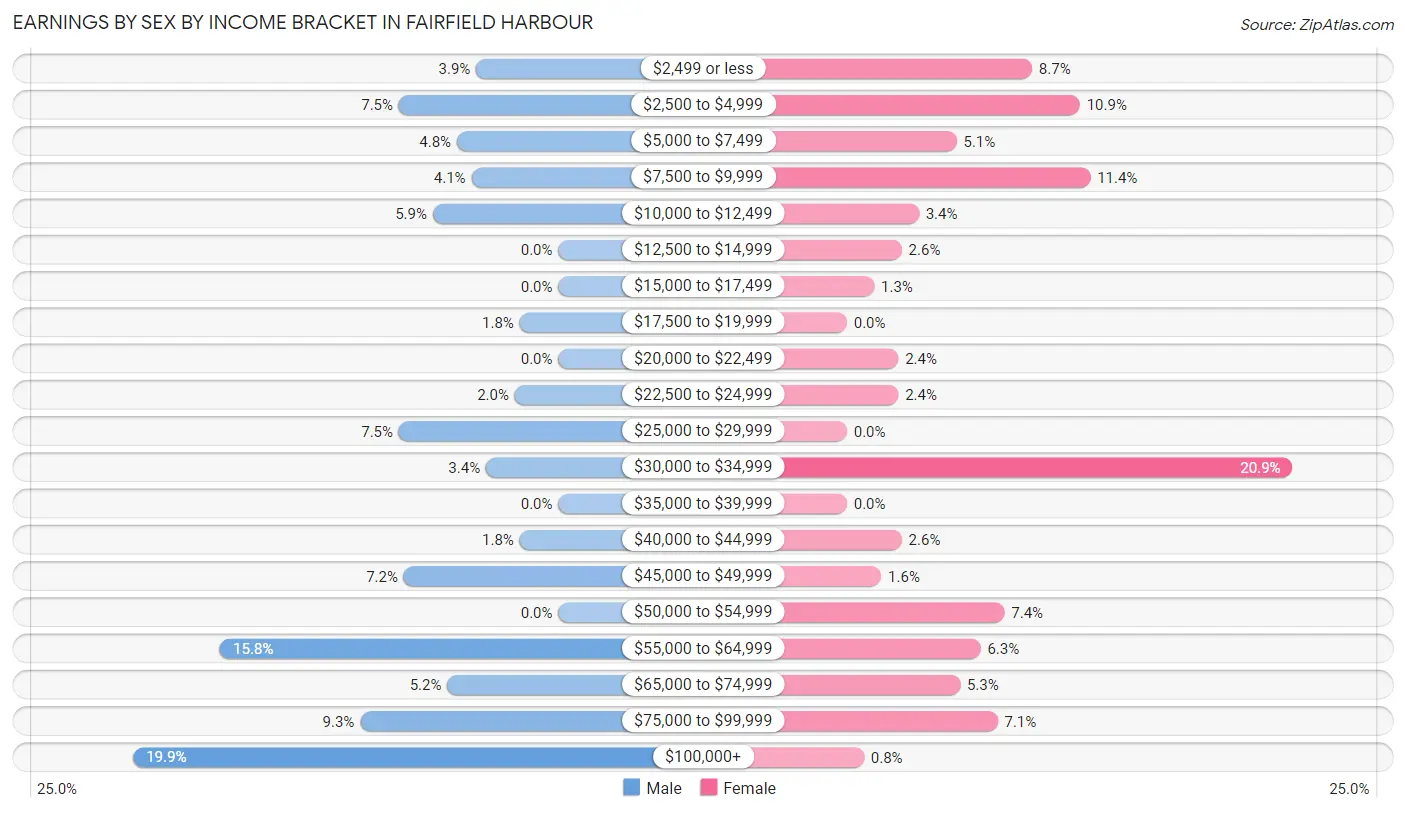
| Income | Male | Female |
| $2,499 or less | 17 (3.8%) | 54 (8.7%) |
| $2,500 to $4,999 | 33 (7.5%) | 68 (10.9%) |
| $5,000 to $7,499 | 21 (4.8%) | 32 (5.1%) |
| $7,500 to $9,999 | 18 (4.1%) | 71 (11.4%) |
| $10,000 to $12,499 | 26 (5.9%) | 21 (3.4%) |
| $12,500 to $14,999 | 0 (0.0%) | 16 (2.6%) |
| $15,000 to $17,499 | 0 (0.0%) | 8 (1.3%) |
| $17,500 to $19,999 | 8 (1.8%) | 0 (0.0%) |
| $20,000 to $22,499 | 0 (0.0%) | 15 (2.4%) |
| $22,500 to $24,999 | 9 (2.0%) | 15 (2.4%) |
| $25,000 to $29,999 | 33 (7.5%) | 0 (0.0%) |
| $30,000 to $34,999 | 15 (3.4%) | 130 (20.9%) |
| $35,000 to $39,999 | 0 (0.0%) | 0 (0.0%) |
| $40,000 to $44,999 | 8 (1.8%) | 16 (2.6%) |
| $45,000 to $49,999 | 32 (7.2%) | 10 (1.6%) |
| $50,000 to $54,999 | 0 (0.0%) | 46 (7.4%) |
| $55,000 to $64,999 | 70 (15.8%) | 39 (6.3%) |
| $65,000 to $74,999 | 23 (5.2%) | 33 (5.3%) |
| $75,000 to $99,999 | 41 (9.3%) | 44 (7.1%) |
| $100,000+ | 88 (19.9%) | 5 (0.8%) |
| Total | 442 (100.0%) | 623 (100.0%) |
Earnings by Sex by Educational Attainment in Fairfield Harbour
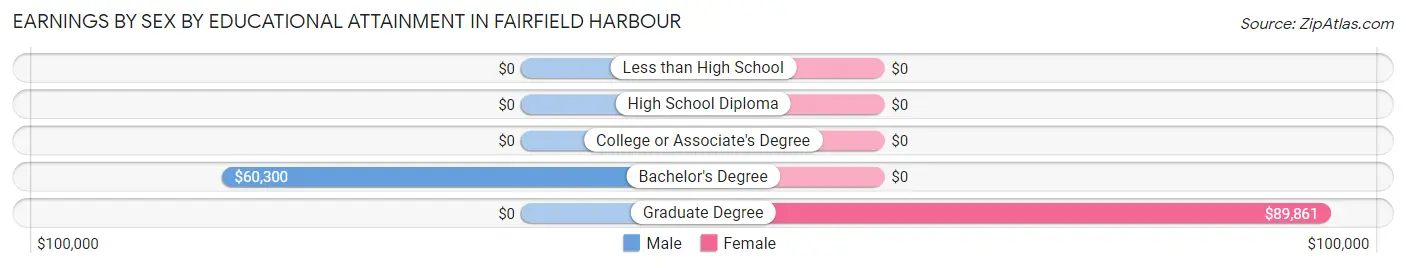
| Educational Attainment | Male Income | Female Income |
| Less than High School | - | - |
| High School Diploma | - | - |
| College or Associate's Degree | - | - |
| Bachelor's Degree | $60,300 | $0 |
| Graduate Degree | - | - |
| Total | $58,806 | $0 |
Family Income in Fairfield Harbour
Family Income Brackets in Fairfield Harbour
According to the Fairfield Harbour family income data, there are 322 families falling into the $50,000 to $74,999 income range, which is the most common income bracket and makes up 32.3% of all families.
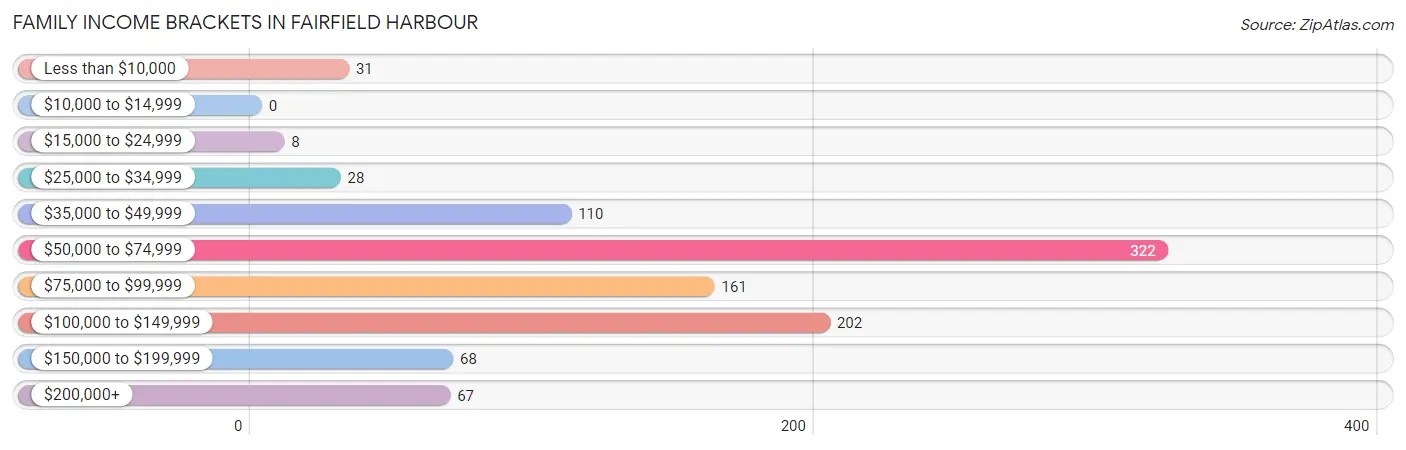
| Income Bracket | # Families | % Families |
| Less than $10,000 | 31 | 3.1% |
| $10,000 to $14,999 | 0 | 0.0% |
| $15,000 to $24,999 | 8 | 0.8% |
| $25,000 to $34,999 | 28 | 2.8% |
| $35,000 to $49,999 | 110 | 11.0% |
| $50,000 to $74,999 | 322 | 32.3% |
| $75,000 to $99,999 | 161 | 16.1% |
| $100,000 to $149,999 | 202 | 20.3% |
| $150,000 to $199,999 | 68 | 6.8% |
| $200,000+ | 67 | 6.7% |
Family Income by Famaliy Size in Fairfield Harbour
2-person families (880 | 88.3%) account for the highest median family income in Fairfield Harbour with $72,424 per family, while 2-person families (880 | 88.3%) have the highest median income of $36,212 per family member.
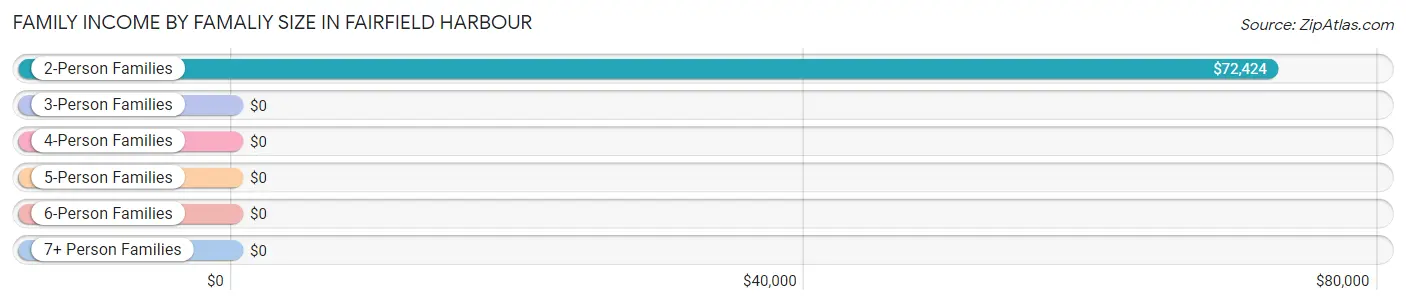
| Income Bracket | # Families | Median Income |
| 2-Person Families | 880 (88.3%) | $72,424 |
| 3-Person Families | 47 (4.7%) | $0 |
| 4-Person Families | 25 (2.5%) | $0 |
| 5-Person Families | 45 (4.5%) | $0 |
| 6-Person Families | 0 (0.0%) | $0 |
| 7+ Person Families | 0 (0.0%) | $0 |
| Total | 997 (100.0%) | $74,922 |
Family Income by Number of Earners in Fairfield Harbour
The median family income in Fairfield Harbour is $74,922, with families comprising 3+ earners (58) having the highest median family income of $250,001, while families with no earners (499) have the lowest median family income of $61,076, accounting for 5.8% and 50.0% of families, respectively.
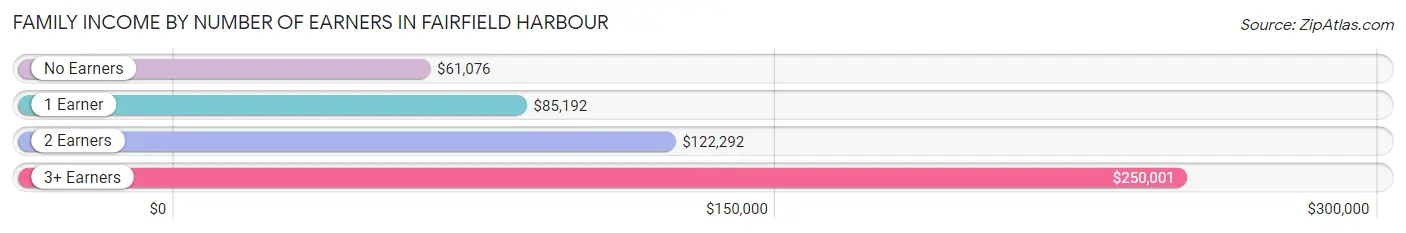
| Number of Earners | # Families | Median Income |
| No Earners | 499 (50.0%) | $61,076 |
| 1 Earner | 276 (27.7%) | $85,192 |
| 2 Earners | 164 (16.5%) | $122,292 |
| 3+ Earners | 58 (5.8%) | $250,001 |
| Total | 997 (100.0%) | $74,922 |
Household Income in Fairfield Harbour
Household Income Brackets in Fairfield Harbour
With 366 households falling in the category, the $50,000 to $74,999 income range is the most frequent in Fairfield Harbour, accounting for 27.8% of all households. In contrast, only 43 households (3.3%) fall into the $15,000 to $24,999 income bracket, making it the least populous group.
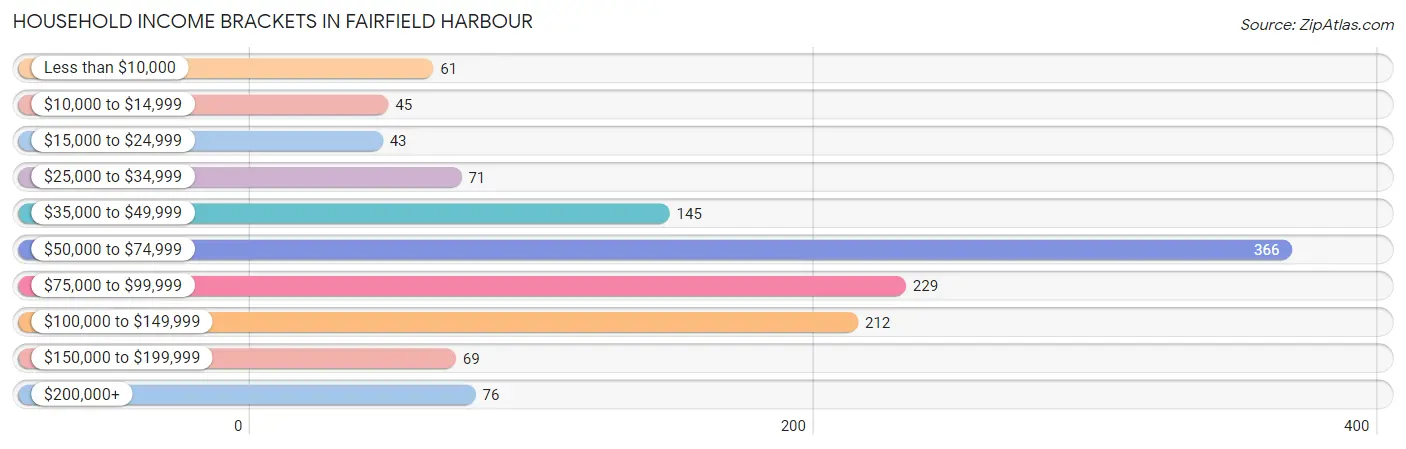
| Income Bracket | # Households | % Households |
| Less than $10,000 | 61 | 4.6% |
| $10,000 to $14,999 | 45 | 3.4% |
| $15,000 to $24,999 | 43 | 3.3% |
| $25,000 to $34,999 | 71 | 5.4% |
| $35,000 to $49,999 | 145 | 11.0% |
| $50,000 to $74,999 | 366 | 27.8% |
| $75,000 to $99,999 | 229 | 17.4% |
| $100,000 to $149,999 | 212 | 16.1% |
| $150,000 to $199,999 | 69 | 5.2% |
| $200,000+ | 76 | 5.8% |
Household Income by Householder Age in Fairfield Harbour
The median household income in Fairfield Harbour is $68,723, with the highest median household income of $94,914 found in the 45 to 64 years age bracket for the primary householder. A total of 432 households (32.8%) fall into this category. Meanwhile, the 15 to 24 years age bracket for the primary householder has the lowest median household income of $0, with 21 households (1.6%) in this group.
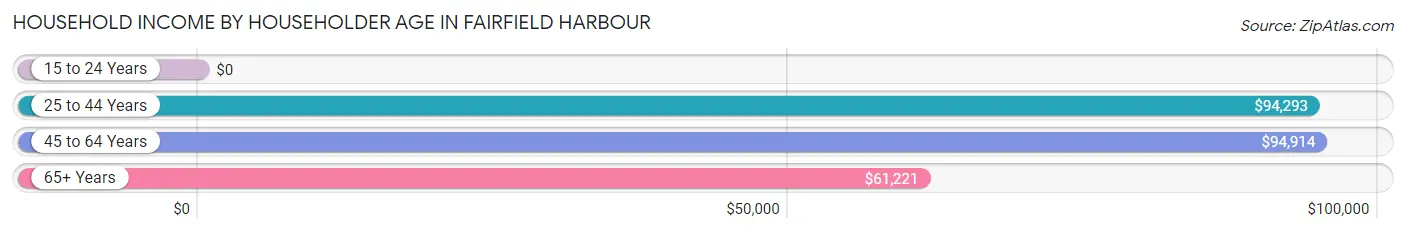
| Income Bracket | # Households | Median Income |
| 15 to 24 Years | 21 (1.6%) | $0 |
| 25 to 44 Years | 61 (4.6%) | $94,293 |
| 45 to 64 Years | 432 (32.8%) | $94,914 |
| 65+ Years | 804 (61.0%) | $61,221 |
| Total | 1,318 (100.0%) | $68,723 |
Poverty in Fairfield Harbour
Income Below Poverty by Sex and Age in Fairfield Harbour
With 6.1% poverty level for males and 3.2% for females among the residents of Fairfield Harbour, 18 to 24 year old males and 55 to 64 year old females are the most vulnerable to poverty, with 21 males (46.7%) and 32 females (9.8%) in their respective age groups living below the poverty level.
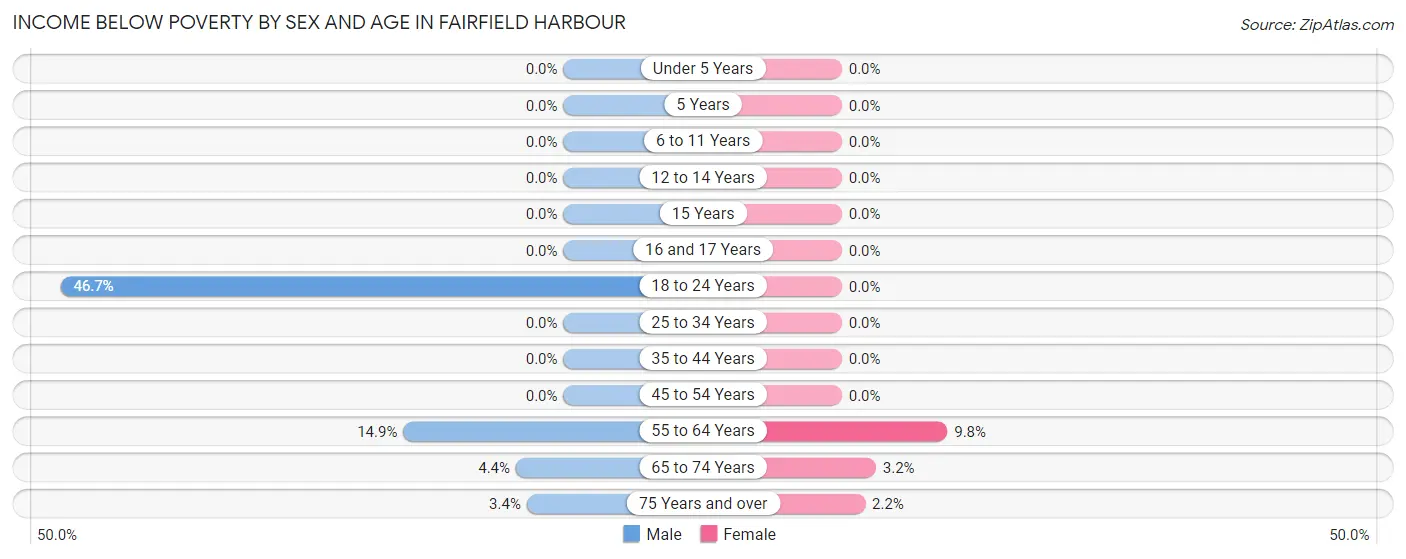
| Age Bracket | Male | Female |
| Under 5 Years | 0 (0.0%) | 0 (0.0%) |
| 5 Years | 0 (0.0%) | 0 (0.0%) |
| 6 to 11 Years | 0 (0.0%) | 0 (0.0%) |
| 12 to 14 Years | 0 (0.0%) | 0 (0.0%) |
| 15 Years | 0 (0.0%) | 0 (0.0%) |
| 16 and 17 Years | 0 (0.0%) | 0 (0.0%) |
| 18 to 24 Years | 21 (46.7%) | 0 (0.0%) |
| 25 to 34 Years | 0 (0.0%) | 0 (0.0%) |
| 35 to 44 Years | 0 (0.0%) | 0 (0.0%) |
| 45 to 54 Years | 0 (0.0%) | 0 (0.0%) |
| 55 to 64 Years | 26 (14.9%) | 32 (9.8%) |
| 65 to 74 Years | 18 (4.4%) | 12 (3.2%) |
| 75 Years and over | 9 (3.4%) | 6 (2.2%) |
| Total | 74 (6.1%) | 50 (3.2%) |
Income Above Poverty by Sex and Age in Fairfield Harbour
According to the poverty statistics in Fairfield Harbour, males aged 6 to 11 years and females aged 6 to 11 years are the age groups that are most secure financially, with 100.0% of males and 100.0% of females in these age groups living above the poverty line.
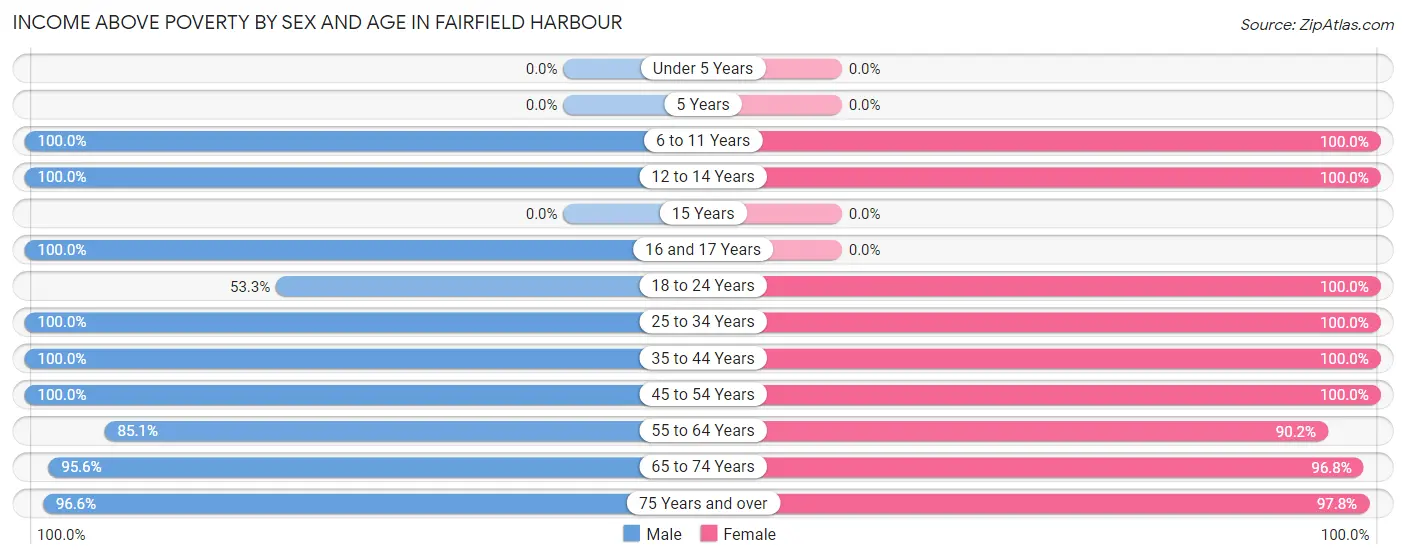
| Age Bracket | Male | Female |
| Under 5 Years | 0 (0.0%) | 0 (0.0%) |
| 5 Years | 0 (0.0%) | 0 (0.0%) |
| 6 to 11 Years | 56 (100.0%) | 17 (100.0%) |
| 12 to 14 Years | 24 (100.0%) | 28 (100.0%) |
| 15 Years | 0 (0.0%) | 0 (0.0%) |
| 16 and 17 Years | 19 (100.0%) | 0 (0.0%) |
| 18 to 24 Years | 24 (53.3%) | 243 (100.0%) |
| 25 to 34 Years | 55 (100.0%) | 38 (100.0%) |
| 35 to 44 Years | 14 (100.0%) | 69 (100.0%) |
| 45 to 54 Years | 161 (100.0%) | 187 (100.0%) |
| 55 to 64 Years | 149 (85.1%) | 295 (90.2%) |
| 65 to 74 Years | 390 (95.6%) | 368 (96.8%) |
| 75 Years and over | 256 (96.6%) | 272 (97.8%) |
| Total | 1,148 (93.9%) | 1,517 (96.8%) |
Income Below Poverty Among Married-Couple Families in Fairfield Harbour
The poverty statistics for married-couple families in Fairfield Harbour show that 3.4% or 31 of the total 901 families live below the poverty line. Families with no children have the highest poverty rate of 3.8%, comprising of 31 families. On the other hand, families with 1 or 2 children have the lowest poverty rate of 0.0%, which includes 0 families.
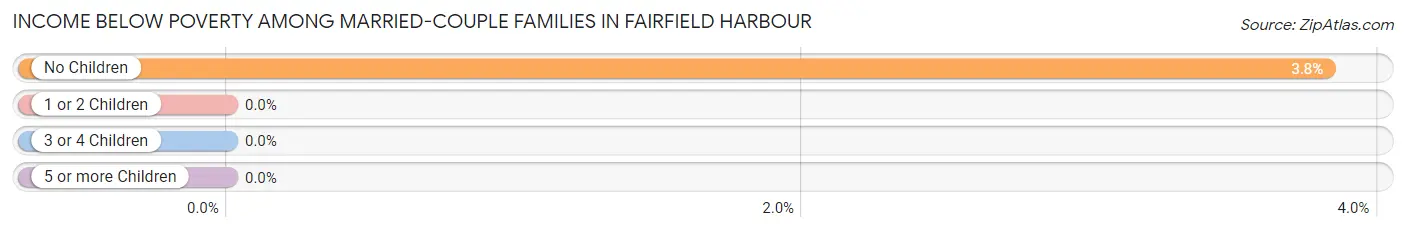
| Children | Above Poverty | Below Poverty |
| No Children | 780 (96.2%) | 31 (3.8%) |
| 1 or 2 Children | 76 (100.0%) | 0 (0.0%) |
| 3 or 4 Children | 14 (100.0%) | 0 (0.0%) |
| 5 or more Children | 0 (0.0%) | 0 (0.0%) |
| Total | 870 (96.6%) | 31 (3.4%) |
Income Below Poverty Among Single-Parent Households in Fairfield Harbour
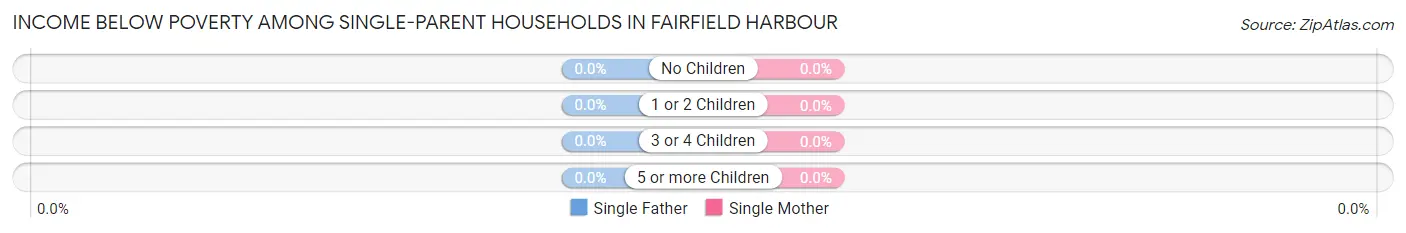
| Children | Single Father | Single Mother |
| No Children | 0 (0.0%) | 0 (0.0%) |
| 1 or 2 Children | 0 (0.0%) | 0 (0.0%) |
| 3 or 4 Children | 0 (0.0%) | 0 (0.0%) |
| 5 or more Children | 0 (0.0%) | 0 (0.0%) |
| Total | 0 (0.0%) | 0 (0.0%) |
Income Below Poverty Among Married-Couple vs Single-Parent Households in Fairfield Harbour
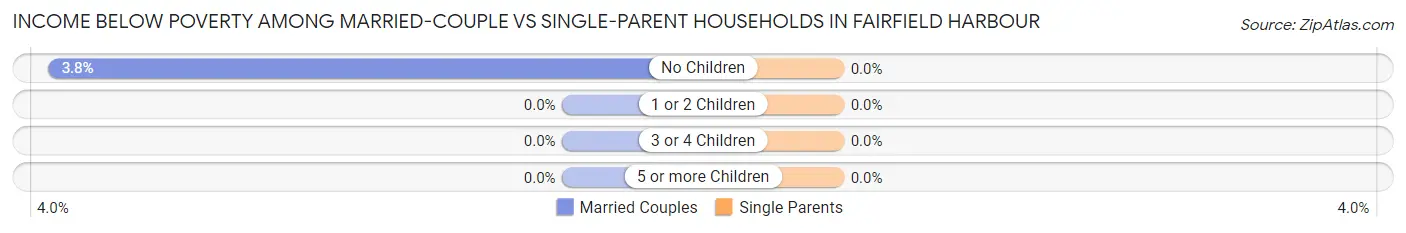
| Children | Married-Couple Families | Single-Parent Households |
| No Children | 31 (3.8%) | 0 (0.0%) |
| 1 or 2 Children | 0 (0.0%) | 0 (0.0%) |
| 3 or 4 Children | 0 (0.0%) | 0 (0.0%) |
| 5 or more Children | 0 (0.0%) | 0 (0.0%) |
| Total | 31 (3.4%) | 0 (0.0%) |
Race in Fairfield Harbour
The most populous races in Fairfield Harbour are White / Caucasian (2,253 | 80.0%), Black / African American (246 | 8.7%), and Two or more Races (229 | 8.1%).
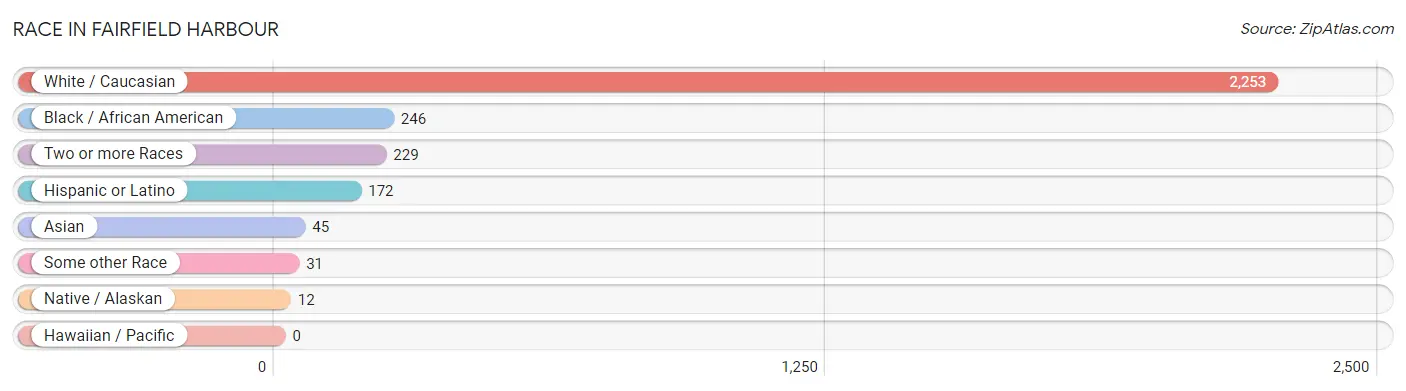
| Race | # Population | % Population |
| Asian | 45 | 1.6% |
| Black / African American | 246 | 8.7% |
| Hawaiian / Pacific | 0 | 0.0% |
| Hispanic or Latino | 172 | 6.1% |
| Native / Alaskan | 12 | 0.4% |
| White / Caucasian | 2,253 | 80.0% |
| Two or more Races | 229 | 8.1% |
| Some other Race | 31 | 1.1% |
| Total | 2,816 | 100.0% |
Ancestry in Fairfield Harbour
The most populous ancestries reported in Fairfield Harbour are English (561 | 19.9%), German (417 | 14.8%), Irish (380 | 13.5%), American (372 | 13.2%), and Italian (189 | 6.7%), together accounting for 68.1% of all Fairfield Harbour residents.
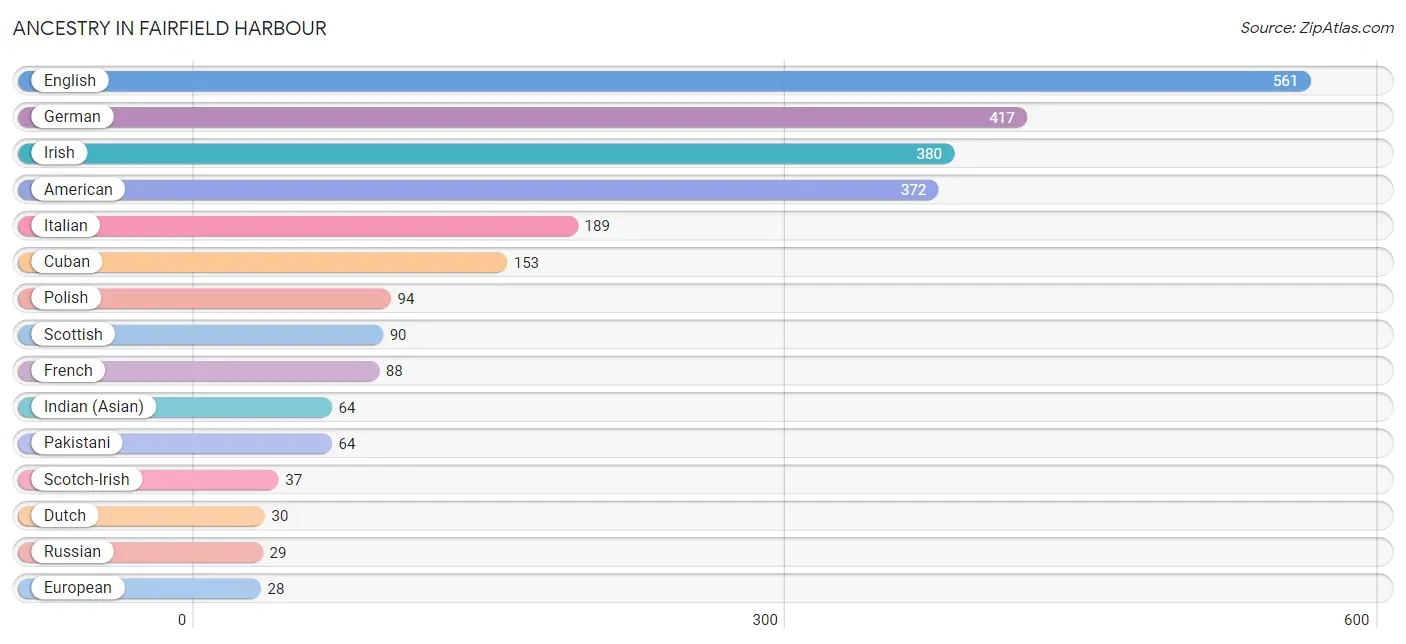
| Ancestry | # Population | % Population |
| African | 7 | 0.3% |
| American | 372 | 13.2% |
| Argentinean | 1 | 0.0% |
| Australian | 13 | 0.5% |
| Austrian | 19 | 0.7% |
| Bhutanese | 13 | 0.5% |
| British | 24 | 0.9% |
| Canadian | 7 | 0.3% |
| Celtic | 7 | 0.3% |
| Cherokee | 12 | 0.4% |
| Cuban | 153 | 5.4% |
| Czech | 9 | 0.3% |
| Danish | 16 | 0.6% |
| Dutch | 30 | 1.1% |
| Ecuadorian | 8 | 0.3% |
| English | 561 | 19.9% |
| European | 28 | 1.0% |
| Finnish | 9 | 0.3% |
| French | 88 | 3.1% |
| French Canadian | 8 | 0.3% |
| German | 417 | 14.8% |
| Greek | 16 | 0.6% |
| Hungarian | 16 | 0.6% |
| Indian (Asian) | 64 | 2.3% |
| Irish | 380 | 13.5% |
| Italian | 189 | 6.7% |
| Korean | 11 | 0.4% |
| Laotian | 21 | 0.7% |
| Northern European | 16 | 0.6% |
| Norwegian | 22 | 0.8% |
| Pakistani | 64 | 2.3% |
| Polish | 94 | 3.3% |
| Portuguese | 9 | 0.3% |
| Puerto Rican | 10 | 0.4% |
| Russian | 29 | 1.0% |
| Scandinavian | 9 | 0.3% |
| Scotch-Irish | 37 | 1.3% |
| Scottish | 90 | 3.2% |
| Slovak | 26 | 0.9% |
| South American | 9 | 0.3% |
| Subsaharan African | 7 | 0.3% |
| Swedish | 8 | 0.3% |
| Welsh | 14 | 0.5% | View All 43 Rows |
Immigrants in Fairfield Harbour
The most numerous immigrant groups reported in Fairfield Harbour came from Latin America (139 | 4.9%), Caribbean (130 | 4.6%), Cuba (130 | 4.6%), Europe (64 | 2.3%), and Asia (34 | 1.2%), together accounting for 17.7% of all Fairfield Harbour residents.
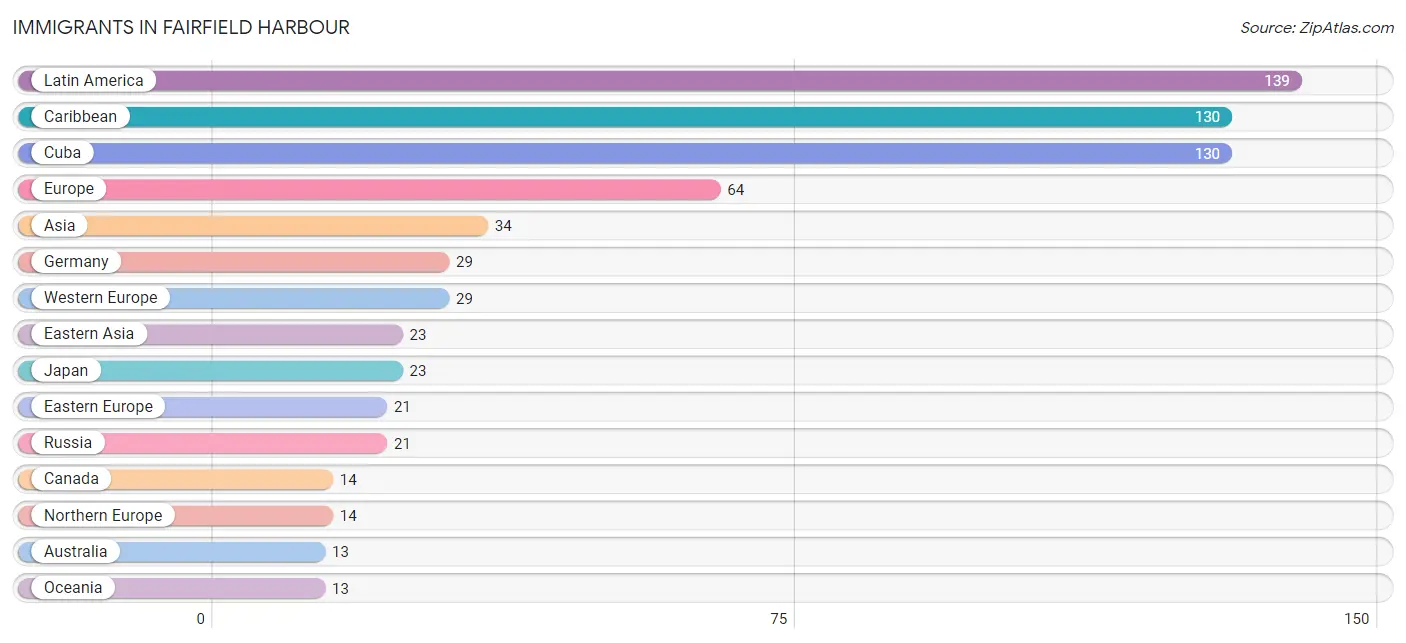
| Immigration Origin | # Population | % Population |
| Argentina | 1 | 0.0% |
| Asia | 34 | 1.2% |
| Australia | 13 | 0.5% |
| Canada | 14 | 0.5% |
| Caribbean | 130 | 4.6% |
| Cuba | 130 | 4.6% |
| Eastern Asia | 23 | 0.8% |
| Eastern Europe | 21 | 0.7% |
| Ecuador | 8 | 0.3% |
| Europe | 64 | 2.3% |
| Germany | 29 | 1.0% |
| Ireland | 7 | 0.3% |
| Japan | 23 | 0.8% |
| Latin America | 139 | 4.9% |
| Northern Europe | 14 | 0.5% |
| Oceania | 13 | 0.5% |
| Philippines | 11 | 0.4% |
| Russia | 21 | 0.7% |
| Scotland | 7 | 0.3% |
| South America | 9 | 0.3% |
| South Eastern Asia | 11 | 0.4% |
| Western Europe | 29 | 1.0% | View All 22 Rows |
Sex and Age in Fairfield Harbour
Sex and Age in Fairfield Harbour
The most populous age groups in Fairfield Harbour are 70 to 74 Years (267 | 21.8%) for men and 20 to 24 Years (225 | 14.1%) for women.
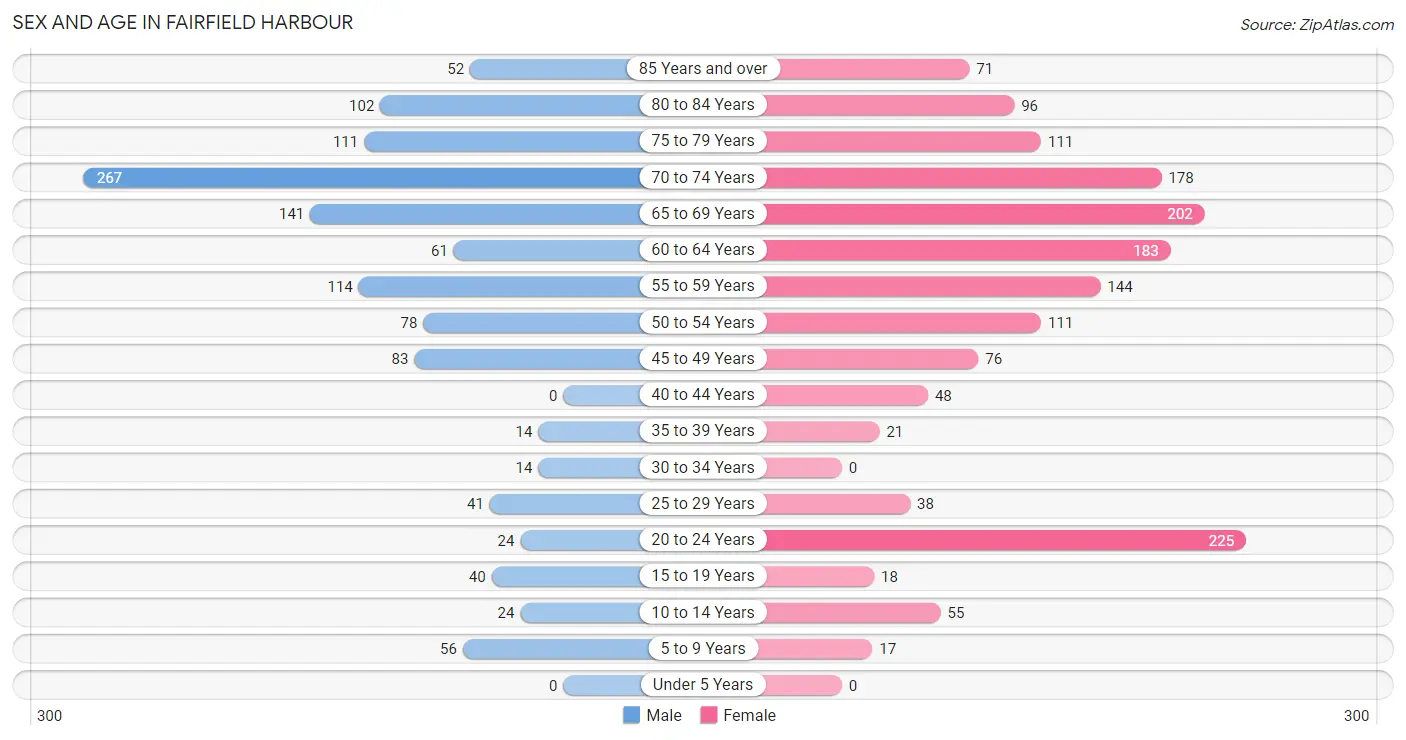
| Age Bracket | Male | Female |
| Under 5 Years | 0 (0.0%) | 0 (0.0%) |
| 5 to 9 Years | 56 (4.6%) | 17 (1.1%) |
| 10 to 14 Years | 24 (2.0%) | 55 (3.5%) |
| 15 to 19 Years | 40 (3.3%) | 18 (1.1%) |
| 20 to 24 Years | 24 (2.0%) | 225 (14.1%) |
| 25 to 29 Years | 41 (3.4%) | 38 (2.4%) |
| 30 to 34 Years | 14 (1.1%) | 0 (0.0%) |
| 35 to 39 Years | 14 (1.1%) | 21 (1.3%) |
| 40 to 44 Years | 0 (0.0%) | 48 (3.0%) |
| 45 to 49 Years | 83 (6.8%) | 76 (4.8%) |
| 50 to 54 Years | 78 (6.4%) | 111 (7.0%) |
| 55 to 59 Years | 114 (9.3%) | 144 (9.0%) |
| 60 to 64 Years | 61 (5.0%) | 183 (11.5%) |
| 65 to 69 Years | 141 (11.5%) | 202 (12.7%) |
| 70 to 74 Years | 267 (21.8%) | 178 (11.2%) |
| 75 to 79 Years | 111 (9.1%) | 111 (7.0%) |
| 80 to 84 Years | 102 (8.4%) | 96 (6.0%) |
| 85 Years and over | 52 (4.3%) | 71 (4.4%) |
| Total | 1,222 (100.0%) | 1,594 (100.0%) |
Families and Households in Fairfield Harbour
Median Family Size in Fairfield Harbour
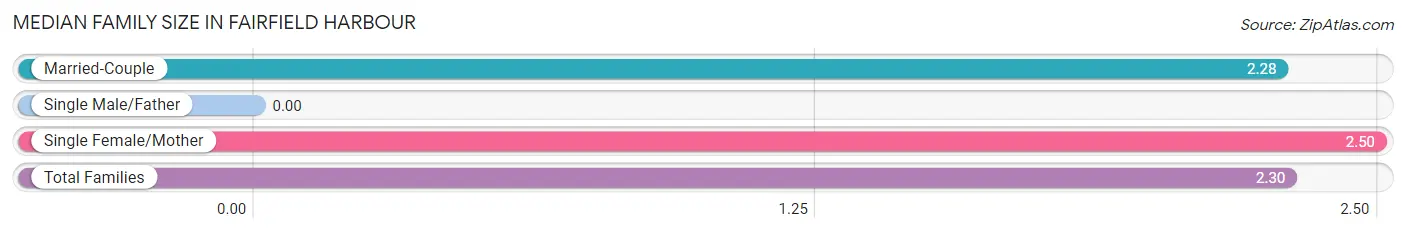
| Family Type | # Families | Family Size |
| Married-Couple | 901 (90.4%) | 2.28 |
| Single Male/Father | 0 (0.0%) | - |
| Single Female/Mother | 96 (9.6%) | 2.50 |
| Total Families | 997 (100.0%) | 2.30 |
Median Household Size in Fairfield Harbour
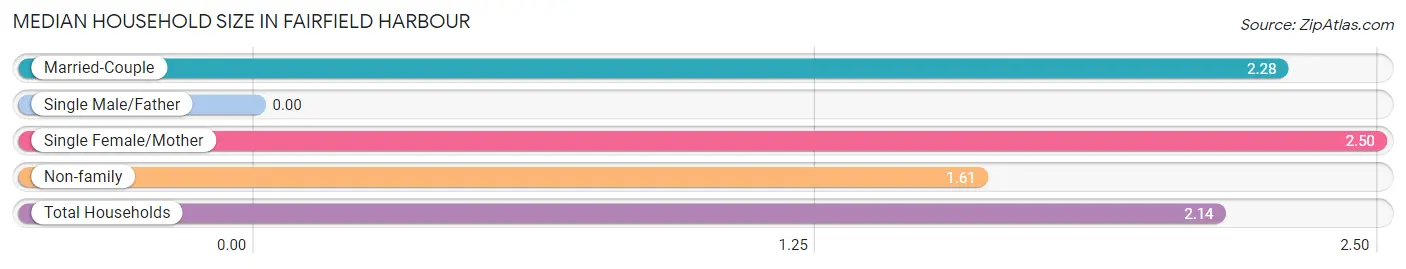
| Household Type | # Households | Household Size |
| Married-Couple | 901 (68.4%) | 2.28 |
| Single Male/Father | 0 (0.0%) | - |
| Single Female/Mother | 96 (7.3%) | 2.50 |
| Non-family | 321 (24.4%) | 1.61 |
| Total Households | 1,318 (100.0%) | 2.14 |
Household Size by Marriage Status in Fairfield Harbour
Out of a total of 1,318 households in Fairfield Harbour, 997 (75.6%) are family households, while 321 (24.4%) are nonfamily households. The most numerous type of family households are 2-person households, comprising 880, and the most common type of nonfamily households are 1-person households, comprising 227.
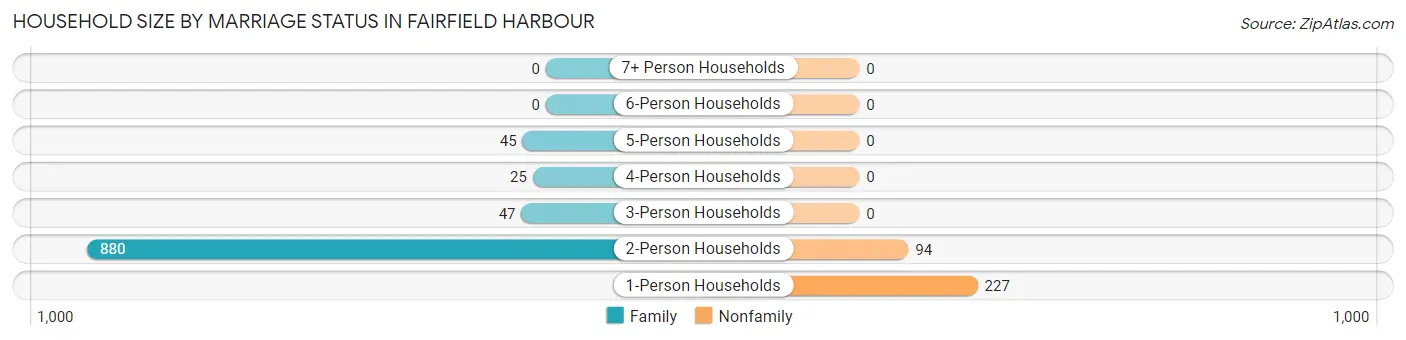
| Household Size | Family Households | Nonfamily Households |
| 1-Person Households | - | 227 (17.2%) |
| 2-Person Households | 880 (66.8%) | 94 (7.1%) |
| 3-Person Households | 47 (3.6%) | 0 (0.0%) |
| 4-Person Households | 25 (1.9%) | 0 (0.0%) |
| 5-Person Households | 45 (3.4%) | 0 (0.0%) |
| 6-Person Households | 0 (0.0%) | 0 (0.0%) |
| 7+ Person Households | 0 (0.0%) | 0 (0.0%) |
| Total | 997 (75.6%) | 321 (24.4%) |
Female Fertility in Fairfield Harbour
Fertility by Age in Fairfield Harbour
| Age Bracket | Women with Births | Births / 1,000 Women |
| 15 to 19 years | 0 (0.0%) | 0.0 |
| 20 to 34 years | 0 (0.0%) | 0.0 |
| 35 to 50 years | 0 (0.0%) | 0.0 |
| Total | 0 (0.0%) | 0.0 |
Fertility by Age by Marriage Status in Fairfield Harbour
| Age Bracket | Married | Unmarried |
| 15 to 19 years | 0 (0.0%) | 0 (0.0%) |
| 20 to 34 years | 0 (0.0%) | 0 (0.0%) |
| 35 to 50 years | 0 (0.0%) | 0 (0.0%) |
| Total | 0 (0.0%) | 0 (0.0%) |
Fertility by Education in Fairfield Harbour
| Educational Attainment | Women with Births | Births / 1,000 Women |
| Less than High School | 0 (0.0%) | 0.0 |
| High School Diploma | 0 (0.0%) | 0.0 |
| College or Associate's Degree | 0 (0.0%) | 0.0 |
| Bachelor's Degree | 0 (0.0%) | 0.0 |
| Graduate Degree | 0 (0.0%) | 0.0 |
| Total | 0 (0.0%) | 0.0 |
Fertility by Education by Marriage Status in Fairfield Harbour
| Educational Attainment | Married | Unmarried |
| Less than High School | 0 (0.0%) | 0 (0.0%) |
| High School Diploma | 0 (0.0%) | 0 (0.0%) |
| College or Associate's Degree | 0 (0.0%) | 0 (0.0%) |
| Bachelor's Degree | 0 (0.0%) | 0 (0.0%) |
| Graduate Degree | 0 (0.0%) | 0 (0.0%) |
| Total | 0 (0.0%) | 0 (0.0%) |
Employment Characteristics in Fairfield Harbour
Employment by Class of Employer in Fairfield Harbour
Among the 815 employed individuals in Fairfield Harbour, private company employees (535 | 65.6%), self-employed (incorporated) (81 | 9.9%), and not-for-profit organizations (75 | 9.2%) make up the most common classes of employment.
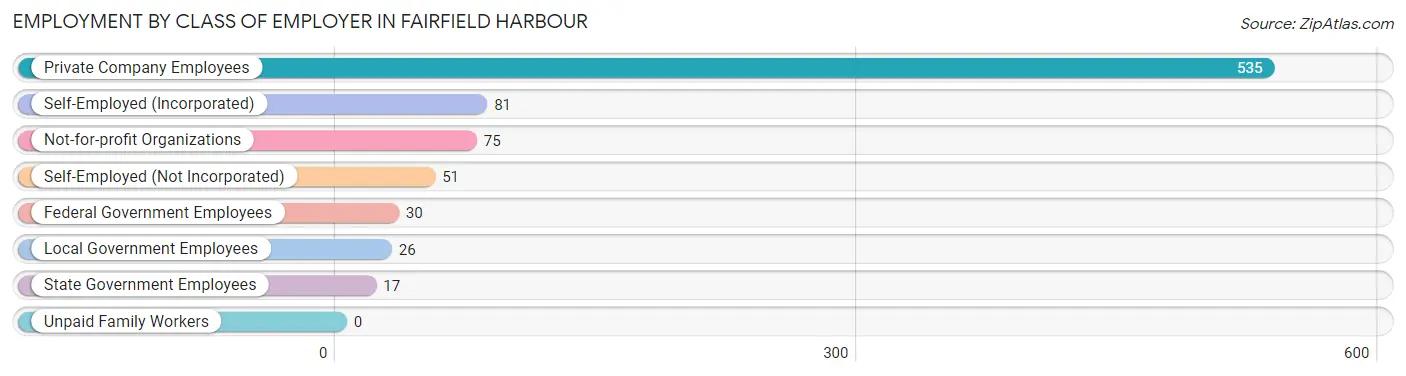
| Employer Class | # Employees | % Employees |
| Private Company Employees | 535 | 65.6% |
| Self-Employed (Incorporated) | 81 | 9.9% |
| Self-Employed (Not Incorporated) | 51 | 6.3% |
| Not-for-profit Organizations | 75 | 9.2% |
| Local Government Employees | 26 | 3.2% |
| State Government Employees | 17 | 2.1% |
| Federal Government Employees | 30 | 3.7% |
| Unpaid Family Workers | 0 | 0.0% |
| Total | 815 | 100.0% |
Employment Status by Age in Fairfield Harbour
According to the labor force statistics for Fairfield Harbour, out of the total population over 16 years of age (2,664), 35.1% or 935 individuals are in the labor force, with 9.4% or 88 of them unemployed. The age group with the highest labor force participation rate is 20 to 24 years, with 100.0% or 249 individuals in the labor force. Within the labor force, the 25 to 29 years age range has the highest percentage of unemployed individuals, with 70.9% or 56 of them being unemployed.
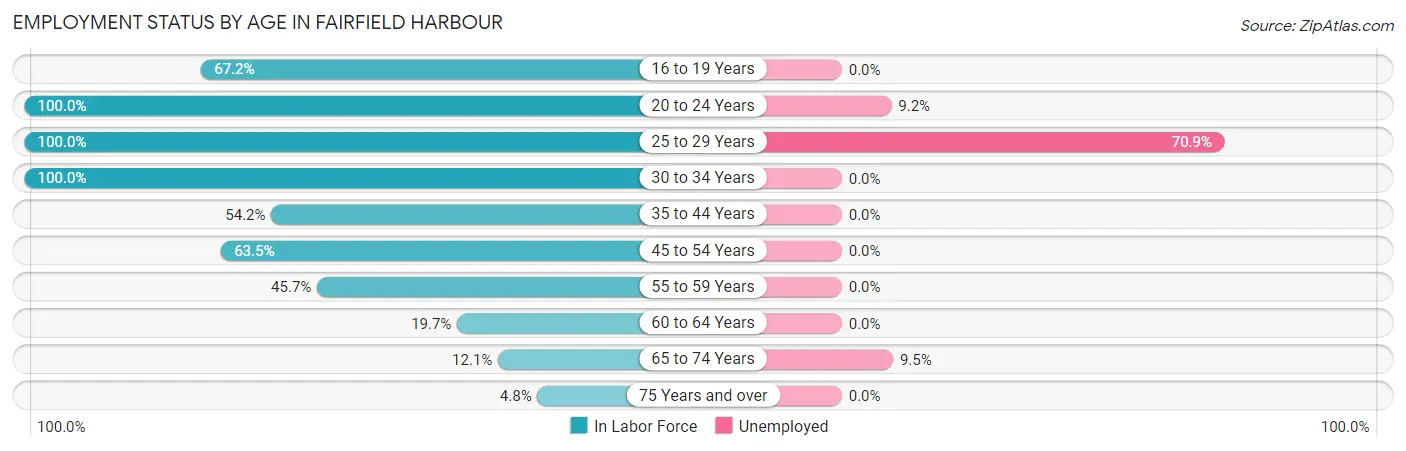
| Age Bracket | In Labor Force | Unemployed |
| 16 to 19 Years | 39 (67.2%) | 0 (0.0%) |
| 20 to 24 Years | 249 (100.0%) | 23 (9.2%) |
| 25 to 29 Years | 79 (100.0%) | 56 (70.9%) |
| 30 to 34 Years | 14 (100.0%) | 0 (0.0%) |
| 35 to 44 Years | 45 (54.2%) | 0 (0.0%) |
| 45 to 54 Years | 221 (63.5%) | 0 (0.0%) |
| 55 to 59 Years | 118 (45.7%) | 0 (0.0%) |
| 60 to 64 Years | 48 (19.7%) | 0 (0.0%) |
| 65 to 74 Years | 95 (12.1%) | 9 (9.5%) |
| 75 Years and over | 26 (4.8%) | 0 (0.0%) |
| Total | 935 (35.1%) | 88 (9.4%) |
Employment Status by Educational Attainment in Fairfield Harbour
According to labor force statistics for Fairfield Harbour, 51.2% of individuals (525) out of the total population between 25 and 64 years of age (1,026) are in the labor force, with 10.7% or 56 of them being unemployed. The group with the highest labor force participation rate are those with the educational attainment of high school diploma, with 69.1% or 67 individuals in the labor force. Within the labor force, individuals with bachelor's degree or higher education have the highest percentage of unemployment, with 13.5% or 38 of them being unemployed.
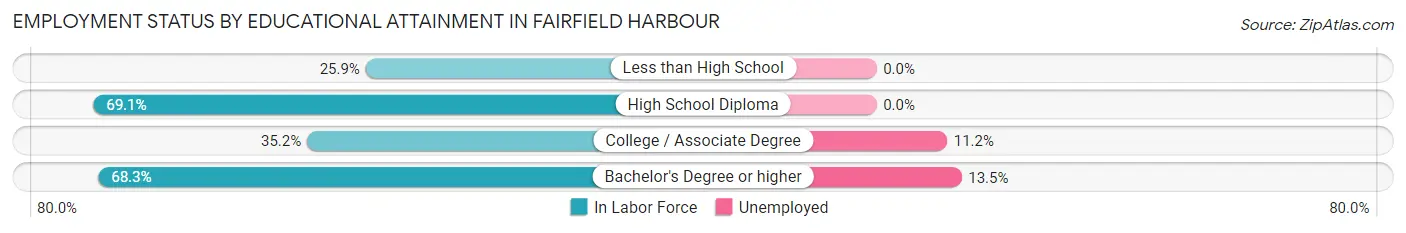
| Educational Attainment | In Labor Force | Unemployed |
| Less than High School | 15 (25.9%) | 0 (0.0%) |
| High School Diploma | 67 (69.1%) | 0 (0.0%) |
| College / Associate Degree | 161 (35.2%) | 51 (11.2%) |
| Bachelor's Degree or higher | 282 (68.3%) | 56 (13.5%) |
| Total | 525 (51.2%) | 110 (10.7%) |
Employment Occupations by Sex in Fairfield Harbour
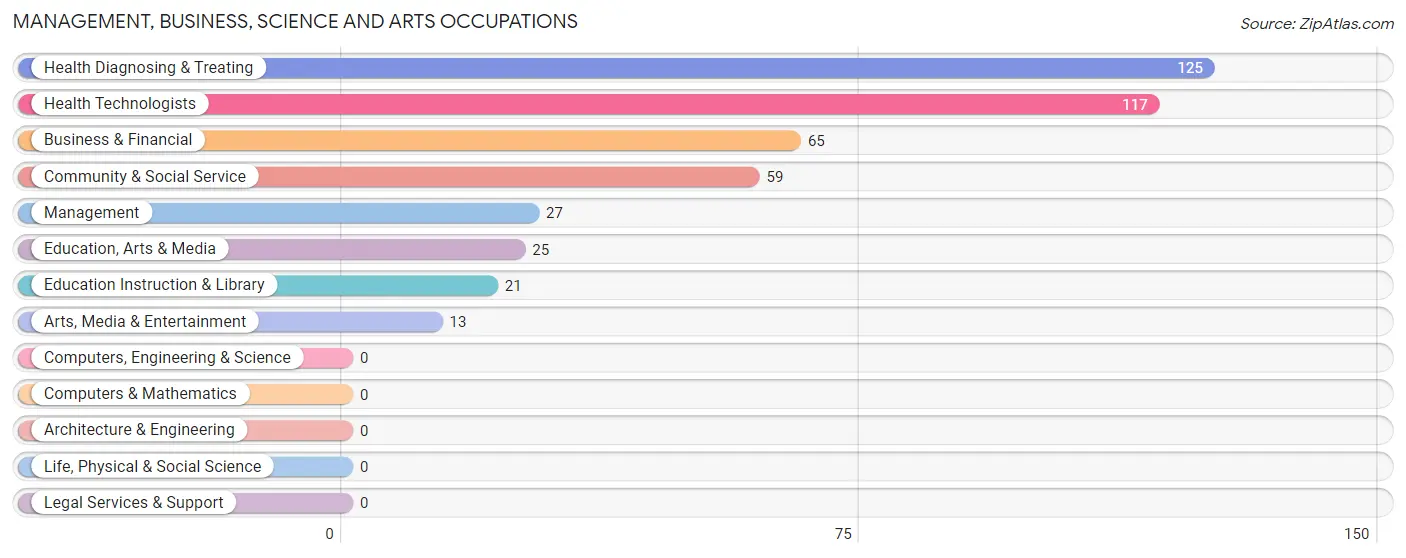
Management, Business, Science and Arts Occupations
The most common Management, Business, Science and Arts occupations in Fairfield Harbour are Health Diagnosing & Treating (125 | 14.8%), Health Technologists (117 | 13.8%), Business & Financial (65 | 7.7%), Community & Social Service (59 | 7.0%), and Management (27 | 3.2%).
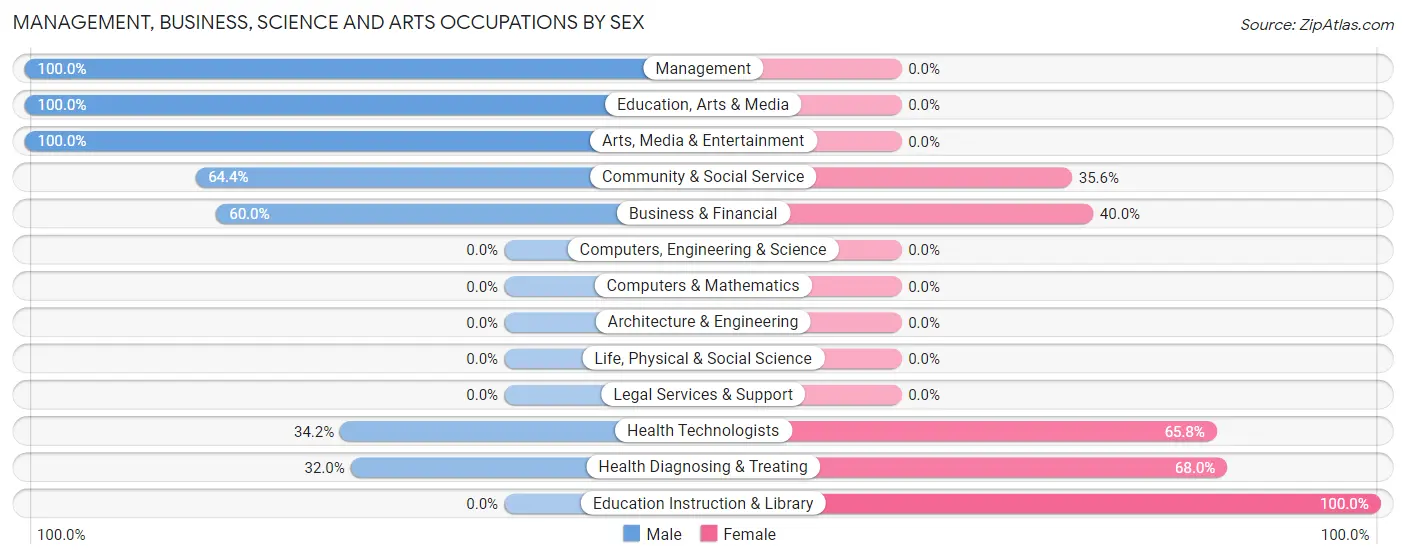
Management, Business, Science and Arts Occupations by Sex
Within the Management, Business, Science and Arts occupations in Fairfield Harbour, the most male-oriented occupations are Management (100.0%), Education, Arts & Media (100.0%), and Arts, Media & Entertainment (100.0%), while the most female-oriented occupations are Education Instruction & Library (100.0%), Health Diagnosing & Treating (68.0%), and Health Technologists (65.8%).
| Occupation | Male | Female |
| Management | 27 (100.0%) | 0 (0.0%) |
| Business & Financial | 39 (60.0%) | 26 (40.0%) |
| Computers, Engineering & Science | 0 (0.0%) | 0 (0.0%) |
| Computers & Mathematics | 0 (0.0%) | 0 (0.0%) |
| Architecture & Engineering | 0 (0.0%) | 0 (0.0%) |
| Life, Physical & Social Science | 0 (0.0%) | 0 (0.0%) |
| Community & Social Service | 38 (64.4%) | 21 (35.6%) |
| Education, Arts & Media | 25 (100.0%) | 0 (0.0%) |
| Legal Services & Support | 0 (0.0%) | 0 (0.0%) |
| Education Instruction & Library | 0 (0.0%) | 21 (100.0%) |
| Arts, Media & Entertainment | 13 (100.0%) | 0 (0.0%) |
| Health Diagnosing & Treating | 40 (32.0%) | 85 (68.0%) |
| Health Technologists | 40 (34.2%) | 77 (65.8%) |
| Total (Category) | 144 (52.2%) | 132 (47.8%) |
| Total (Overall) | 360 (42.5%) | 486 (57.5%) |
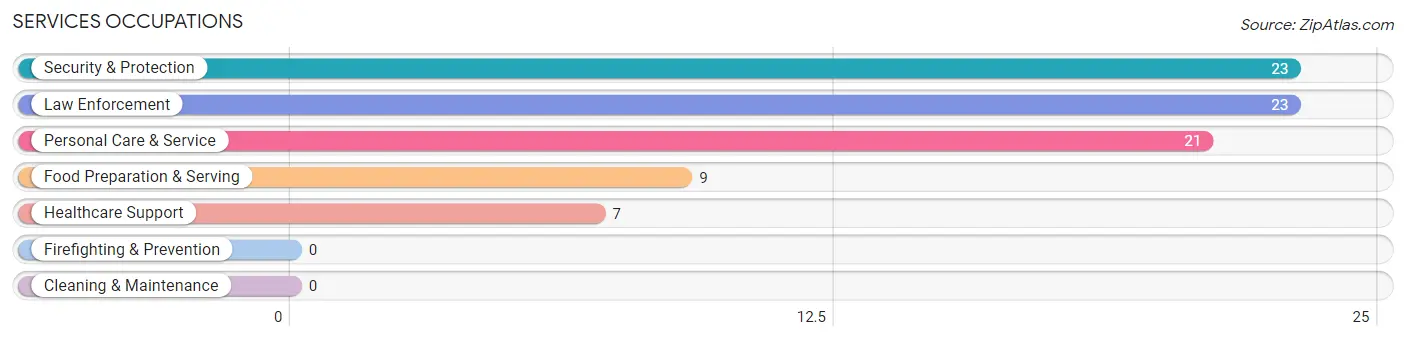
Services Occupations
The most common Services occupations in Fairfield Harbour are Security & Protection (23 | 2.7%), Law Enforcement (23 | 2.7%), Personal Care & Service (21 | 2.5%), Food Preparation & Serving (9 | 1.1%), and Healthcare Support (7 | 0.8%).
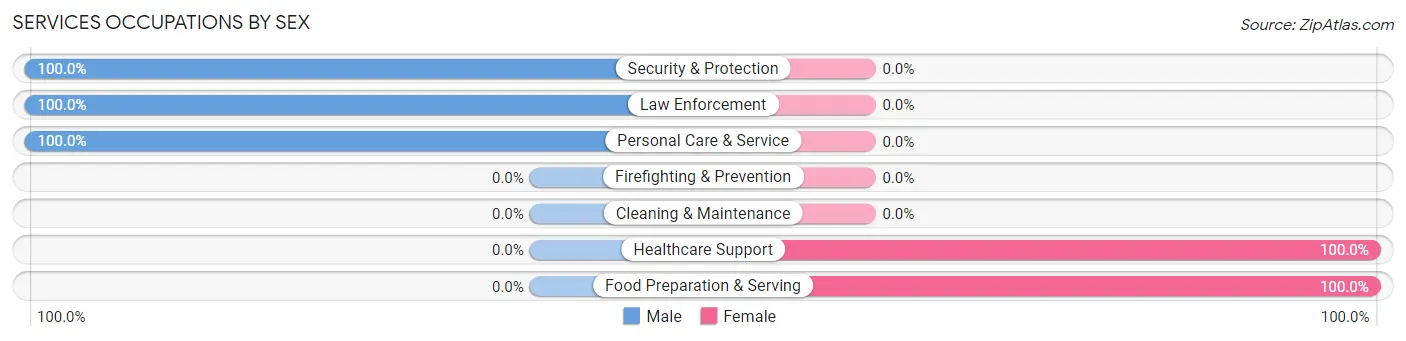
Services Occupations by Sex
Within the Services occupations in Fairfield Harbour, the most male-oriented occupations are Security & Protection (100.0%), Law Enforcement (100.0%), and Personal Care & Service (100.0%), while the most female-oriented occupations are Healthcare Support (100.0%), and Food Preparation & Serving (100.0%).
| Occupation | Male | Female |
| Healthcare Support | 0 (0.0%) | 7 (100.0%) |
| Security & Protection | 23 (100.0%) | 0 (0.0%) |
| Firefighting & Prevention | 0 (0.0%) | 0 (0.0%) |
| Law Enforcement | 23 (100.0%) | 0 (0.0%) |
| Food Preparation & Serving | 0 (0.0%) | 9 (100.0%) |
| Cleaning & Maintenance | 0 (0.0%) | 0 (0.0%) |
| Personal Care & Service | 21 (100.0%) | 0 (0.0%) |
| Total (Category) | 44 (73.3%) | 16 (26.7%) |
| Total (Overall) | 360 (42.5%) | 486 (57.5%) |
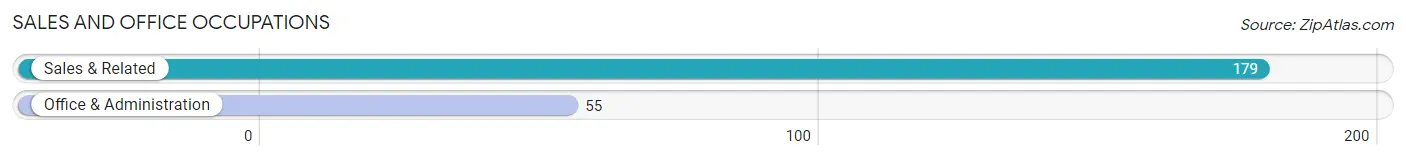
Sales and Office Occupations
The most common Sales and Office occupations in Fairfield Harbour are Sales & Related (179 | 21.2%), and Office & Administration (55 | 6.5%).
Sales and Office Occupations by Sex
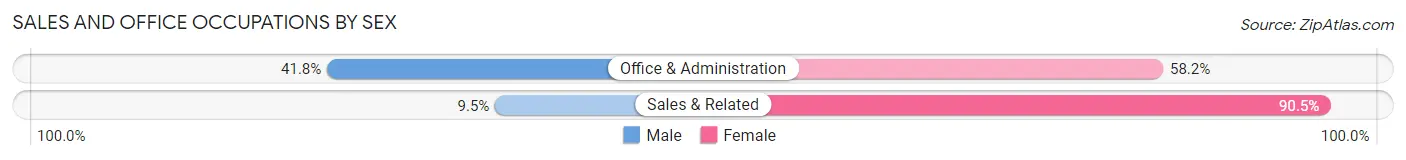
| Occupation | Male | Female |
| Sales & Related | 17 (9.5%) | 162 (90.5%) |
| Office & Administration | 23 (41.8%) | 32 (58.2%) |
| Total (Category) | 40 (17.1%) | 194 (82.9%) |
| Total (Overall) | 360 (42.5%) | 486 (57.5%) |
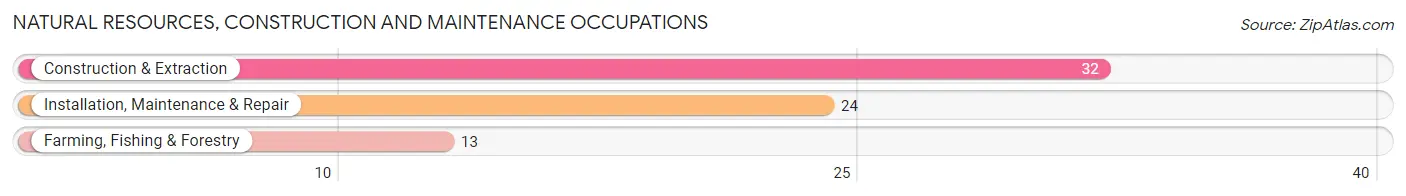
Natural Resources, Construction and Maintenance Occupations
The most common Natural Resources, Construction and Maintenance occupations in Fairfield Harbour are Construction & Extraction (32 | 3.8%), Installation, Maintenance & Repair (24 | 2.8%), and Farming, Fishing & Forestry (13 | 1.5%).
Natural Resources, Construction and Maintenance Occupations by Sex
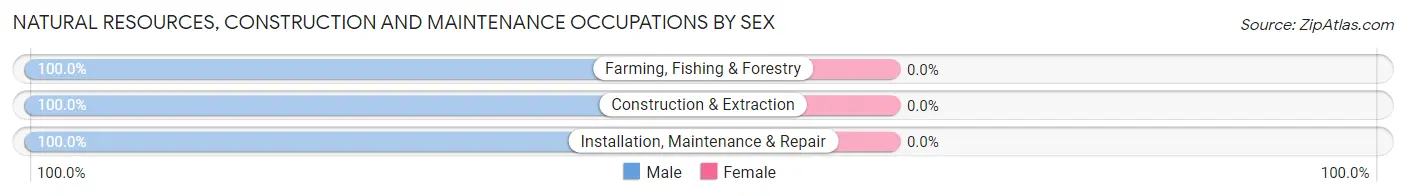
| Occupation | Male | Female |
| Farming, Fishing & Forestry | 13 (100.0%) | 0 (0.0%) |
| Construction & Extraction | 32 (100.0%) | 0 (0.0%) |
| Installation, Maintenance & Repair | 24 (100.0%) | 0 (0.0%) |
| Total (Category) | 69 (100.0%) | 0 (0.0%) |
| Total (Overall) | 360 (42.5%) | 486 (57.5%) |
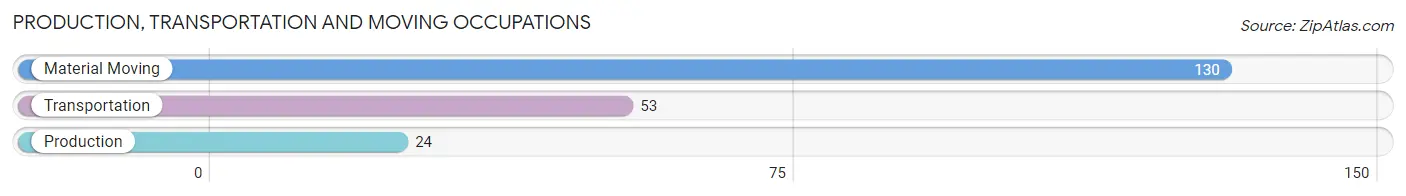
Production, Transportation and Moving Occupations
The most common Production, Transportation and Moving occupations in Fairfield Harbour are Material Moving (130 | 15.4%), Transportation (53 | 6.3%), and Production (24 | 2.8%).
Production, Transportation and Moving Occupations by Sex
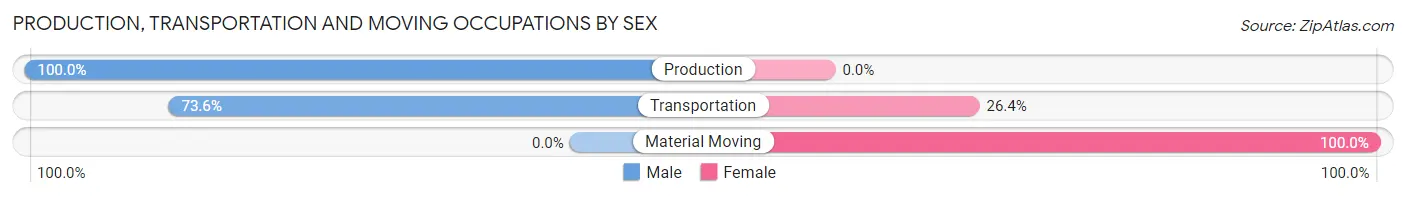
| Occupation | Male | Female |
| Production | 24 (100.0%) | 0 (0.0%) |
| Transportation | 39 (73.6%) | 14 (26.4%) |
| Material Moving | 0 (0.0%) | 130 (100.0%) |
| Total (Category) | 63 (30.4%) | 144 (69.6%) |
| Total (Overall) | 360 (42.5%) | 486 (57.5%) |
Employment Industries by Sex in Fairfield Harbour
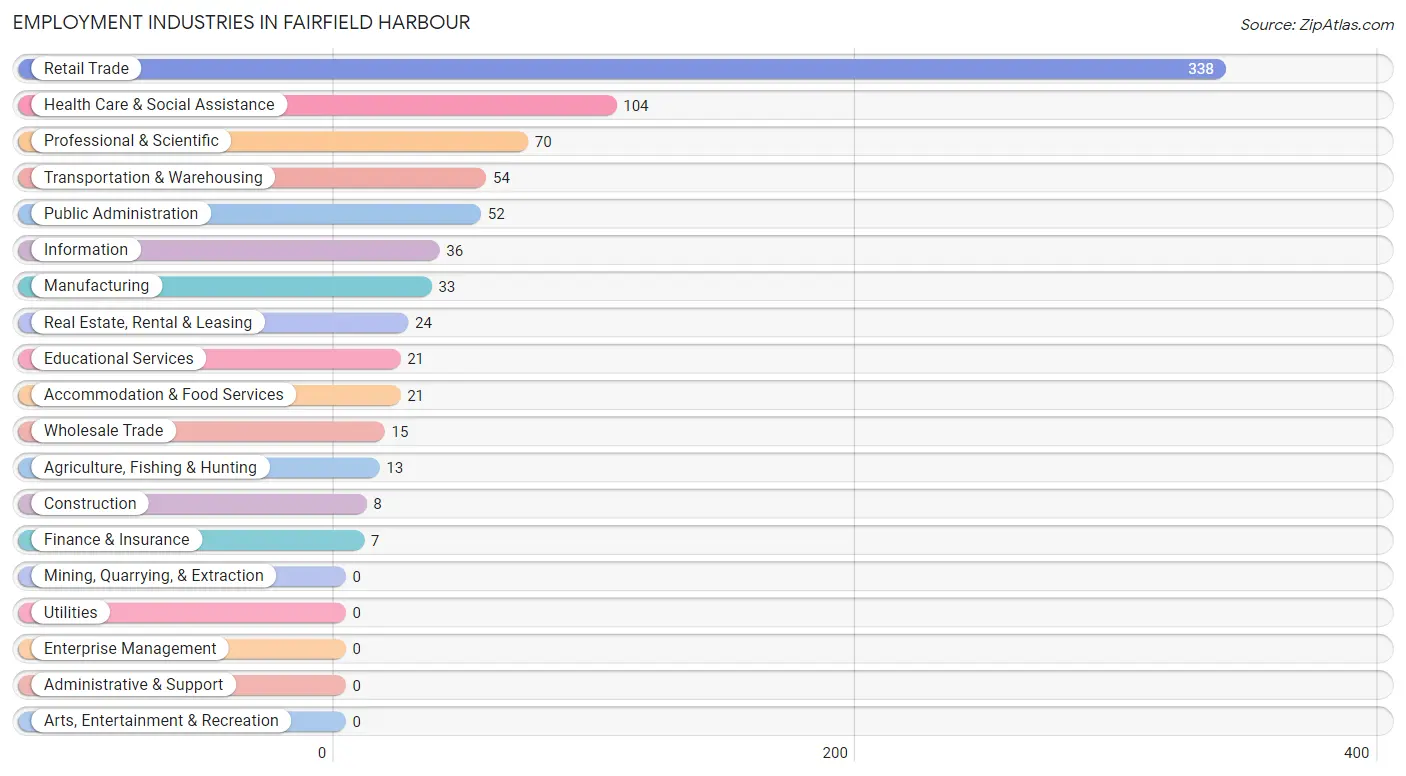
Employment Industries in Fairfield Harbour
The major employment industries in Fairfield Harbour include Retail Trade (338 | 40.0%), Health Care & Social Assistance (104 | 12.3%), Professional & Scientific (70 | 8.3%), Transportation & Warehousing (54 | 6.4%), and Public Administration (52 | 6.1%).
Employment Industries by Sex in Fairfield Harbour
The Fairfield Harbour industries that see more men than women are Agriculture, Fishing & Hunting (100.0%), Manufacturing (100.0%), and Wholesale Trade (100.0%), whereas the industries that tend to have a higher number of women are Construction (100.0%), Finance & Insurance (100.0%), and Educational Services (100.0%).
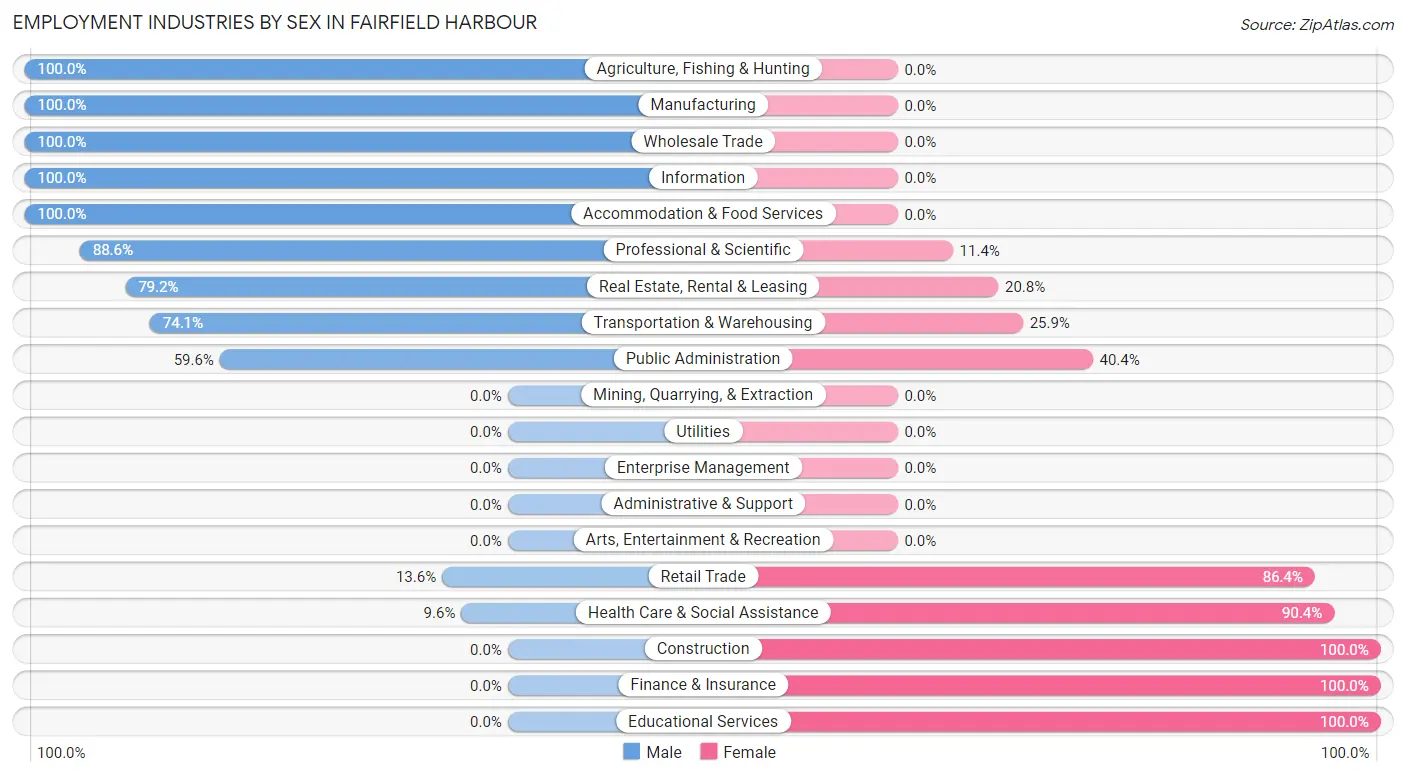
| Industry | Male | Female |
| Agriculture, Fishing & Hunting | 13 (100.0%) | 0 (0.0%) |
| Mining, Quarrying, & Extraction | 0 (0.0%) | 0 (0.0%) |
| Construction | 0 (0.0%) | 8 (100.0%) |
| Manufacturing | 33 (100.0%) | 0 (0.0%) |
| Wholesale Trade | 15 (100.0%) | 0 (0.0%) |
| Retail Trade | 46 (13.6%) | 292 (86.4%) |
| Transportation & Warehousing | 40 (74.1%) | 14 (25.9%) |
| Utilities | 0 (0.0%) | 0 (0.0%) |
| Information | 36 (100.0%) | 0 (0.0%) |
| Finance & Insurance | 0 (0.0%) | 7 (100.0%) |
| Real Estate, Rental & Leasing | 19 (79.2%) | 5 (20.8%) |
| Professional & Scientific | 62 (88.6%) | 8 (11.4%) |
| Enterprise Management | 0 (0.0%) | 0 (0.0%) |
| Administrative & Support | 0 (0.0%) | 0 (0.0%) |
| Educational Services | 0 (0.0%) | 21 (100.0%) |
| Health Care & Social Assistance | 10 (9.6%) | 94 (90.4%) |
| Arts, Entertainment & Recreation | 0 (0.0%) | 0 (0.0%) |
| Accommodation & Food Services | 21 (100.0%) | 0 (0.0%) |
| Public Administration | 31 (59.6%) | 21 (40.4%) |
| Total | 360 (42.5%) | 486 (57.5%) |
Education in Fairfield Harbour
School Enrollment in Fairfield Harbour
The most common levels of schooling among the 417 students in Fairfield Harbour are college / undergraduate (237 | 56.8%), middle school (79 | 18.9%), and elementary school (56 | 13.4%).
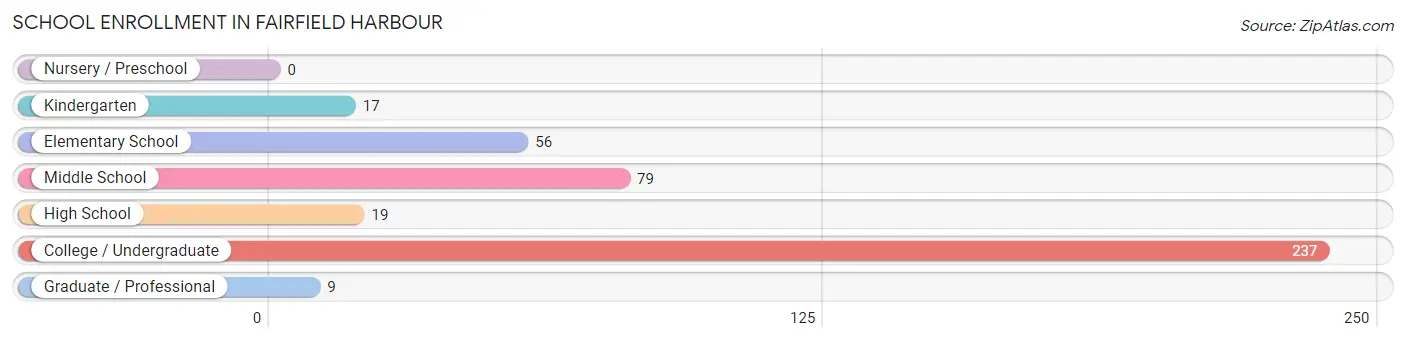
| School Level | # Students | % Students |
| Nursery / Preschool | 0 | 0.0% |
| Kindergarten | 17 | 4.1% |
| Elementary School | 56 | 13.4% |
| Middle School | 79 | 18.9% |
| High School | 19 | 4.6% |
| College / Undergraduate | 237 | 56.8% |
| Graduate / Professional | 9 | 2.2% |
| Total | 417 | 100.0% |
School Enrollment by Age by Funding Source in Fairfield Harbour
Out of a total of 417 students who are enrolled in schools in Fairfield Harbour, 87 (20.9%) attend a private institution, while the remaining 330 (79.1%) are enrolled in public schools. The age group of 5 to 9 year old has the highest likelihood of being enrolled in private schools, with 36 (49.3% in the age bracket) enrolled. Conversely, the age group of 15 to 17 year olds has the lowest likelihood of being enrolled in a private school, with 19 (100.0% in the age bracket) attending a public institution.
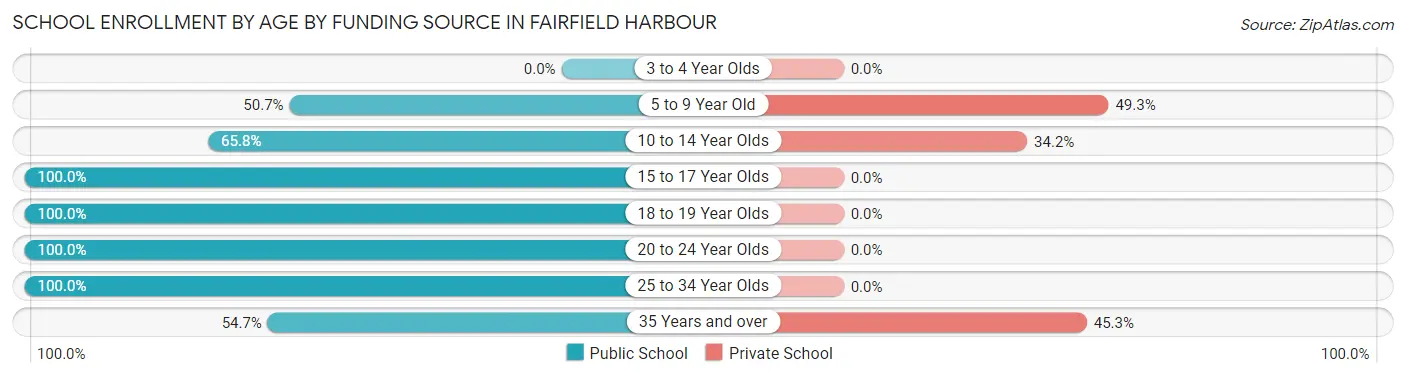
| Age Bracket | Public School | Private School |
| 3 to 4 Year Olds | 0 (0.0%) | 0 (0.0%) |
| 5 to 9 Year Old | 37 (50.7%) | 36 (49.3%) |
| 10 to 14 Year Olds | 52 (65.8%) | 27 (34.2%) |
| 15 to 17 Year Olds | 19 (100.0%) | 0 (0.0%) |
| 18 to 19 Year Olds | 18 (100.0%) | 0 (0.0%) |
| 20 to 24 Year Olds | 119 (100.0%) | 0 (0.0%) |
| 25 to 34 Year Olds | 56 (100.0%) | 0 (0.0%) |
| 35 Years and over | 29 (54.7%) | 24 (45.3%) |
| Total | 330 (79.1%) | 87 (20.9%) |
Educational Attainment by Field of Study in Fairfield Harbour
Business (213 | 21.3%), education (116 | 11.6%), social sciences (95 | 9.5%), science & technology (89 | 8.9%), and literature & languages (83 | 8.3%) are the most common fields of study among 999 individuals in Fairfield Harbour who have obtained a bachelor's degree or higher.
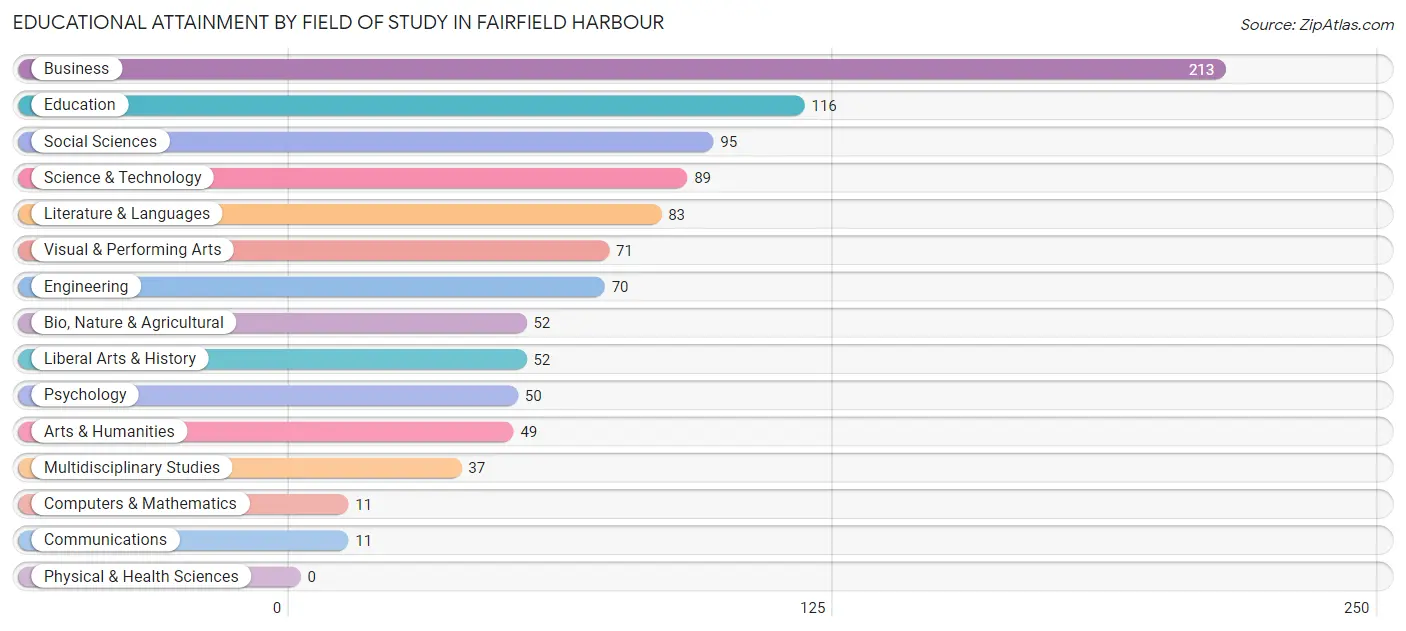
| Field of Study | # Graduates | % Graduates |
| Computers & Mathematics | 11 | 1.1% |
| Bio, Nature & Agricultural | 52 | 5.2% |
| Physical & Health Sciences | 0 | 0.0% |
| Psychology | 50 | 5.0% |
| Social Sciences | 95 | 9.5% |
| Engineering | 70 | 7.0% |
| Multidisciplinary Studies | 37 | 3.7% |
| Science & Technology | 89 | 8.9% |
| Business | 213 | 21.3% |
| Education | 116 | 11.6% |
| Literature & Languages | 83 | 8.3% |
| Liberal Arts & History | 52 | 5.2% |
| Visual & Performing Arts | 71 | 7.1% |
| Communications | 11 | 1.1% |
| Arts & Humanities | 49 | 4.9% |
| Total | 999 | 100.0% |
Transportation & Commute in Fairfield Harbour
Vehicle Availability by Sex in Fairfield Harbour
The most prevalent vehicle ownership categories in Fairfield Harbour are males with 2 vehicles (145, accounting for 43.0%) and females with 2 vehicles (235, making up 30.3%).
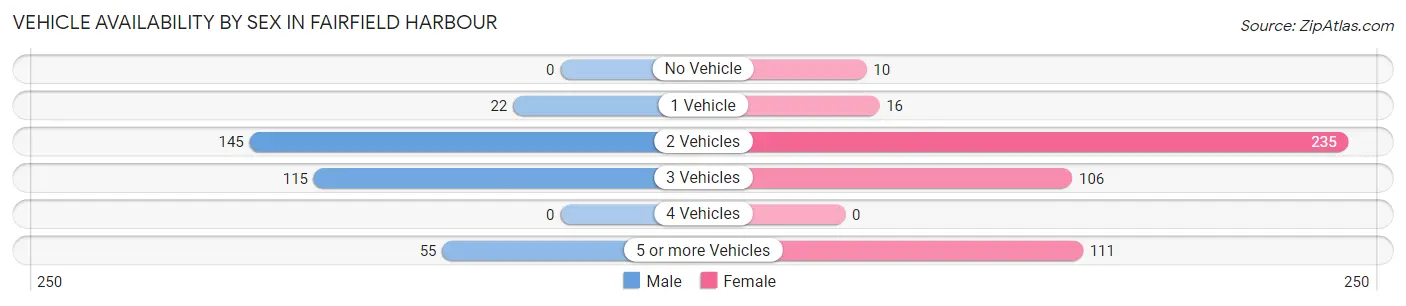
| Vehicles Available | Male | Female |
| No Vehicle | 0 (0.0%) | 10 (2.1%) |
| 1 Vehicle | 22 (6.5%) | 16 (3.4%) |
| 2 Vehicles | 145 (43.0%) | 235 (49.2%) |
| 3 Vehicles | 115 (34.1%) | 106 (22.2%) |
| 4 Vehicles | 0 (0.0%) | 0 (0.0%) |
| 5 or more Vehicles | 55 (16.3%) | 111 (23.2%) |
| Total | 337 (100.0%) | 478 (100.0%) |
Commute Time in Fairfield Harbour
The most frequently occuring commute durations in Fairfield Harbour are 20 to 24 minutes (148 commuters, 19.5%), 40 to 44 minutes (139 commuters, 18.3%), and 30 to 34 minutes (113 commuters, 14.9%).
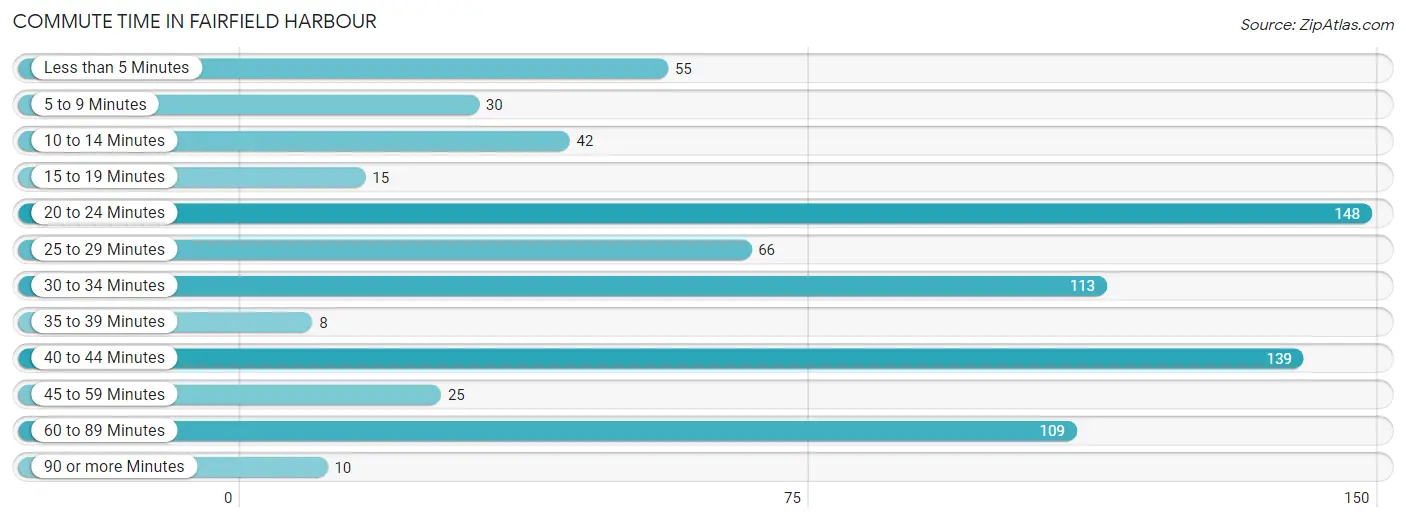
| Commute Time | # Commuters | % Commuters |
| Less than 5 Minutes | 55 | 7.2% |
| 5 to 9 Minutes | 30 | 4.0% |
| 10 to 14 Minutes | 42 | 5.5% |
| 15 to 19 Minutes | 15 | 2.0% |
| 20 to 24 Minutes | 148 | 19.5% |
| 25 to 29 Minutes | 66 | 8.7% |
| 30 to 34 Minutes | 113 | 14.9% |
| 35 to 39 Minutes | 8 | 1.1% |
| 40 to 44 Minutes | 139 | 18.3% |
| 45 to 59 Minutes | 25 | 3.3% |
| 60 to 89 Minutes | 109 | 14.3% |
| 90 or more Minutes | 10 | 1.3% |
Commute Time by Sex in Fairfield Harbour
The most common commute times in Fairfield Harbour are 20 to 24 minutes (99 commuters, 33.3%) for males and 40 to 44 minutes (130 commuters, 28.1%) for females.
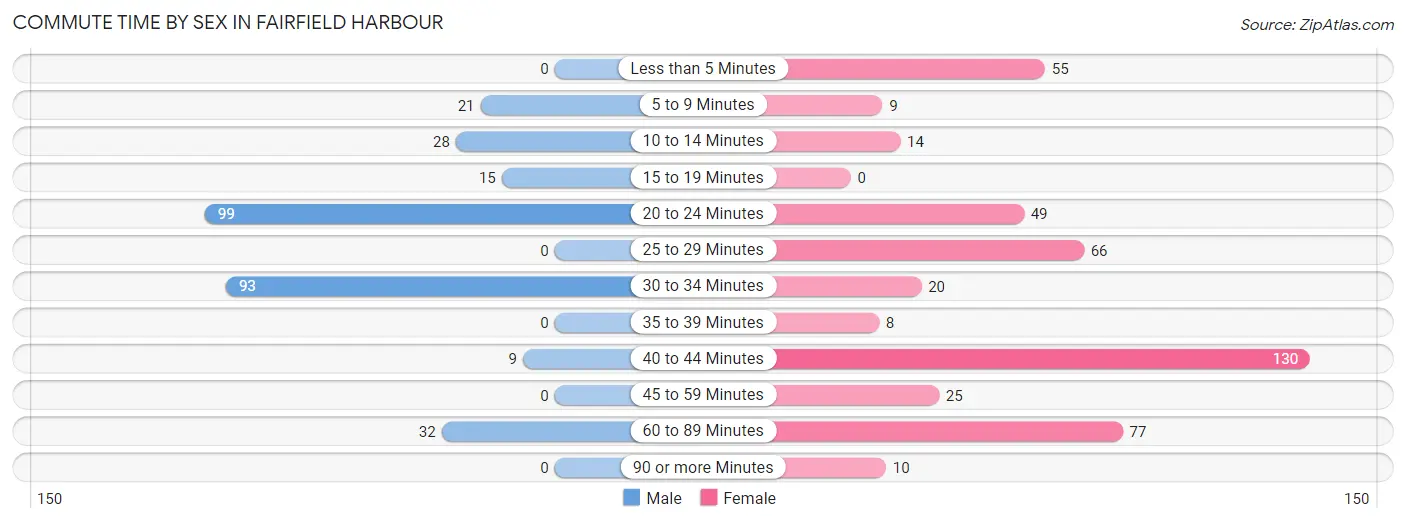
| Commute Time | Male | Female |
| Less than 5 Minutes | 0 (0.0%) | 55 (11.9%) |
| 5 to 9 Minutes | 21 (7.1%) | 9 (1.9%) |
| 10 to 14 Minutes | 28 (9.4%) | 14 (3.0%) |
| 15 to 19 Minutes | 15 (5.1%) | 0 (0.0%) |
| 20 to 24 Minutes | 99 (33.3%) | 49 (10.6%) |
| 25 to 29 Minutes | 0 (0.0%) | 66 (14.2%) |
| 30 to 34 Minutes | 93 (31.3%) | 20 (4.3%) |
| 35 to 39 Minutes | 0 (0.0%) | 8 (1.7%) |
| 40 to 44 Minutes | 9 (3.0%) | 130 (28.1%) |
| 45 to 59 Minutes | 0 (0.0%) | 25 (5.4%) |
| 60 to 89 Minutes | 32 (10.8%) | 77 (16.6%) |
| 90 or more Minutes | 0 (0.0%) | 10 (2.2%) |
Time of Departure to Work by Sex in Fairfield Harbour
The most frequent times of departure to work in Fairfield Harbour are 8:00 AM to 8:29 AM (61, 20.5%) for males and 6:00 AM to 6:29 AM (139, 30.0%) for females.
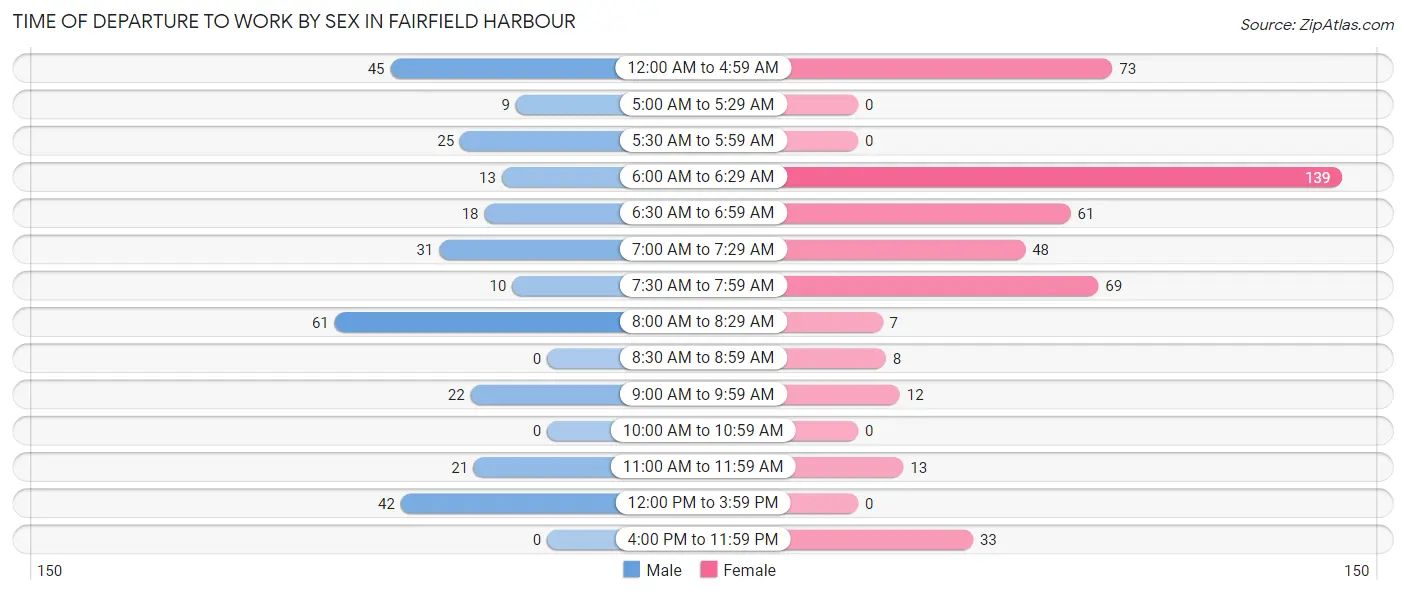
| Time of Departure | Male | Female |
| 12:00 AM to 4:59 AM | 45 (15.1%) | 73 (15.8%) |
| 5:00 AM to 5:29 AM | 9 (3.0%) | 0 (0.0%) |
| 5:30 AM to 5:59 AM | 25 (8.4%) | 0 (0.0%) |
| 6:00 AM to 6:29 AM | 13 (4.4%) | 139 (30.0%) |
| 6:30 AM to 6:59 AM | 18 (6.1%) | 61 (13.2%) |
| 7:00 AM to 7:29 AM | 31 (10.4%) | 48 (10.4%) |
| 7:30 AM to 7:59 AM | 10 (3.4%) | 69 (14.9%) |
| 8:00 AM to 8:29 AM | 61 (20.5%) | 7 (1.5%) |
| 8:30 AM to 8:59 AM | 0 (0.0%) | 8 (1.7%) |
| 9:00 AM to 9:59 AM | 22 (7.4%) | 12 (2.6%) |
| 10:00 AM to 10:59 AM | 0 (0.0%) | 0 (0.0%) |
| 11:00 AM to 11:59 AM | 21 (7.1%) | 13 (2.8%) |
| 12:00 PM to 3:59 PM | 42 (14.1%) | 0 (0.0%) |
| 4:00 PM to 11:59 PM | 0 (0.0%) | 33 (7.1%) |
| Total | 297 (100.0%) | 463 (100.0%) |
Housing Occupancy in Fairfield Harbour
Occupancy by Ownership in Fairfield Harbour
Of the total 1,318 dwellings in Fairfield Harbour, owner-occupied units account for 1,156 (87.7%), while renter-occupied units make up 162 (12.3%).
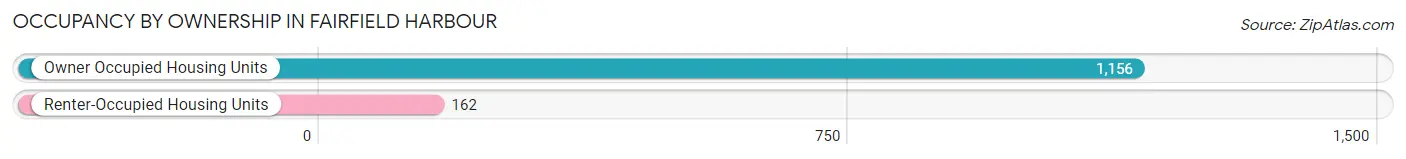
| Occupancy | # Housing Units | % Housing Units |
| Owner Occupied Housing Units | 1,156 | 87.7% |
| Renter-Occupied Housing Units | 162 | 12.3% |
| Total Occupied Housing Units | 1,318 | 100.0% |
Occupancy by Household Size in Fairfield Harbour
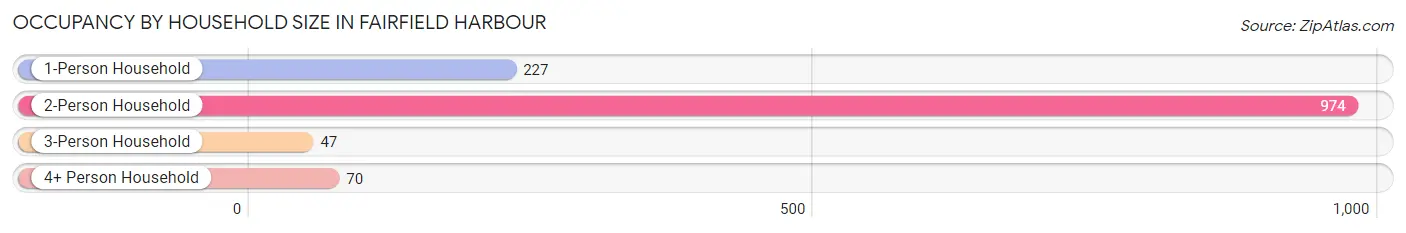
| Household Size | # Housing Units | % Housing Units |
| 1-Person Household | 227 | 17.2% |
| 2-Person Household | 974 | 73.9% |
| 3-Person Household | 47 | 3.6% |
| 4+ Person Household | 70 | 5.3% |
| Total Housing Units | 1,318 | 100.0% |
Occupancy by Ownership by Household Size in Fairfield Harbour
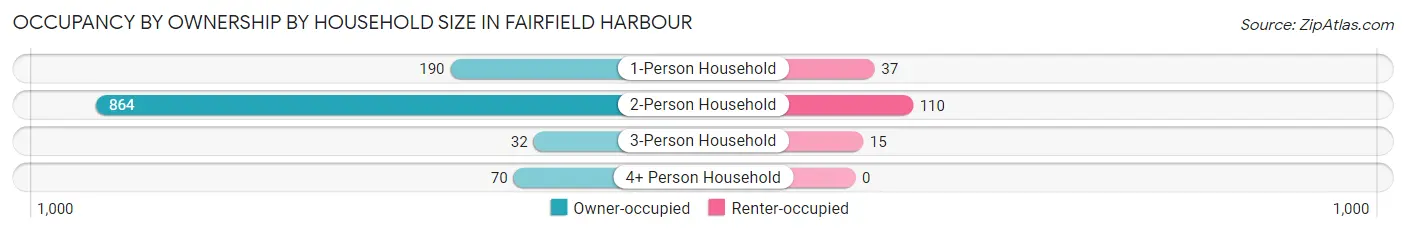
| Household Size | Owner-occupied | Renter-occupied |
| 1-Person Household | 190 (83.7%) | 37 (16.3%) |
| 2-Person Household | 864 (88.7%) | 110 (11.3%) |
| 3-Person Household | 32 (68.1%) | 15 (31.9%) |
| 4+ Person Household | 70 (100.0%) | 0 (0.0%) |
| Total Housing Units | 1,156 (87.7%) | 162 (12.3%) |
Occupancy by Educational Attainment in Fairfield Harbour
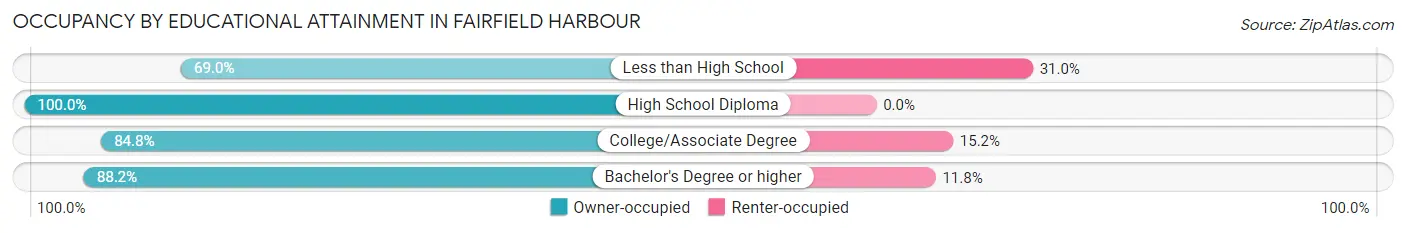
| Household Size | Owner-occupied | Renter-occupied |
| Less than High School | 20 (69.0%) | 9 (31.0%) |
| High School Diploma | 148 (100.0%) | 0 (0.0%) |
| College/Associate Degree | 463 (84.8%) | 83 (15.2%) |
| Bachelor's Degree or higher | 525 (88.2%) | 70 (11.8%) |
Occupancy by Age of Householder in Fairfield Harbour
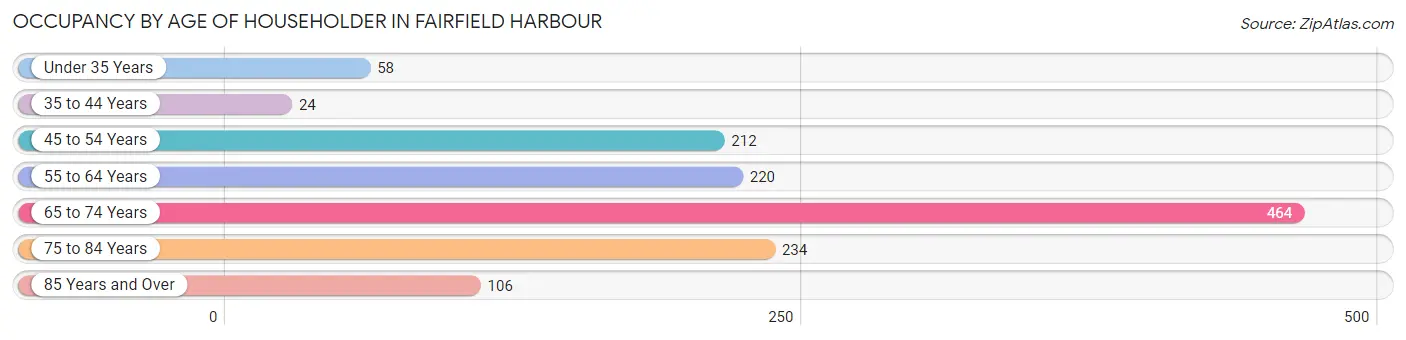
| Age Bracket | # Households | % Households |
| Under 35 Years | 58 | 4.4% |
| 35 to 44 Years | 24 | 1.8% |
| 45 to 54 Years | 212 | 16.1% |
| 55 to 64 Years | 220 | 16.7% |
| 65 to 74 Years | 464 | 35.2% |
| 75 to 84 Years | 234 | 17.7% |
| 85 Years and Over | 106 | 8.0% |
| Total | 1,318 | 100.0% |
Housing Finances in Fairfield Harbour
Median Income by Occupancy in Fairfield Harbour
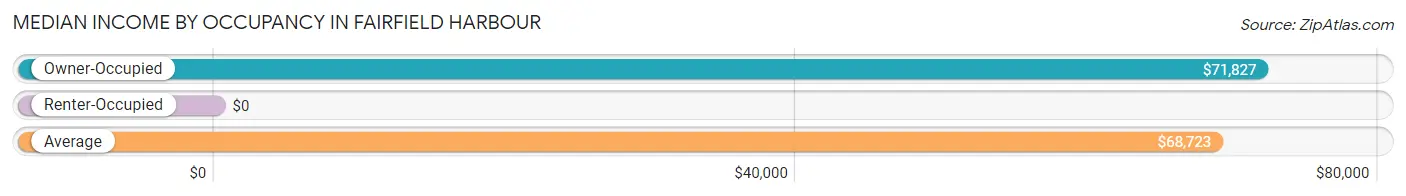
| Occupancy Type | # Households | Median Income |
| Owner-Occupied | 1,156 (87.7%) | $71,827 |
| Renter-Occupied | 162 (12.3%) | $0 |
| Average | 1,318 (100.0%) | $68,723 |
Occupancy by Householder Income Bracket in Fairfield Harbour
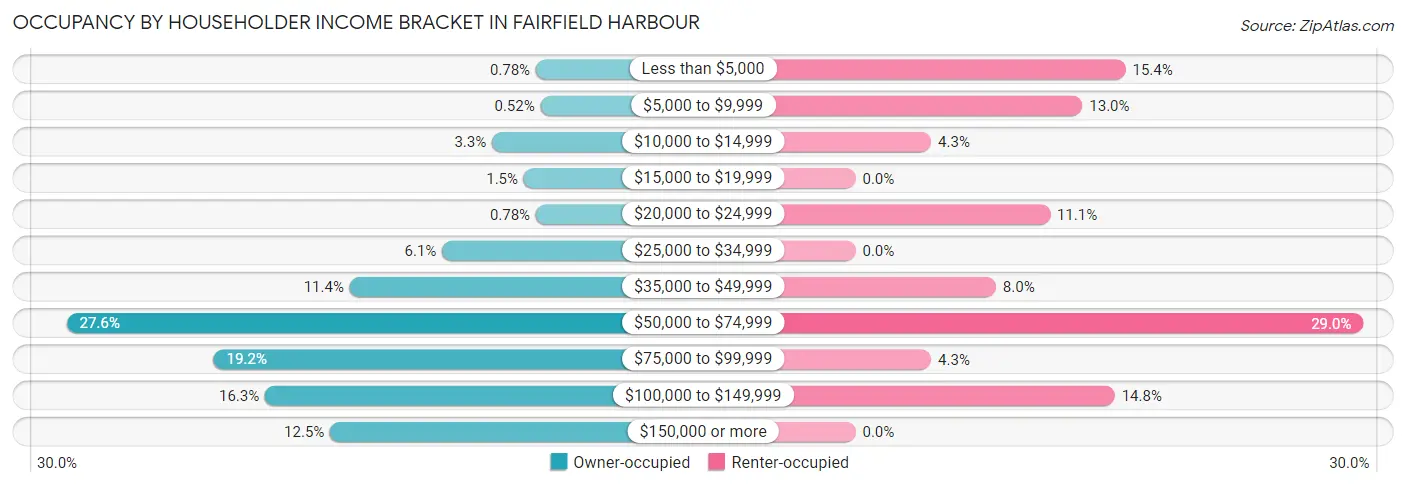
| Income Bracket | Owner-occupied | Renter-occupied |
| Less than $5,000 | 9 (0.8%) | 25 (15.4%) |
| $5,000 to $9,999 | 6 (0.5%) | 21 (13.0%) |
| $10,000 to $14,999 | 38 (3.3%) | 7 (4.3%) |
| $15,000 to $19,999 | 17 (1.5%) | 0 (0.0%) |
| $20,000 to $24,999 | 9 (0.8%) | 18 (11.1%) |
| $25,000 to $34,999 | 71 (6.1%) | 0 (0.0%) |
| $35,000 to $49,999 | 132 (11.4%) | 13 (8.0%) |
| $50,000 to $74,999 | 319 (27.6%) | 47 (29.0%) |
| $75,000 to $99,999 | 222 (19.2%) | 7 (4.3%) |
| $100,000 to $149,999 | 188 (16.3%) | 24 (14.8%) |
| $150,000 or more | 145 (12.5%) | 0 (0.0%) |
| Total | 1,156 (100.0%) | 162 (100.0%) |
Monthly Housing Cost Tiers in Fairfield Harbour
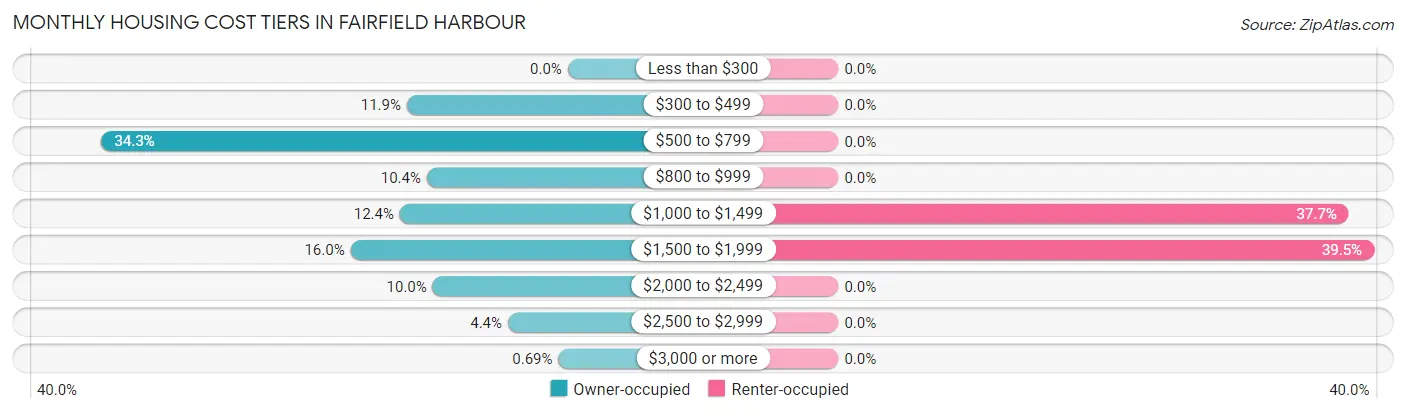
| Monthly Cost | Owner-occupied | Renter-occupied |
| Less than $300 | 0 (0.0%) | 0 (0.0%) |
| $300 to $499 | 137 (11.8%) | 0 (0.0%) |
| $500 to $799 | 397 (34.3%) | 0 (0.0%) |
| $800 to $999 | 120 (10.4%) | 0 (0.0%) |
| $1,000 to $1,499 | 143 (12.4%) | 61 (37.7%) |
| $1,500 to $1,999 | 185 (16.0%) | 64 (39.5%) |
| $2,000 to $2,499 | 115 (10.0%) | 0 (0.0%) |
| $2,500 to $2,999 | 51 (4.4%) | 0 (0.0%) |
| $3,000 or more | 8 (0.7%) | 0 (0.0%) |
| Total | 1,156 (100.0%) | 162 (100.0%) |
Physical Housing Characteristics in Fairfield Harbour
Housing Structures in Fairfield Harbour
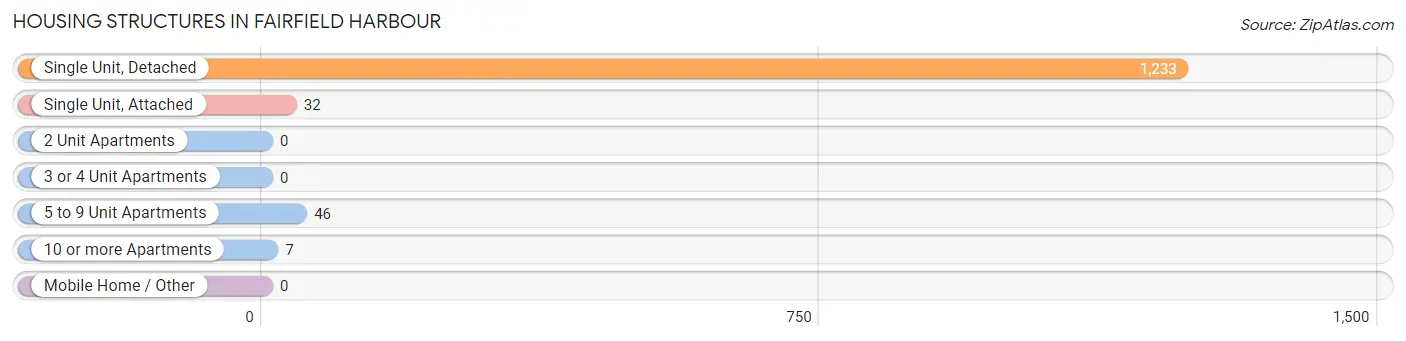
| Structure Type | # Housing Units | % Housing Units |
| Single Unit, Detached | 1,233 | 93.5% |
| Single Unit, Attached | 32 | 2.4% |
| 2 Unit Apartments | 0 | 0.0% |
| 3 or 4 Unit Apartments | 0 | 0.0% |
| 5 to 9 Unit Apartments | 46 | 3.5% |
| 10 or more Apartments | 7 | 0.5% |
| Mobile Home / Other | 0 | 0.0% |
| Total | 1,318 | 100.0% |
Housing Structures by Occupancy in Fairfield Harbour
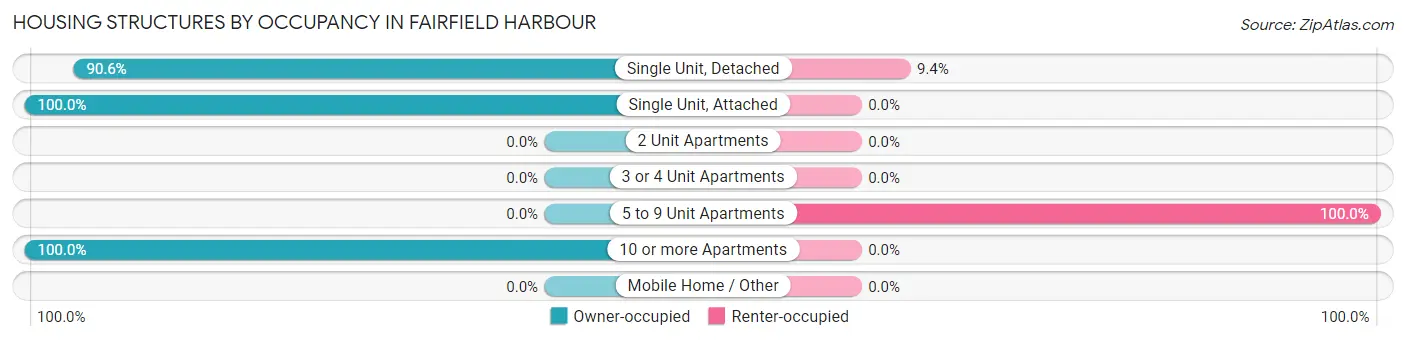
| Structure Type | Owner-occupied | Renter-occupied |
| Single Unit, Detached | 1,117 (90.6%) | 116 (9.4%) |
| Single Unit, Attached | 32 (100.0%) | 0 (0.0%) |
| 2 Unit Apartments | 0 (0.0%) | 0 (0.0%) |
| 3 or 4 Unit Apartments | 0 (0.0%) | 0 (0.0%) |
| 5 to 9 Unit Apartments | 0 (0.0%) | 46 (100.0%) |
| 10 or more Apartments | 7 (100.0%) | 0 (0.0%) |
| Mobile Home / Other | 0 (0.0%) | 0 (0.0%) |
| Total | 1,156 (87.7%) | 162 (12.3%) |
Housing Structures by Number of Rooms in Fairfield Harbour
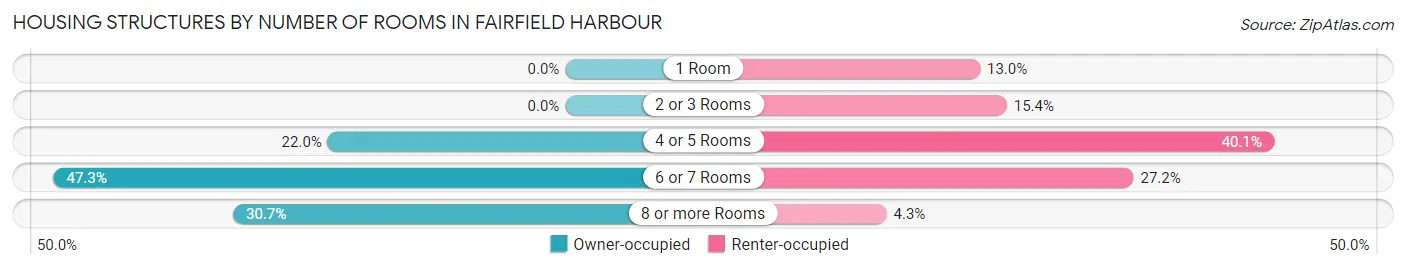
| Number of Rooms | Owner-occupied | Renter-occupied |
| 1 Room | 0 (0.0%) | 21 (13.0%) |
| 2 or 3 Rooms | 0 (0.0%) | 25 (15.4%) |
| 4 or 5 Rooms | 254 (22.0%) | 65 (40.1%) |
| 6 or 7 Rooms | 547 (47.3%) | 44 (27.2%) |
| 8 or more Rooms | 355 (30.7%) | 7 (4.3%) |
| Total | 1,156 (100.0%) | 162 (100.0%) |
Housing Structure by Heating Type in Fairfield Harbour
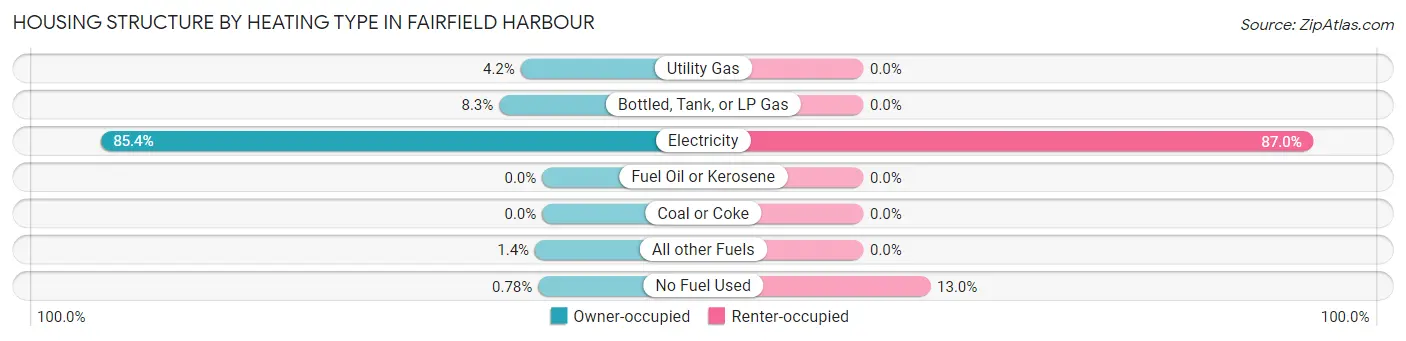
| Heating Type | Owner-occupied | Renter-occupied |
| Utility Gas | 48 (4.2%) | 0 (0.0%) |
| Bottled, Tank, or LP Gas | 96 (8.3%) | 0 (0.0%) |
| Electricity | 987 (85.4%) | 141 (87.0%) |
| Fuel Oil or Kerosene | 0 (0.0%) | 0 (0.0%) |
| Coal or Coke | 0 (0.0%) | 0 (0.0%) |
| All other Fuels | 16 (1.4%) | 0 (0.0%) |
| No Fuel Used | 9 (0.8%) | 21 (13.0%) |
| Total | 1,156 (100.0%) | 162 (100.0%) |
Household Vehicle Usage in Fairfield Harbour
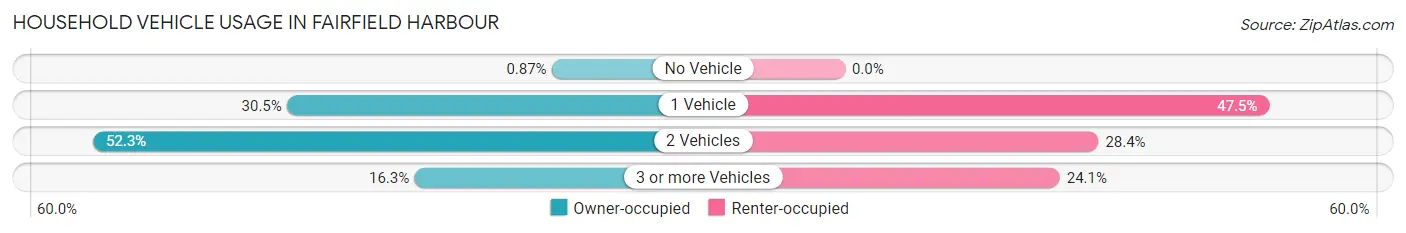
| Vehicles per Household | Owner-occupied | Renter-occupied |
| No Vehicle | 10 (0.9%) | 0 (0.0%) |
| 1 Vehicle | 353 (30.5%) | 77 (47.5%) |
| 2 Vehicles | 605 (52.3%) | 46 (28.4%) |
| 3 or more Vehicles | 188 (16.3%) | 39 (24.1%) |
| Total | 1,156 (100.0%) | 162 (100.0%) |
Real Estate & Mortgages in Fairfield Harbour
Real Estate and Mortgage Overview in Fairfield Harbour
| Characteristic | Without Mortgage | With Mortgage |
| Housing Units | 553 | 603 |
| Median Property Value | $254,400 | $254,600 |
| Median Household Income | $67,537 | $94 |
| Monthly Housing Costs | $570 | $8 |
| Real Estate Taxes | $1,359 | $0 |
Property Value by Mortgage Status in Fairfield Harbour
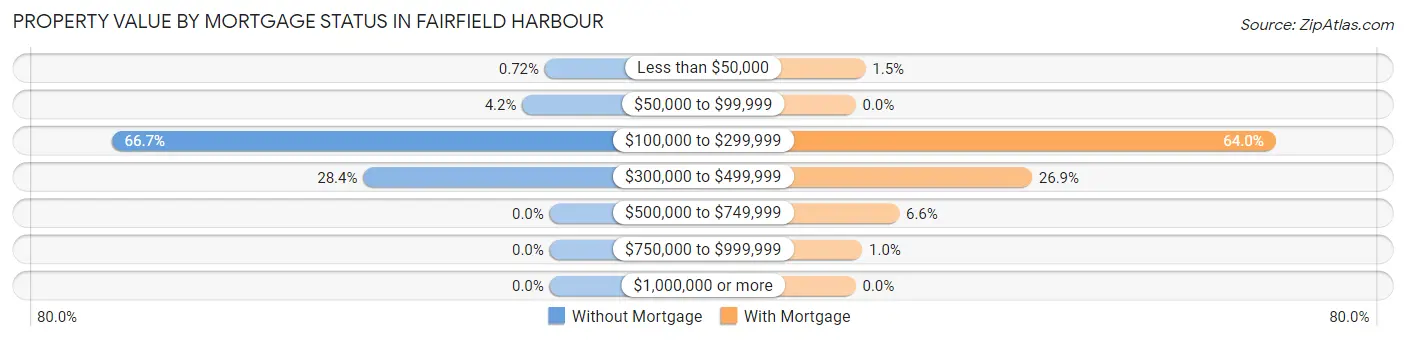
| Property Value | Without Mortgage | With Mortgage |
| Less than $50,000 | 4 (0.7%) | 9 (1.5%) |
| $50,000 to $99,999 | 23 (4.2%) | 0 (0.0%) |
| $100,000 to $299,999 | 369 (66.7%) | 386 (64.0%) |
| $300,000 to $499,999 | 157 (28.4%) | 162 (26.9%) |
| $500,000 to $749,999 | 0 (0.0%) | 40 (6.6%) |
| $750,000 to $999,999 | 0 (0.0%) | 6 (1.0%) |
| $1,000,000 or more | 0 (0.0%) | 0 (0.0%) |
| Total | 553 (100.0%) | 603 (100.0%) |
Household Income by Mortgage Status in Fairfield Harbour
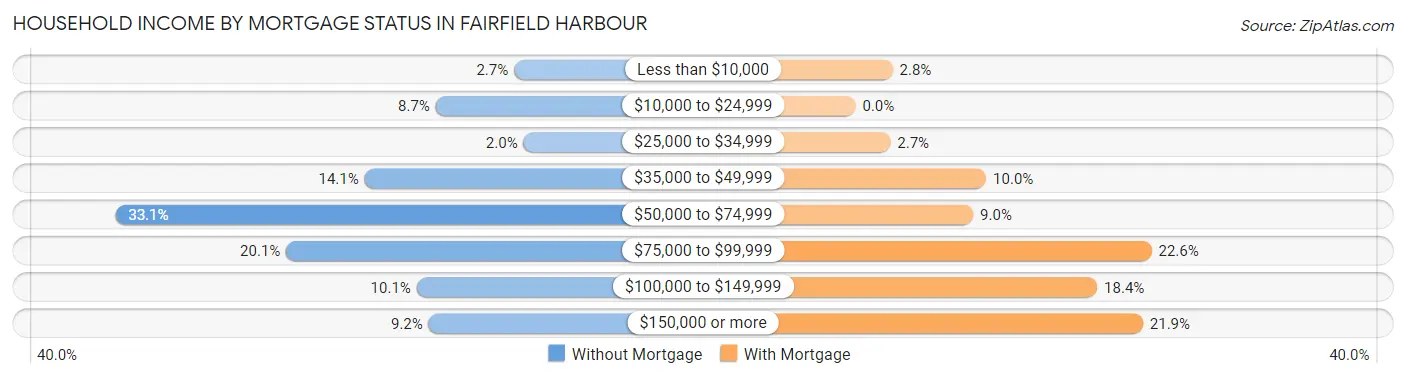
| Household Income | Without Mortgage | With Mortgage |
| Less than $10,000 | 15 (2.7%) | 17 (2.8%) |
| $10,000 to $24,999 | 48 (8.7%) | 0 (0.0%) |
| $25,000 to $34,999 | 11 (2.0%) | 16 (2.6%) |
| $35,000 to $49,999 | 78 (14.1%) | 60 (10.0%) |
| $50,000 to $74,999 | 183 (33.1%) | 54 (9.0%) |
| $75,000 to $99,999 | 111 (20.1%) | 136 (22.6%) |
| $100,000 to $149,999 | 56 (10.1%) | 111 (18.4%) |
| $150,000 or more | 51 (9.2%) | 132 (21.9%) |
| Total | 553 (100.0%) | 603 (100.0%) |
Property Value to Household Income Ratio in Fairfield Harbour
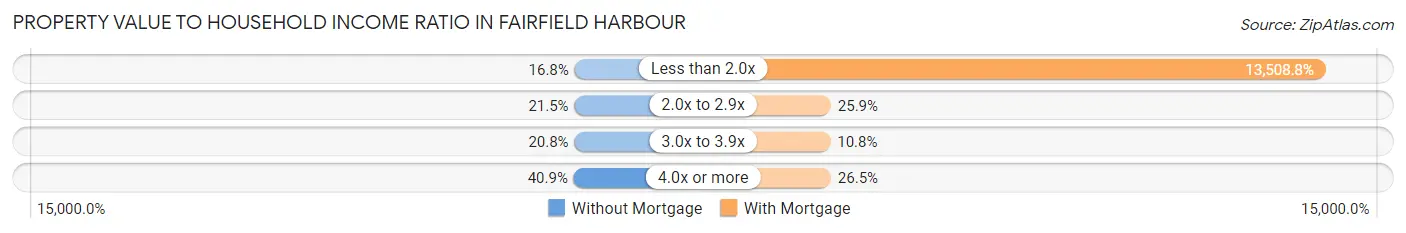
| Value-to-Income Ratio | Without Mortgage | With Mortgage |
| Less than 2.0x | 93 (16.8%) | 81,458 (13,508.8%) |
| 2.0x to 2.9x | 119 (21.5%) | 156 (25.9%) |
| 3.0x to 3.9x | 115 (20.8%) | 65 (10.8%) |
| 4.0x or more | 226 (40.9%) | 160 (26.5%) |
| Total | 553 (100.0%) | 603 (100.0%) |
Real Estate Taxes by Mortgage Status in Fairfield Harbour
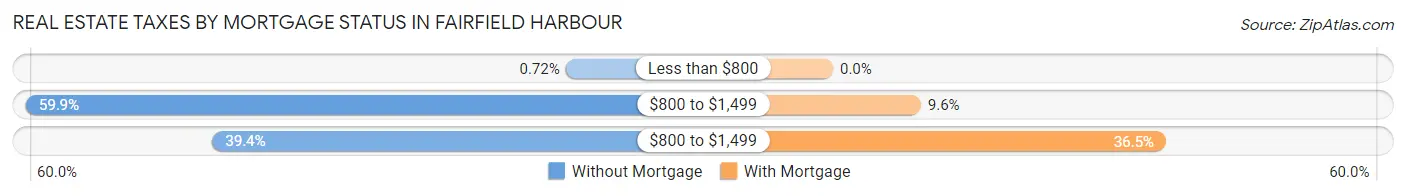
| Property Taxes | Without Mortgage | With Mortgage |
| Less than $800 | 4 (0.7%) | 0 (0.0%) |
| $800 to $1,499 | 331 (59.9%) | 58 (9.6%) |
| $800 to $1,499 | 218 (39.4%) | 220 (36.5%) |
| Total | 553 (100.0%) | 603 (100.0%) |
Health & Disability in Fairfield Harbour
Health Insurance Coverage by Age in Fairfield Harbour
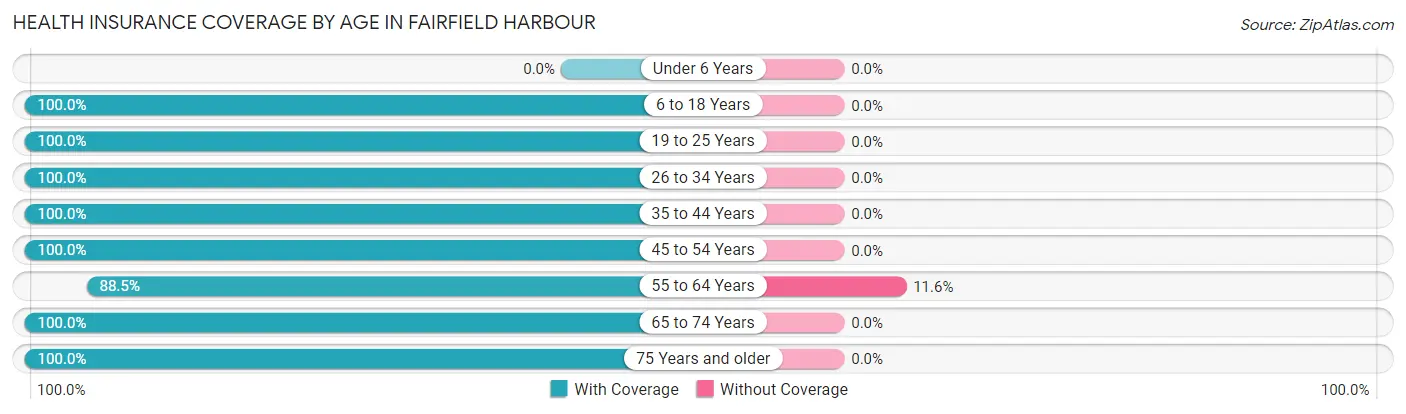
| Age Bracket | With Coverage | Without Coverage |
| Under 6 Years | 0 (0.0%) | 0 (0.0%) |
| 6 to 18 Years | 171 (100.0%) | 0 (0.0%) |
| 19 to 25 Years | 326 (100.0%) | 0 (0.0%) |
| 26 to 34 Years | 55 (100.0%) | 0 (0.0%) |
| 35 to 44 Years | 83 (100.0%) | 0 (0.0%) |
| 45 to 54 Years | 348 (100.0%) | 0 (0.0%) |
| 55 to 64 Years | 444 (88.4%) | 58 (11.6%) |
| 65 to 74 Years | 788 (100.0%) | 0 (0.0%) |
| 75 Years and older | 543 (100.0%) | 0 (0.0%) |
| Total | 2,758 (97.9%) | 58 (2.1%) |
Health Insurance Coverage by Citizenship Status in Fairfield Harbour
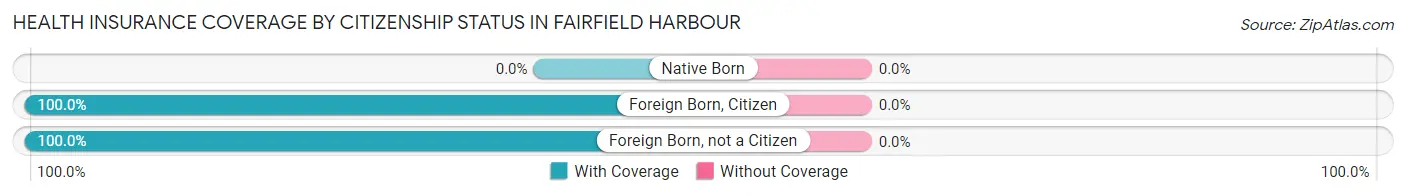
| Citizenship Status | With Coverage | Without Coverage |
| Native Born | 0 (0.0%) | 0 (0.0%) |
| Foreign Born, Citizen | 171 (100.0%) | 0 (0.0%) |
| Foreign Born, not a Citizen | 326 (100.0%) | 0 (0.0%) |
Health Insurance Coverage by Household Income in Fairfield Harbour
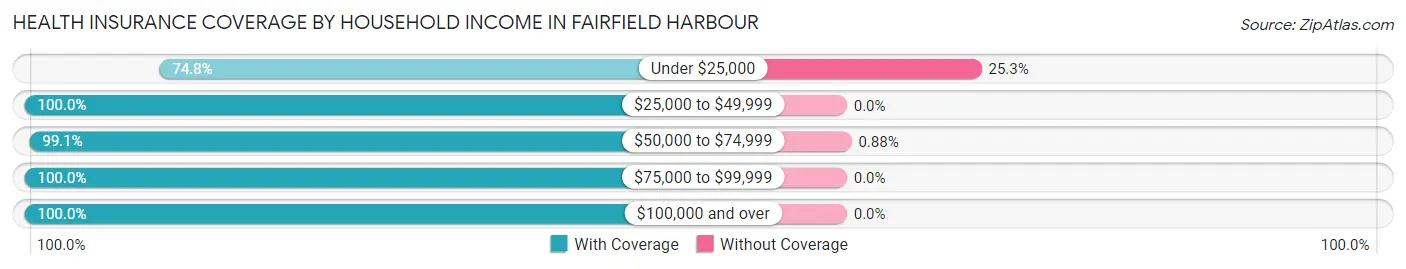
| Household Income | With Coverage | Without Coverage |
| Under $25,000 | 151 (74.8%) | 51 (25.3%) |
| $25,000 to $49,999 | 401 (100.0%) | 0 (0.0%) |
| $50,000 to $74,999 | 785 (99.1%) | 7 (0.9%) |
| $75,000 to $99,999 | 572 (100.0%) | 0 (0.0%) |
| $100,000 and over | 849 (100.0%) | 0 (0.0%) |
Public vs Private Health Insurance Coverage by Age in Fairfield Harbour
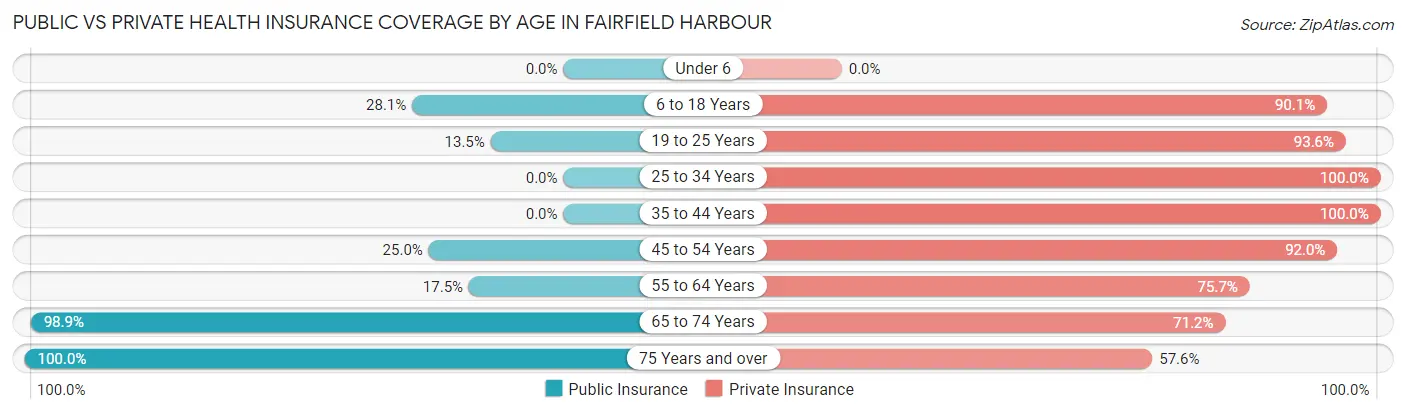
| Age Bracket | Public Insurance | Private Insurance |
| Under 6 | 0 (0.0%) | 0 (0.0%) |
| 6 to 18 Years | 48 (28.1%) | 154 (90.1%) |
| 19 to 25 Years | 44 (13.5%) | 305 (93.6%) |
| 25 to 34 Years | 0 (0.0%) | 55 (100.0%) |
| 35 to 44 Years | 0 (0.0%) | 83 (100.0%) |
| 45 to 54 Years | 87 (25.0%) | 320 (91.9%) |
| 55 to 64 Years | 88 (17.5%) | 380 (75.7%) |
| 65 to 74 Years | 779 (98.9%) | 561 (71.2%) |
| 75 Years and over | 543 (100.0%) | 313 (57.6%) |
| Total | 1,589 (56.4%) | 2,171 (77.1%) |
Disability Status by Sex by Age in Fairfield Harbour
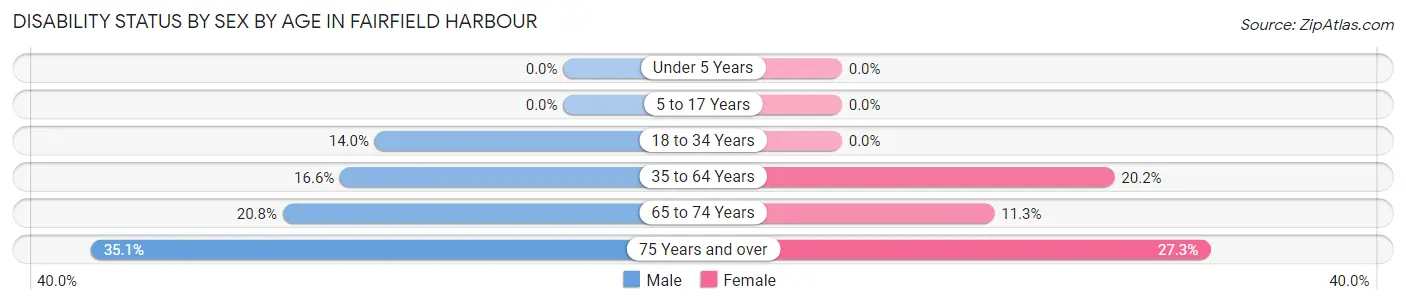
| Age Bracket | Male | Female |
| Under 5 Years | 0 (0.0%) | 0 (0.0%) |
| 5 to 17 Years | 0 (0.0%) | 0 (0.0%) |
| 18 to 34 Years | 14 (14.0%) | 0 (0.0%) |
| 35 to 64 Years | 58 (16.6%) | 118 (20.2%) |
| 65 to 74 Years | 85 (20.8%) | 43 (11.3%) |
| 75 Years and over | 93 (35.1%) | 76 (27.3%) |
Disability Class by Sex by Age in Fairfield Harbour
Disability Class: Hearing Difficulty
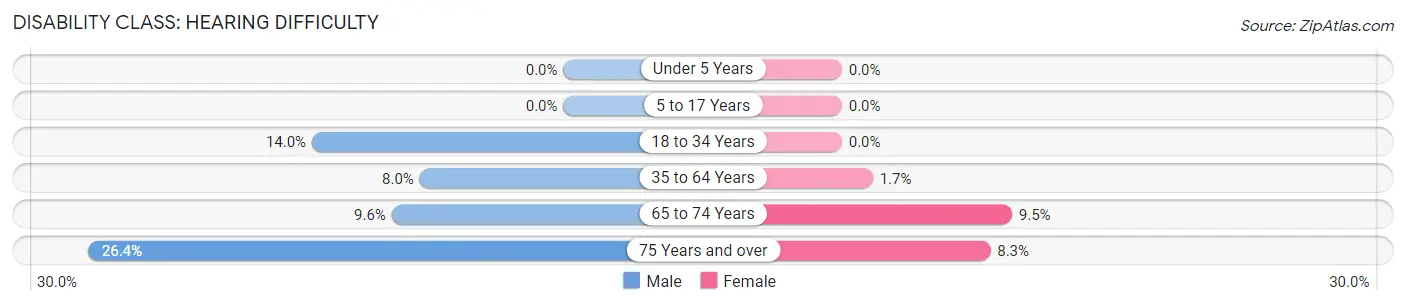
| Age Bracket | Male | Female |
| Under 5 Years | 0 (0.0%) | 0 (0.0%) |
| 5 to 17 Years | 0 (0.0%) | 0 (0.0%) |
| 18 to 34 Years | 14 (14.0%) | 0 (0.0%) |
| 35 to 64 Years | 28 (8.0%) | 10 (1.7%) |
| 65 to 74 Years | 39 (9.6%) | 36 (9.5%) |
| 75 Years and over | 70 (26.4%) | 23 (8.3%) |
Disability Class: Vision Difficulty
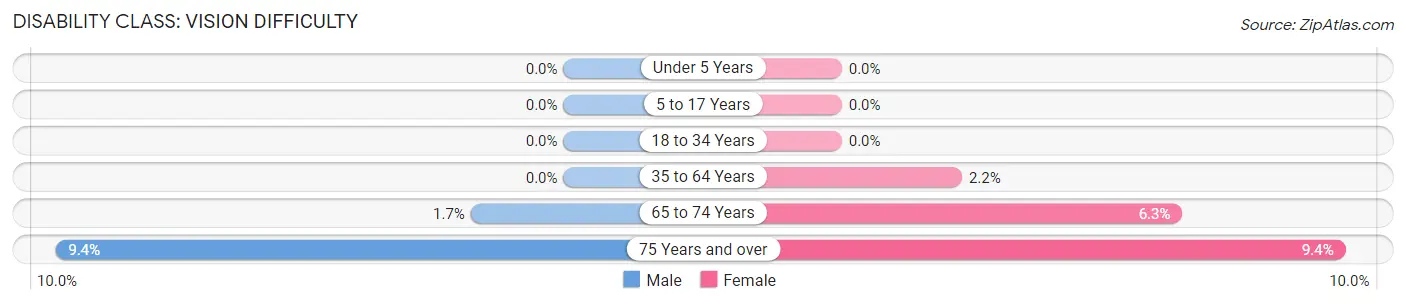
| Age Bracket | Male | Female |
| Under 5 Years | 0 (0.0%) | 0 (0.0%) |
| 5 to 17 Years | 0 (0.0%) | 0 (0.0%) |
| 18 to 34 Years | 0 (0.0%) | 0 (0.0%) |
| 35 to 64 Years | 0 (0.0%) | 13 (2.2%) |
| 65 to 74 Years | 7 (1.7%) | 24 (6.3%) |
| 75 Years and over | 25 (9.4%) | 26 (9.3%) |
Disability Class: Cognitive Difficulty
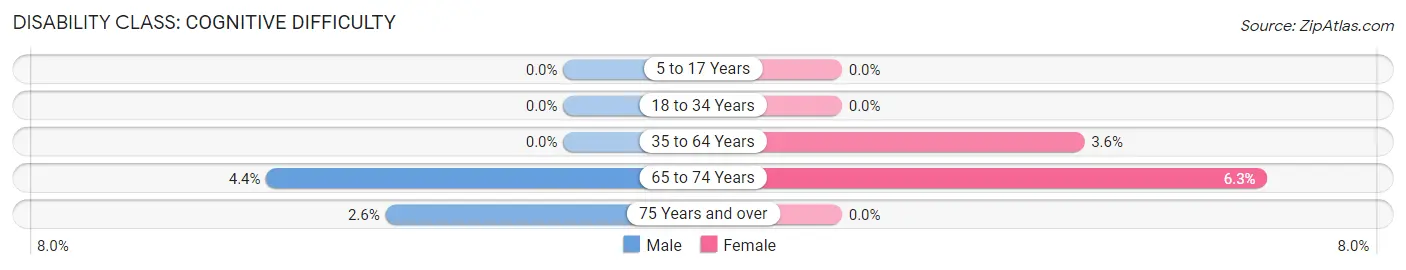
| Age Bracket | Male | Female |
| 5 to 17 Years | 0 (0.0%) | 0 (0.0%) |
| 18 to 34 Years | 0 (0.0%) | 0 (0.0%) |
| 35 to 64 Years | 0 (0.0%) | 21 (3.6%) |
| 65 to 74 Years | 18 (4.4%) | 24 (6.3%) |
| 75 Years and over | 7 (2.6%) | 0 (0.0%) |
Disability Class: Ambulatory Difficulty
| Age Bracket | Male | Female |
| 5 to 17 Years | 0 (0.0%) | 0 (0.0%) |
| 18 to 34 Years | 0 (0.0%) | 0 (0.0%) |
| 35 to 64 Years | 16 (4.6%) | 87 (14.9%) |
| 65 to 74 Years | 70 (17.2%) | 7 (1.8%) |
| 75 Years and over | 38 (14.3%) | 36 (13.0%) |
Disability Class: Self-Care Difficulty
| Age Bracket | Male | Female |
| 5 to 17 Years | 0 (0.0%) | 0 (0.0%) |
| 18 to 34 Years | 0 (0.0%) | 0 (0.0%) |
| 35 to 64 Years | 7 (2.0%) | 36 (6.2%) |
| 65 to 74 Years | 35 (8.6%) | 0 (0.0%) |
| 75 Years and over | 8 (3.0%) | 0 (0.0%) |
Technology Access in Fairfield Harbour
Computing Device Access in Fairfield Harbour
| Device Type | # Households | % Households |
| Desktop or Laptop | 1,150 | 87.3% |
| Smartphone | 1,195 | 90.7% |
| Tablet | 910 | 69.0% |
| No Computing Device | 9 | 0.7% |
| Total | 1,318 | 100.0% |
Internet Access in Fairfield Harbour
| Internet Type | # Households | % Households |
| Dial-Up Internet | 8 | 0.6% |
| Broadband Home | 1,054 | 80.0% |
| Cellular Data Only | 105 | 8.0% |
| Satellite Internet | 71 | 5.4% |
| No Internet | 138 | 10.5% |
| Total | 1,318 | 100.0% |
Fairfield Harbour Summary
Fairfield Harbour is a small, unincorporated community located in Craven County, North Carolina. It is situated on the Neuse River, approximately 20 miles east of New Bern, the county seat. The community is part of the New Bern Metropolitan Statistical Area and is home to approximately 1,500 people.
History
Fairfield Harbour was founded in the late 1960s as a planned community. It was developed by the Fairfield Harbour Corporation, which was owned by the North Carolina National Bank. The community was designed to be a self-contained, master-planned community with a variety of amenities, including a marina, golf course, tennis courts, and a clubhouse.
The community was initially developed as a retirement community, but it has since become a popular destination for vacationers and second-home owners. The community has grown steadily over the years and now includes a variety of residential, commercial, and recreational properties.
Geography
Fairfield Harbour is located in eastern North Carolina, approximately 20 miles east of New Bern. It is situated on the Neuse River, which is part of the Intracoastal Waterway. The community is surrounded by a variety of natural features, including wetlands, forests, and creeks.
The climate in Fairfield Harbour is humid subtropical, with hot, humid summers and mild winters. The average annual temperature is around 70 degrees Fahrenheit, and the average annual precipitation is around 50 inches.
Economy
The economy of Fairfield Harbour is largely driven by tourism and second-home ownership. The community is home to a variety of recreational activities, including golf, tennis, fishing, and boating. There are also several restaurants, shops, and other businesses in the area.
Demographics
As of the 2010 census, the population of Fairfield Harbour was 1,521. The racial makeup of the community was 94.3% White, 2.2% African American, 0.7% Native American, 0.7% Asian, 0.2% Pacific Islander, and 1.9% from other races. The median household income was $50,938, and the median family income was $60,938.
Conclusion
Fairfield Harbour is a small, unincorporated community located in Craven County, North Carolina. It is situated on the Neuse River, approximately 20 miles east of New Bern, the county seat. The community was founded in the late 1960s as a planned community and has since become a popular destination for vacationers and second-home owners. The economy of Fairfield Harbour is largely driven by tourism and second-home ownership, and the population of the community was 1,521 as of the 2010 census.
Common Questions
What is Per Capita Income in Fairfield Harbour?
Per Capita income in Fairfield Harbour is $40,064.
What is the Median Family Income in Fairfield Harbour?
Median Family Income in Fairfield Harbour is $74,922.
What is the Median Household income in Fairfield Harbour?
Median Household Income in Fairfield Harbour is $68,723.
What is Income or Wage Gap in Fairfield Harbour?
Income or Wage Gap in Fairfield Harbour is 43.1%.
Women in Fairfield Harbour earn 56.9 cents for every dollar earned by a man.
What is Inequality or Gini Index in Fairfield Harbour?
Inequality or Gini Index in Fairfield Harbour is 0.38.
What is the Total Population of Fairfield Harbour?
Total Population of Fairfield Harbour is 2,816.
What is the Total Male Population of Fairfield Harbour?
Total Male Population of Fairfield Harbour is 1,222.
What is the Total Female Population of Fairfield Harbour?
Total Female Population of Fairfield Harbour is 1,594.
What is the Ratio of Males per 100 Females in Fairfield Harbour?
There are 76.66 Males per 100 Females in Fairfield Harbour.
What is the Ratio of Females per 100 Males in Fairfield Harbour?
There are 130.44 Females per 100 Males in Fairfield Harbour.
What is the Median Population Age in Fairfield Harbour?
Median Population Age in Fairfield Harbour is 64.0 Years.
What is the Average Family Size in Fairfield Harbour
Average Family Size in Fairfield Harbour is 2.3 People.
What is the Average Household Size in Fairfield Harbour
Average Household Size in Fairfield Harbour is 2.1 People.
How Large is the Labor Force in Fairfield Harbour?
There are 935 People in the Labor Forcein in Fairfield Harbour.
What is the Percentage of People in the Labor Force in Fairfield Harbour?
35.1% of People are in the Labor Force in Fairfield Harbour.
What is the Unemployment Rate in Fairfield Harbour?
Unemployment Rate in Fairfield Harbour is 9.4%.