Mount Olive, NC Map & Demographics
Mount Olive Map
Mount Olive Overview
$27,462
PER CAPITA INCOME
$63,686
AVG FAMILY INCOME
$41,738
AVG HOUSEHOLD INCOME
19.5%
WAGE / INCOME GAP [ % ]
80.5¢/ $1
WAGE / INCOME GAP [ $ ]
0.50
INEQUALITY / GINI INDEX
4,286
TOTAL POPULATION
2,332
MALE POPULATION
1,954
FEMALE POPULATION
119.34
MALES / 100 FEMALES
83.79
FEMALES / 100 MALES
41.9
MEDIAN AGE
2.9
AVG FAMILY SIZE
2.2
AVG HOUSEHOLD SIZE
2,134
LABOR FORCE [ PEOPLE ]
56.5%
PERCENT IN LABOR FORCE
7.1%
UNEMPLOYMENT RATE
Mount Olive Zip Codes
Mount Olive Area Codes
Income in Mount Olive
Income Overview in Mount Olive
Per Capita Income in Mount Olive is $27,462, while median incomes of families and households are $63,686 and $41,738 respectively.
| Characteristic | Number | Measure |
| Per Capita Income | 4,286 | $27,462 |
| Median Family Income | 911 | $63,686 |
| Mean Family Income | 911 | $83,190 |
| Median Household Income | 1,736 | $41,738 |
| Mean Household Income | 1,736 | $60,886 |
| Income Deficit | 911 | $0 |
| Wage / Income Gap (%) | 4,286 | 19.50% |
| Wage / Income Gap ($) | 4,286 | 80.50¢ per $1 |
| Gini / Inequality Index | 4,286 | 0.50 |
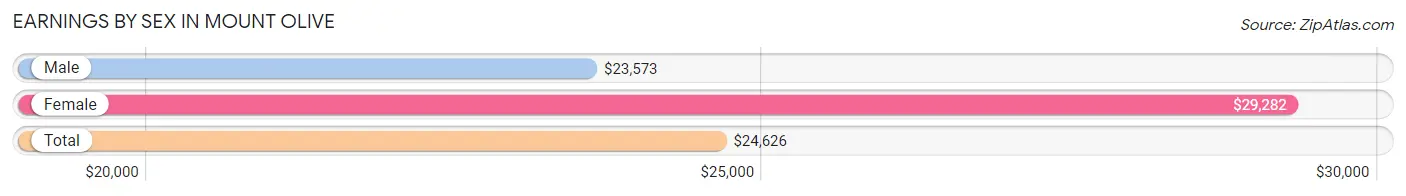
Earnings by Sex in Mount Olive
Average Earnings in Mount Olive are $24,626, $23,573 for men and $29,282 for women, a difference of 19.5%.
| Sex | Number | Average Earnings |
| Male | 1,295 (57.1%) | $23,573 |
| Female | 975 (42.9%) | $29,282 |
| Total | 2,270 (100.0%) | $24,626 |
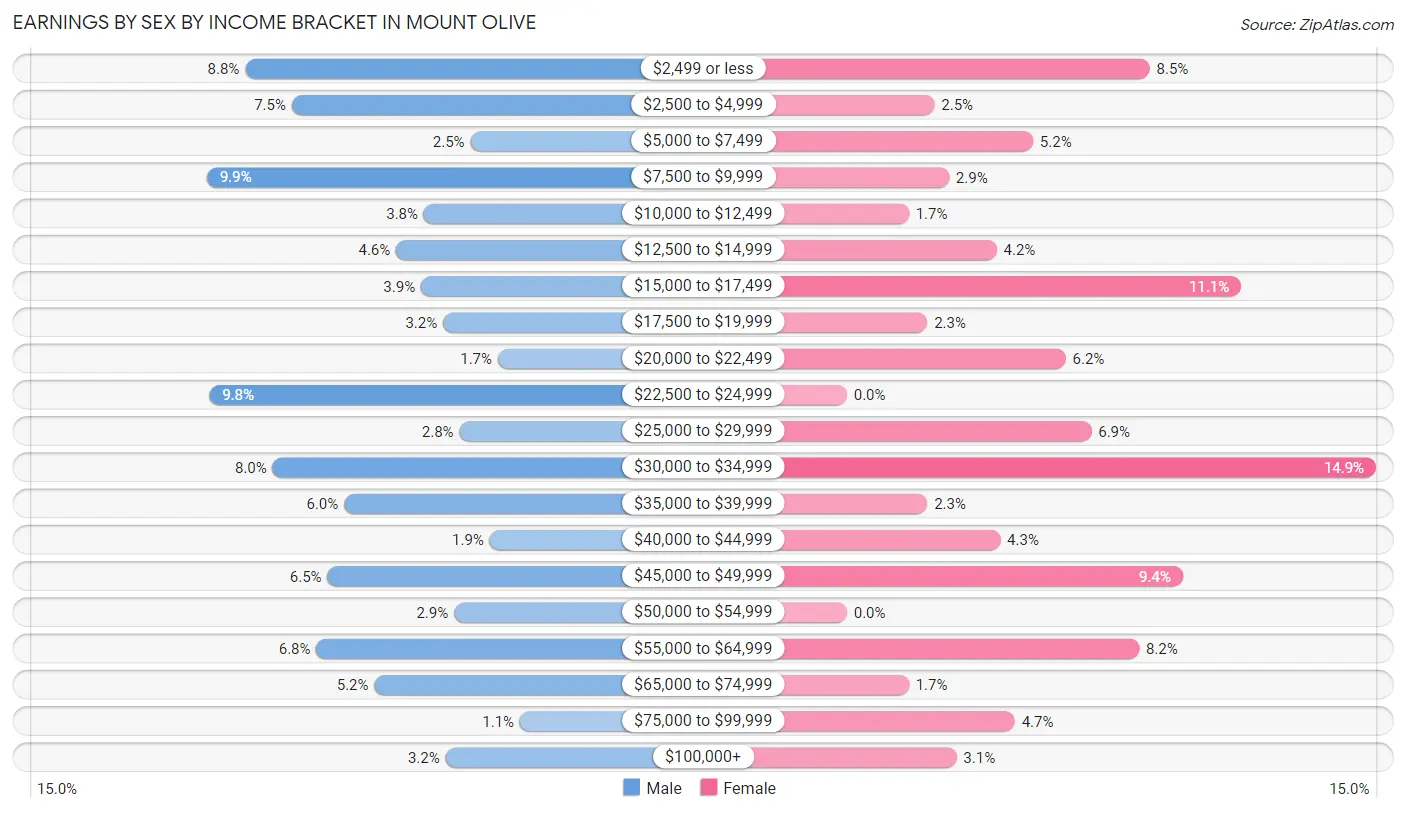
Earnings by Sex by Income Bracket in Mount Olive
The most common earnings brackets in Mount Olive are $7,500 to $9,999 for men (128 | 9.9%) and $30,000 to $34,999 for women (145 | 14.9%).
| Income | Male | Female |
| $2,499 or less | 114 (8.8%) | 83 (8.5%) |
| $2,500 to $4,999 | 97 (7.5%) | 24 (2.5%) |
| $5,000 to $7,499 | 32 (2.5%) | 51 (5.2%) |
| $7,500 to $9,999 | 128 (9.9%) | 28 (2.9%) |
| $10,000 to $12,499 | 49 (3.8%) | 17 (1.7%) |
| $12,500 to $14,999 | 59 (4.6%) | 41 (4.2%) |
| $15,000 to $17,499 | 50 (3.9%) | 108 (11.1%) |
| $17,500 to $19,999 | 42 (3.2%) | 22 (2.3%) |
| $20,000 to $22,499 | 22 (1.7%) | 60 (6.1%) |
| $22,500 to $24,999 | 127 (9.8%) | 0 (0.0%) |
| $25,000 to $29,999 | 36 (2.8%) | 67 (6.9%) |
| $30,000 to $34,999 | 104 (8.0%) | 145 (14.9%) |
| $35,000 to $39,999 | 78 (6.0%) | 22 (2.3%) |
| $40,000 to $44,999 | 25 (1.9%) | 42 (4.3%) |
| $45,000 to $49,999 | 84 (6.5%) | 92 (9.4%) |
| $50,000 to $54,999 | 38 (2.9%) | 0 (0.0%) |
| $55,000 to $64,999 | 88 (6.8%) | 80 (8.2%) |
| $65,000 to $74,999 | 67 (5.2%) | 17 (1.7%) |
| $75,000 to $99,999 | 14 (1.1%) | 46 (4.7%) |
| $100,000+ | 41 (3.2%) | 30 (3.1%) |
| Total | 1,295 (100.0%) | 975 (100.0%) |
Earnings by Sex by Educational Attainment in Mount Olive
Average earnings in Mount Olive are $33,254 for men and $33,374 for women, a difference of 0.4%. Men with an educational attainment of graduate degree enjoy the highest average annual earnings of $66,786, while those with high school diploma education earn the least with $23,680. Women with an educational attainment of bachelor's degree earn the most with the average annual earnings of $58,846, while those with less than high school education have the smallest earnings of $27,625.

| Educational Attainment | Male Income | Female Income |
| Less than High School | - | - |
| High School Diploma | $23,680 | $32,744 |
| College or Associate's Degree | $33,750 | $33,819 |
| Bachelor's Degree | $45,917 | $58,846 |
| Graduate Degree | $66,786 | $0 |
| Total | $33,254 | $33,374 |
Family Income in Mount Olive
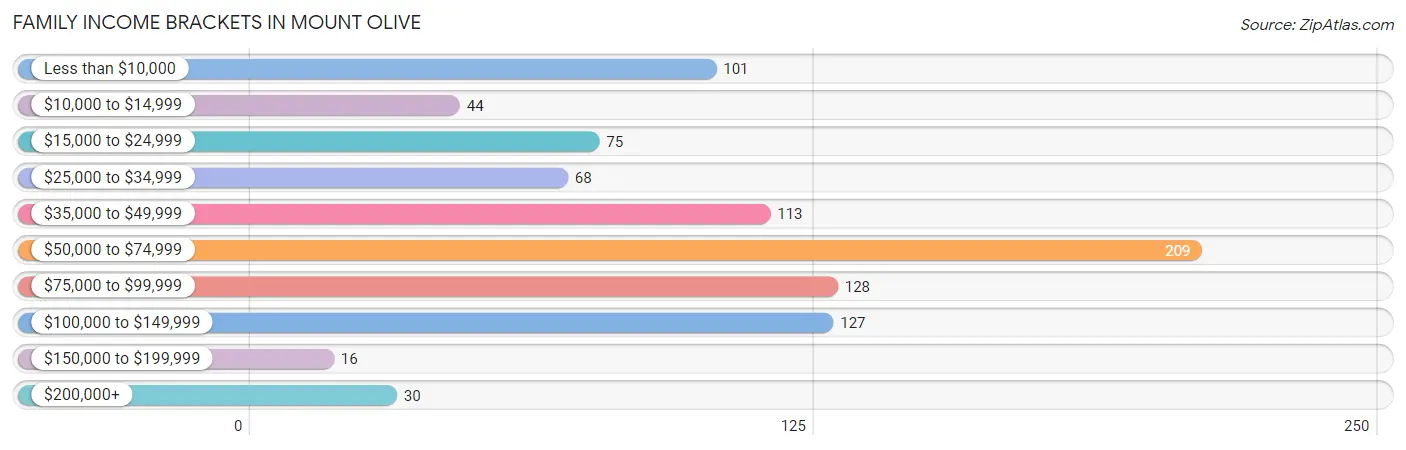
Family Income Brackets in Mount Olive
According to the Mount Olive family income data, there are 209 families falling into the $50,000 to $74,999 income range, which is the most common income bracket and makes up 22.9% of all families. Conversely, the $150,000 to $199,999 income bracket is the least frequent group with only 16 families (1.8%) belonging to this category.
| Income Bracket | # Families | % Families |
| Less than $10,000 | 101 | 11.1% |
| $10,000 to $14,999 | 44 | 4.8% |
| $15,000 to $24,999 | 75 | 8.2% |
| $25,000 to $34,999 | 68 | 7.5% |
| $35,000 to $49,999 | 113 | 12.4% |
| $50,000 to $74,999 | 209 | 22.9% |
| $75,000 to $99,999 | 128 | 14.1% |
| $100,000 to $149,999 | 127 | 13.9% |
| $150,000 to $199,999 | 16 | 1.8% |
| $200,000+ | 30 | 3.3% |
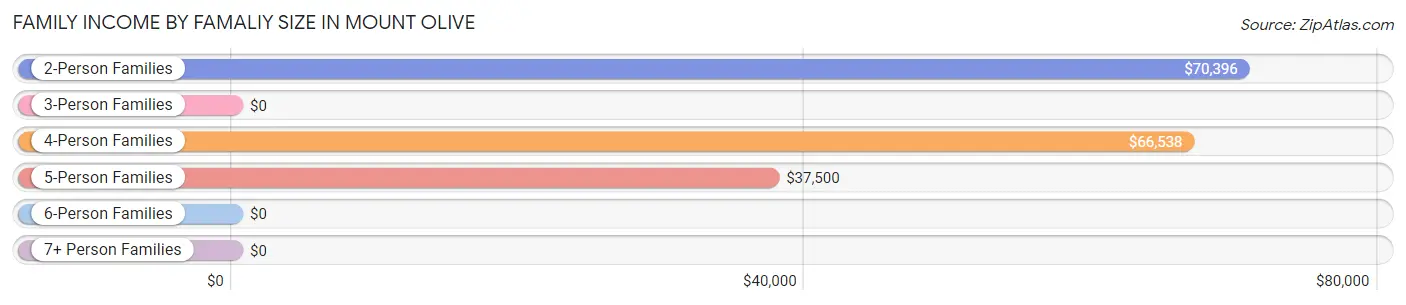
Family Income by Famaliy Size in Mount Olive
2-person families (447 | 49.1%) account for the highest median family income in Mount Olive with $70,396 per family, while 2-person families (447 | 49.1%) have the highest median income of $35,198 per family member.
| Income Bracket | # Families | Median Income |
| 2-Person Families | 447 (49.1%) | $70,396 |
| 3-Person Families | 242 (26.6%) | $0 |
| 4-Person Families | 158 (17.3%) | $66,538 |
| 5-Person Families | 64 (7.0%) | $37,500 |
| 6-Person Families | 0 (0.0%) | $0 |
| 7+ Person Families | 0 (0.0%) | $0 |
| Total | 911 (100.0%) | $63,686 |
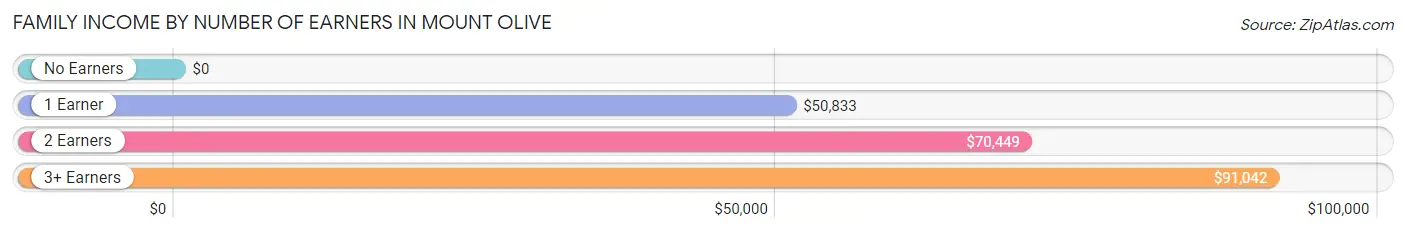
Family Income by Number of Earners in Mount Olive
| Number of Earners | # Families | Median Income |
| No Earners | 152 (16.7%) | $0 |
| 1 Earner | 388 (42.6%) | $50,833 |
| 2 Earners | 288 (31.6%) | $70,449 |
| 3+ Earners | 83 (9.1%) | $91,042 |
| Total | 911 (100.0%) | $63,686 |
Household Income in Mount Olive
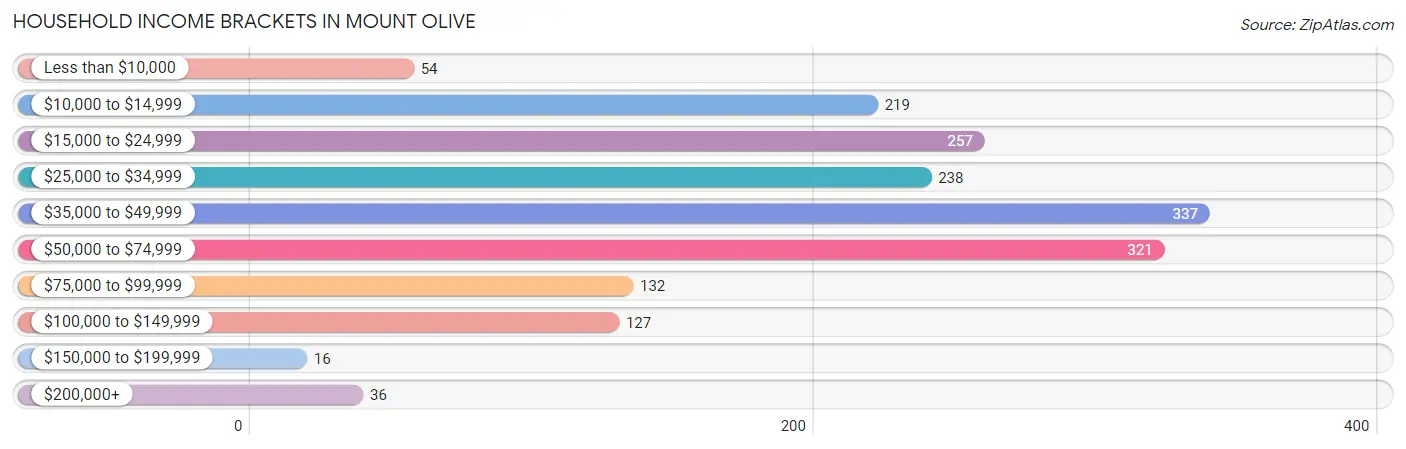
Household Income Brackets in Mount Olive
With 337 households falling in the category, the $35,000 to $49,999 income range is the most frequent in Mount Olive, accounting for 19.4% of all households. In contrast, only 16 households (0.9%) fall into the $150,000 to $199,999 income bracket, making it the least populous group.
| Income Bracket | # Households | % Households |
| Less than $10,000 | 54 | 3.1% |
| $10,000 to $14,999 | 219 | 12.6% |
| $15,000 to $24,999 | 257 | 14.8% |
| $25,000 to $34,999 | 238 | 13.7% |
| $35,000 to $49,999 | 337 | 19.4% |
| $50,000 to $74,999 | 321 | 18.5% |
| $75,000 to $99,999 | 132 | 7.6% |
| $100,000 to $149,999 | 127 | 7.3% |
| $150,000 to $199,999 | 16 | 0.9% |
| $200,000+ | 36 | 2.1% |
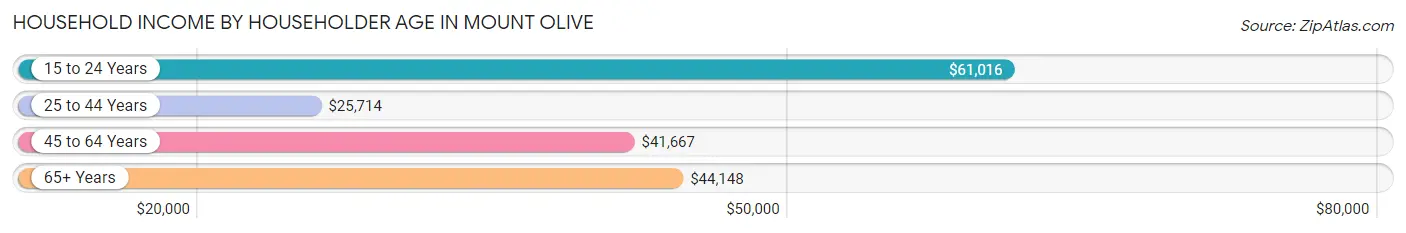
Household Income by Householder Age in Mount Olive
The median household income in Mount Olive is $41,738, with the highest median household income of $61,016 found in the 15 to 24 years age bracket for the primary householder. A total of 90 households (5.2%) fall into this category. Meanwhile, the 25 to 44 years age bracket for the primary householder has the lowest median household income of $25,714, with 418 households (24.1%) in this group.
| Income Bracket | # Households | Median Income |
| 15 to 24 Years | 90 (5.2%) | $61,016 |
| 25 to 44 Years | 418 (24.1%) | $25,714 |
| 45 to 64 Years | 604 (34.8%) | $41,667 |
| 65+ Years | 624 (35.9%) | $44,148 |
| Total | 1,736 (100.0%) | $41,738 |
Poverty in Mount Olive
Income Below Poverty by Sex and Age in Mount Olive
With 30.3% poverty level for males and 22.5% for females among the residents of Mount Olive, 5 year old males and under 5 year old females are the most vulnerable to poverty, with 33 males (100.0%) and 27 females (100.0%) in their respective age groups living below the poverty level.
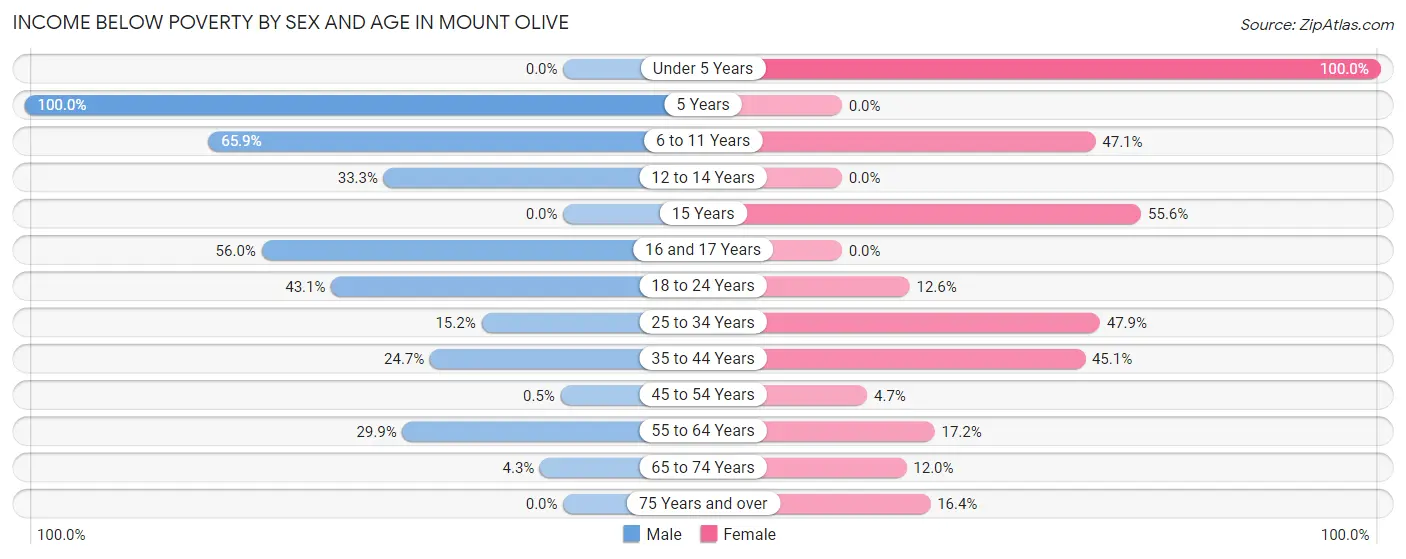
| Age Bracket | Male | Female |
| Under 5 Years | 0 (0.0%) | 27 (100.0%) |
| 5 Years | 33 (100.0%) | 0 (0.0%) |
| 6 to 11 Years | 170 (65.9%) | 40 (47.1%) |
| 12 to 14 Years | 16 (33.3%) | 0 (0.0%) |
| 15 Years | 0 (0.0%) | 15 (55.6%) |
| 16 and 17 Years | 84 (56.0%) | 0 (0.0%) |
| 18 to 24 Years | 115 (43.1%) | 20 (12.6%) |
| 25 to 34 Years | 41 (15.2%) | 34 (47.9%) |
| 35 to 44 Years | 45 (24.7%) | 116 (45.1%) |
| 45 to 54 Years | 1 (0.5%) | 11 (4.7%) |
| 55 to 64 Years | 106 (29.9%) | 63 (17.2%) |
| 65 to 74 Years | 8 (4.3%) | 26 (12.0%) |
| 75 Years and over | 0 (0.0%) | 42 (16.4%) |
| Total | 619 (30.3%) | 394 (22.5%) |
Income Above Poverty by Sex and Age in Mount Olive
According to the poverty statistics in Mount Olive, males aged under 5 years and females aged 5 years are the age groups that are most secure financially, with 100.0% of males and 100.0% of females in these age groups living above the poverty line.
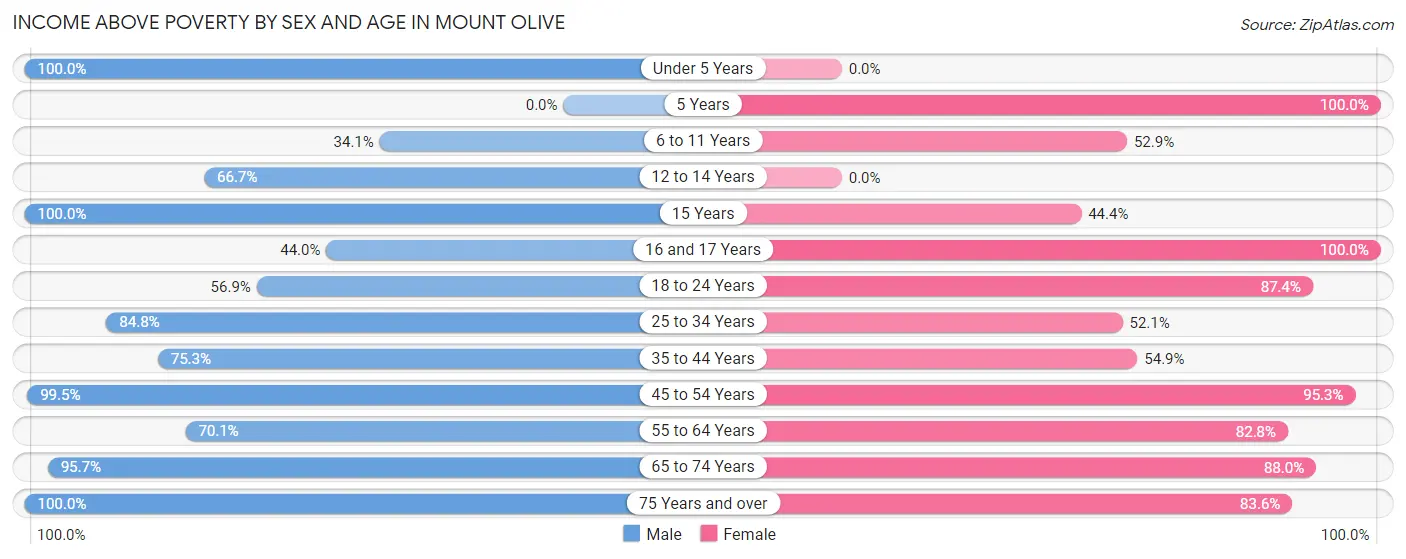
| Age Bracket | Male | Female |
| Under 5 Years | 8 (100.0%) | 0 (0.0%) |
| 5 Years | 0 (0.0%) | 12 (100.0%) |
| 6 to 11 Years | 88 (34.1%) | 45 (52.9%) |
| 12 to 14 Years | 32 (66.7%) | 0 (0.0%) |
| 15 Years | 11 (100.0%) | 12 (44.4%) |
| 16 and 17 Years | 66 (44.0%) | 37 (100.0%) |
| 18 to 24 Years | 152 (56.9%) | 139 (87.4%) |
| 25 to 34 Years | 229 (84.8%) | 37 (52.1%) |
| 35 to 44 Years | 137 (75.3%) | 141 (54.9%) |
| 45 to 54 Years | 199 (99.5%) | 223 (95.3%) |
| 55 to 64 Years | 249 (70.1%) | 303 (82.8%) |
| 65 to 74 Years | 178 (95.7%) | 191 (88.0%) |
| 75 Years and over | 75 (100.0%) | 214 (83.6%) |
| Total | 1,424 (69.7%) | 1,354 (77.5%) |
Income Below Poverty Among Married-Couple Families in Mount Olive
The poverty statistics for married-couple families in Mount Olive show that 4.4% or 15 of the total 338 families live below the poverty line. Families with no children have the highest poverty rate of 5.9%, comprising of 15 families. On the other hand, families with 1 or 2 children have the lowest poverty rate of 0.0%, which includes 0 families.
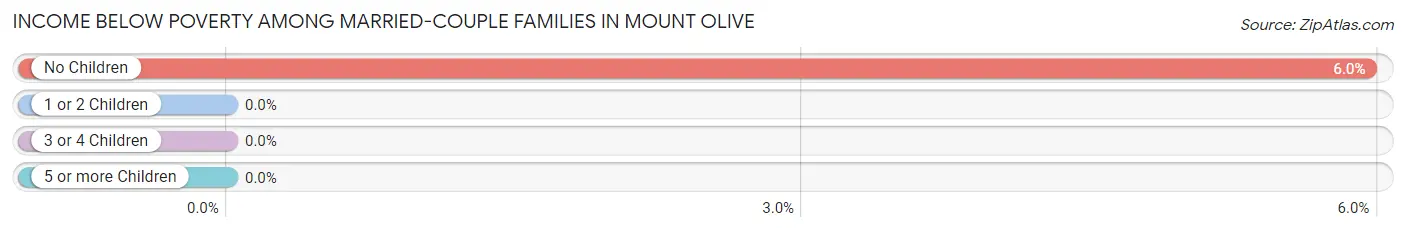
| Children | Above Poverty | Below Poverty |
| No Children | 237 (94.1%) | 15 (5.9%) |
| 1 or 2 Children | 86 (100.0%) | 0 (0.0%) |
| 3 or 4 Children | 0 (0.0%) | 0 (0.0%) |
| 5 or more Children | 0 (0.0%) | 0 (0.0%) |
| Total | 323 (95.6%) | 15 (4.4%) |
Income Below Poverty Among Single-Parent Households in Mount Olive
According to the poverty data in Mount Olive, 52.0% or 65 single-father households and 30.4% or 136 single-mother households are living below the poverty line. Among single-father households, those with 1 or 2 children have the highest poverty rate, with 65 households (54.2%) experiencing poverty. Likewise, among single-mother households, those with 3 or 4 children have the highest poverty rate, with 20 households (100.0%) falling below the poverty line.
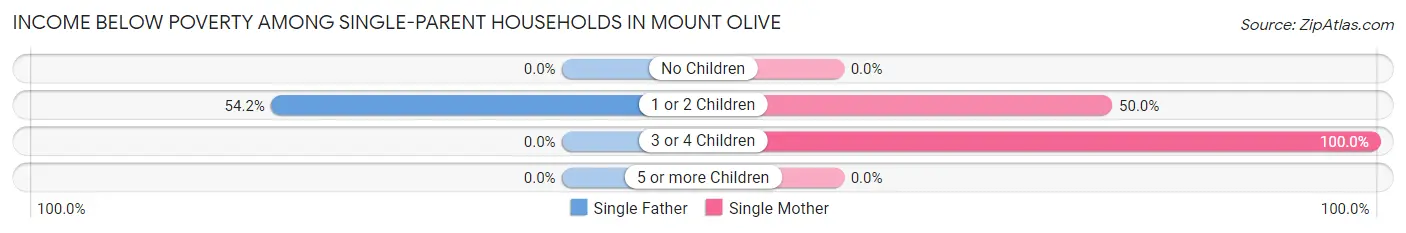
| Children | Single Father | Single Mother |
| No Children | 0 (0.0%) | 0 (0.0%) |
| 1 or 2 Children | 65 (54.2%) | 116 (50.0%) |
| 3 or 4 Children | 0 (0.0%) | 20 (100.0%) |
| 5 or more Children | 0 (0.0%) | 0 (0.0%) |
| Total | 65 (52.0%) | 136 (30.4%) |
Income Below Poverty Among Married-Couple vs Single-Parent Households in Mount Olive
The poverty data for Mount Olive shows that 15 of the married-couple family households (4.4%) and 201 of the single-parent households (35.1%) are living below the poverty level. Within the married-couple family households, those with no children have the highest poverty rate, with 15 households (5.9%) falling below the poverty line. Among the single-parent households, those with 3 or 4 children have the highest poverty rate, with 20 household (100.0%) living below poverty.
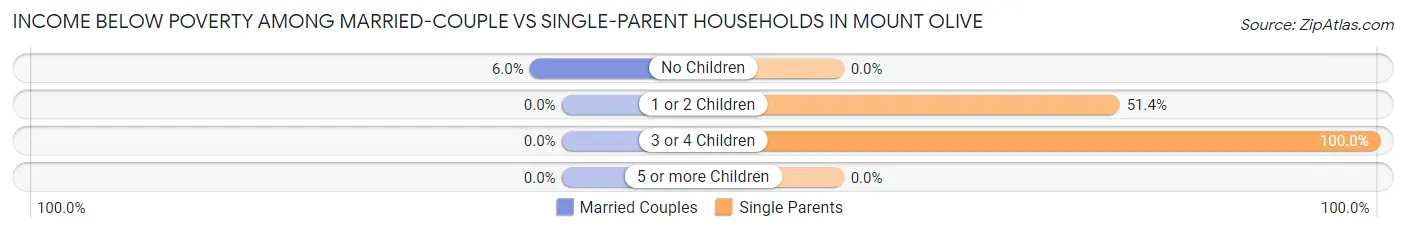
| Children | Married-Couple Families | Single-Parent Households |
| No Children | 15 (5.9%) | 0 (0.0%) |
| 1 or 2 Children | 0 (0.0%) | 181 (51.4%) |
| 3 or 4 Children | 0 (0.0%) | 20 (100.0%) |
| 5 or more Children | 0 (0.0%) | 0 (0.0%) |
| Total | 15 (4.4%) | 201 (35.1%) |
Race in Mount Olive
The most populous races in Mount Olive are Black / African American (2,301 | 53.7%), White / Caucasian (1,652 | 38.5%), and Hispanic or Latino (280 | 6.5%).
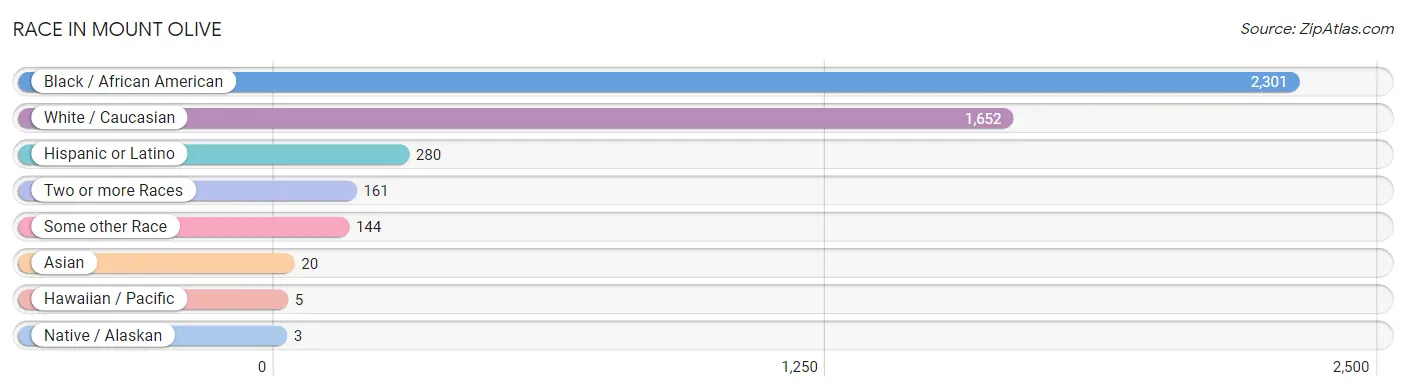
| Race | # Population | % Population |
| Asian | 20 | 0.5% |
| Black / African American | 2,301 | 53.7% |
| Hawaiian / Pacific | 5 | 0.1% |
| Hispanic or Latino | 280 | 6.5% |
| Native / Alaskan | 3 | 0.1% |
| White / Caucasian | 1,652 | 38.5% |
| Two or more Races | 161 | 3.8% |
| Some other Race | 144 | 3.4% |
| Total | 4,286 | 100.0% |
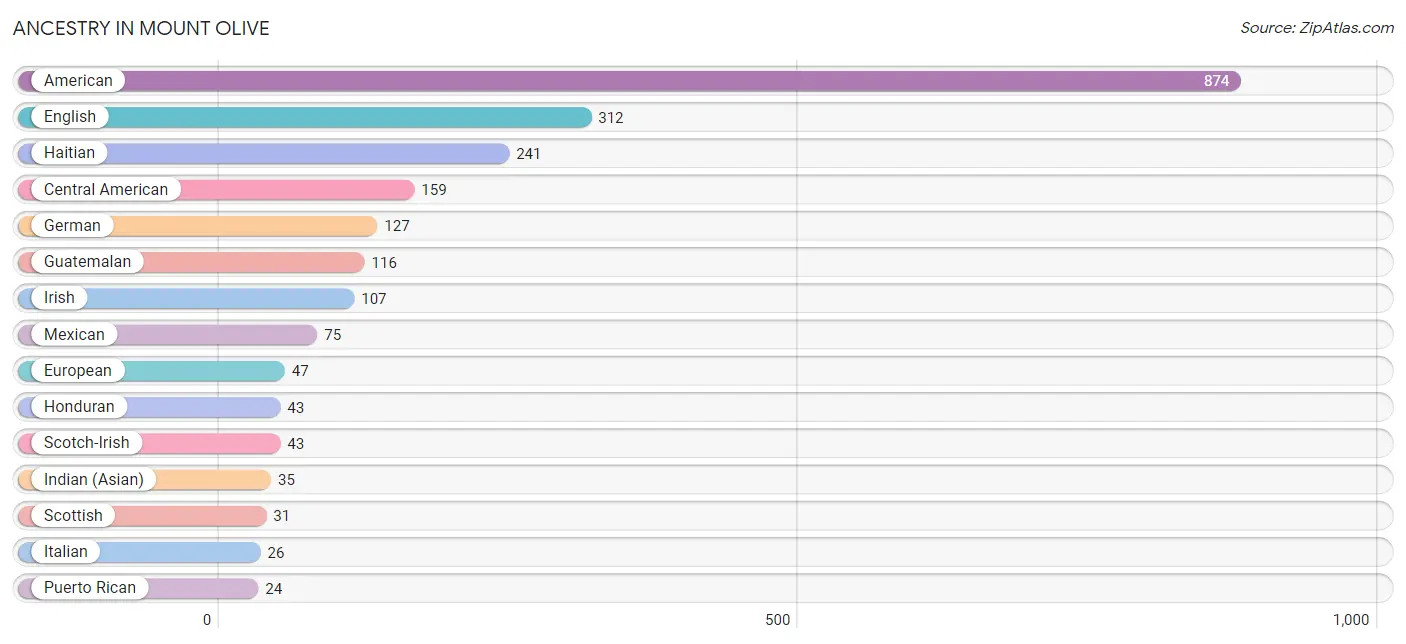
Ancestry in Mount Olive
The most populous ancestries reported in Mount Olive are American (874 | 20.4%), English (312 | 7.3%), Haitian (241 | 5.6%), Central American (159 | 3.7%), and German (127 | 3.0%), together accounting for 40.0% of all Mount Olive residents.
| Ancestry | # Population | % Population |
| American | 874 | 20.4% |
| Austrian | 7 | 0.2% |
| Bhutanese | 3 | 0.1% |
| Brazilian | 3 | 0.1% |
| British | 11 | 0.3% |
| Burmese | 1 | 0.0% |
| Canadian | 5 | 0.1% |
| Central American | 159 | 3.7% |
| Croatian | 4 | 0.1% |
| Danish | 4 | 0.1% |
| Dutch | 10 | 0.2% |
| English | 312 | 7.3% |
| European | 47 | 1.1% |
| French | 19 | 0.4% |
| German | 127 | 3.0% |
| Ghanaian | 5 | 0.1% |
| Guamanian / Chamorro | 5 | 0.1% |
| Guatemalan | 116 | 2.7% |
| Haitian | 241 | 5.6% |
| Honduran | 43 | 1.0% |
| Indian (Asian) | 35 | 0.8% |
| Irish | 107 | 2.5% |
| Italian | 26 | 0.6% |
| Mexican | 75 | 1.8% |
| Norwegian | 11 | 0.3% |
| Peruvian | 9 | 0.2% |
| Polish | 6 | 0.1% |
| Portuguese | 10 | 0.2% |
| Puerto Rican | 24 | 0.6% |
| Russian | 2 | 0.1% |
| Scotch-Irish | 43 | 1.0% |
| Scottish | 31 | 0.7% |
| Slovak | 12 | 0.3% |
| South African | 2 | 0.1% |
| South American | 18 | 0.4% |
| Subsaharan African | 7 | 0.2% |
| Sudanese | 5 | 0.1% |
| Swedish | 6 | 0.1% |
| Thai | 14 | 0.3% |
| Turkish | 3 | 0.1% |
| Venezuelan | 9 | 0.2% |
| Welsh | 21 | 0.5% | View All 42 Rows |
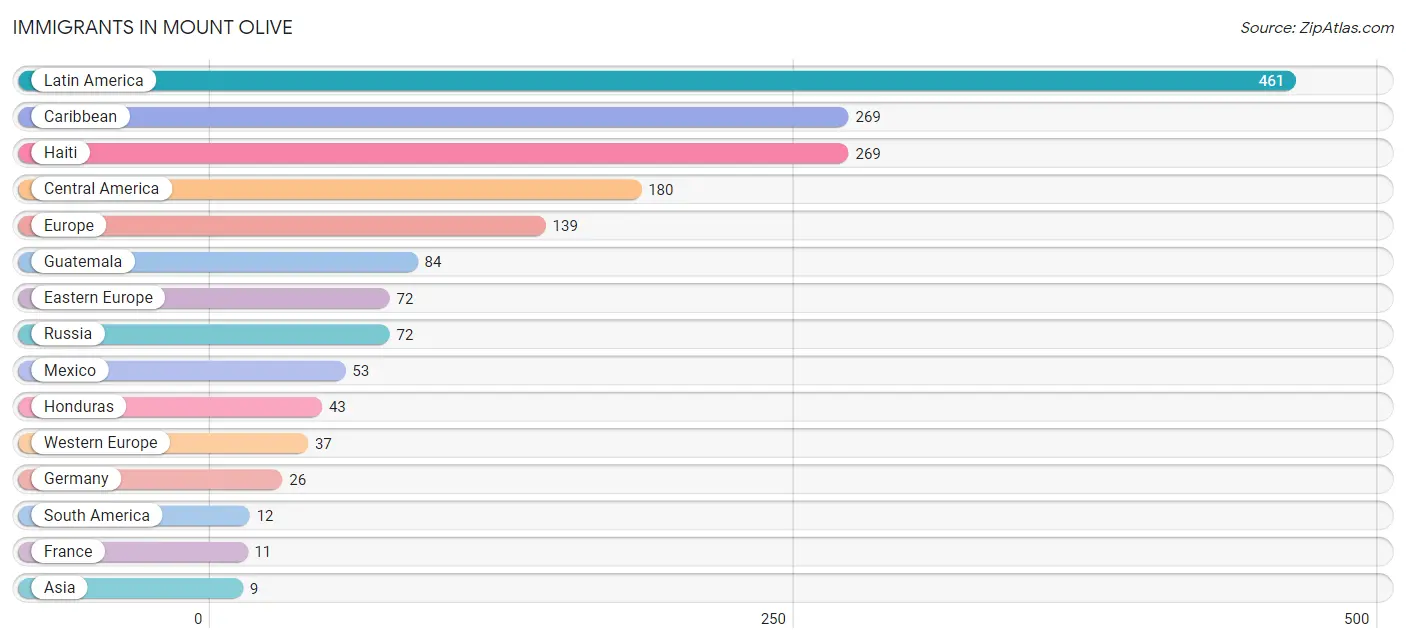
Immigrants in Mount Olive
The most numerous immigrant groups reported in Mount Olive came from Latin America (461 | 10.8%), Caribbean (269 | 6.3%), Haiti (269 | 6.3%), Central America (180 | 4.2%), and Europe (139 | 3.2%), together accounting for 30.8% of all Mount Olive residents.
| Immigration Origin | # Population | % Population |
| Asia | 9 | 0.2% |
| Brazil | 3 | 0.1% |
| Caribbean | 269 | 6.3% |
| Central America | 180 | 4.2% |
| Eastern Europe | 72 | 1.7% |
| Europe | 139 | 3.2% |
| France | 11 | 0.3% |
| Germany | 26 | 0.6% |
| Guatemala | 84 | 2.0% |
| Haiti | 269 | 6.3% |
| Honduras | 43 | 1.0% |
| Italy | 4 | 0.1% |
| Latin America | 461 | 10.8% |
| Mexico | 53 | 1.2% |
| Northern Europe | 2 | 0.1% |
| Oceania | 6 | 0.1% |
| Russia | 72 | 1.7% |
| South America | 12 | 0.3% |
| South Eastern Asia | 6 | 0.1% |
| Southern Europe | 4 | 0.1% |
| Thailand | 6 | 0.1% |
| Turkey | 3 | 0.1% |
| Venezuela | 9 | 0.2% |
| Western Asia | 3 | 0.1% |
| Western Europe | 37 | 0.9% | View All 25 Rows |
Sex and Age in Mount Olive
Sex and Age in Mount Olive
The most populous age groups in Mount Olive are 15 to 19 Years (412 | 17.7%) for men and 55 to 59 Years (203 | 10.4%) for women.
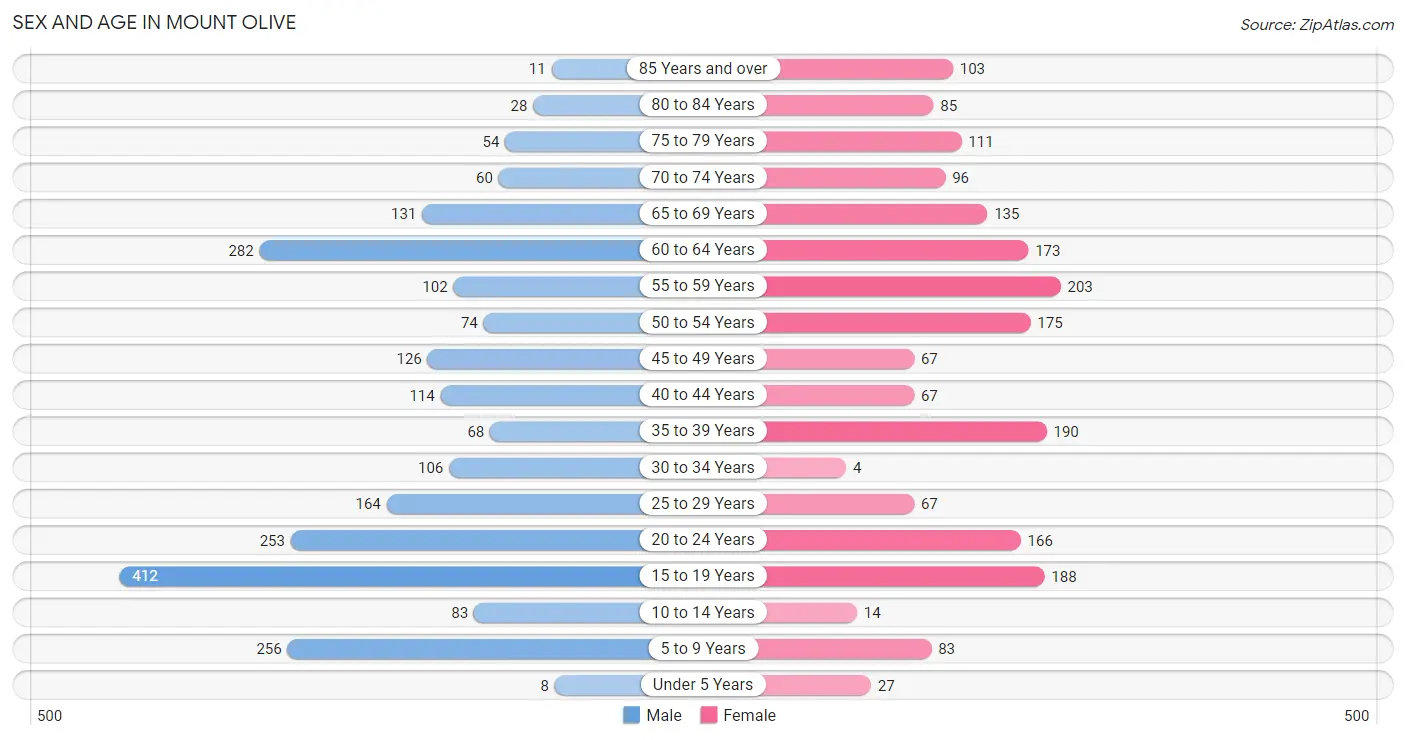
| Age Bracket | Male | Female |
| Under 5 Years | 8 (0.3%) | 27 (1.4%) |
| 5 to 9 Years | 256 (11.0%) | 83 (4.3%) |
| 10 to 14 Years | 83 (3.6%) | 14 (0.7%) |
| 15 to 19 Years | 412 (17.7%) | 188 (9.6%) |
| 20 to 24 Years | 253 (10.8%) | 166 (8.5%) |
| 25 to 29 Years | 164 (7.0%) | 67 (3.4%) |
| 30 to 34 Years | 106 (4.5%) | 4 (0.2%) |
| 35 to 39 Years | 68 (2.9%) | 190 (9.7%) |
| 40 to 44 Years | 114 (4.9%) | 67 (3.4%) |
| 45 to 49 Years | 126 (5.4%) | 67 (3.4%) |
| 50 to 54 Years | 74 (3.2%) | 175 (9.0%) |
| 55 to 59 Years | 102 (4.4%) | 203 (10.4%) |
| 60 to 64 Years | 282 (12.1%) | 173 (8.8%) |
| 65 to 69 Years | 131 (5.6%) | 135 (6.9%) |
| 70 to 74 Years | 60 (2.6%) | 96 (4.9%) |
| 75 to 79 Years | 54 (2.3%) | 111 (5.7%) |
| 80 to 84 Years | 28 (1.2%) | 85 (4.3%) |
| 85 Years and over | 11 (0.5%) | 103 (5.3%) |
| Total | 2,332 (100.0%) | 1,954 (100.0%) |
Families and Households in Mount Olive
Median Family Size in Mount Olive
The median family size in Mount Olive is 2.94 persons per family, with single female/mother families (448 | 49.2%) accounting for the largest median family size of 3.12 persons per family. On the other hand, married-couple families (338 | 37.1%) represent the smallest median family size with 2.68 persons per family.
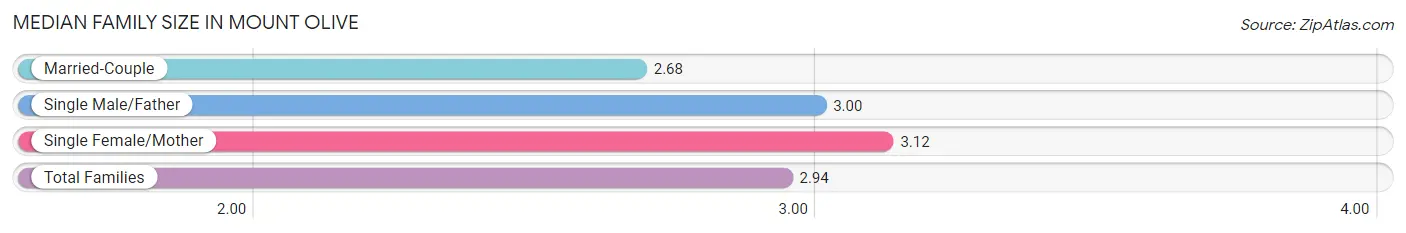
| Family Type | # Families | Family Size |
| Married-Couple | 338 (37.1%) | 2.68 |
| Single Male/Father | 125 (13.7%) | 3.00 |
| Single Female/Mother | 448 (49.2%) | 3.12 |
| Total Families | 911 (100.0%) | 2.94 |
Median Household Size in Mount Olive
The median household size in Mount Olive is 2.18 persons per household, with single female/mother households (448 | 25.8%) accounting for the largest median household size of 3.33 persons per household. non-family households (825 | 47.5%) represent the smallest median household size with 1.21 persons per household.
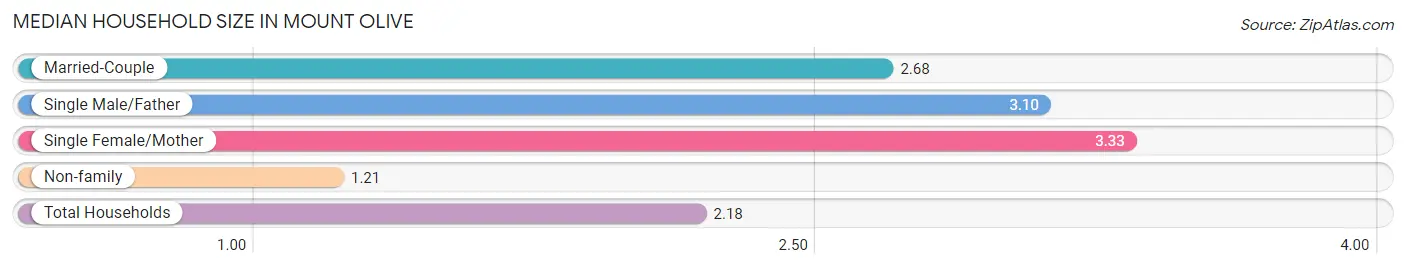
| Household Type | # Households | Household Size |
| Married-Couple | 338 (19.5%) | 2.68 |
| Single Male/Father | 125 (7.2%) | 3.10 |
| Single Female/Mother | 448 (25.8%) | 3.33 |
| Non-family | 825 (47.5%) | 1.21 |
| Total Households | 1,736 (100.0%) | 2.18 |
Household Size by Marriage Status in Mount Olive
Out of a total of 1,736 households in Mount Olive, 911 (52.5%) are family households, while 825 (47.5%) are nonfamily households. The most numerous type of family households are 2-person households, comprising 447, and the most common type of nonfamily households are 1-person households, comprising 672.
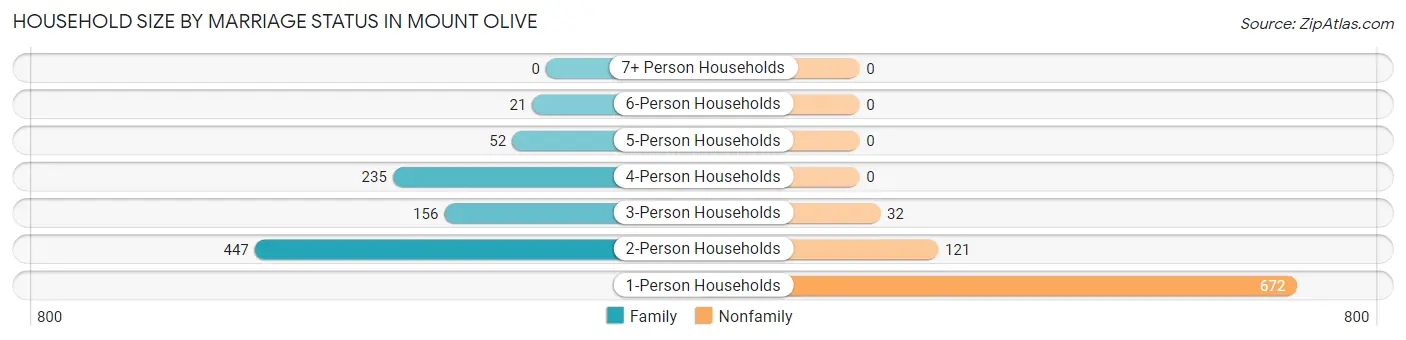
| Household Size | Family Households | Nonfamily Households |
| 1-Person Households | - | 672 (38.7%) |
| 2-Person Households | 447 (25.8%) | 121 (7.0%) |
| 3-Person Households | 156 (9.0%) | 32 (1.8%) |
| 4-Person Households | 235 (13.5%) | 0 (0.0%) |
| 5-Person Households | 52 (3.0%) | 0 (0.0%) |
| 6-Person Households | 21 (1.2%) | 0 (0.0%) |
| 7+ Person Households | 0 (0.0%) | 0 (0.0%) |
| Total | 911 (52.5%) | 825 (47.5%) |
Female Fertility in Mount Olive
Fertility by Age in Mount Olive
Average fertility rate in Mount Olive is 27.0 births per 1,000 women. Women in the age bracket of 20 to 34 years have the highest fertility rate with 51.0 births per 1,000 women. Women in the age bracket of 20 to 34 years acount for 54.5% of all women with births.
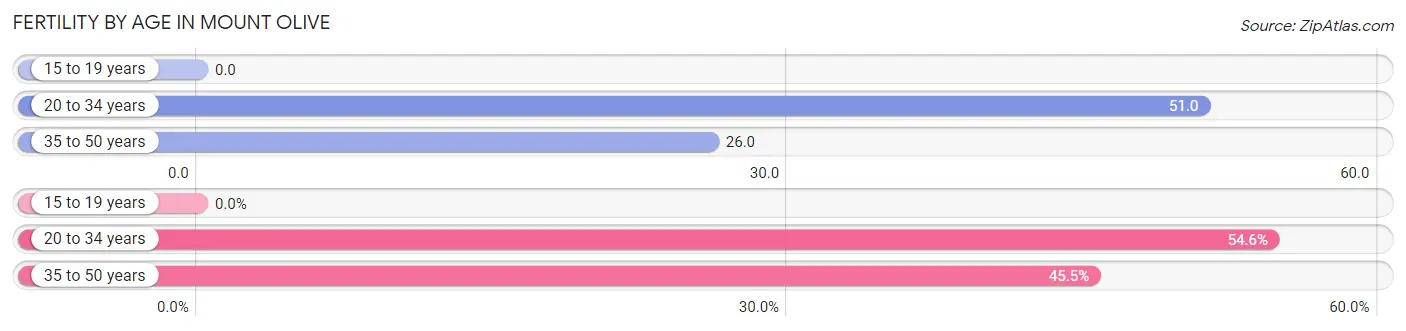
| Age Bracket | Women with Births | Births / 1,000 Women |
| 15 to 19 years | 0 (0.0%) | 0.0 |
| 20 to 34 years | 12 (54.5%) | 51.0 |
| 35 to 50 years | 10 (45.5%) | 26.0 |
| Total | 22 (100.0%) | 27.0 |
Fertility by Age by Marriage Status in Mount Olive
45.5% of women with births (22) in Mount Olive are married. The highest percentage of unmarried women with births falls into 20 to 34 years age bracket with 100.0% of them unmarried at the time of birth, while the lowest percentage of unmarried women with births belong to 35 to 50 years age bracket with 0.0% of them unmarried.
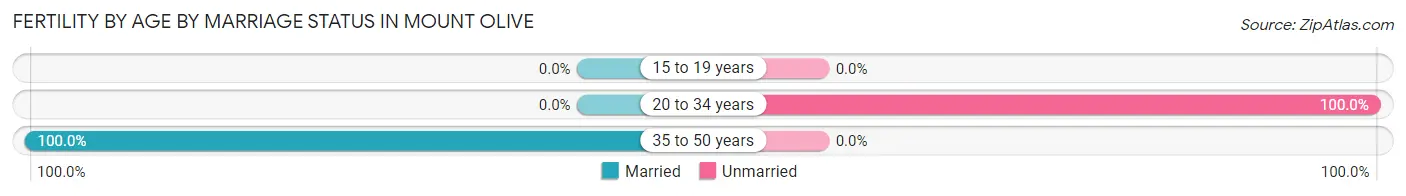
| Age Bracket | Married | Unmarried |
| 15 to 19 years | 0 (0.0%) | 0 (0.0%) |
| 20 to 34 years | 0 (0.0%) | 12 (100.0%) |
| 35 to 50 years | 10 (100.0%) | 0 (0.0%) |
| Total | 10 (45.5%) | 12 (54.5%) |
Fertility by Education in Mount Olive
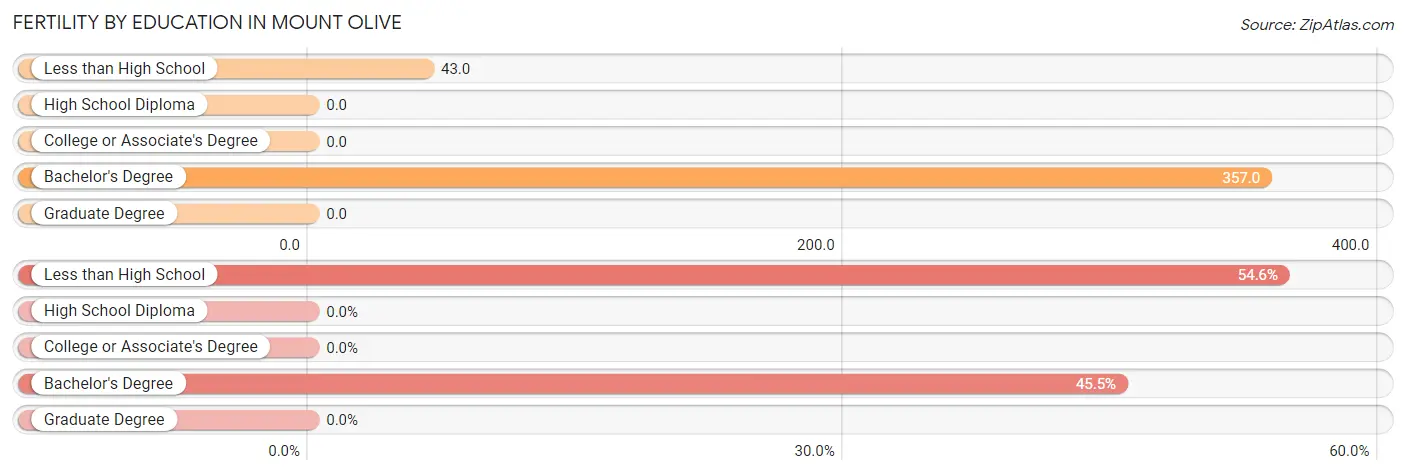
| Educational Attainment | Women with Births | Births / 1,000 Women |
| Less than High School | 12 (54.5%) | 43.0 |
| High School Diploma | 0 (0.0%) | 0.0 |
| College or Associate's Degree | 0 (0.0%) | 0.0 |
| Bachelor's Degree | 10 (45.5%) | 357.0 |
| Graduate Degree | 0 (0.0%) | 0.0 |
| Total | 22 (100.0%) | 27.0 |
Fertility by Education by Marriage Status in Mount Olive
54.5% of women with births in Mount Olive are unmarried. Women with the educational attainment of bachelor's degree are most likely to be married with 100.0% of them married at childbirth, while women with the educational attainment of less than high school are least likely to be married with 100.0% of them unmarried at childbirth.
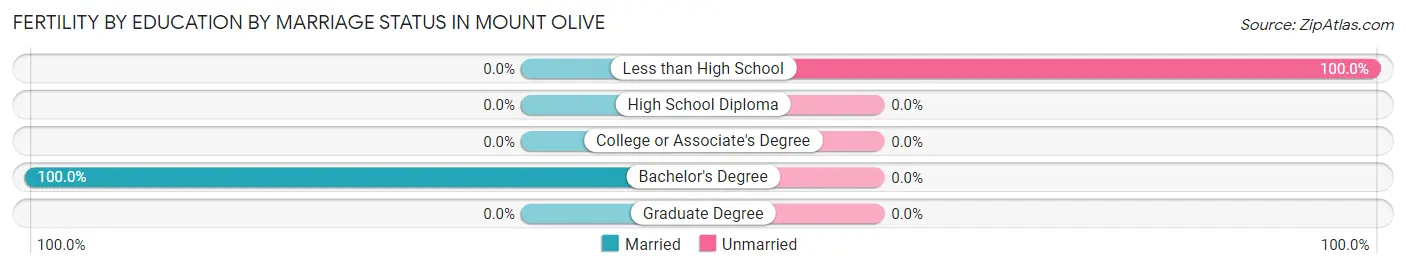
| Educational Attainment | Married | Unmarried |
| Less than High School | 0 (0.0%) | 12 (100.0%) |
| High School Diploma | 0 (0.0%) | 0 (0.0%) |
| College or Associate's Degree | 0 (0.0%) | 0 (0.0%) |
| Bachelor's Degree | 10 (100.0%) | 0 (0.0%) |
| Graduate Degree | 0 (0.0%) | 0 (0.0%) |
| Total | 10 (45.5%) | 12 (54.5%) |
Employment Characteristics in Mount Olive
Employment by Class of Employer in Mount Olive
Among the 1,925 employed individuals in Mount Olive, private company employees (1,404 | 72.9%), local government employees (294 | 15.3%), and state government employees (122 | 6.3%) make up the most common classes of employment.
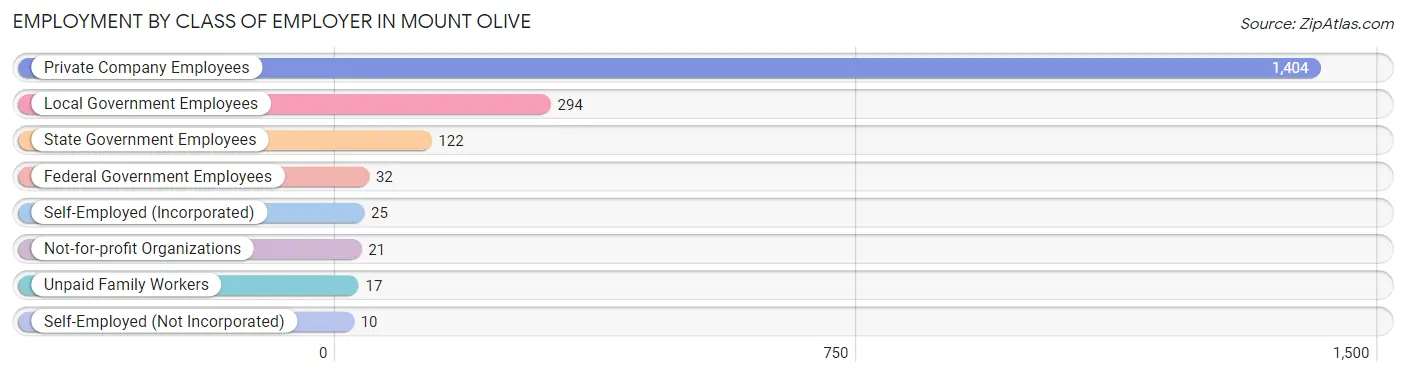
| Employer Class | # Employees | % Employees |
| Private Company Employees | 1,404 | 72.9% |
| Self-Employed (Incorporated) | 25 | 1.3% |
| Self-Employed (Not Incorporated) | 10 | 0.5% |
| Not-for-profit Organizations | 21 | 1.1% |
| Local Government Employees | 294 | 15.3% |
| State Government Employees | 122 | 6.3% |
| Federal Government Employees | 32 | 1.7% |
| Unpaid Family Workers | 17 | 0.9% |
| Total | 1,925 | 100.0% |
Employment Status by Age in Mount Olive
According to the labor force statistics for Mount Olive, out of the total population over 16 years of age (3,777), 56.5% or 2,134 individuals are in the labor force, with 7.1% or 152 of them unemployed. The age group with the highest labor force participation rate is 35 to 44 years, with 96.8% or 425 individuals in the labor force. Within the labor force, the 35 to 44 years age range has the highest percentage of unemployed individuals, with 20.2% or 86 of them being unemployed.
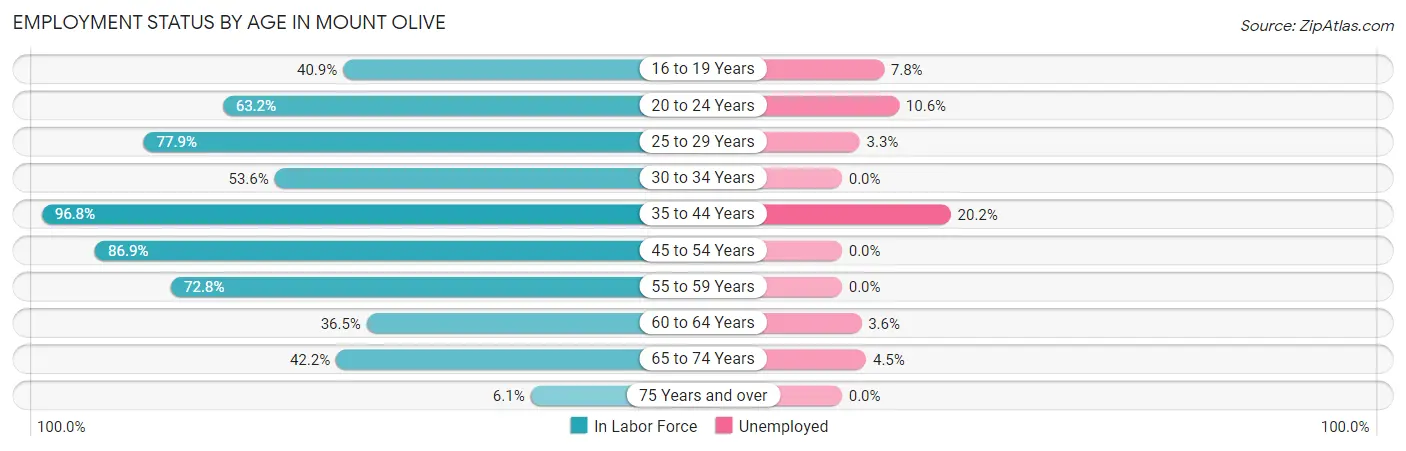
| Age Bracket | In Labor Force | Unemployed |
| 16 to 19 Years | 230 (40.9%) | 18 (7.8%) |
| 20 to 24 Years | 265 (63.2%) | 28 (10.6%) |
| 25 to 29 Years | 180 (77.9%) | 6 (3.3%) |
| 30 to 34 Years | 59 (53.6%) | 0 (0.0%) |
| 35 to 44 Years | 425 (96.8%) | 86 (20.2%) |
| 45 to 54 Years | 384 (86.9%) | 0 (0.0%) |
| 55 to 59 Years | 222 (72.8%) | 0 (0.0%) |
| 60 to 64 Years | 166 (36.5%) | 6 (3.6%) |
| 65 to 74 Years | 178 (42.2%) | 8 (4.5%) |
| 75 Years and over | 24 (6.1%) | 0 (0.0%) |
| Total | 2,134 (56.5%) | 152 (7.1%) |
Employment Status by Educational Attainment in Mount Olive
According to labor force statistics for Mount Olive, 72.5% of individuals (1,437) out of the total population between 25 and 64 years of age (1,982) are in the labor force, with 6.8% or 98 of them being unemployed. The group with the highest labor force participation rate are those with the educational attainment of bachelor's degree or higher, with 94.5% or 259 individuals in the labor force. Within the labor force, individuals with less than high school education have the highest percentage of unemployment, with 26.1% or 86 of them being unemployed.
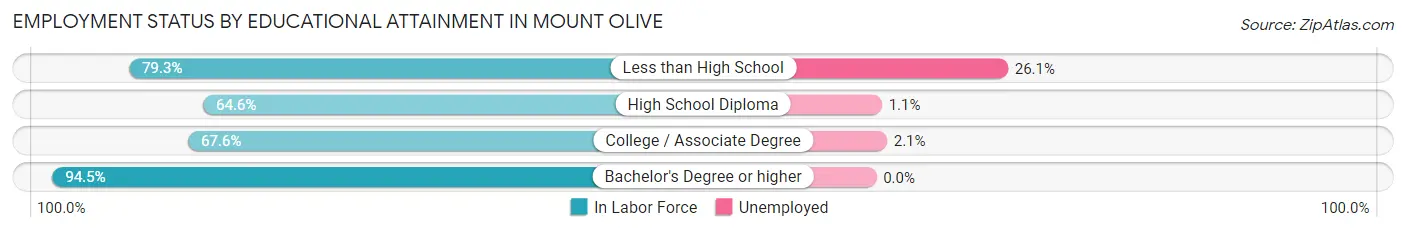
| Educational Attainment | In Labor Force | Unemployed |
| Less than High School | 329 (79.3%) | 108 (26.1%) |
| High School Diploma | 558 (64.6%) | 10 (1.1%) |
| College / Associate Degree | 290 (67.6%) | 9 (2.1%) |
| Bachelor's Degree or higher | 259 (94.5%) | 0 (0.0%) |
| Total | 1,437 (72.5%) | 135 (6.8%) |
Employment Occupations by Sex in Mount Olive
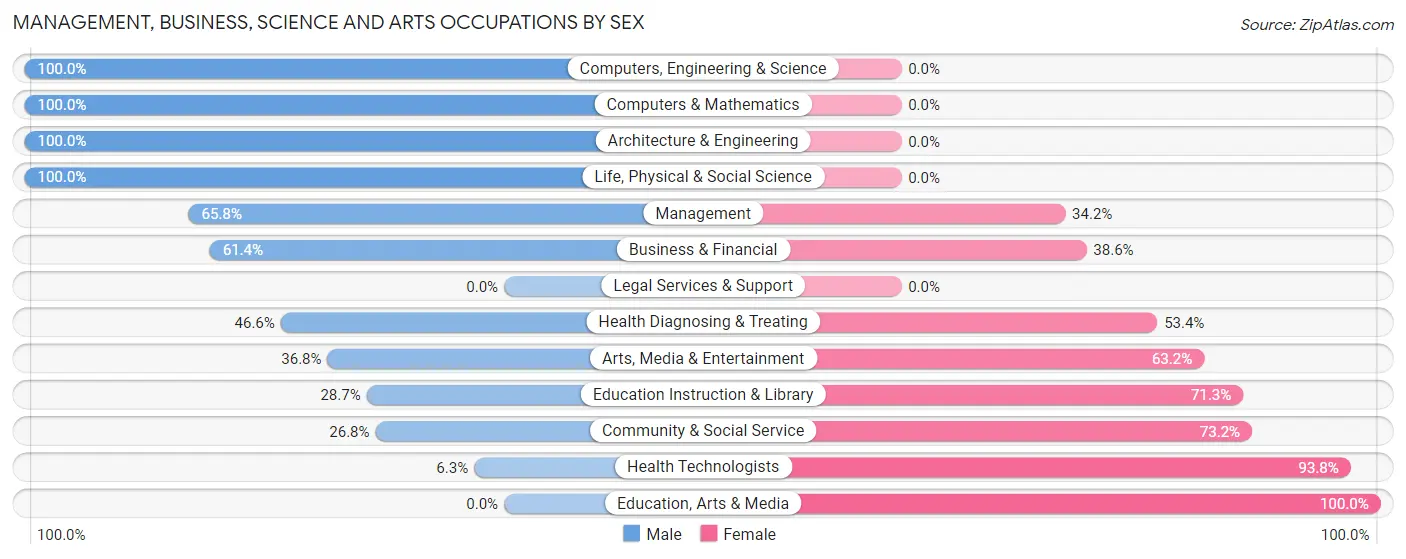
Management, Business, Science and Arts Occupations
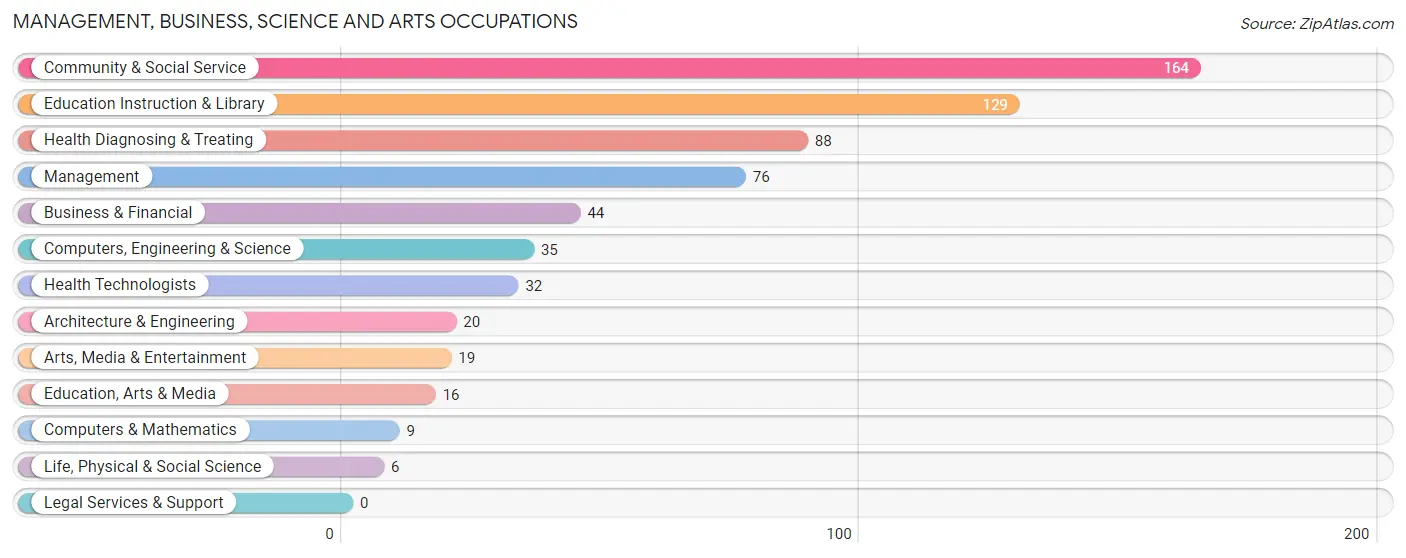
The most common Management, Business, Science and Arts occupations in Mount Olive are Community & Social Service (164 | 8.3%), Education Instruction & Library (129 | 6.5%), Health Diagnosing & Treating (88 | 4.4%), Management (76 | 3.8%), and Business & Financial (44 | 2.2%).
Management, Business, Science and Arts Occupations by Sex
Within the Management, Business, Science and Arts occupations in Mount Olive, the most male-oriented occupations are Computers, Engineering & Science (100.0%), Computers & Mathematics (100.0%), and Architecture & Engineering (100.0%), while the most female-oriented occupations are Education, Arts & Media (100.0%), Health Technologists (93.8%), and Community & Social Service (73.2%).
| Occupation | Male | Female |
| Management | 50 (65.8%) | 26 (34.2%) |
| Business & Financial | 27 (61.4%) | 17 (38.6%) |
| Computers, Engineering & Science | 35 (100.0%) | 0 (0.0%) |
| Computers & Mathematics | 9 (100.0%) | 0 (0.0%) |
| Architecture & Engineering | 20 (100.0%) | 0 (0.0%) |
| Life, Physical & Social Science | 6 (100.0%) | 0 (0.0%) |
| Community & Social Service | 44 (26.8%) | 120 (73.2%) |
| Education, Arts & Media | 0 (0.0%) | 16 (100.0%) |
| Legal Services & Support | 0 (0.0%) | 0 (0.0%) |
| Education Instruction & Library | 37 (28.7%) | 92 (71.3%) |
| Arts, Media & Entertainment | 7 (36.8%) | 12 (63.2%) |
| Health Diagnosing & Treating | 41 (46.6%) | 47 (53.4%) |
| Health Technologists | 2 (6.2%) | 30 (93.8%) |
| Total (Category) | 197 (48.4%) | 210 (51.6%) |
| Total (Overall) | 1,097 (55.4%) | 884 (44.6%) |
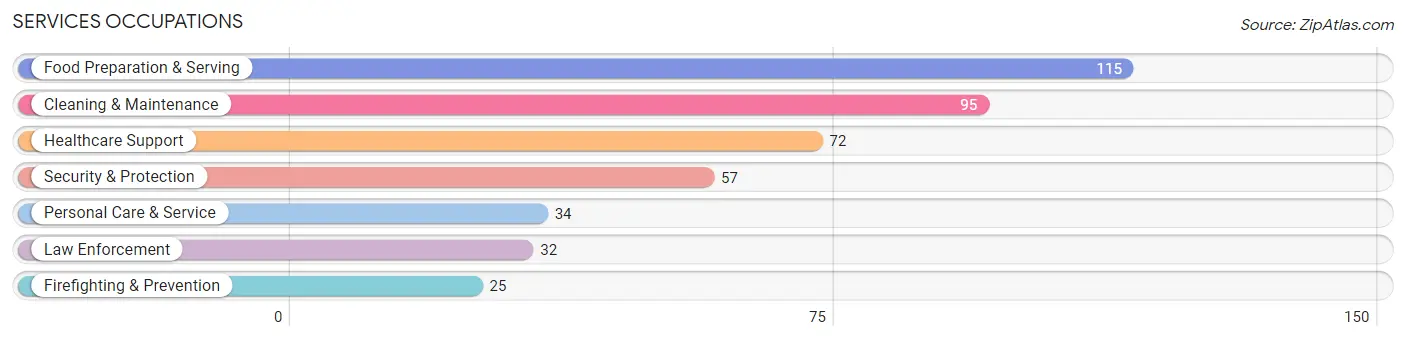
Services Occupations
The most common Services occupations in Mount Olive are Food Preparation & Serving (115 | 5.8%), Cleaning & Maintenance (95 | 4.8%), Healthcare Support (72 | 3.6%), Security & Protection (57 | 2.9%), and Personal Care & Service (34 | 1.7%).
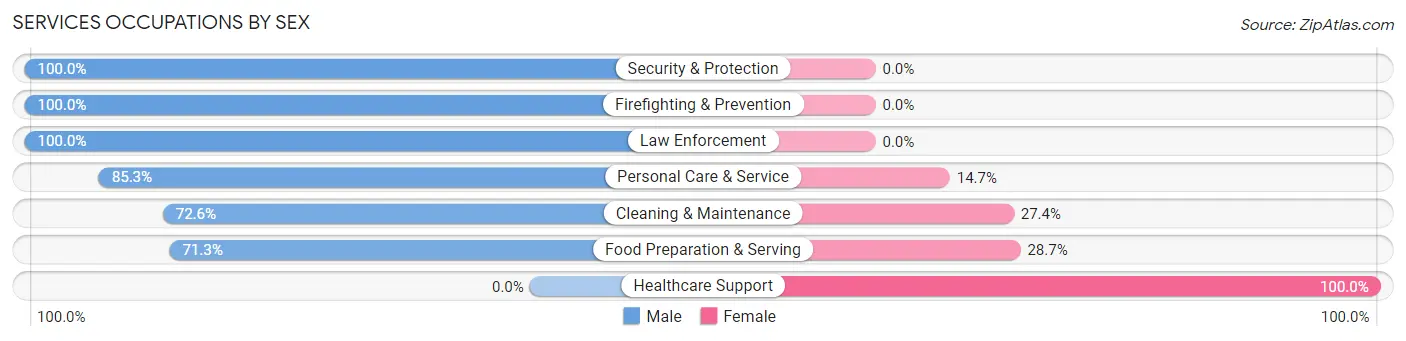
Services Occupations by Sex
Within the Services occupations in Mount Olive, the most male-oriented occupations are Security & Protection (100.0%), Firefighting & Prevention (100.0%), and Law Enforcement (100.0%), while the most female-oriented occupations are Healthcare Support (100.0%), Food Preparation & Serving (28.7%), and Cleaning & Maintenance (27.4%).
| Occupation | Male | Female |
| Healthcare Support | 0 (0.0%) | 72 (100.0%) |
| Security & Protection | 57 (100.0%) | 0 (0.0%) |
| Firefighting & Prevention | 25 (100.0%) | 0 (0.0%) |
| Law Enforcement | 32 (100.0%) | 0 (0.0%) |
| Food Preparation & Serving | 82 (71.3%) | 33 (28.7%) |
| Cleaning & Maintenance | 69 (72.6%) | 26 (27.4%) |
| Personal Care & Service | 29 (85.3%) | 5 (14.7%) |
| Total (Category) | 237 (63.5%) | 136 (36.5%) |
| Total (Overall) | 1,097 (55.4%) | 884 (44.6%) |
Sales and Office Occupations
The most common Sales and Office occupations in Mount Olive are Office & Administration (222 | 11.2%), and Sales & Related (208 | 10.5%).
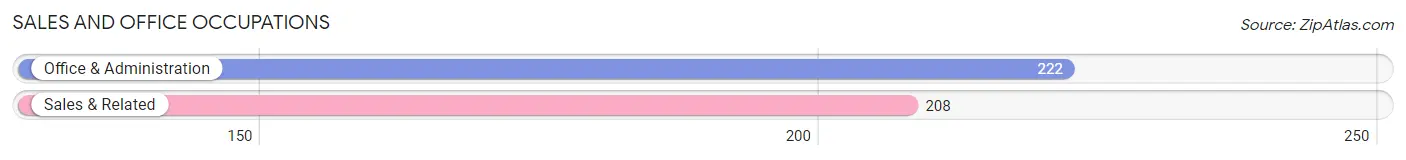
Sales and Office Occupations by Sex
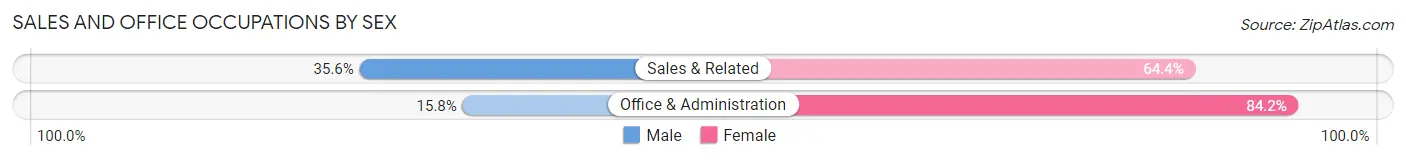
| Occupation | Male | Female |
| Sales & Related | 74 (35.6%) | 134 (64.4%) |
| Office & Administration | 35 (15.8%) | 187 (84.2%) |
| Total (Category) | 109 (25.4%) | 321 (74.7%) |
| Total (Overall) | 1,097 (55.4%) | 884 (44.6%) |
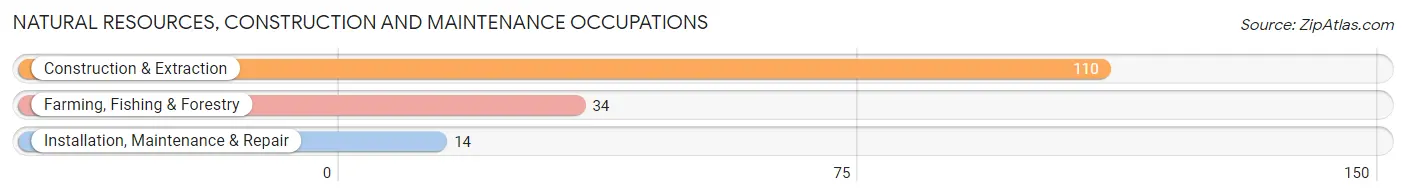
Natural Resources, Construction and Maintenance Occupations
The most common Natural Resources, Construction and Maintenance occupations in Mount Olive are Construction & Extraction (110 | 5.6%), Farming, Fishing & Forestry (34 | 1.7%), and Installation, Maintenance & Repair (14 | 0.7%).
Natural Resources, Construction and Maintenance Occupations by Sex
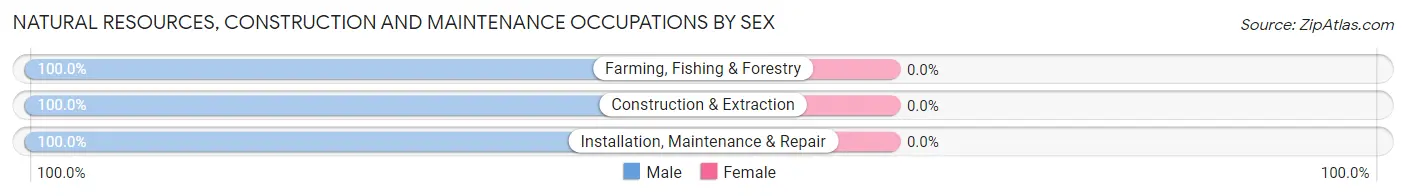
| Occupation | Male | Female |
| Farming, Fishing & Forestry | 34 (100.0%) | 0 (0.0%) |
| Construction & Extraction | 110 (100.0%) | 0 (0.0%) |
| Installation, Maintenance & Repair | 14 (100.0%) | 0 (0.0%) |
| Total (Category) | 158 (100.0%) | 0 (0.0%) |
| Total (Overall) | 1,097 (55.4%) | 884 (44.6%) |
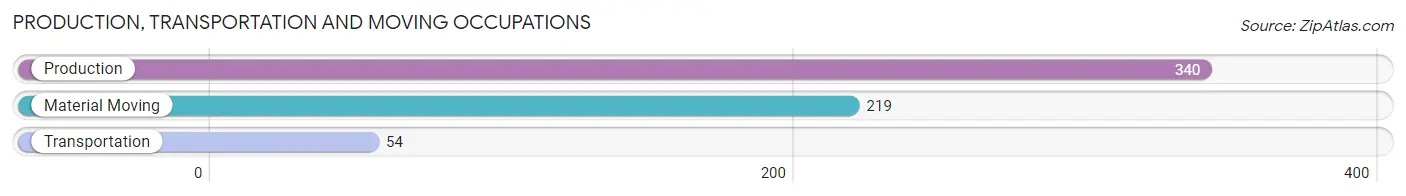
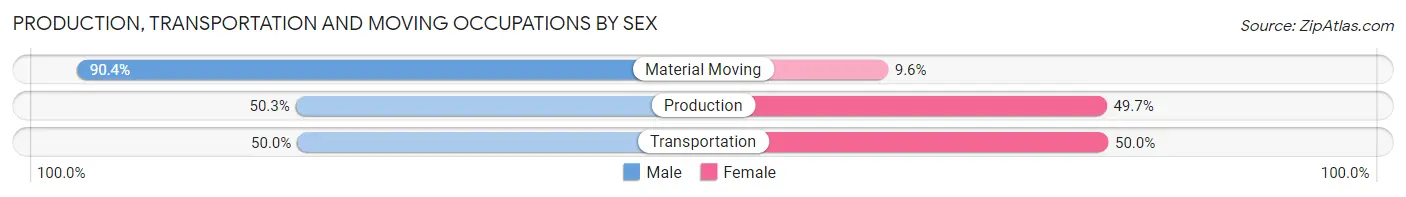
Production, Transportation and Moving Occupations
The most common Production, Transportation and Moving occupations in Mount Olive are Production (340 | 17.2%), Material Moving (219 | 11.1%), and Transportation (54 | 2.7%).
Production, Transportation and Moving Occupations by Sex
| Occupation | Male | Female |
| Production | 171 (50.3%) | 169 (49.7%) |
| Transportation | 27 (50.0%) | 27 (50.0%) |
| Material Moving | 198 (90.4%) | 21 (9.6%) |
| Total (Category) | 396 (64.6%) | 217 (35.4%) |
| Total (Overall) | 1,097 (55.4%) | 884 (44.6%) |
Employment Industries by Sex in Mount Olive
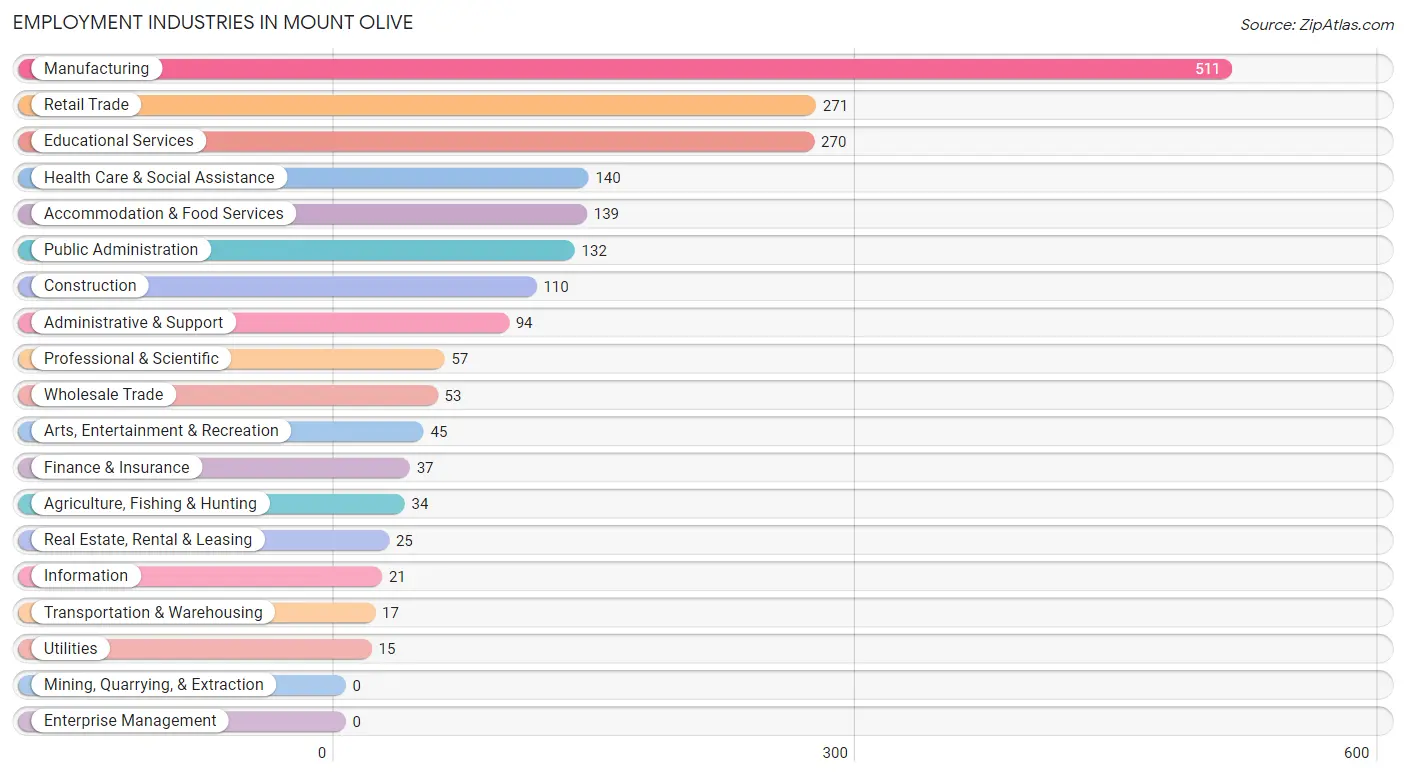
Employment Industries in Mount Olive
The major employment industries in Mount Olive include Manufacturing (511 | 25.8%), Retail Trade (271 | 13.7%), Educational Services (270 | 13.6%), Health Care & Social Assistance (140 | 7.1%), and Accommodation & Food Services (139 | 7.0%).
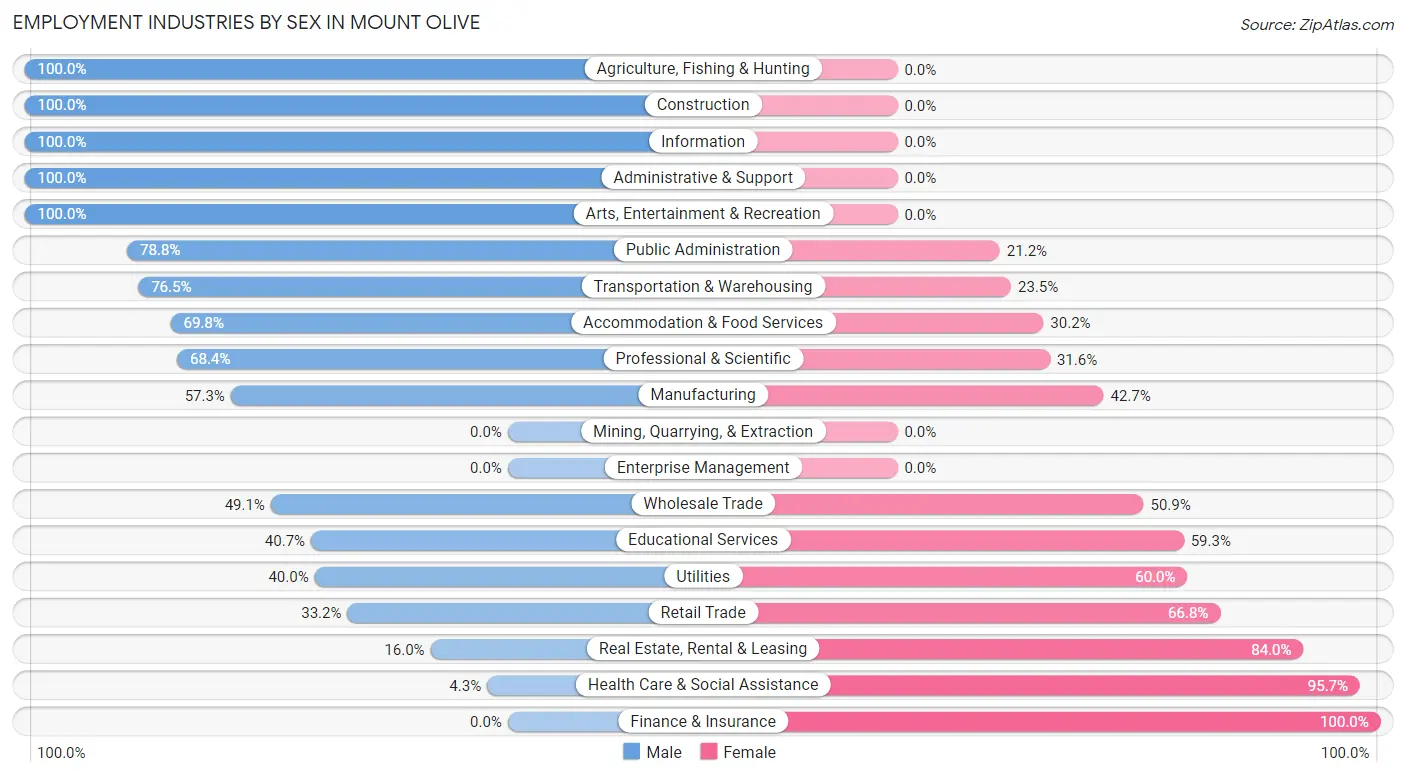
Employment Industries by Sex in Mount Olive
The Mount Olive industries that see more men than women are Agriculture, Fishing & Hunting (100.0%), Construction (100.0%), and Information (100.0%), whereas the industries that tend to have a higher number of women are Finance & Insurance (100.0%), Health Care & Social Assistance (95.7%), and Real Estate, Rental & Leasing (84.0%).
| Industry | Male | Female |
| Agriculture, Fishing & Hunting | 34 (100.0%) | 0 (0.0%) |
| Mining, Quarrying, & Extraction | 0 (0.0%) | 0 (0.0%) |
| Construction | 110 (100.0%) | 0 (0.0%) |
| Manufacturing | 293 (57.3%) | 218 (42.7%) |
| Wholesale Trade | 26 (49.1%) | 27 (50.9%) |
| Retail Trade | 90 (33.2%) | 181 (66.8%) |
| Transportation & Warehousing | 13 (76.5%) | 4 (23.5%) |
| Utilities | 6 (40.0%) | 9 (60.0%) |
| Information | 21 (100.0%) | 0 (0.0%) |
| Finance & Insurance | 0 (0.0%) | 37 (100.0%) |
| Real Estate, Rental & Leasing | 4 (16.0%) | 21 (84.0%) |
| Professional & Scientific | 39 (68.4%) | 18 (31.6%) |
| Enterprise Management | 0 (0.0%) | 0 (0.0%) |
| Administrative & Support | 94 (100.0%) | 0 (0.0%) |
| Educational Services | 110 (40.7%) | 160 (59.3%) |
| Health Care & Social Assistance | 6 (4.3%) | 134 (95.7%) |
| Arts, Entertainment & Recreation | 45 (100.0%) | 0 (0.0%) |
| Accommodation & Food Services | 97 (69.8%) | 42 (30.2%) |
| Public Administration | 104 (78.8%) | 28 (21.2%) |
| Total | 1,097 (55.4%) | 884 (44.6%) |
Education in Mount Olive
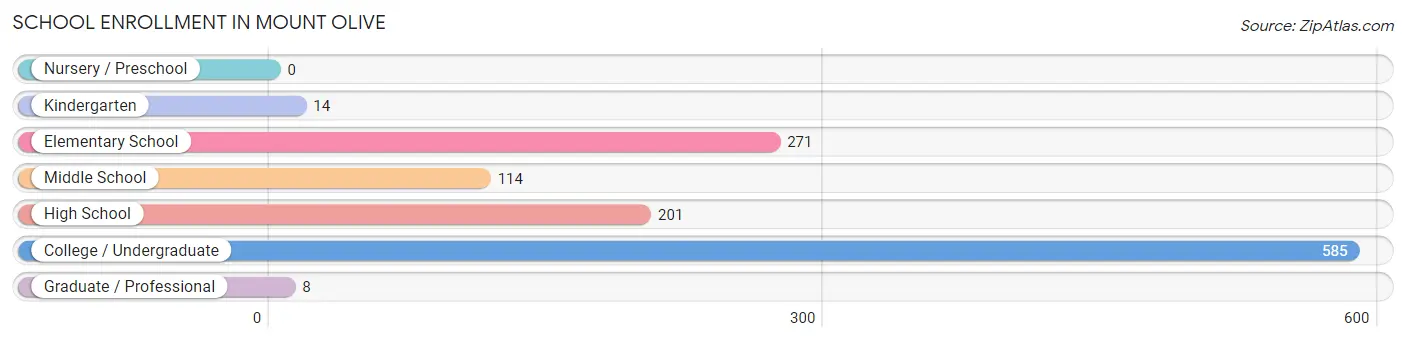
School Enrollment in Mount Olive
The most common levels of schooling among the 1,193 students in Mount Olive are college / undergraduate (585 | 49.0%), elementary school (271 | 22.7%), and high school (201 | 16.9%).
| School Level | # Students | % Students |
| Nursery / Preschool | 0 | 0.0% |
| Kindergarten | 14 | 1.2% |
| Elementary School | 271 | 22.7% |
| Middle School | 114 | 9.6% |
| High School | 201 | 16.9% |
| College / Undergraduate | 585 | 49.0% |
| Graduate / Professional | 8 | 0.7% |
| Total | 1,193 | 100.0% |
School Enrollment by Age by Funding Source in Mount Olive
Out of a total of 1,193 students who are enrolled in schools in Mount Olive, 383 (32.1%) attend a private institution, while the remaining 810 (67.9%) are enrolled in public schools. The age group of 20 to 24 year olds has the highest likelihood of being enrolled in private schools, with 196 (77.5% in the age bracket) enrolled. Conversely, the age group of 5 to 9 year old has the lowest likelihood of being enrolled in a private school, with 302 (100.0% in the age bracket) attending a public institution.
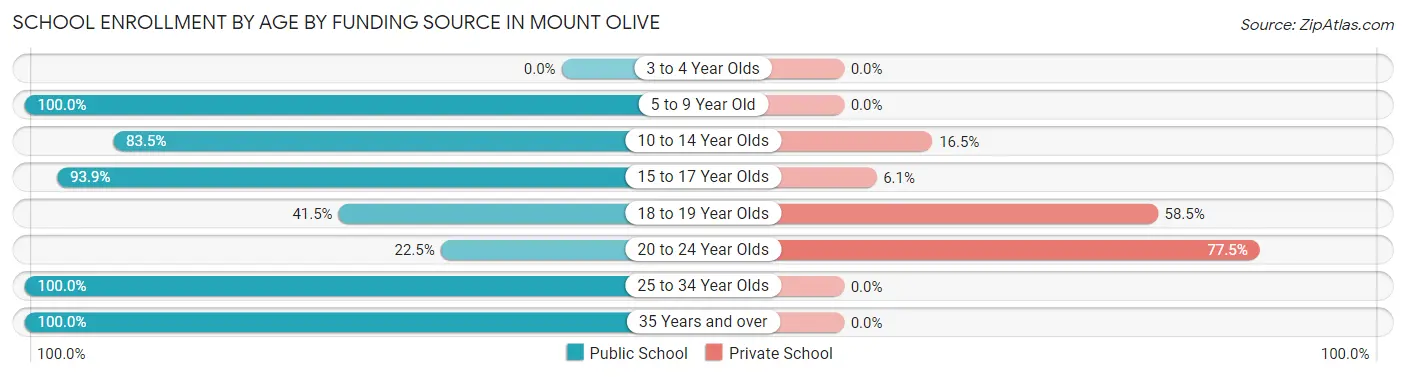
| Age Bracket | Public School | Private School |
| 3 to 4 Year Olds | 0 (0.0%) | 0 (0.0%) |
| 5 to 9 Year Old | 302 (100.0%) | 0 (0.0%) |
| 10 to 14 Year Olds | 81 (83.5%) | 16 (16.5%) |
| 15 to 17 Year Olds | 186 (93.9%) | 12 (6.1%) |
| 18 to 19 Year Olds | 113 (41.5%) | 159 (58.5%) |
| 20 to 24 Year Olds | 57 (22.5%) | 196 (77.5%) |
| 25 to 34 Year Olds | 7 (100.0%) | 0 (0.0%) |
| 35 Years and over | 64 (100.0%) | 0 (0.0%) |
| Total | 810 (67.9%) | 383 (32.1%) |
Educational Attainment by Field of Study in Mount Olive
Education (197 | 41.5%), business (66 | 13.9%), engineering (40 | 8.4%), literature & languages (39 | 8.2%), and social sciences (36 | 7.6%) are the most common fields of study among 475 individuals in Mount Olive who have obtained a bachelor's degree or higher.
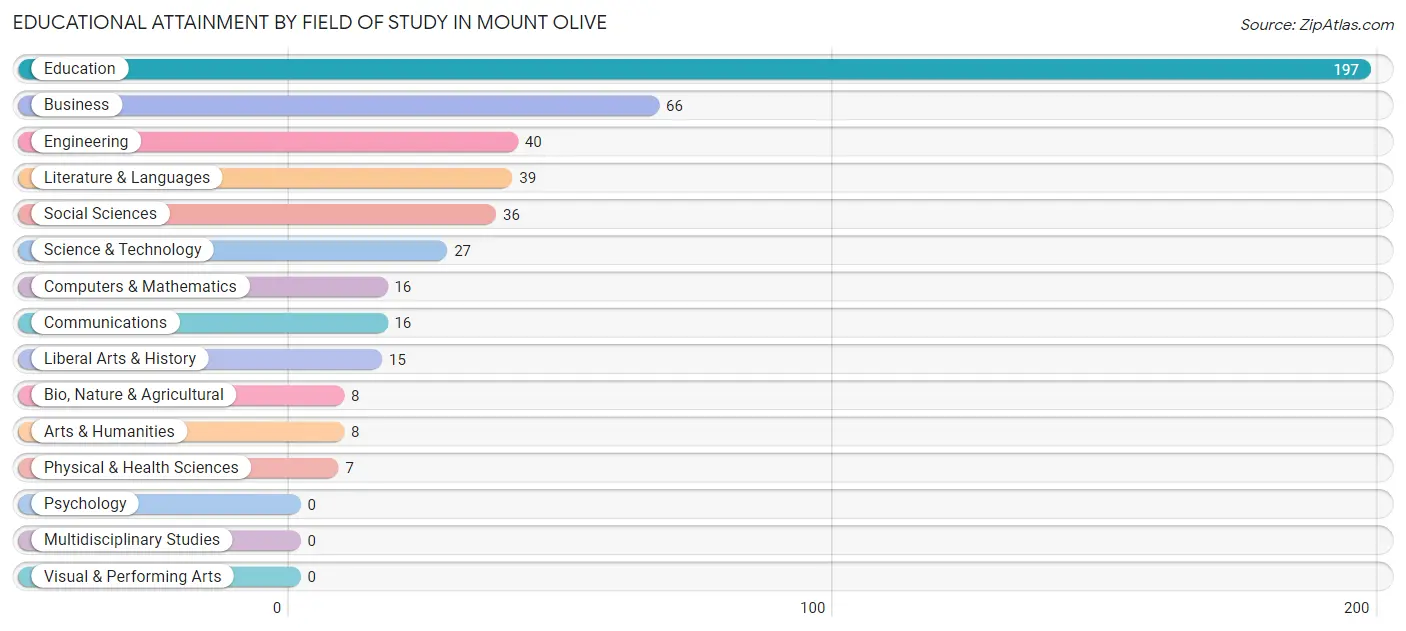
| Field of Study | # Graduates | % Graduates |
| Computers & Mathematics | 16 | 3.4% |
| Bio, Nature & Agricultural | 8 | 1.7% |
| Physical & Health Sciences | 7 | 1.5% |
| Psychology | 0 | 0.0% |
| Social Sciences | 36 | 7.6% |
| Engineering | 40 | 8.4% |
| Multidisciplinary Studies | 0 | 0.0% |
| Science & Technology | 27 | 5.7% |
| Business | 66 | 13.9% |
| Education | 197 | 41.5% |
| Literature & Languages | 39 | 8.2% |
| Liberal Arts & History | 15 | 3.2% |
| Visual & Performing Arts | 0 | 0.0% |
| Communications | 16 | 3.4% |
| Arts & Humanities | 8 | 1.7% |
| Total | 475 | 100.0% |
Transportation & Commute in Mount Olive
Vehicle Availability by Sex in Mount Olive
The most prevalent vehicle ownership categories in Mount Olive are males with 2 vehicles (369, accounting for 35.5%) and females with 2 vehicles (248, making up 45.5%).
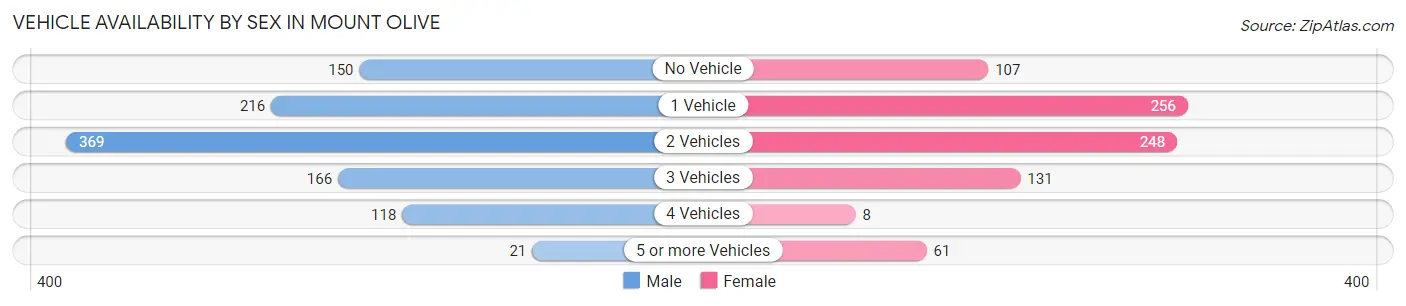
| Vehicles Available | Male | Female |
| No Vehicle | 150 (14.4%) | 107 (13.2%) |
| 1 Vehicle | 216 (20.8%) | 256 (31.6%) |
| 2 Vehicles | 369 (35.5%) | 248 (30.6%) |
| 3 Vehicles | 166 (16.0%) | 131 (16.2%) |
| 4 Vehicles | 118 (11.4%) | 8 (1.0%) |
| 5 or more Vehicles | 21 (2.0%) | 61 (7.5%) |
| Total | 1,040 (100.0%) | 811 (100.0%) |
Commute Time in Mount Olive
The most frequently occuring commute durations in Mount Olive are 5 to 9 minutes (527 commuters, 27.8%), less than 5 minutes (249 commuters, 13.1%), and 30 to 34 minutes (242 commuters, 12.8%).
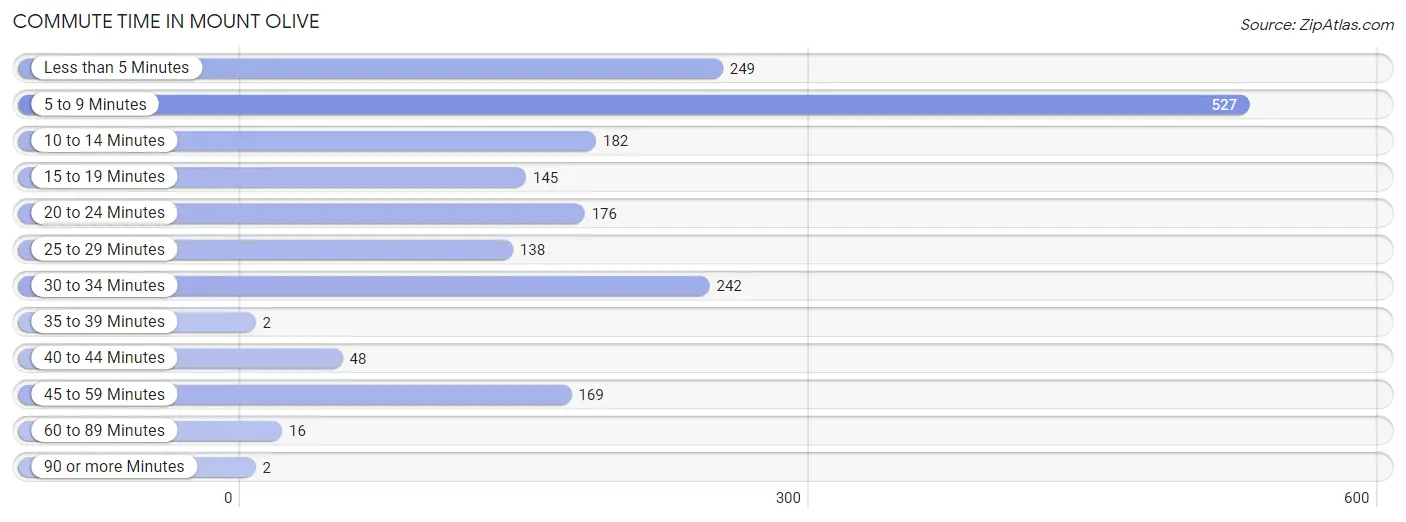
| Commute Time | # Commuters | % Commuters |
| Less than 5 Minutes | 249 | 13.1% |
| 5 to 9 Minutes | 527 | 27.8% |
| 10 to 14 Minutes | 182 | 9.6% |
| 15 to 19 Minutes | 145 | 7.6% |
| 20 to 24 Minutes | 176 | 9.3% |
| 25 to 29 Minutes | 138 | 7.3% |
| 30 to 34 Minutes | 242 | 12.8% |
| 35 to 39 Minutes | 2 | 0.1% |
| 40 to 44 Minutes | 48 | 2.5% |
| 45 to 59 Minutes | 169 | 8.9% |
| 60 to 89 Minutes | 16 | 0.8% |
| 90 or more Minutes | 2 | 0.1% |
Commute Time by Sex in Mount Olive
The most common commute times in Mount Olive are 5 to 9 minutes (289 commuters, 27.1%) for males and 5 to 9 minutes (238 commuters, 28.7%) for females.
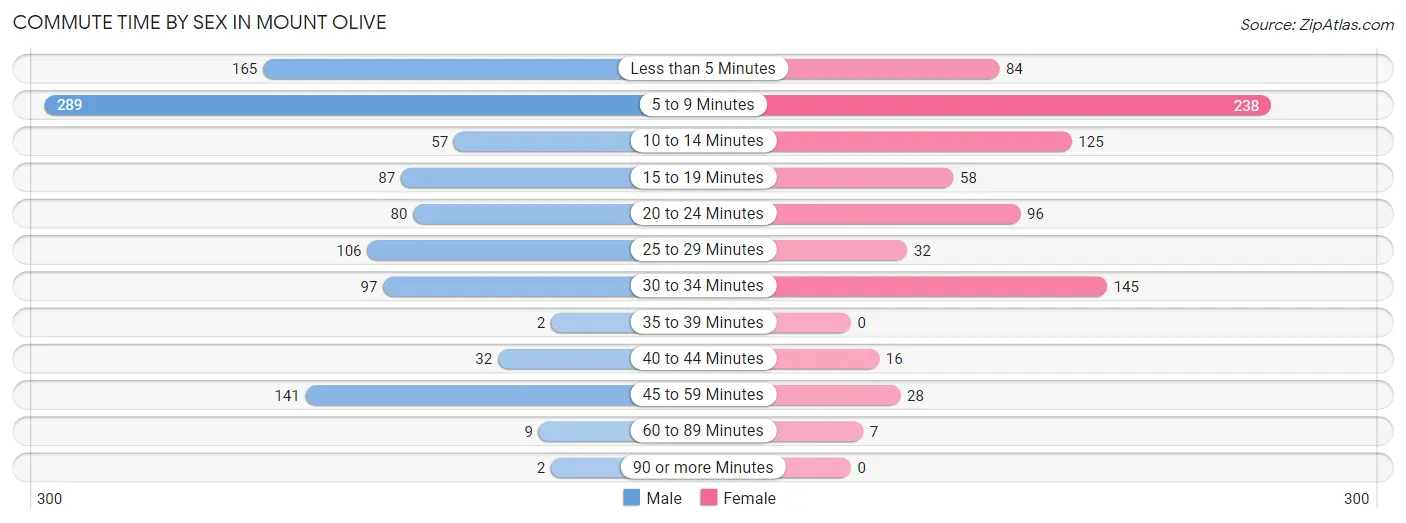
| Commute Time | Male | Female |
| Less than 5 Minutes | 165 (15.5%) | 84 (10.1%) |
| 5 to 9 Minutes | 289 (27.1%) | 238 (28.7%) |
| 10 to 14 Minutes | 57 (5.3%) | 125 (15.1%) |
| 15 to 19 Minutes | 87 (8.2%) | 58 (7.0%) |
| 20 to 24 Minutes | 80 (7.5%) | 96 (11.6%) |
| 25 to 29 Minutes | 106 (9.9%) | 32 (3.9%) |
| 30 to 34 Minutes | 97 (9.1%) | 145 (17.5%) |
| 35 to 39 Minutes | 2 (0.2%) | 0 (0.0%) |
| 40 to 44 Minutes | 32 (3.0%) | 16 (1.9%) |
| 45 to 59 Minutes | 141 (13.2%) | 28 (3.4%) |
| 60 to 89 Minutes | 9 (0.8%) | 7 (0.8%) |
| 90 or more Minutes | 2 (0.2%) | 0 (0.0%) |
Time of Departure to Work by Sex in Mount Olive
The most frequent times of departure to work in Mount Olive are 7:30 AM to 7:59 AM (211, 19.8%) for males and 7:00 AM to 7:29 AM (185, 22.3%) for females.
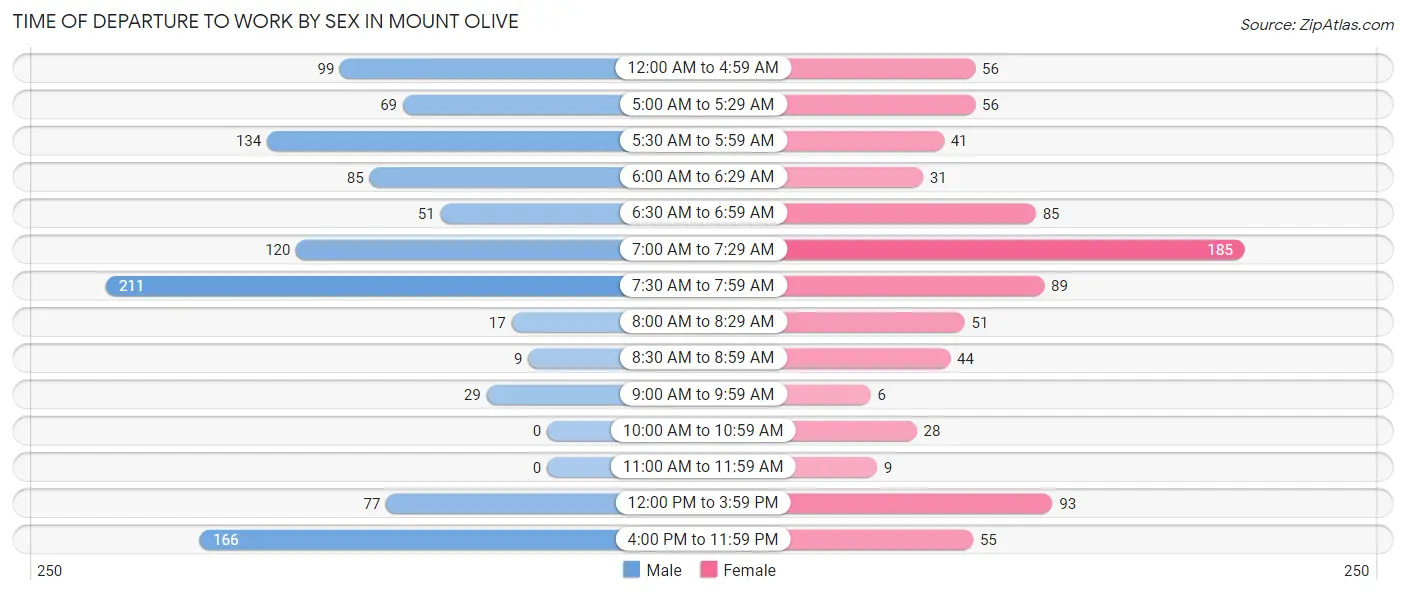
| Time of Departure | Male | Female |
| 12:00 AM to 4:59 AM | 99 (9.3%) | 56 (6.8%) |
| 5:00 AM to 5:29 AM | 69 (6.5%) | 56 (6.8%) |
| 5:30 AM to 5:59 AM | 134 (12.6%) | 41 (5.0%) |
| 6:00 AM to 6:29 AM | 85 (8.0%) | 31 (3.7%) |
| 6:30 AM to 6:59 AM | 51 (4.8%) | 85 (10.2%) |
| 7:00 AM to 7:29 AM | 120 (11.3%) | 185 (22.3%) |
| 7:30 AM to 7:59 AM | 211 (19.8%) | 89 (10.7%) |
| 8:00 AM to 8:29 AM | 17 (1.6%) | 51 (6.1%) |
| 8:30 AM to 8:59 AM | 9 (0.8%) | 44 (5.3%) |
| 9:00 AM to 9:59 AM | 29 (2.7%) | 6 (0.7%) |
| 10:00 AM to 10:59 AM | 0 (0.0%) | 28 (3.4%) |
| 11:00 AM to 11:59 AM | 0 (0.0%) | 9 (1.1%) |
| 12:00 PM to 3:59 PM | 77 (7.2%) | 93 (11.2%) |
| 4:00 PM to 11:59 PM | 166 (15.6%) | 55 (6.6%) |
| Total | 1,067 (100.0%) | 829 (100.0%) |
Housing Occupancy in Mount Olive
Occupancy by Ownership in Mount Olive
Of the total 1,736 dwellings in Mount Olive, owner-occupied units account for 928 (53.5%), while renter-occupied units make up 808 (46.5%).
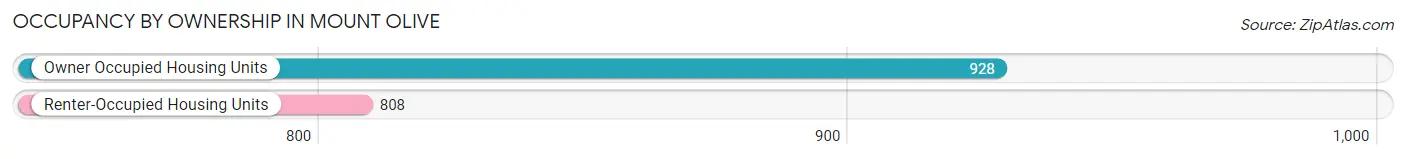
| Occupancy | # Housing Units | % Housing Units |
| Owner Occupied Housing Units | 928 | 53.5% |
| Renter-Occupied Housing Units | 808 | 46.5% |
| Total Occupied Housing Units | 1,736 | 100.0% |
Occupancy by Household Size in Mount Olive
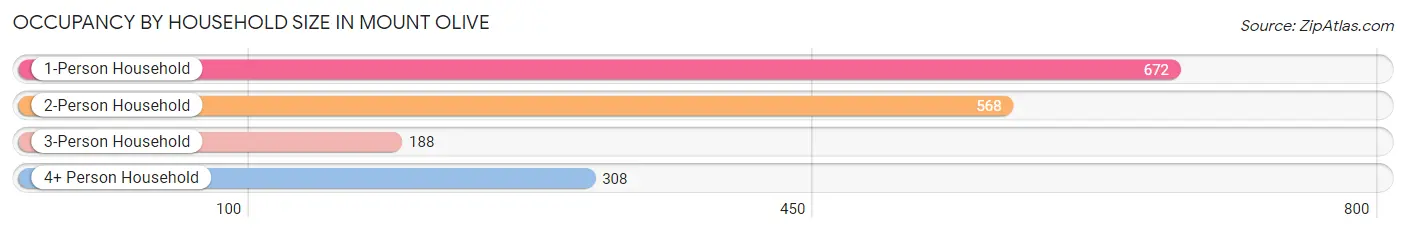
| Household Size | # Housing Units | % Housing Units |
| 1-Person Household | 672 | 38.7% |
| 2-Person Household | 568 | 32.7% |
| 3-Person Household | 188 | 10.8% |
| 4+ Person Household | 308 | 17.7% |
| Total Housing Units | 1,736 | 100.0% |
Occupancy by Ownership by Household Size in Mount Olive
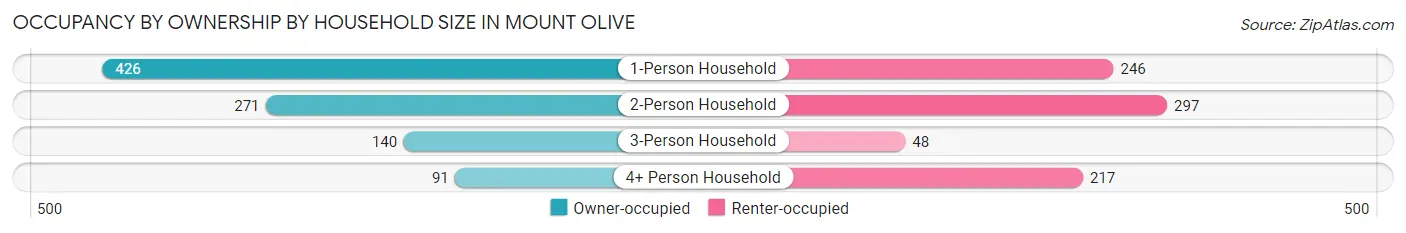
| Household Size | Owner-occupied | Renter-occupied |
| 1-Person Household | 426 (63.4%) | 246 (36.6%) |
| 2-Person Household | 271 (47.7%) | 297 (52.3%) |
| 3-Person Household | 140 (74.5%) | 48 (25.5%) |
| 4+ Person Household | 91 (29.5%) | 217 (70.5%) |
| Total Housing Units | 928 (53.5%) | 808 (46.5%) |
Occupancy by Educational Attainment in Mount Olive
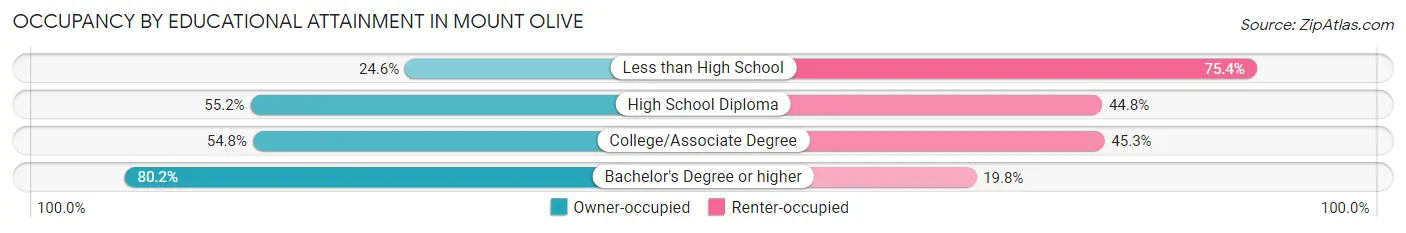
| Household Size | Owner-occupied | Renter-occupied |
| Less than High School | 71 (24.6%) | 218 (75.4%) |
| High School Diploma | 375 (55.2%) | 304 (44.8%) |
| College/Associate Degree | 288 (54.7%) | 238 (45.3%) |
| Bachelor's Degree or higher | 194 (80.2%) | 48 (19.8%) |
Occupancy by Age of Householder in Mount Olive
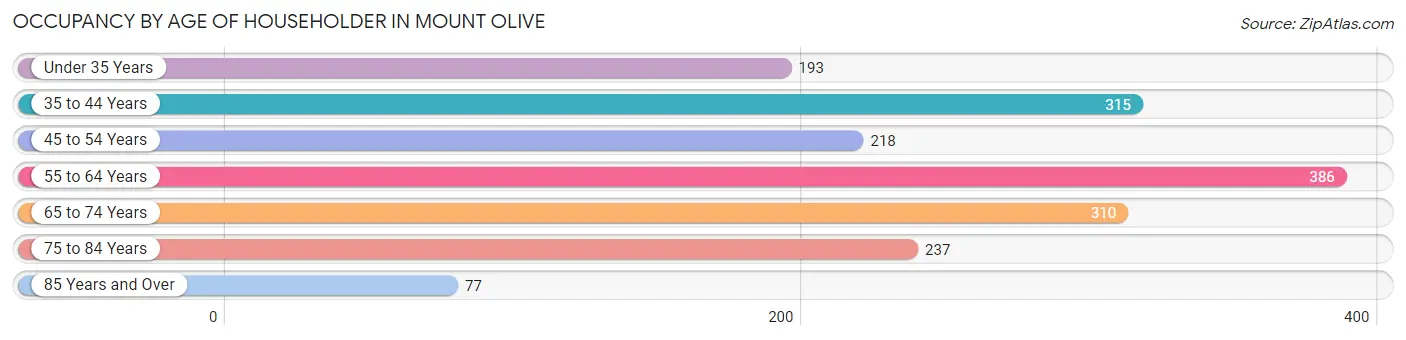
| Age Bracket | # Households | % Households |
| Under 35 Years | 193 | 11.1% |
| 35 to 44 Years | 315 | 18.1% |
| 45 to 54 Years | 218 | 12.6% |
| 55 to 64 Years | 386 | 22.2% |
| 65 to 74 Years | 310 | 17.9% |
| 75 to 84 Years | 237 | 13.7% |
| 85 Years and Over | 77 | 4.4% |
| Total | 1,736 | 100.0% |
Housing Finances in Mount Olive
Median Income by Occupancy in Mount Olive
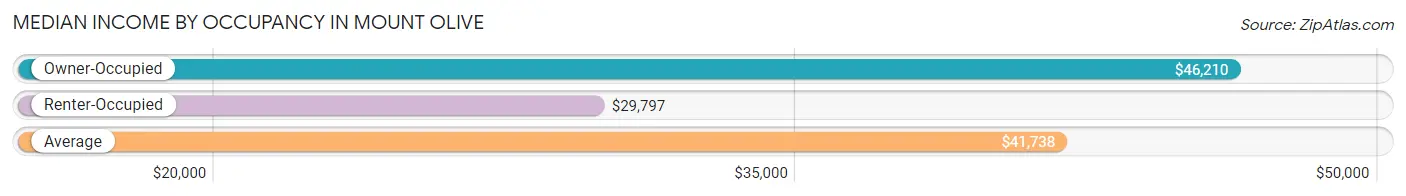
| Occupancy Type | # Households | Median Income |
| Owner-Occupied | 928 (53.5%) | $46,210 |
| Renter-Occupied | 808 (46.5%) | $29,797 |
| Average | 1,736 (100.0%) | $41,738 |
Occupancy by Householder Income Bracket in Mount Olive
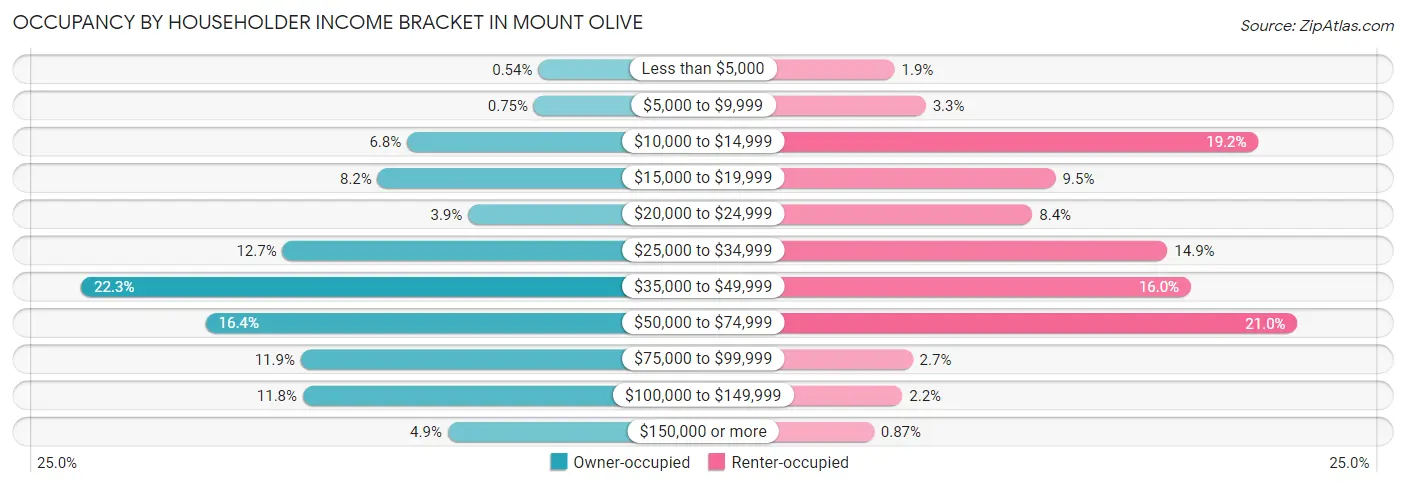
| Income Bracket | Owner-occupied | Renter-occupied |
| Less than $5,000 | 5 (0.5%) | 15 (1.9%) |
| $5,000 to $9,999 | 7 (0.7%) | 27 (3.3%) |
| $10,000 to $14,999 | 63 (6.8%) | 155 (19.2%) |
| $15,000 to $19,999 | 76 (8.2%) | 77 (9.5%) |
| $20,000 to $24,999 | 36 (3.9%) | 68 (8.4%) |
| $25,000 to $34,999 | 118 (12.7%) | 120 (14.8%) |
| $35,000 to $49,999 | 207 (22.3%) | 129 (16.0%) |
| $50,000 to $74,999 | 152 (16.4%) | 170 (21.0%) |
| $75,000 to $99,999 | 110 (11.8%) | 22 (2.7%) |
| $100,000 to $149,999 | 109 (11.7%) | 18 (2.2%) |
| $150,000 or more | 45 (4.9%) | 7 (0.9%) |
| Total | 928 (100.0%) | 808 (100.0%) |
Monthly Housing Cost Tiers in Mount Olive
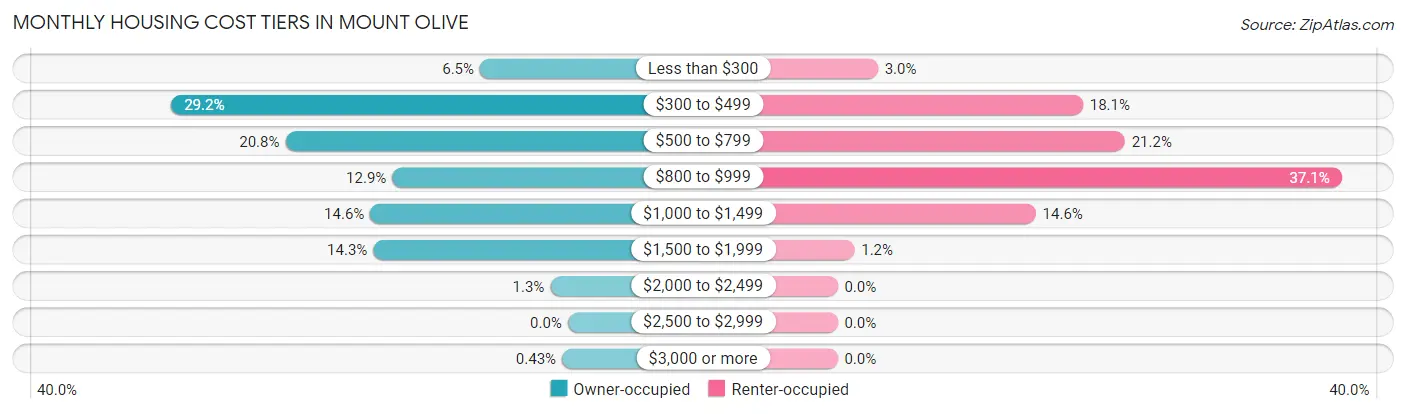
| Monthly Cost | Owner-occupied | Renter-occupied |
| Less than $300 | 60 (6.5%) | 24 (3.0%) |
| $300 to $499 | 271 (29.2%) | 146 (18.1%) |
| $500 to $799 | 193 (20.8%) | 171 (21.2%) |
| $800 to $999 | 120 (12.9%) | 300 (37.1%) |
| $1,000 to $1,499 | 135 (14.5%) | 118 (14.6%) |
| $1,500 to $1,999 | 133 (14.3%) | 10 (1.2%) |
| $2,000 to $2,499 | 12 (1.3%) | 0 (0.0%) |
| $2,500 to $2,999 | 0 (0.0%) | 0 (0.0%) |
| $3,000 or more | 4 (0.4%) | 0 (0.0%) |
| Total | 928 (100.0%) | 808 (100.0%) |
Physical Housing Characteristics in Mount Olive
Housing Structures in Mount Olive
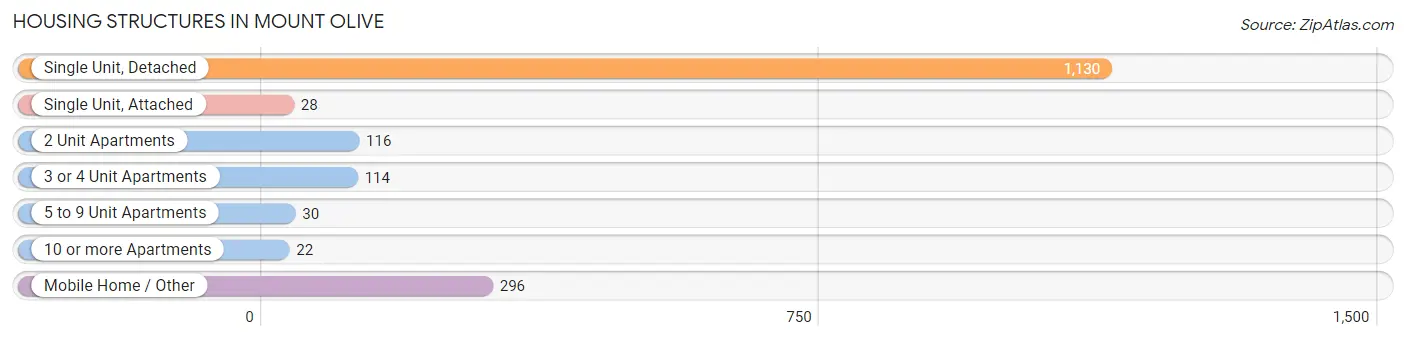
| Structure Type | # Housing Units | % Housing Units |
| Single Unit, Detached | 1,130 | 65.1% |
| Single Unit, Attached | 28 | 1.6% |
| 2 Unit Apartments | 116 | 6.7% |
| 3 or 4 Unit Apartments | 114 | 6.6% |
| 5 to 9 Unit Apartments | 30 | 1.7% |
| 10 or more Apartments | 22 | 1.3% |
| Mobile Home / Other | 296 | 17.1% |
| Total | 1,736 | 100.0% |
Housing Structures by Occupancy in Mount Olive
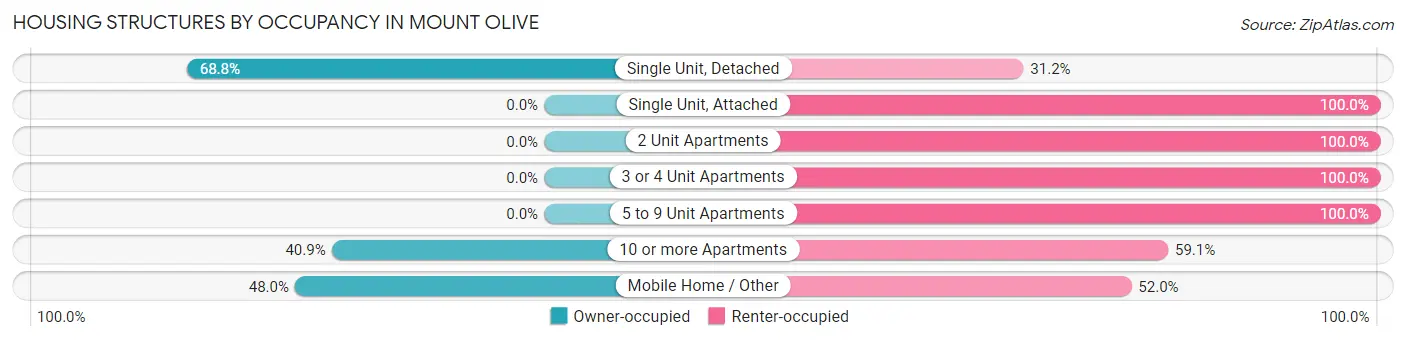
| Structure Type | Owner-occupied | Renter-occupied |
| Single Unit, Detached | 777 (68.8%) | 353 (31.2%) |
| Single Unit, Attached | 0 (0.0%) | 28 (100.0%) |
| 2 Unit Apartments | 0 (0.0%) | 116 (100.0%) |
| 3 or 4 Unit Apartments | 0 (0.0%) | 114 (100.0%) |
| 5 to 9 Unit Apartments | 0 (0.0%) | 30 (100.0%) |
| 10 or more Apartments | 9 (40.9%) | 13 (59.1%) |
| Mobile Home / Other | 142 (48.0%) | 154 (52.0%) |
| Total | 928 (53.5%) | 808 (46.5%) |
Housing Structures by Number of Rooms in Mount Olive
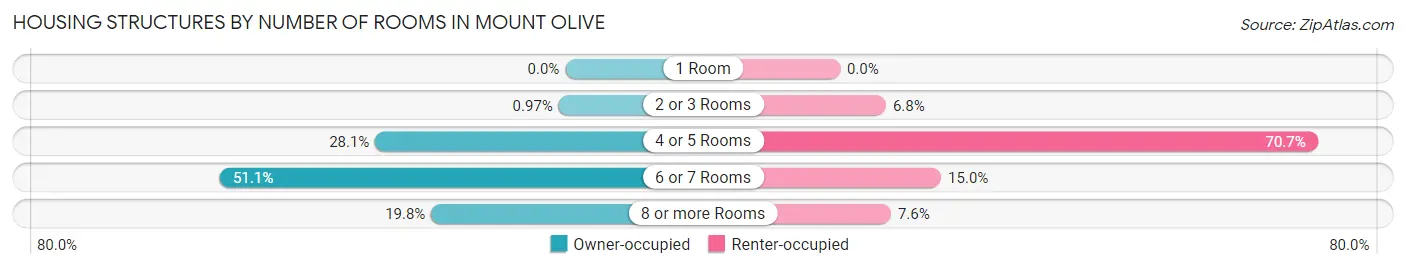
| Number of Rooms | Owner-occupied | Renter-occupied |
| 1 Room | 0 (0.0%) | 0 (0.0%) |
| 2 or 3 Rooms | 9 (1.0%) | 55 (6.8%) |
| 4 or 5 Rooms | 261 (28.1%) | 571 (70.7%) |
| 6 or 7 Rooms | 474 (51.1%) | 121 (15.0%) |
| 8 or more Rooms | 184 (19.8%) | 61 (7.5%) |
| Total | 928 (100.0%) | 808 (100.0%) |
Housing Structure by Heating Type in Mount Olive
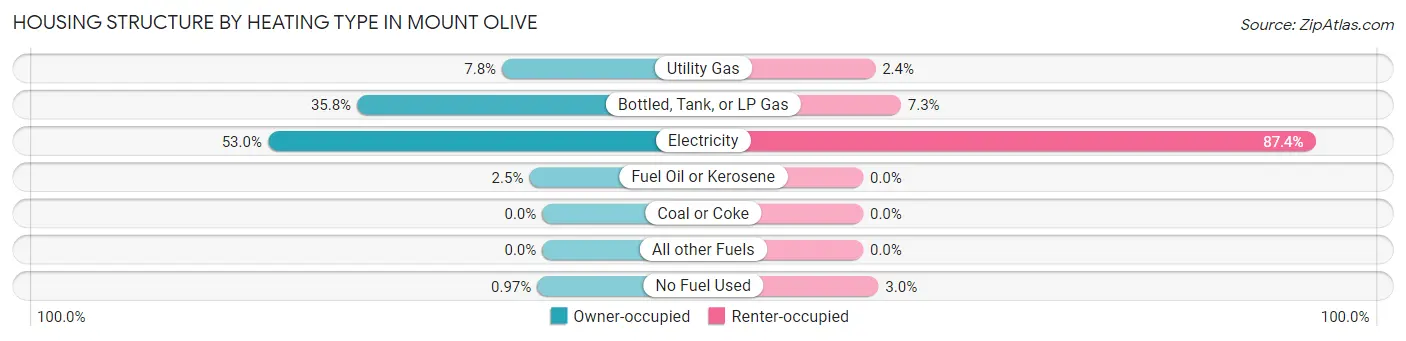
| Heating Type | Owner-occupied | Renter-occupied |
| Utility Gas | 72 (7.8%) | 19 (2.4%) |
| Bottled, Tank, or LP Gas | 332 (35.8%) | 59 (7.3%) |
| Electricity | 492 (53.0%) | 706 (87.4%) |
| Fuel Oil or Kerosene | 23 (2.5%) | 0 (0.0%) |
| Coal or Coke | 0 (0.0%) | 0 (0.0%) |
| All other Fuels | 0 (0.0%) | 0 (0.0%) |
| No Fuel Used | 9 (1.0%) | 24 (3.0%) |
| Total | 928 (100.0%) | 808 (100.0%) |
Household Vehicle Usage in Mount Olive
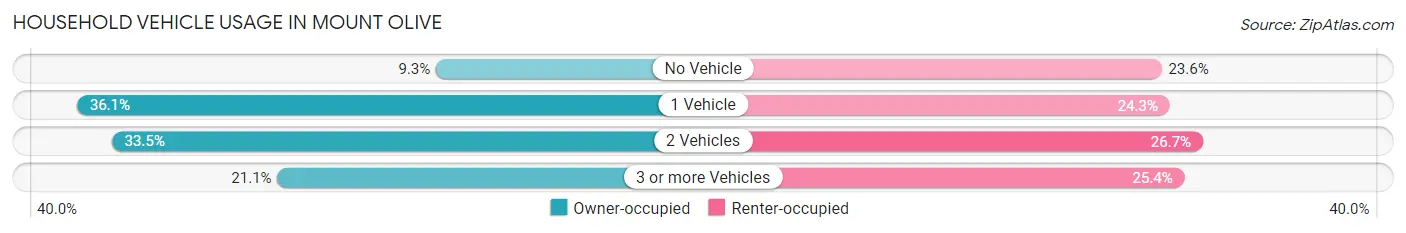
| Vehicles per Household | Owner-occupied | Renter-occupied |
| No Vehicle | 86 (9.3%) | 191 (23.6%) |
| 1 Vehicle | 335 (36.1%) | 196 (24.3%) |
| 2 Vehicles | 311 (33.5%) | 216 (26.7%) |
| 3 or more Vehicles | 196 (21.1%) | 205 (25.4%) |
| Total | 928 (100.0%) | 808 (100.0%) |
Real Estate & Mortgages in Mount Olive
Real Estate and Mortgage Overview in Mount Olive
| Characteristic | Without Mortgage | With Mortgage |
| Housing Units | 513 | 415 |
| Median Property Value | $93,600 | $133,400 |
| Median Household Income | $40,573 | $15 |
| Monthly Housing Costs | $456 | $4 |
| Real Estate Taxes | $1,185 | $7 |
Property Value by Mortgage Status in Mount Olive
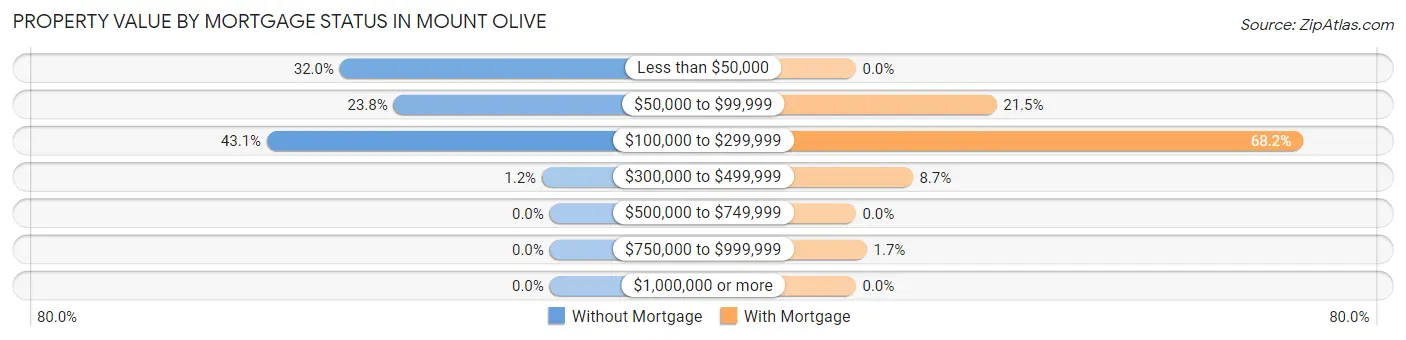
| Property Value | Without Mortgage | With Mortgage |
| Less than $50,000 | 164 (32.0%) | 0 (0.0%) |
| $50,000 to $99,999 | 122 (23.8%) | 89 (21.4%) |
| $100,000 to $299,999 | 221 (43.1%) | 283 (68.2%) |
| $300,000 to $499,999 | 6 (1.2%) | 36 (8.7%) |
| $500,000 to $749,999 | 0 (0.0%) | 0 (0.0%) |
| $750,000 to $999,999 | 0 (0.0%) | 7 (1.7%) |
| $1,000,000 or more | 0 (0.0%) | 0 (0.0%) |
| Total | 513 (100.0%) | 415 (100.0%) |
Household Income by Mortgage Status in Mount Olive
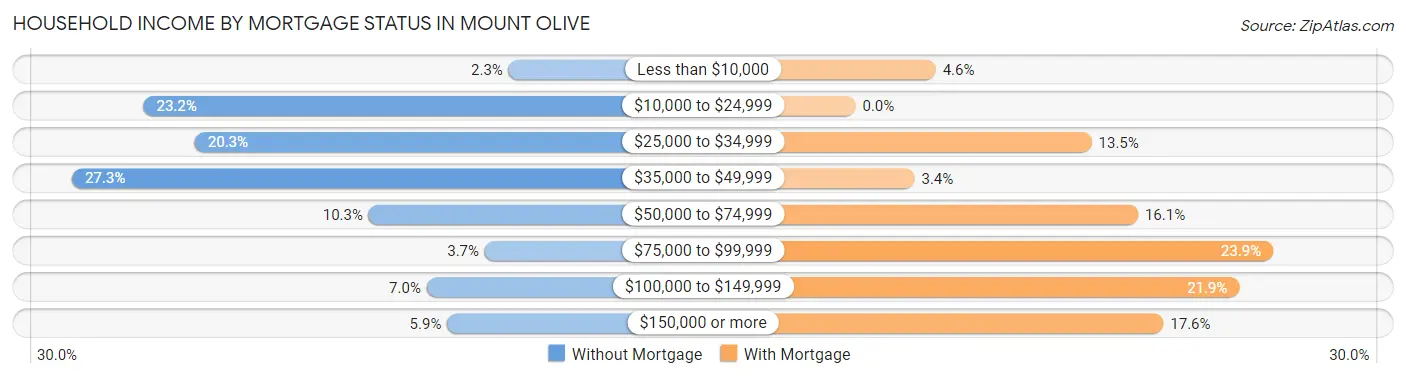
| Household Income | Without Mortgage | With Mortgage |
| Less than $10,000 | 12 (2.3%) | 19 (4.6%) |
| $10,000 to $24,999 | 119 (23.2%) | 0 (0.0%) |
| $25,000 to $34,999 | 104 (20.3%) | 56 (13.5%) |
| $35,000 to $49,999 | 140 (27.3%) | 14 (3.4%) |
| $50,000 to $74,999 | 53 (10.3%) | 67 (16.1%) |
| $75,000 to $99,999 | 19 (3.7%) | 99 (23.9%) |
| $100,000 to $149,999 | 36 (7.0%) | 91 (21.9%) |
| $150,000 or more | 30 (5.9%) | 73 (17.6%) |
| Total | 513 (100.0%) | 415 (100.0%) |
Property Value to Household Income Ratio in Mount Olive
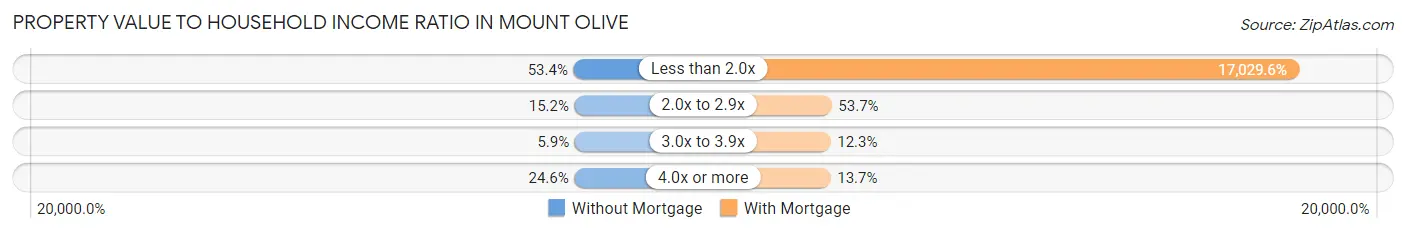
| Value-to-Income Ratio | Without Mortgage | With Mortgage |
| Less than 2.0x | 274 (53.4%) | 70,673 (17,029.6%) |
| 2.0x to 2.9x | 78 (15.2%) | 223 (53.7%) |
| 3.0x to 3.9x | 30 (5.9%) | 51 (12.3%) |
| 4.0x or more | 126 (24.6%) | 57 (13.7%) |
| Total | 513 (100.0%) | 415 (100.0%) |
Real Estate Taxes by Mortgage Status in Mount Olive
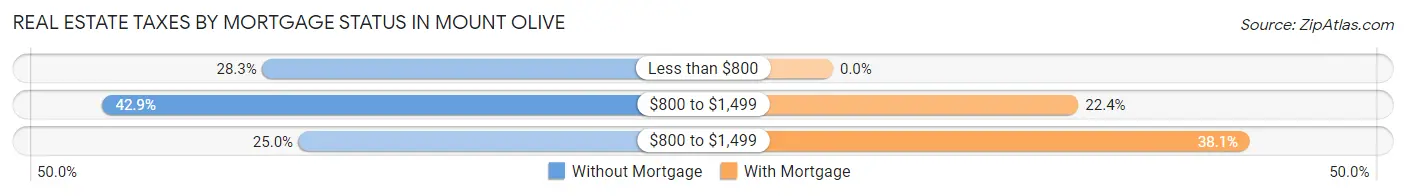
| Property Taxes | Without Mortgage | With Mortgage |
| Less than $800 | 145 (28.3%) | 0 (0.0%) |
| $800 to $1,499 | 220 (42.9%) | 93 (22.4%) |
| $800 to $1,499 | 128 (24.9%) | 158 (38.1%) |
| Total | 513 (100.0%) | 415 (100.0%) |
Health & Disability in Mount Olive
Health Insurance Coverage by Age in Mount Olive
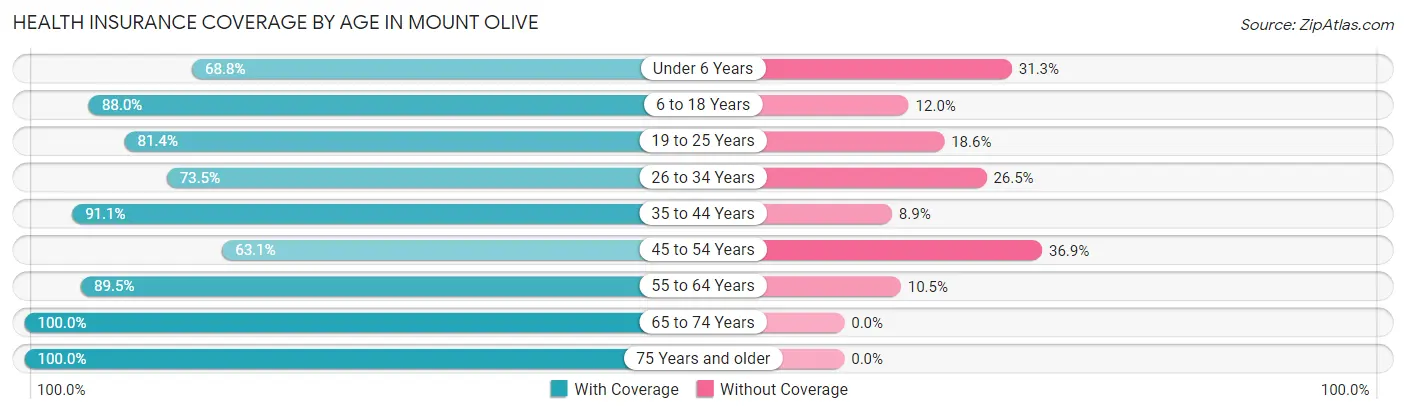
| Age Bracket | With Coverage | Without Coverage |
| Under 6 Years | 55 (68.8%) | 25 (31.2%) |
| 6 to 18 Years | 719 (88.0%) | 98 (12.0%) |
| 19 to 25 Years | 585 (81.4%) | 134 (18.6%) |
| 26 to 34 Years | 158 (73.5%) | 57 (26.5%) |
| 35 to 44 Years | 400 (91.1%) | 39 (8.9%) |
| 45 to 54 Years | 274 (63.1%) | 160 (36.9%) |
| 55 to 64 Years | 645 (89.5%) | 76 (10.5%) |
| 65 to 74 Years | 403 (100.0%) | 0 (0.0%) |
| 75 Years and older | 331 (100.0%) | 0 (0.0%) |
| Total | 3,570 (85.8%) | 589 (14.2%) |
Health Insurance Coverage by Citizenship Status in Mount Olive
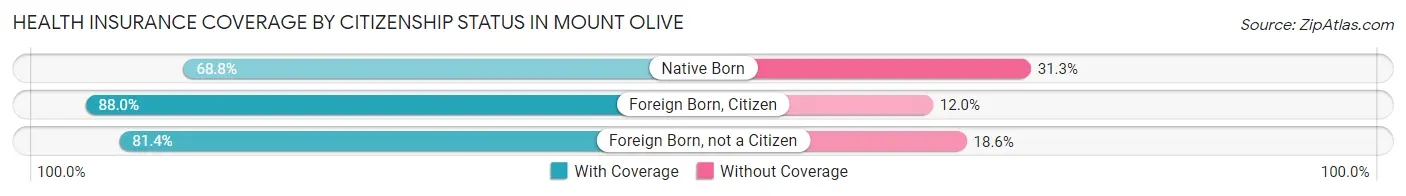
| Citizenship Status | With Coverage | Without Coverage |
| Native Born | 55 (68.8%) | 25 (31.2%) |
| Foreign Born, Citizen | 719 (88.0%) | 98 (12.0%) |
| Foreign Born, not a Citizen | 585 (81.4%) | 134 (18.6%) |
Health Insurance Coverage by Household Income in Mount Olive
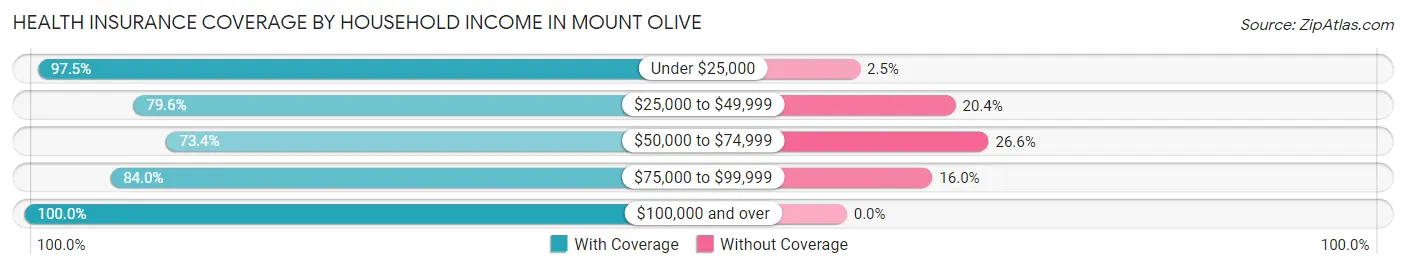
| Household Income | With Coverage | Without Coverage |
| Under $25,000 | 863 (97.5%) | 22 (2.5%) |
| $25,000 to $49,999 | 977 (79.6%) | 250 (20.4%) |
| $50,000 to $74,999 | 614 (73.4%) | 222 (26.6%) |
| $75,000 to $99,999 | 246 (84.0%) | 47 (16.0%) |
| $100,000 and over | 540 (100.0%) | 0 (0.0%) |
Public vs Private Health Insurance Coverage by Age in Mount Olive
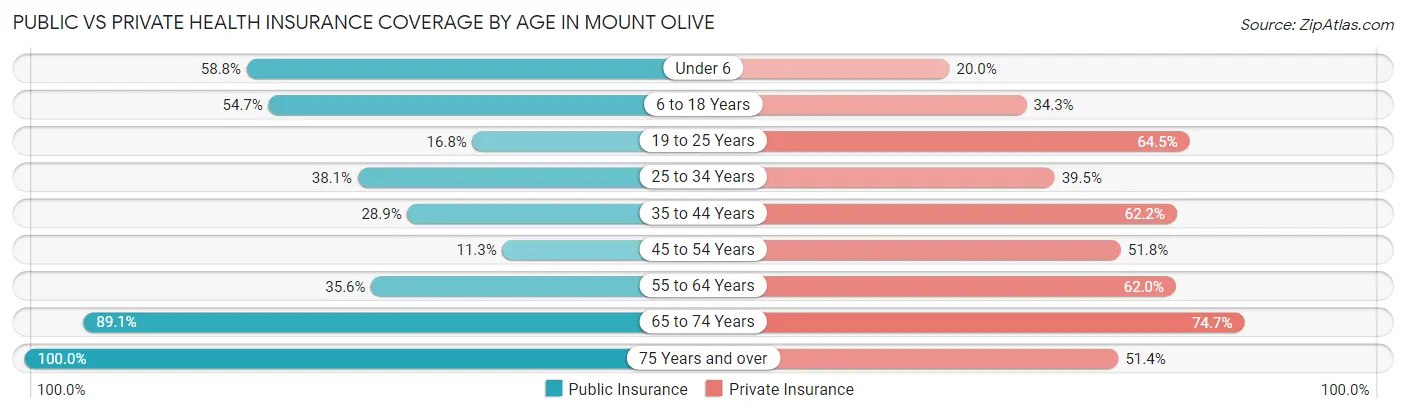
| Age Bracket | Public Insurance | Private Insurance |
| Under 6 | 47 (58.8%) | 16 (20.0%) |
| 6 to 18 Years | 447 (54.7%) | 280 (34.3%) |
| 19 to 25 Years | 121 (16.8%) | 464 (64.5%) |
| 25 to 34 Years | 82 (38.1%) | 85 (39.5%) |
| 35 to 44 Years | 127 (28.9%) | 273 (62.2%) |
| 45 to 54 Years | 49 (11.3%) | 225 (51.8%) |
| 55 to 64 Years | 257 (35.6%) | 447 (62.0%) |
| 65 to 74 Years | 359 (89.1%) | 301 (74.7%) |
| 75 Years and over | 331 (100.0%) | 170 (51.4%) |
| Total | 1,820 (43.8%) | 2,261 (54.4%) |
Disability Status by Sex by Age in Mount Olive
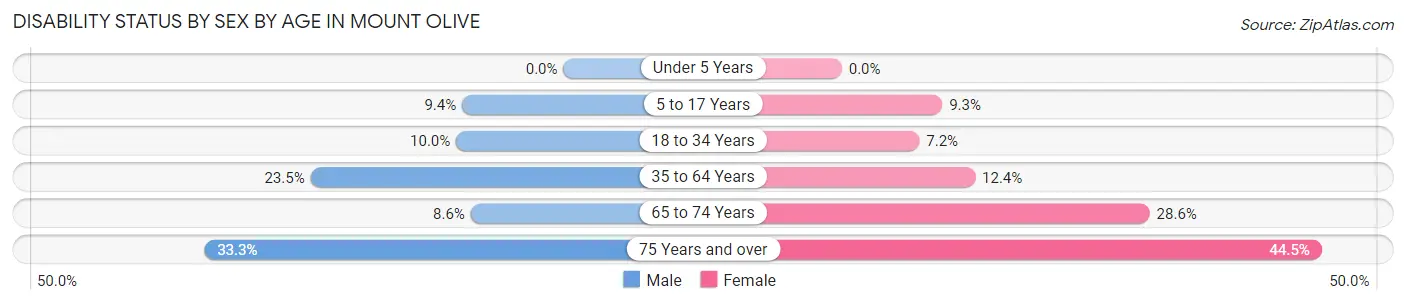
| Age Bracket | Male | Female |
| Under 5 Years | 0 (0.0%) | 0 (0.0%) |
| 5 to 17 Years | 47 (9.4%) | 15 (9.3%) |
| 18 to 34 Years | 77 (10.0%) | 26 (7.2%) |
| 35 to 64 Years | 173 (23.5%) | 106 (12.4%) |
| 65 to 74 Years | 16 (8.6%) | 62 (28.6%) |
| 75 Years and over | 25 (33.3%) | 114 (44.5%) |
Disability Class by Sex by Age in Mount Olive
Disability Class: Hearing Difficulty
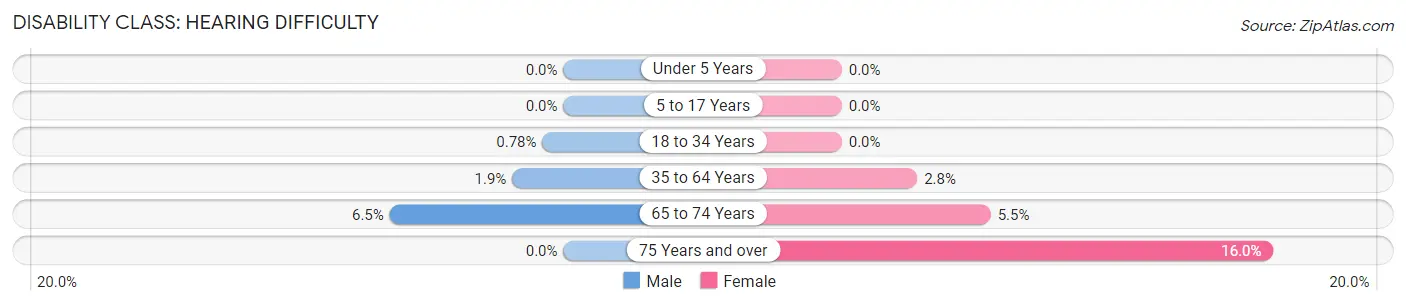
| Age Bracket | Male | Female |
| Under 5 Years | 0 (0.0%) | 0 (0.0%) |
| 5 to 17 Years | 0 (0.0%) | 0 (0.0%) |
| 18 to 34 Years | 6 (0.8%) | 0 (0.0%) |
| 35 to 64 Years | 14 (1.9%) | 24 (2.8%) |
| 65 to 74 Years | 12 (6.5%) | 12 (5.5%) |
| 75 Years and over | 0 (0.0%) | 41 (16.0%) |
Disability Class: Vision Difficulty
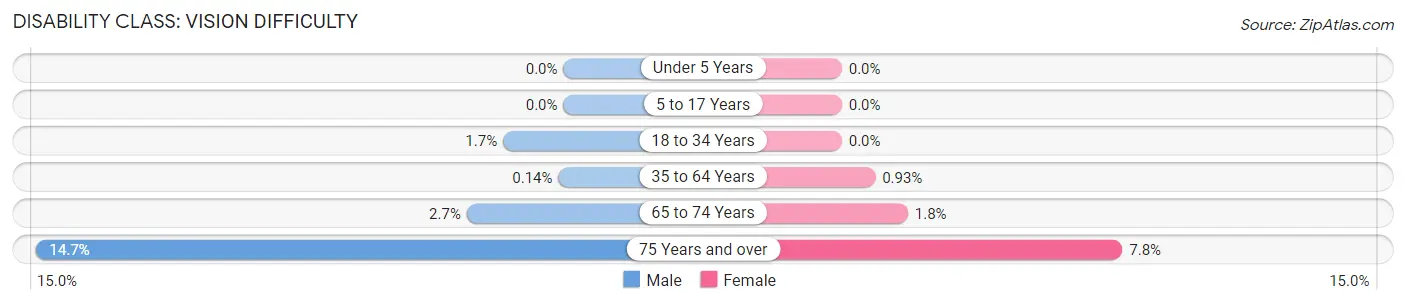
| Age Bracket | Male | Female |
| Under 5 Years | 0 (0.0%) | 0 (0.0%) |
| 5 to 17 Years | 0 (0.0%) | 0 (0.0%) |
| 18 to 34 Years | 13 (1.7%) | 0 (0.0%) |
| 35 to 64 Years | 1 (0.1%) | 8 (0.9%) |
| 65 to 74 Years | 5 (2.7%) | 4 (1.8%) |
| 75 Years and over | 11 (14.7%) | 20 (7.8%) |
Disability Class: Cognitive Difficulty
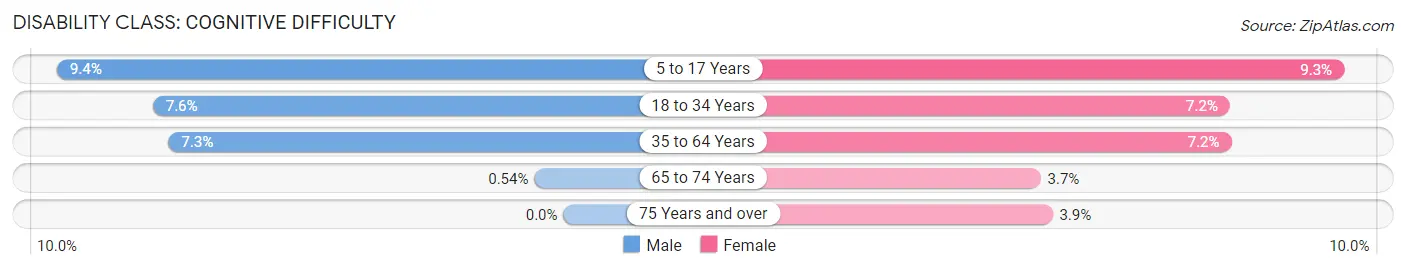
| Age Bracket | Male | Female |
| 5 to 17 Years | 47 (9.4%) | 15 (9.3%) |
| 18 to 34 Years | 59 (7.6%) | 26 (7.2%) |
| 35 to 64 Years | 54 (7.3%) | 62 (7.2%) |
| 65 to 74 Years | 1 (0.5%) | 8 (3.7%) |
| 75 Years and over | 0 (0.0%) | 10 (3.9%) |
Disability Class: Ambulatory Difficulty
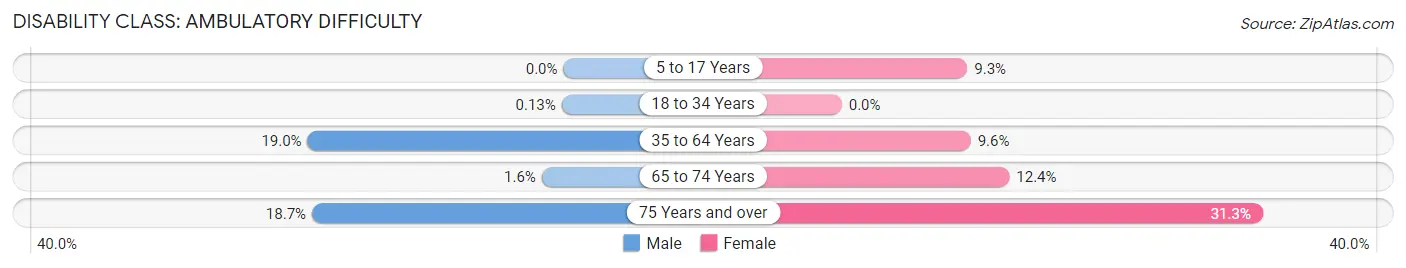
| Age Bracket | Male | Female |
| 5 to 17 Years | 0 (0.0%) | 15 (9.3%) |
| 18 to 34 Years | 1 (0.1%) | 0 (0.0%) |
| 35 to 64 Years | 140 (19.0%) | 82 (9.6%) |
| 65 to 74 Years | 3 (1.6%) | 27 (12.4%) |
| 75 Years and over | 14 (18.7%) | 80 (31.2%) |
Disability Class: Self-Care Difficulty
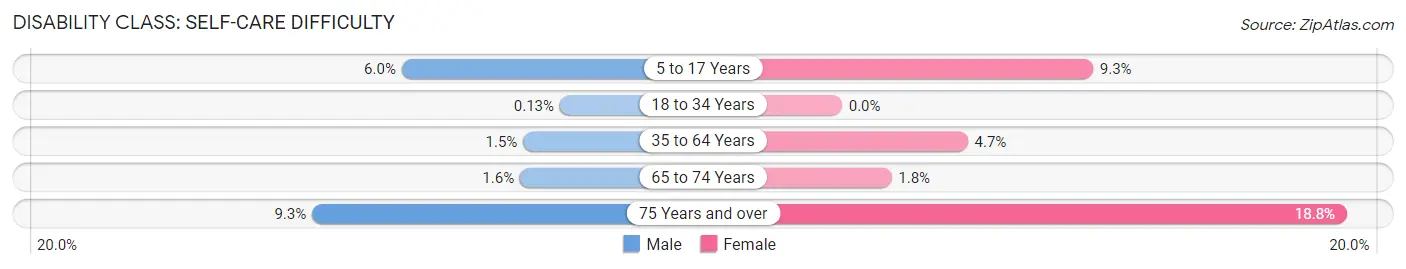
| Age Bracket | Male | Female |
| 5 to 17 Years | 30 (6.0%) | 15 (9.3%) |
| 18 to 34 Years | 1 (0.1%) | 0 (0.0%) |
| 35 to 64 Years | 11 (1.5%) | 40 (4.7%) |
| 65 to 74 Years | 3 (1.6%) | 4 (1.8%) |
| 75 Years and over | 7 (9.3%) | 48 (18.8%) |
Technology Access in Mount Olive
Computing Device Access in Mount Olive
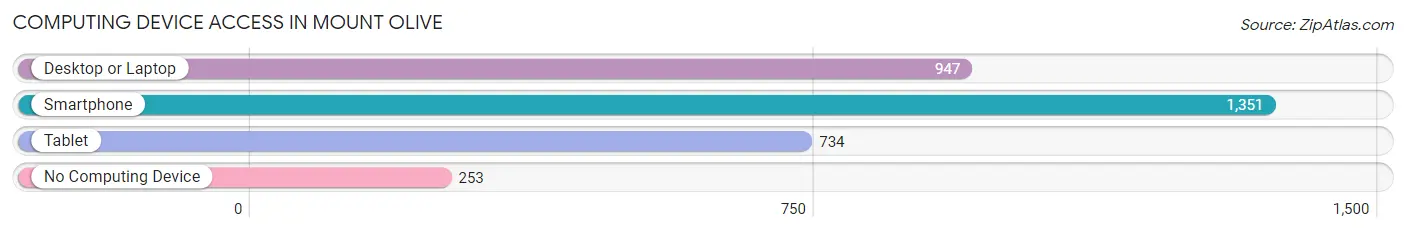
| Device Type | # Households | % Households |
| Desktop or Laptop | 947 | 54.5% |
| Smartphone | 1,351 | 77.8% |
| Tablet | 734 | 42.3% |
| No Computing Device | 253 | 14.6% |
| Total | 1,736 | 100.0% |
Internet Access in Mount Olive
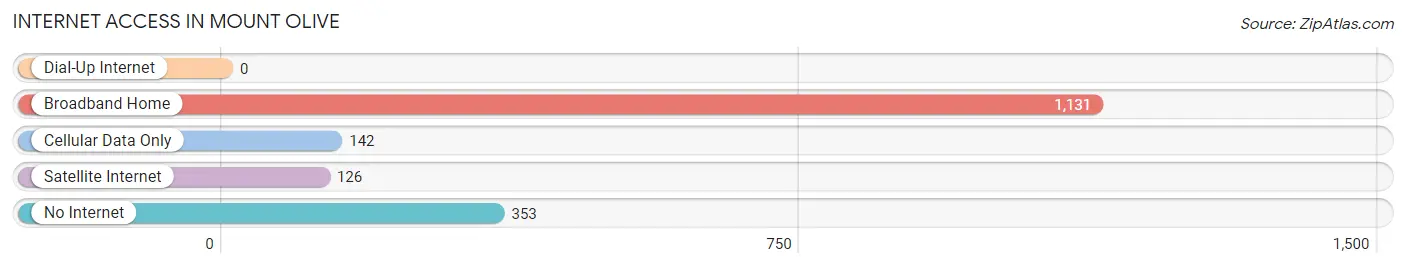
| Internet Type | # Households | % Households |
| Dial-Up Internet | 0 | 0.0% |
| Broadband Home | 1,131 | 65.1% |
| Cellular Data Only | 142 | 8.2% |
| Satellite Internet | 126 | 7.3% |
| No Internet | 353 | 20.3% |
| Total | 1,736 | 100.0% |
Mount Olive Summary
Introduction
Mount Olive is a small town located in Wayne County, North Carolina. It is situated in the eastern part of the state, approximately 40 miles southeast of Raleigh. The town is known for its rich history, diverse geography, and vibrant economy. This paper will provide an overview of Mount Olive’s history, geography, economy, and demographics in 2000 words.
History
Mount Olive was founded in 1874 by a group of settlers from the nearby town of Goldsboro. The town was named after the nearby Mount Olive Church, which was built in 1845. The town quickly grew and by the early 1900s, it had become a thriving agricultural center. The town was also home to several businesses, including a cotton mill, a furniture factory, and a brickyard.
In the early 20th century, Mount Olive experienced a period of growth and prosperity. The town was home to several banks, a movie theater, and a variety of stores. The town also had a thriving African-American community, which included a school, a church, and a number of businesses.
In the 1950s, the town began to decline as the local economy shifted away from agriculture and manufacturing. The town’s population decreased and many of the businesses closed. In the late 1970s, the town began to experience a resurgence as new businesses opened and the population began to grow again.
Geography
Mount Olive is located in the eastern part of North Carolina, approximately 40 miles southeast of Raleigh. The town is situated in the Coastal Plain region of the state, which is characterized by flat terrain and sandy soils. The town is located near the Neuse River, which provides a source of water for the town.
The town is surrounded by several small towns and cities, including Goldsboro, Smithfield, and Kinston. The town is also located near the Croatan National Forest, which provides a variety of outdoor recreational opportunities.
Economy
Mount Olive’s economy is largely based on agriculture and manufacturing. The town is home to several large farms, which produce a variety of crops, including corn, soybeans, and cotton. The town is also home to several manufacturing companies, which produce a variety of products, including furniture, textiles, and automotive parts.
The town is also home to several retail stores, restaurants, and other businesses. The town is also home to several educational institutions, including a community college and a technical institute.
Demographics
As of the 2010 census, the population of Mount Olive was 5,914. The town is predominantly white, with a small African-American population. The town also has a small Hispanic population. The median household income in the town is $37,000, and the median home value is $125,000.
Conclusion
Mount Olive is a small town located in Wayne County, North Carolina. The town is known for its rich history, diverse geography, and vibrant economy. The town is home to several large farms, manufacturing companies, and other businesses. The town is predominantly white, with a small African-American and Hispanic population. The median household income in the town is $37,000, and the median home value is $125,000.
Common Questions
What is Per Capita Income in Mount Olive?
Per Capita income in Mount Olive is $27,462.
What is the Median Family Income in Mount Olive?
Median Family Income in Mount Olive is $63,686.
What is the Median Household income in Mount Olive?
Median Household Income in Mount Olive is $41,738.
What is Income or Wage Gap in Mount Olive?
Income or Wage Gap in Mount Olive is 19.5%.
Women in Mount Olive earn 80.5 cents for every dollar earned by a man.
What is Inequality or Gini Index in Mount Olive?
Inequality or Gini Index in Mount Olive is 0.50.
What is the Total Population of Mount Olive?
Total Population of Mount Olive is 4,286.
What is the Total Male Population of Mount Olive?
Total Male Population of Mount Olive is 2,332.
What is the Total Female Population of Mount Olive?
Total Female Population of Mount Olive is 1,954.
What is the Ratio of Males per 100 Females in Mount Olive?
There are 119.34 Males per 100 Females in Mount Olive.
What is the Ratio of Females per 100 Males in Mount Olive?
There are 83.79 Females per 100 Males in Mount Olive.
What is the Median Population Age in Mount Olive?
Median Population Age in Mount Olive is 41.9 Years.
What is the Average Family Size in Mount Olive
Average Family Size in Mount Olive is 2.9 People.
What is the Average Household Size in Mount Olive
Average Household Size in Mount Olive is 2.2 People.
How Large is the Labor Force in Mount Olive?
There are 2,134 People in the Labor Forcein in Mount Olive.
What is the Percentage of People in the Labor Force in Mount Olive?
56.5% of People are in the Labor Force in Mount Olive.
What is the Unemployment Rate in Mount Olive?
Unemployment Rate in Mount Olive is 7.1%.