Woodland, NC Map & Demographics
Woodland Map
Woodland Overview
$24,178
PER CAPITA INCOME
$57,857
AVG FAMILY INCOME
$40,489
AVG HOUSEHOLD INCOME
$19,007
FAMILY INCOME DEFICIT
0.53
INEQUALITY / GINI INDEX
630
TOTAL POPULATION
338
MALE POPULATION
292
FEMALE POPULATION
115.75
MALES / 100 FEMALES
86.39
FEMALES / 100 MALES
51.8
MEDIAN AGE
3.1
AVG FAMILY SIZE
2.4
AVG HOUSEHOLD SIZE
162
LABOR FORCE [ PEOPLE ]
32.0%
PERCENT IN LABOR FORCE
3.7%
UNEMPLOYMENT RATE
Woodland Zip Codes
Woodland Area Codes
Income in Woodland
Income Overview in Woodland
Per Capita Income in Woodland is $24,178, while median incomes of families and households are $57,857 and $40,489 respectively.
| Characteristic | Number | Measure |
| Per Capita Income | 630 | $24,178 |
| Median Family Income | 162 | $57,857 |
| Mean Family Income | 162 | $75,067 |
| Median Household Income | 265 | $40,489 |
| Mean Household Income | 265 | $57,119 |
| Income Deficit | 162 | $19,007 |
| Wage / Income Gap (%) | 630 | 0.00% |
| Wage / Income Gap ($) | 630 | 100.00¢ per $1 |
| Gini / Inequality Index | 630 | 0.53 |
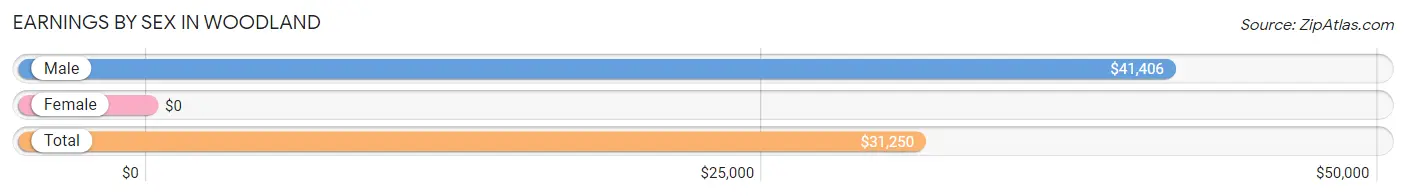
Earnings by Sex in Woodland
| Sex | Number | Average Earnings |
| Male | 96 (53.6%) | $41,406 |
| Female | 83 (46.4%) | $0 |
| Total | 179 (100.0%) | $31,250 |
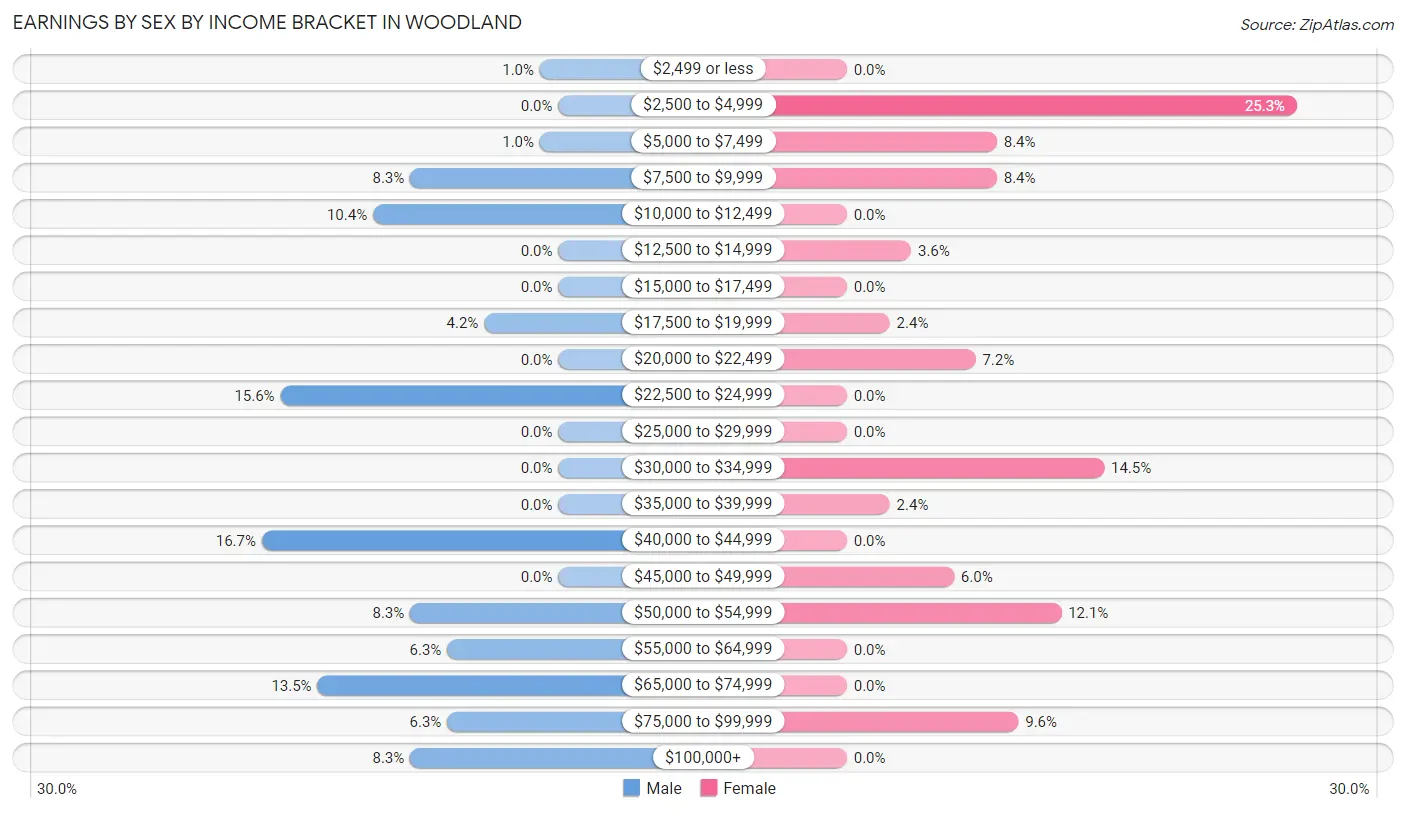
Earnings by Sex by Income Bracket in Woodland
The most common earnings brackets in Woodland are $40,000 to $44,999 for men (16 | 16.7%) and $2,500 to $4,999 for women (21 | 25.3%).
| Income | Male | Female |
| $2,499 or less | 1 (1.0%) | 0 (0.0%) |
| $2,500 to $4,999 | 0 (0.0%) | 21 (25.3%) |
| $5,000 to $7,499 | 1 (1.0%) | 7 (8.4%) |
| $7,500 to $9,999 | 8 (8.3%) | 7 (8.4%) |
| $10,000 to $12,499 | 10 (10.4%) | 0 (0.0%) |
| $12,500 to $14,999 | 0 (0.0%) | 3 (3.6%) |
| $15,000 to $17,499 | 0 (0.0%) | 0 (0.0%) |
| $17,500 to $19,999 | 4 (4.2%) | 2 (2.4%) |
| $20,000 to $22,499 | 0 (0.0%) | 6 (7.2%) |
| $22,500 to $24,999 | 15 (15.6%) | 0 (0.0%) |
| $25,000 to $29,999 | 0 (0.0%) | 0 (0.0%) |
| $30,000 to $34,999 | 0 (0.0%) | 12 (14.5%) |
| $35,000 to $39,999 | 0 (0.0%) | 2 (2.4%) |
| $40,000 to $44,999 | 16 (16.7%) | 0 (0.0%) |
| $45,000 to $49,999 | 0 (0.0%) | 5 (6.0%) |
| $50,000 to $54,999 | 8 (8.3%) | 10 (12.0%) |
| $55,000 to $64,999 | 6 (6.2%) | 0 (0.0%) |
| $65,000 to $74,999 | 13 (13.5%) | 0 (0.0%) |
| $75,000 to $99,999 | 6 (6.2%) | 8 (9.6%) |
| $100,000+ | 8 (8.3%) | 0 (0.0%) |
| Total | 96 (100.0%) | 83 (100.0%) |
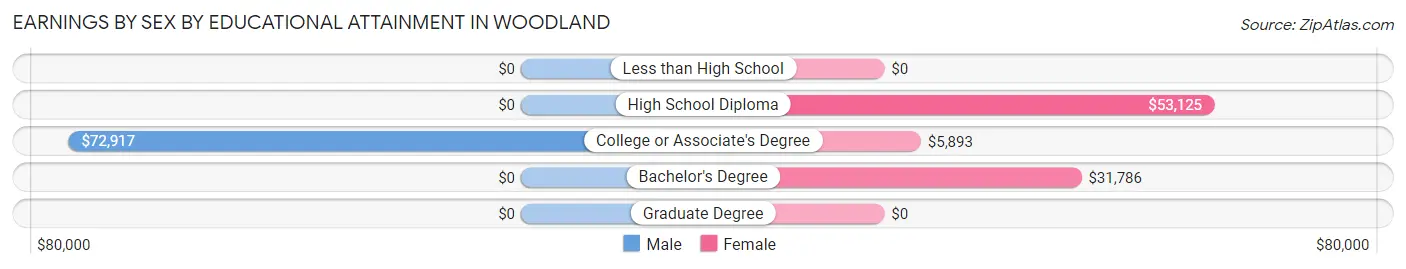
Earnings by Sex by Educational Attainment in Woodland
| Educational Attainment | Male Income | Female Income |
| Less than High School | - | - |
| High School Diploma | - | - |
| College or Associate's Degree | $72,917 | $5,893 |
| Bachelor's Degree | - | - |
| Graduate Degree | - | - |
| Total | $41,406 | $0 |
Family Income in Woodland
Family Income Brackets in Woodland
According to the Woodland family income data, there are 38 families falling into the $50,000 to $74,999 income range, which is the most common income bracket and makes up 23.5% of all families. Conversely, the $35,000 to $49,999 income bracket is the least frequent group with only 2 families (1.2%) belonging to this category.
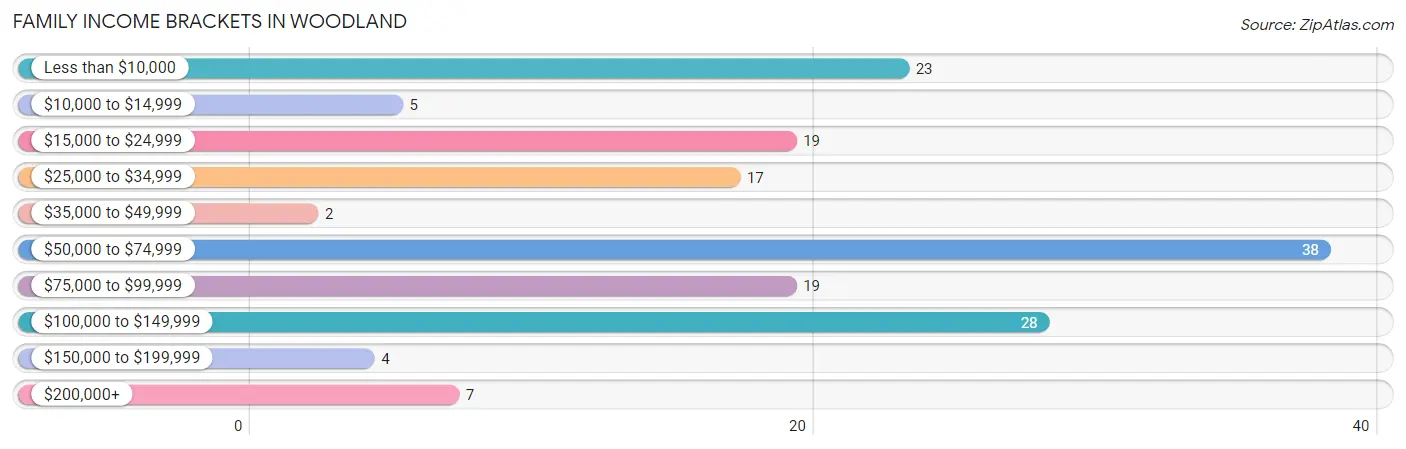
| Income Bracket | # Families | % Families |
| Less than $10,000 | 23 | 14.2% |
| $10,000 to $14,999 | 5 | 3.1% |
| $15,000 to $24,999 | 19 | 11.7% |
| $25,000 to $34,999 | 17 | 10.5% |
| $35,000 to $49,999 | 2 | 1.2% |
| $50,000 to $74,999 | 38 | 23.5% |
| $75,000 to $99,999 | 19 | 11.7% |
| $100,000 to $149,999 | 28 | 17.3% |
| $150,000 to $199,999 | 4 | 2.5% |
| $200,000+ | 7 | 4.3% |
Family Income by Famaliy Size in Woodland
2-person families (106 | 65.4%) account for the highest median family income in Woodland with $78,750 per family, while 2-person families (106 | 65.4%) have the highest median income of $39,375 per family member.
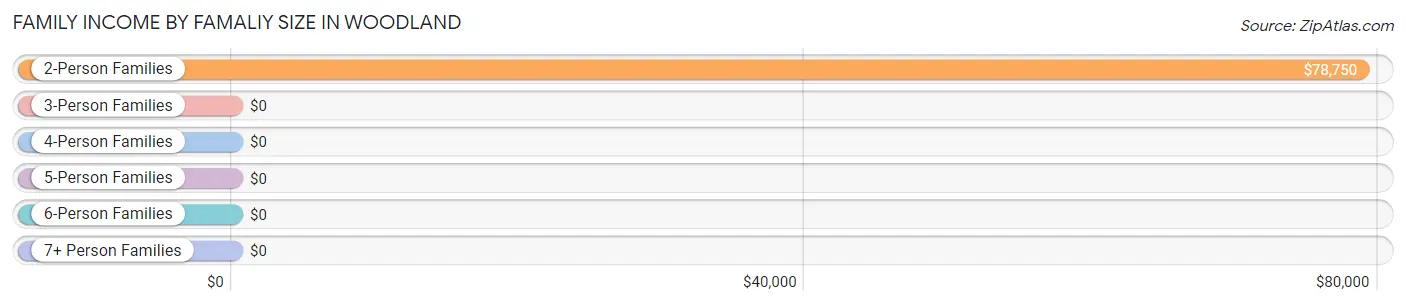
| Income Bracket | # Families | Median Income |
| 2-Person Families | 106 (65.4%) | $78,750 |
| 3-Person Families | 39 (24.1%) | $0 |
| 4-Person Families | 0 (0.0%) | $0 |
| 5-Person Families | 7 (4.3%) | $0 |
| 6-Person Families | 0 (0.0%) | $0 |
| 7+ Person Families | 10 (6.2%) | $0 |
| Total | 162 (100.0%) | $57,857 |
Family Income by Number of Earners in Woodland
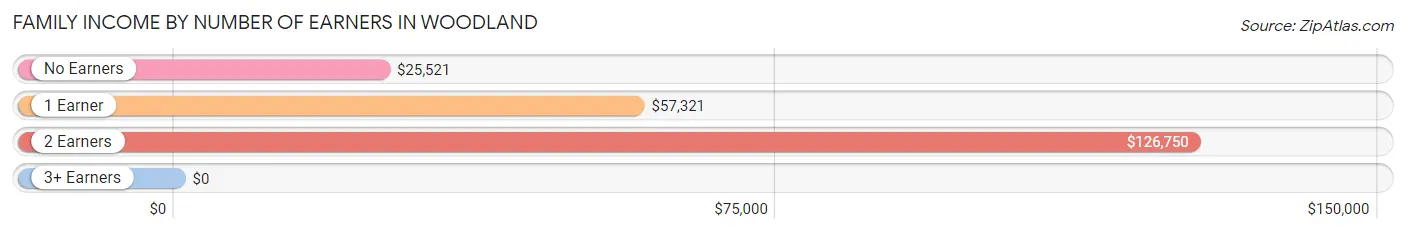
| Number of Earners | # Families | Median Income |
| No Earners | 51 (31.5%) | $25,521 |
| 1 Earner | 79 (48.8%) | $57,321 |
| 2 Earners | 32 (19.8%) | $126,750 |
| 3+ Earners | 0 (0.0%) | $0 |
| Total | 162 (100.0%) | $57,857 |
Household Income in Woodland
Household Income Brackets in Woodland
With 52 households falling in the category, the $50,000 to $74,999 income range is the most frequent in Woodland, accounting for 19.6% of all households. In contrast, only 4 households (1.5%) fall into the $150,000 to $199,999 income bracket, making it the least populous group.
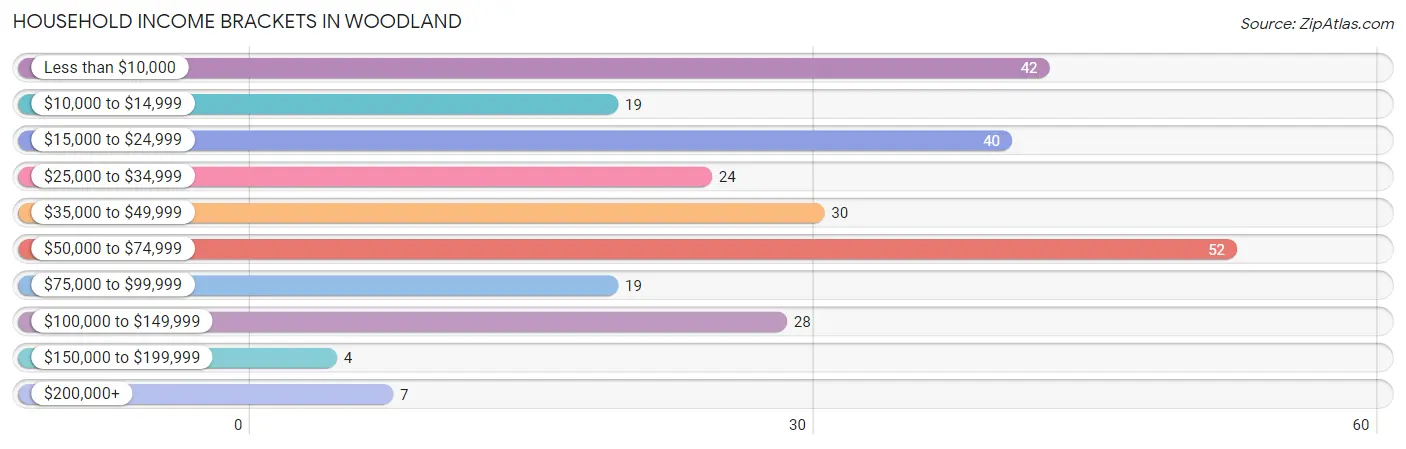
| Income Bracket | # Households | % Households |
| Less than $10,000 | 42 | 15.8% |
| $10,000 to $14,999 | 19 | 7.2% |
| $15,000 to $24,999 | 40 | 15.1% |
| $25,000 to $34,999 | 24 | 9.1% |
| $35,000 to $49,999 | 30 | 11.3% |
| $50,000 to $74,999 | 52 | 19.6% |
| $75,000 to $99,999 | 19 | 7.2% |
| $100,000 to $149,999 | 28 | 10.6% |
| $150,000 to $199,999 | 4 | 1.5% |
| $200,000+ | 7 | 2.6% |
Household Income by Householder Age in Woodland
The median household income in Woodland is $40,489, with the highest median household income of $35,625 found in the 65+ years age bracket for the primary householder. A total of 137 households (51.7%) fall into this category.
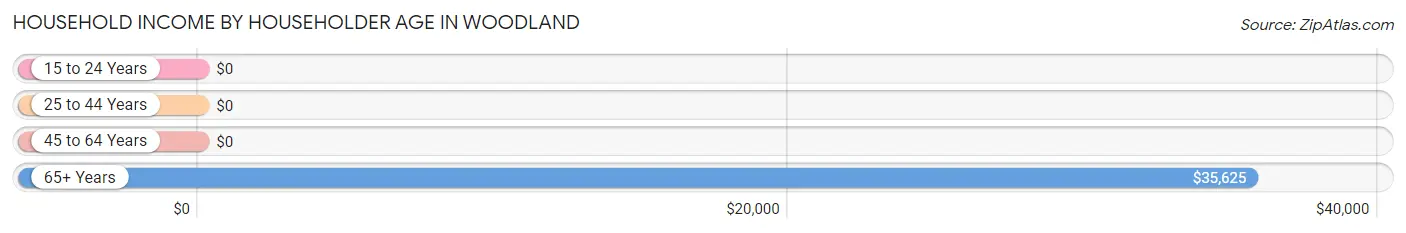
| Income Bracket | # Households | Median Income |
| 15 to 24 Years | 0 (0.0%) | $0 |
| 25 to 44 Years | 56 (21.1%) | $0 |
| 45 to 64 Years | 72 (27.2%) | $0 |
| 65+ Years | 137 (51.7%) | $35,625 |
| Total | 265 (100.0%) | $40,489 |
Poverty in Woodland
Income Below Poverty by Sex and Age in Woodland
With 19.3% poverty level for males and 32.3% for females among the residents of Woodland, 5 year old males and under 5 year old females are the most vulnerable to poverty, with 2 males (100.0%) and 6 females (100.0%) in their respective age groups living below the poverty level.
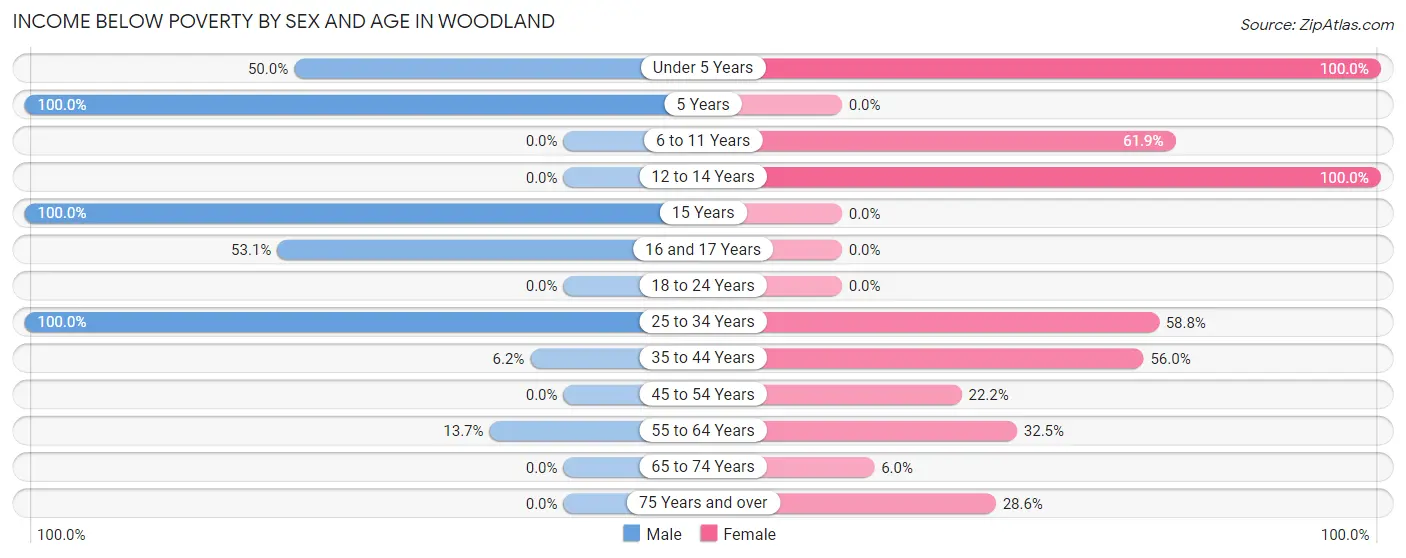
| Age Bracket | Male | Female |
| Under 5 Years | 11 (50.0%) | 6 (100.0%) |
| 5 Years | 2 (100.0%) | 0 (0.0%) |
| 6 to 11 Years | 0 (0.0%) | 13 (61.9%) |
| 12 to 14 Years | 0 (0.0%) | 15 (100.0%) |
| 15 Years | 21 (100.0%) | 0 (0.0%) |
| 16 and 17 Years | 17 (53.1%) | 0 (0.0%) |
| 18 to 24 Years | 0 (0.0%) | 0 (0.0%) |
| 25 to 34 Years | 3 (100.0%) | 10 (58.8%) |
| 35 to 44 Years | 4 (6.1%) | 14 (56.0%) |
| 45 to 54 Years | 0 (0.0%) | 8 (22.2%) |
| 55 to 64 Years | 7 (13.7%) | 13 (32.5%) |
| 65 to 74 Years | 0 (0.0%) | 5 (6.0%) |
| 75 Years and over | 0 (0.0%) | 10 (28.6%) |
| Total | 65 (19.3%) | 94 (32.3%) |
Income Above Poverty by Sex and Age in Woodland
According to the poverty statistics in Woodland, males aged 6 to 11 years and females aged 15 years are the age groups that are most secure financially, with 100.0% of males and 100.0% of females in these age groups living above the poverty line.
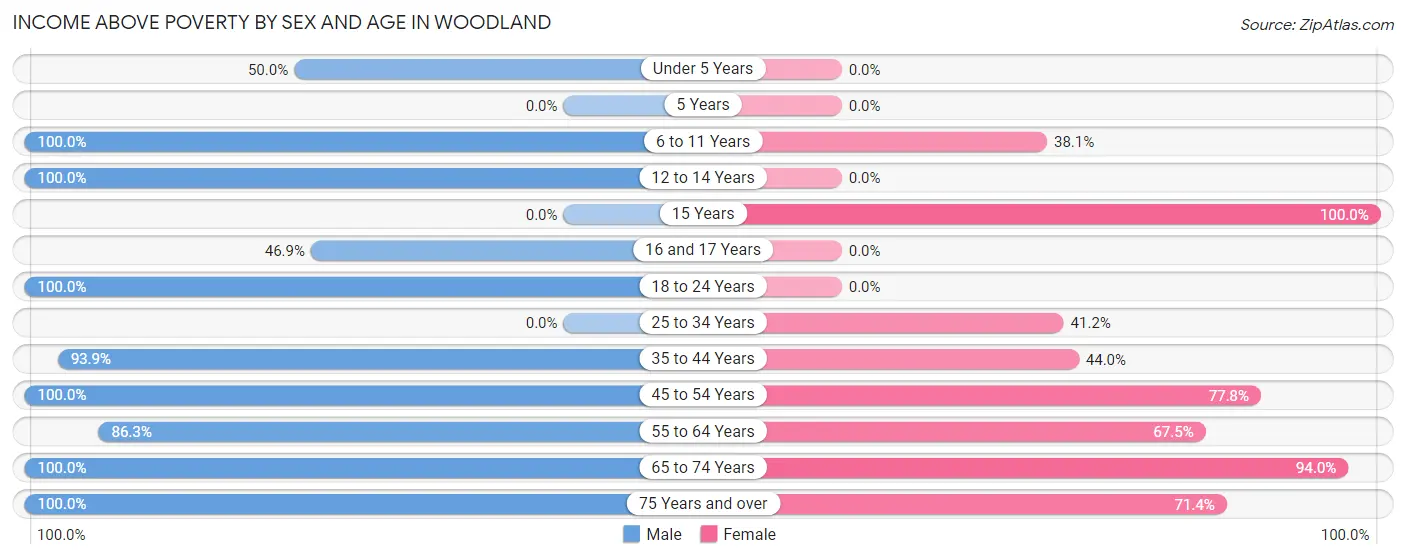
| Age Bracket | Male | Female |
| Under 5 Years | 11 (50.0%) | 0 (0.0%) |
| 5 Years | 0 (0.0%) | 0 (0.0%) |
| 6 to 11 Years | 4 (100.0%) | 8 (38.1%) |
| 12 to 14 Years | 17 (100.0%) | 0 (0.0%) |
| 15 Years | 0 (0.0%) | 13 (100.0%) |
| 16 and 17 Years | 15 (46.9%) | 0 (0.0%) |
| 18 to 24 Years | 12 (100.0%) | 0 (0.0%) |
| 25 to 34 Years | 0 (0.0%) | 7 (41.2%) |
| 35 to 44 Years | 61 (93.9%) | 11 (44.0%) |
| 45 to 54 Years | 25 (100.0%) | 28 (77.8%) |
| 55 to 64 Years | 44 (86.3%) | 27 (67.5%) |
| 65 to 74 Years | 68 (100.0%) | 78 (94.0%) |
| 75 Years and over | 15 (100.0%) | 25 (71.4%) |
| Total | 272 (80.7%) | 197 (67.7%) |
Income Below Poverty Among Married-Couple Families in Woodland
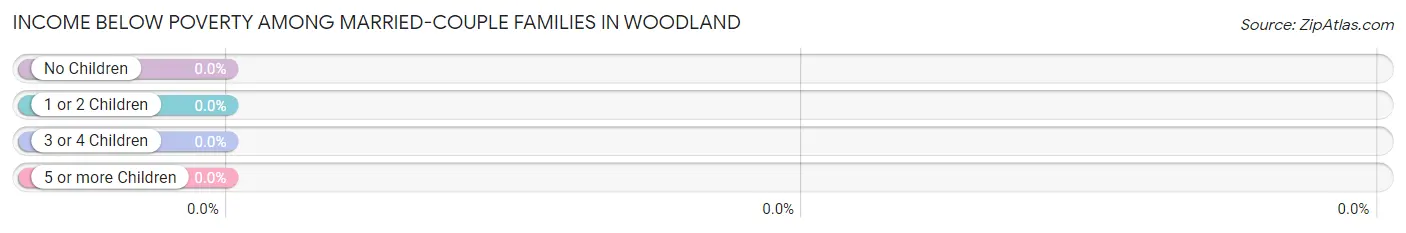
| Children | Above Poverty | Below Poverty |
| No Children | 91 (100.0%) | 0 (0.0%) |
| 1 or 2 Children | 0 (0.0%) | 0 (0.0%) |
| 3 or 4 Children | 0 (0.0%) | 0 (0.0%) |
| 5 or more Children | 10 (100.0%) | 0 (0.0%) |
| Total | 101 (100.0%) | 0 (0.0%) |
Income Below Poverty Among Single-Parent Households in Woodland
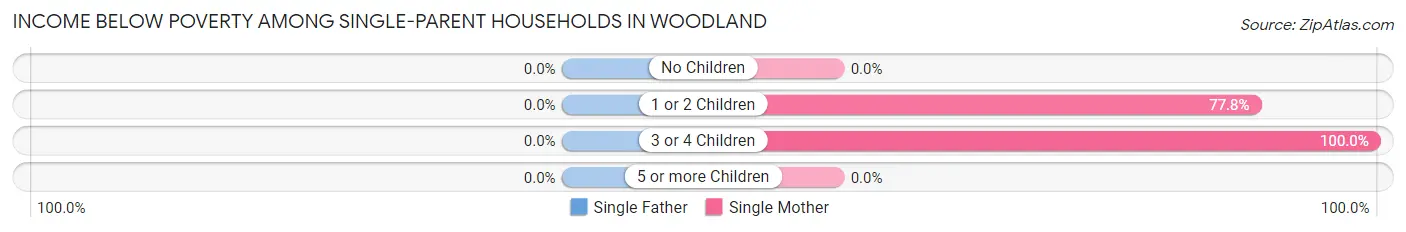
| Children | Single Father | Single Mother |
| No Children | 0 (0.0%) | 0 (0.0%) |
| 1 or 2 Children | 0 (0.0%) | 21 (77.8%) |
| 3 or 4 Children | 0 (0.0%) | 7 (100.0%) |
| 5 or more Children | 0 (0.0%) | 0 (0.0%) |
| Total | 0 (0.0%) | 28 (56.0%) |
Income Below Poverty Among Married-Couple vs Single-Parent Households in Woodland
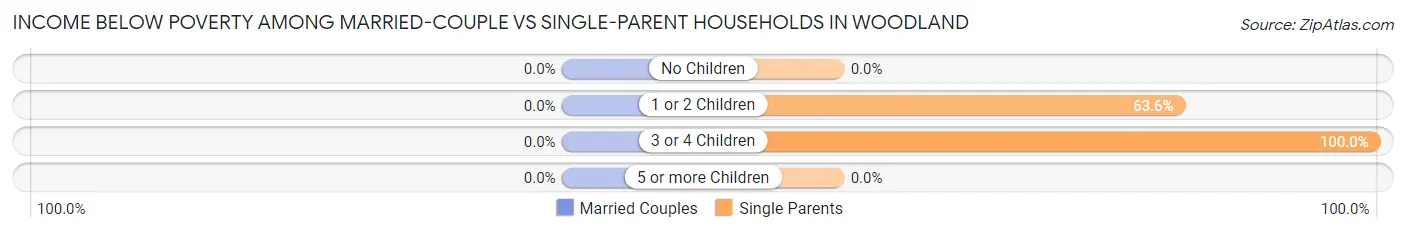
| Children | Married-Couple Families | Single-Parent Households |
| No Children | 0 (0.0%) | 0 (0.0%) |
| 1 or 2 Children | 0 (0.0%) | 21 (63.6%) |
| 3 or 4 Children | 0 (0.0%) | 7 (100.0%) |
| 5 or more Children | 0 (0.0%) | 0 (0.0%) |
| Total | 0 (0.0%) | 28 (45.9%) |
Race in Woodland
The most populous races in Woodland are White / Caucasian (292 | 46.4%), Black / African American (290 | 46.0%), and Hispanic or Latino (27 | 4.3%).
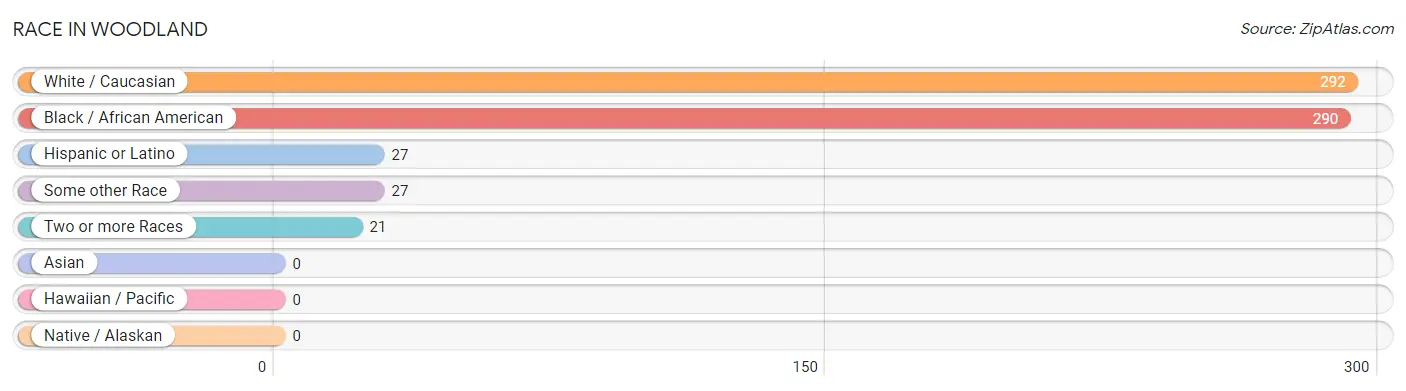
| Race | # Population | % Population |
| Asian | 0 | 0.0% |
| Black / African American | 290 | 46.0% |
| Hawaiian / Pacific | 0 | 0.0% |
| Hispanic or Latino | 27 | 4.3% |
| Native / Alaskan | 0 | 0.0% |
| White / Caucasian | 292 | 46.4% |
| Two or more Races | 21 | 3.3% |
| Some other Race | 27 | 4.3% |
| Total | 630 | 100.0% |
Ancestry in Woodland
The most populous ancestries reported in Woodland are American (128 | 20.3%), Arab (49 | 7.8%), English (39 | 6.2%), European (24 | 3.8%), and African (8 | 1.3%), together accounting for 39.4% of all Woodland residents.
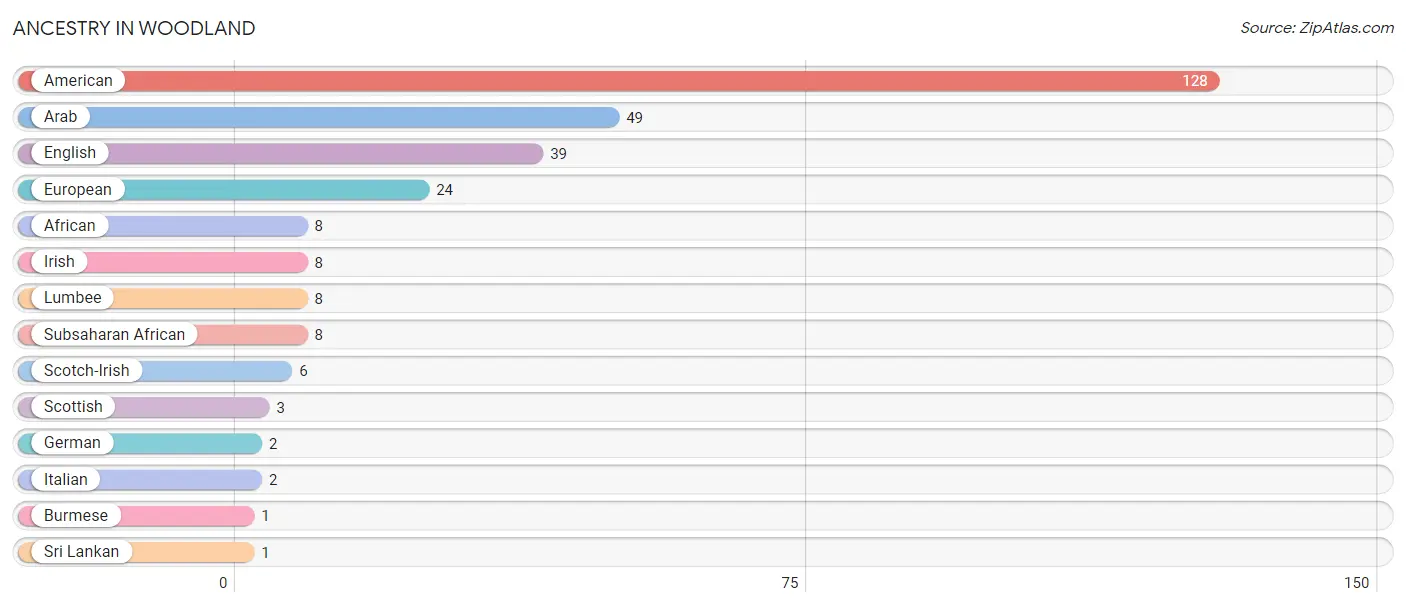
| Ancestry | # Population | % Population |
| African | 8 | 1.3% |
| American | 128 | 20.3% |
| Arab | 49 | 7.8% |
| Burmese | 1 | 0.2% |
| English | 39 | 6.2% |
| European | 24 | 3.8% |
| German | 2 | 0.3% |
| Irish | 8 | 1.3% |
| Italian | 2 | 0.3% |
| Lumbee | 8 | 1.3% |
| Scotch-Irish | 6 | 0.9% |
| Scottish | 3 | 0.5% |
| Sri Lankan | 1 | 0.2% |
| Subsaharan African | 8 | 1.3% | View All 14 Rows |
Immigrants in Woodland
The most numerous immigrant groups reported in Woodland came from Asia (77 | 12.2%), Western Asia (77 | 12.2%), Yemen (77 | 12.2%), Central America (15 | 2.4%), and Latin America (15 | 2.4%), together accounting for 41.4% of all Woodland residents.
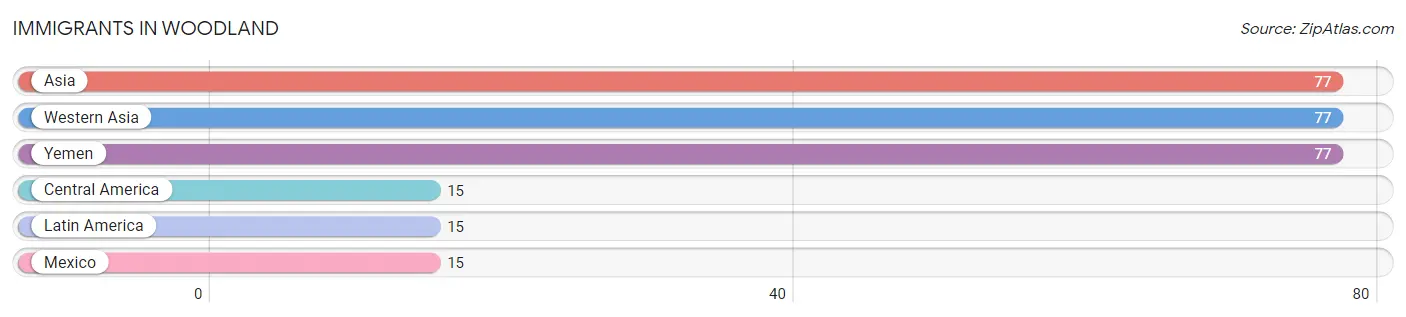
| Immigration Origin | # Population | % Population |
| Asia | 77 | 12.2% |
| Central America | 15 | 2.4% |
| Latin America | 15 | 2.4% |
| Mexico | 15 | 2.4% |
| Western Asia | 77 | 12.2% |
| Yemen | 77 | 12.2% | View All 6 Rows |
Sex and Age in Woodland
Sex and Age in Woodland
The most populous age groups in Woodland are 15 to 19 Years (65 | 19.2%) for men and 70 to 74 Years (60 | 20.5%) for women.
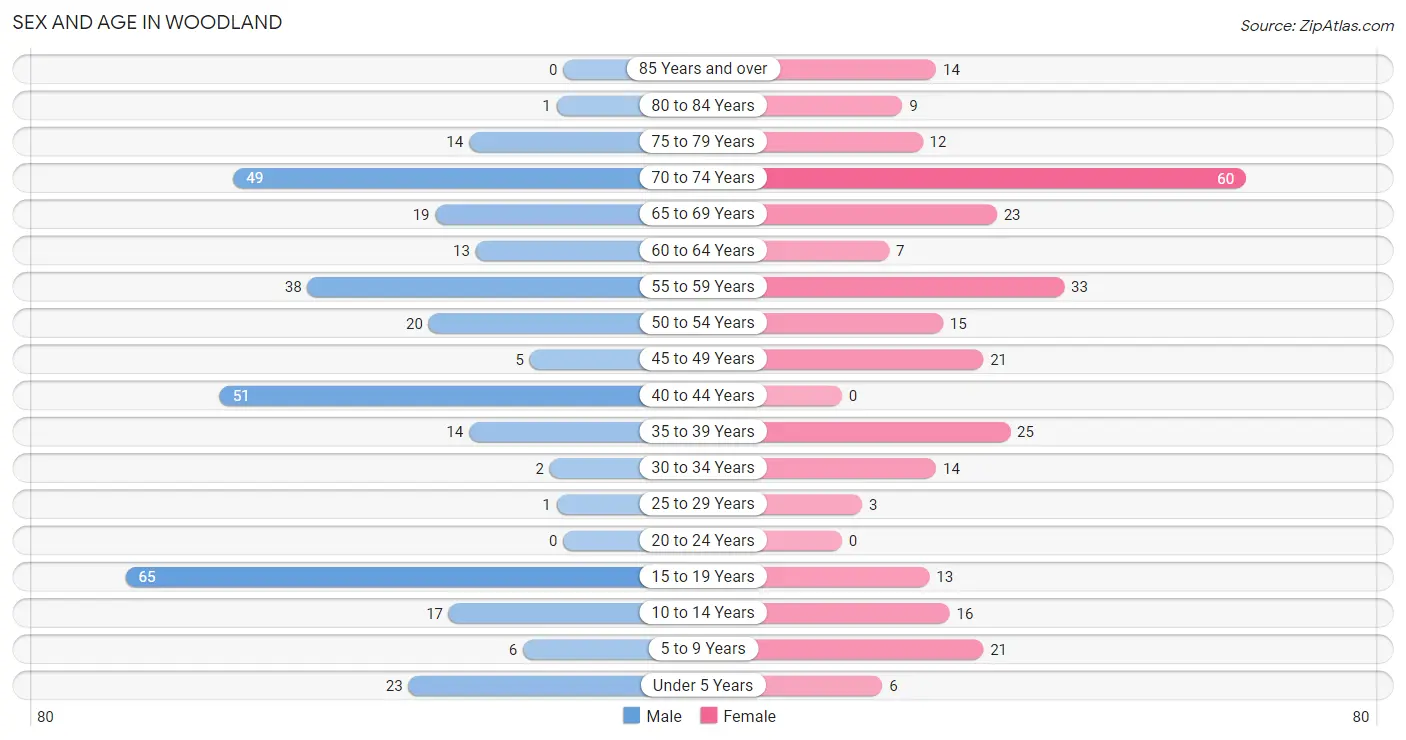
| Age Bracket | Male | Female |
| Under 5 Years | 23 (6.8%) | 6 (2.1%) |
| 5 to 9 Years | 6 (1.8%) | 21 (7.2%) |
| 10 to 14 Years | 17 (5.0%) | 16 (5.5%) |
| 15 to 19 Years | 65 (19.2%) | 13 (4.4%) |
| 20 to 24 Years | 0 (0.0%) | 0 (0.0%) |
| 25 to 29 Years | 1 (0.3%) | 3 (1.0%) |
| 30 to 34 Years | 2 (0.6%) | 14 (4.8%) |
| 35 to 39 Years | 14 (4.1%) | 25 (8.6%) |
| 40 to 44 Years | 51 (15.1%) | 0 (0.0%) |
| 45 to 49 Years | 5 (1.5%) | 21 (7.2%) |
| 50 to 54 Years | 20 (5.9%) | 15 (5.1%) |
| 55 to 59 Years | 38 (11.2%) | 33 (11.3%) |
| 60 to 64 Years | 13 (3.8%) | 7 (2.4%) |
| 65 to 69 Years | 19 (5.6%) | 23 (7.9%) |
| 70 to 74 Years | 49 (14.5%) | 60 (20.5%) |
| 75 to 79 Years | 14 (4.1%) | 12 (4.1%) |
| 80 to 84 Years | 1 (0.3%) | 9 (3.1%) |
| 85 Years and over | 0 (0.0%) | 14 (4.8%) |
| Total | 338 (100.0%) | 292 (100.0%) |
Families and Households in Woodland
Median Family Size in Woodland
The median family size in Woodland is 3.14 persons per family, with single female/mother families (50 | 30.9%) accounting for the largest median family size of 3.34 persons per family. On the other hand, single male/father families (11 | 6.8%) represent the smallest median family size with 2.27 persons per family.
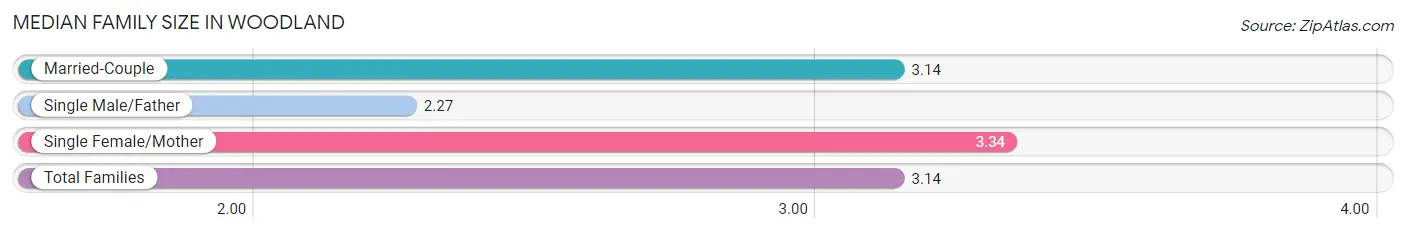
| Family Type | # Families | Family Size |
| Married-Couple | 101 (62.4%) | 3.14 |
| Single Male/Father | 11 (6.8%) | 2.27 |
| Single Female/Mother | 50 (30.9%) | 3.34 |
| Total Families | 162 (100.0%) | 3.14 |
Median Household Size in Woodland
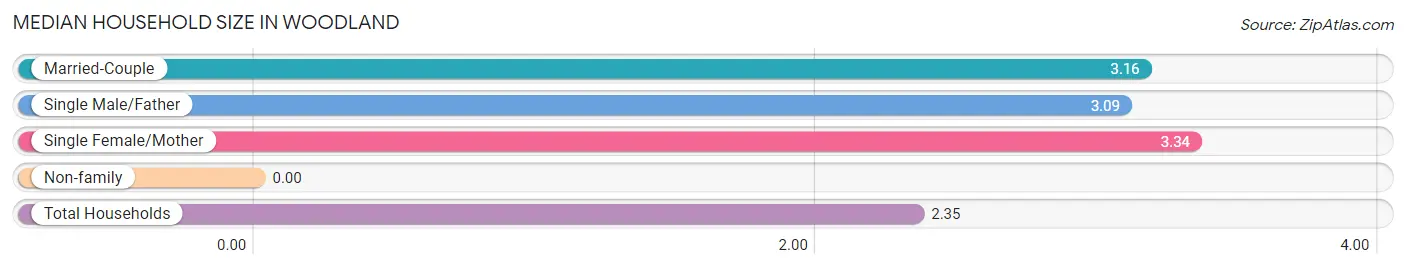
| Household Type | # Households | Household Size |
| Married-Couple | 101 (38.1%) | 3.16 |
| Single Male/Father | 11 (4.2%) | 3.09 |
| Single Female/Mother | 50 (18.9%) | 3.34 |
| Non-family | 103 (38.9%) | - |
| Total Households | 265 (100.0%) | 2.35 |
Household Size by Marriage Status in Woodland
Out of a total of 265 households in Woodland, 162 (61.1%) are family households, while 103 (38.9%) are nonfamily households. The most numerous type of family households are 2-person households, comprising 94, and the most common type of nonfamily households are 1-person households, comprising 103.
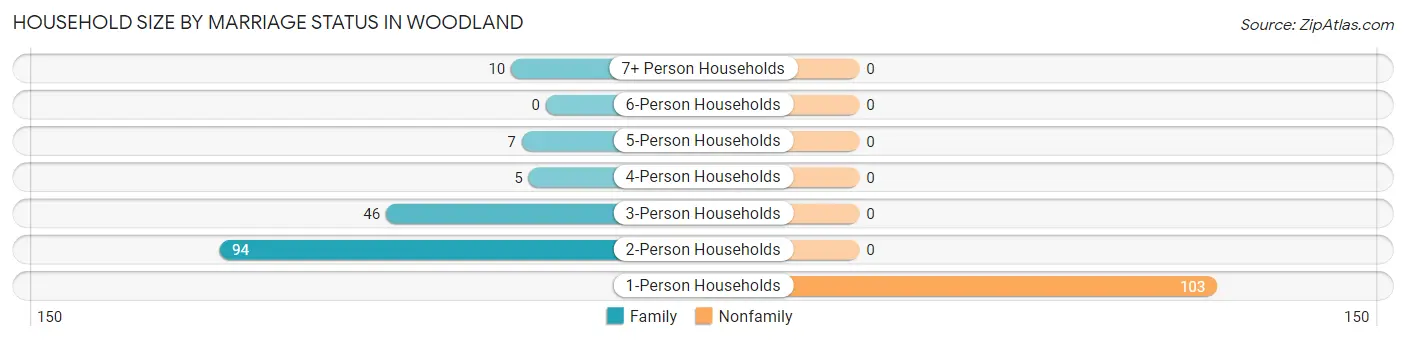
| Household Size | Family Households | Nonfamily Households |
| 1-Person Households | - | 103 (38.9%) |
| 2-Person Households | 94 (35.5%) | 0 (0.0%) |
| 3-Person Households | 46 (17.4%) | 0 (0.0%) |
| 4-Person Households | 5 (1.9%) | 0 (0.0%) |
| 5-Person Households | 7 (2.6%) | 0 (0.0%) |
| 6-Person Households | 0 (0.0%) | 0 (0.0%) |
| 7+ Person Households | 10 (3.8%) | 0 (0.0%) |
| Total | 162 (61.1%) | 103 (38.9%) |
Female Fertility in Woodland
Fertility by Age in Woodland
Average fertility rate in Woodland is 92.0 births per 1,000 women. Women in the age bracket of 20 to 34 years have the highest fertility rate with 412.0 births per 1,000 women. Women in the age bracket of 20 to 34 years acount for 100.0% of all women with births.
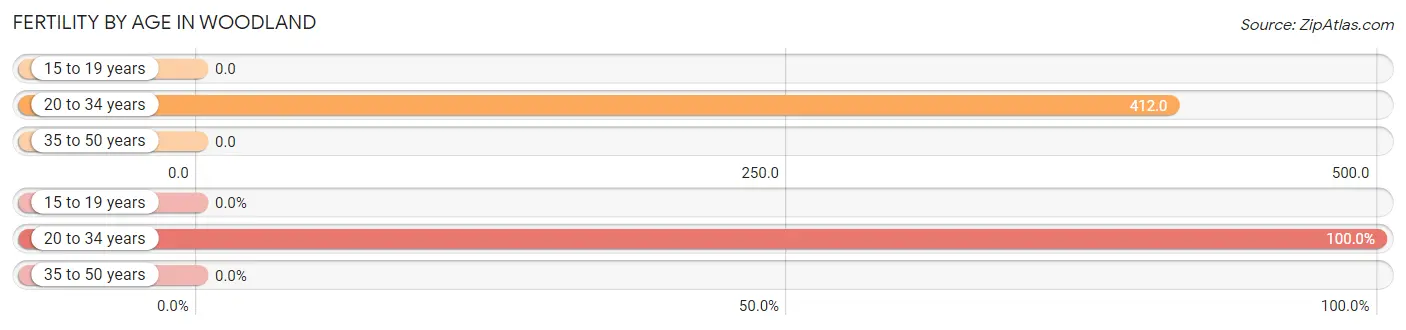
| Age Bracket | Women with Births | Births / 1,000 Women |
| 15 to 19 years | 0 (0.0%) | 0.0 |
| 20 to 34 years | 7 (100.0%) | 412.0 |
| 35 to 50 years | 0 (0.0%) | 0.0 |
| Total | 7 (100.0%) | 92.0 |
Fertility by Age by Marriage Status in Woodland
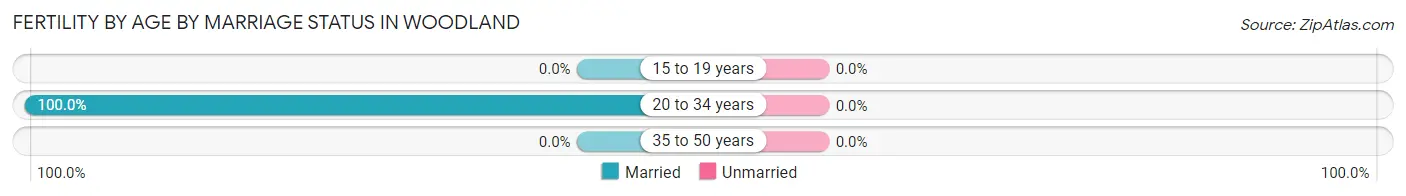
| Age Bracket | Married | Unmarried |
| 15 to 19 years | 0 (0.0%) | 0 (0.0%) |
| 20 to 34 years | 7 (100.0%) | 0 (0.0%) |
| 35 to 50 years | 0 (0.0%) | 0 (0.0%) |
| Total | 7 (100.0%) | 0 (0.0%) |
Fertility by Education in Woodland
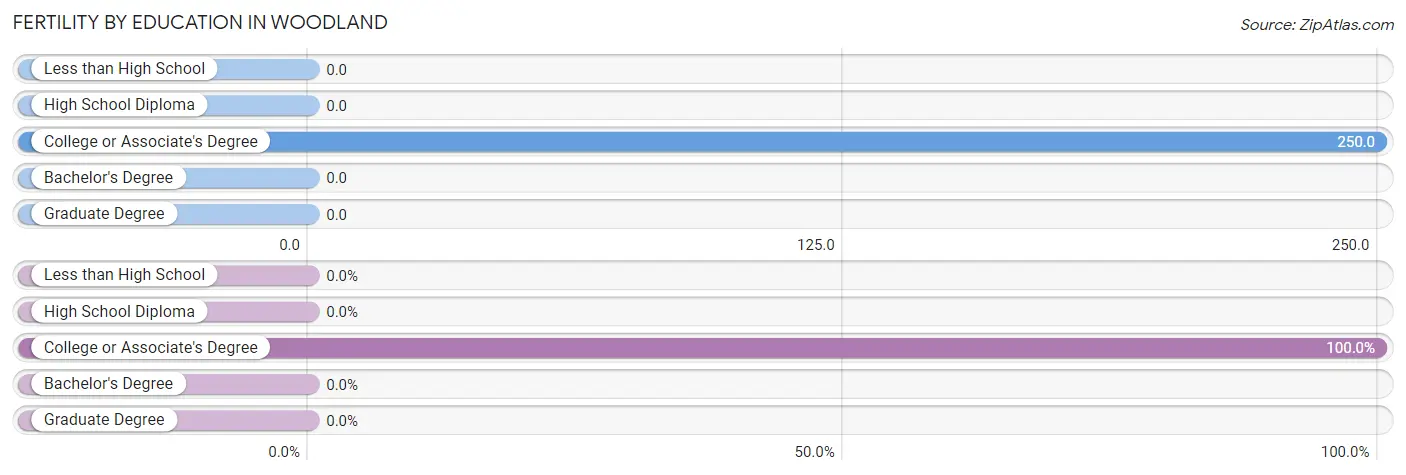
| Educational Attainment | Women with Births | Births / 1,000 Women |
| Less than High School | 0 (0.0%) | 0.0 |
| High School Diploma | 0 (0.0%) | 0.0 |
| College or Associate's Degree | 7 (100.0%) | 250.0 |
| Bachelor's Degree | 0 (0.0%) | 0.0 |
| Graduate Degree | 0 (0.0%) | 0.0 |
| Total | 7 (100.0%) | 92.0 |
Fertility by Education by Marriage Status in Woodland
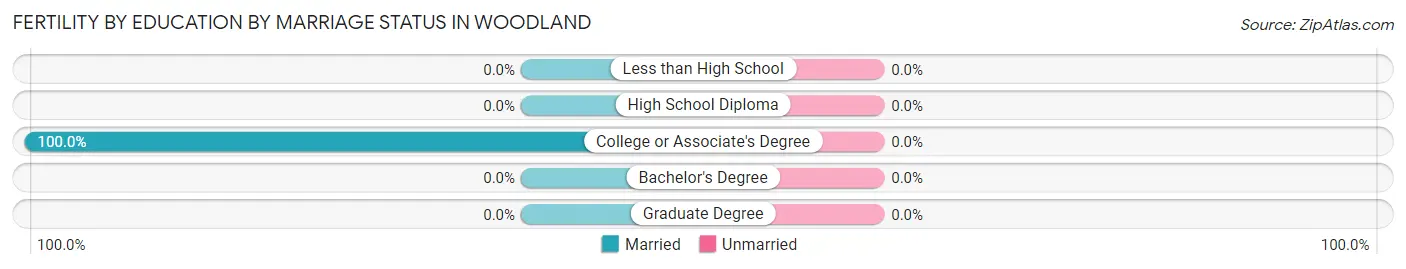
| Educational Attainment | Married | Unmarried |
| Less than High School | 0 (0.0%) | 0 (0.0%) |
| High School Diploma | 0 (0.0%) | 0 (0.0%) |
| College or Associate's Degree | 7 (100.0%) | 0 (0.0%) |
| Bachelor's Degree | 0 (0.0%) | 0 (0.0%) |
| Graduate Degree | 0 (0.0%) | 0 (0.0%) |
| Total | 7 (100.0%) | 0 (0.0%) |
Employment Characteristics in Woodland
Employment by Class of Employer in Woodland
Among the 153 employed individuals in Woodland, private company employees (122 | 79.7%), local government employees (22 | 14.4%), and not-for-profit organizations (4 | 2.6%) make up the most common classes of employment.
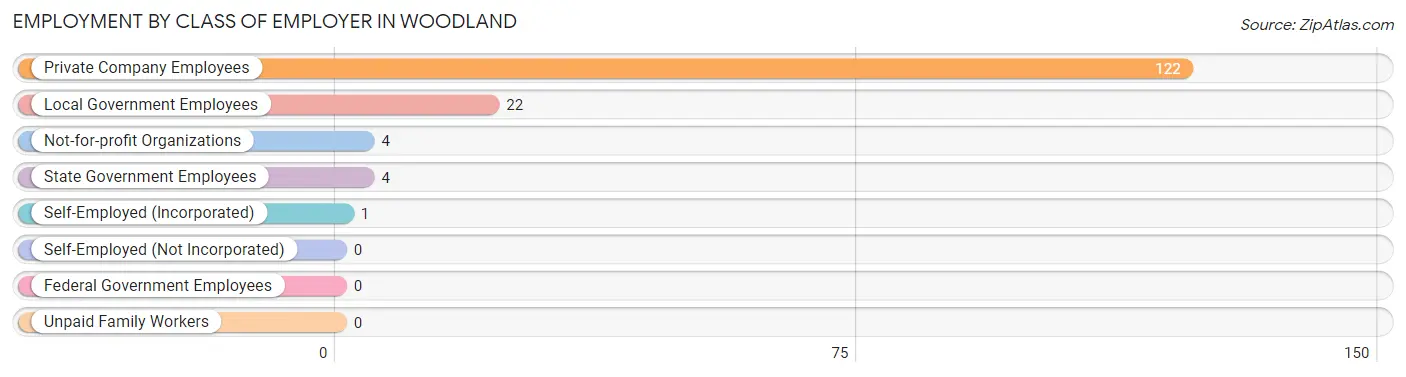
| Employer Class | # Employees | % Employees |
| Private Company Employees | 122 | 79.7% |
| Self-Employed (Incorporated) | 1 | 0.6% |
| Self-Employed (Not Incorporated) | 0 | 0.0% |
| Not-for-profit Organizations | 4 | 2.6% |
| Local Government Employees | 22 | 14.4% |
| State Government Employees | 4 | 2.6% |
| Federal Government Employees | 0 | 0.0% |
| Unpaid Family Workers | 0 | 0.0% |
| Total | 153 | 100.0% |
Employment Status by Age in Woodland
According to the labor force statistics for Woodland, out of the total population over 16 years of age (507), 32.0% or 162 individuals are in the labor force, with 3.7% or 6 of them unemployed. The age group with the highest labor force participation rate is 30 to 34 years, with 87.5% or 14 individuals in the labor force. Within the labor force, the 45 to 54 years age range has the highest percentage of unemployed individuals, with 13.0% or 6 of them being unemployed.
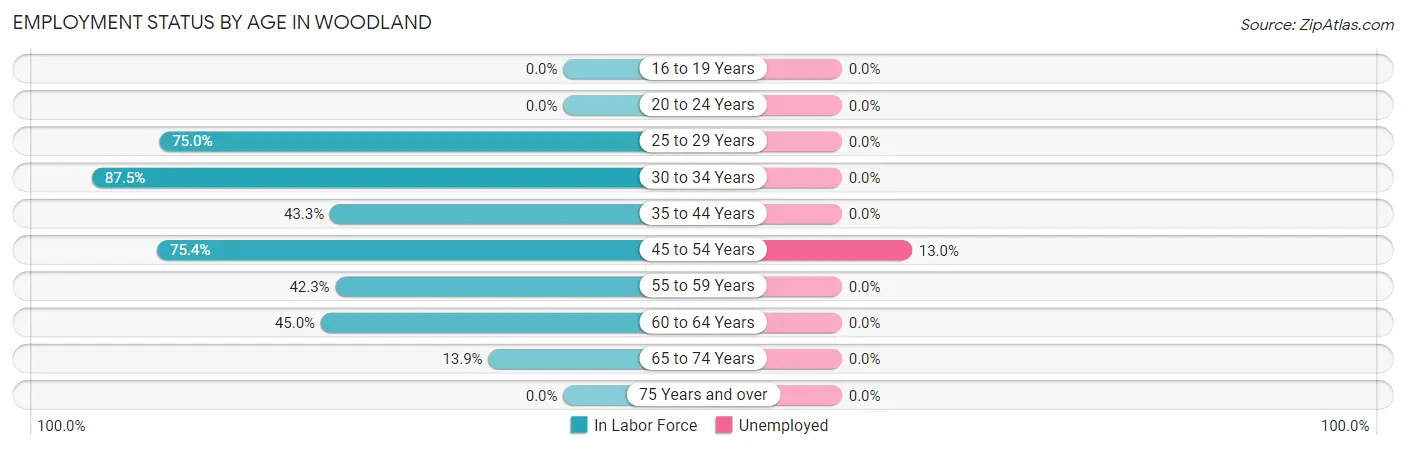
| Age Bracket | In Labor Force | Unemployed |
| 16 to 19 Years | 0 (0.0%) | 0 (0.0%) |
| 20 to 24 Years | 0 (0.0%) | 0 (0.0%) |
| 25 to 29 Years | 3 (75.0%) | 0 (0.0%) |
| 30 to 34 Years | 14 (87.5%) | 0 (0.0%) |
| 35 to 44 Years | 39 (43.3%) | 0 (0.0%) |
| 45 to 54 Years | 46 (75.4%) | 6 (13.0%) |
| 55 to 59 Years | 30 (42.3%) | 0 (0.0%) |
| 60 to 64 Years | 9 (45.0%) | 0 (0.0%) |
| 65 to 74 Years | 21 (13.9%) | 0 (0.0%) |
| 75 Years and over | 0 (0.0%) | 0 (0.0%) |
| Total | 162 (32.0%) | 6 (3.7%) |
Employment Status by Educational Attainment in Woodland
According to labor force statistics for Woodland, 53.8% of individuals (141) out of the total population between 25 and 64 years of age (262) are in the labor force, with 4.3% or 6 of them being unemployed. The group with the highest labor force participation rate are those with the educational attainment of bachelor's degree or higher, with 78.4% or 40 individuals in the labor force. Within the labor force, individuals with college / associate degree education have the highest percentage of unemployment, with 12.5% or 6 of them being unemployed.
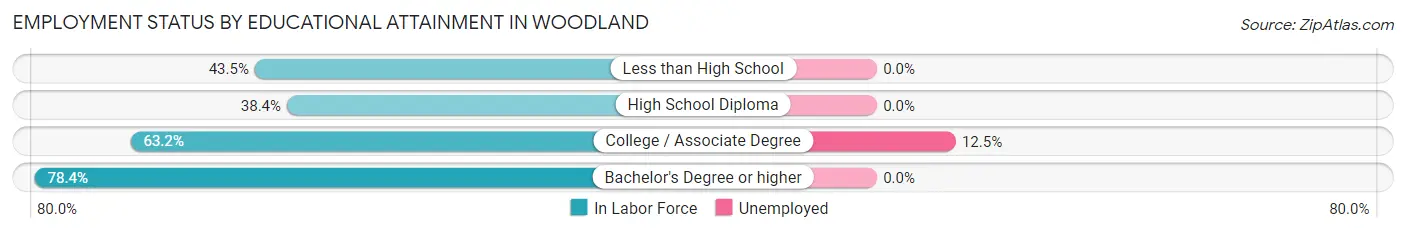
| Educational Attainment | In Labor Force | Unemployed |
| Less than High School | 10 (43.5%) | 0 (0.0%) |
| High School Diploma | 43 (38.4%) | 0 (0.0%) |
| College / Associate Degree | 48 (63.2%) | 10 (12.5%) |
| Bachelor's Degree or higher | 40 (78.4%) | 0 (0.0%) |
| Total | 141 (53.8%) | 11 (4.3%) |
Employment Occupations by Sex in Woodland
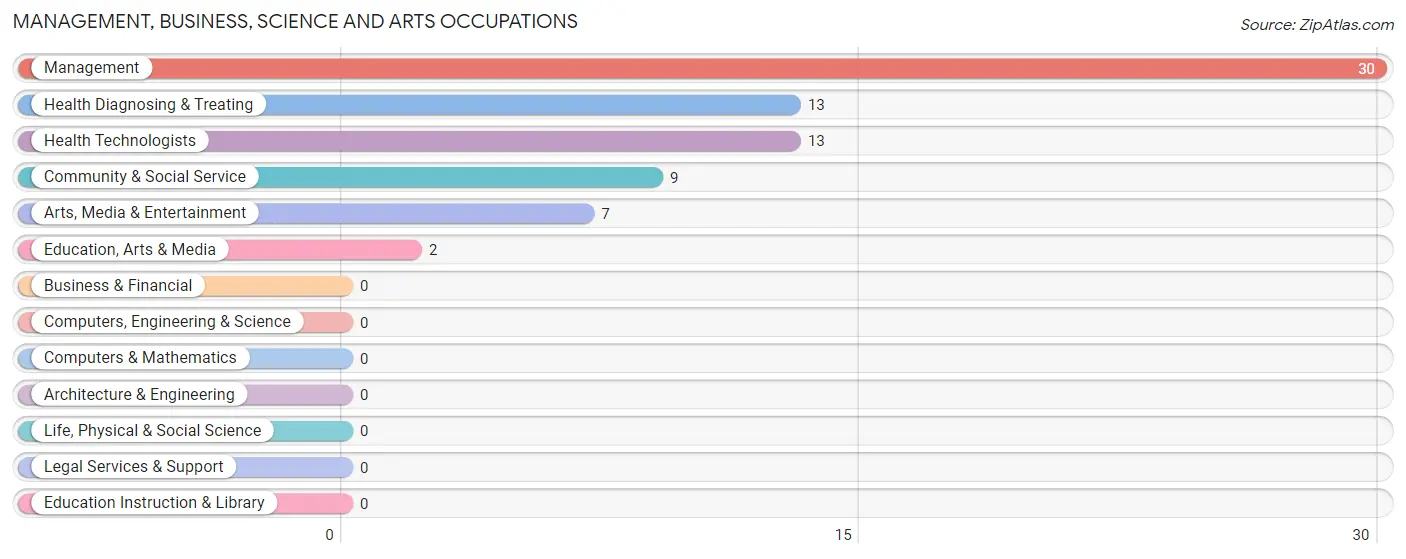
Management, Business, Science and Arts Occupations
The most common Management, Business, Science and Arts occupations in Woodland are Management (30 | 19.2%), Health Diagnosing & Treating (13 | 8.3%), Health Technologists (13 | 8.3%), Community & Social Service (9 | 5.8%), and Arts, Media & Entertainment (7 | 4.5%).
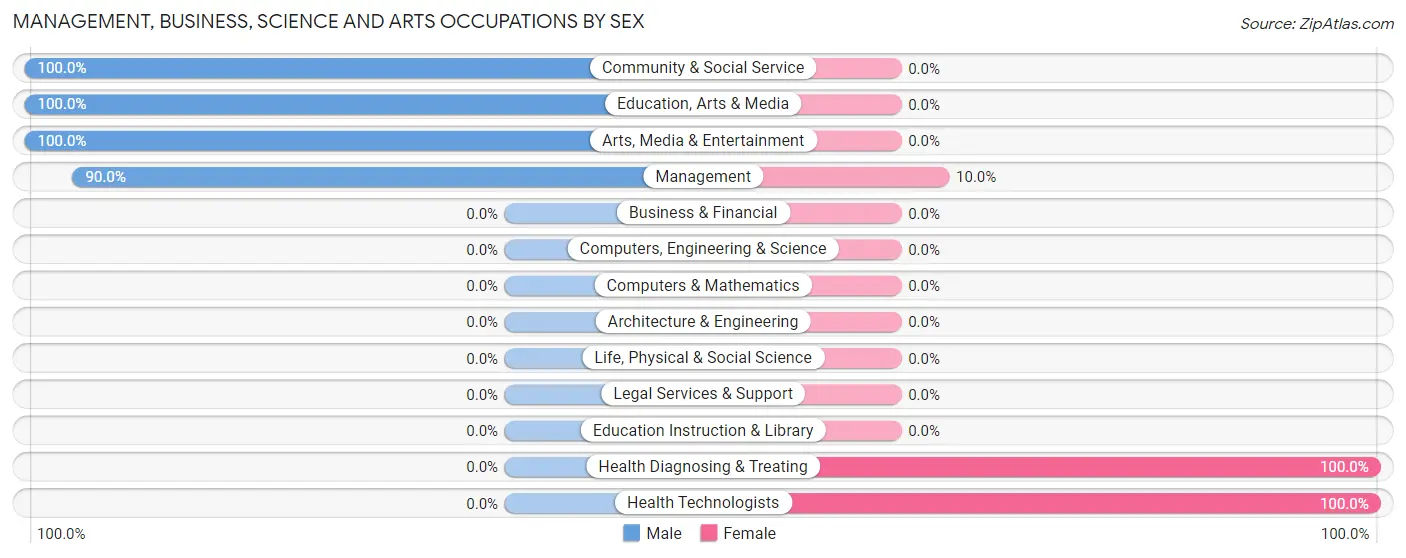
Management, Business, Science and Arts Occupations by Sex
Within the Management, Business, Science and Arts occupations in Woodland, the most male-oriented occupations are Community & Social Service (100.0%), Education, Arts & Media (100.0%), and Arts, Media & Entertainment (100.0%), while the most female-oriented occupations are Health Diagnosing & Treating (100.0%), Health Technologists (100.0%), and Management (10.0%).
| Occupation | Male | Female |
| Management | 27 (90.0%) | 3 (10.0%) |
| Business & Financial | 0 (0.0%) | 0 (0.0%) |
| Computers, Engineering & Science | 0 (0.0%) | 0 (0.0%) |
| Computers & Mathematics | 0 (0.0%) | 0 (0.0%) |
| Architecture & Engineering | 0 (0.0%) | 0 (0.0%) |
| Life, Physical & Social Science | 0 (0.0%) | 0 (0.0%) |
| Community & Social Service | 9 (100.0%) | 0 (0.0%) |
| Education, Arts & Media | 2 (100.0%) | 0 (0.0%) |
| Legal Services & Support | 0 (0.0%) | 0 (0.0%) |
| Education Instruction & Library | 0 (0.0%) | 0 (0.0%) |
| Arts, Media & Entertainment | 7 (100.0%) | 0 (0.0%) |
| Health Diagnosing & Treating | 0 (0.0%) | 13 (100.0%) |
| Health Technologists | 0 (0.0%) | 13 (100.0%) |
| Total (Category) | 36 (69.2%) | 16 (30.8%) |
| Total (Overall) | 86 (55.1%) | 70 (44.9%) |
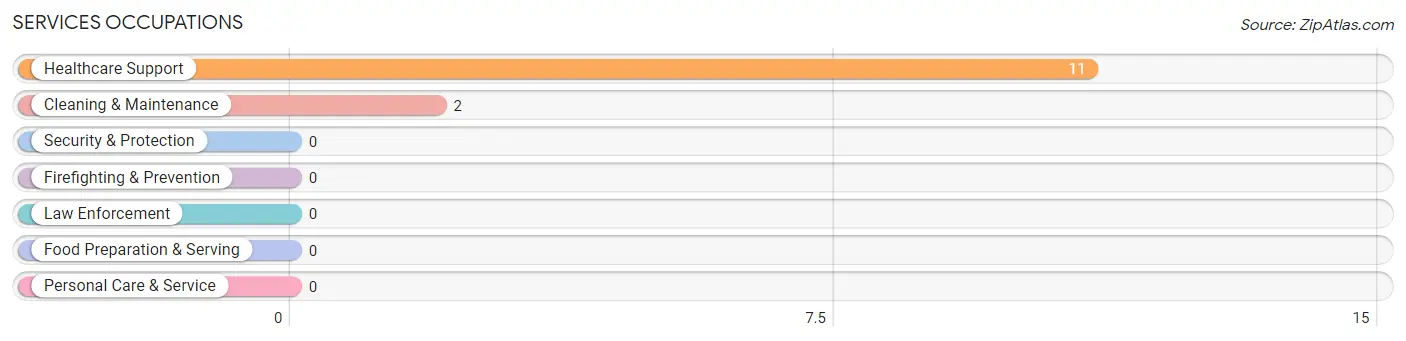
Services Occupations
The most common Services occupations in Woodland are Healthcare Support (11 | 7.0%), and Cleaning & Maintenance (2 | 1.3%).
Services Occupations by Sex
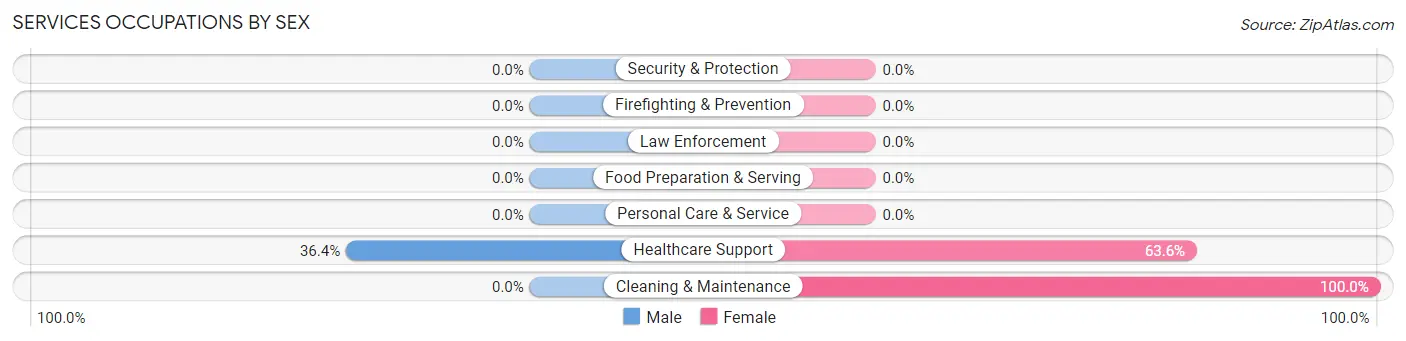
| Occupation | Male | Female |
| Healthcare Support | 4 (36.4%) | 7 (63.6%) |
| Security & Protection | 0 (0.0%) | 0 (0.0%) |
| Firefighting & Prevention | 0 (0.0%) | 0 (0.0%) |
| Law Enforcement | 0 (0.0%) | 0 (0.0%) |
| Food Preparation & Serving | 0 (0.0%) | 0 (0.0%) |
| Cleaning & Maintenance | 0 (0.0%) | 2 (100.0%) |
| Personal Care & Service | 0 (0.0%) | 0 (0.0%) |
| Total (Category) | 4 (30.8%) | 9 (69.2%) |
| Total (Overall) | 86 (55.1%) | 70 (44.9%) |
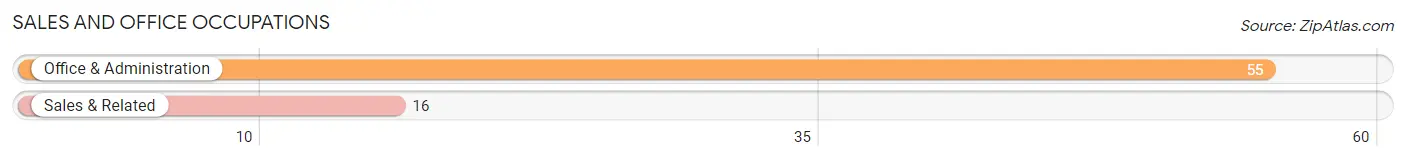
Sales and Office Occupations
The most common Sales and Office occupations in Woodland are Office & Administration (55 | 35.3%), and Sales & Related (16 | 10.3%).
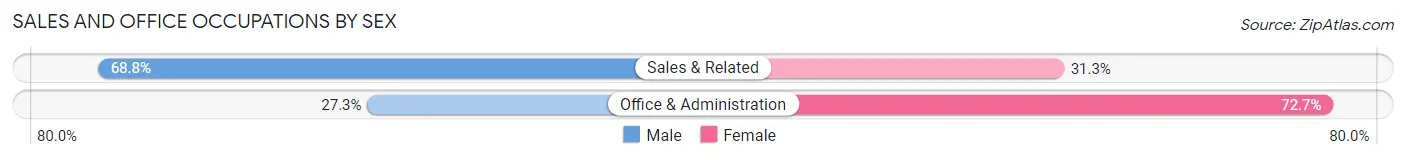
Sales and Office Occupations by Sex
| Occupation | Male | Female |
| Sales & Related | 11 (68.8%) | 5 (31.2%) |
| Office & Administration | 15 (27.3%) | 40 (72.7%) |
| Total (Category) | 26 (36.6%) | 45 (63.4%) |
| Total (Overall) | 86 (55.1%) | 70 (44.9%) |
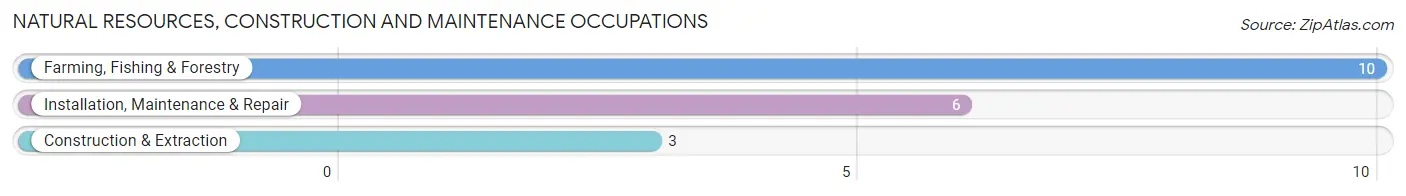
Natural Resources, Construction and Maintenance Occupations
The most common Natural Resources, Construction and Maintenance occupations in Woodland are Farming, Fishing & Forestry (10 | 6.4%), Installation, Maintenance & Repair (6 | 3.8%), and Construction & Extraction (3 | 1.9%).
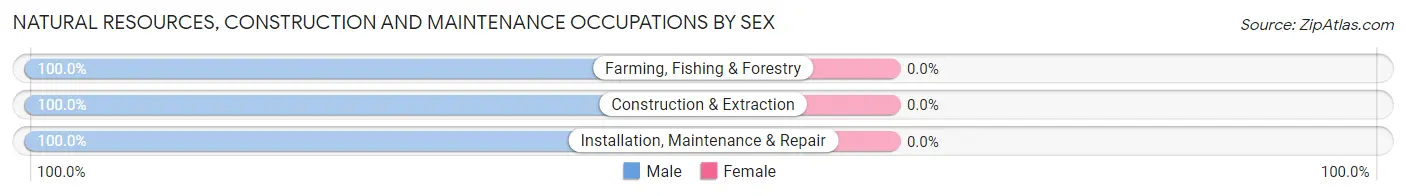
Natural Resources, Construction and Maintenance Occupations by Sex
| Occupation | Male | Female |
| Farming, Fishing & Forestry | 10 (100.0%) | 0 (0.0%) |
| Construction & Extraction | 3 (100.0%) | 0 (0.0%) |
| Installation, Maintenance & Repair | 6 (100.0%) | 0 (0.0%) |
| Total (Category) | 19 (100.0%) | 0 (0.0%) |
| Total (Overall) | 86 (55.1%) | 70 (44.9%) |
Production, Transportation and Moving Occupations
The most common Production, Transportation and Moving occupations in Woodland are , and Material Moving (1 | 0.6%).
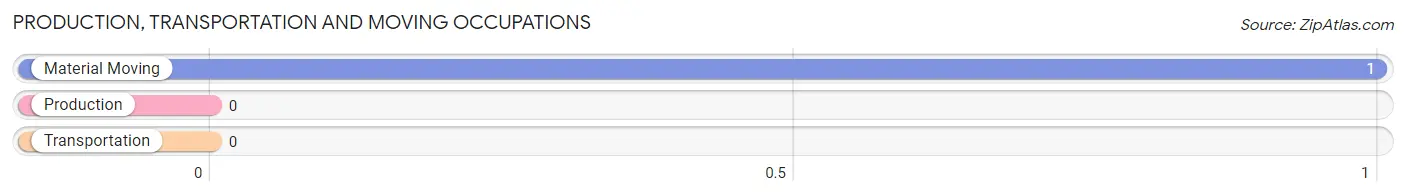
Production, Transportation and Moving Occupations by Sex
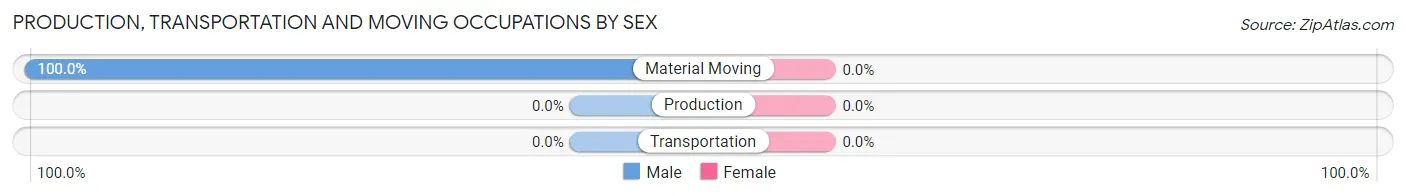
| Occupation | Male | Female |
| Production | 0 (0.0%) | 0 (0.0%) |
| Transportation | 0 (0.0%) | 0 (0.0%) |
| Material Moving | 1 (100.0%) | 0 (0.0%) |
| Total (Category) | 1 (100.0%) | 0 (0.0%) |
| Total (Overall) | 86 (55.1%) | 70 (44.9%) |
Employment Industries by Sex in Woodland
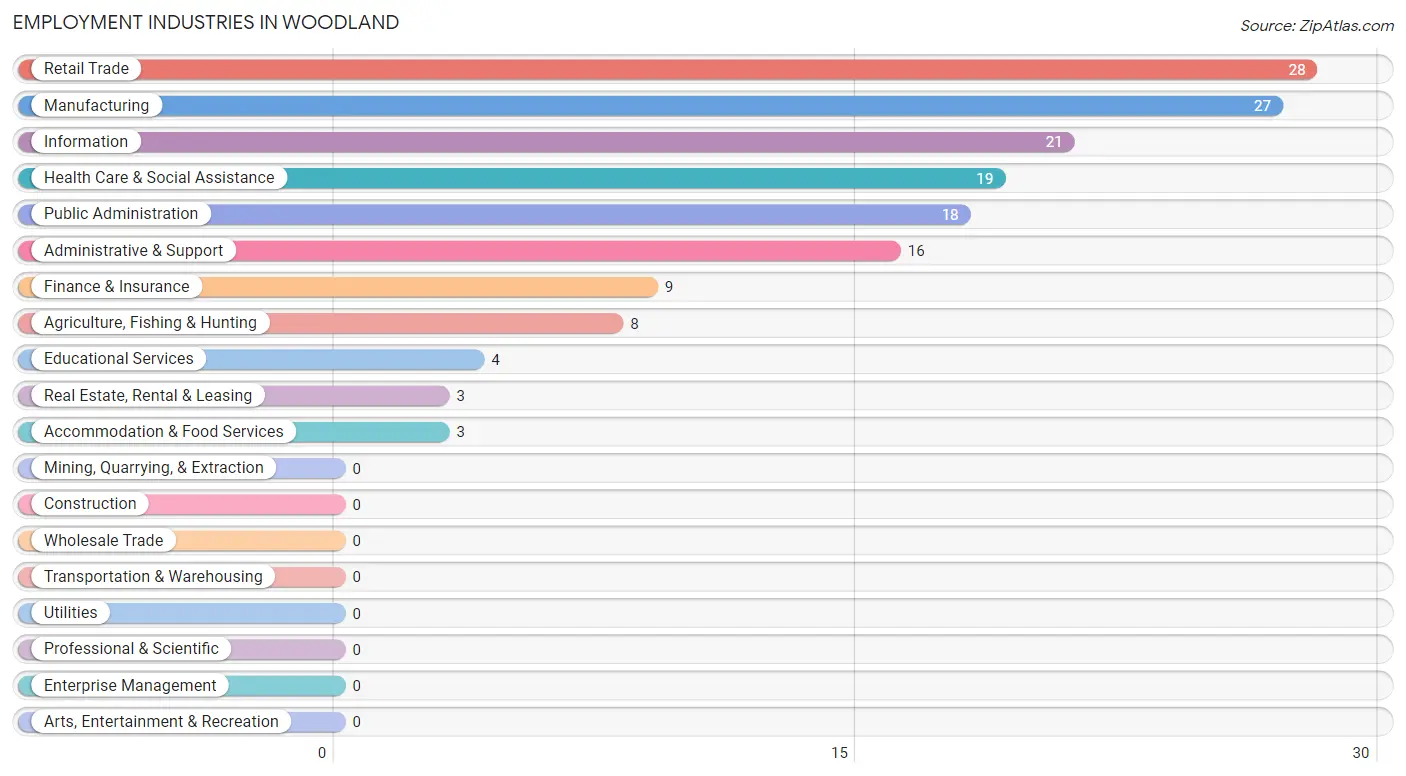
Employment Industries in Woodland
The major employment industries in Woodland include Retail Trade (28 | 17.9%), Manufacturing (27 | 17.3%), Information (21 | 13.5%), Health Care & Social Assistance (19 | 12.2%), and Public Administration (18 | 11.5%).
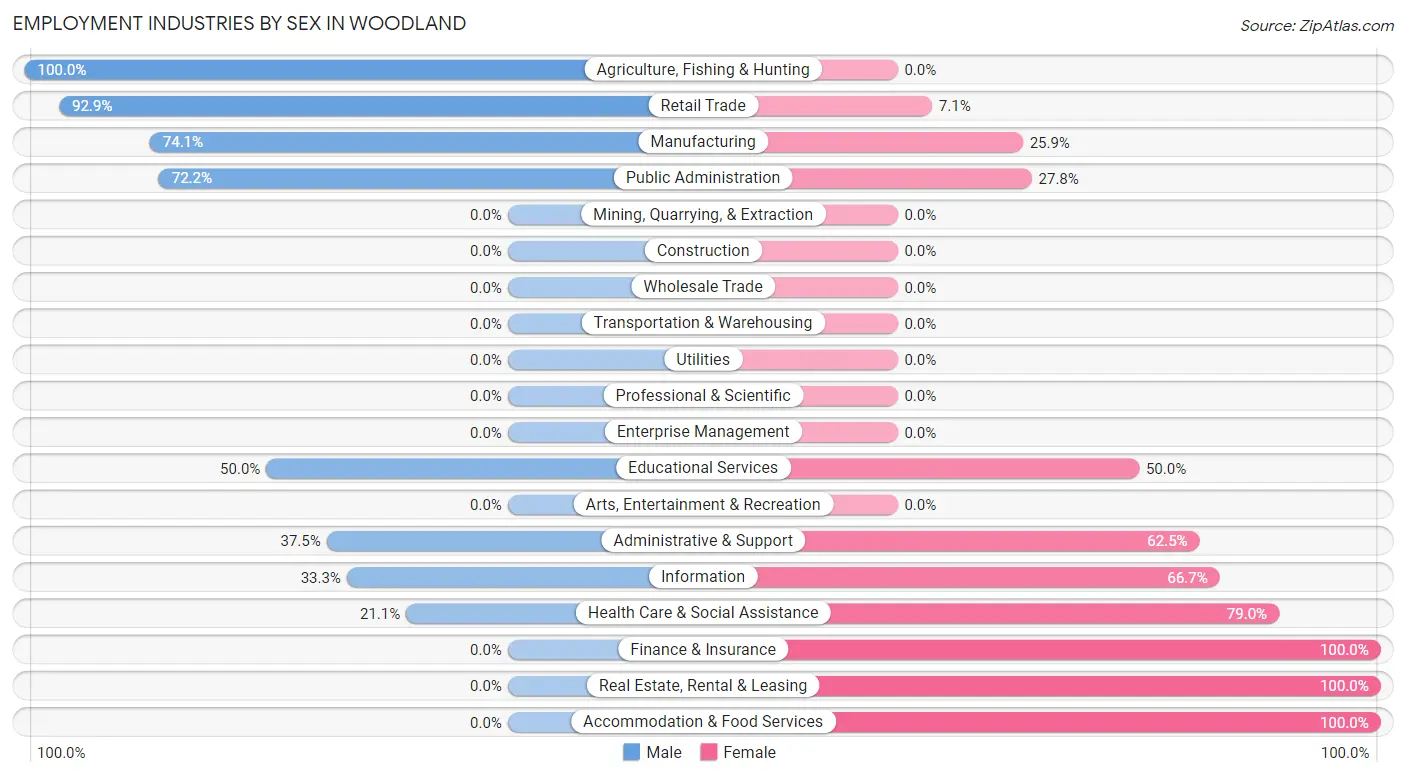
Employment Industries by Sex in Woodland
The Woodland industries that see more men than women are Agriculture, Fishing & Hunting (100.0%), Retail Trade (92.9%), and Manufacturing (74.1%), whereas the industries that tend to have a higher number of women are Finance & Insurance (100.0%), Real Estate, Rental & Leasing (100.0%), and Accommodation & Food Services (100.0%).
| Industry | Male | Female |
| Agriculture, Fishing & Hunting | 8 (100.0%) | 0 (0.0%) |
| Mining, Quarrying, & Extraction | 0 (0.0%) | 0 (0.0%) |
| Construction | 0 (0.0%) | 0 (0.0%) |
| Manufacturing | 20 (74.1%) | 7 (25.9%) |
| Wholesale Trade | 0 (0.0%) | 0 (0.0%) |
| Retail Trade | 26 (92.9%) | 2 (7.1%) |
| Transportation & Warehousing | 0 (0.0%) | 0 (0.0%) |
| Utilities | 0 (0.0%) | 0 (0.0%) |
| Information | 7 (33.3%) | 14 (66.7%) |
| Finance & Insurance | 0 (0.0%) | 9 (100.0%) |
| Real Estate, Rental & Leasing | 0 (0.0%) | 3 (100.0%) |
| Professional & Scientific | 0 (0.0%) | 0 (0.0%) |
| Enterprise Management | 0 (0.0%) | 0 (0.0%) |
| Administrative & Support | 6 (37.5%) | 10 (62.5%) |
| Educational Services | 2 (50.0%) | 2 (50.0%) |
| Health Care & Social Assistance | 4 (21.0%) | 15 (78.9%) |
| Arts, Entertainment & Recreation | 0 (0.0%) | 0 (0.0%) |
| Accommodation & Food Services | 0 (0.0%) | 3 (100.0%) |
| Public Administration | 13 (72.2%) | 5 (27.8%) |
| Total | 86 (55.1%) | 70 (44.9%) |
Education in Woodland
School Enrollment in Woodland
The most common levels of schooling among the 150 students in Woodland are middle school (67 | 44.7%), high school (44 | 29.3%), and elementary school (13 | 8.7%).
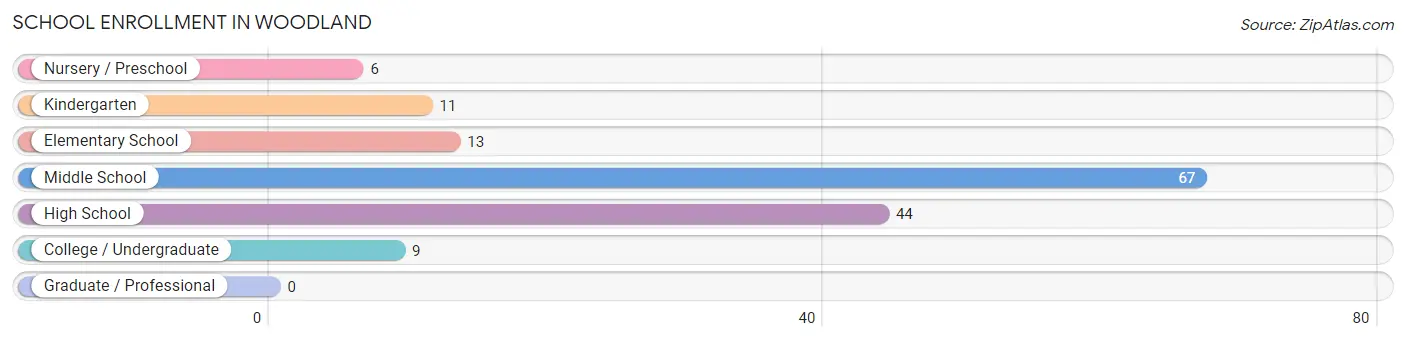
| School Level | # Students | % Students |
| Nursery / Preschool | 6 | 4.0% |
| Kindergarten | 11 | 7.3% |
| Elementary School | 13 | 8.7% |
| Middle School | 67 | 44.7% |
| High School | 44 | 29.3% |
| College / Undergraduate | 9 | 6.0% |
| Graduate / Professional | 0 | 0.0% |
| Total | 150 | 100.0% |
School Enrollment by Age by Funding Source in Woodland
Out of a total of 150 students who are enrolled in schools in Woodland, 29 (19.3%) attend a private institution, while the remaining 121 (80.7%) are enrolled in public schools. The age group of 35 years and over has the highest likelihood of being enrolled in private schools, with 8 (88.9% in the age bracket) enrolled. Conversely, the age group of 3 to 4 year olds has the lowest likelihood of being enrolled in a private school, with 6 (100.0% in the age bracket) attending a public institution.
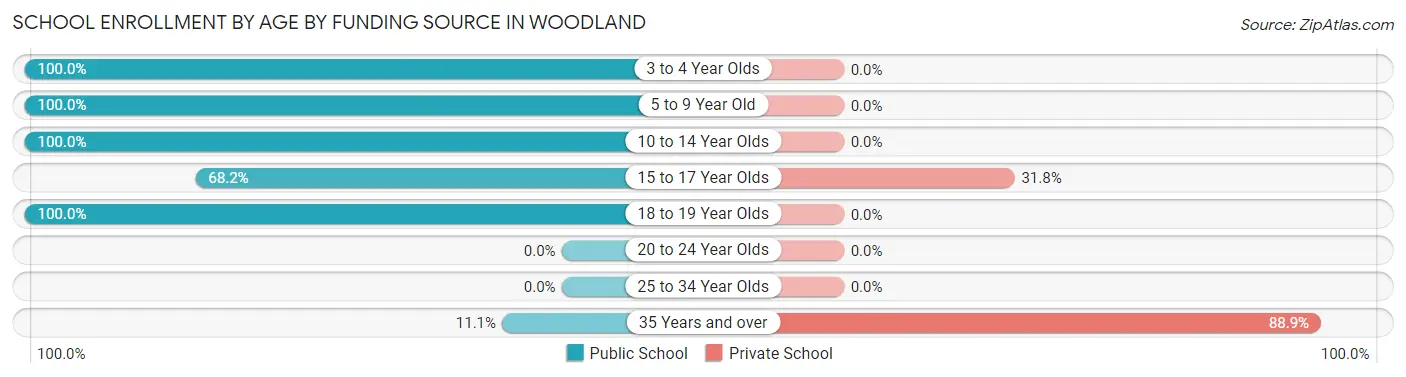
| Age Bracket | Public School | Private School |
| 3 to 4 Year Olds | 6 (100.0%) | 0 (0.0%) |
| 5 to 9 Year Old | 24 (100.0%) | 0 (0.0%) |
| 10 to 14 Year Olds | 33 (100.0%) | 0 (0.0%) |
| 15 to 17 Year Olds | 45 (68.2%) | 21 (31.8%) |
| 18 to 19 Year Olds | 12 (100.0%) | 0 (0.0%) |
| 20 to 24 Year Olds | 0 (0.0%) | 0 (0.0%) |
| 25 to 34 Year Olds | 0 (0.0%) | 0 (0.0%) |
| 35 Years and over | 1 (11.1%) | 8 (88.9%) |
| Total | 121 (80.7%) | 29 (19.3%) |
Educational Attainment by Field of Study in Woodland
Social sciences (19 | 28.4%), psychology (15 | 22.4%), liberal arts & history (14 | 20.9%), business (9 | 13.4%), and science & technology (5 | 7.5%) are the most common fields of study among 67 individuals in Woodland who have obtained a bachelor's degree or higher.
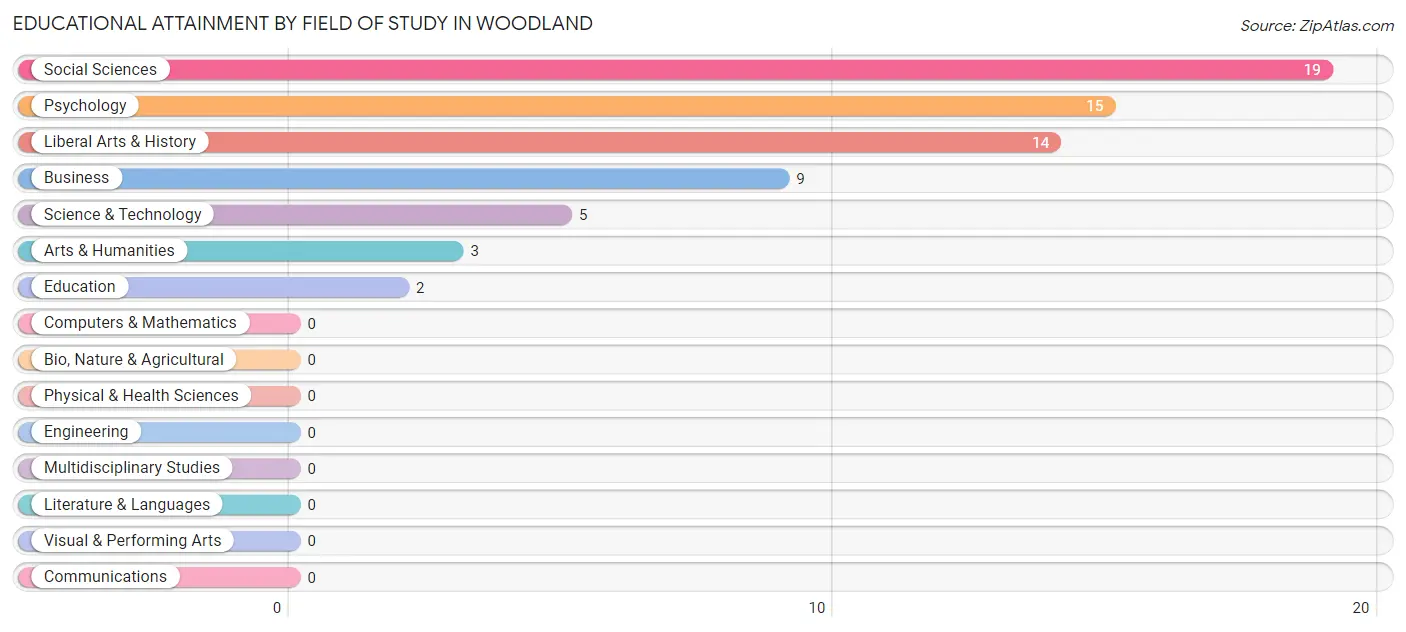
| Field of Study | # Graduates | % Graduates |
| Computers & Mathematics | 0 | 0.0% |
| Bio, Nature & Agricultural | 0 | 0.0% |
| Physical & Health Sciences | 0 | 0.0% |
| Psychology | 15 | 22.4% |
| Social Sciences | 19 | 28.4% |
| Engineering | 0 | 0.0% |
| Multidisciplinary Studies | 0 | 0.0% |
| Science & Technology | 5 | 7.5% |
| Business | 9 | 13.4% |
| Education | 2 | 3.0% |
| Literature & Languages | 0 | 0.0% |
| Liberal Arts & History | 14 | 20.9% |
| Visual & Performing Arts | 0 | 0.0% |
| Communications | 0 | 0.0% |
| Arts & Humanities | 3 | 4.5% |
| Total | 67 | 100.0% |
Transportation & Commute in Woodland
Vehicle Availability by Sex in Woodland
The most prevalent vehicle ownership categories in Woodland are males with 1 vehicle (48, accounting for 57.8%) and females with 1 vehicle (19, making up 68.6%).
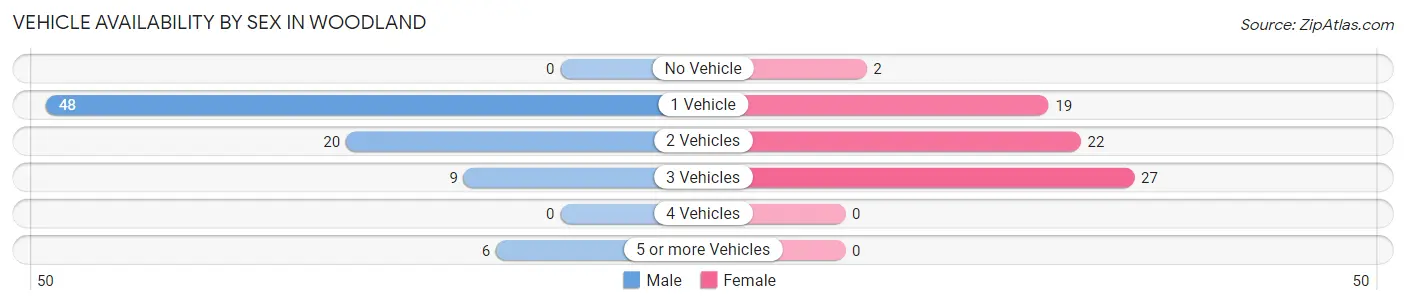
| Vehicles Available | Male | Female |
| No Vehicle | 0 (0.0%) | 2 (2.9%) |
| 1 Vehicle | 48 (57.8%) | 19 (27.1%) |
| 2 Vehicles | 20 (24.1%) | 22 (31.4%) |
| 3 Vehicles | 9 (10.8%) | 27 (38.6%) |
| 4 Vehicles | 0 (0.0%) | 0 (0.0%) |
| 5 or more Vehicles | 6 (7.2%) | 0 (0.0%) |
| Total | 83 (100.0%) | 70 (100.0%) |
Commute Time in Woodland
The most frequently occuring commute durations in Woodland are 5 to 9 minutes (31 commuters, 22.6%), 30 to 34 minutes (31 commuters, 22.6%), and 15 to 19 minutes (21 commuters, 15.3%).
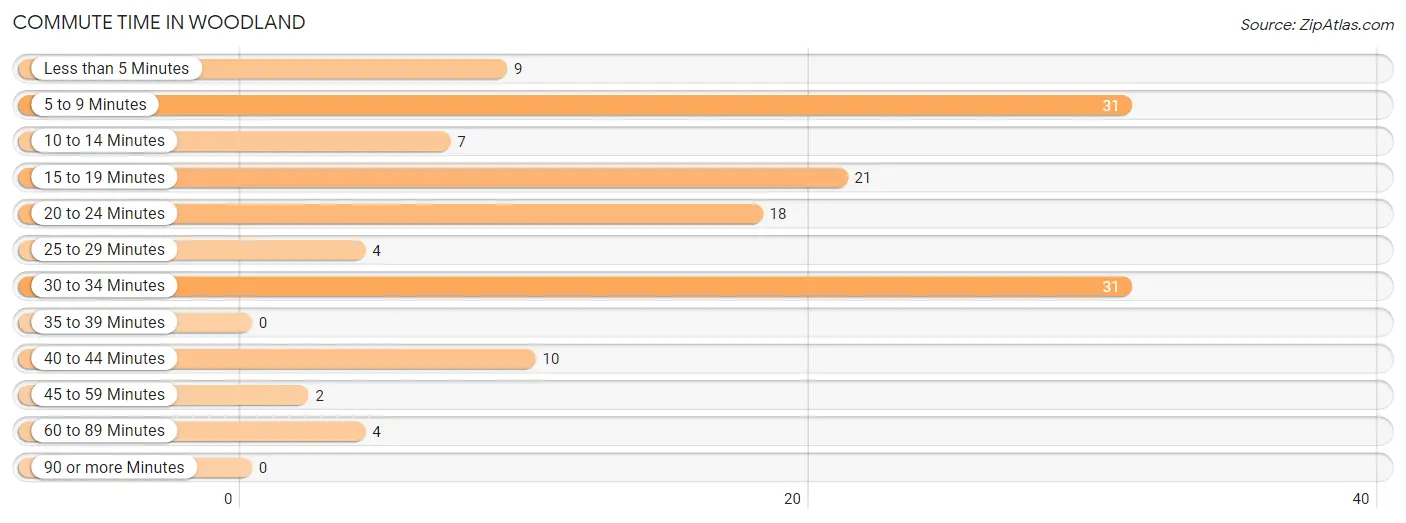
| Commute Time | # Commuters | % Commuters |
| Less than 5 Minutes | 9 | 6.6% |
| 5 to 9 Minutes | 31 | 22.6% |
| 10 to 14 Minutes | 7 | 5.1% |
| 15 to 19 Minutes | 21 | 15.3% |
| 20 to 24 Minutes | 18 | 13.1% |
| 25 to 29 Minutes | 4 | 2.9% |
| 30 to 34 Minutes | 31 | 22.6% |
| 35 to 39 Minutes | 0 | 0.0% |
| 40 to 44 Minutes | 10 | 7.3% |
| 45 to 59 Minutes | 2 | 1.5% |
| 60 to 89 Minutes | 4 | 2.9% |
| 90 or more Minutes | 0 | 0.0% |
Commute Time by Sex in Woodland
The most common commute times in Woodland are 30 to 34 minutes (23 commuters, 28.4%) for males and 5 to 9 minutes (13 commuters, 23.2%) for females.
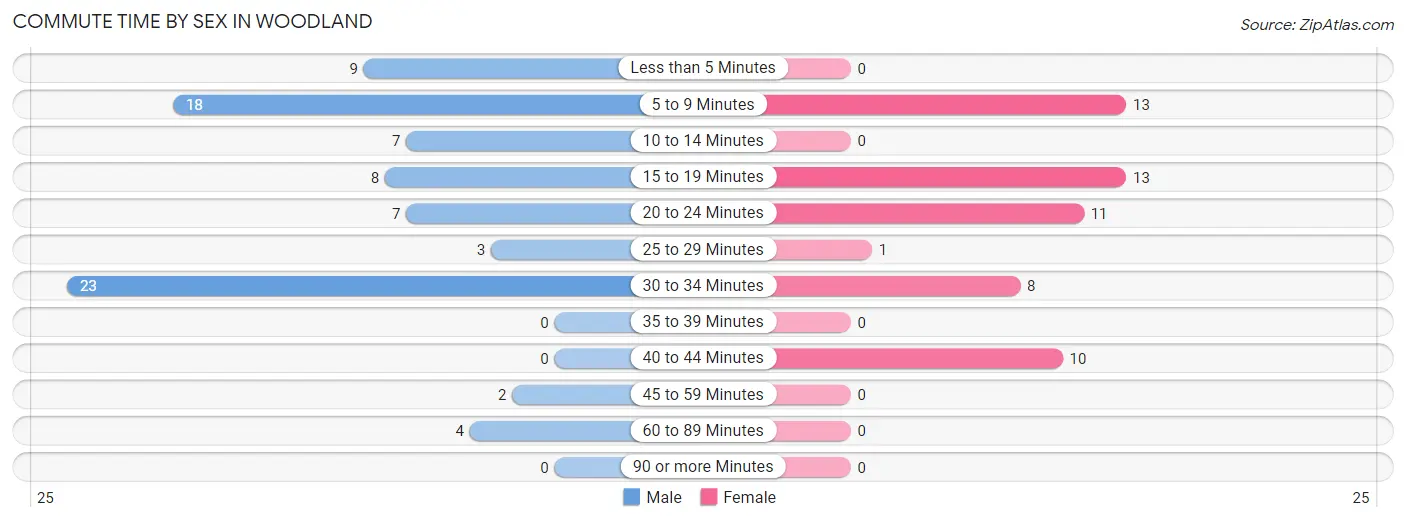
| Commute Time | Male | Female |
| Less than 5 Minutes | 9 (11.1%) | 0 (0.0%) |
| 5 to 9 Minutes | 18 (22.2%) | 13 (23.2%) |
| 10 to 14 Minutes | 7 (8.6%) | 0 (0.0%) |
| 15 to 19 Minutes | 8 (9.9%) | 13 (23.2%) |
| 20 to 24 Minutes | 7 (8.6%) | 11 (19.6%) |
| 25 to 29 Minutes | 3 (3.7%) | 1 (1.8%) |
| 30 to 34 Minutes | 23 (28.4%) | 8 (14.3%) |
| 35 to 39 Minutes | 0 (0.0%) | 0 (0.0%) |
| 40 to 44 Minutes | 0 (0.0%) | 10 (17.9%) |
| 45 to 59 Minutes | 2 (2.5%) | 0 (0.0%) |
| 60 to 89 Minutes | 4 (4.9%) | 0 (0.0%) |
| 90 or more Minutes | 0 (0.0%) | 0 (0.0%) |
Time of Departure to Work by Sex in Woodland
The most frequent times of departure to work in Woodland are 6:00 AM to 6:29 AM (17, 21.0%) for males and 8:00 AM to 8:29 AM (30, 53.6%) for females.
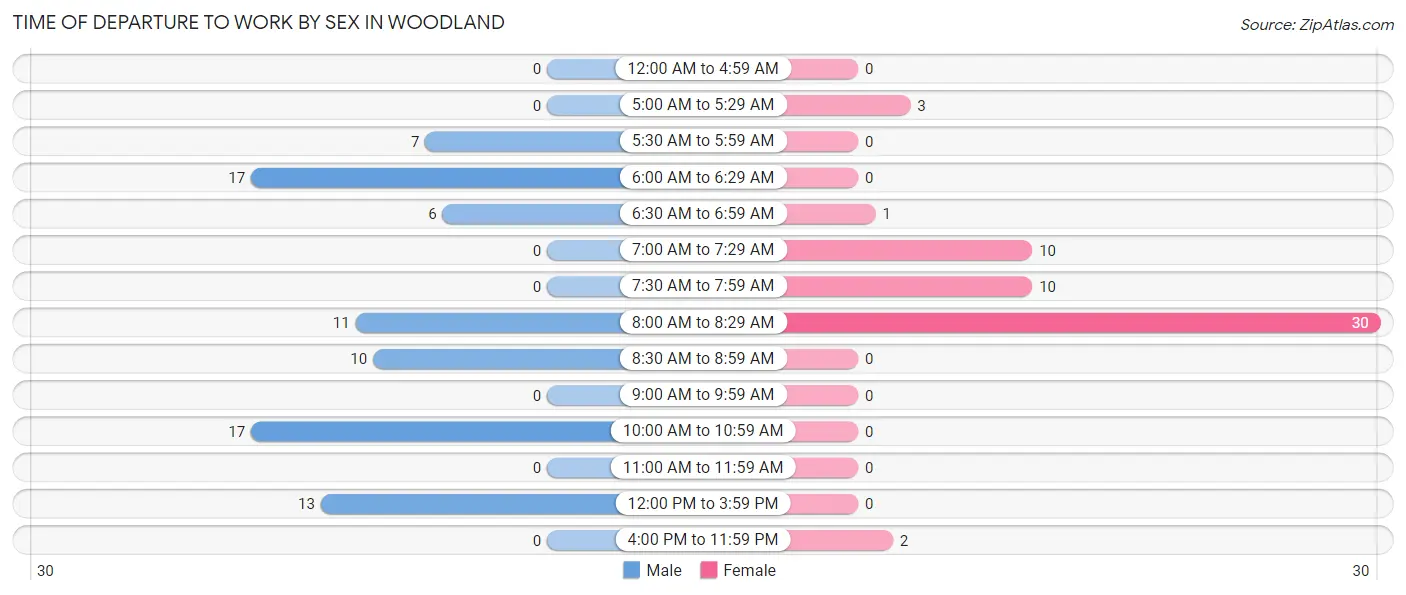
| Time of Departure | Male | Female |
| 12:00 AM to 4:59 AM | 0 (0.0%) | 0 (0.0%) |
| 5:00 AM to 5:29 AM | 0 (0.0%) | 3 (5.4%) |
| 5:30 AM to 5:59 AM | 7 (8.6%) | 0 (0.0%) |
| 6:00 AM to 6:29 AM | 17 (21.0%) | 0 (0.0%) |
| 6:30 AM to 6:59 AM | 6 (7.4%) | 1 (1.8%) |
| 7:00 AM to 7:29 AM | 0 (0.0%) | 10 (17.9%) |
| 7:30 AM to 7:59 AM | 0 (0.0%) | 10 (17.9%) |
| 8:00 AM to 8:29 AM | 11 (13.6%) | 30 (53.6%) |
| 8:30 AM to 8:59 AM | 10 (12.3%) | 0 (0.0%) |
| 9:00 AM to 9:59 AM | 0 (0.0%) | 0 (0.0%) |
| 10:00 AM to 10:59 AM | 17 (21.0%) | 0 (0.0%) |
| 11:00 AM to 11:59 AM | 0 (0.0%) | 0 (0.0%) |
| 12:00 PM to 3:59 PM | 13 (16.1%) | 0 (0.0%) |
| 4:00 PM to 11:59 PM | 0 (0.0%) | 2 (3.6%) |
| Total | 81 (100.0%) | 56 (100.0%) |
Housing Occupancy in Woodland
Occupancy by Ownership in Woodland
Of the total 265 dwellings in Woodland, owner-occupied units account for 129 (48.7%), while renter-occupied units make up 136 (51.3%).
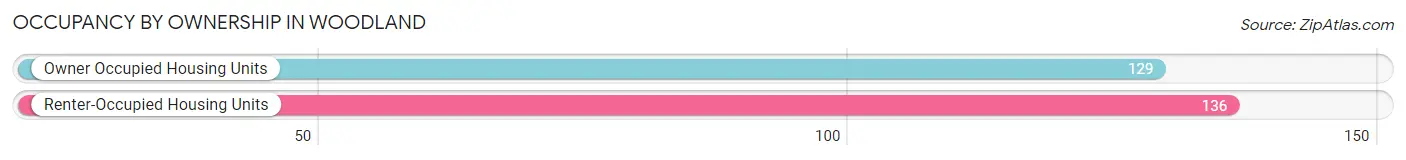
| Occupancy | # Housing Units | % Housing Units |
| Owner Occupied Housing Units | 129 | 48.7% |
| Renter-Occupied Housing Units | 136 | 51.3% |
| Total Occupied Housing Units | 265 | 100.0% |
Occupancy by Household Size in Woodland
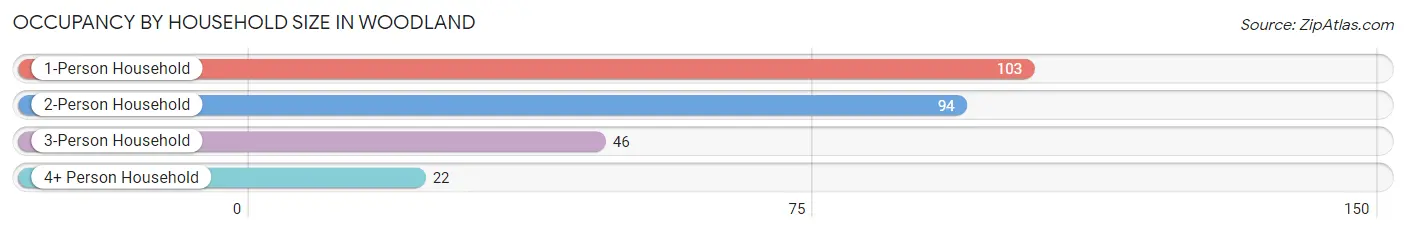
| Household Size | # Housing Units | % Housing Units |
| 1-Person Household | 103 | 38.9% |
| 2-Person Household | 94 | 35.5% |
| 3-Person Household | 46 | 17.4% |
| 4+ Person Household | 22 | 8.3% |
| Total Housing Units | 265 | 100.0% |
Occupancy by Ownership by Household Size in Woodland
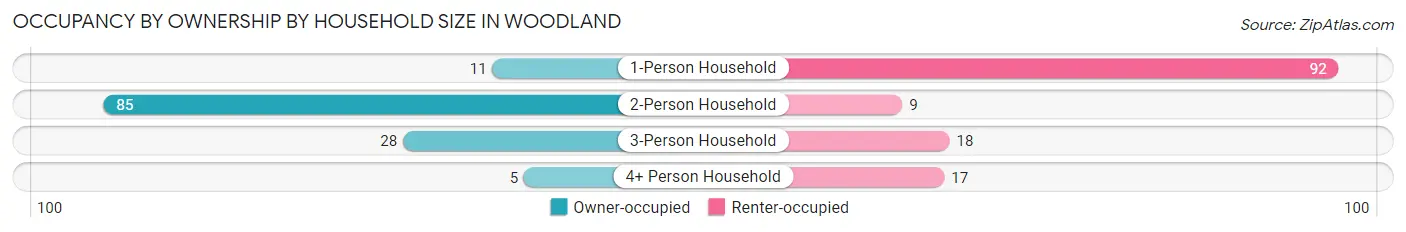
| Household Size | Owner-occupied | Renter-occupied |
| 1-Person Household | 11 (10.7%) | 92 (89.3%) |
| 2-Person Household | 85 (90.4%) | 9 (9.6%) |
| 3-Person Household | 28 (60.9%) | 18 (39.1%) |
| 4+ Person Household | 5 (22.7%) | 17 (77.3%) |
| Total Housing Units | 129 (48.7%) | 136 (51.3%) |
Occupancy by Educational Attainment in Woodland
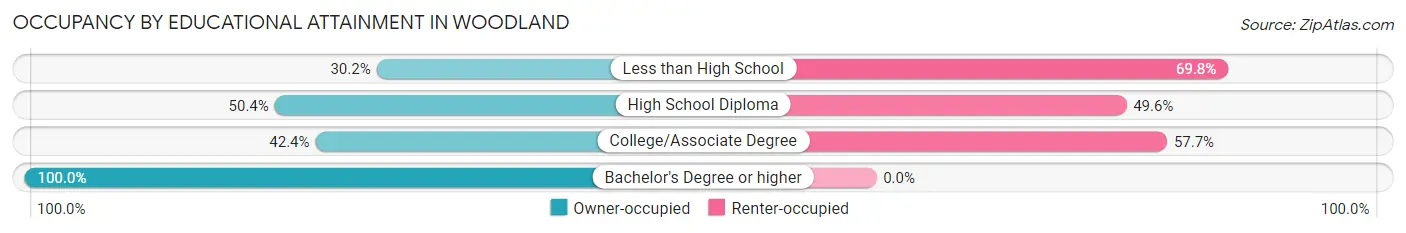
| Household Size | Owner-occupied | Renter-occupied |
| Less than High School | 13 (30.2%) | 30 (69.8%) |
| High School Diploma | 58 (50.4%) | 57 (49.6%) |
| College/Associate Degree | 36 (42.3%) | 49 (57.7%) |
| Bachelor's Degree or higher | 22 (100.0%) | 0 (0.0%) |
Occupancy by Age of Householder in Woodland
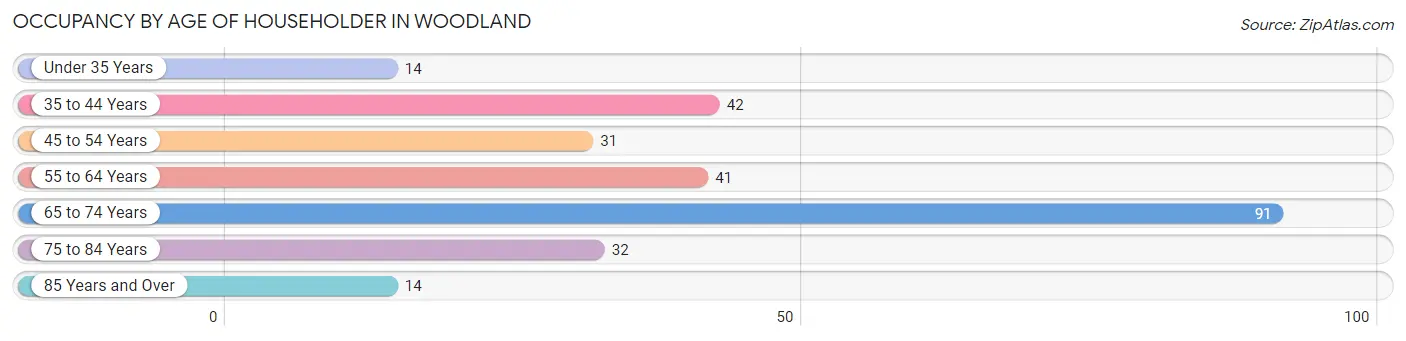
| Age Bracket | # Households | % Households |
| Under 35 Years | 14 | 5.3% |
| 35 to 44 Years | 42 | 15.9% |
| 45 to 54 Years | 31 | 11.7% |
| 55 to 64 Years | 41 | 15.5% |
| 65 to 74 Years | 91 | 34.3% |
| 75 to 84 Years | 32 | 12.1% |
| 85 Years and Over | 14 | 5.3% |
| Total | 265 | 100.0% |
Housing Finances in Woodland
Median Income by Occupancy in Woodland
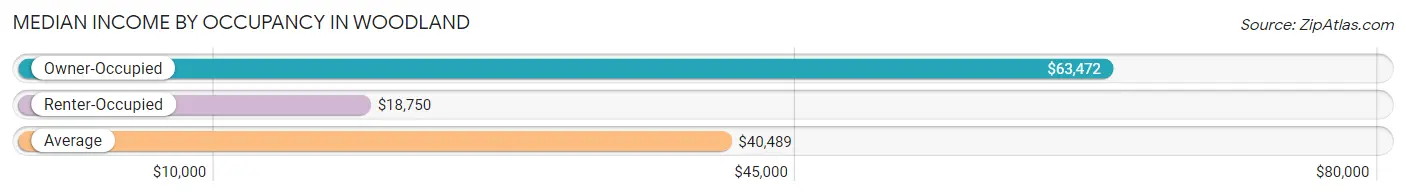
| Occupancy Type | # Households | Median Income |
| Owner-Occupied | 129 (48.7%) | $63,472 |
| Renter-Occupied | 136 (51.3%) | $18,750 |
| Average | 265 (100.0%) | $40,489 |
Occupancy by Householder Income Bracket in Woodland
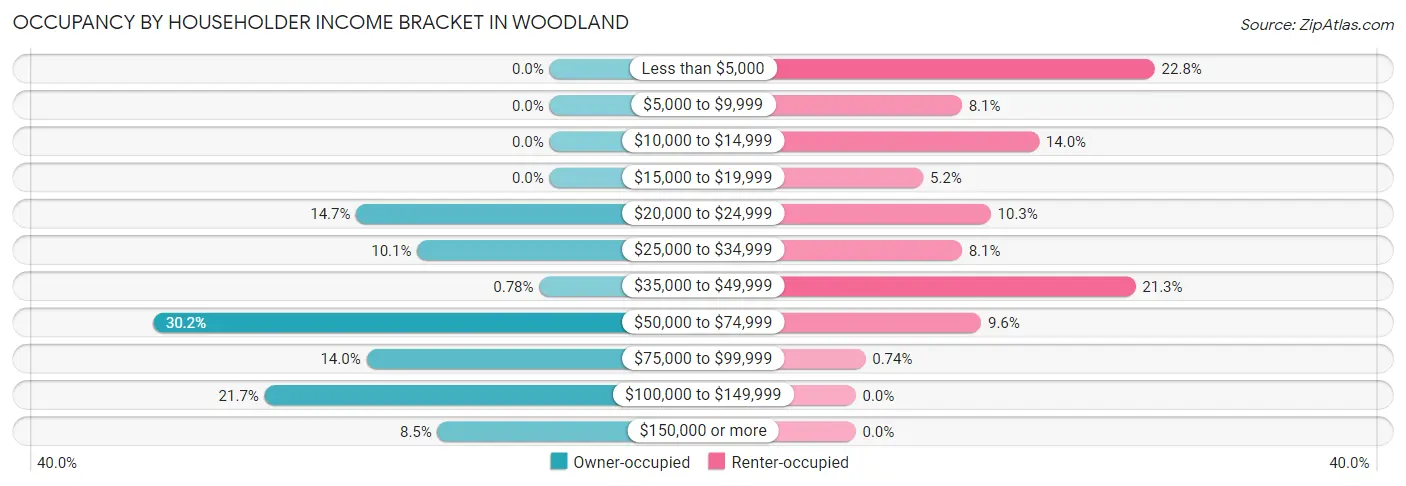
| Income Bracket | Owner-occupied | Renter-occupied |
| Less than $5,000 | 0 (0.0%) | 31 (22.8%) |
| $5,000 to $9,999 | 0 (0.0%) | 11 (8.1%) |
| $10,000 to $14,999 | 0 (0.0%) | 19 (14.0%) |
| $15,000 to $19,999 | 0 (0.0%) | 7 (5.1%) |
| $20,000 to $24,999 | 19 (14.7%) | 14 (10.3%) |
| $25,000 to $34,999 | 13 (10.1%) | 11 (8.1%) |
| $35,000 to $49,999 | 1 (0.8%) | 29 (21.3%) |
| $50,000 to $74,999 | 39 (30.2%) | 13 (9.6%) |
| $75,000 to $99,999 | 18 (14.0%) | 1 (0.7%) |
| $100,000 to $149,999 | 28 (21.7%) | 0 (0.0%) |
| $150,000 or more | 11 (8.5%) | 0 (0.0%) |
| Total | 129 (100.0%) | 136 (100.0%) |
Monthly Housing Cost Tiers in Woodland
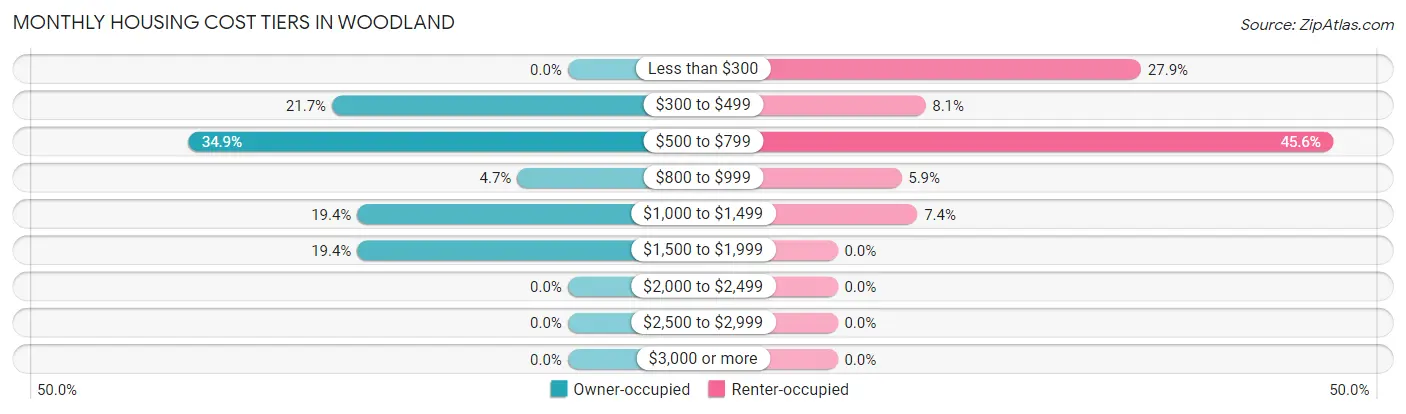
| Monthly Cost | Owner-occupied | Renter-occupied |
| Less than $300 | 0 (0.0%) | 38 (27.9%) |
| $300 to $499 | 28 (21.7%) | 11 (8.1%) |
| $500 to $799 | 45 (34.9%) | 62 (45.6%) |
| $800 to $999 | 6 (4.6%) | 8 (5.9%) |
| $1,000 to $1,499 | 25 (19.4%) | 10 (7.3%) |
| $1,500 to $1,999 | 25 (19.4%) | 0 (0.0%) |
| $2,000 to $2,499 | 0 (0.0%) | 0 (0.0%) |
| $2,500 to $2,999 | 0 (0.0%) | 0 (0.0%) |
| $3,000 or more | 0 (0.0%) | 0 (0.0%) |
| Total | 129 (100.0%) | 136 (100.0%) |
Physical Housing Characteristics in Woodland
Housing Structures in Woodland
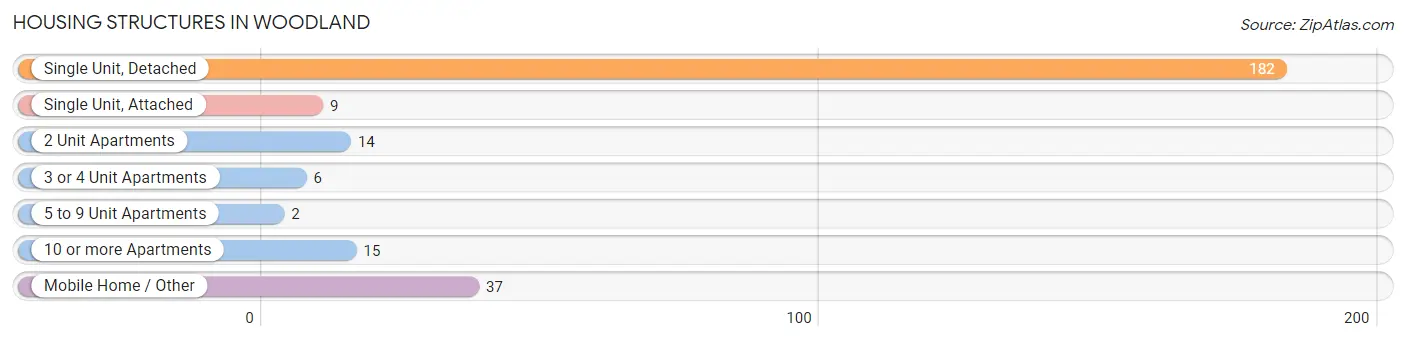
| Structure Type | # Housing Units | % Housing Units |
| Single Unit, Detached | 182 | 68.7% |
| Single Unit, Attached | 9 | 3.4% |
| 2 Unit Apartments | 14 | 5.3% |
| 3 or 4 Unit Apartments | 6 | 2.3% |
| 5 to 9 Unit Apartments | 2 | 0.7% |
| 10 or more Apartments | 15 | 5.7% |
| Mobile Home / Other | 37 | 14.0% |
| Total | 265 | 100.0% |
Housing Structures by Occupancy in Woodland
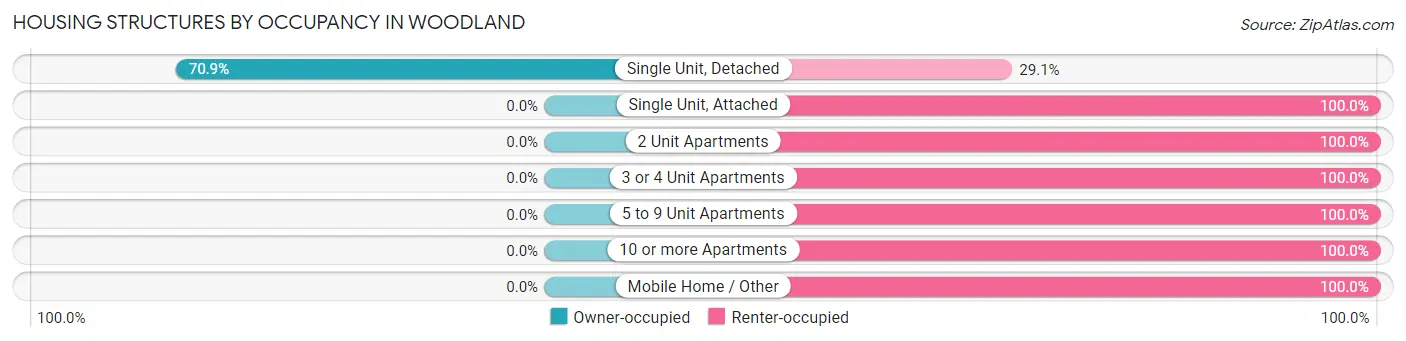
| Structure Type | Owner-occupied | Renter-occupied |
| Single Unit, Detached | 129 (70.9%) | 53 (29.1%) |
| Single Unit, Attached | 0 (0.0%) | 9 (100.0%) |
| 2 Unit Apartments | 0 (0.0%) | 14 (100.0%) |
| 3 or 4 Unit Apartments | 0 (0.0%) | 6 (100.0%) |
| 5 to 9 Unit Apartments | 0 (0.0%) | 2 (100.0%) |
| 10 or more Apartments | 0 (0.0%) | 15 (100.0%) |
| Mobile Home / Other | 0 (0.0%) | 37 (100.0%) |
| Total | 129 (48.7%) | 136 (51.3%) |
Housing Structures by Number of Rooms in Woodland
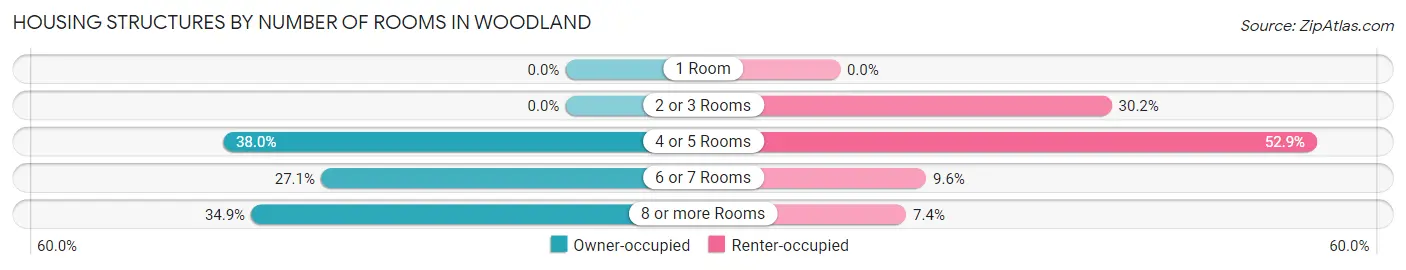
| Number of Rooms | Owner-occupied | Renter-occupied |
| 1 Room | 0 (0.0%) | 0 (0.0%) |
| 2 or 3 Rooms | 0 (0.0%) | 41 (30.1%) |
| 4 or 5 Rooms | 49 (38.0%) | 72 (52.9%) |
| 6 or 7 Rooms | 35 (27.1%) | 13 (9.6%) |
| 8 or more Rooms | 45 (34.9%) | 10 (7.3%) |
| Total | 129 (100.0%) | 136 (100.0%) |
Housing Structure by Heating Type in Woodland
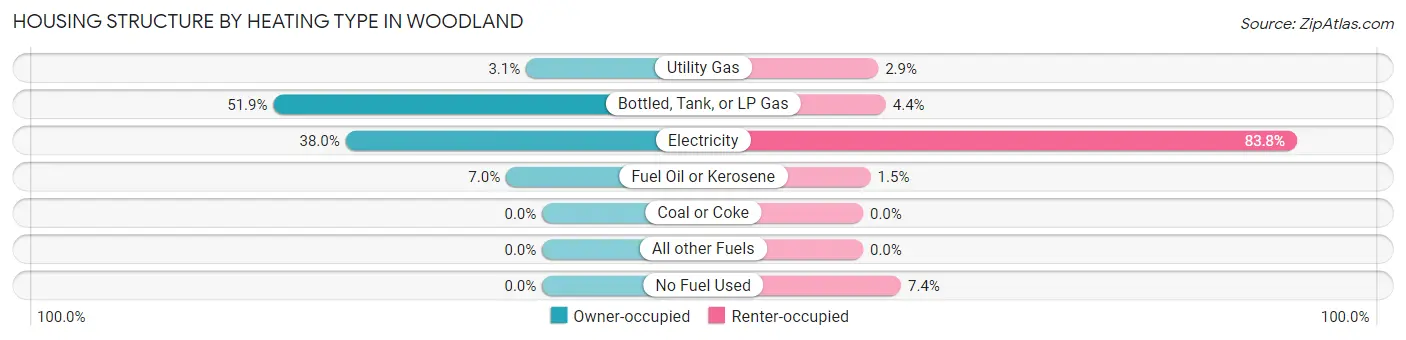
| Heating Type | Owner-occupied | Renter-occupied |
| Utility Gas | 4 (3.1%) | 4 (2.9%) |
| Bottled, Tank, or LP Gas | 67 (51.9%) | 6 (4.4%) |
| Electricity | 49 (38.0%) | 114 (83.8%) |
| Fuel Oil or Kerosene | 9 (7.0%) | 2 (1.5%) |
| Coal or Coke | 0 (0.0%) | 0 (0.0%) |
| All other Fuels | 0 (0.0%) | 0 (0.0%) |
| No Fuel Used | 0 (0.0%) | 10 (7.3%) |
| Total | 129 (100.0%) | 136 (100.0%) |
Household Vehicle Usage in Woodland
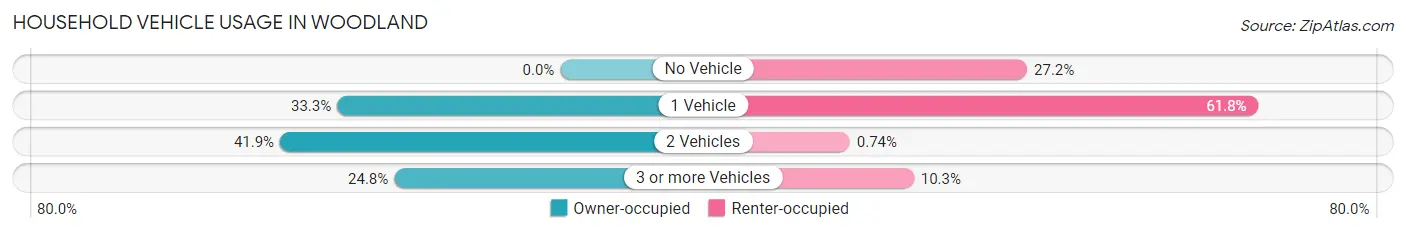
| Vehicles per Household | Owner-occupied | Renter-occupied |
| No Vehicle | 0 (0.0%) | 37 (27.2%) |
| 1 Vehicle | 43 (33.3%) | 84 (61.8%) |
| 2 Vehicles | 54 (41.9%) | 1 (0.7%) |
| 3 or more Vehicles | 32 (24.8%) | 14 (10.3%) |
| Total | 129 (100.0%) | 136 (100.0%) |
Real Estate & Mortgages in Woodland
Real Estate and Mortgage Overview in Woodland
| Characteristic | Without Mortgage | With Mortgage |
| Housing Units | 75 | 54 |
| Median Property Value | $138,300 | $85,000 |
| Median Household Income | $77,917 | $4 |
| Monthly Housing Costs | $603 | $0 |
| Real Estate Taxes | $1,359 | $0 |
Property Value by Mortgage Status in Woodland
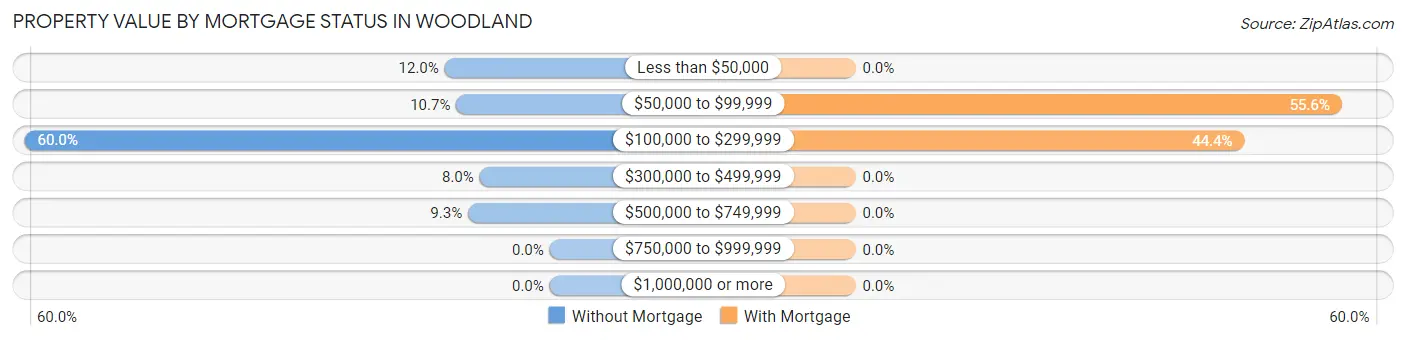
| Property Value | Without Mortgage | With Mortgage |
| Less than $50,000 | 9 (12.0%) | 0 (0.0%) |
| $50,000 to $99,999 | 8 (10.7%) | 30 (55.6%) |
| $100,000 to $299,999 | 45 (60.0%) | 24 (44.4%) |
| $300,000 to $499,999 | 6 (8.0%) | 0 (0.0%) |
| $500,000 to $749,999 | 7 (9.3%) | 0 (0.0%) |
| $750,000 to $999,999 | 0 (0.0%) | 0 (0.0%) |
| $1,000,000 or more | 0 (0.0%) | 0 (0.0%) |
| Total | 75 (100.0%) | 54 (100.0%) |
Household Income by Mortgage Status in Woodland
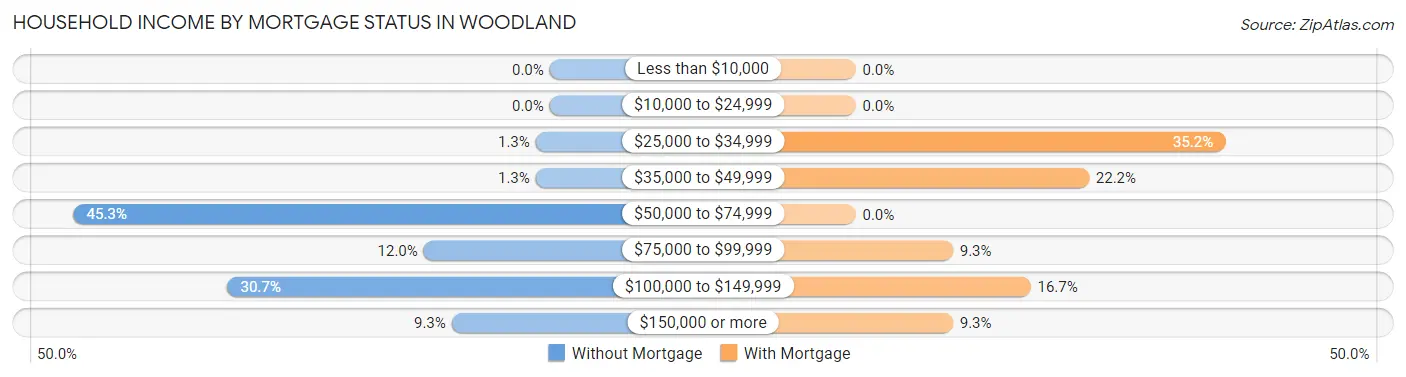
| Household Income | Without Mortgage | With Mortgage |
| Less than $10,000 | 0 (0.0%) | 0 (0.0%) |
| $10,000 to $24,999 | 0 (0.0%) | 0 (0.0%) |
| $25,000 to $34,999 | 1 (1.3%) | 19 (35.2%) |
| $35,000 to $49,999 | 1 (1.3%) | 12 (22.2%) |
| $50,000 to $74,999 | 34 (45.3%) | 0 (0.0%) |
| $75,000 to $99,999 | 9 (12.0%) | 5 (9.3%) |
| $100,000 to $149,999 | 23 (30.7%) | 9 (16.7%) |
| $150,000 or more | 7 (9.3%) | 5 (9.3%) |
| Total | 75 (100.0%) | 54 (100.0%) |
Property Value to Household Income Ratio in Woodland
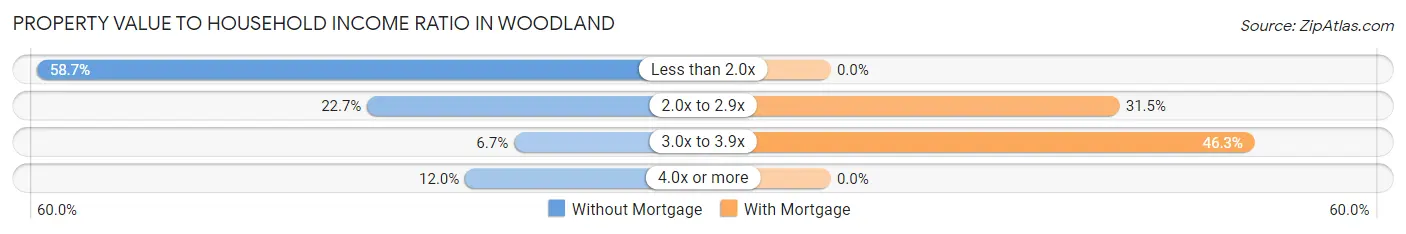
| Value-to-Income Ratio | Without Mortgage | With Mortgage |
| Less than 2.0x | 44 (58.7%) | 0 (0.0%) |
| 2.0x to 2.9x | 17 (22.7%) | 17 (31.5%) |
| 3.0x to 3.9x | 5 (6.7%) | 25 (46.3%) |
| 4.0x or more | 9 (12.0%) | 0 (0.0%) |
| Total | 75 (100.0%) | 54 (100.0%) |
Real Estate Taxes by Mortgage Status in Woodland
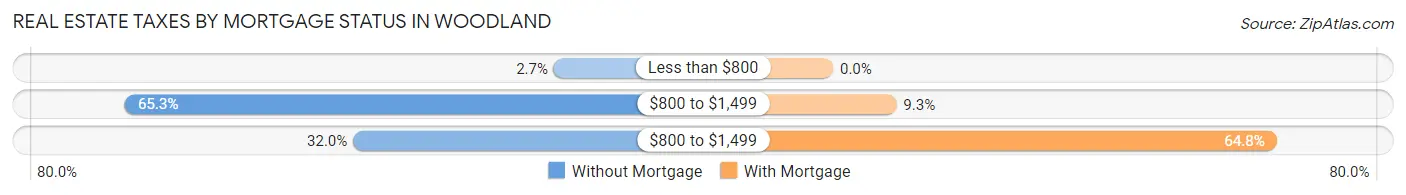
| Property Taxes | Without Mortgage | With Mortgage |
| Less than $800 | 2 (2.7%) | 0 (0.0%) |
| $800 to $1,499 | 49 (65.3%) | 5 (9.3%) |
| $800 to $1,499 | 24 (32.0%) | 35 (64.8%) |
| Total | 75 (100.0%) | 54 (100.0%) |
Health & Disability in Woodland
Health Insurance Coverage by Age in Woodland
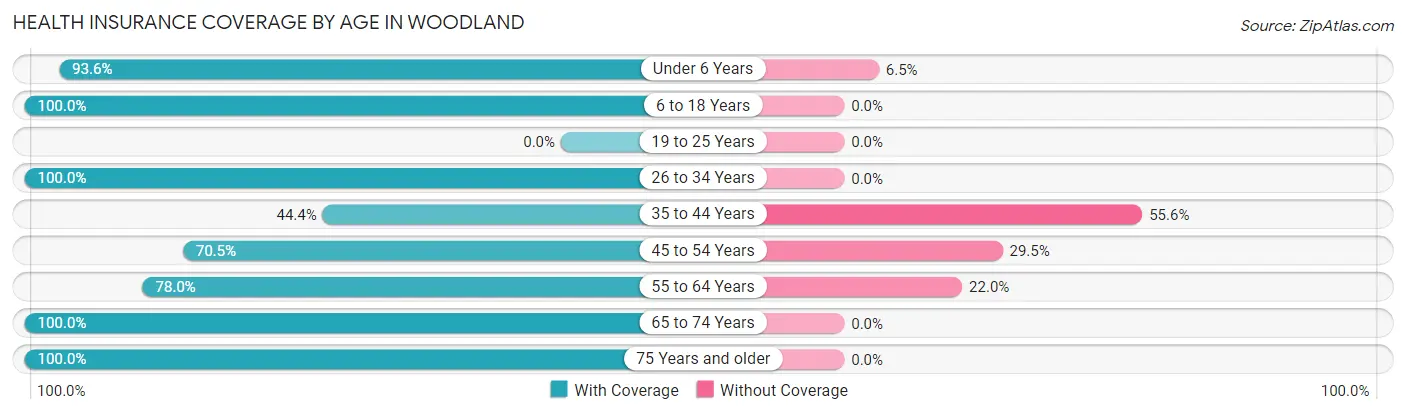
| Age Bracket | With Coverage | Without Coverage |
| Under 6 Years | 29 (93.5%) | 2 (6.5%) |
| 6 to 18 Years | 136 (100.0%) | 0 (0.0%) |
| 19 to 25 Years | 0 (0.0%) | 0 (0.0%) |
| 26 to 34 Years | 20 (100.0%) | 0 (0.0%) |
| 35 to 44 Years | 40 (44.4%) | 50 (55.6%) |
| 45 to 54 Years | 43 (70.5%) | 18 (29.5%) |
| 55 to 64 Years | 71 (78.0%) | 20 (22.0%) |
| 65 to 74 Years | 151 (100.0%) | 0 (0.0%) |
| 75 Years and older | 50 (100.0%) | 0 (0.0%) |
| Total | 540 (85.7%) | 90 (14.3%) |
Health Insurance Coverage by Citizenship Status in Woodland
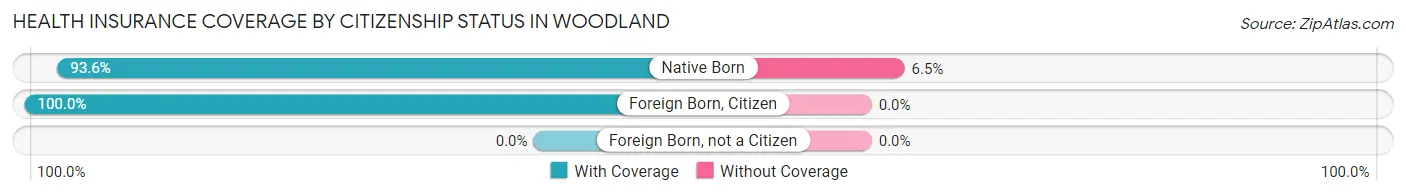
| Citizenship Status | With Coverage | Without Coverage |
| Native Born | 29 (93.5%) | 2 (6.5%) |
| Foreign Born, Citizen | 136 (100.0%) | 0 (0.0%) |
| Foreign Born, not a Citizen | 0 (0.0%) | 0 (0.0%) |
Health Insurance Coverage by Household Income in Woodland
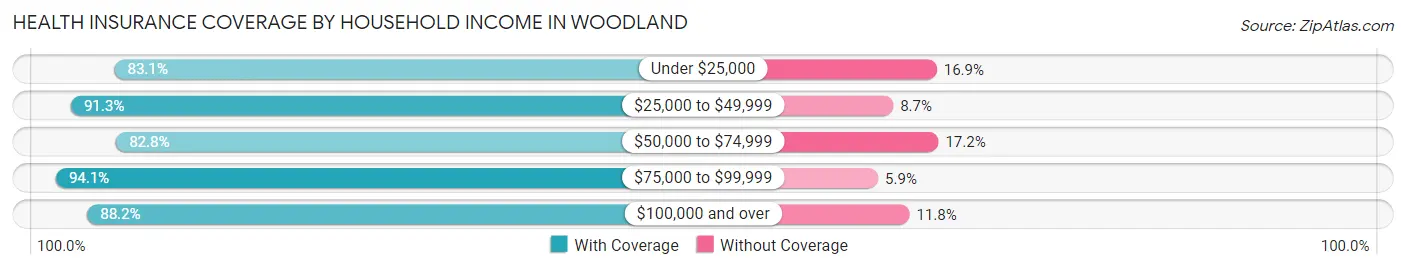
| Household Income | With Coverage | Without Coverage |
| Under $25,000 | 212 (83.1%) | 43 (16.9%) |
| $25,000 to $49,999 | 63 (91.3%) | 6 (8.7%) |
| $50,000 to $74,999 | 135 (82.8%) | 28 (17.2%) |
| $75,000 to $99,999 | 48 (94.1%) | 3 (5.9%) |
| $100,000 and over | 75 (88.2%) | 10 (11.8%) |
Public vs Private Health Insurance Coverage by Age in Woodland
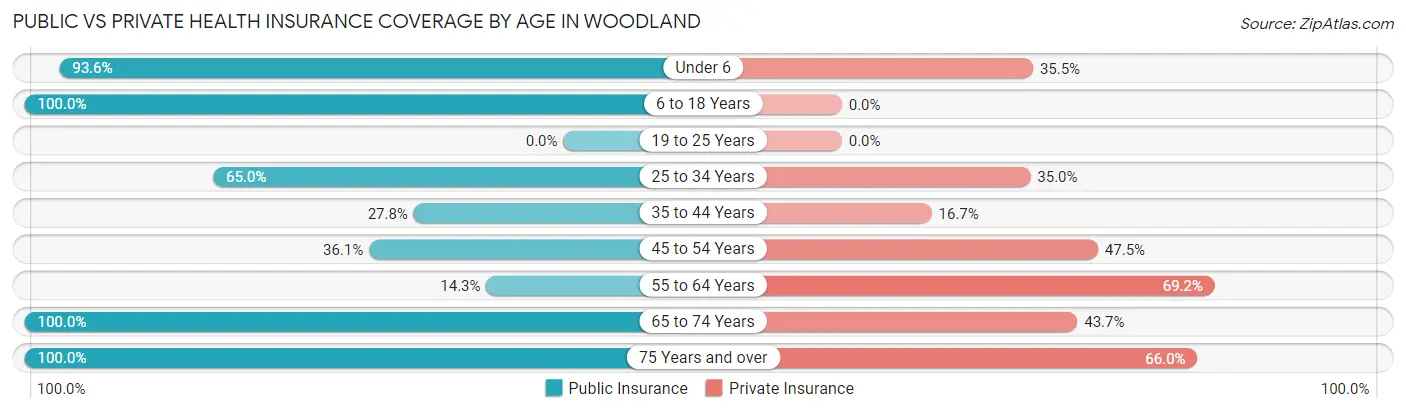
| Age Bracket | Public Insurance | Private Insurance |
| Under 6 | 29 (93.5%) | 11 (35.5%) |
| 6 to 18 Years | 136 (100.0%) | 0 (0.0%) |
| 19 to 25 Years | 0 (0.0%) | 0 (0.0%) |
| 25 to 34 Years | 13 (65.0%) | 7 (35.0%) |
| 35 to 44 Years | 25 (27.8%) | 15 (16.7%) |
| 45 to 54 Years | 22 (36.1%) | 29 (47.5%) |
| 55 to 64 Years | 13 (14.3%) | 63 (69.2%) |
| 65 to 74 Years | 151 (100.0%) | 66 (43.7%) |
| 75 Years and over | 50 (100.0%) | 33 (66.0%) |
| Total | 439 (69.7%) | 224 (35.6%) |
Disability Status by Sex by Age in Woodland
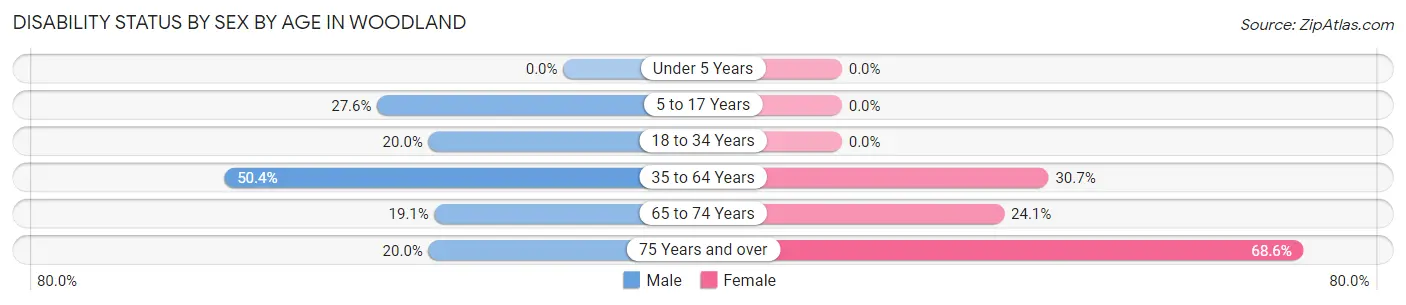
| Age Bracket | Male | Female |
| Under 5 Years | 0 (0.0%) | 0 (0.0%) |
| 5 to 17 Years | 21 (27.6%) | 0 (0.0%) |
| 18 to 34 Years | 3 (20.0%) | 0 (0.0%) |
| 35 to 64 Years | 71 (50.3%) | 31 (30.7%) |
| 65 to 74 Years | 13 (19.1%) | 20 (24.1%) |
| 75 Years and over | 3 (20.0%) | 24 (68.6%) |
Disability Class by Sex by Age in Woodland
Disability Class: Hearing Difficulty
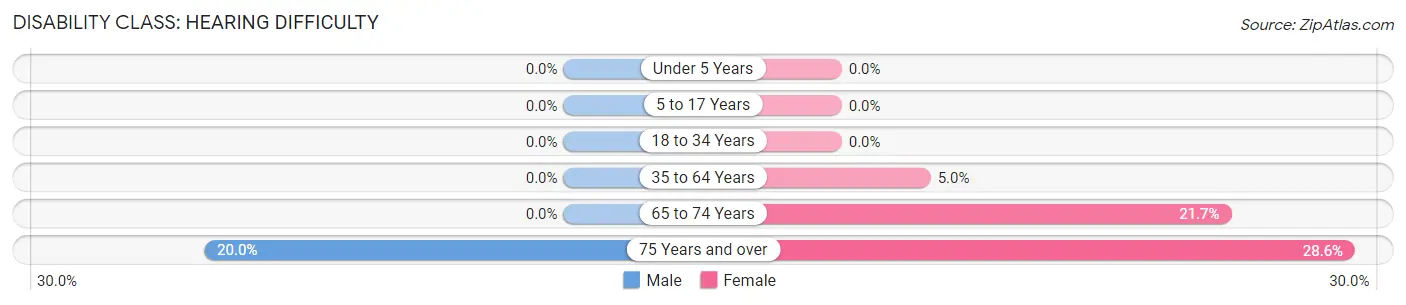
| Age Bracket | Male | Female |
| Under 5 Years | 0 (0.0%) | 0 (0.0%) |
| 5 to 17 Years | 0 (0.0%) | 0 (0.0%) |
| 18 to 34 Years | 0 (0.0%) | 0 (0.0%) |
| 35 to 64 Years | 0 (0.0%) | 5 (5.0%) |
| 65 to 74 Years | 0 (0.0%) | 18 (21.7%) |
| 75 Years and over | 3 (20.0%) | 10 (28.6%) |
Disability Class: Vision Difficulty
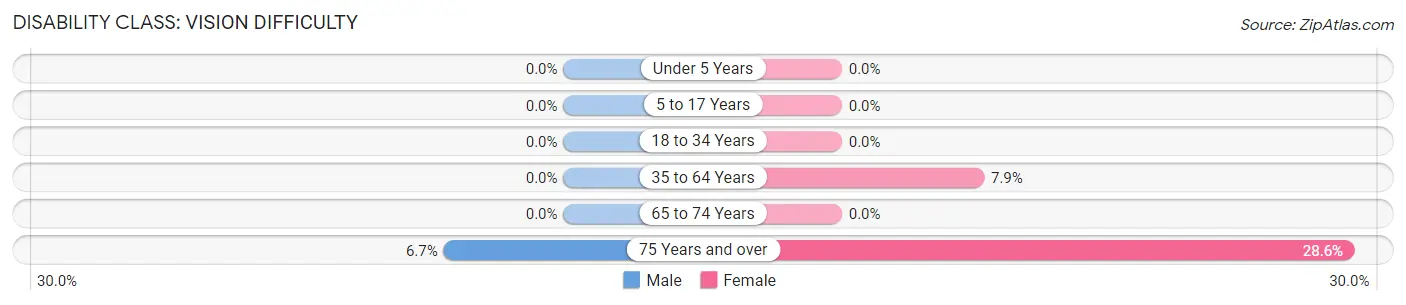
| Age Bracket | Male | Female |
| Under 5 Years | 0 (0.0%) | 0 (0.0%) |
| 5 to 17 Years | 0 (0.0%) | 0 (0.0%) |
| 18 to 34 Years | 0 (0.0%) | 0 (0.0%) |
| 35 to 64 Years | 0 (0.0%) | 8 (7.9%) |
| 65 to 74 Years | 0 (0.0%) | 0 (0.0%) |
| 75 Years and over | 1 (6.7%) | 10 (28.6%) |
Disability Class: Cognitive Difficulty
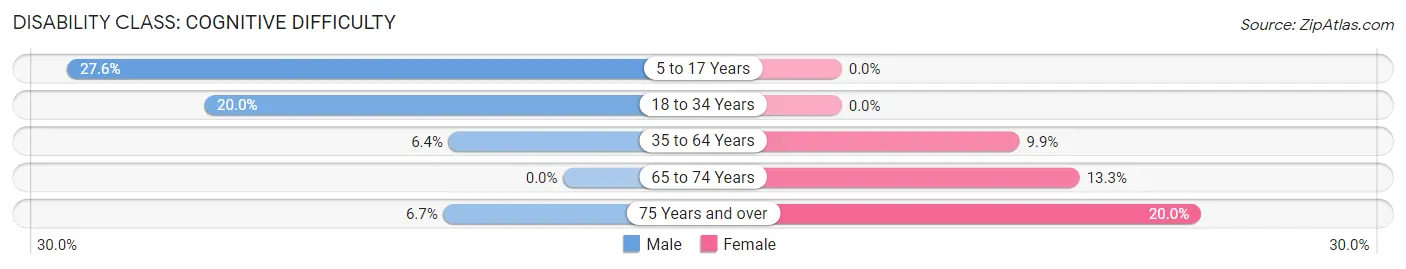
| Age Bracket | Male | Female |
| 5 to 17 Years | 21 (27.6%) | 0 (0.0%) |
| 18 to 34 Years | 3 (20.0%) | 0 (0.0%) |
| 35 to 64 Years | 9 (6.4%) | 10 (9.9%) |
| 65 to 74 Years | 0 (0.0%) | 11 (13.3%) |
| 75 Years and over | 1 (6.7%) | 7 (20.0%) |
Disability Class: Ambulatory Difficulty
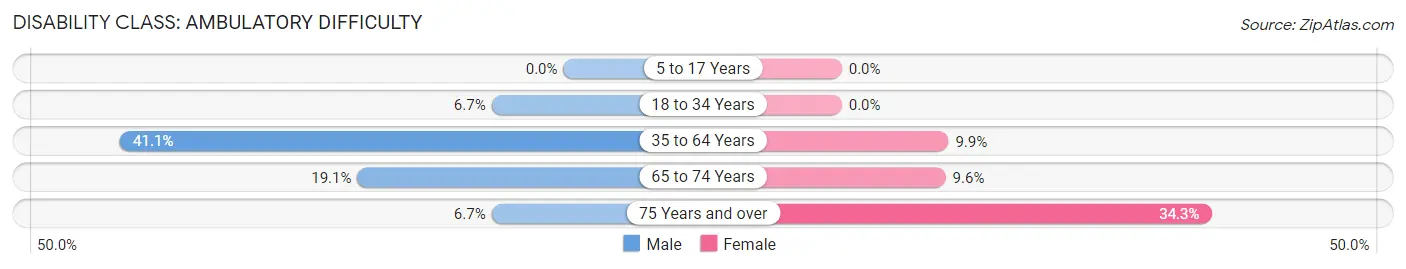
| Age Bracket | Male | Female |
| 5 to 17 Years | 0 (0.0%) | 0 (0.0%) |
| 18 to 34 Years | 1 (6.7%) | 0 (0.0%) |
| 35 to 64 Years | 58 (41.1%) | 10 (9.9%) |
| 65 to 74 Years | 13 (19.1%) | 8 (9.6%) |
| 75 Years and over | 1 (6.7%) | 12 (34.3%) |
Disability Class: Self-Care Difficulty
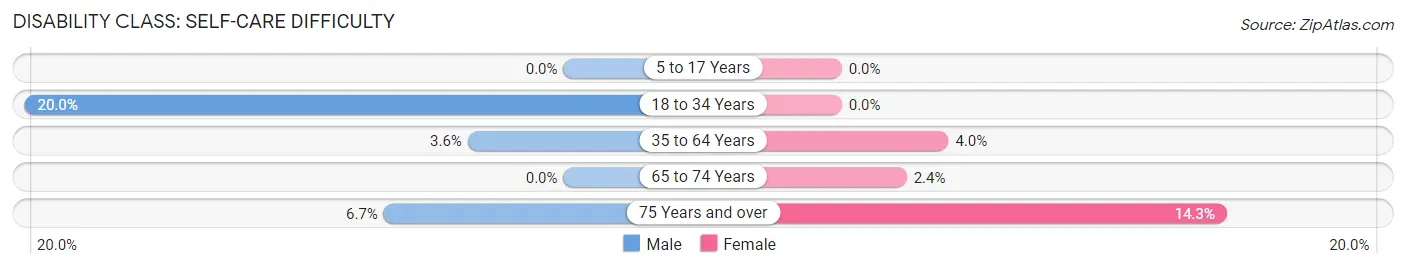
| Age Bracket | Male | Female |
| 5 to 17 Years | 0 (0.0%) | 0 (0.0%) |
| 18 to 34 Years | 3 (20.0%) | 0 (0.0%) |
| 35 to 64 Years | 5 (3.5%) | 4 (4.0%) |
| 65 to 74 Years | 0 (0.0%) | 2 (2.4%) |
| 75 Years and over | 1 (6.7%) | 5 (14.3%) |
Technology Access in Woodland
Computing Device Access in Woodland
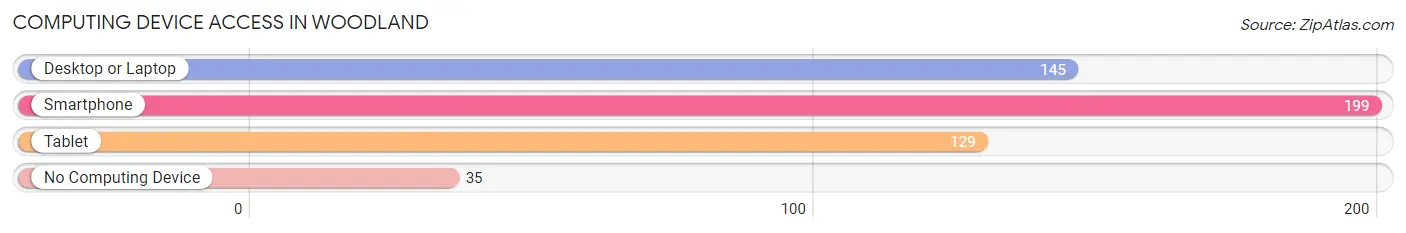
| Device Type | # Households | % Households |
| Desktop or Laptop | 145 | 54.7% |
| Smartphone | 199 | 75.1% |
| Tablet | 129 | 48.7% |
| No Computing Device | 35 | 13.2% |
| Total | 265 | 100.0% |
Internet Access in Woodland
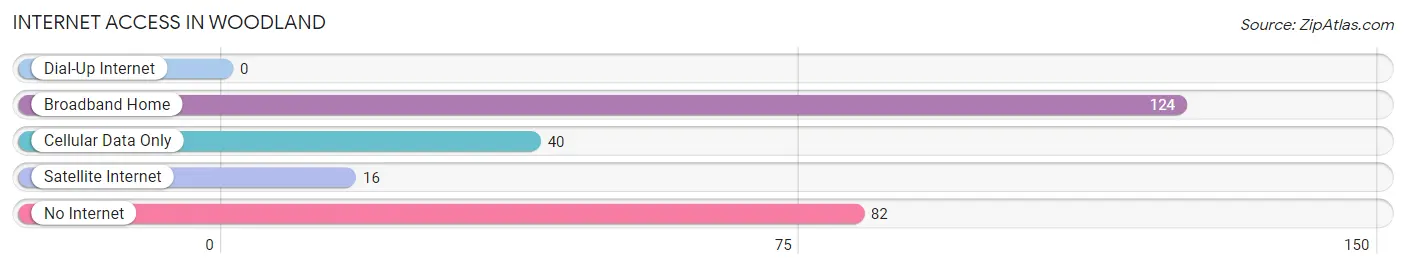
| Internet Type | # Households | % Households |
| Dial-Up Internet | 0 | 0.0% |
| Broadband Home | 124 | 46.8% |
| Cellular Data Only | 40 | 15.1% |
| Satellite Internet | 16 | 6.0% |
| No Internet | 82 | 30.9% |
| Total | 265 | 100.0% |
Woodland Summary
Woodland is a small town located in Northampton County, North Carolina. It is situated in the northeastern part of the state, approximately 40 miles east of Raleigh. The town has a population of approximately 1,500 people and is part of the Roanoke Rapids Micropolitan Statistical Area.
Geography
Woodland is located in the northeastern part of North Carolina, in the Roanoke Rapids Micropolitan Statistical Area. It is situated in the Coastal Plain region of the state, and is bordered by the Roanoke River to the north and the Chowan River to the south. The town is located approximately 40 miles east of Raleigh, the state capital.
The town is situated on a flat, low-lying terrain, with an elevation of just over 100 feet. The climate is humid subtropical, with hot, humid summers and mild winters. The average annual temperature is around 70 degrees Fahrenheit, with an average annual precipitation of around 45 inches.
History
Woodland was first settled in the early 1700s by English settlers. The town was originally known as “Woodland”, and was incorporated in 1887. The town was named after the nearby woodlands, which were used for timber and other resources.
In the late 1800s, the town became a center for the lumber industry, with several sawmills and lumber yards located in the area. The town also became a center for the tobacco industry, with several tobacco warehouses located in the area.
In the early 1900s, the town began to experience a decline in the lumber and tobacco industries, and the population began to decline. In the late 1900s, the town began to experience a resurgence, with the opening of several new businesses and the development of a new industrial park.
Economy
The economy of Woodland is largely based on agriculture and manufacturing. The town is home to several large farms, which produce a variety of crops, including corn, soybeans, cotton, and tobacco. The town is also home to several manufacturing companies, which produce a variety of products, including furniture, textiles, and electronics.
The town is also home to several retail stores, restaurants, and other businesses. The town is served by several major highways, including Interstate 95, US Highway 158, and US Highway 301.
Demographics
As of the 2010 census, the population of Woodland was 1,500 people. The racial makeup of the town was 79.2% White, 17.3% African American, 0.7% Native American, 0.7% Asian, 0.3% from other races, and 1.9% from two or more races. Hispanic or Latino of any race were 1.3% of the population.
The median household income in Woodland was $31,250, and the median family income was $37,500. The per capita income in the town was $17,857. About 17.3% of families and 20.7% of the population were below the poverty line, including 28.3% of those under age 18 and 11.1% of those age 65 or over.
Woodland is served by the Northampton County School District, which includes two elementary schools, one middle school, and one high school. The town is also home to several churches, including the Woodland United Methodist Church, the Woodland Baptist Church, and the Woodland Presbyterian Church.
Common Questions
What is Per Capita Income in Woodland?
Per Capita income in Woodland is $24,178.
What is the Median Family Income in Woodland?
Median Family Income in Woodland is $57,857.
What is the Median Household income in Woodland?
Median Household Income in Woodland is $40,489.
What is Family Income Deficit in Woodland?
Family Income Deficit in Woodland is $19,007.
Families that are below poverty line in Woodland earn $19,007 less on average than the poverty threshold level.
What is Inequality or Gini Index in Woodland?
Inequality or Gini Index in Woodland is 0.53.
What is the Total Population of Woodland?
Total Population of Woodland is 630.
What is the Total Male Population of Woodland?
Total Male Population of Woodland is 338.
What is the Total Female Population of Woodland?
Total Female Population of Woodland is 292.
What is the Ratio of Males per 100 Females in Woodland?
There are 115.75 Males per 100 Females in Woodland.
What is the Ratio of Females per 100 Males in Woodland?
There are 86.39 Females per 100 Males in Woodland.
What is the Median Population Age in Woodland?
Median Population Age in Woodland is 51.8 Years.
What is the Average Family Size in Woodland
Average Family Size in Woodland is 3.1 People.
What is the Average Household Size in Woodland
Average Household Size in Woodland is 2.4 People.
How Large is the Labor Force in Woodland?
There are 162 People in the Labor Forcein in Woodland.
What is the Percentage of People in the Labor Force in Woodland?
32.0% of People are in the Labor Force in Woodland.
What is the Unemployment Rate in Woodland?
Unemployment Rate in Woodland is 3.7%.