Hamilton, NC Map & Demographics
Hamilton Map
Hamilton Overview
$25,690
PER CAPITA INCOME
$59,250
AVG FAMILY INCOME
$41,429
AVG HOUSEHOLD INCOME
18.1%
WAGE / INCOME GAP [ % ]
81.9¢/ $1
WAGE / INCOME GAP [ $ ]
0.41
INEQUALITY / GINI INDEX
167
TOTAL POPULATION
74
MALE POPULATION
93
FEMALE POPULATION
79.57
MALES / 100 FEMALES
125.68
FEMALES / 100 MALES
61.2
MEDIAN AGE
2.8
AVG FAMILY SIZE
2.1
AVG HOUSEHOLD SIZE
76
LABOR FORCE [ PEOPLE ]
47.2%
PERCENT IN LABOR FORCE
7.9%
UNEMPLOYMENT RATE
Hamilton Zip Codes
Hamilton Area Codes
Income in Hamilton
Income Overview in Hamilton
Per Capita Income in Hamilton is $25,690, while median incomes of families and households are $59,250 and $41,429 respectively.
| Characteristic | Number | Measure |
| Per Capita Income | 167 | $25,690 |
| Median Family Income | 47 | $59,250 |
| Mean Family Income | 47 | $71,962 |
| Median Household Income | 80 | $41,429 |
| Mean Household Income | 80 | $54,344 |
| Income Deficit | 47 | $0 |
| Wage / Income Gap (%) | 167 | 18.06% |
| Wage / Income Gap ($) | 167 | 81.94¢ per $1 |
| Gini / Inequality Index | 167 | 0.41 |
Earnings by Sex in Hamilton
Average Earnings in Hamilton are $27,375, $30,000 for men and $24,583 for women, a difference of 18.1%.
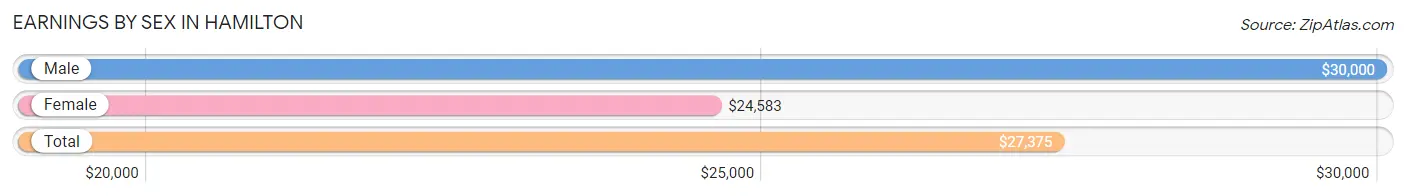
| Sex | Number | Average Earnings |
| Male | 44 (57.1%) | $30,000 |
| Female | 33 (42.9%) | $24,583 |
| Total | 77 (100.0%) | $27,375 |
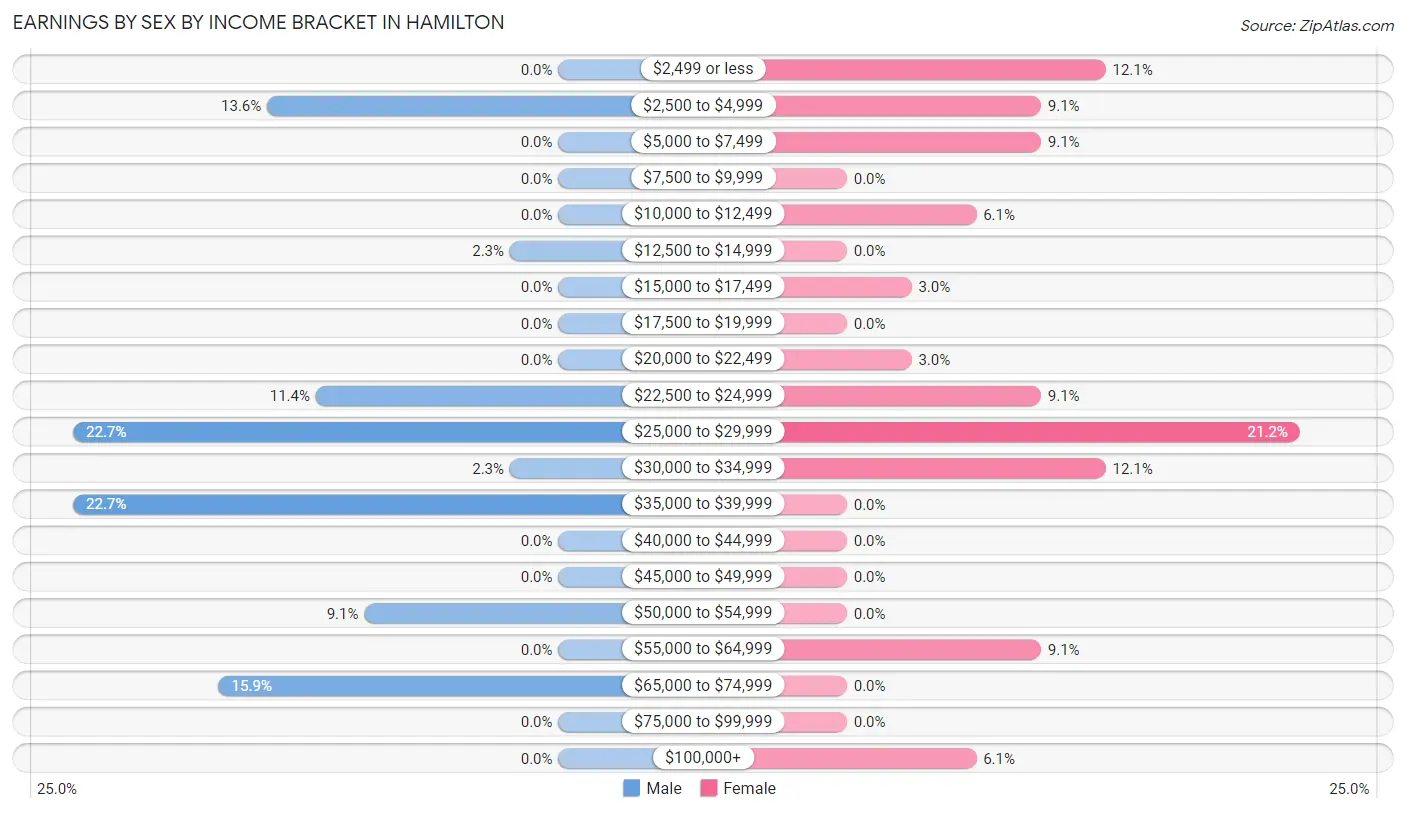
Earnings by Sex by Income Bracket in Hamilton
The most common earnings brackets in Hamilton are $25,000 to $29,999 for men (10 | 22.7%) and $25,000 to $29,999 for women (7 | 21.2%).
| Income | Male | Female |
| $2,499 or less | 0 (0.0%) | 4 (12.1%) |
| $2,500 to $4,999 | 6 (13.6%) | 3 (9.1%) |
| $5,000 to $7,499 | 0 (0.0%) | 3 (9.1%) |
| $7,500 to $9,999 | 0 (0.0%) | 0 (0.0%) |
| $10,000 to $12,499 | 0 (0.0%) | 2 (6.1%) |
| $12,500 to $14,999 | 1 (2.3%) | 0 (0.0%) |
| $15,000 to $17,499 | 0 (0.0%) | 1 (3.0%) |
| $17,500 to $19,999 | 0 (0.0%) | 0 (0.0%) |
| $20,000 to $22,499 | 0 (0.0%) | 1 (3.0%) |
| $22,500 to $24,999 | 5 (11.4%) | 3 (9.1%) |
| $25,000 to $29,999 | 10 (22.7%) | 7 (21.2%) |
| $30,000 to $34,999 | 1 (2.3%) | 4 (12.1%) |
| $35,000 to $39,999 | 10 (22.7%) | 0 (0.0%) |
| $40,000 to $44,999 | 0 (0.0%) | 0 (0.0%) |
| $45,000 to $49,999 | 0 (0.0%) | 0 (0.0%) |
| $50,000 to $54,999 | 4 (9.1%) | 0 (0.0%) |
| $55,000 to $64,999 | 0 (0.0%) | 3 (9.1%) |
| $65,000 to $74,999 | 7 (15.9%) | 0 (0.0%) |
| $75,000 to $99,999 | 0 (0.0%) | 0 (0.0%) |
| $100,000+ | 0 (0.0%) | 2 (6.1%) |
| Total | 44 (100.0%) | 33 (100.0%) |
Earnings by Sex by Educational Attainment in Hamilton
Average earnings in Hamilton are $30,000 for men and $24,583 for women, a difference of 18.1%. Men with an educational attainment of high school diploma enjoy the highest average annual earnings of $53,750, while those with college or associate's degree education earn the least with $26,125. Women with an educational attainment of high school diploma earn the most with the average annual earnings of $28,036, while those with high school diploma education have the smallest earnings of $28,036.
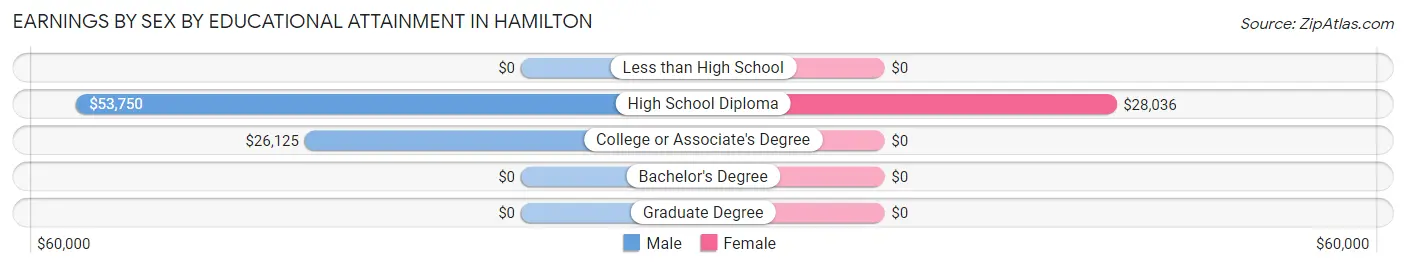
| Educational Attainment | Male Income | Female Income |
| Less than High School | - | - |
| High School Diploma | $53,750 | $28,036 |
| College or Associate's Degree | $26,125 | $0 |
| Bachelor's Degree | - | - |
| Graduate Degree | - | - |
| Total | $30,000 | $24,583 |
Family Income in Hamilton
Family Income Brackets in Hamilton
According to the Hamilton family income data, there are 19 families falling into the $50,000 to $74,999 income range, which is the most common income bracket and makes up 40.4% of all families.
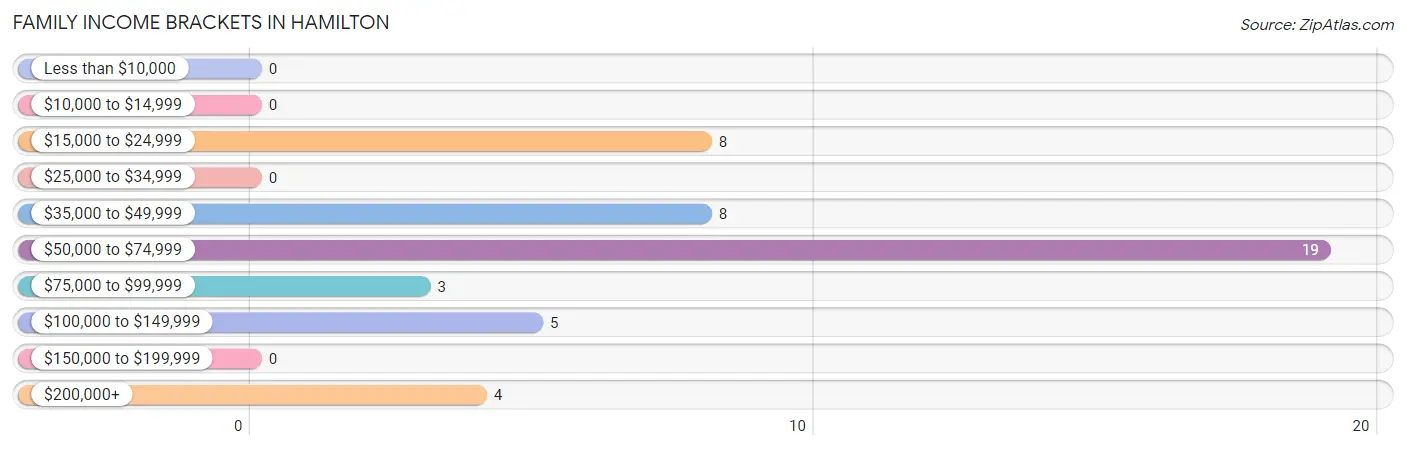
| Income Bracket | # Families | % Families |
| Less than $10,000 | 0 | 0.0% |
| $10,000 to $14,999 | 0 | 0.0% |
| $15,000 to $24,999 | 8 | 17.0% |
| $25,000 to $34,999 | 0 | 0.0% |
| $35,000 to $49,999 | 8 | 17.0% |
| $50,000 to $74,999 | 19 | 40.4% |
| $75,000 to $99,999 | 3 | 6.4% |
| $100,000 to $149,999 | 5 | 10.6% |
| $150,000 to $199,999 | 0 | 0.0% |
| $200,000+ | 4 | 8.5% |
Family Income by Famaliy Size in Hamilton
3-person families (13 | 27.7%) account for the highest median family income in Hamilton with $65,750 per family, while 2-person families (29 | 61.7%) have the highest median income of $28,875 per family member.
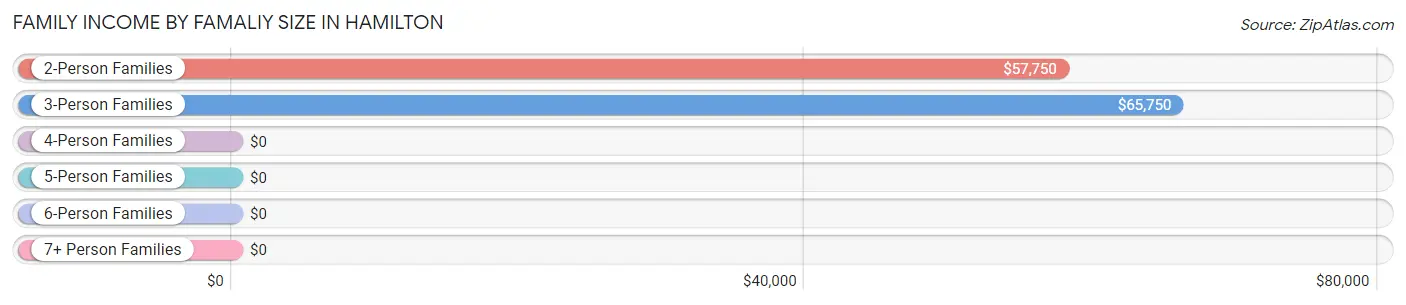
| Income Bracket | # Families | Median Income |
| 2-Person Families | 29 (61.7%) | $57,750 |
| 3-Person Families | 13 (27.7%) | $65,750 |
| 4-Person Families | 1 (2.1%) | $0 |
| 5-Person Families | 4 (8.5%) | $0 |
| 6-Person Families | 0 (0.0%) | $0 |
| 7+ Person Families | 0 (0.0%) | $0 |
| Total | 47 (100.0%) | $59,250 |
Family Income by Number of Earners in Hamilton
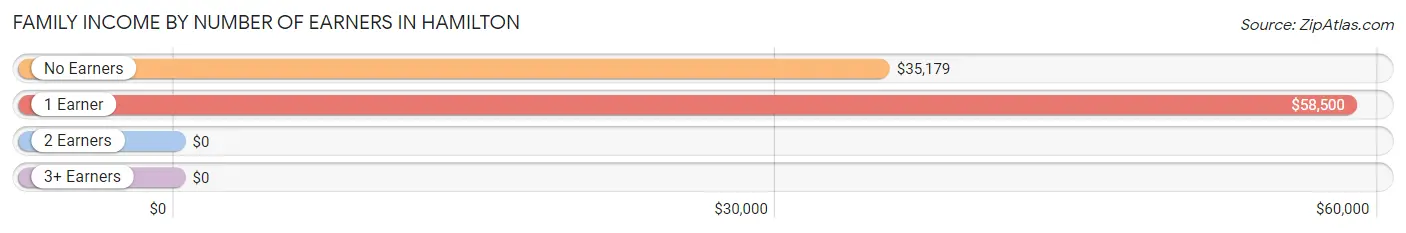
| Number of Earners | # Families | Median Income |
| No Earners | 15 (31.9%) | $35,179 |
| 1 Earner | 14 (29.8%) | $58,500 |
| 2 Earners | 11 (23.4%) | $0 |
| 3+ Earners | 7 (14.9%) | $0 |
| Total | 47 (100.0%) | $59,250 |
Household Income in Hamilton
Household Income Brackets in Hamilton
With 22 households falling in the category, the $15,000 to $24,999 income range is the most frequent in Hamilton, accounting for 27.5% of all households.
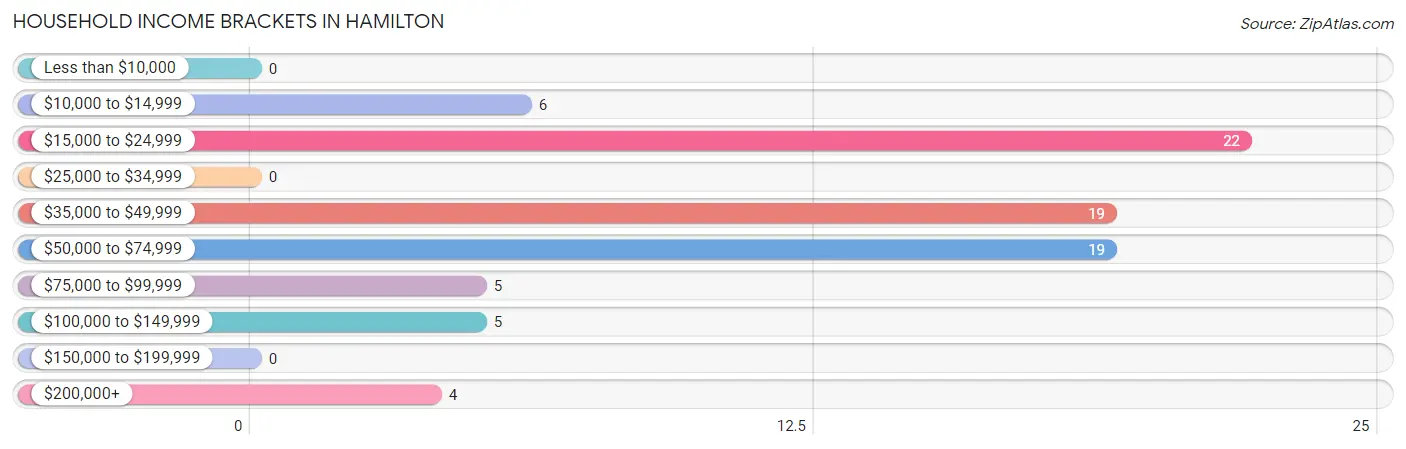
| Income Bracket | # Households | % Households |
| Less than $10,000 | 0 | 0.0% |
| $10,000 to $14,999 | 6 | 7.5% |
| $15,000 to $24,999 | 22 | 27.5% |
| $25,000 to $34,999 | 0 | 0.0% |
| $35,000 to $49,999 | 19 | 23.8% |
| $50,000 to $74,999 | 19 | 23.8% |
| $75,000 to $99,999 | 5 | 6.3% |
| $100,000 to $149,999 | 5 | 6.3% |
| $150,000 to $199,999 | 0 | 0.0% |
| $200,000+ | 4 | 5.0% |
Household Income by Householder Age in Hamilton
The median household income in Hamilton is $41,429, with the highest median household income of $55,938 found in the 45 to 64 years age bracket for the primary householder. A total of 37 households (46.3%) fall into this category.
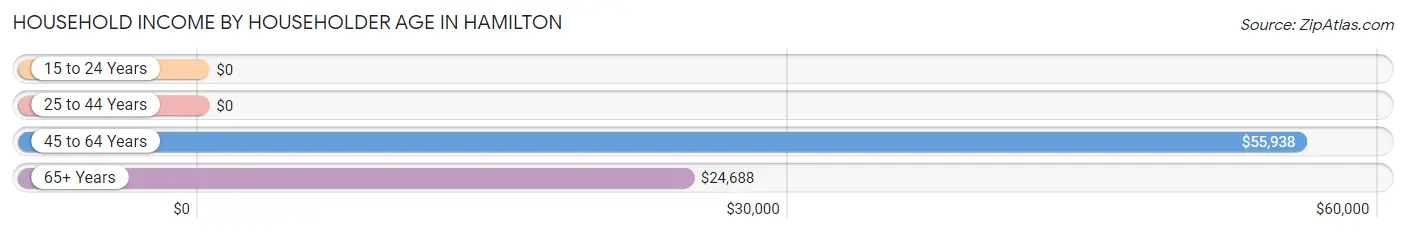
| Income Bracket | # Households | Median Income |
| 15 to 24 Years | 0 (0.0%) | $0 |
| 25 to 44 Years | 4 (5.0%) | $0 |
| 45 to 64 Years | 37 (46.3%) | $55,938 |
| 65+ Years | 39 (48.7%) | $24,688 |
| Total | 80 (100.0%) | $41,429 |
Poverty in Hamilton
Income Below Poverty by Sex and Age in Hamilton
With 5.4% poverty level for males and 12.9% for females among the residents of Hamilton, under 5 year old males and 6 to 11 year old females are the most vulnerable to poverty, with 1 males (100.0%) and 2 females (100.0%) in their respective age groups living below the poverty level.
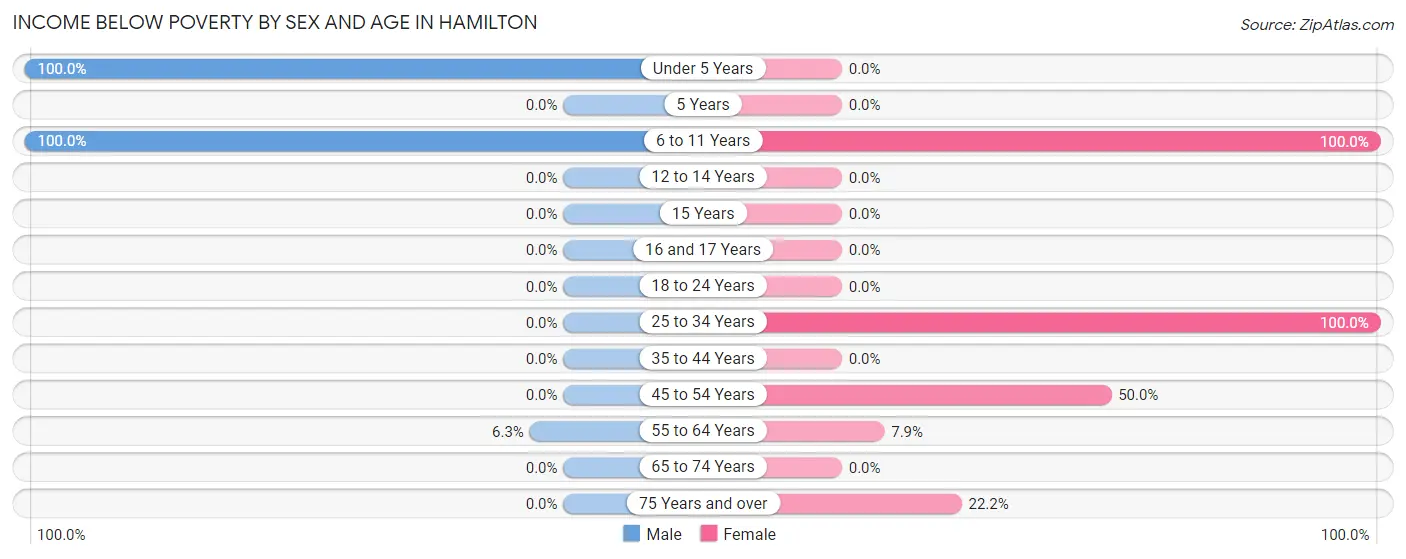
| Age Bracket | Male | Female |
| Under 5 Years | 1 (100.0%) | 0 (0.0%) |
| 5 Years | 0 (0.0%) | 0 (0.0%) |
| 6 to 11 Years | 2 (100.0%) | 2 (100.0%) |
| 12 to 14 Years | 0 (0.0%) | 0 (0.0%) |
| 15 Years | 0 (0.0%) | 0 (0.0%) |
| 16 and 17 Years | 0 (0.0%) | 0 (0.0%) |
| 18 to 24 Years | 0 (0.0%) | 0 (0.0%) |
| 25 to 34 Years | 0 (0.0%) | 1 (100.0%) |
| 35 to 44 Years | 0 (0.0%) | 0 (0.0%) |
| 45 to 54 Years | 0 (0.0%) | 2 (50.0%) |
| 55 to 64 Years | 1 (6.2%) | 3 (7.9%) |
| 65 to 74 Years | 0 (0.0%) | 0 (0.0%) |
| 75 Years and over | 0 (0.0%) | 4 (22.2%) |
| Total | 4 (5.4%) | 12 (12.9%) |
Income Above Poverty by Sex and Age in Hamilton
According to the poverty statistics in Hamilton, males aged 25 to 34 years and females aged 12 to 14 years are the age groups that are most secure financially, with 100.0% of males and 100.0% of females in these age groups living above the poverty line.
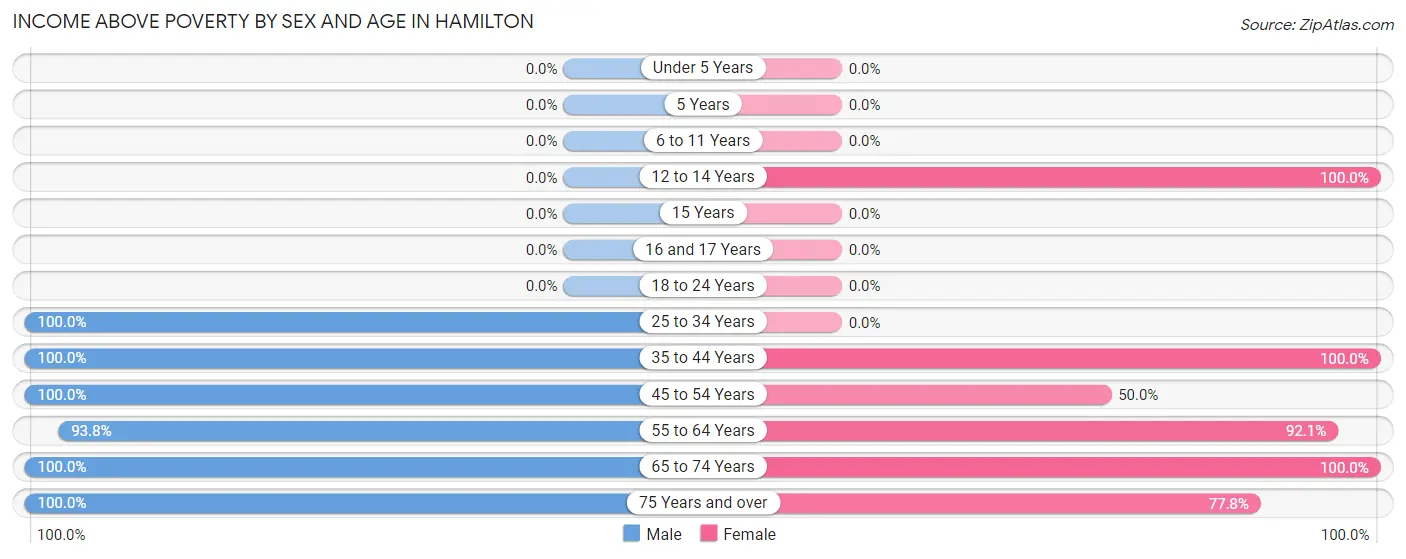
| Age Bracket | Male | Female |
| Under 5 Years | 0 (0.0%) | 0 (0.0%) |
| 5 Years | 0 (0.0%) | 0 (0.0%) |
| 6 to 11 Years | 0 (0.0%) | 0 (0.0%) |
| 12 to 14 Years | 0 (0.0%) | 1 (100.0%) |
| 15 Years | 0 (0.0%) | 0 (0.0%) |
| 16 and 17 Years | 0 (0.0%) | 0 (0.0%) |
| 18 to 24 Years | 0 (0.0%) | 0 (0.0%) |
| 25 to 34 Years | 20 (100.0%) | 0 (0.0%) |
| 35 to 44 Years | 5 (100.0%) | 6 (100.0%) |
| 45 to 54 Years | 1 (100.0%) | 2 (50.0%) |
| 55 to 64 Years | 15 (93.8%) | 35 (92.1%) |
| 65 to 74 Years | 20 (100.0%) | 23 (100.0%) |
| 75 Years and over | 9 (100.0%) | 14 (77.8%) |
| Total | 70 (94.6%) | 81 (87.1%) |
Income Below Poverty Among Married-Couple Families in Hamilton
The poverty statistics for married-couple families in Hamilton show that 2.9% or 1 of the total 35 families live below the poverty line. Families with no children have the highest poverty rate of 3.2%, comprising of 1 families. On the other hand, families with 1 or 2 children have the lowest poverty rate of 0.0%, which includes 0 families.
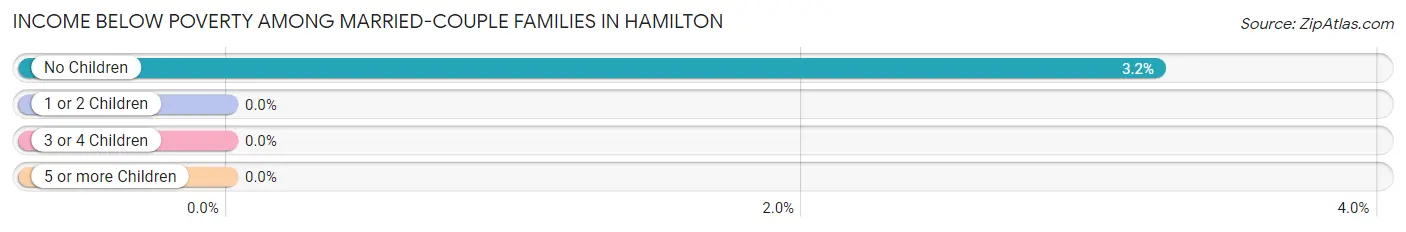
| Children | Above Poverty | Below Poverty |
| No Children | 30 (96.8%) | 1 (3.2%) |
| 1 or 2 Children | 4 (100.0%) | 0 (0.0%) |
| 3 or 4 Children | 0 (0.0%) | 0 (0.0%) |
| 5 or more Children | 0 (0.0%) | 0 (0.0%) |
| Total | 34 (97.1%) | 1 (2.9%) |
Income Below Poverty Among Single-Parent Households in Hamilton
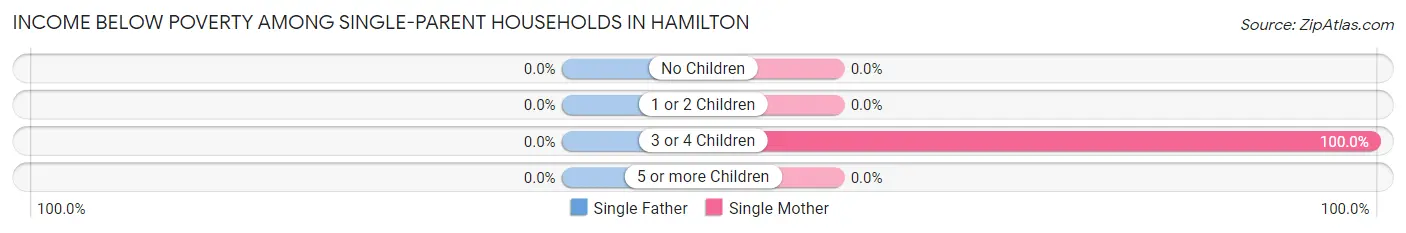
| Children | Single Father | Single Mother |
| No Children | 0 (0.0%) | 0 (0.0%) |
| 1 or 2 Children | 0 (0.0%) | 0 (0.0%) |
| 3 or 4 Children | 0 (0.0%) | 1 (100.0%) |
| 5 or more Children | 0 (0.0%) | 0 (0.0%) |
| Total | 0 (0.0%) | 1 (8.3%) |
Income Below Poverty Among Married-Couple vs Single-Parent Households in Hamilton
The poverty data for Hamilton shows that 1 of the married-couple family households (2.9%) and 1 of the single-parent households (8.3%) are living below the poverty level. Within the married-couple family households, those with no children have the highest poverty rate, with 1 households (3.2%) falling below the poverty line. Among the single-parent households, those with 3 or 4 children have the highest poverty rate, with 1 household (100.0%) living below poverty.
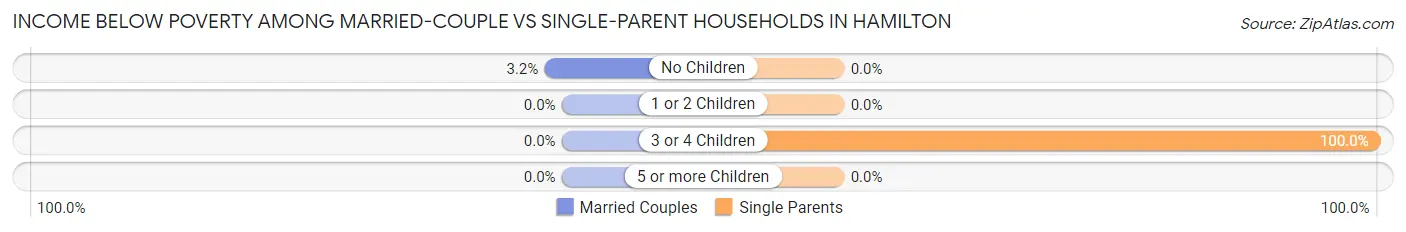
| Children | Married-Couple Families | Single-Parent Households |
| No Children | 1 (3.2%) | 0 (0.0%) |
| 1 or 2 Children | 0 (0.0%) | 0 (0.0%) |
| 3 or 4 Children | 0 (0.0%) | 1 (100.0%) |
| 5 or more Children | 0 (0.0%) | 0 (0.0%) |
| Total | 1 (2.9%) | 1 (8.3%) |
Race in Hamilton
The most populous races in Hamilton are Black / African American (124 | 74.3%), and White / Caucasian (43 | 25.8%).
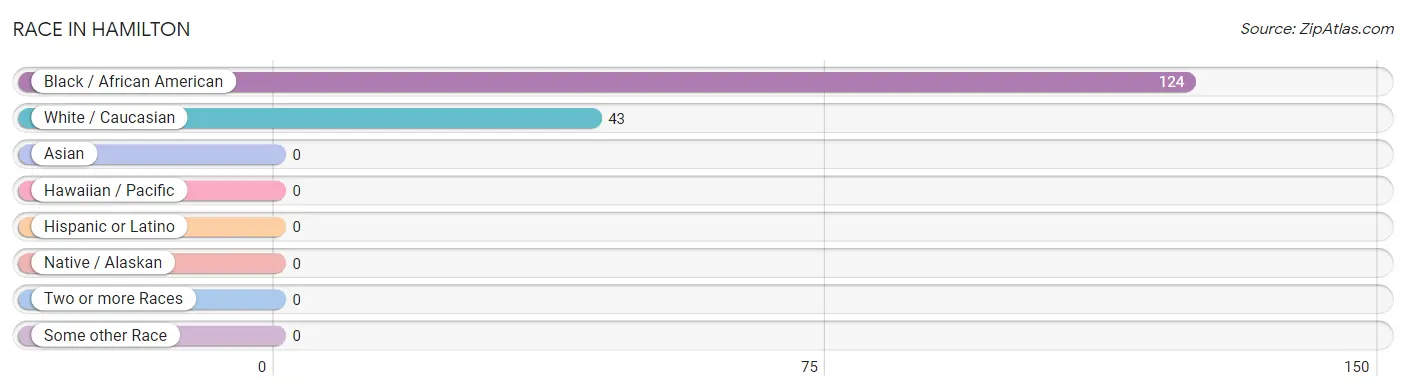
| Race | # Population | % Population |
| Asian | 0 | 0.0% |
| Black / African American | 124 | 74.3% |
| Hawaiian / Pacific | 0 | 0.0% |
| Hispanic or Latino | 0 | 0.0% |
| Native / Alaskan | 0 | 0.0% |
| White / Caucasian | 43 | 25.8% |
| Two or more Races | 0 | 0.0% |
| Some other Race | 0 | 0.0% |
| Total | 167 | 100.0% |
Ancestry in Hamilton
The most populous ancestries reported in Hamilton are English (13 | 7.8%), Irish (9 | 5.4%), American (8 | 4.8%), and German (7 | 4.2%), together accounting for 22.1% of all Hamilton residents.
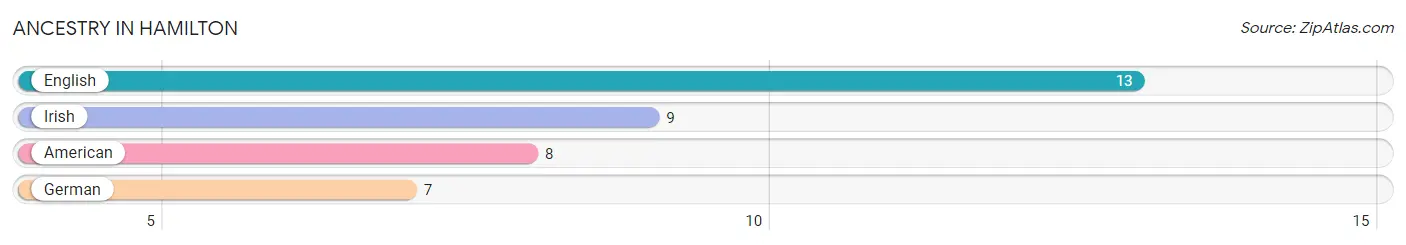
| Ancestry | # Population | % Population |
| American | 8 | 4.8% |
| English | 13 | 7.8% |
| German | 7 | 4.2% |
| Irish | 9 | 5.4% | View All 4 Rows |
Immigrants in Hamilton

| Immigration Origin | # Population | % Population | View All 0 Rows |
Sex and Age in Hamilton
Sex and Age in Hamilton
The most populous age groups in Hamilton are 30 to 34 Years (18 | 24.3%) for men and 60 to 64 Years (21 | 22.6%) for women.

| Age Bracket | Male | Female |
| Under 5 Years | 1 (1.3%) | 0 (0.0%) |
| 5 to 9 Years | 0 (0.0%) | 2 (2.1%) |
| 10 to 14 Years | 2 (2.7%) | 1 (1.1%) |
| 15 to 19 Years | 0 (0.0%) | 0 (0.0%) |
| 20 to 24 Years | 0 (0.0%) | 0 (0.0%) |
| 25 to 29 Years | 2 (2.7%) | 1 (1.1%) |
| 30 to 34 Years | 18 (24.3%) | 0 (0.0%) |
| 35 to 39 Years | 5 (6.8%) | 6 (6.5%) |
| 40 to 44 Years | 0 (0.0%) | 0 (0.0%) |
| 45 to 49 Years | 0 (0.0%) | 0 (0.0%) |
| 50 to 54 Years | 1 (1.3%) | 4 (4.3%) |
| 55 to 59 Years | 2 (2.7%) | 17 (18.3%) |
| 60 to 64 Years | 14 (18.9%) | 21 (22.6%) |
| 65 to 69 Years | 14 (18.9%) | 11 (11.8%) |
| 70 to 74 Years | 6 (8.1%) | 12 (12.9%) |
| 75 to 79 Years | 8 (10.8%) | 4 (4.3%) |
| 80 to 84 Years | 1 (1.3%) | 7 (7.5%) |
| 85 Years and over | 0 (0.0%) | 7 (7.5%) |
| Total | 74 (100.0%) | 93 (100.0%) |
Families and Households in Hamilton
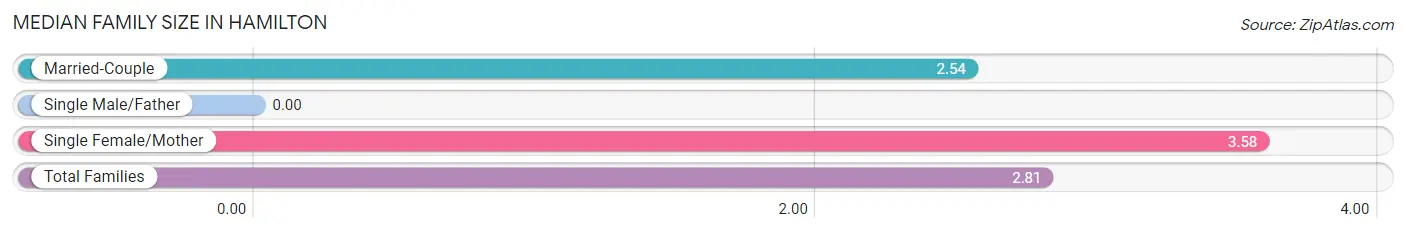
Median Family Size in Hamilton
| Family Type | # Families | Family Size |
| Married-Couple | 35 (74.5%) | 2.54 |
| Single Male/Father | 0 (0.0%) | - |
| Single Female/Mother | 12 (25.5%) | 3.58 |
| Total Families | 47 (100.0%) | 2.81 |
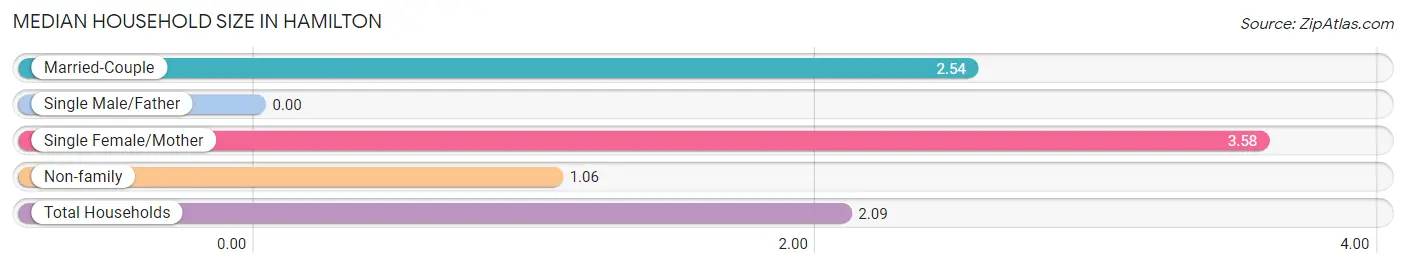
Median Household Size in Hamilton
| Household Type | # Households | Household Size |
| Married-Couple | 35 (43.8%) | 2.54 |
| Single Male/Father | 0 (0.0%) | - |
| Single Female/Mother | 12 (15.0%) | 3.58 |
| Non-family | 33 (41.2%) | 1.06 |
| Total Households | 80 (100.0%) | 2.09 |
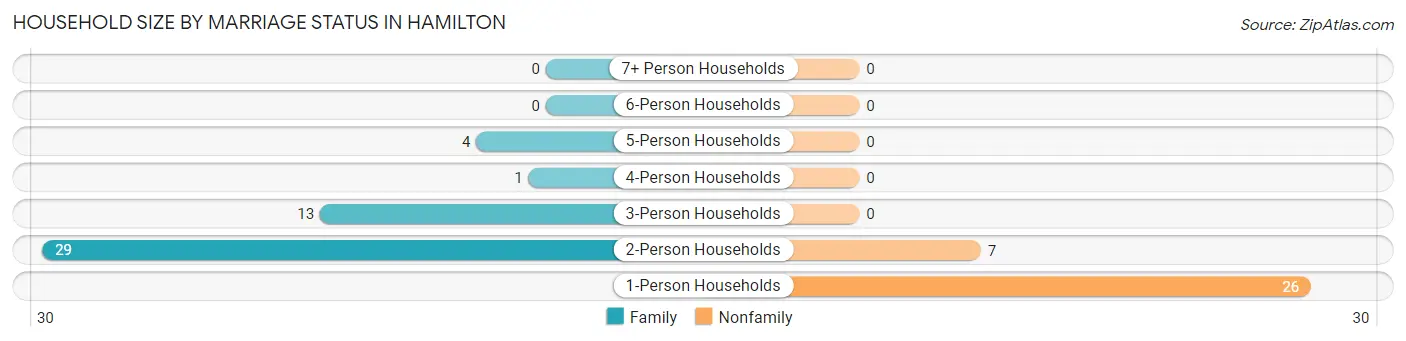
Household Size by Marriage Status in Hamilton
Out of a total of 80 households in Hamilton, 47 (58.8%) are family households, while 33 (41.2%) are nonfamily households. The most numerous type of family households are 2-person households, comprising 29, and the most common type of nonfamily households are 1-person households, comprising 26.
| Household Size | Family Households | Nonfamily Households |
| 1-Person Households | - | 26 (32.5%) |
| 2-Person Households | 29 (36.2%) | 7 (8.7%) |
| 3-Person Households | 13 (16.3%) | 0 (0.0%) |
| 4-Person Households | 1 (1.3%) | 0 (0.0%) |
| 5-Person Households | 4 (5.0%) | 0 (0.0%) |
| 6-Person Households | 0 (0.0%) | 0 (0.0%) |
| 7+ Person Households | 0 (0.0%) | 0 (0.0%) |
| Total | 47 (58.8%) | 33 (41.2%) |
Female Fertility in Hamilton
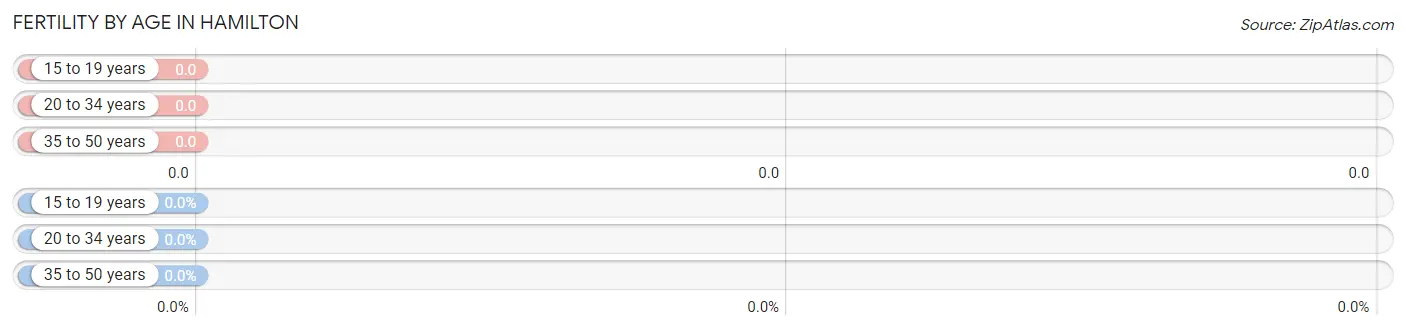
Fertility by Age in Hamilton
| Age Bracket | Women with Births | Births / 1,000 Women |
| 15 to 19 years | 0 (0.0%) | 0.0 |
| 20 to 34 years | 0 (0.0%) | 0.0 |
| 35 to 50 years | 0 (0.0%) | 0.0 |
| Total | 0 (0.0%) | 0.0 |
Fertility by Age by Marriage Status in Hamilton
| Age Bracket | Married | Unmarried |
| 15 to 19 years | 0 (0.0%) | 0 (0.0%) |
| 20 to 34 years | 0 (0.0%) | 0 (0.0%) |
| 35 to 50 years | 0 (0.0%) | 0 (0.0%) |
| Total | 0 (0.0%) | 0 (0.0%) |
Fertility by Education in Hamilton
| Educational Attainment | Women with Births | Births / 1,000 Women |
| Less than High School | 0 (0.0%) | 0.0 |
| High School Diploma | 0 (0.0%) | 0.0 |
| College or Associate's Degree | 0 (0.0%) | 0.0 |
| Bachelor's Degree | 0 (0.0%) | 0.0 |
| Graduate Degree | 0 (0.0%) | 0.0 |
| Total | 0 (0.0%) | 0.0 |
Fertility by Education by Marriage Status in Hamilton
| Educational Attainment | Married | Unmarried |
| Less than High School | 0 (0.0%) | 0 (0.0%) |
| High School Diploma | 0 (0.0%) | 0 (0.0%) |
| College or Associate's Degree | 0 (0.0%) | 0 (0.0%) |
| Bachelor's Degree | 0 (0.0%) | 0 (0.0%) |
| Graduate Degree | 0 (0.0%) | 0 (0.0%) |
| Total | 0 (0.0%) | 0 (0.0%) |
Employment Characteristics in Hamilton
Employment by Class of Employer in Hamilton
Among the 68 employed individuals in Hamilton, private company employees (34 | 50.0%), state government employees (15 | 22.1%), and not-for-profit organizations (11 | 16.2%) make up the most common classes of employment.
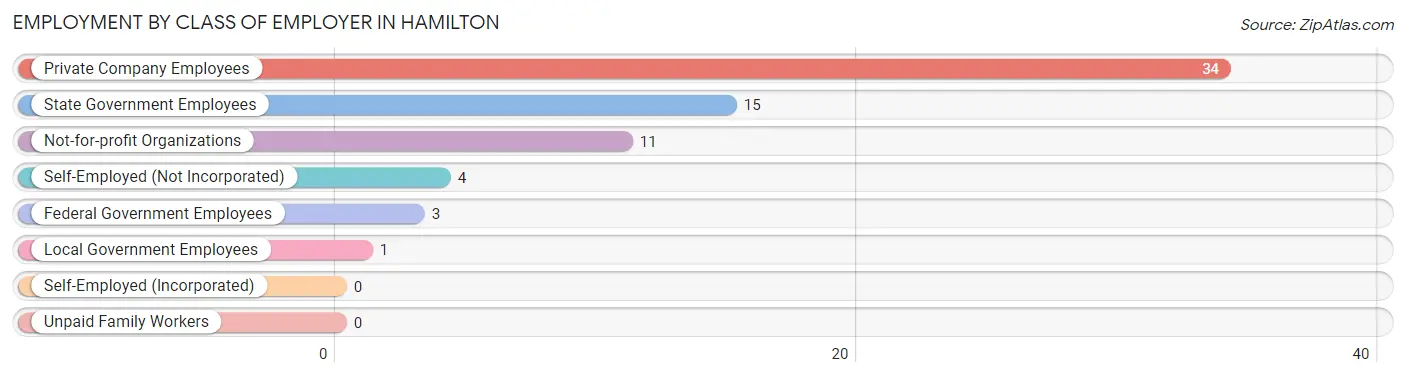
| Employer Class | # Employees | % Employees |
| Private Company Employees | 34 | 50.0% |
| Self-Employed (Incorporated) | 0 | 0.0% |
| Self-Employed (Not Incorporated) | 4 | 5.9% |
| Not-for-profit Organizations | 11 | 16.2% |
| Local Government Employees | 1 | 1.5% |
| State Government Employees | 15 | 22.1% |
| Federal Government Employees | 3 | 4.4% |
| Unpaid Family Workers | 0 | 0.0% |
| Total | 68 | 100.0% |
Employment Status by Age in Hamilton
According to the labor force statistics for Hamilton, out of the total population over 16 years of age (161), 47.2% or 76 individuals are in the labor force, with 7.9% or 6 of them unemployed. The age group with the highest labor force participation rate is 45 to 54 years, with 100.0% or 5 individuals in the labor force. Within the labor force, the 65 to 74 years age range has the highest percentage of unemployed individuals, with 40.0% or 6 of them being unemployed.
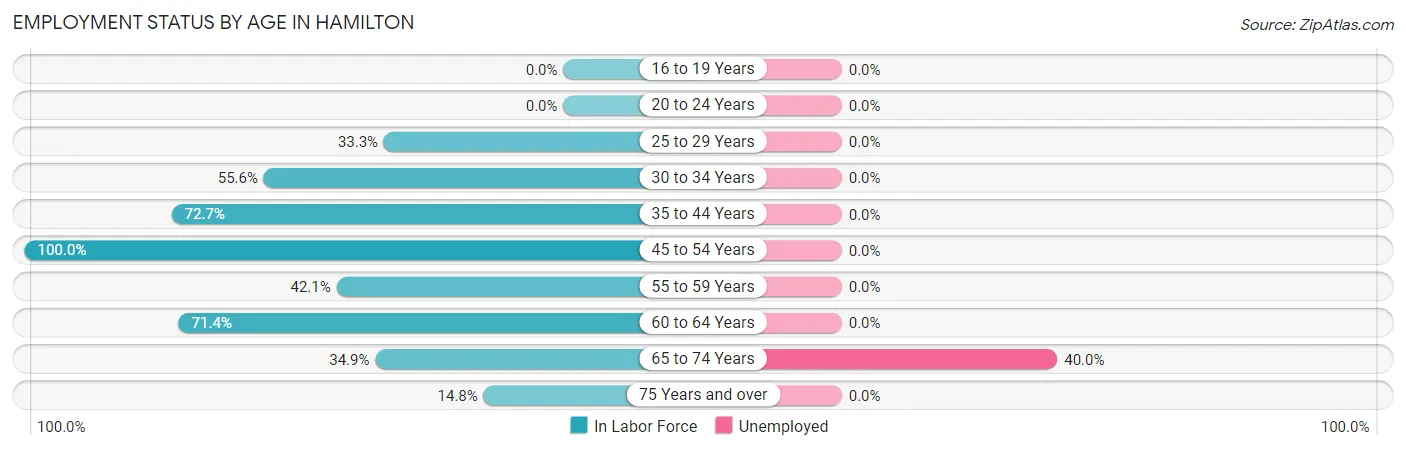
| Age Bracket | In Labor Force | Unemployed |
| 16 to 19 Years | 0 (0.0%) | 0 (0.0%) |
| 20 to 24 Years | 0 (0.0%) | 0 (0.0%) |
| 25 to 29 Years | 1 (33.3%) | 0 (0.0%) |
| 30 to 34 Years | 10 (55.6%) | 0 (0.0%) |
| 35 to 44 Years | 8 (72.7%) | 0 (0.0%) |
| 45 to 54 Years | 5 (100.0%) | 0 (0.0%) |
| 55 to 59 Years | 8 (42.1%) | 0 (0.0%) |
| 60 to 64 Years | 25 (71.4%) | 0 (0.0%) |
| 65 to 74 Years | 15 (34.9%) | 6 (40.0%) |
| 75 Years and over | 4 (14.8%) | 0 (0.0%) |
| Total | 76 (47.2%) | 6 (7.9%) |
Employment Status by Educational Attainment in Hamilton
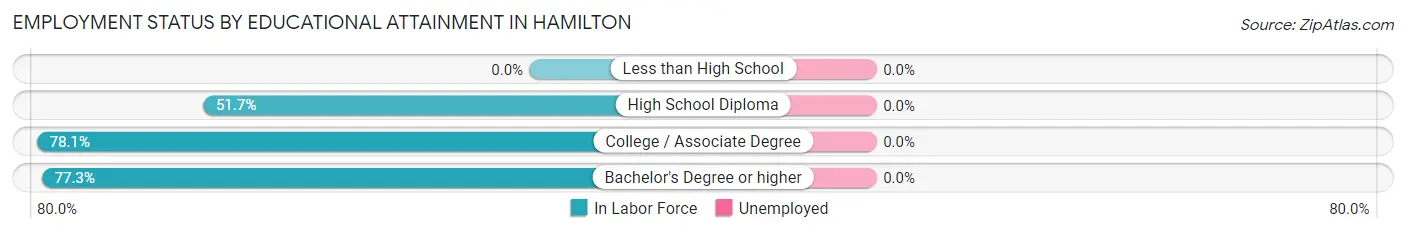
| Educational Attainment | In Labor Force | Unemployed |
| Less than High School | 0 (0.0%) | 0 (0.0%) |
| High School Diploma | 15 (51.7%) | 0 (0.0%) |
| College / Associate Degree | 25 (78.1%) | 0 (0.0%) |
| Bachelor's Degree or higher | 17 (77.3%) | 0 (0.0%) |
| Total | 57 (62.6%) | 0 (0.0%) |
Employment Occupations by Sex in Hamilton
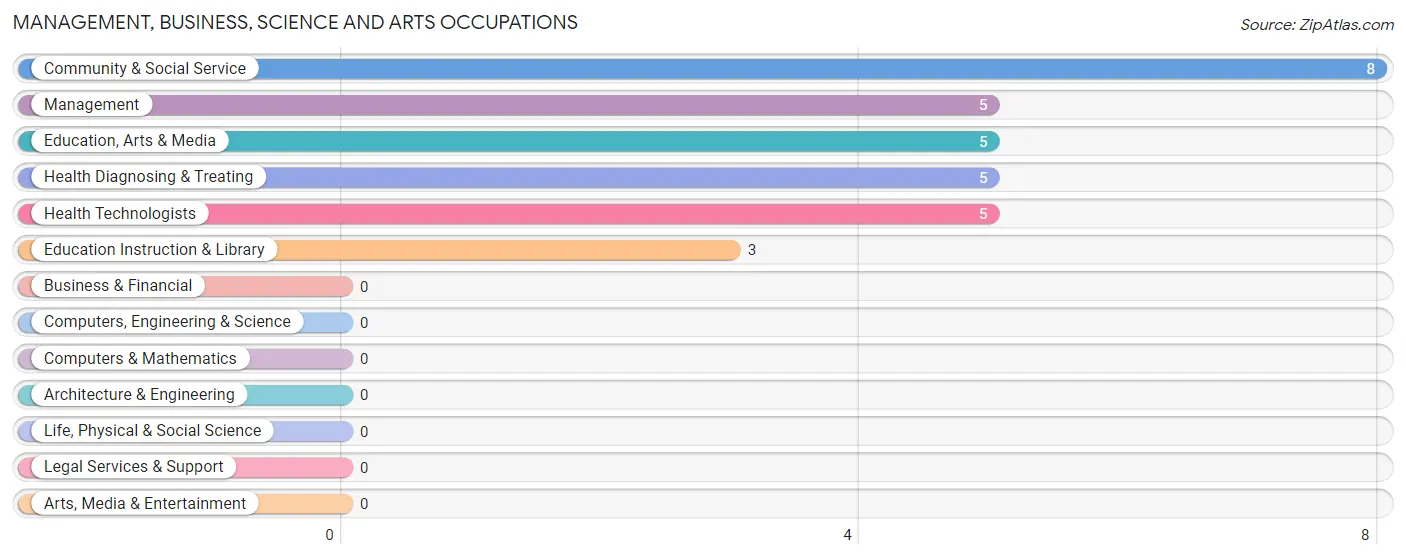
Management, Business, Science and Arts Occupations
The most common Management, Business, Science and Arts occupations in Hamilton are Community & Social Service (8 | 11.4%), Management (5 | 7.1%), Education, Arts & Media (5 | 7.1%), Health Diagnosing & Treating (5 | 7.1%), and Health Technologists (5 | 7.1%).
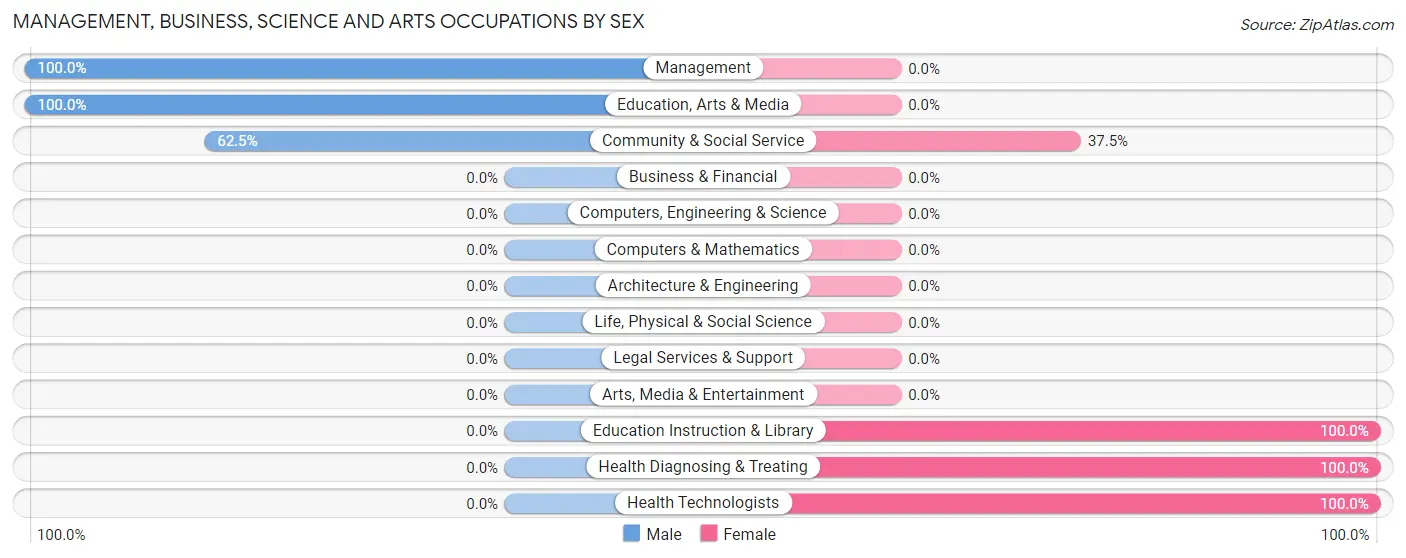
Management, Business, Science and Arts Occupations by Sex
Within the Management, Business, Science and Arts occupations in Hamilton, the most male-oriented occupations are Management (100.0%), Education, Arts & Media (100.0%), and Community & Social Service (62.5%), while the most female-oriented occupations are Education Instruction & Library (100.0%), Health Diagnosing & Treating (100.0%), and Health Technologists (100.0%).
| Occupation | Male | Female |
| Management | 5 (100.0%) | 0 (0.0%) |
| Business & Financial | 0 (0.0%) | 0 (0.0%) |
| Computers, Engineering & Science | 0 (0.0%) | 0 (0.0%) |
| Computers & Mathematics | 0 (0.0%) | 0 (0.0%) |
| Architecture & Engineering | 0 (0.0%) | 0 (0.0%) |
| Life, Physical & Social Science | 0 (0.0%) | 0 (0.0%) |
| Community & Social Service | 5 (62.5%) | 3 (37.5%) |
| Education, Arts & Media | 5 (100.0%) | 0 (0.0%) |
| Legal Services & Support | 0 (0.0%) | 0 (0.0%) |
| Education Instruction & Library | 0 (0.0%) | 3 (100.0%) |
| Arts, Media & Entertainment | 0 (0.0%) | 0 (0.0%) |
| Health Diagnosing & Treating | 0 (0.0%) | 5 (100.0%) |
| Health Technologists | 0 (0.0%) | 5 (100.0%) |
| Total (Category) | 10 (55.6%) | 8 (44.4%) |
| Total (Overall) | 38 (54.3%) | 32 (45.7%) |
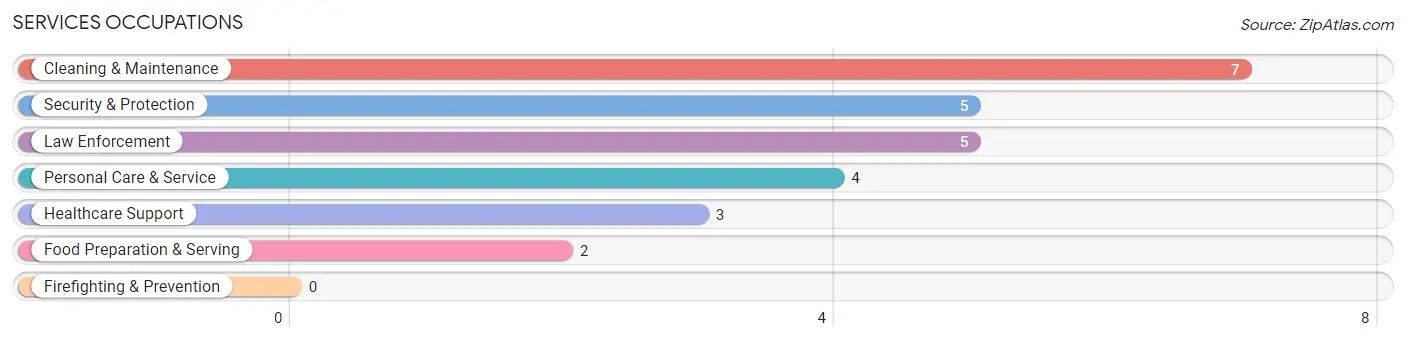
Services Occupations
The most common Services occupations in Hamilton are Cleaning & Maintenance (7 | 10.0%), Security & Protection (5 | 7.1%), Law Enforcement (5 | 7.1%), Personal Care & Service (4 | 5.7%), and Healthcare Support (3 | 4.3%).
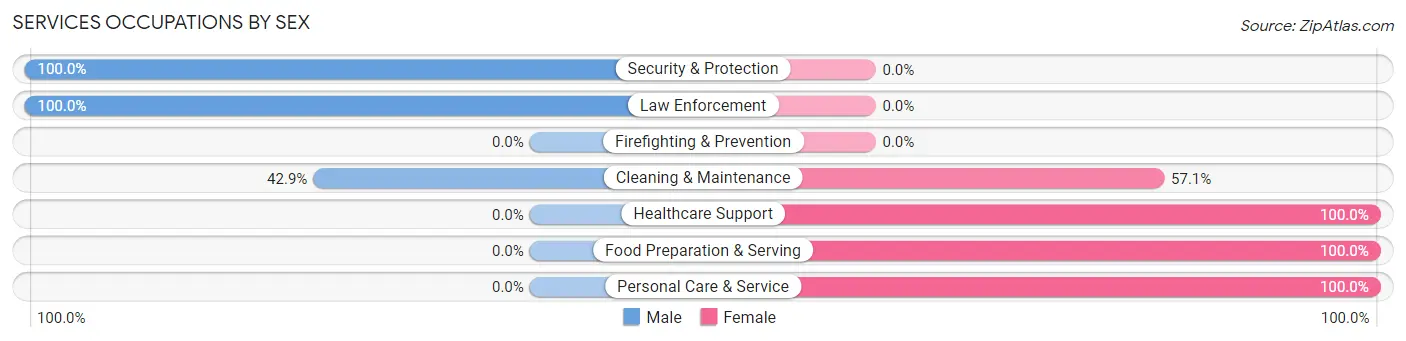
Services Occupations by Sex
Within the Services occupations in Hamilton, the most male-oriented occupations are Security & Protection (100.0%), Law Enforcement (100.0%), and Cleaning & Maintenance (42.9%), while the most female-oriented occupations are Healthcare Support (100.0%), Food Preparation & Serving (100.0%), and Personal Care & Service (100.0%).
| Occupation | Male | Female |
| Healthcare Support | 0 (0.0%) | 3 (100.0%) |
| Security & Protection | 5 (100.0%) | 0 (0.0%) |
| Firefighting & Prevention | 0 (0.0%) | 0 (0.0%) |
| Law Enforcement | 5 (100.0%) | 0 (0.0%) |
| Food Preparation & Serving | 0 (0.0%) | 2 (100.0%) |
| Cleaning & Maintenance | 3 (42.9%) | 4 (57.1%) |
| Personal Care & Service | 0 (0.0%) | 4 (100.0%) |
| Total (Category) | 8 (38.1%) | 13 (61.9%) |
| Total (Overall) | 38 (54.3%) | 32 (45.7%) |
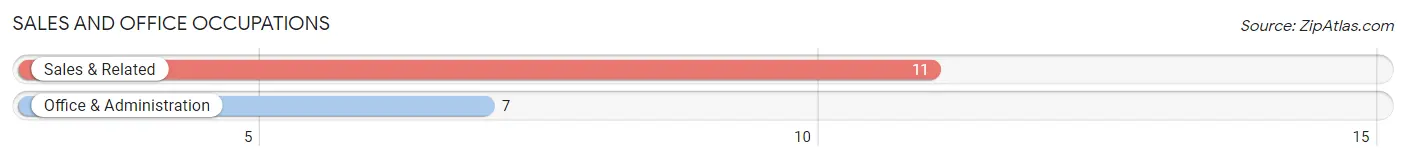
Sales and Office Occupations
The most common Sales and Office occupations in Hamilton are Sales & Related (11 | 15.7%), and Office & Administration (7 | 10.0%).
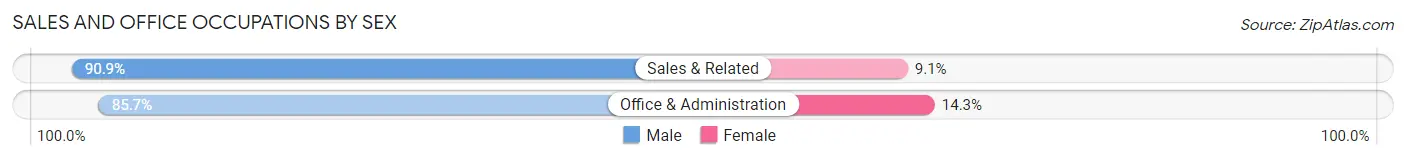
Sales and Office Occupations by Sex
| Occupation | Male | Female |
| Sales & Related | 10 (90.9%) | 1 (9.1%) |
| Office & Administration | 6 (85.7%) | 1 (14.3%) |
| Total (Category) | 16 (88.9%) | 2 (11.1%) |
| Total (Overall) | 38 (54.3%) | 32 (45.7%) |
Natural Resources, Construction and Maintenance Occupations
Natural Resources, Construction and Maintenance Occupations by Sex
| Occupation | Male | Female |
| Farming, Fishing & Forestry | 0 (0.0%) | 0 (0.0%) |
| Construction & Extraction | 0 (0.0%) | 0 (0.0%) |
| Installation, Maintenance & Repair | 0 (0.0%) | 0 (0.0%) |
| Total (Category) | 0 (0.0%) | 0 (0.0%) |
| Total (Overall) | 38 (54.3%) | 32 (45.7%) |
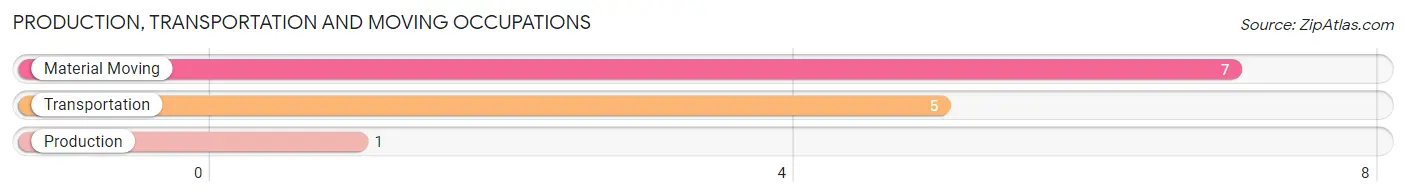
Production, Transportation and Moving Occupations
The most common Production, Transportation and Moving occupations in Hamilton are Material Moving (7 | 10.0%), Transportation (5 | 7.1%), and Production (1 | 1.4%).
Production, Transportation and Moving Occupations by Sex
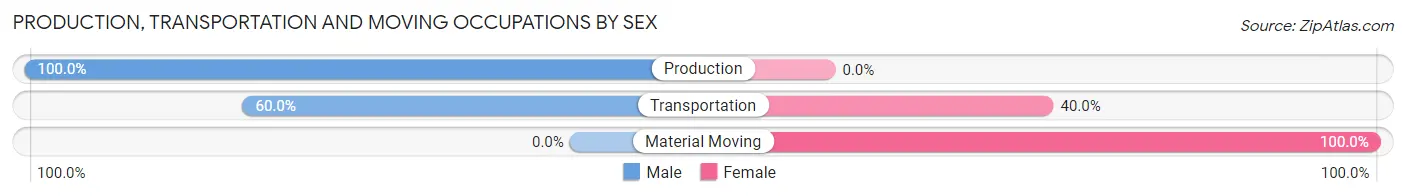
| Occupation | Male | Female |
| Production | 1 (100.0%) | 0 (0.0%) |
| Transportation | 3 (60.0%) | 2 (40.0%) |
| Material Moving | 0 (0.0%) | 7 (100.0%) |
| Total (Category) | 4 (30.8%) | 9 (69.2%) |
| Total (Overall) | 38 (54.3%) | 32 (45.7%) |
Employment Industries by Sex in Hamilton
Employment Industries in Hamilton
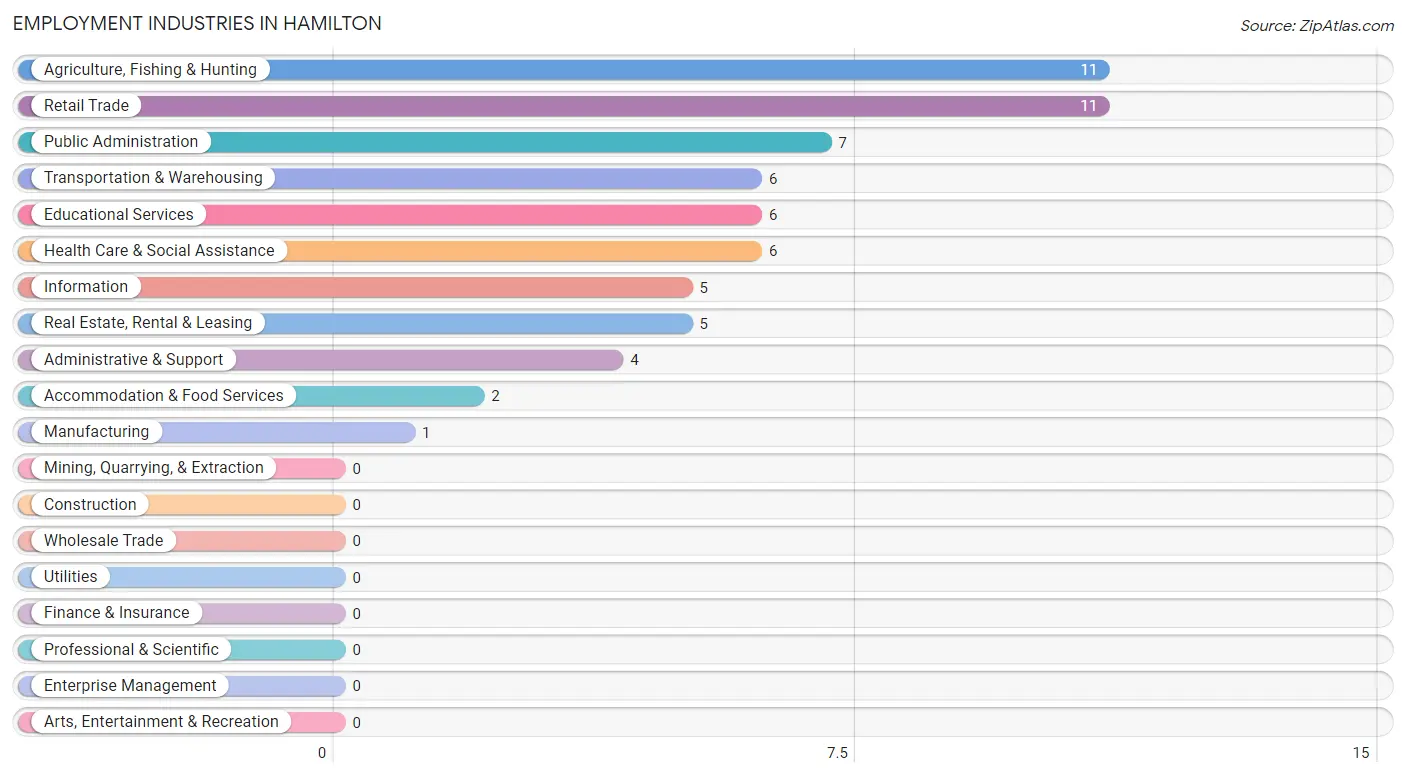
The major employment industries in Hamilton include Agriculture, Fishing & Hunting (11 | 15.7%), Retail Trade (11 | 15.7%), Public Administration (7 | 10.0%), Transportation & Warehousing (6 | 8.6%), and Educational Services (6 | 8.6%).
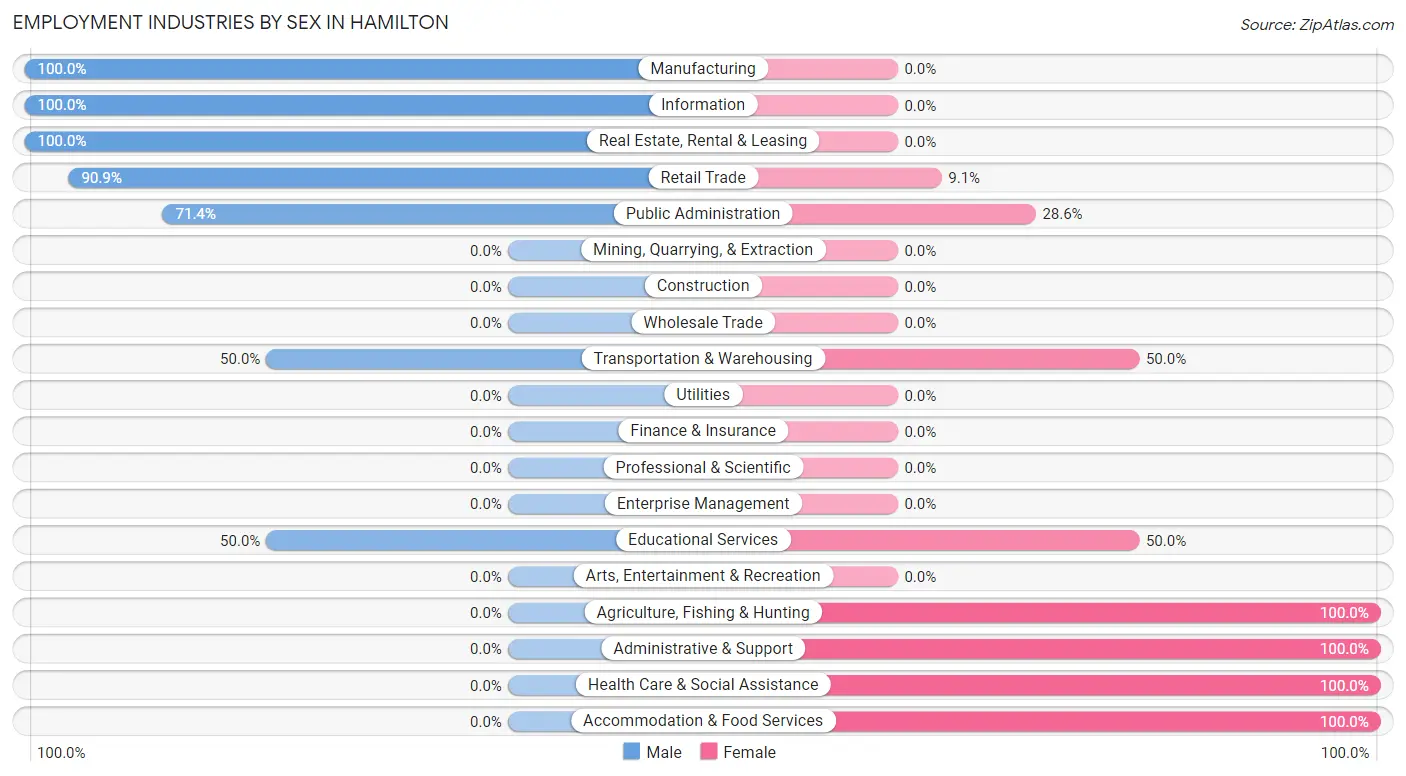
Employment Industries by Sex in Hamilton
The Hamilton industries that see more men than women are Manufacturing (100.0%), Information (100.0%), and Real Estate, Rental & Leasing (100.0%), whereas the industries that tend to have a higher number of women are Agriculture, Fishing & Hunting (100.0%), Administrative & Support (100.0%), and Health Care & Social Assistance (100.0%).
| Industry | Male | Female |
| Agriculture, Fishing & Hunting | 0 (0.0%) | 11 (100.0%) |
| Mining, Quarrying, & Extraction | 0 (0.0%) | 0 (0.0%) |
| Construction | 0 (0.0%) | 0 (0.0%) |
| Manufacturing | 1 (100.0%) | 0 (0.0%) |
| Wholesale Trade | 0 (0.0%) | 0 (0.0%) |
| Retail Trade | 10 (90.9%) | 1 (9.1%) |
| Transportation & Warehousing | 3 (50.0%) | 3 (50.0%) |
| Utilities | 0 (0.0%) | 0 (0.0%) |
| Information | 5 (100.0%) | 0 (0.0%) |
| Finance & Insurance | 0 (0.0%) | 0 (0.0%) |
| Real Estate, Rental & Leasing | 5 (100.0%) | 0 (0.0%) |
| Professional & Scientific | 0 (0.0%) | 0 (0.0%) |
| Enterprise Management | 0 (0.0%) | 0 (0.0%) |
| Administrative & Support | 0 (0.0%) | 4 (100.0%) |
| Educational Services | 3 (50.0%) | 3 (50.0%) |
| Health Care & Social Assistance | 0 (0.0%) | 6 (100.0%) |
| Arts, Entertainment & Recreation | 0 (0.0%) | 0 (0.0%) |
| Accommodation & Food Services | 0 (0.0%) | 2 (100.0%) |
| Public Administration | 5 (71.4%) | 2 (28.6%) |
| Total | 38 (54.3%) | 32 (45.7%) |
Education in Hamilton
School Enrollment in Hamilton
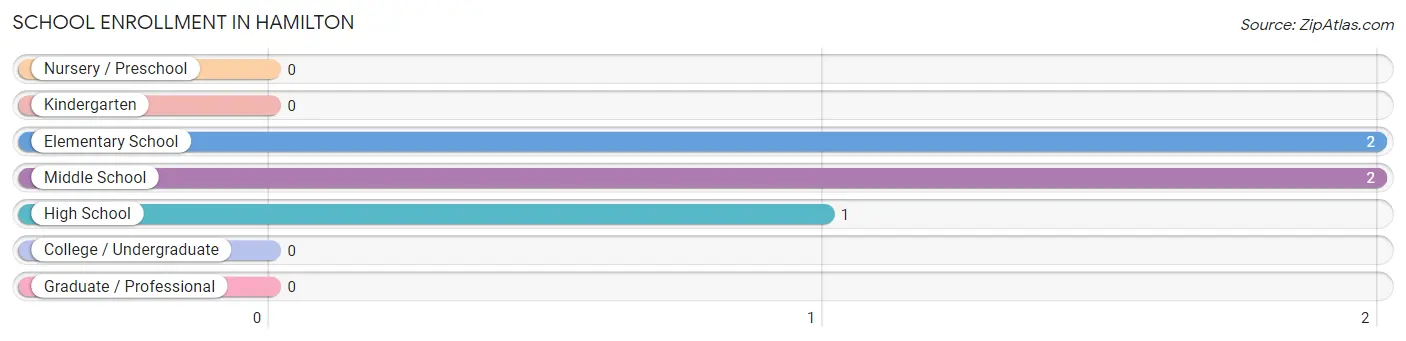
The most common levels of schooling among the 5 students in Hamilton are elementary school (2 | 40.0%), middle school (2 | 40.0%), and high school (1 | 20.0%).
| School Level | # Students | % Students |
| Nursery / Preschool | 0 | 0.0% |
| Kindergarten | 0 | 0.0% |
| Elementary School | 2 | 40.0% |
| Middle School | 2 | 40.0% |
| High School | 1 | 20.0% |
| College / Undergraduate | 0 | 0.0% |
| Graduate / Professional | 0 | 0.0% |
| Total | 5 | 100.0% |
School Enrollment by Age by Funding Source in Hamilton
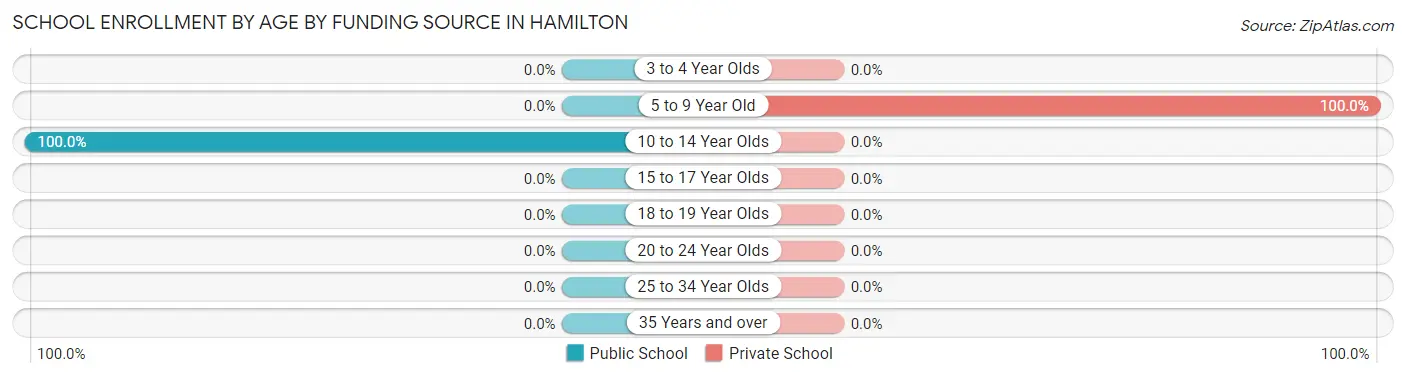
Out of a total of 5 students who are enrolled in schools in Hamilton, 2 (40.0%) attend a private institution, while the remaining 3 (60.0%) are enrolled in public schools. The age group of 5 to 9 year old has the highest likelihood of being enrolled in private schools, with 2 (100.0% in the age bracket) enrolled. Conversely, the age group of 10 to 14 year olds has the lowest likelihood of being enrolled in a private school, with 3 (100.0% in the age bracket) attending a public institution.
| Age Bracket | Public School | Private School |
| 3 to 4 Year Olds | 0 (0.0%) | 0 (0.0%) |
| 5 to 9 Year Old | 0 (0.0%) | 2 (100.0%) |
| 10 to 14 Year Olds | 3 (100.0%) | 0 (0.0%) |
| 15 to 17 Year Olds | 0 (0.0%) | 0 (0.0%) |
| 18 to 19 Year Olds | 0 (0.0%) | 0 (0.0%) |
| 20 to 24 Year Olds | 0 (0.0%) | 0 (0.0%) |
| 25 to 34 Year Olds | 0 (0.0%) | 0 (0.0%) |
| 35 Years and over | 0 (0.0%) | 0 (0.0%) |
| Total | 3 (60.0%) | 2 (40.0%) |
Educational Attainment by Field of Study in Hamilton
Literature & languages (5 | 22.7%), arts & humanities (4 | 18.2%), science & technology (3 | 13.6%), business (3 | 13.6%), and communications (3 | 13.6%) are the most common fields of study among 22 individuals in Hamilton who have obtained a bachelor's degree or higher.
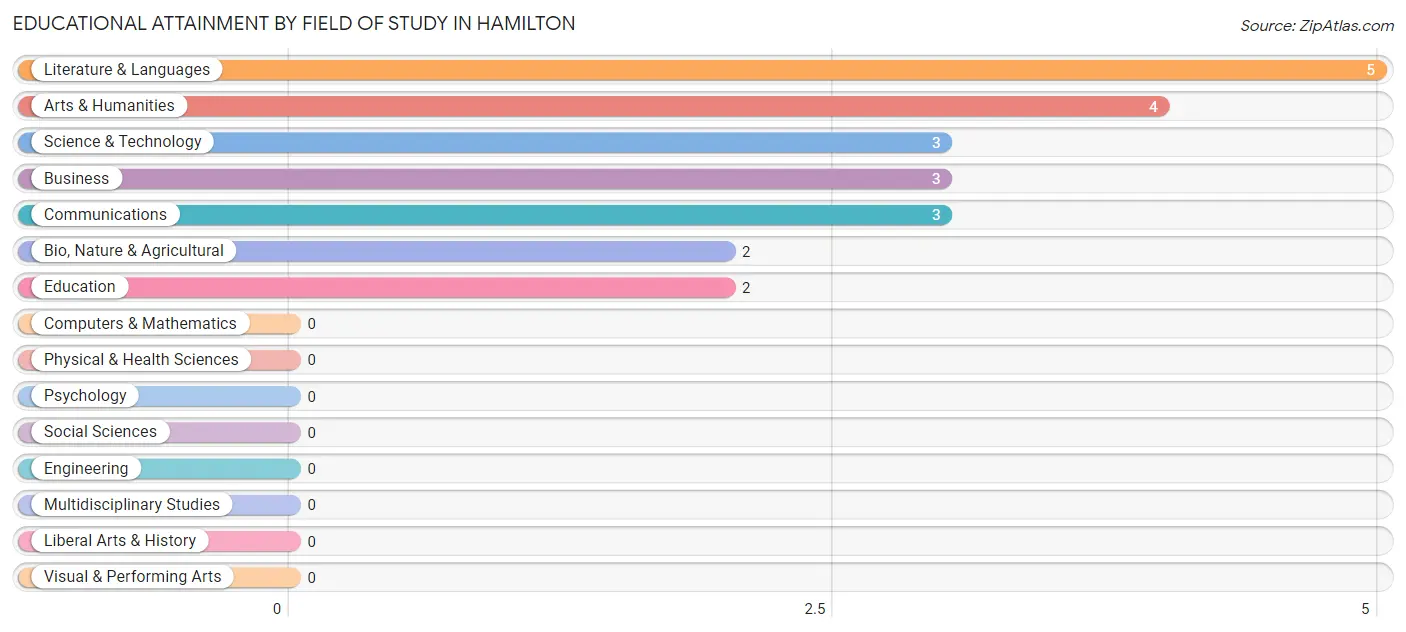
| Field of Study | # Graduates | % Graduates |
| Computers & Mathematics | 0 | 0.0% |
| Bio, Nature & Agricultural | 2 | 9.1% |
| Physical & Health Sciences | 0 | 0.0% |
| Psychology | 0 | 0.0% |
| Social Sciences | 0 | 0.0% |
| Engineering | 0 | 0.0% |
| Multidisciplinary Studies | 0 | 0.0% |
| Science & Technology | 3 | 13.6% |
| Business | 3 | 13.6% |
| Education | 2 | 9.1% |
| Literature & Languages | 5 | 22.7% |
| Liberal Arts & History | 0 | 0.0% |
| Visual & Performing Arts | 0 | 0.0% |
| Communications | 3 | 13.6% |
| Arts & Humanities | 4 | 18.2% |
| Total | 22 | 100.0% |
Transportation & Commute in Hamilton
Vehicle Availability by Sex in Hamilton
The most prevalent vehicle ownership categories in Hamilton are males with 3 vehicles (21, accounting for 55.3%) and females with 3 vehicles (0, making up 70.0%).
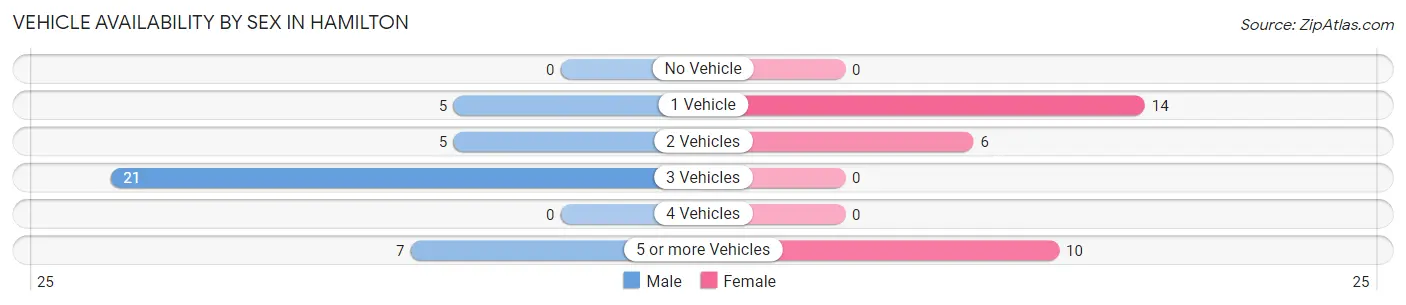
| Vehicles Available | Male | Female |
| No Vehicle | 0 (0.0%) | 0 (0.0%) |
| 1 Vehicle | 5 (13.2%) | 14 (46.7%) |
| 2 Vehicles | 5 (13.2%) | 6 (20.0%) |
| 3 Vehicles | 21 (55.3%) | 0 (0.0%) |
| 4 Vehicles | 0 (0.0%) | 0 (0.0%) |
| 5 or more Vehicles | 7 (18.4%) | 10 (33.3%) |
| Total | 38 (100.0%) | 30 (100.0%) |
Commute Time in Hamilton
The most frequently occuring commute durations in Hamilton are 30 to 34 minutes (14 commuters, 21.9%), 60 to 89 minutes (14 commuters, 21.9%), and 5 to 9 minutes (8 commuters, 12.5%).
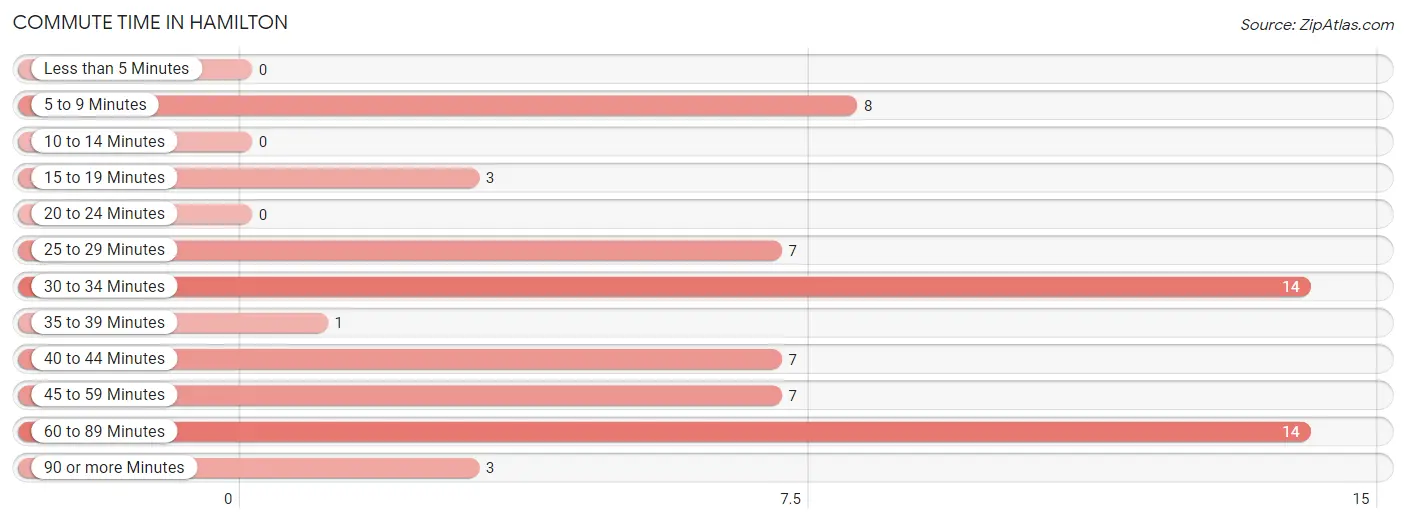
| Commute Time | # Commuters | % Commuters |
| Less than 5 Minutes | 0 | 0.0% |
| 5 to 9 Minutes | 8 | 12.5% |
| 10 to 14 Minutes | 0 | 0.0% |
| 15 to 19 Minutes | 3 | 4.7% |
| 20 to 24 Minutes | 0 | 0.0% |
| 25 to 29 Minutes | 7 | 10.9% |
| 30 to 34 Minutes | 14 | 21.9% |
| 35 to 39 Minutes | 1 | 1.6% |
| 40 to 44 Minutes | 7 | 10.9% |
| 45 to 59 Minutes | 7 | 10.9% |
| 60 to 89 Minutes | 14 | 21.9% |
| 90 or more Minutes | 3 | 4.7% |
Commute Time by Sex in Hamilton
The most common commute times in Hamilton are 60 to 89 minutes (14 commuters, 36.8%) for males and 25 to 29 minutes (7 commuters, 26.9%) for females.
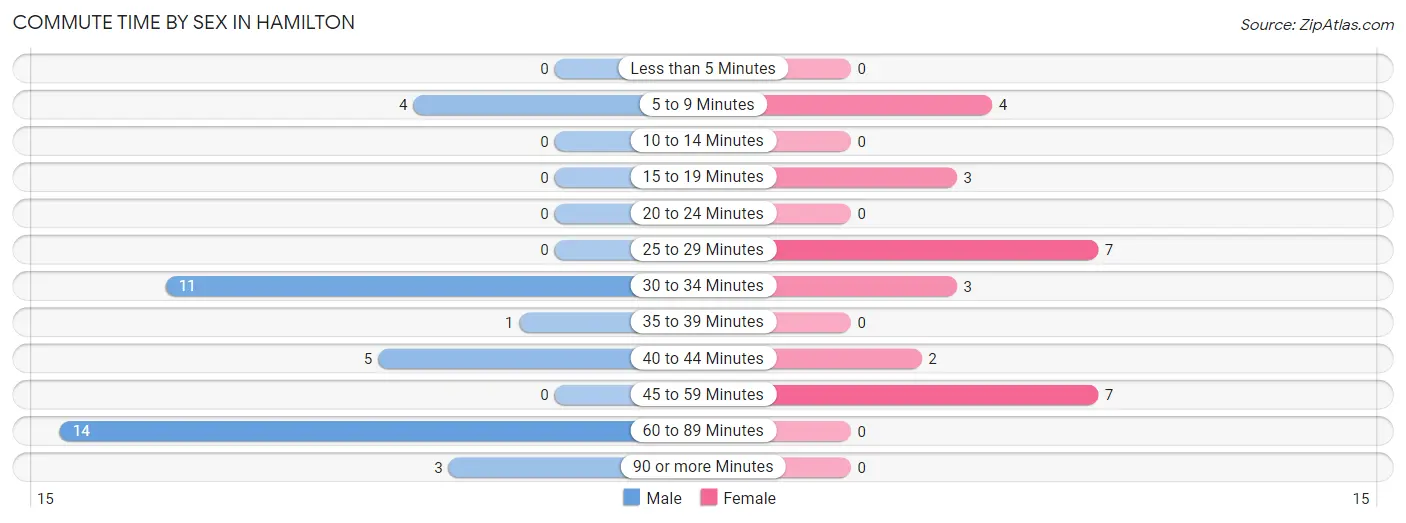
| Commute Time | Male | Female |
| Less than 5 Minutes | 0 (0.0%) | 0 (0.0%) |
| 5 to 9 Minutes | 4 (10.5%) | 4 (15.4%) |
| 10 to 14 Minutes | 0 (0.0%) | 0 (0.0%) |
| 15 to 19 Minutes | 0 (0.0%) | 3 (11.5%) |
| 20 to 24 Minutes | 0 (0.0%) | 0 (0.0%) |
| 25 to 29 Minutes | 0 (0.0%) | 7 (26.9%) |
| 30 to 34 Minutes | 11 (28.9%) | 3 (11.5%) |
| 35 to 39 Minutes | 1 (2.6%) | 0 (0.0%) |
| 40 to 44 Minutes | 5 (13.2%) | 2 (7.7%) |
| 45 to 59 Minutes | 0 (0.0%) | 7 (26.9%) |
| 60 to 89 Minutes | 14 (36.8%) | 0 (0.0%) |
| 90 or more Minutes | 3 (7.9%) | 0 (0.0%) |
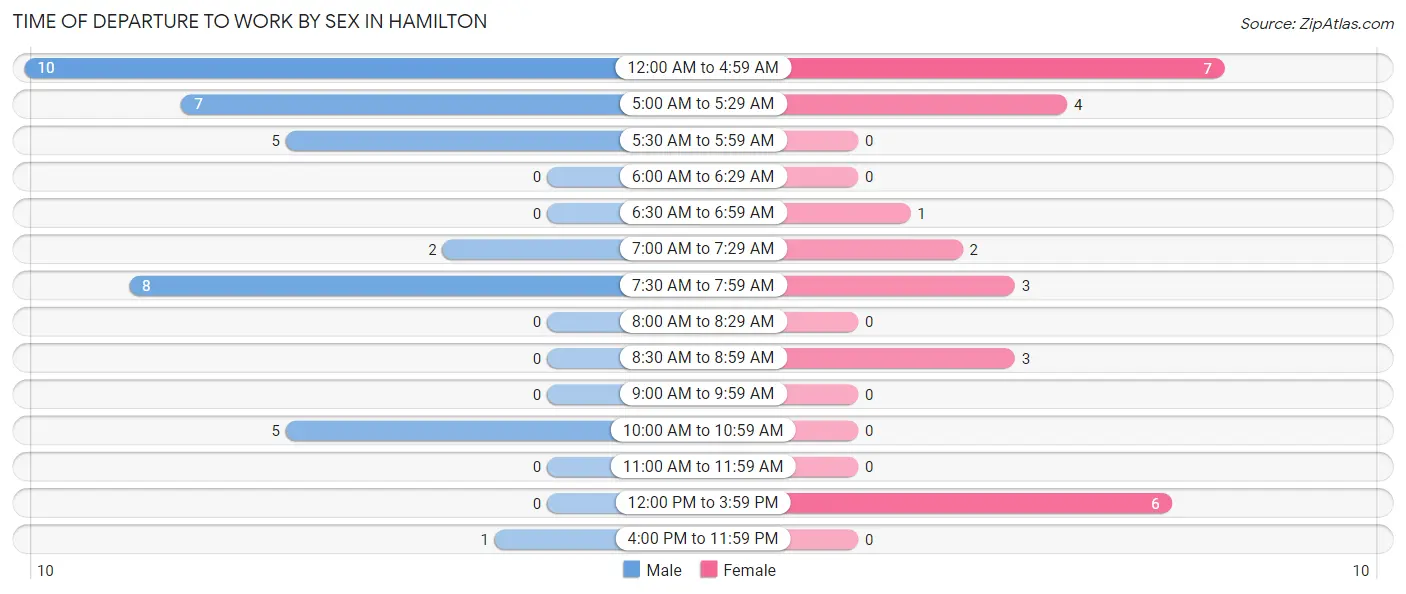
Time of Departure to Work by Sex in Hamilton
The most frequent times of departure to work in Hamilton are 12:00 AM to 4:59 AM (10, 26.3%) for males and 12:00 AM to 4:59 AM (7, 26.9%) for females.
| Time of Departure | Male | Female |
| 12:00 AM to 4:59 AM | 10 (26.3%) | 7 (26.9%) |
| 5:00 AM to 5:29 AM | 7 (18.4%) | 4 (15.4%) |
| 5:30 AM to 5:59 AM | 5 (13.2%) | 0 (0.0%) |
| 6:00 AM to 6:29 AM | 0 (0.0%) | 0 (0.0%) |
| 6:30 AM to 6:59 AM | 0 (0.0%) | 1 (3.8%) |
| 7:00 AM to 7:29 AM | 2 (5.3%) | 2 (7.7%) |
| 7:30 AM to 7:59 AM | 8 (21.0%) | 3 (11.5%) |
| 8:00 AM to 8:29 AM | 0 (0.0%) | 0 (0.0%) |
| 8:30 AM to 8:59 AM | 0 (0.0%) | 3 (11.5%) |
| 9:00 AM to 9:59 AM | 0 (0.0%) | 0 (0.0%) |
| 10:00 AM to 10:59 AM | 5 (13.2%) | 0 (0.0%) |
| 11:00 AM to 11:59 AM | 0 (0.0%) | 0 (0.0%) |
| 12:00 PM to 3:59 PM | 0 (0.0%) | 6 (23.1%) |
| 4:00 PM to 11:59 PM | 1 (2.6%) | 0 (0.0%) |
| Total | 38 (100.0%) | 26 (100.0%) |
Housing Occupancy in Hamilton
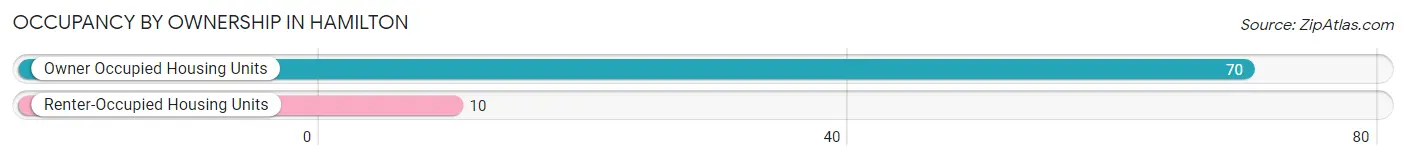
Occupancy by Ownership in Hamilton
Of the total 80 dwellings in Hamilton, owner-occupied units account for 70 (87.5%), while renter-occupied units make up 10 (12.5%).
| Occupancy | # Housing Units | % Housing Units |
| Owner Occupied Housing Units | 70 | 87.5% |
| Renter-Occupied Housing Units | 10 | 12.5% |
| Total Occupied Housing Units | 80 | 100.0% |
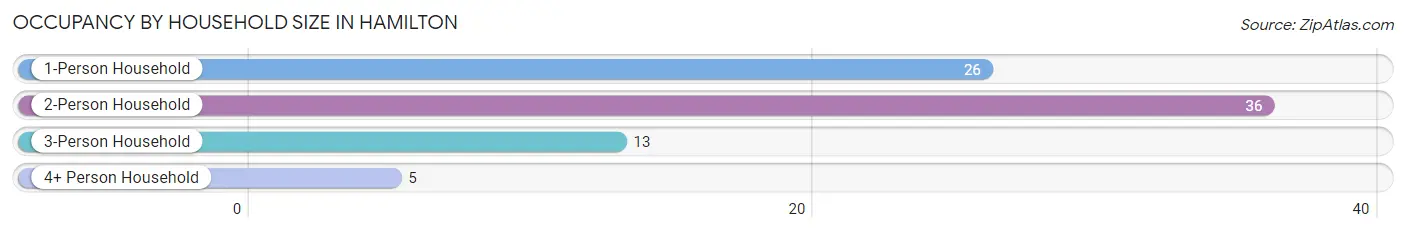
Occupancy by Household Size in Hamilton
| Household Size | # Housing Units | % Housing Units |
| 1-Person Household | 26 | 32.5% |
| 2-Person Household | 36 | 45.0% |
| 3-Person Household | 13 | 16.3% |
| 4+ Person Household | 5 | 6.2% |
| Total Housing Units | 80 | 100.0% |
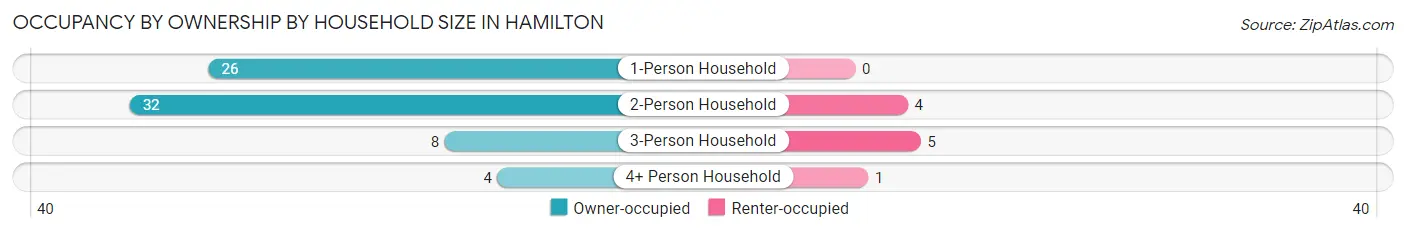
Occupancy by Ownership by Household Size in Hamilton
| Household Size | Owner-occupied | Renter-occupied |
| 1-Person Household | 26 (100.0%) | 0 (0.0%) |
| 2-Person Household | 32 (88.9%) | 4 (11.1%) |
| 3-Person Household | 8 (61.5%) | 5 (38.5%) |
| 4+ Person Household | 4 (80.0%) | 1 (20.0%) |
| Total Housing Units | 70 (87.5%) | 10 (12.5%) |
Occupancy by Educational Attainment in Hamilton
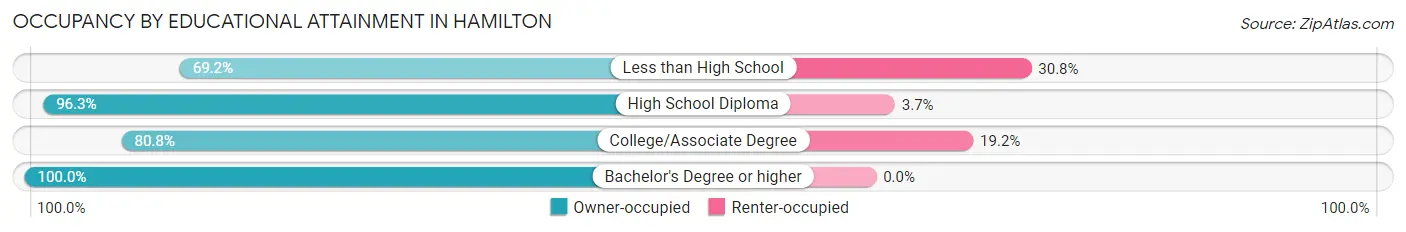
| Household Size | Owner-occupied | Renter-occupied |
| Less than High School | 9 (69.2%) | 4 (30.8%) |
| High School Diploma | 26 (96.3%) | 1 (3.7%) |
| College/Associate Degree | 21 (80.8%) | 5 (19.2%) |
| Bachelor's Degree or higher | 14 (100.0%) | 0 (0.0%) |
Occupancy by Age of Householder in Hamilton
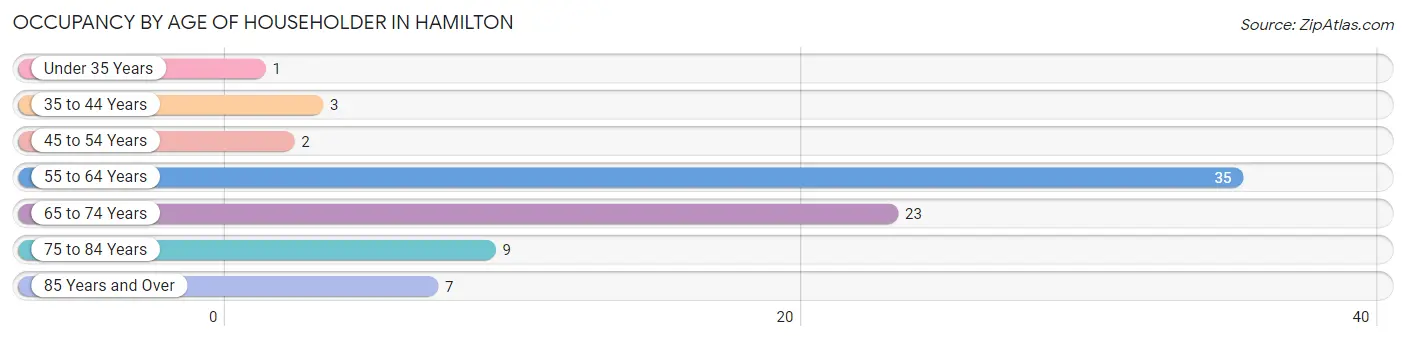
| Age Bracket | # Households | % Households |
| Under 35 Years | 1 | 1.3% |
| 35 to 44 Years | 3 | 3.7% |
| 45 to 54 Years | 2 | 2.5% |
| 55 to 64 Years | 35 | 43.8% |
| 65 to 74 Years | 23 | 28.7% |
| 75 to 84 Years | 9 | 11.3% |
| 85 Years and Over | 7 | 8.7% |
| Total | 80 | 100.0% |
Housing Finances in Hamilton
Median Income by Occupancy in Hamilton
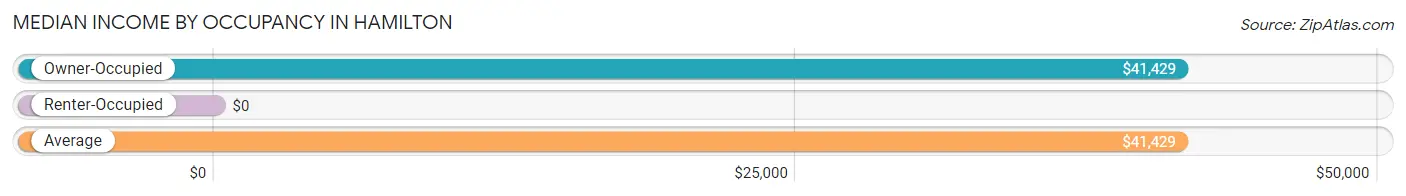
| Occupancy Type | # Households | Median Income |
| Owner-Occupied | 70 (87.5%) | $41,429 |
| Renter-Occupied | 10 (12.5%) | $0 |
| Average | 80 (100.0%) | $41,429 |
Occupancy by Householder Income Bracket in Hamilton
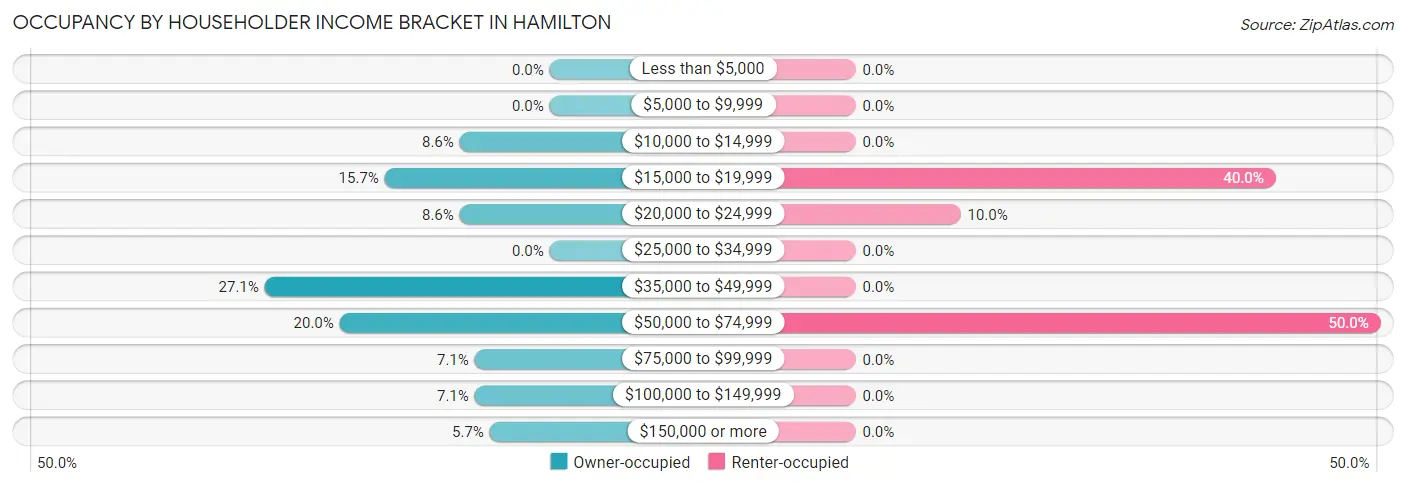
| Income Bracket | Owner-occupied | Renter-occupied |
| Less than $5,000 | 0 (0.0%) | 0 (0.0%) |
| $5,000 to $9,999 | 0 (0.0%) | 0 (0.0%) |
| $10,000 to $14,999 | 6 (8.6%) | 0 (0.0%) |
| $15,000 to $19,999 | 11 (15.7%) | 4 (40.0%) |
| $20,000 to $24,999 | 6 (8.6%) | 1 (10.0%) |
| $25,000 to $34,999 | 0 (0.0%) | 0 (0.0%) |
| $35,000 to $49,999 | 19 (27.1%) | 0 (0.0%) |
| $50,000 to $74,999 | 14 (20.0%) | 5 (50.0%) |
| $75,000 to $99,999 | 5 (7.1%) | 0 (0.0%) |
| $100,000 to $149,999 | 5 (7.1%) | 0 (0.0%) |
| $150,000 or more | 4 (5.7%) | 0 (0.0%) |
| Total | 70 (100.0%) | 10 (100.0%) |
Monthly Housing Cost Tiers in Hamilton
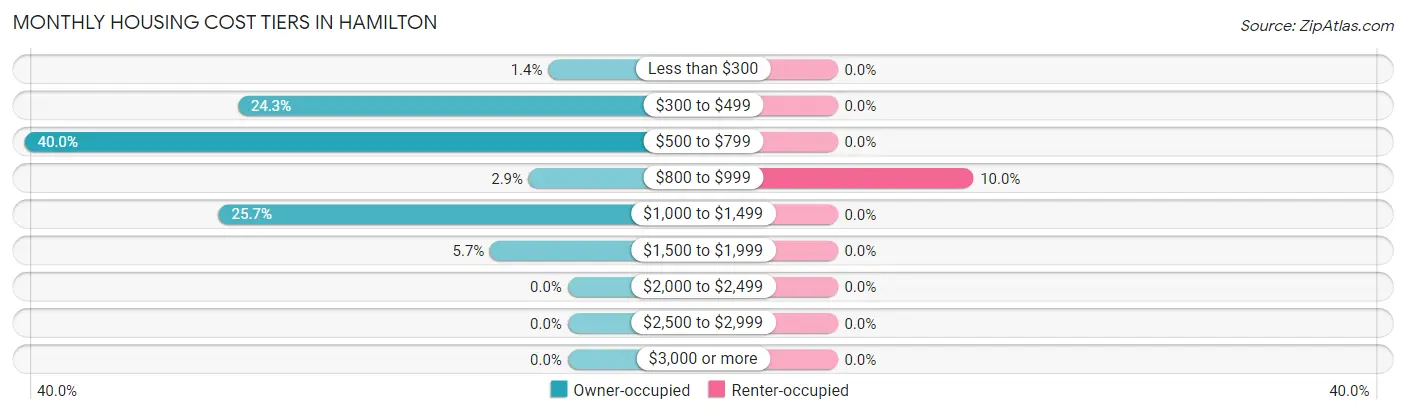
| Monthly Cost | Owner-occupied | Renter-occupied |
| Less than $300 | 1 (1.4%) | 0 (0.0%) |
| $300 to $499 | 17 (24.3%) | 0 (0.0%) |
| $500 to $799 | 28 (40.0%) | 0 (0.0%) |
| $800 to $999 | 2 (2.9%) | 1 (10.0%) |
| $1,000 to $1,499 | 18 (25.7%) | 0 (0.0%) |
| $1,500 to $1,999 | 4 (5.7%) | 0 (0.0%) |
| $2,000 to $2,499 | 0 (0.0%) | 0 (0.0%) |
| $2,500 to $2,999 | 0 (0.0%) | 0 (0.0%) |
| $3,000 or more | 0 (0.0%) | 0 (0.0%) |
| Total | 70 (100.0%) | 10 (100.0%) |
Physical Housing Characteristics in Hamilton
Housing Structures in Hamilton
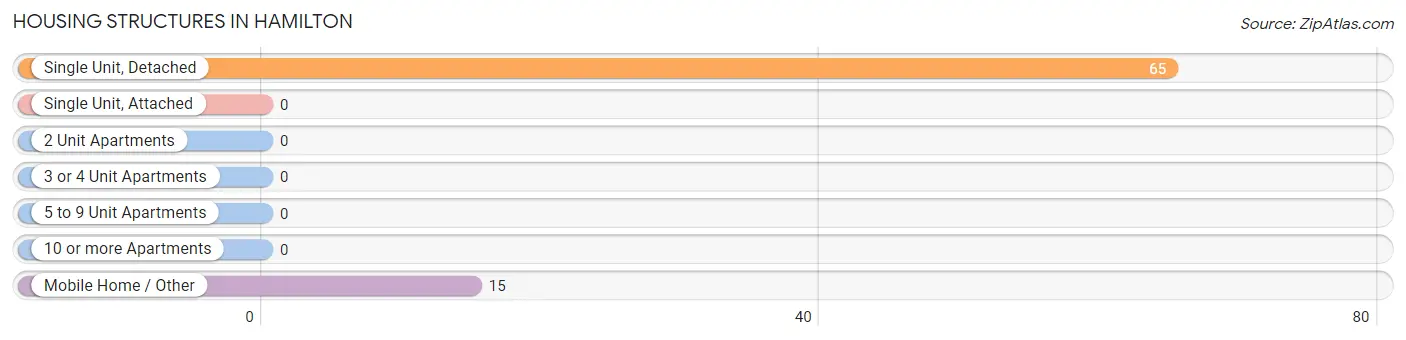
| Structure Type | # Housing Units | % Housing Units |
| Single Unit, Detached | 65 | 81.2% |
| Single Unit, Attached | 0 | 0.0% |
| 2 Unit Apartments | 0 | 0.0% |
| 3 or 4 Unit Apartments | 0 | 0.0% |
| 5 to 9 Unit Apartments | 0 | 0.0% |
| 10 or more Apartments | 0 | 0.0% |
| Mobile Home / Other | 15 | 18.8% |
| Total | 80 | 100.0% |
Housing Structures by Occupancy in Hamilton
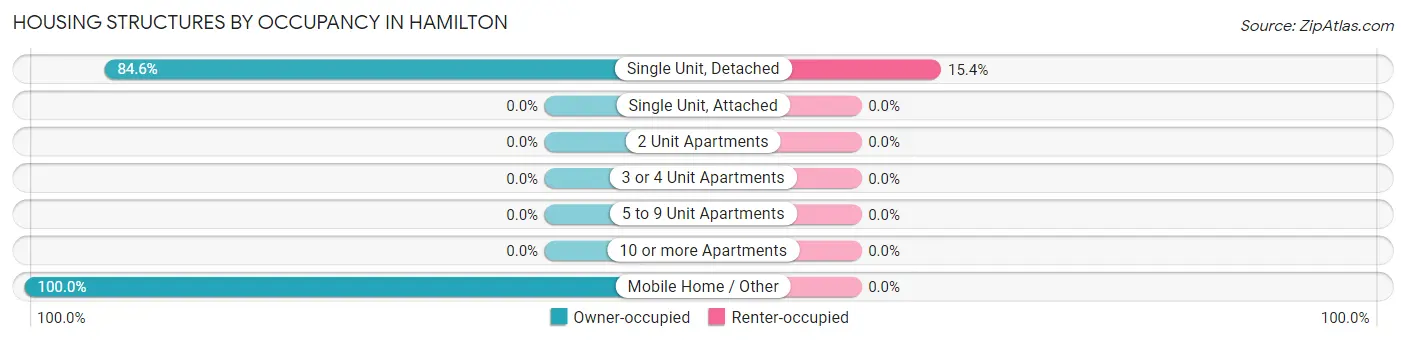
| Structure Type | Owner-occupied | Renter-occupied |
| Single Unit, Detached | 55 (84.6%) | 10 (15.4%) |
| Single Unit, Attached | 0 (0.0%) | 0 (0.0%) |
| 2 Unit Apartments | 0 (0.0%) | 0 (0.0%) |
| 3 or 4 Unit Apartments | 0 (0.0%) | 0 (0.0%) |
| 5 to 9 Unit Apartments | 0 (0.0%) | 0 (0.0%) |
| 10 or more Apartments | 0 (0.0%) | 0 (0.0%) |
| Mobile Home / Other | 15 (100.0%) | 0 (0.0%) |
| Total | 70 (87.5%) | 10 (12.5%) |
Housing Structures by Number of Rooms in Hamilton
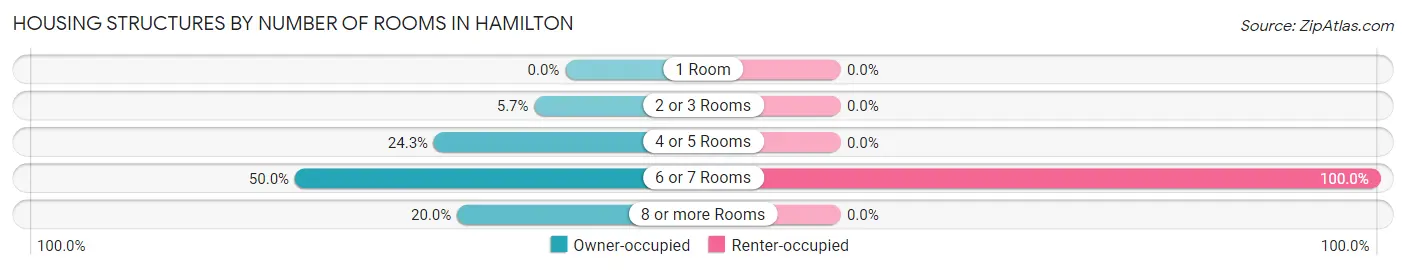
| Number of Rooms | Owner-occupied | Renter-occupied |
| 1 Room | 0 (0.0%) | 0 (0.0%) |
| 2 or 3 Rooms | 4 (5.7%) | 0 (0.0%) |
| 4 or 5 Rooms | 17 (24.3%) | 0 (0.0%) |
| 6 or 7 Rooms | 35 (50.0%) | 10 (100.0%) |
| 8 or more Rooms | 14 (20.0%) | 0 (0.0%) |
| Total | 70 (100.0%) | 10 (100.0%) |
Housing Structure by Heating Type in Hamilton
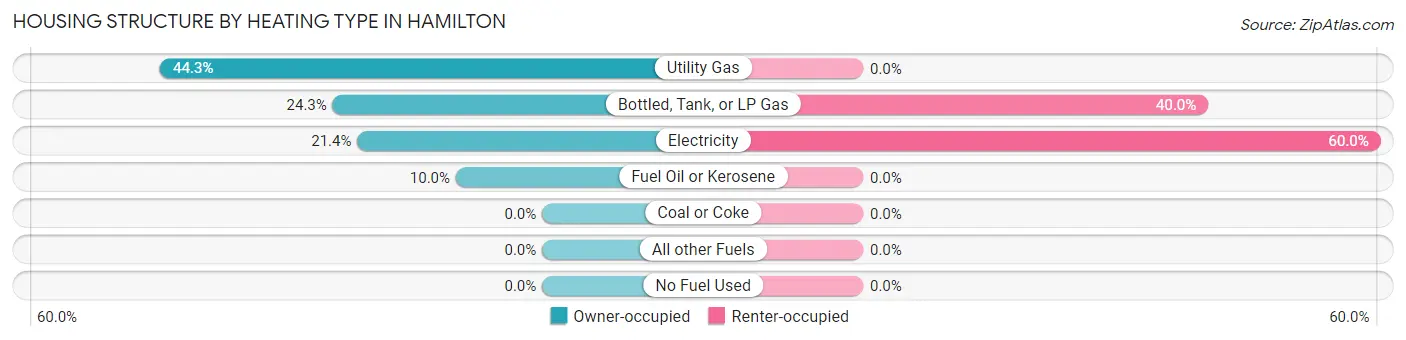
| Heating Type | Owner-occupied | Renter-occupied |
| Utility Gas | 31 (44.3%) | 0 (0.0%) |
| Bottled, Tank, or LP Gas | 17 (24.3%) | 4 (40.0%) |
| Electricity | 15 (21.4%) | 6 (60.0%) |
| Fuel Oil or Kerosene | 7 (10.0%) | 0 (0.0%) |
| Coal or Coke | 0 (0.0%) | 0 (0.0%) |
| All other Fuels | 0 (0.0%) | 0 (0.0%) |
| No Fuel Used | 0 (0.0%) | 0 (0.0%) |
| Total | 70 (100.0%) | 10 (100.0%) |
Household Vehicle Usage in Hamilton
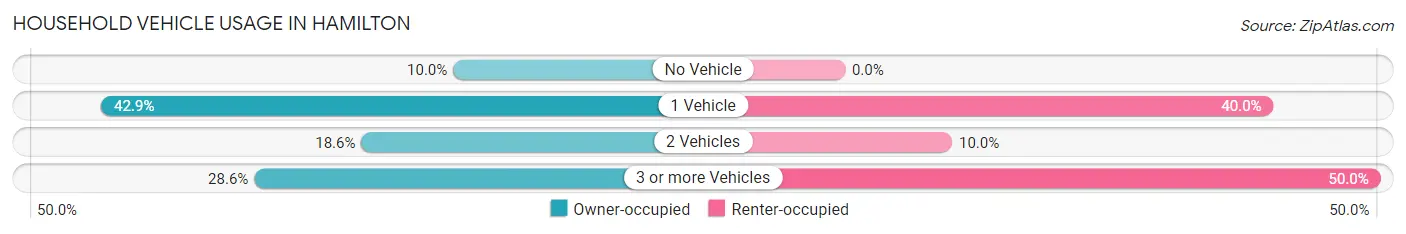
| Vehicles per Household | Owner-occupied | Renter-occupied |
| No Vehicle | 7 (10.0%) | 0 (0.0%) |
| 1 Vehicle | 30 (42.9%) | 4 (40.0%) |
| 2 Vehicles | 13 (18.6%) | 1 (10.0%) |
| 3 or more Vehicles | 20 (28.6%) | 5 (50.0%) |
| Total | 70 (100.0%) | 10 (100.0%) |
Real Estate & Mortgages in Hamilton
Real Estate and Mortgage Overview in Hamilton
| Characteristic | Without Mortgage | With Mortgage |
| Housing Units | 42 | 28 |
| Median Property Value | $51,700 | $85,000 |
| Median Household Income | $41,786 | $4 |
| Monthly Housing Costs | $536 | $0 |
| Real Estate Taxes | $733 | $0 |
Property Value by Mortgage Status in Hamilton
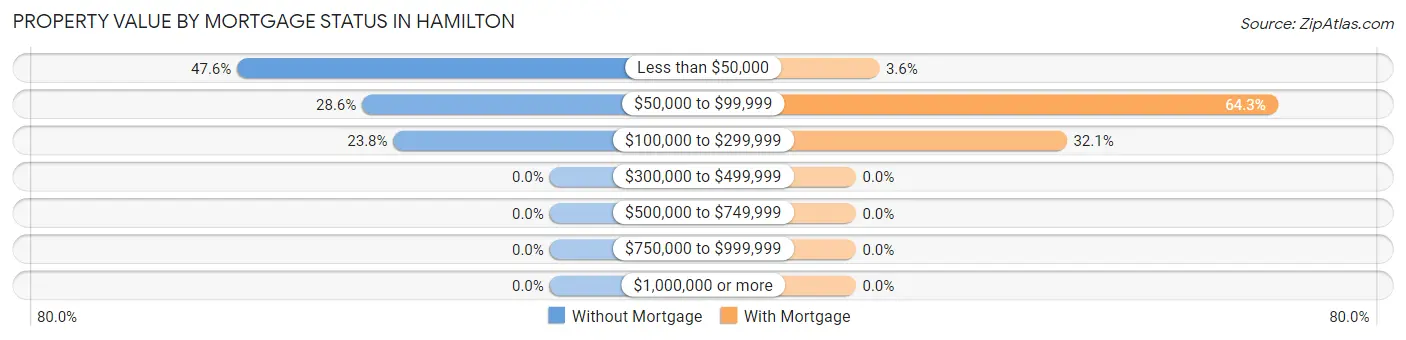
| Property Value | Without Mortgage | With Mortgage |
| Less than $50,000 | 20 (47.6%) | 1 (3.6%) |
| $50,000 to $99,999 | 12 (28.6%) | 18 (64.3%) |
| $100,000 to $299,999 | 10 (23.8%) | 9 (32.1%) |
| $300,000 to $499,999 | 0 (0.0%) | 0 (0.0%) |
| $500,000 to $749,999 | 0 (0.0%) | 0 (0.0%) |
| $750,000 to $999,999 | 0 (0.0%) | 0 (0.0%) |
| $1,000,000 or more | 0 (0.0%) | 0 (0.0%) |
| Total | 42 (100.0%) | 28 (100.0%) |
Household Income by Mortgage Status in Hamilton
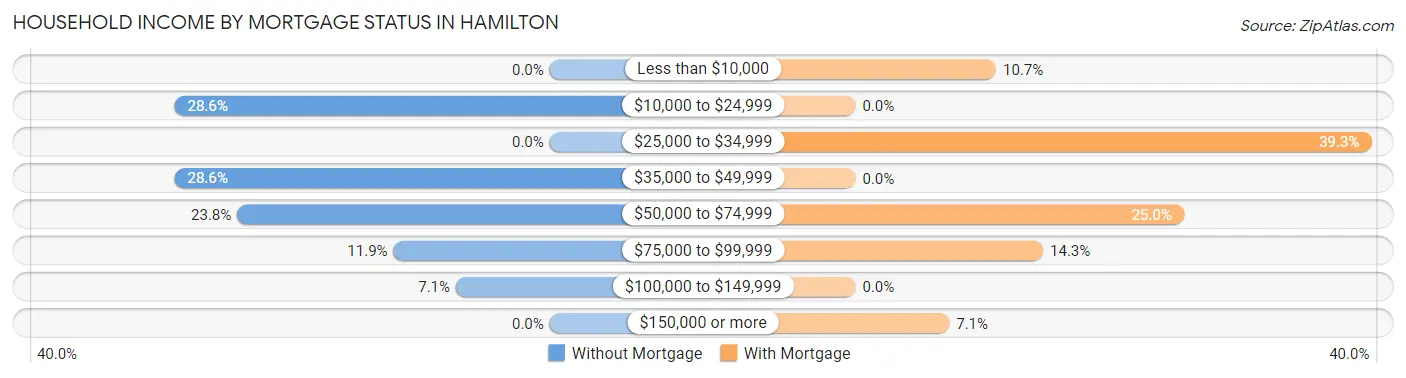
| Household Income | Without Mortgage | With Mortgage |
| Less than $10,000 | 0 (0.0%) | 3 (10.7%) |
| $10,000 to $24,999 | 12 (28.6%) | 0 (0.0%) |
| $25,000 to $34,999 | 0 (0.0%) | 11 (39.3%) |
| $35,000 to $49,999 | 12 (28.6%) | 0 (0.0%) |
| $50,000 to $74,999 | 10 (23.8%) | 7 (25.0%) |
| $75,000 to $99,999 | 5 (11.9%) | 4 (14.3%) |
| $100,000 to $149,999 | 3 (7.1%) | 0 (0.0%) |
| $150,000 or more | 0 (0.0%) | 2 (7.1%) |
| Total | 42 (100.0%) | 28 (100.0%) |
Property Value to Household Income Ratio in Hamilton
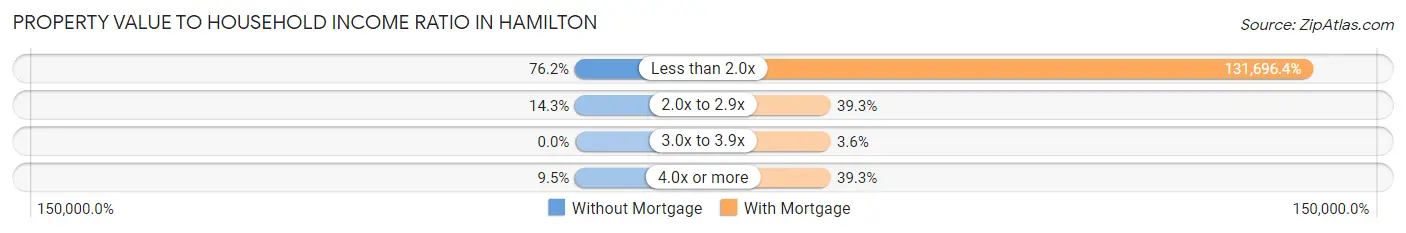
| Value-to-Income Ratio | Without Mortgage | With Mortgage |
| Less than 2.0x | 32 (76.2%) | 36,875 (131,696.4%) |
| 2.0x to 2.9x | 6 (14.3%) | 11 (39.3%) |
| 3.0x to 3.9x | 0 (0.0%) | 1 (3.6%) |
| 4.0x or more | 4 (9.5%) | 11 (39.3%) |
| Total | 42 (100.0%) | 28 (100.0%) |
Real Estate Taxes by Mortgage Status in Hamilton
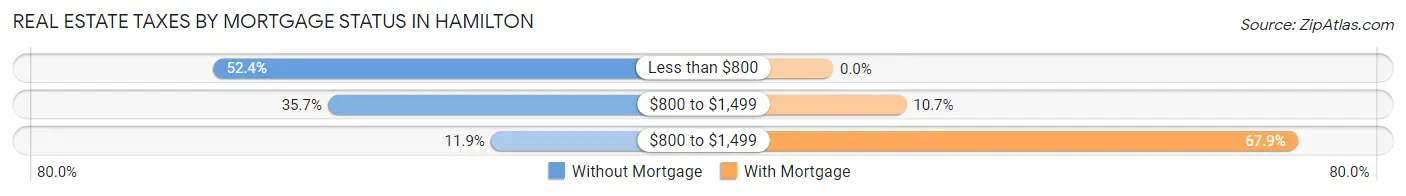
| Property Taxes | Without Mortgage | With Mortgage |
| Less than $800 | 22 (52.4%) | 0 (0.0%) |
| $800 to $1,499 | 15 (35.7%) | 3 (10.7%) |
| $800 to $1,499 | 5 (11.9%) | 19 (67.9%) |
| Total | 42 (100.0%) | 28 (100.0%) |
Health & Disability in Hamilton
Health Insurance Coverage by Age in Hamilton
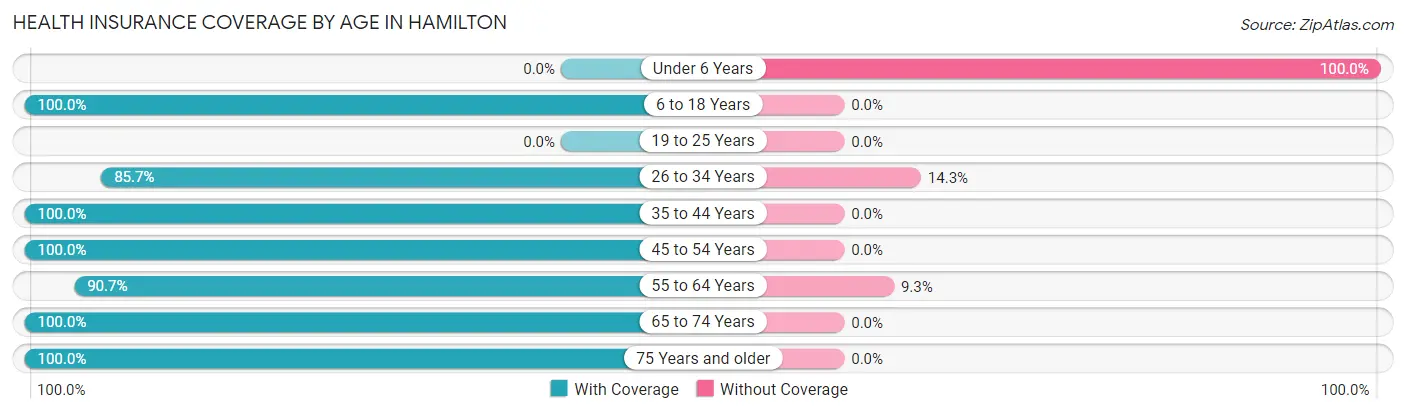
| Age Bracket | With Coverage | Without Coverage |
| Under 6 Years | 0 (0.0%) | 1 (100.0%) |
| 6 to 18 Years | 5 (100.0%) | 0 (0.0%) |
| 19 to 25 Years | 0 (0.0%) | 0 (0.0%) |
| 26 to 34 Years | 18 (85.7%) | 3 (14.3%) |
| 35 to 44 Years | 11 (100.0%) | 0 (0.0%) |
| 45 to 54 Years | 5 (100.0%) | 0 (0.0%) |
| 55 to 64 Years | 49 (90.7%) | 5 (9.3%) |
| 65 to 74 Years | 43 (100.0%) | 0 (0.0%) |
| 75 Years and older | 27 (100.0%) | 0 (0.0%) |
| Total | 158 (94.6%) | 9 (5.4%) |
Health Insurance Coverage by Citizenship Status in Hamilton
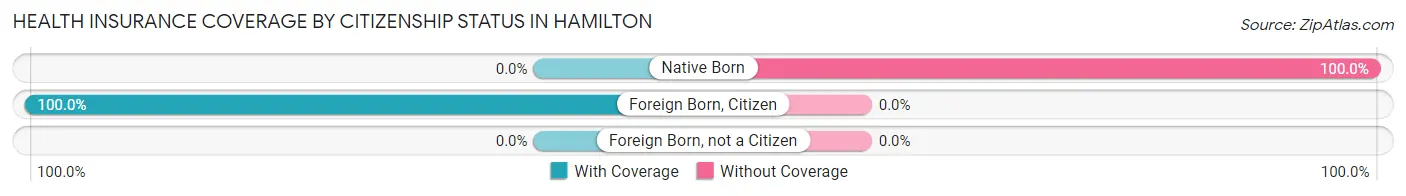
| Citizenship Status | With Coverage | Without Coverage |
| Native Born | 0 (0.0%) | 1 (100.0%) |
| Foreign Born, Citizen | 5 (100.0%) | 0 (0.0%) |
| Foreign Born, not a Citizen | 0 (0.0%) | 0 (0.0%) |
Health Insurance Coverage by Household Income in Hamilton
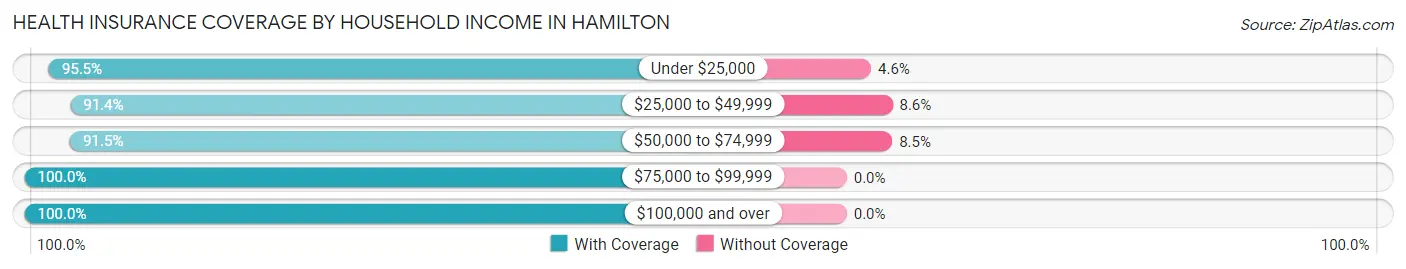
| Household Income | With Coverage | Without Coverage |
| Under $25,000 | 42 (95.5%) | 2 (4.5%) |
| $25,000 to $49,999 | 32 (91.4%) | 3 (8.6%) |
| $50,000 to $74,999 | 43 (91.5%) | 4 (8.5%) |
| $75,000 to $99,999 | 15 (100.0%) | 0 (0.0%) |
| $100,000 and over | 26 (100.0%) | 0 (0.0%) |
Public vs Private Health Insurance Coverage by Age in Hamilton
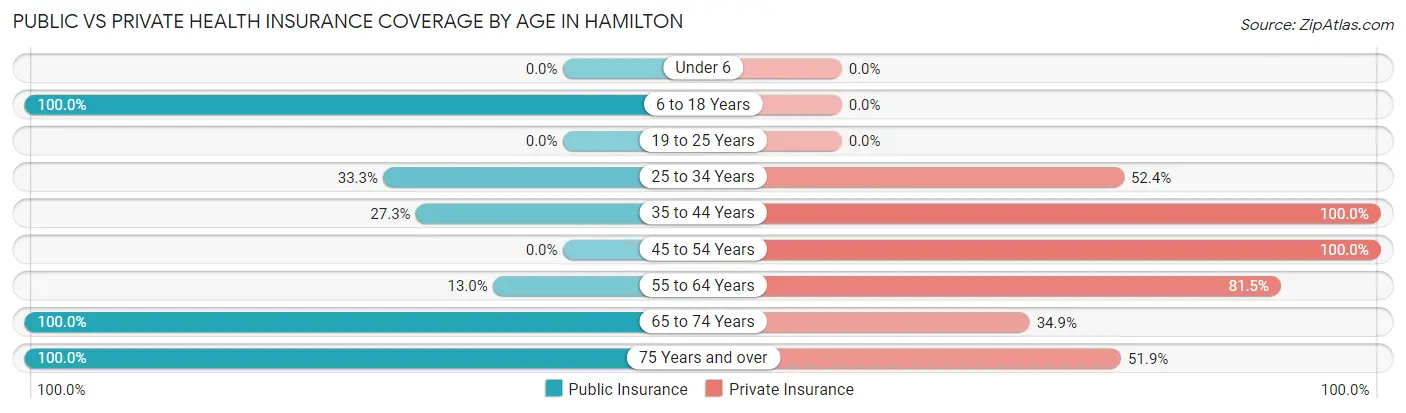
| Age Bracket | Public Insurance | Private Insurance |
| Under 6 | 0 (0.0%) | 0 (0.0%) |
| 6 to 18 Years | 5 (100.0%) | 0 (0.0%) |
| 19 to 25 Years | 0 (0.0%) | 0 (0.0%) |
| 25 to 34 Years | 7 (33.3%) | 11 (52.4%) |
| 35 to 44 Years | 3 (27.3%) | 11 (100.0%) |
| 45 to 54 Years | 0 (0.0%) | 5 (100.0%) |
| 55 to 64 Years | 7 (13.0%) | 44 (81.5%) |
| 65 to 74 Years | 43 (100.0%) | 15 (34.9%) |
| 75 Years and over | 27 (100.0%) | 14 (51.8%) |
| Total | 92 (55.1%) | 100 (59.9%) |
Disability Status by Sex by Age in Hamilton
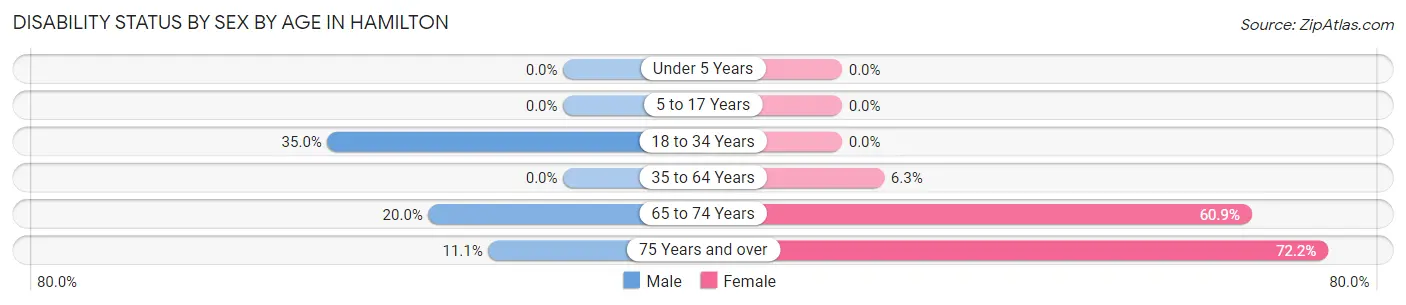
| Age Bracket | Male | Female |
| Under 5 Years | 0 (0.0%) | 0 (0.0%) |
| 5 to 17 Years | 0 (0.0%) | 0 (0.0%) |
| 18 to 34 Years | 7 (35.0%) | 0 (0.0%) |
| 35 to 64 Years | 0 (0.0%) | 3 (6.2%) |
| 65 to 74 Years | 4 (20.0%) | 14 (60.9%) |
| 75 Years and over | 1 (11.1%) | 13 (72.2%) |
Disability Class by Sex by Age in Hamilton
Disability Class: Hearing Difficulty
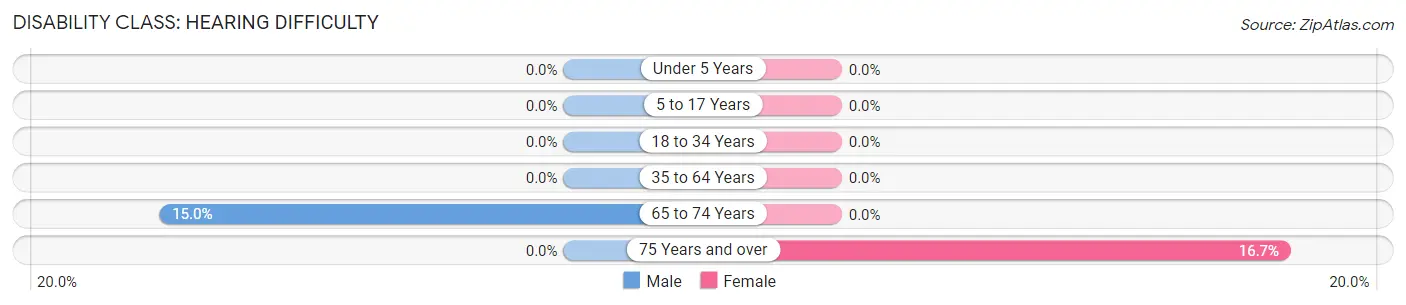
| Age Bracket | Male | Female |
| Under 5 Years | 0 (0.0%) | 0 (0.0%) |
| 5 to 17 Years | 0 (0.0%) | 0 (0.0%) |
| 18 to 34 Years | 0 (0.0%) | 0 (0.0%) |
| 35 to 64 Years | 0 (0.0%) | 0 (0.0%) |
| 65 to 74 Years | 3 (15.0%) | 0 (0.0%) |
| 75 Years and over | 0 (0.0%) | 3 (16.7%) |
Disability Class: Vision Difficulty
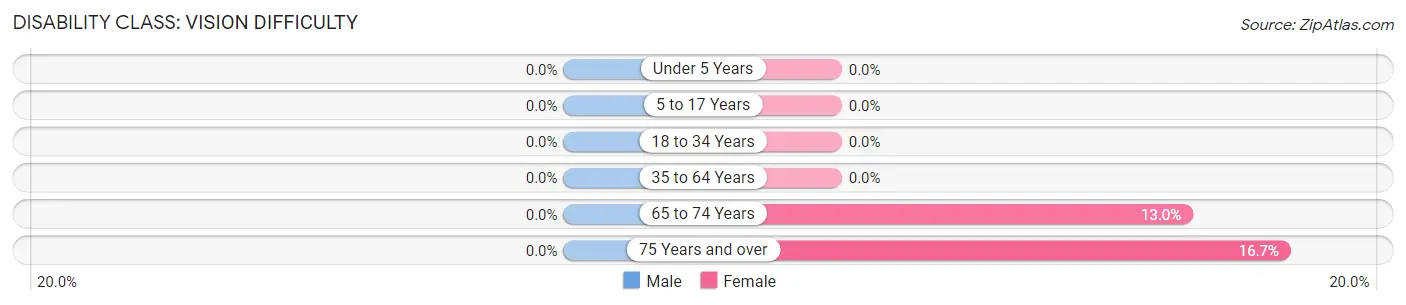
| Age Bracket | Male | Female |
| Under 5 Years | 0 (0.0%) | 0 (0.0%) |
| 5 to 17 Years | 0 (0.0%) | 0 (0.0%) |
| 18 to 34 Years | 0 (0.0%) | 0 (0.0%) |
| 35 to 64 Years | 0 (0.0%) | 0 (0.0%) |
| 65 to 74 Years | 0 (0.0%) | 3 (13.0%) |
| 75 Years and over | 0 (0.0%) | 3 (16.7%) |
Disability Class: Cognitive Difficulty
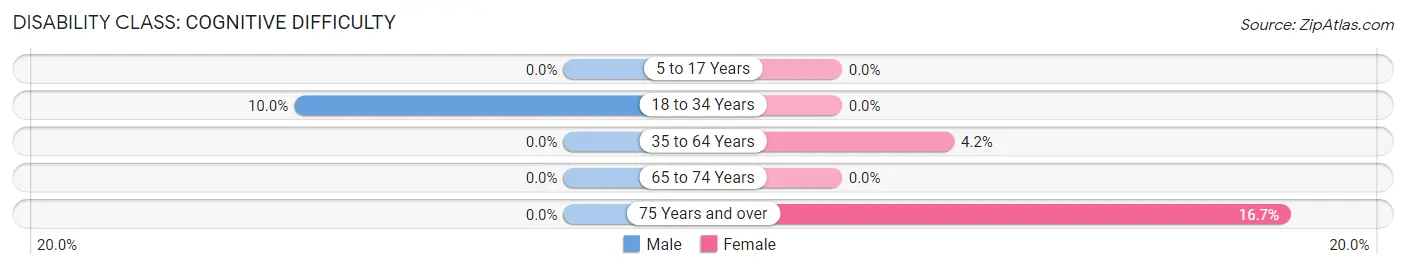
| Age Bracket | Male | Female |
| 5 to 17 Years | 0 (0.0%) | 0 (0.0%) |
| 18 to 34 Years | 2 (10.0%) | 0 (0.0%) |
| 35 to 64 Years | 0 (0.0%) | 2 (4.2%) |
| 65 to 74 Years | 0 (0.0%) | 0 (0.0%) |
| 75 Years and over | 0 (0.0%) | 3 (16.7%) |
Disability Class: Ambulatory Difficulty
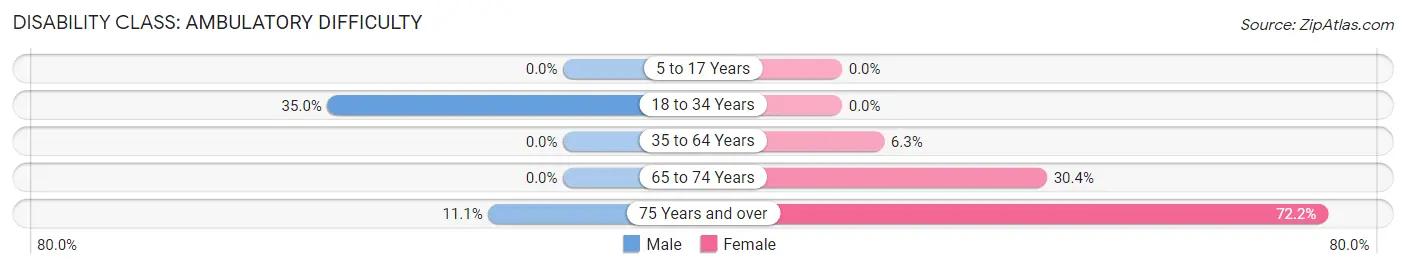
| Age Bracket | Male | Female |
| 5 to 17 Years | 0 (0.0%) | 0 (0.0%) |
| 18 to 34 Years | 7 (35.0%) | 0 (0.0%) |
| 35 to 64 Years | 0 (0.0%) | 3 (6.2%) |
| 65 to 74 Years | 0 (0.0%) | 7 (30.4%) |
| 75 Years and over | 1 (11.1%) | 13 (72.2%) |
Disability Class: Self-Care Difficulty
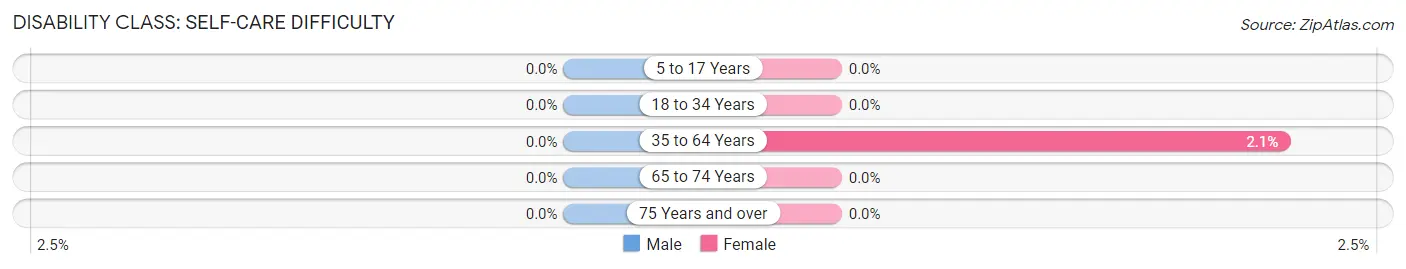
| Age Bracket | Male | Female |
| 5 to 17 Years | 0 (0.0%) | 0 (0.0%) |
| 18 to 34 Years | 0 (0.0%) | 0 (0.0%) |
| 35 to 64 Years | 0 (0.0%) | 1 (2.1%) |
| 65 to 74 Years | 0 (0.0%) | 0 (0.0%) |
| 75 Years and over | 0 (0.0%) | 0 (0.0%) |
Technology Access in Hamilton
Computing Device Access in Hamilton
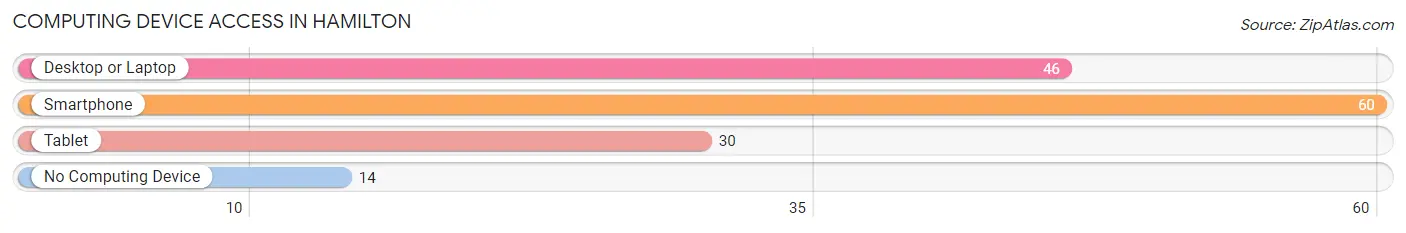
| Device Type | # Households | % Households |
| Desktop or Laptop | 46 | 57.5% |
| Smartphone | 60 | 75.0% |
| Tablet | 30 | 37.5% |
| No Computing Device | 14 | 17.5% |
| Total | 80 | 100.0% |
Internet Access in Hamilton
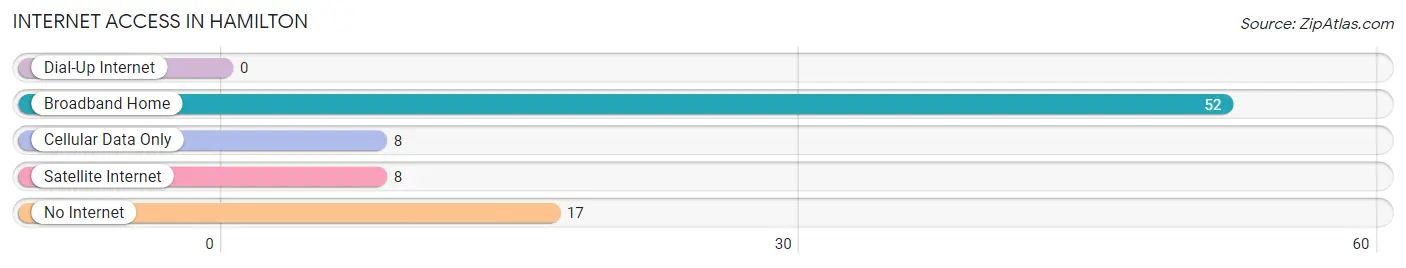
| Internet Type | # Households | % Households |
| Dial-Up Internet | 0 | 0.0% |
| Broadband Home | 52 | 65.0% |
| Cellular Data Only | 8 | 10.0% |
| Satellite Internet | 8 | 10.0% |
| No Internet | 17 | 21.2% |
| Total | 80 | 100.0% |
Hamilton Summary
Hamilton, North Carolina is a small town located in the foothills of the Appalachian Mountains in the western part of the state. It is situated in the Piedmont region of North Carolina, and is part of the larger metropolitan area of Asheville. The town has a population of approximately 1,500 people, and is the county seat of Martin County.
History
The town of Hamilton was founded in 1883 by a group of settlers from the nearby town of Williamston. The settlers chose the name Hamilton in honor of Alexander Hamilton, the first Secretary of the Treasury. The town was incorporated in 1887, and the first post office was established in 1888.
The town grew slowly over the years, and by the early 1900s, it had become a thriving agricultural center. The town was home to several cotton mills, and the local economy was largely based on the production of cotton and other agricultural products.
In the 1950s, the town began to experience a period of growth and development. The construction of Interstate 85 in the 1960s further spurred the town’s growth, and by the 1970s, Hamilton had become a popular tourist destination.
Geography
Hamilton is located in the foothills of the Appalachian Mountains in the western part of North Carolina. The town is situated in the Piedmont region of the state, and is part of the larger metropolitan area of Asheville. The town is located at an elevation of 1,000 feet above sea level, and is surrounded by rolling hills and forests.
The town is located near the intersection of Interstate 85 and US Highway 64, and is approximately 30 miles from the city of Asheville. The nearest major airport is located in Charlotte, which is approximately 90 miles away.
Economy
The economy of Hamilton is largely based on tourism and agriculture. The town is home to several tourist attractions, including the Hamilton Historic District, which is listed on the National Register of Historic Places. The town is also home to several wineries, and is a popular destination for wine tasting.
Agriculture is also an important part of the local economy. The town is home to several farms, and the surrounding area is known for its production of apples, peaches, and other fruits and vegetables.
Demographics
As of the 2010 census, the population of Hamilton was 1,500 people. The racial makeup of the town was 94.7% White, 2.7% African American, 0.3% Native American, 0.7% Asian, and 1.6% from other races. The median household income was $35,000, and the median age was 40 years.
Conclusion
Hamilton, North Carolina is a small town located in the foothills of the Appalachian Mountains in the western part of the state. The town has a population of approximately 1,500 people, and is the county seat of Martin County. The town’s economy is largely based on tourism and agriculture, and the town is home to several tourist attractions and wineries. The town is also home to several farms, and the surrounding area is known for its production of apples, peaches, and other fruits and vegetables.
Common Questions
What is Per Capita Income in Hamilton?
Per Capita income in Hamilton is $25,690.
What is the Median Family Income in Hamilton?
Median Family Income in Hamilton is $59,250.
What is the Median Household income in Hamilton?
Median Household Income in Hamilton is $41,429.
What is Income or Wage Gap in Hamilton?
Income or Wage Gap in Hamilton is 18.1%.
Women in Hamilton earn 81.9 cents for every dollar earned by a man.
What is Inequality or Gini Index in Hamilton?
Inequality or Gini Index in Hamilton is 0.41.
What is the Total Population of Hamilton?
Total Population of Hamilton is 167.
What is the Total Male Population of Hamilton?
Total Male Population of Hamilton is 74.
What is the Total Female Population of Hamilton?
Total Female Population of Hamilton is 93.
What is the Ratio of Males per 100 Females in Hamilton?
There are 79.57 Males per 100 Females in Hamilton.
What is the Ratio of Females per 100 Males in Hamilton?
There are 125.68 Females per 100 Males in Hamilton.
What is the Median Population Age in Hamilton?
Median Population Age in Hamilton is 61.2 Years.
What is the Average Family Size in Hamilton
Average Family Size in Hamilton is 2.8 People.
What is the Average Household Size in Hamilton
Average Household Size in Hamilton is 2.1 People.
How Large is the Labor Force in Hamilton?
There are 76 People in the Labor Forcein in Hamilton.
What is the Percentage of People in the Labor Force in Hamilton?
47.2% of People are in the Labor Force in Hamilton.
What is the Unemployment Rate in Hamilton?
Unemployment Rate in Hamilton is 7.9%.