Plymouth, NC Map & Demographics
Plymouth Map
Plymouth Overview
$17,266
PER CAPITA INCOME
$36,006
AVG FAMILY INCOME
$24,385
AVG HOUSEHOLD INCOME
52.1%
WAGE / INCOME GAP [ % ]
47.9¢/ $1
WAGE / INCOME GAP [ $ ]
0.49
INEQUALITY / GINI INDEX
3,315
TOTAL POPULATION
1,958
MALE POPULATION
1,357
FEMALE POPULATION
144.29
MALES / 100 FEMALES
69.31
FEMALES / 100 MALES
46.6
MEDIAN AGE
3.1
AVG FAMILY SIZE
2.0
AVG HOUSEHOLD SIZE
1,162
LABOR FORCE [ PEOPLE ]
42.9%
PERCENT IN LABOR FORCE
24.2%
UNEMPLOYMENT RATE
Plymouth Zip Codes
Plymouth Area Codes
Income in Plymouth
Income Overview in Plymouth
Per Capita Income in Plymouth is $17,266, while median incomes of families and households are $36,006 and $24,385 respectively.
| Characteristic | Number | Measure |
| Per Capita Income | 3,315 | $17,266 |
| Median Family Income | 718 | $36,006 |
| Mean Family Income | 718 | $45,979 |
| Median Household Income | 1,582 | $24,385 |
| Mean Household Income | 1,582 | $35,166 |
| Income Deficit | 718 | $0 |
| Wage / Income Gap (%) | 3,315 | 52.08% |
| Wage / Income Gap ($) | 3,315 | 47.92¢ per $1 |
| Gini / Inequality Index | 3,315 | 0.49 |
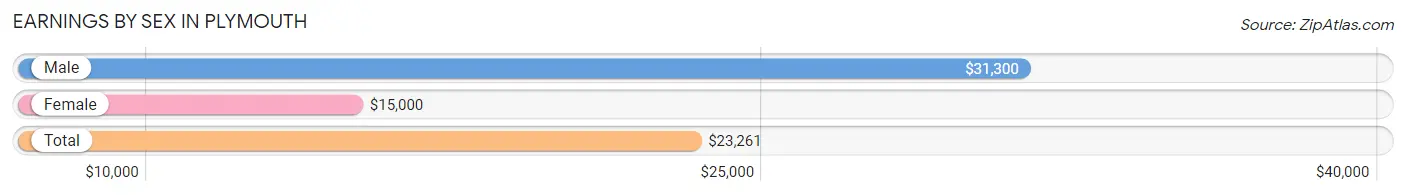
Earnings by Sex in Plymouth
Average Earnings in Plymouth are $23,261, $31,300 for men and $15,000 for women, a difference of 52.1%.
| Sex | Number | Average Earnings |
| Male | 488 (42.1%) | $31,300 |
| Female | 672 (57.9%) | $15,000 |
| Total | 1,160 (100.0%) | $23,261 |
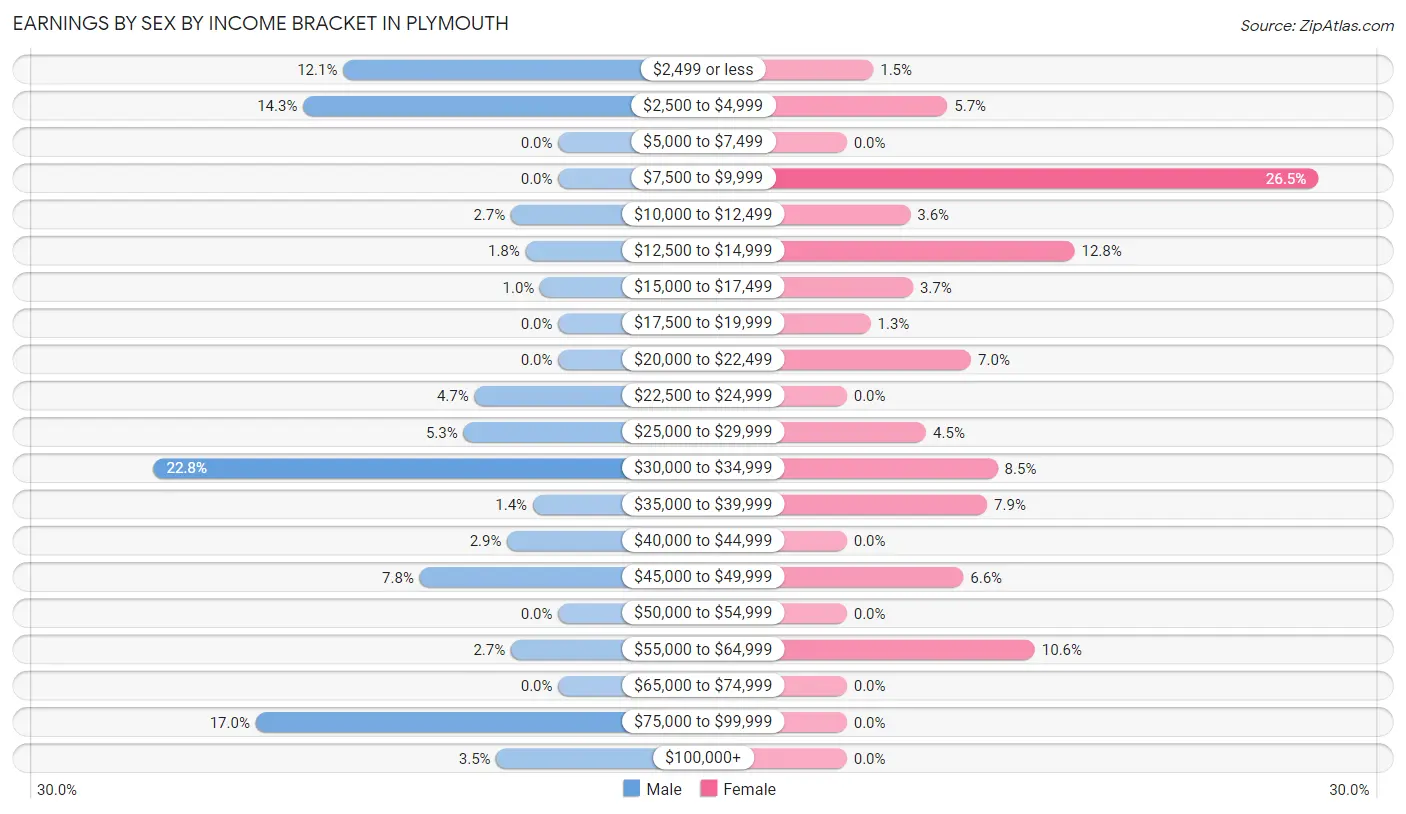
Earnings by Sex by Income Bracket in Plymouth
The most common earnings brackets in Plymouth are $30,000 to $34,999 for men (111 | 22.8%) and $7,500 to $9,999 for women (178 | 26.5%).
| Income | Male | Female |
| $2,499 or less | 59 (12.1%) | 10 (1.5%) |
| $2,500 to $4,999 | 70 (14.3%) | 38 (5.7%) |
| $5,000 to $7,499 | 0 (0.0%) | 0 (0.0%) |
| $7,500 to $9,999 | 0 (0.0%) | 178 (26.5%) |
| $10,000 to $12,499 | 13 (2.7%) | 24 (3.6%) |
| $12,500 to $14,999 | 9 (1.8%) | 86 (12.8%) |
| $15,000 to $17,499 | 5 (1.0%) | 25 (3.7%) |
| $17,500 to $19,999 | 0 (0.0%) | 9 (1.3%) |
| $20,000 to $22,499 | 0 (0.0%) | 47 (7.0%) |
| $22,500 to $24,999 | 23 (4.7%) | 0 (0.0%) |
| $25,000 to $29,999 | 26 (5.3%) | 30 (4.5%) |
| $30,000 to $34,999 | 111 (22.8%) | 57 (8.5%) |
| $35,000 to $39,999 | 7 (1.4%) | 53 (7.9%) |
| $40,000 to $44,999 | 14 (2.9%) | 0 (0.0%) |
| $45,000 to $49,999 | 38 (7.8%) | 44 (6.6%) |
| $50,000 to $54,999 | 0 (0.0%) | 0 (0.0%) |
| $55,000 to $64,999 | 13 (2.7%) | 71 (10.6%) |
| $65,000 to $74,999 | 0 (0.0%) | 0 (0.0%) |
| $75,000 to $99,999 | 83 (17.0%) | 0 (0.0%) |
| $100,000+ | 17 (3.5%) | 0 (0.0%) |
| Total | 488 (100.0%) | 672 (100.0%) |
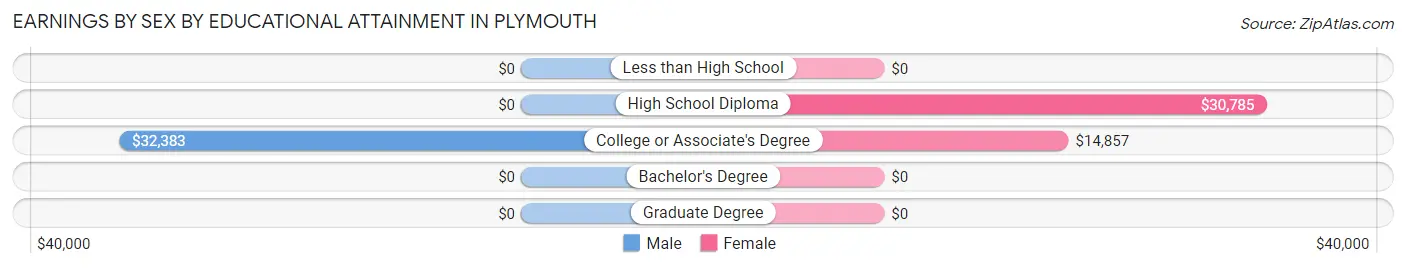
Earnings by Sex by Educational Attainment in Plymouth
Average earnings in Plymouth are $31,200 for men and $16,450 for women, a difference of 47.3%. Men with an educational attainment of college or associate's degree enjoy the highest average annual earnings of $32,383, while those with college or associate's degree education earn the least with $32,383. Women with an educational attainment of high school diploma earn the most with the average annual earnings of $30,785, while those with college or associate's degree education have the smallest earnings of $14,857.
| Educational Attainment | Male Income | Female Income |
| Less than High School | - | - |
| High School Diploma | - | - |
| College or Associate's Degree | $32,383 | $14,857 |
| Bachelor's Degree | - | - |
| Graduate Degree | - | - |
| Total | $31,200 | $16,450 |
Family Income in Plymouth
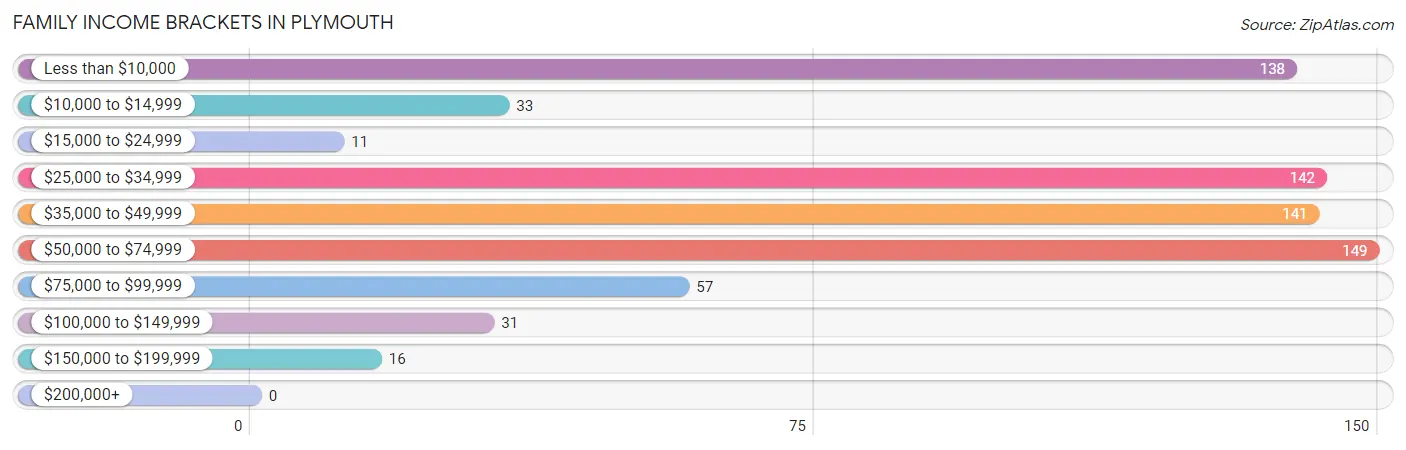
Family Income Brackets in Plymouth
According to the Plymouth family income data, there are 149 families falling into the $50,000 to $74,999 income range, which is the most common income bracket and makes up 20.7% of all families.
| Income Bracket | # Families | % Families |
| Less than $10,000 | 138 | 19.2% |
| $10,000 to $14,999 | 33 | 4.6% |
| $15,000 to $24,999 | 11 | 1.5% |
| $25,000 to $34,999 | 142 | 19.8% |
| $35,000 to $49,999 | 141 | 19.6% |
| $50,000 to $74,999 | 149 | 20.8% |
| $75,000 to $99,999 | 57 | 7.9% |
| $100,000 to $149,999 | 31 | 4.3% |
| $150,000 to $199,999 | 16 | 2.2% |
| $200,000+ | 0 | 0.0% |
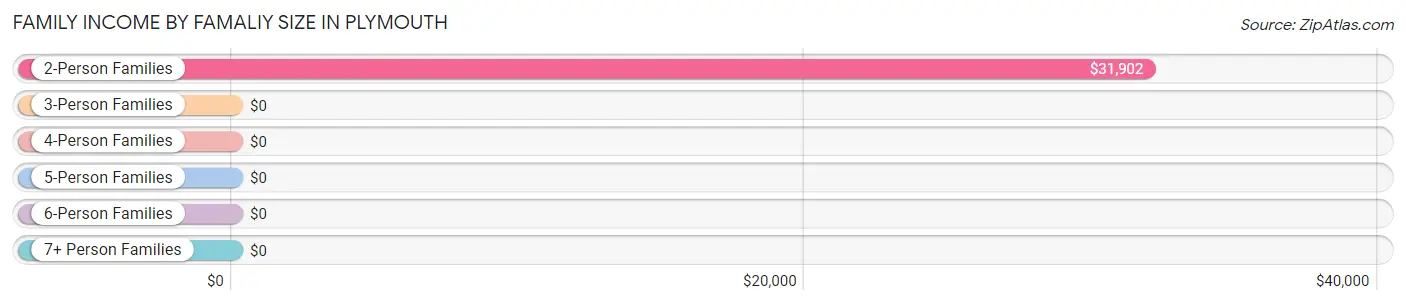
Family Income by Famaliy Size in Plymouth
2-person families (434 | 60.5%) account for the highest median family income in Plymouth with $31,902 per family, while 2-person families (434 | 60.5%) have the highest median income of $15,951 per family member.
| Income Bracket | # Families | Median Income |
| 2-Person Families | 434 (60.5%) | $31,902 |
| 3-Person Families | 80 (11.1%) | $0 |
| 4-Person Families | 117 (16.3%) | $0 |
| 5-Person Families | 87 (12.1%) | $0 |
| 6-Person Families | 0 (0.0%) | $0 |
| 7+ Person Families | 0 (0.0%) | $0 |
| Total | 718 (100.0%) | $36,006 |
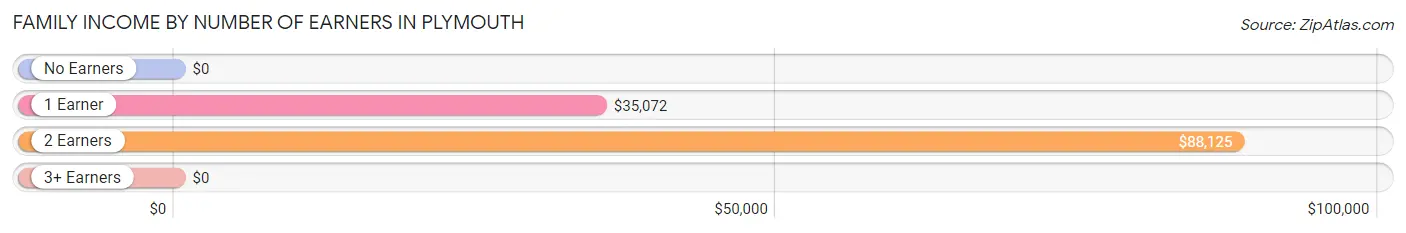
Family Income by Number of Earners in Plymouth
| Number of Earners | # Families | Median Income |
| No Earners | 78 (10.9%) | $0 |
| 1 Earner | 567 (79.0%) | $35,072 |
| 2 Earners | 61 (8.5%) | $88,125 |
| 3+ Earners | 12 (1.7%) | $0 |
| Total | 718 (100.0%) | $36,006 |
Household Income in Plymouth
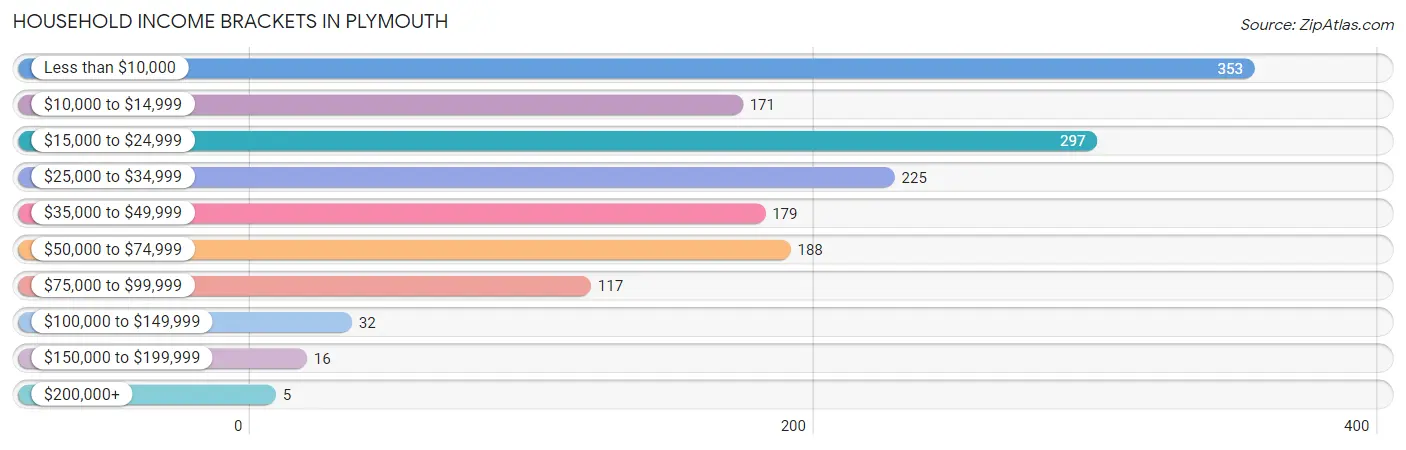
Household Income Brackets in Plymouth
With 353 households falling in the category, the less than $10,000 income range is the most frequent in Plymouth, accounting for 22.3% of all households. In contrast, only 5 households (0.3%) fall into the $200,000+ income bracket, making it the least populous group.
| Income Bracket | # Households | % Households |
| Less than $10,000 | 353 | 22.3% |
| $10,000 to $14,999 | 171 | 10.8% |
| $15,000 to $24,999 | 297 | 18.8% |
| $25,000 to $34,999 | 225 | 14.2% |
| $35,000 to $49,999 | 179 | 11.3% |
| $50,000 to $74,999 | 188 | 11.9% |
| $75,000 to $99,999 | 117 | 7.4% |
| $100,000 to $149,999 | 32 | 2.0% |
| $150,000 to $199,999 | 16 | 1.0% |
| $200,000+ | 5 | 0.3% |
Household Income by Householder Age in Plymouth
The median household income in Plymouth is $24,385, with the highest median household income of $34,559 found in the 65+ years age bracket for the primary householder. A total of 598 households (37.8%) fall into this category. Meanwhile, the 15 to 24 years age bracket for the primary householder has the lowest median household income of $0, with 6 households (0.4%) in this group.
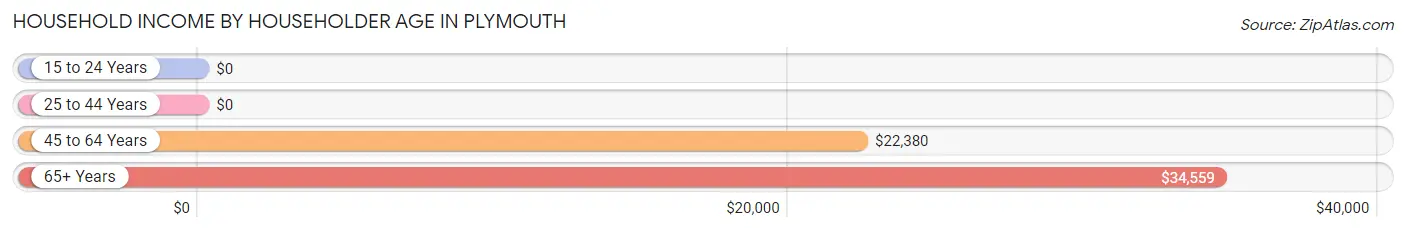
| Income Bracket | # Households | Median Income |
| 15 to 24 Years | 6 (0.4%) | $0 |
| 25 to 44 Years | 377 (23.8%) | $0 |
| 45 to 64 Years | 601 (38.0%) | $22,380 |
| 65+ Years | 598 (37.8%) | $34,559 |
| Total | 1,582 (100.0%) | $24,385 |
Poverty in Plymouth
Income Below Poverty by Sex and Age in Plymouth
With 39.8% poverty level for males and 30.3% for females among the residents of Plymouth, 12 to 14 year old males and 25 to 34 year old females are the most vulnerable to poverty, with 112 males (100.0%) and 138 females (90.8%) in their respective age groups living below the poverty level.
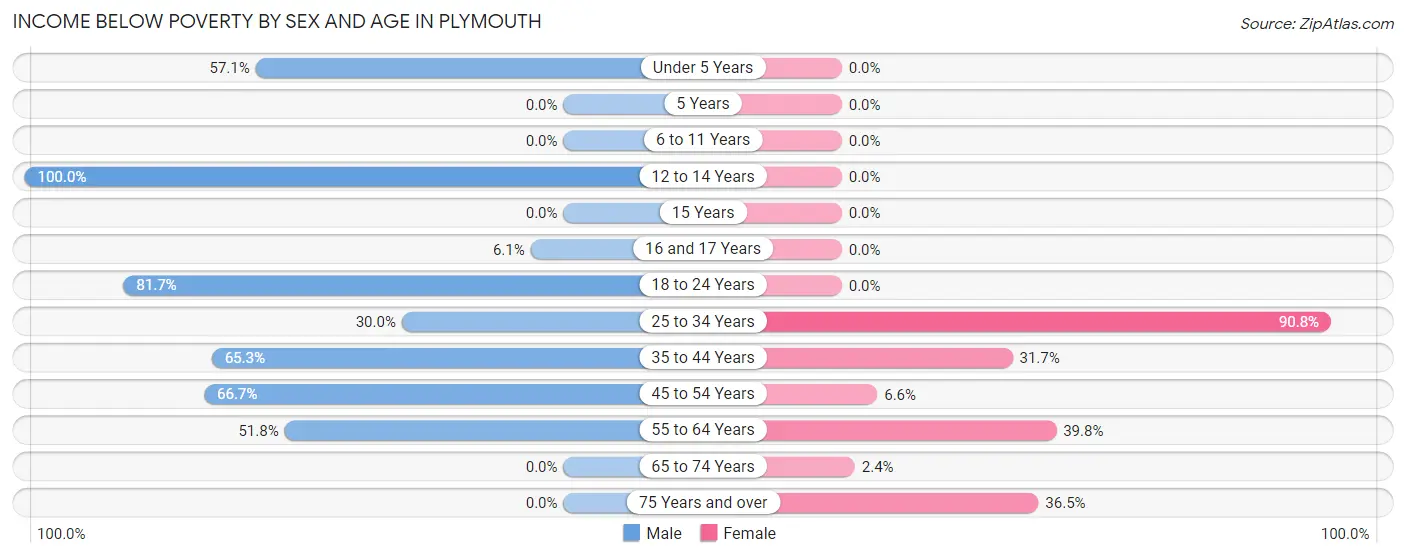
| Age Bracket | Male | Female |
| Under 5 Years | 112 (57.1%) | 0 (0.0%) |
| 5 Years | 0 (0.0%) | 0 (0.0%) |
| 6 to 11 Years | 0 (0.0%) | 0 (0.0%) |
| 12 to 14 Years | 112 (100.0%) | 0 (0.0%) |
| 15 Years | 0 (0.0%) | 0 (0.0%) |
| 16 and 17 Years | 7 (6.1%) | 0 (0.0%) |
| 18 to 24 Years | 218 (81.7%) | 0 (0.0%) |
| 25 to 34 Years | 48 (30.0%) | 138 (90.8%) |
| 35 to 44 Years | 62 (65.3%) | 58 (31.7%) |
| 45 to 54 Years | 102 (66.7%) | 12 (6.6%) |
| 55 to 64 Years | 103 (51.8%) | 121 (39.8%) |
| 65 to 74 Years | 0 (0.0%) | 7 (2.4%) |
| 75 Years and over | 0 (0.0%) | 54 (36.5%) |
| Total | 764 (39.8%) | 390 (30.3%) |
Income Above Poverty by Sex and Age in Plymouth
According to the poverty statistics in Plymouth, males aged 5 years and females aged 18 to 24 years are the age groups that are most secure financially, with 100.0% of males and 100.0% of females in these age groups living above the poverty line.
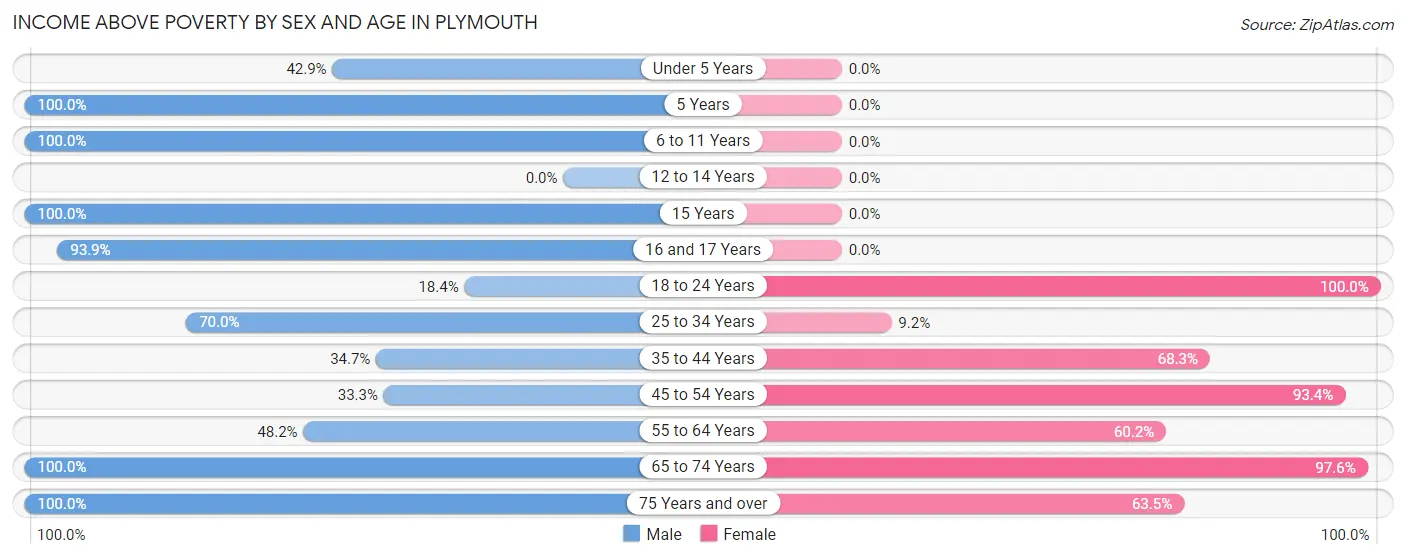
| Age Bracket | Male | Female |
| Under 5 Years | 84 (42.9%) | 0 (0.0%) |
| 5 Years | 19 (100.0%) | 0 (0.0%) |
| 6 to 11 Years | 170 (100.0%) | 0 (0.0%) |
| 12 to 14 Years | 0 (0.0%) | 0 (0.0%) |
| 15 Years | 109 (100.0%) | 0 (0.0%) |
| 16 and 17 Years | 108 (93.9%) | 0 (0.0%) |
| 18 to 24 Years | 49 (18.3%) | 29 (100.0%) |
| 25 to 34 Years | 112 (70.0%) | 14 (9.2%) |
| 35 to 44 Years | 33 (34.7%) | 125 (68.3%) |
| 45 to 54 Years | 51 (33.3%) | 170 (93.4%) |
| 55 to 64 Years | 96 (48.2%) | 183 (60.2%) |
| 65 to 74 Years | 202 (100.0%) | 282 (97.6%) |
| 75 Years and over | 122 (100.0%) | 94 (63.5%) |
| Total | 1,155 (60.2%) | 897 (69.7%) |
Income Below Poverty Among Married-Couple Families in Plymouth
The poverty statistics for married-couple families in Plymouth show that 4.9% or 15 of the total 309 families live below the poverty line. Families with no children have the highest poverty rate of 6.1%, comprising of 15 families. On the other hand, families with 1 or 2 children have the lowest poverty rate of 0.0%, which includes 0 families.
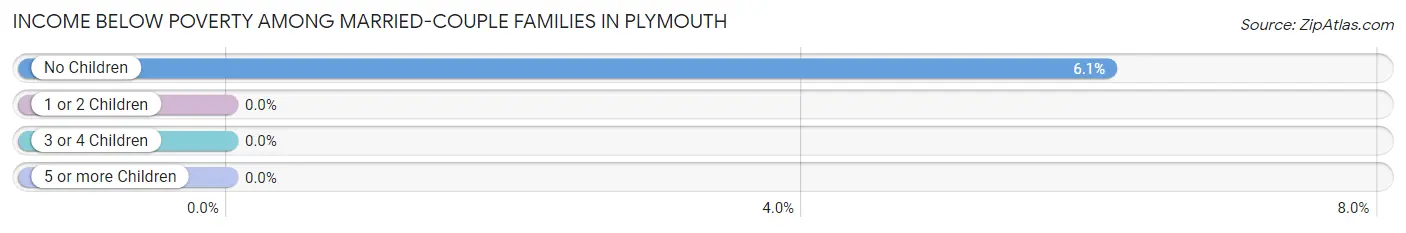
| Children | Above Poverty | Below Poverty |
| No Children | 230 (93.9%) | 15 (6.1%) |
| 1 or 2 Children | 64 (100.0%) | 0 (0.0%) |
| 3 or 4 Children | 0 (0.0%) | 0 (0.0%) |
| 5 or more Children | 0 (0.0%) | 0 (0.0%) |
| Total | 294 (95.2%) | 15 (4.9%) |
Income Below Poverty Among Single-Parent Households in Plymouth
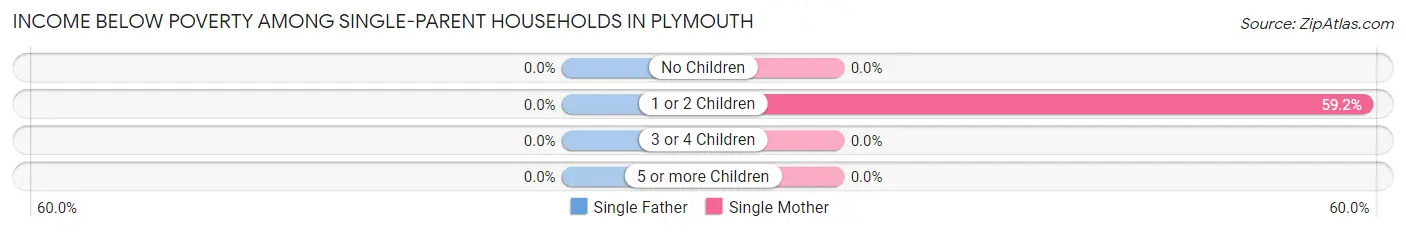
| Children | Single Father | Single Mother |
| No Children | 0 (0.0%) | 0 (0.0%) |
| 1 or 2 Children | 0 (0.0%) | 209 (59.2%) |
| 3 or 4 Children | 0 (0.0%) | 0 (0.0%) |
| 5 or more Children | 0 (0.0%) | 0 (0.0%) |
| Total | 0 (0.0%) | 209 (51.1%) |
Income Below Poverty Among Married-Couple vs Single-Parent Households in Plymouth
The poverty data for Plymouth shows that 15 of the married-couple family households (4.9%) and 209 of the single-parent households (51.1%) are living below the poverty level. Within the married-couple family households, those with no children have the highest poverty rate, with 15 households (6.1%) falling below the poverty line. Among the single-parent households, those with 1 or 2 children have the highest poverty rate, with 209 household (59.2%) living below poverty.
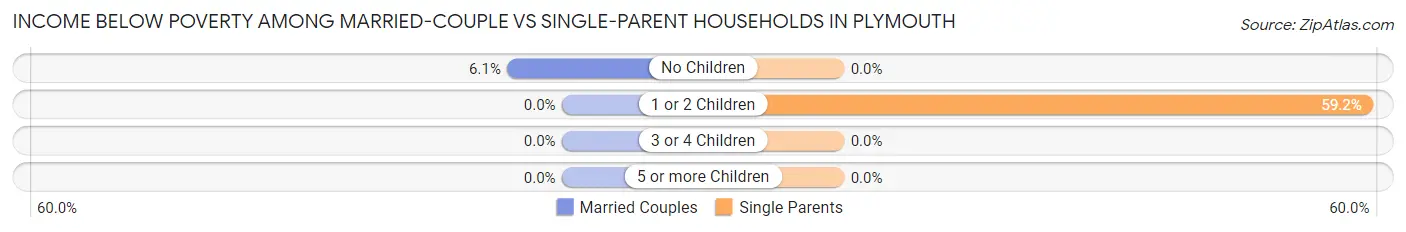
| Children | Married-Couple Families | Single-Parent Households |
| No Children | 15 (6.1%) | 0 (0.0%) |
| 1 or 2 Children | 0 (0.0%) | 209 (59.2%) |
| 3 or 4 Children | 0 (0.0%) | 0 (0.0%) |
| 5 or more Children | 0 (0.0%) | 0 (0.0%) |
| Total | 15 (4.9%) | 209 (51.1%) |
Race in Plymouth
The most populous races in Plymouth are Black / African American (2,206 | 66.5%), White / Caucasian (1,045 | 31.5%), and Some other Race (33 | 1.0%).
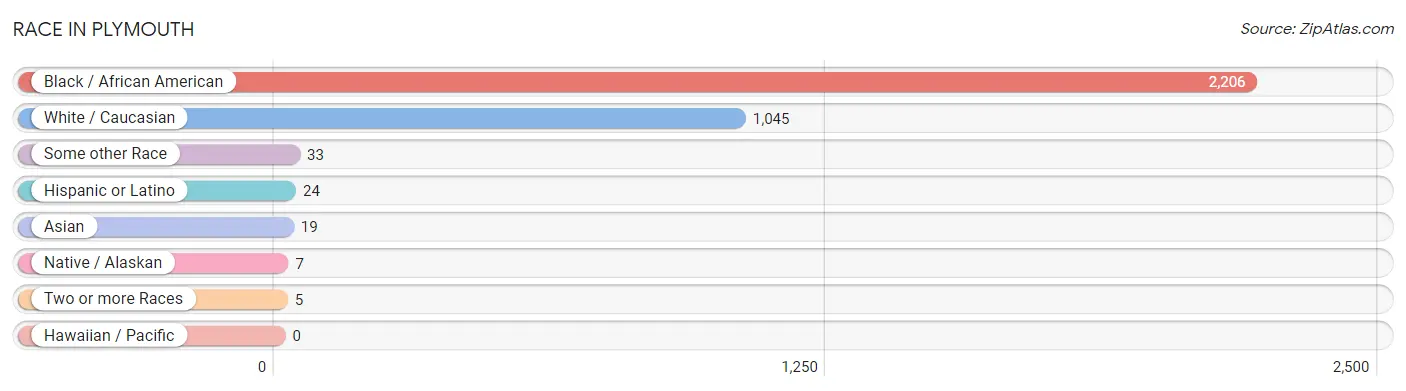
| Race | # Population | % Population |
| Asian | 19 | 0.6% |
| Black / African American | 2,206 | 66.5% |
| Hawaiian / Pacific | 0 | 0.0% |
| Hispanic or Latino | 24 | 0.7% |
| Native / Alaskan | 7 | 0.2% |
| White / Caucasian | 1,045 | 31.5% |
| Two or more Races | 5 | 0.2% |
| Some other Race | 33 | 1.0% |
| Total | 3,315 | 100.0% |
Ancestry in Plymouth
The most populous ancestries reported in Plymouth are American (574 | 17.3%), English (66 | 2.0%), Scottish (59 | 1.8%), Italian (35 | 1.1%), and Subsaharan African (33 | 1.0%), together accounting for 23.2% of all Plymouth residents.
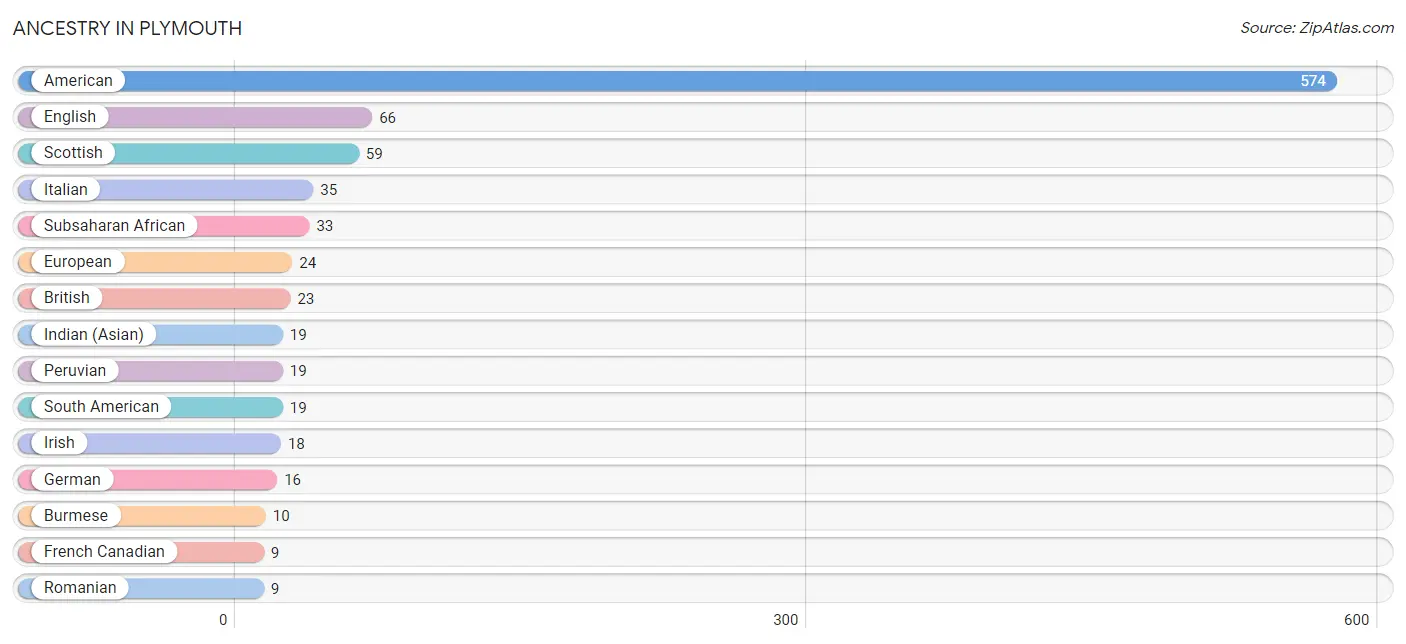
| Ancestry | # Population | % Population |
| American | 574 | 17.3% |
| British | 23 | 0.7% |
| Burmese | 10 | 0.3% |
| Cherokee | 5 | 0.2% |
| English | 66 | 2.0% |
| European | 24 | 0.7% |
| French Canadian | 9 | 0.3% |
| German | 16 | 0.5% |
| Indian (Asian) | 19 | 0.6% |
| Irish | 18 | 0.5% |
| Italian | 35 | 1.1% |
| Osage | 7 | 0.2% |
| Peruvian | 19 | 0.6% |
| Romanian | 9 | 0.3% |
| Scottish | 59 | 1.8% |
| South American | 19 | 0.6% |
| Spaniard | 5 | 0.2% |
| Subsaharan African | 33 | 1.0% |
| Welsh | 4 | 0.1% | View All 19 Rows |
Immigrants in Plymouth
The most numerous immigrant groups reported in Plymouth came from Latin America (19 | 0.6%), Peru (19 | 0.6%), and South America (19 | 0.6%), together accounting for 1.7% of all Plymouth residents.
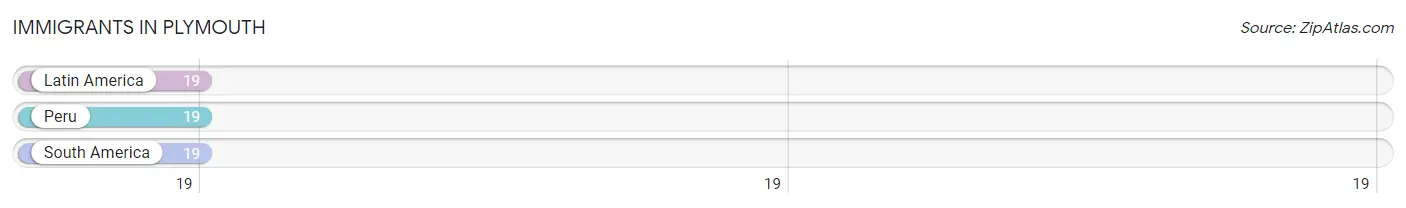
| Immigration Origin | # Population | % Population |
| Latin America | 19 | 0.6% |
| Peru | 19 | 0.6% |
| South America | 19 | 0.6% | View All 3 Rows |
Sex and Age in Plymouth
Sex and Age in Plymouth
The most populous age groups in Plymouth are 15 to 19 Years (326 | 16.7%) for men and 60 to 64 Years (217 | 16.0%) for women.
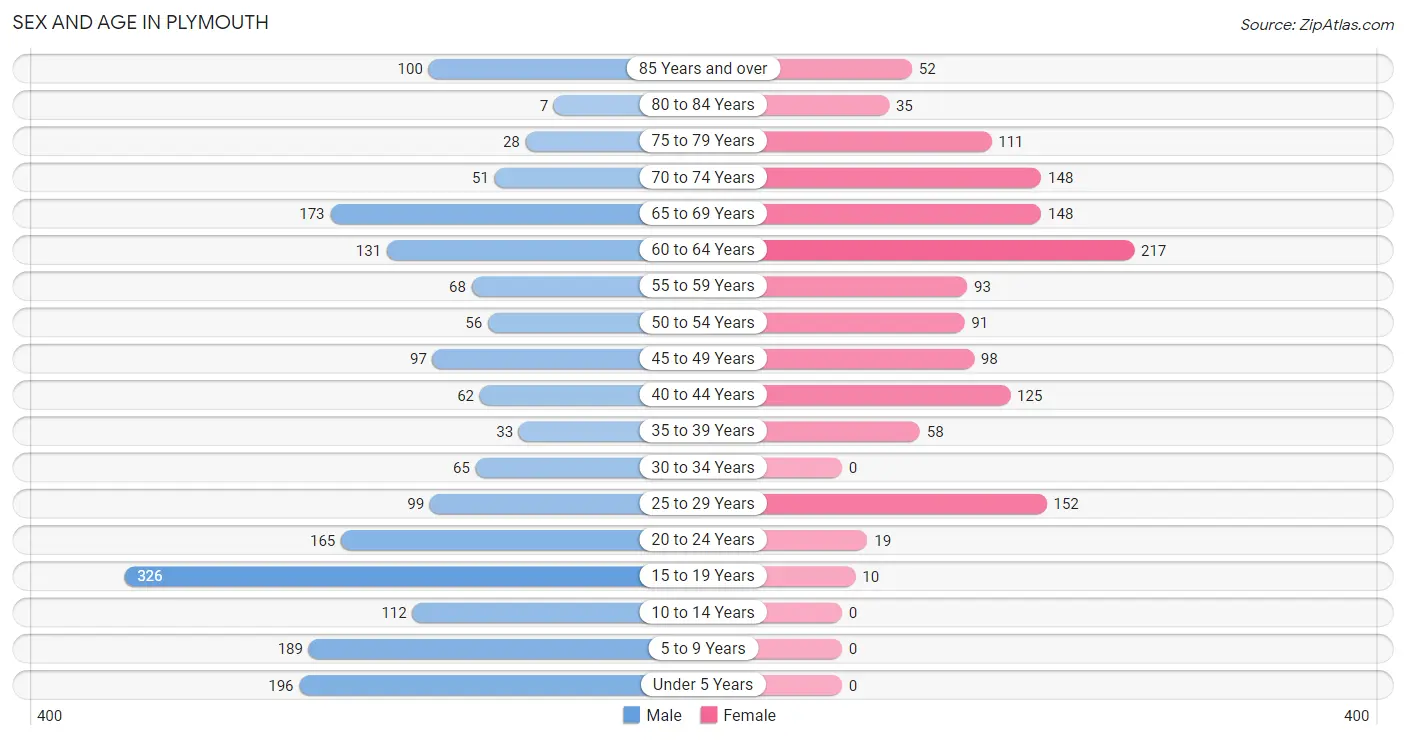
| Age Bracket | Male | Female |
| Under 5 Years | 196 (10.0%) | 0 (0.0%) |
| 5 to 9 Years | 189 (9.7%) | 0 (0.0%) |
| 10 to 14 Years | 112 (5.7%) | 0 (0.0%) |
| 15 to 19 Years | 326 (16.7%) | 10 (0.7%) |
| 20 to 24 Years | 165 (8.4%) | 19 (1.4%) |
| 25 to 29 Years | 99 (5.1%) | 152 (11.2%) |
| 30 to 34 Years | 65 (3.3%) | 0 (0.0%) |
| 35 to 39 Years | 33 (1.7%) | 58 (4.3%) |
| 40 to 44 Years | 62 (3.2%) | 125 (9.2%) |
| 45 to 49 Years | 97 (5.0%) | 98 (7.2%) |
| 50 to 54 Years | 56 (2.9%) | 91 (6.7%) |
| 55 to 59 Years | 68 (3.5%) | 93 (6.9%) |
| 60 to 64 Years | 131 (6.7%) | 217 (16.0%) |
| 65 to 69 Years | 173 (8.8%) | 148 (10.9%) |
| 70 to 74 Years | 51 (2.6%) | 148 (10.9%) |
| 75 to 79 Years | 28 (1.4%) | 111 (8.2%) |
| 80 to 84 Years | 7 (0.4%) | 35 (2.6%) |
| 85 Years and over | 100 (5.1%) | 52 (3.8%) |
| Total | 1,958 (100.0%) | 1,357 (100.0%) |
Families and Households in Plymouth
Median Family Size in Plymouth
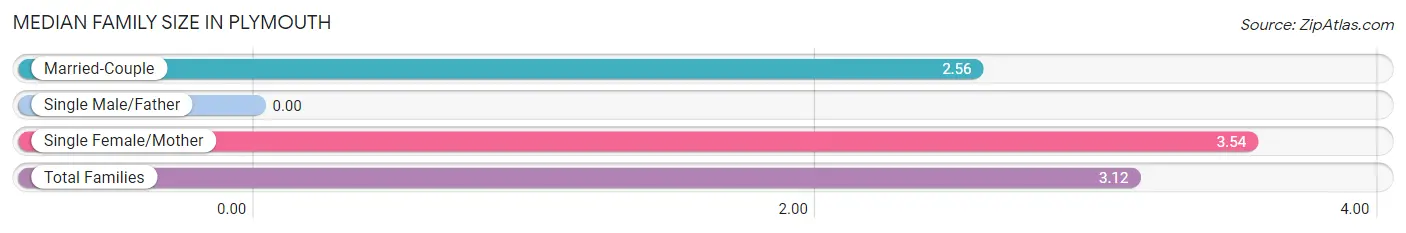
| Family Type | # Families | Family Size |
| Married-Couple | 309 (43.0%) | 2.56 |
| Single Male/Father | 0 (0.0%) | - |
| Single Female/Mother | 409 (57.0%) | 3.54 |
| Total Families | 718 (100.0%) | 3.12 |
Median Household Size in Plymouth
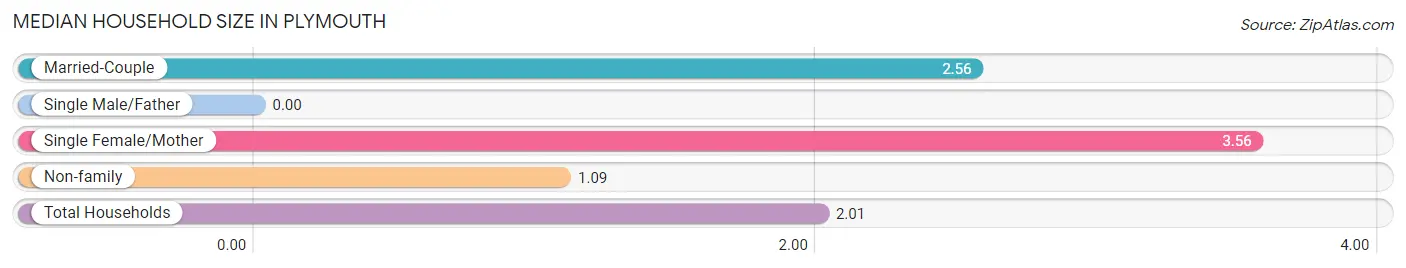
| Household Type | # Households | Household Size |
| Married-Couple | 309 (19.5%) | 2.56 |
| Single Male/Father | 0 (0.0%) | - |
| Single Female/Mother | 409 (25.9%) | 3.56 |
| Non-family | 864 (54.6%) | 1.09 |
| Total Households | 1,582 (100.0%) | 2.01 |
Household Size by Marriage Status in Plymouth
Out of a total of 1,582 households in Plymouth, 718 (45.4%) are family households, while 864 (54.6%) are nonfamily households. The most numerous type of family households are 2-person households, comprising 416, and the most common type of nonfamily households are 1-person households, comprising 777.
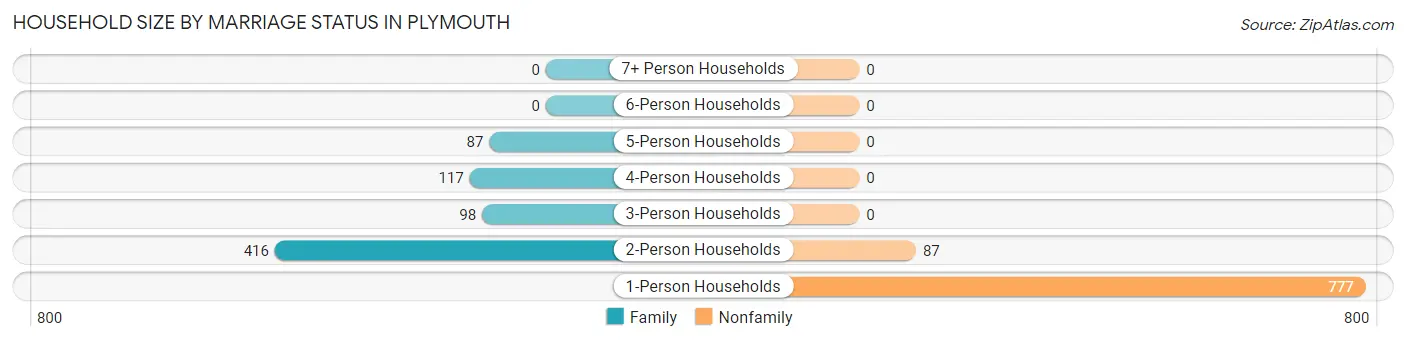
| Household Size | Family Households | Nonfamily Households |
| 1-Person Households | - | 777 (49.1%) |
| 2-Person Households | 416 (26.3%) | 87 (5.5%) |
| 3-Person Households | 98 (6.2%) | 0 (0.0%) |
| 4-Person Households | 117 (7.4%) | 0 (0.0%) |
| 5-Person Households | 87 (5.5%) | 0 (0.0%) |
| 6-Person Households | 0 (0.0%) | 0 (0.0%) |
| 7+ Person Households | 0 (0.0%) | 0 (0.0%) |
| Total | 718 (45.4%) | 864 (54.6%) |
Female Fertility in Plymouth
Fertility by Age in Plymouth
Average fertility rate in Plymouth is 259.0 births per 1,000 women. Women in the age bracket of 20 to 34 years have the highest fertility rate with 807.0 births per 1,000 women. Women in the age bracket of 20 to 34 years acount for 96.5% of all women with births.
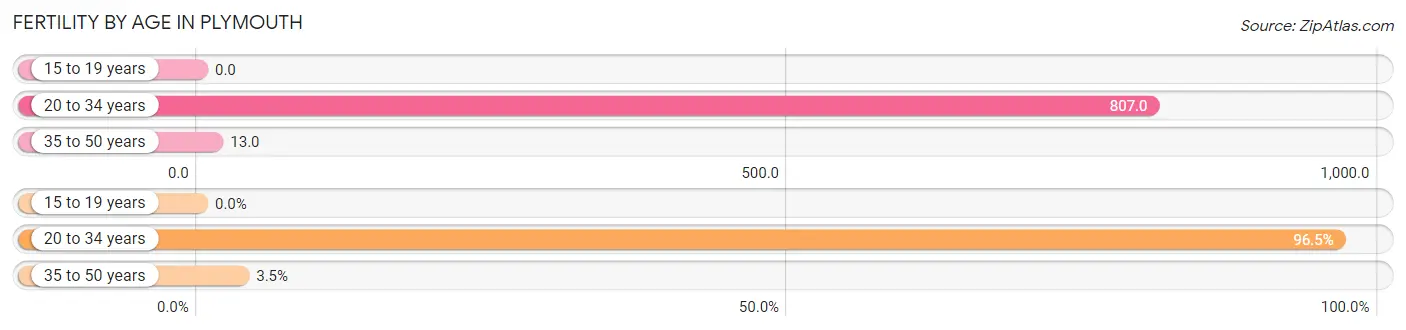
| Age Bracket | Women with Births | Births / 1,000 Women |
| 15 to 19 years | 0 (0.0%) | 0.0 |
| 20 to 34 years | 138 (96.5%) | 807.0 |
| 35 to 50 years | 5 (3.5%) | 13.0 |
| Total | 143 (100.0%) | 259.0 |
Fertility by Age by Marriage Status in Plymouth
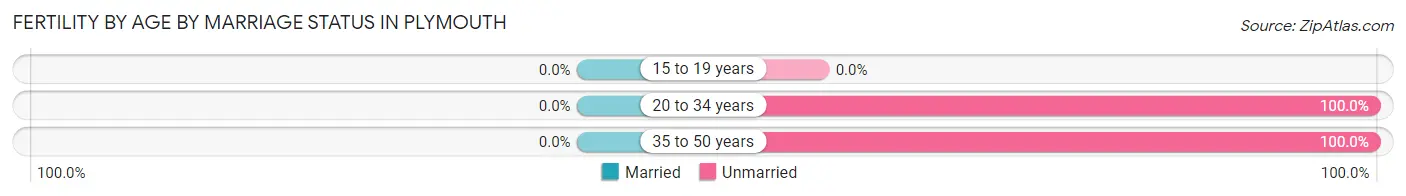
| Age Bracket | Married | Unmarried |
| 15 to 19 years | 0 (0.0%) | 0 (0.0%) |
| 20 to 34 years | 0 (0.0%) | 138 (100.0%) |
| 35 to 50 years | 0 (0.0%) | 5 (100.0%) |
| Total | 0 (0.0%) | 143 (100.0%) |
Fertility by Education in Plymouth
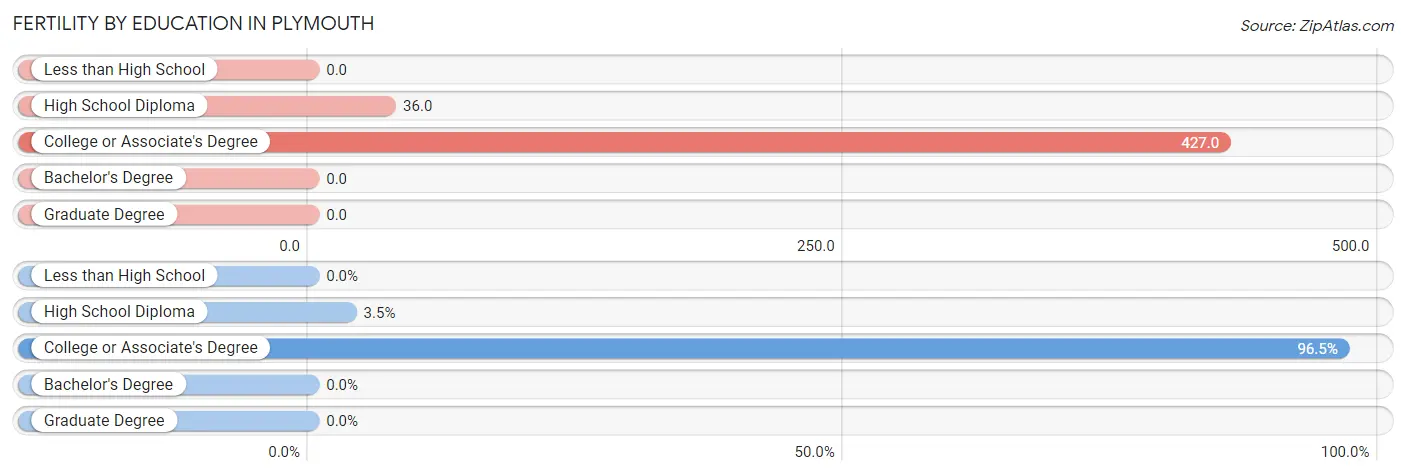
| Educational Attainment | Women with Births | Births / 1,000 Women |
| Less than High School | 0 (0.0%) | 0.0 |
| High School Diploma | 5 (3.5%) | 36.0 |
| College or Associate's Degree | 138 (96.5%) | 427.0 |
| Bachelor's Degree | 0 (0.0%) | 0.0 |
| Graduate Degree | 0 (0.0%) | 0.0 |
| Total | 143 (100.0%) | 259.0 |
Fertility by Education by Marriage Status in Plymouth
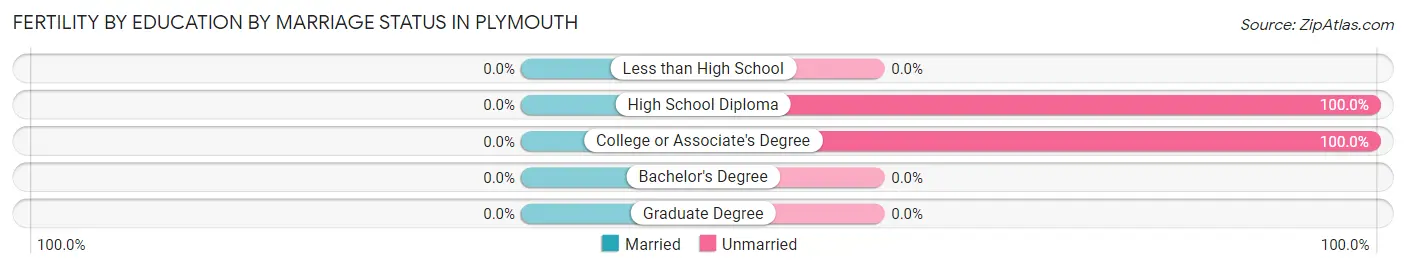
| Educational Attainment | Married | Unmarried |
| Less than High School | 0 (0.0%) | 0 (0.0%) |
| High School Diploma | 0 (0.0%) | 5 (100.0%) |
| College or Associate's Degree | 0 (0.0%) | 138 (100.0%) |
| Bachelor's Degree | 0 (0.0%) | 0 (0.0%) |
| Graduate Degree | 0 (0.0%) | 0 (0.0%) |
| Total | 0 (0.0%) | 143 (100.0%) |
Employment Characteristics in Plymouth
Employment by Class of Employer in Plymouth
Among the 872 employed individuals in Plymouth, private company employees (610 | 70.0%), state government employees (111 | 12.7%), and not-for-profit organizations (84 | 9.6%) make up the most common classes of employment.
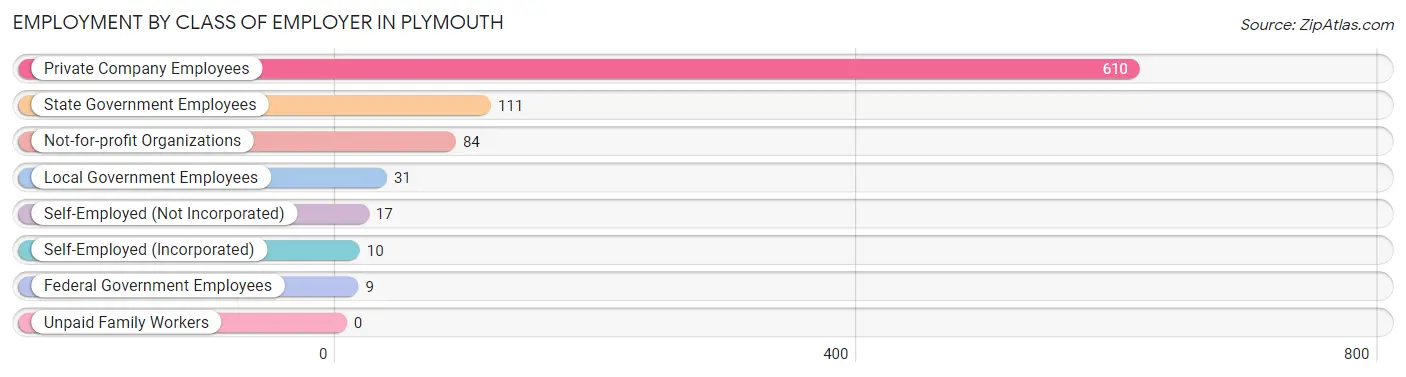
| Employer Class | # Employees | % Employees |
| Private Company Employees | 610 | 70.0% |
| Self-Employed (Incorporated) | 10 | 1.1% |
| Self-Employed (Not Incorporated) | 17 | 1.9% |
| Not-for-profit Organizations | 84 | 9.6% |
| Local Government Employees | 31 | 3.6% |
| State Government Employees | 111 | 12.7% |
| Federal Government Employees | 9 | 1.0% |
| Unpaid Family Workers | 0 | 0.0% |
| Total | 872 | 100.0% |
Employment Status by Age in Plymouth
According to the labor force statistics for Plymouth, out of the total population over 16 years of age (2,709), 42.9% or 1,162 individuals are in the labor force, with 24.2% or 281 of them unemployed. The age group with the highest labor force participation rate is 25 to 29 years, with 100.0% or 251 individuals in the labor force. Within the labor force, the 20 to 24 years age range has the highest percentage of unemployed individuals, with 63.2% or 43 of them being unemployed.
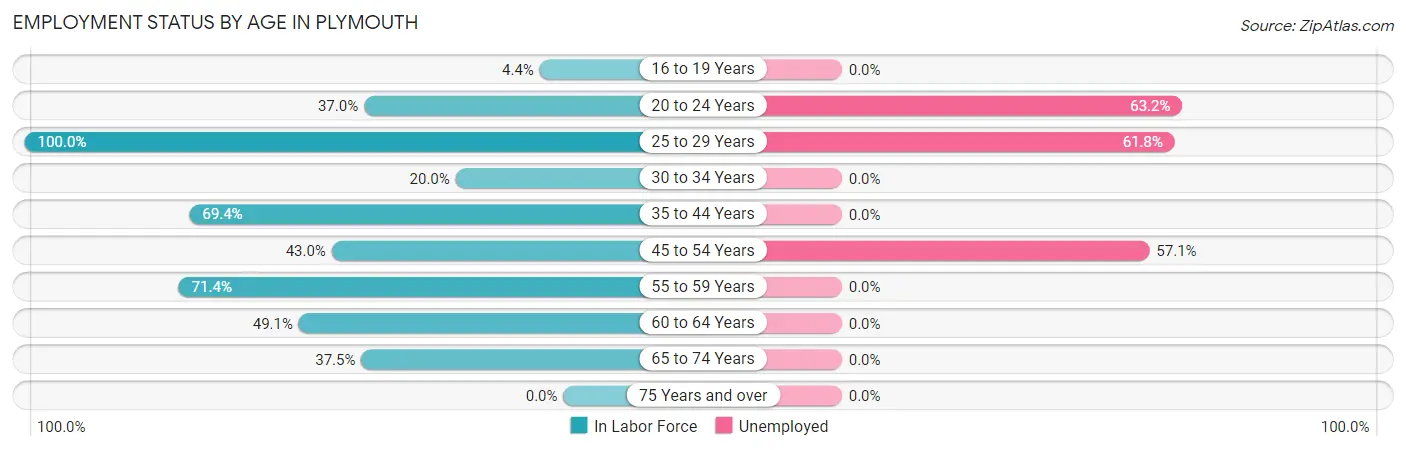
| Age Bracket | In Labor Force | Unemployed |
| 16 to 19 Years | 10 (4.4%) | 0 (0.0%) |
| 20 to 24 Years | 68 (37.0%) | 43 (63.2%) |
| 25 to 29 Years | 251 (100.0%) | 155 (61.8%) |
| 30 to 34 Years | 13 (20.0%) | 0 (0.0%) |
| 35 to 44 Years | 193 (69.4%) | 0 (0.0%) |
| 45 to 54 Years | 147 (43.0%) | 84 (57.1%) |
| 55 to 59 Years | 115 (71.4%) | 0 (0.0%) |
| 60 to 64 Years | 171 (49.1%) | 0 (0.0%) |
| 65 to 74 Years | 195 (37.5%) | 0 (0.0%) |
| 75 Years and over | 0 (0.0%) | 0 (0.0%) |
| Total | 1,162 (42.9%) | 281 (24.2%) |
Employment Status by Educational Attainment in Plymouth
According to labor force statistics for Plymouth, 61.6% of individuals (890) out of the total population between 25 and 64 years of age (1,445) are in the labor force, with 26.9% or 239 of them being unemployed. The group with the highest labor force participation rate are those with the educational attainment of college / associate degree, with 89.1% or 566 individuals in the labor force. Within the labor force, individuals with high school diploma education have the highest percentage of unemployment, with 34.9% or 101 of them being unemployed.
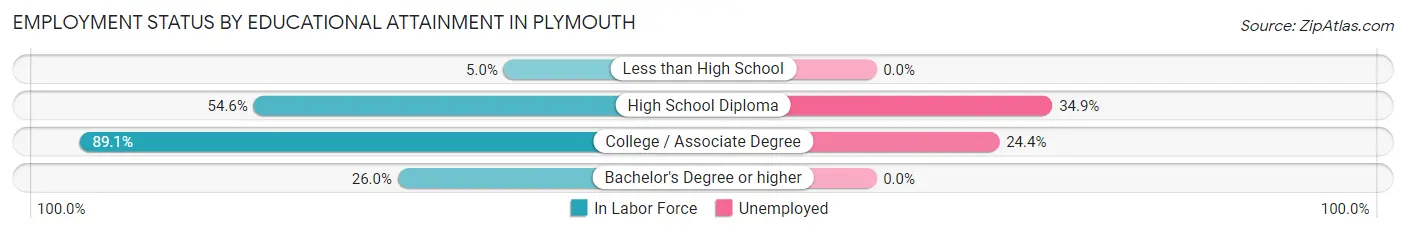
| Educational Attainment | In Labor Force | Unemployed |
| Less than High School | 9 (5.0%) | 0 (0.0%) |
| High School Diploma | 289 (54.6%) | 185 (34.9%) |
| College / Associate Degree | 566 (89.1%) | 155 (24.4%) |
| Bachelor's Degree or higher | 26 (26.0%) | 0 (0.0%) |
| Total | 890 (61.6%) | 389 (26.9%) |
Employment Occupations by Sex in Plymouth
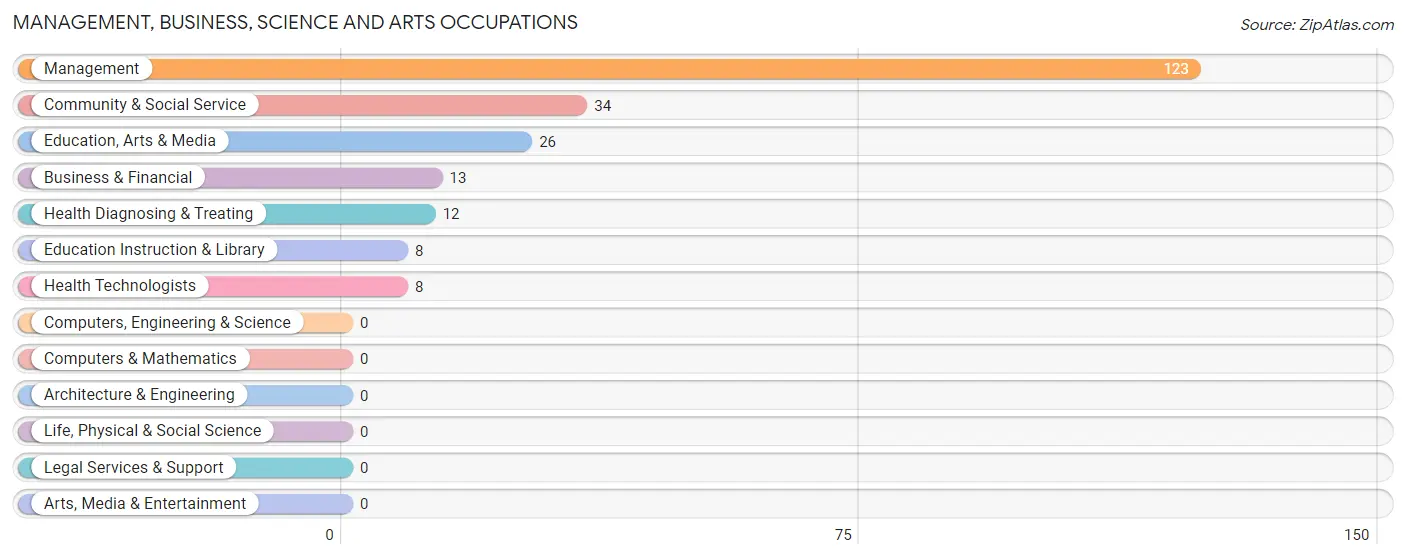
Management, Business, Science and Arts Occupations
The most common Management, Business, Science and Arts occupations in Plymouth are Management (123 | 14.0%), Community & Social Service (34 | 3.9%), Education, Arts & Media (26 | 2.9%), Business & Financial (13 | 1.5%), and Health Diagnosing & Treating (12 | 1.4%).
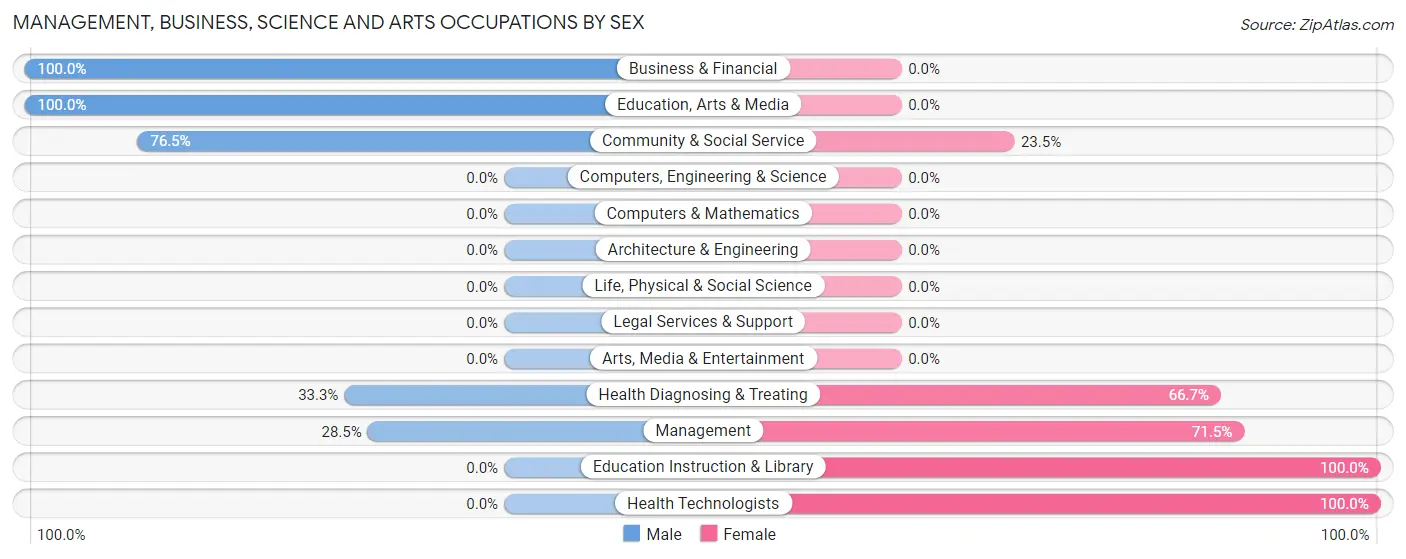
Management, Business, Science and Arts Occupations by Sex
Within the Management, Business, Science and Arts occupations in Plymouth, the most male-oriented occupations are Business & Financial (100.0%), Education, Arts & Media (100.0%), and Community & Social Service (76.5%), while the most female-oriented occupations are Education Instruction & Library (100.0%), Health Technologists (100.0%), and Management (71.5%).
| Occupation | Male | Female |
| Management | 35 (28.5%) | 88 (71.5%) |
| Business & Financial | 13 (100.0%) | 0 (0.0%) |
| Computers, Engineering & Science | 0 (0.0%) | 0 (0.0%) |
| Computers & Mathematics | 0 (0.0%) | 0 (0.0%) |
| Architecture & Engineering | 0 (0.0%) | 0 (0.0%) |
| Life, Physical & Social Science | 0 (0.0%) | 0 (0.0%) |
| Community & Social Service | 26 (76.5%) | 8 (23.5%) |
| Education, Arts & Media | 26 (100.0%) | 0 (0.0%) |
| Legal Services & Support | 0 (0.0%) | 0 (0.0%) |
| Education Instruction & Library | 0 (0.0%) | 8 (100.0%) |
| Arts, Media & Entertainment | 0 (0.0%) | 0 (0.0%) |
| Health Diagnosing & Treating | 4 (33.3%) | 8 (66.7%) |
| Health Technologists | 0 (0.0%) | 8 (100.0%) |
| Total (Category) | 78 (42.9%) | 104 (57.1%) |
| Total (Overall) | 357 (40.5%) | 524 (59.5%) |
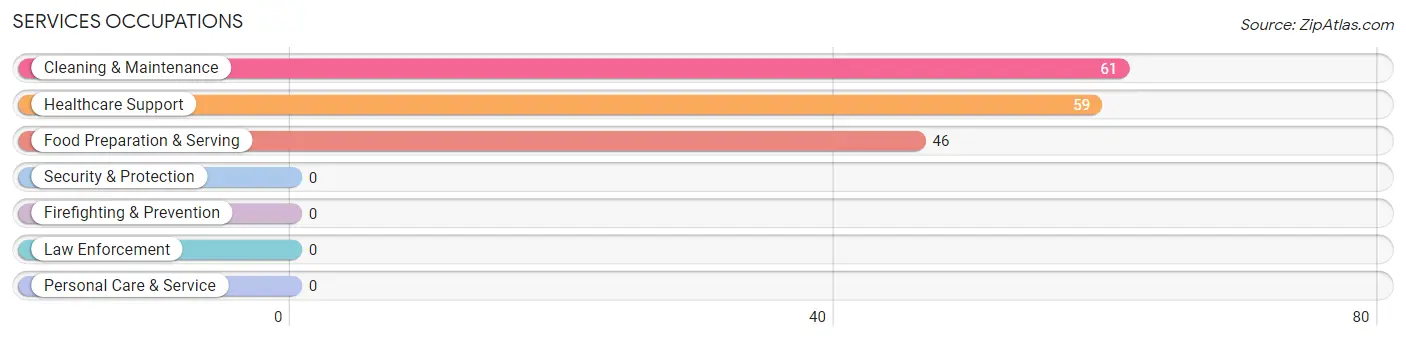
Services Occupations
The most common Services occupations in Plymouth are Cleaning & Maintenance (61 | 6.9%), Healthcare Support (59 | 6.7%), and Food Preparation & Serving (46 | 5.2%).
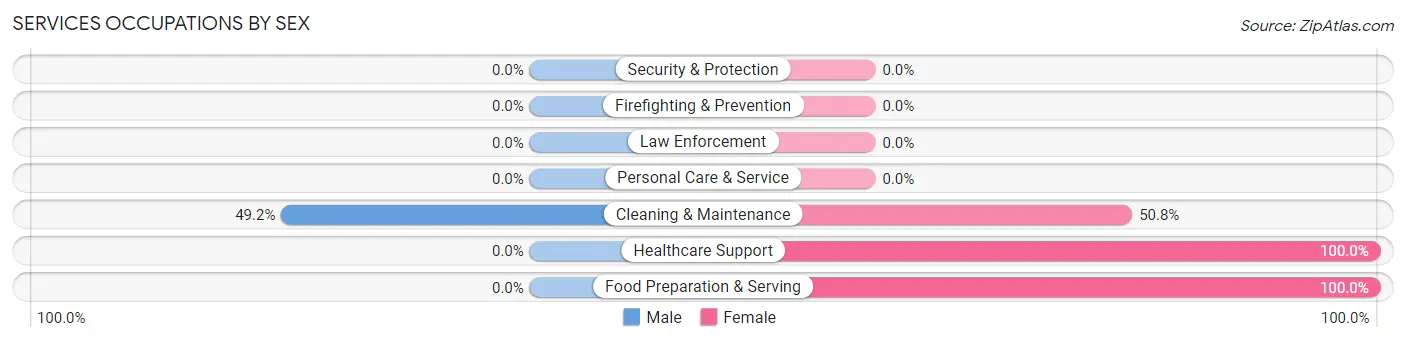
Services Occupations by Sex
| Occupation | Male | Female |
| Healthcare Support | 0 (0.0%) | 59 (100.0%) |
| Security & Protection | 0 (0.0%) | 0 (0.0%) |
| Firefighting & Prevention | 0 (0.0%) | 0 (0.0%) |
| Law Enforcement | 0 (0.0%) | 0 (0.0%) |
| Food Preparation & Serving | 0 (0.0%) | 46 (100.0%) |
| Cleaning & Maintenance | 30 (49.2%) | 31 (50.8%) |
| Personal Care & Service | 0 (0.0%) | 0 (0.0%) |
| Total (Category) | 30 (18.1%) | 136 (81.9%) |
| Total (Overall) | 357 (40.5%) | 524 (59.5%) |
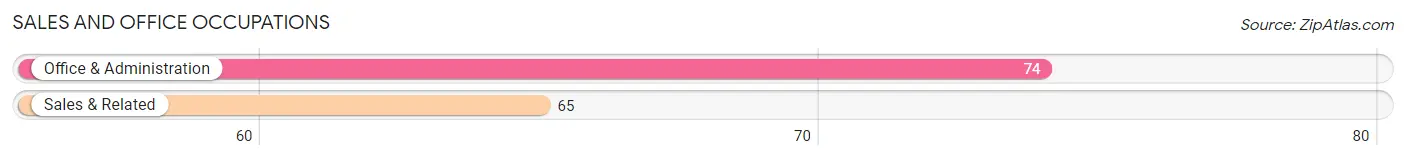
Sales and Office Occupations
The most common Sales and Office occupations in Plymouth are Office & Administration (74 | 8.4%), and Sales & Related (65 | 7.4%).
Sales and Office Occupations by Sex
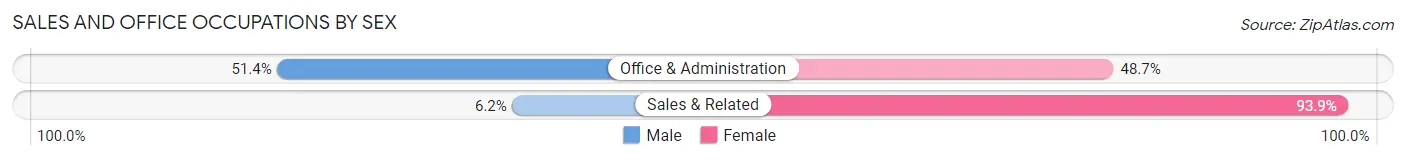
| Occupation | Male | Female |
| Sales & Related | 4 (6.1%) | 61 (93.9%) |
| Office & Administration | 38 (51.3%) | 36 (48.6%) |
| Total (Category) | 42 (30.2%) | 97 (69.8%) |
| Total (Overall) | 357 (40.5%) | 524 (59.5%) |
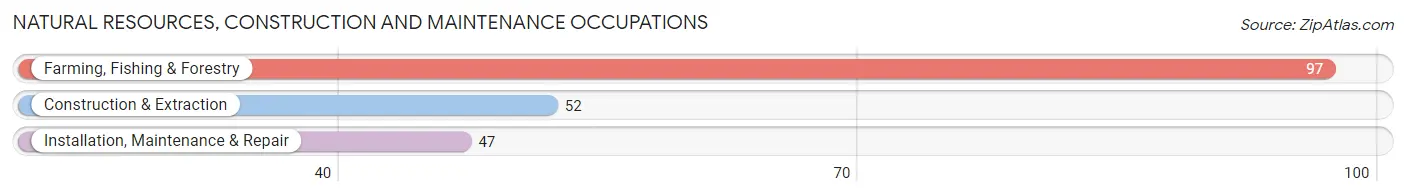
Natural Resources, Construction and Maintenance Occupations
The most common Natural Resources, Construction and Maintenance occupations in Plymouth are Farming, Fishing & Forestry (97 | 11.0%), Construction & Extraction (52 | 5.9%), and Installation, Maintenance & Repair (47 | 5.3%).
Natural Resources, Construction and Maintenance Occupations by Sex
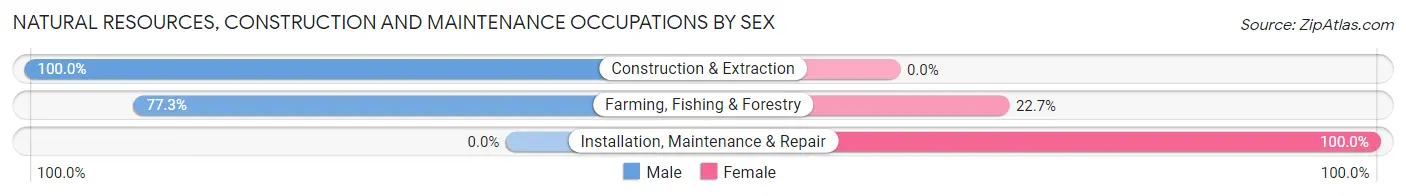
| Occupation | Male | Female |
| Farming, Fishing & Forestry | 75 (77.3%) | 22 (22.7%) |
| Construction & Extraction | 52 (100.0%) | 0 (0.0%) |
| Installation, Maintenance & Repair | 0 (0.0%) | 47 (100.0%) |
| Total (Category) | 127 (64.8%) | 69 (35.2%) |
| Total (Overall) | 357 (40.5%) | 524 (59.5%) |
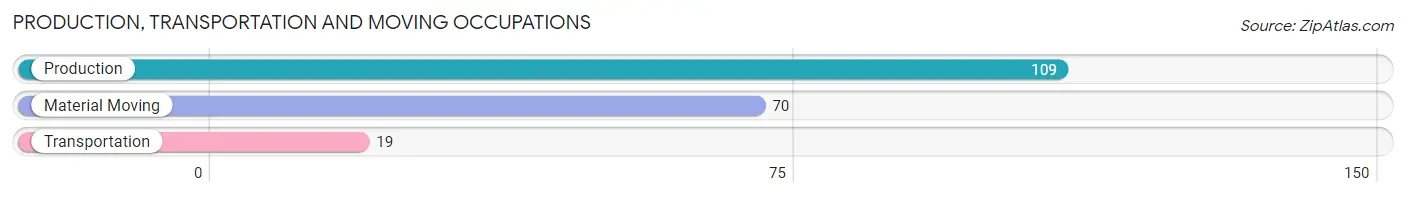
Production, Transportation and Moving Occupations
The most common Production, Transportation and Moving occupations in Plymouth are Production (109 | 12.4%), Material Moving (70 | 8.0%), and Transportation (19 | 2.2%).
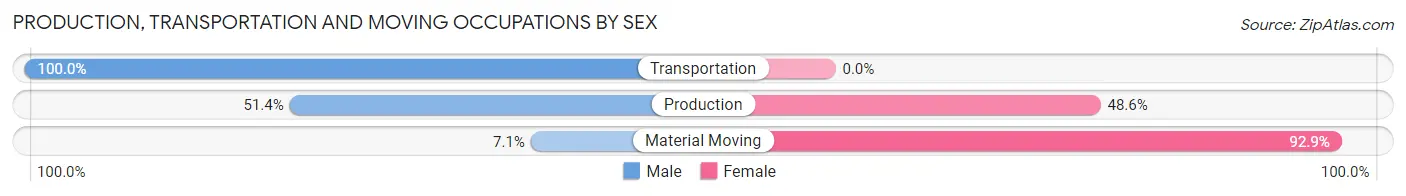
Production, Transportation and Moving Occupations by Sex
| Occupation | Male | Female |
| Production | 56 (51.4%) | 53 (48.6%) |
| Transportation | 19 (100.0%) | 0 (0.0%) |
| Material Moving | 5 (7.1%) | 65 (92.9%) |
| Total (Category) | 80 (40.4%) | 118 (59.6%) |
| Total (Overall) | 357 (40.5%) | 524 (59.5%) |
Employment Industries by Sex in Plymouth
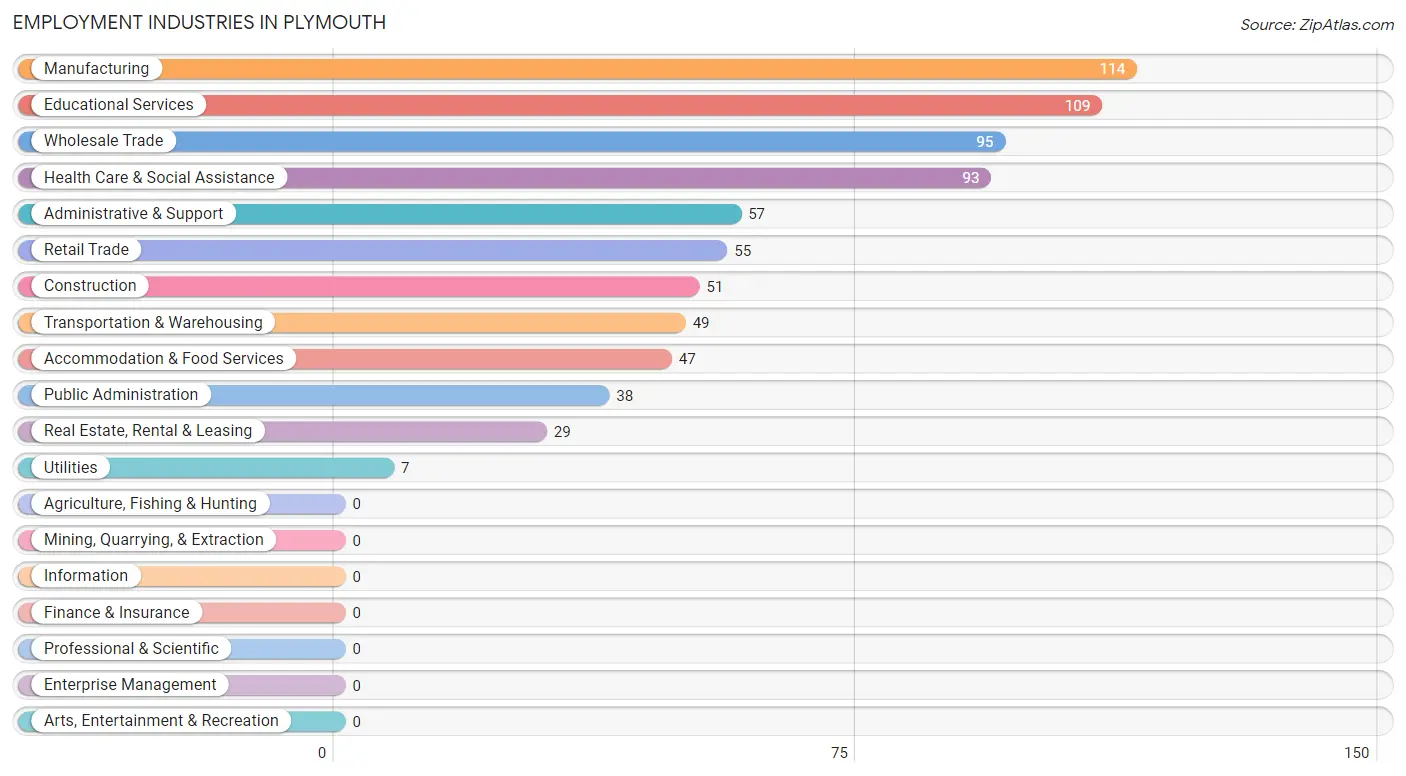
Employment Industries in Plymouth
The major employment industries in Plymouth include Manufacturing (114 | 12.9%), Educational Services (109 | 12.4%), Wholesale Trade (95 | 10.8%), Health Care & Social Assistance (93 | 10.6%), and Administrative & Support (57 | 6.5%).
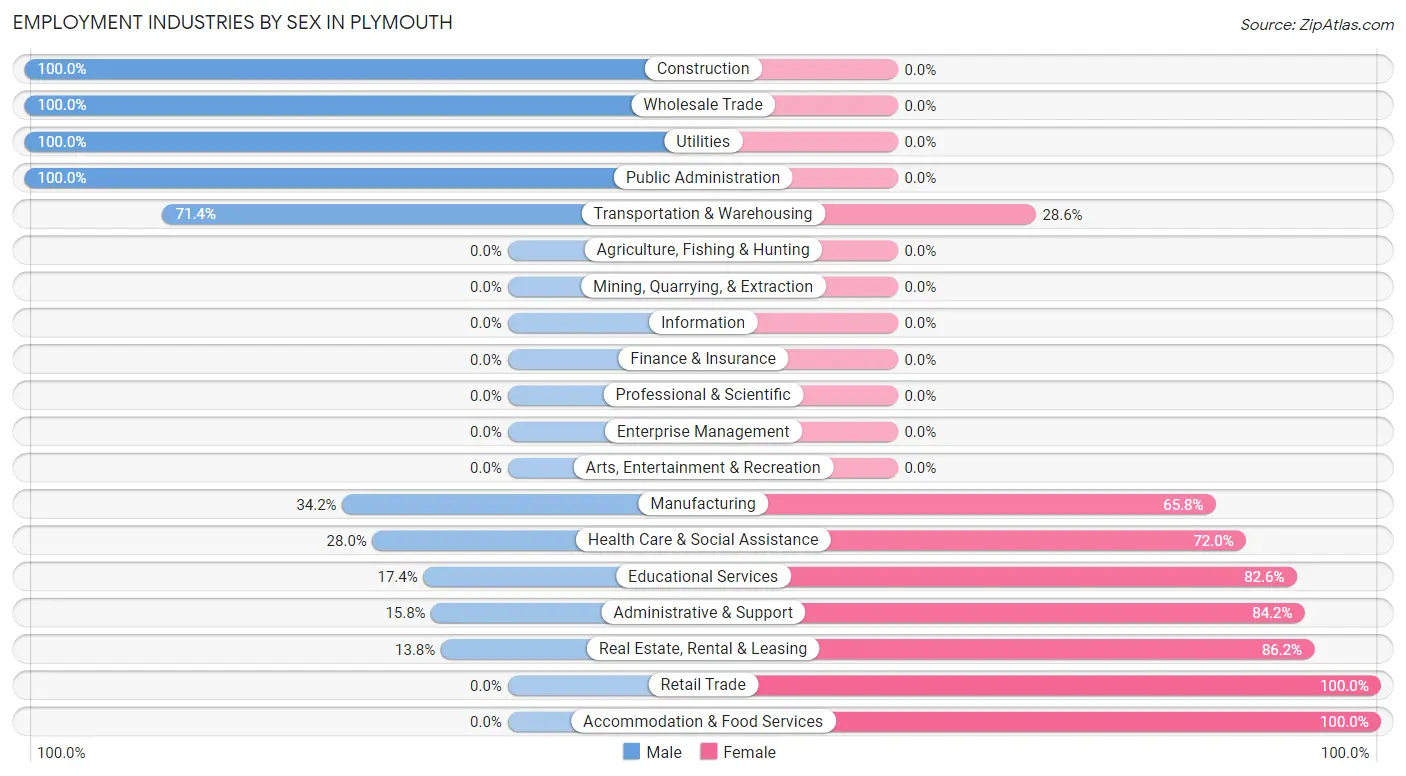
Employment Industries by Sex in Plymouth
The Plymouth industries that see more men than women are Construction (100.0%), Wholesale Trade (100.0%), and Utilities (100.0%), whereas the industries that tend to have a higher number of women are Retail Trade (100.0%), Accommodation & Food Services (100.0%), and Real Estate, Rental & Leasing (86.2%).
| Industry | Male | Female |
| Agriculture, Fishing & Hunting | 0 (0.0%) | 0 (0.0%) |
| Mining, Quarrying, & Extraction | 0 (0.0%) | 0 (0.0%) |
| Construction | 51 (100.0%) | 0 (0.0%) |
| Manufacturing | 39 (34.2%) | 75 (65.8%) |
| Wholesale Trade | 95 (100.0%) | 0 (0.0%) |
| Retail Trade | 0 (0.0%) | 55 (100.0%) |
| Transportation & Warehousing | 35 (71.4%) | 14 (28.6%) |
| Utilities | 7 (100.0%) | 0 (0.0%) |
| Information | 0 (0.0%) | 0 (0.0%) |
| Finance & Insurance | 0 (0.0%) | 0 (0.0%) |
| Real Estate, Rental & Leasing | 4 (13.8%) | 25 (86.2%) |
| Professional & Scientific | 0 (0.0%) | 0 (0.0%) |
| Enterprise Management | 0 (0.0%) | 0 (0.0%) |
| Administrative & Support | 9 (15.8%) | 48 (84.2%) |
| Educational Services | 19 (17.4%) | 90 (82.6%) |
| Health Care & Social Assistance | 26 (28.0%) | 67 (72.0%) |
| Arts, Entertainment & Recreation | 0 (0.0%) | 0 (0.0%) |
| Accommodation & Food Services | 0 (0.0%) | 47 (100.0%) |
| Public Administration | 38 (100.0%) | 0 (0.0%) |
| Total | 357 (40.5%) | 524 (59.5%) |
Education in Plymouth
School Enrollment in Plymouth
The most common levels of schooling among the 577 students in Plymouth are middle school (221 | 38.3%), elementary school (170 | 29.5%), and high school (114 | 19.8%).
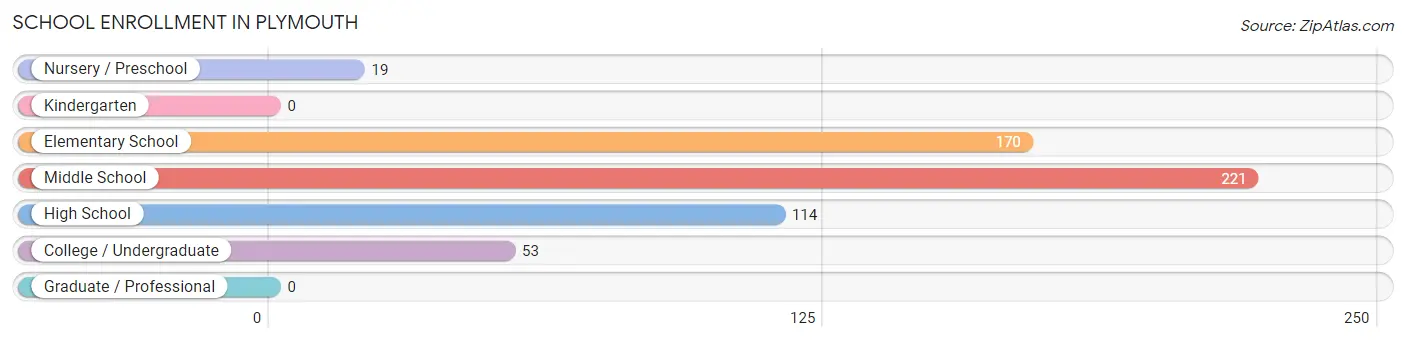
| School Level | # Students | % Students |
| Nursery / Preschool | 19 | 3.3% |
| Kindergarten | 0 | 0.0% |
| Elementary School | 170 | 29.5% |
| Middle School | 221 | 38.3% |
| High School | 114 | 19.8% |
| College / Undergraduate | 53 | 9.2% |
| Graduate / Professional | 0 | 0.0% |
| Total | 577 | 100.0% |
School Enrollment by Age by Funding Source in Plymouth
Out of a total of 577 students who are enrolled in schools in Plymouth, 7 (1.2%) attend a private institution, while the remaining 570 (98.8%) are enrolled in public schools. The age group of 20 to 24 year olds has the highest likelihood of being enrolled in private schools, with 7 (36.8% in the age bracket) enrolled. Conversely, the age group of 5 to 9 year old has the lowest likelihood of being enrolled in a private school, with 189 (100.0% in the age bracket) attending a public institution.
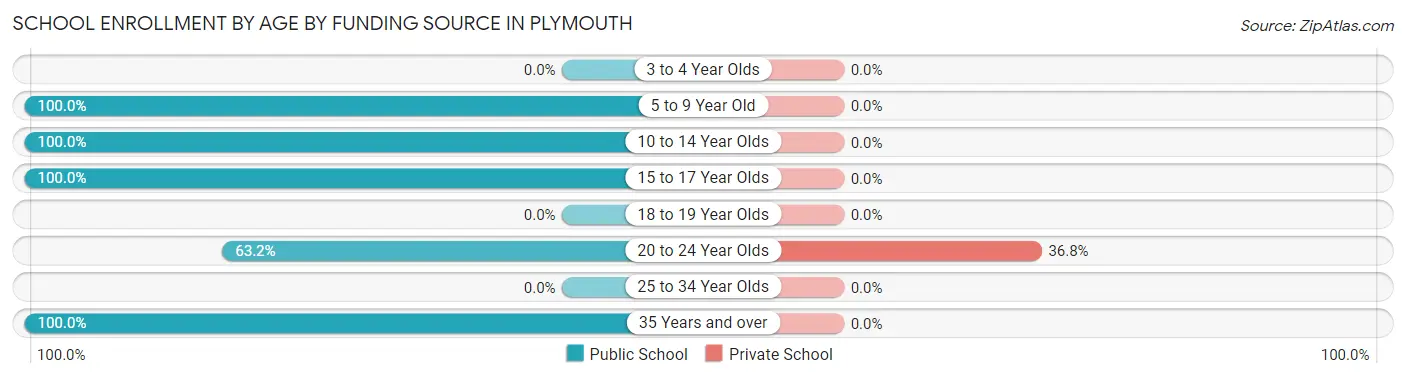
| Age Bracket | Public School | Private School |
| 3 to 4 Year Olds | 0 (0.0%) | 0 (0.0%) |
| 5 to 9 Year Old | 189 (100.0%) | 0 (0.0%) |
| 10 to 14 Year Olds | 112 (100.0%) | 0 (0.0%) |
| 15 to 17 Year Olds | 217 (100.0%) | 0 (0.0%) |
| 18 to 19 Year Olds | 0 (0.0%) | 0 (0.0%) |
| 20 to 24 Year Olds | 12 (63.2%) | 7 (36.8%) |
| 25 to 34 Year Olds | 0 (0.0%) | 0 (0.0%) |
| 35 Years and over | 40 (100.0%) | 0 (0.0%) |
| Total | 570 (98.8%) | 7 (1.2%) |
Educational Attainment by Field of Study in Plymouth
Social sciences (68 | 53.5%), business (24 | 18.9%), science & technology (18 | 14.2%), education (8 | 6.3%), and computers & mathematics (5 | 3.9%) are the most common fields of study among 127 individuals in Plymouth who have obtained a bachelor's degree or higher.
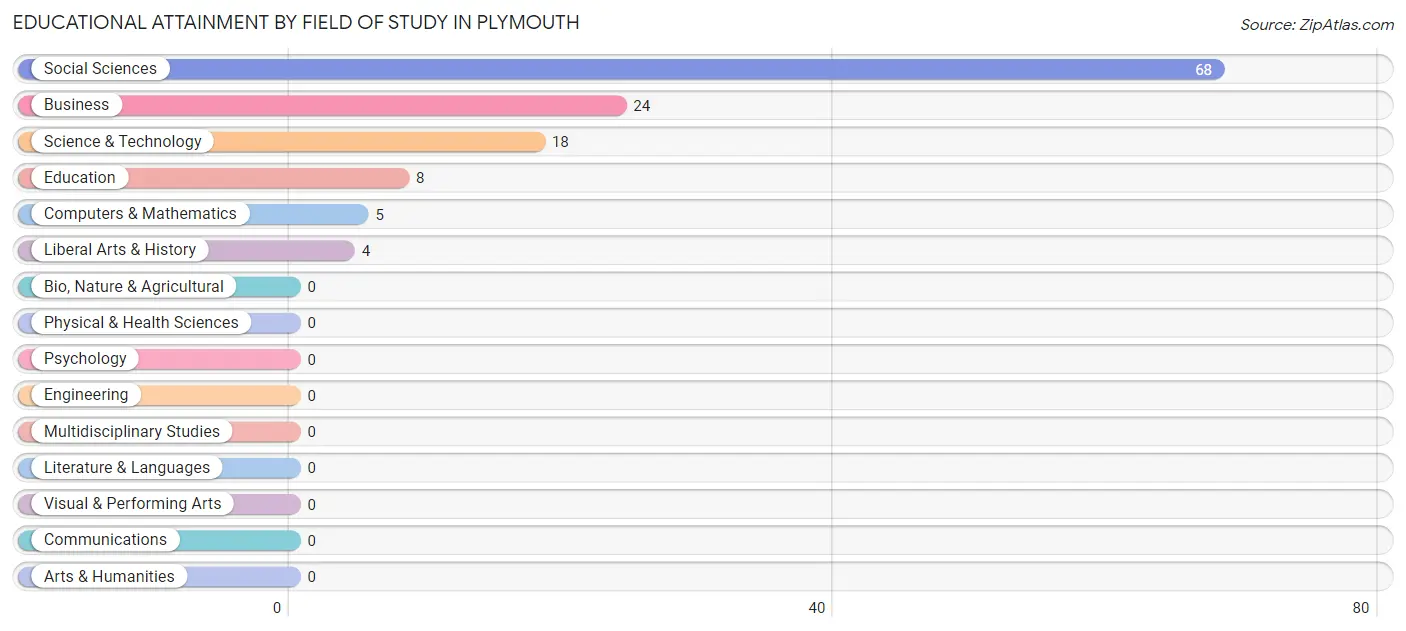
| Field of Study | # Graduates | % Graduates |
| Computers & Mathematics | 5 | 3.9% |
| Bio, Nature & Agricultural | 0 | 0.0% |
| Physical & Health Sciences | 0 | 0.0% |
| Psychology | 0 | 0.0% |
| Social Sciences | 68 | 53.5% |
| Engineering | 0 | 0.0% |
| Multidisciplinary Studies | 0 | 0.0% |
| Science & Technology | 18 | 14.2% |
| Business | 24 | 18.9% |
| Education | 8 | 6.3% |
| Literature & Languages | 0 | 0.0% |
| Liberal Arts & History | 4 | 3.2% |
| Visual & Performing Arts | 0 | 0.0% |
| Communications | 0 | 0.0% |
| Arts & Humanities | 0 | 0.0% |
| Total | 127 | 100.0% |
Transportation & Commute in Plymouth
Vehicle Availability by Sex in Plymouth
The most prevalent vehicle ownership categories in Plymouth are males with 1 vehicle (162, accounting for 45.4%) and females with 1 vehicle (269, making up 31.5%).
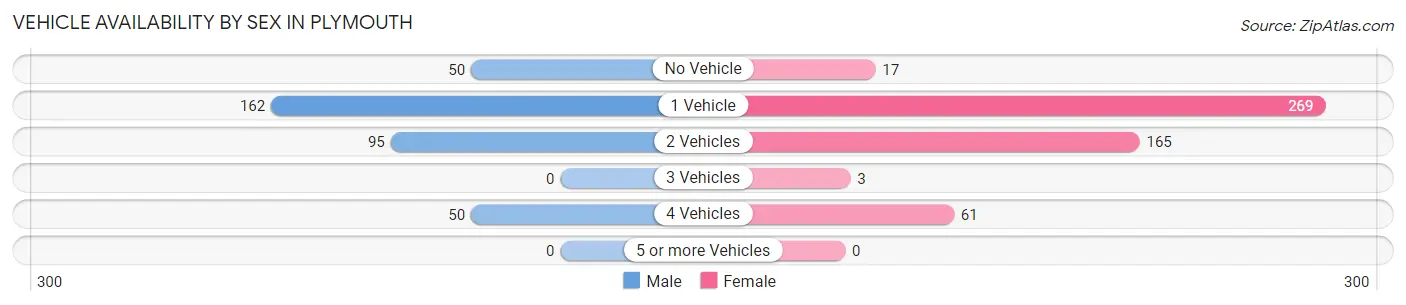
| Vehicles Available | Male | Female |
| No Vehicle | 50 (14.0%) | 17 (3.3%) |
| 1 Vehicle | 162 (45.4%) | 269 (52.2%) |
| 2 Vehicles | 95 (26.6%) | 165 (32.0%) |
| 3 Vehicles | 0 (0.0%) | 3 (0.6%) |
| 4 Vehicles | 50 (14.0%) | 61 (11.8%) |
| 5 or more Vehicles | 0 (0.0%) | 0 (0.0%) |
| Total | 357 (100.0%) | 515 (100.0%) |
Commute Time in Plymouth
The most frequently occuring commute durations in Plymouth are 10 to 14 minutes (250 commuters, 29.2%), 5 to 9 minutes (169 commuters, 19.8%), and 60 to 89 minutes (127 commuters, 14.8%).
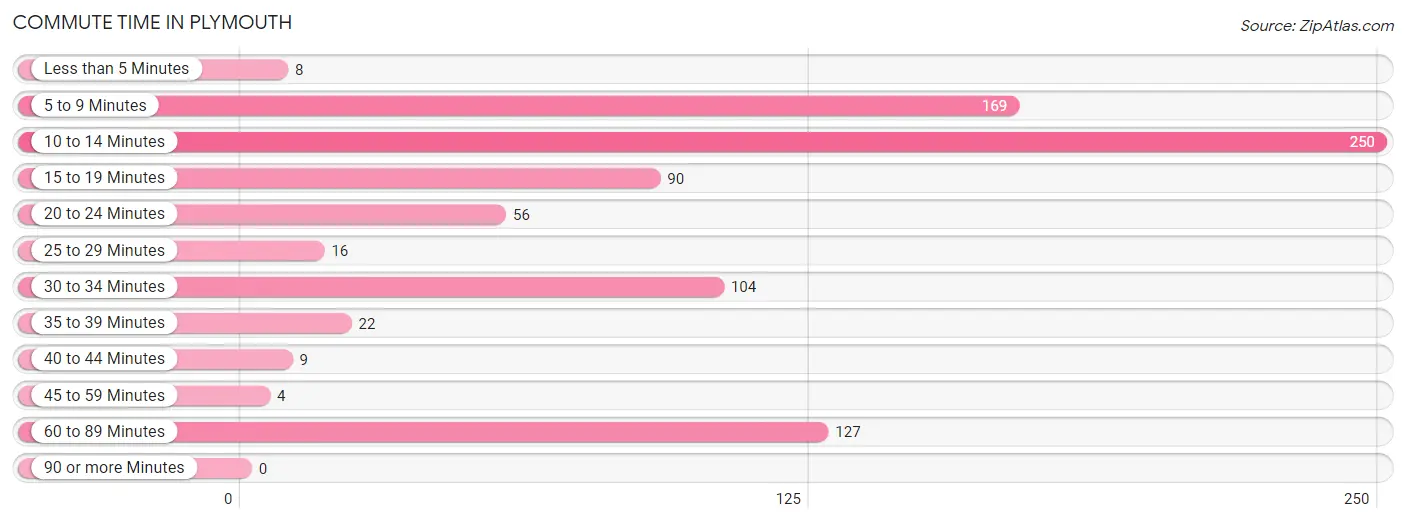
| Commute Time | # Commuters | % Commuters |
| Less than 5 Minutes | 8 | 0.9% |
| 5 to 9 Minutes | 169 | 19.8% |
| 10 to 14 Minutes | 250 | 29.2% |
| 15 to 19 Minutes | 90 | 10.5% |
| 20 to 24 Minutes | 56 | 6.6% |
| 25 to 29 Minutes | 16 | 1.9% |
| 30 to 34 Minutes | 104 | 12.2% |
| 35 to 39 Minutes | 22 | 2.6% |
| 40 to 44 Minutes | 9 | 1.1% |
| 45 to 59 Minutes | 4 | 0.5% |
| 60 to 89 Minutes | 127 | 14.8% |
| 90 or more Minutes | 0 | 0.0% |
Commute Time by Sex in Plymouth
The most common commute times in Plymouth are 60 to 89 minutes (117 commuters, 34.4%) for males and 10 to 14 minutes (221 commuters, 42.9%) for females.
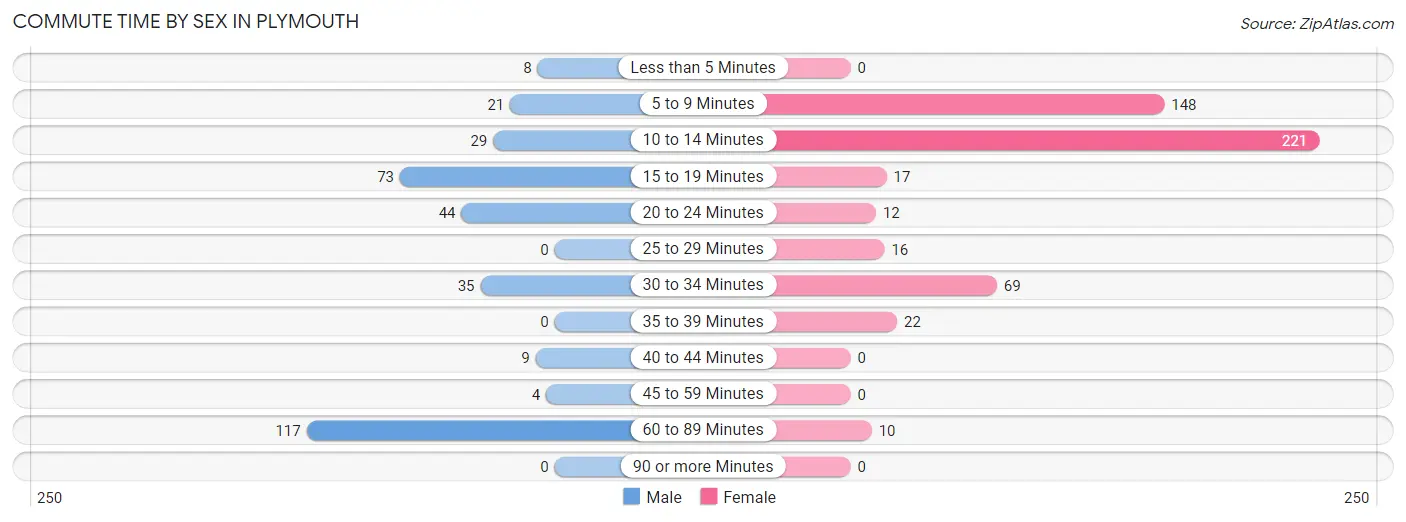
| Commute Time | Male | Female |
| Less than 5 Minutes | 8 (2.4%) | 0 (0.0%) |
| 5 to 9 Minutes | 21 (6.2%) | 148 (28.7%) |
| 10 to 14 Minutes | 29 (8.5%) | 221 (42.9%) |
| 15 to 19 Minutes | 73 (21.5%) | 17 (3.3%) |
| 20 to 24 Minutes | 44 (12.9%) | 12 (2.3%) |
| 25 to 29 Minutes | 0 (0.0%) | 16 (3.1%) |
| 30 to 34 Minutes | 35 (10.3%) | 69 (13.4%) |
| 35 to 39 Minutes | 0 (0.0%) | 22 (4.3%) |
| 40 to 44 Minutes | 9 (2.6%) | 0 (0.0%) |
| 45 to 59 Minutes | 4 (1.2%) | 0 (0.0%) |
| 60 to 89 Minutes | 117 (34.4%) | 10 (1.9%) |
| 90 or more Minutes | 0 (0.0%) | 0 (0.0%) |
Time of Departure to Work by Sex in Plymouth
The most frequent times of departure to work in Plymouth are 6:00 AM to 6:29 AM (93, 27.4%) for males and 8:00 AM to 8:29 AM (114, 22.1%) for females.
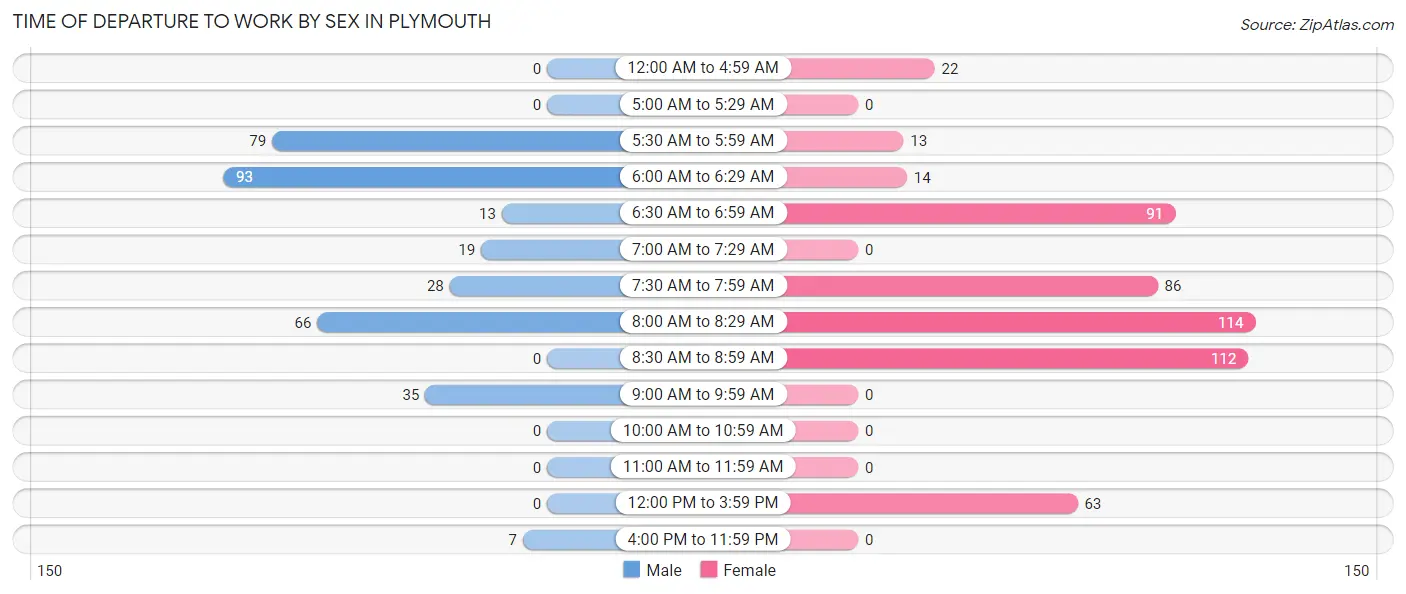
| Time of Departure | Male | Female |
| 12:00 AM to 4:59 AM | 0 (0.0%) | 22 (4.3%) |
| 5:00 AM to 5:29 AM | 0 (0.0%) | 0 (0.0%) |
| 5:30 AM to 5:59 AM | 79 (23.2%) | 13 (2.5%) |
| 6:00 AM to 6:29 AM | 93 (27.4%) | 14 (2.7%) |
| 6:30 AM to 6:59 AM | 13 (3.8%) | 91 (17.7%) |
| 7:00 AM to 7:29 AM | 19 (5.6%) | 0 (0.0%) |
| 7:30 AM to 7:59 AM | 28 (8.2%) | 86 (16.7%) |
| 8:00 AM to 8:29 AM | 66 (19.4%) | 114 (22.1%) |
| 8:30 AM to 8:59 AM | 0 (0.0%) | 112 (21.7%) |
| 9:00 AM to 9:59 AM | 35 (10.3%) | 0 (0.0%) |
| 10:00 AM to 10:59 AM | 0 (0.0%) | 0 (0.0%) |
| 11:00 AM to 11:59 AM | 0 (0.0%) | 0 (0.0%) |
| 12:00 PM to 3:59 PM | 0 (0.0%) | 63 (12.2%) |
| 4:00 PM to 11:59 PM | 7 (2.1%) | 0 (0.0%) |
| Total | 340 (100.0%) | 515 (100.0%) |
Housing Occupancy in Plymouth
Occupancy by Ownership in Plymouth
Of the total 1,582 dwellings in Plymouth, owner-occupied units account for 661 (41.8%), while renter-occupied units make up 921 (58.2%).
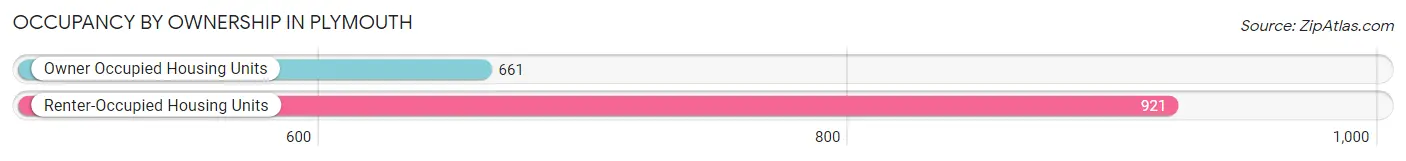
| Occupancy | # Housing Units | % Housing Units |
| Owner Occupied Housing Units | 661 | 41.8% |
| Renter-Occupied Housing Units | 921 | 58.2% |
| Total Occupied Housing Units | 1,582 | 100.0% |
Occupancy by Household Size in Plymouth
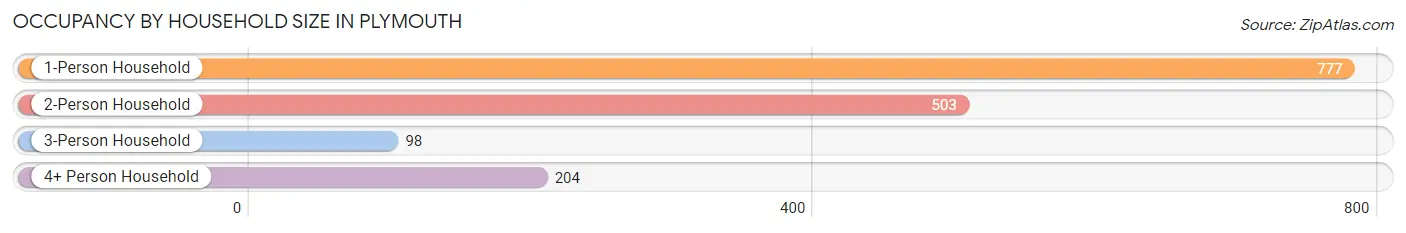
| Household Size | # Housing Units | % Housing Units |
| 1-Person Household | 777 | 49.1% |
| 2-Person Household | 503 | 31.8% |
| 3-Person Household | 98 | 6.2% |
| 4+ Person Household | 204 | 12.9% |
| Total Housing Units | 1,582 | 100.0% |
Occupancy by Ownership by Household Size in Plymouth
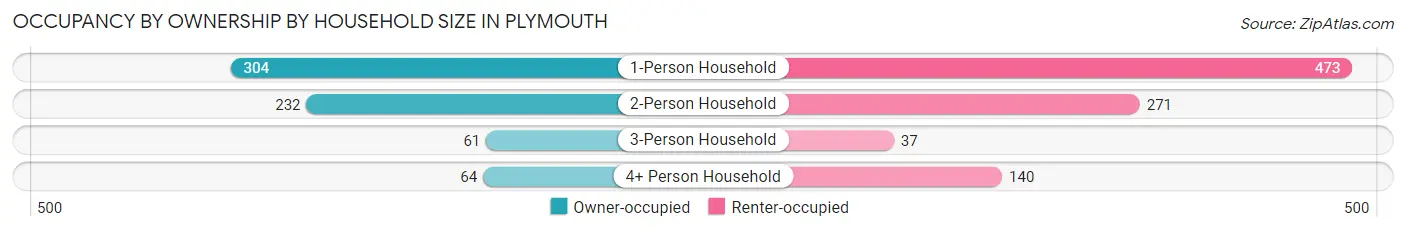
| Household Size | Owner-occupied | Renter-occupied |
| 1-Person Household | 304 (39.1%) | 473 (60.9%) |
| 2-Person Household | 232 (46.1%) | 271 (53.9%) |
| 3-Person Household | 61 (62.2%) | 37 (37.8%) |
| 4+ Person Household | 64 (31.4%) | 140 (68.6%) |
| Total Housing Units | 661 (41.8%) | 921 (58.2%) |
Occupancy by Educational Attainment in Plymouth
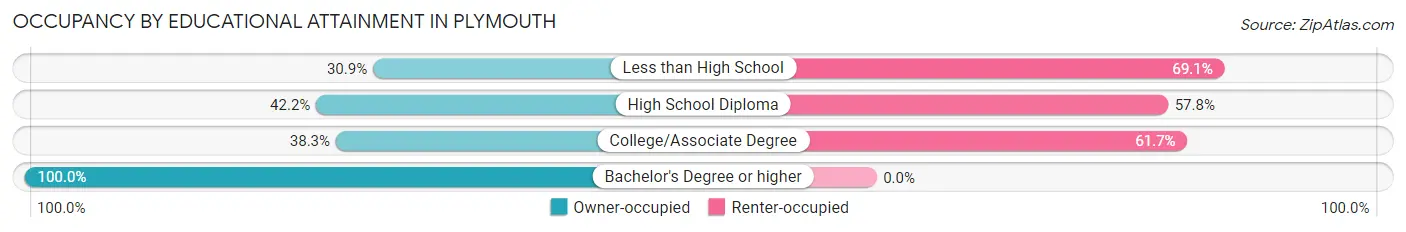
| Household Size | Owner-occupied | Renter-occupied |
| Less than High School | 90 (30.9%) | 201 (69.1%) |
| High School Diploma | 235 (42.2%) | 322 (57.8%) |
| College/Associate Degree | 247 (38.3%) | 398 (61.7%) |
| Bachelor's Degree or higher | 89 (100.0%) | 0 (0.0%) |
Occupancy by Age of Householder in Plymouth
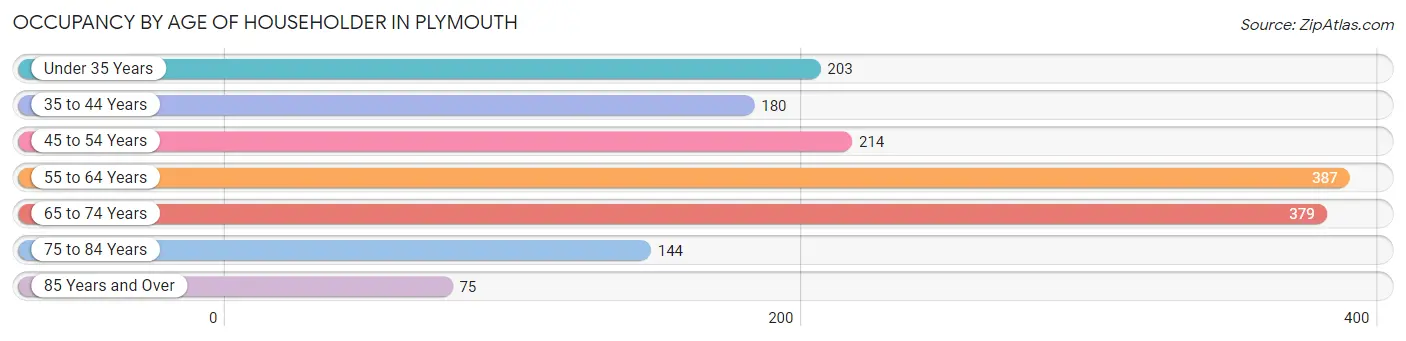
| Age Bracket | # Households | % Households |
| Under 35 Years | 203 | 12.8% |
| 35 to 44 Years | 180 | 11.4% |
| 45 to 54 Years | 214 | 13.5% |
| 55 to 64 Years | 387 | 24.5% |
| 65 to 74 Years | 379 | 24.0% |
| 75 to 84 Years | 144 | 9.1% |
| 85 Years and Over | 75 | 4.7% |
| Total | 1,582 | 100.0% |
Housing Finances in Plymouth
Median Income by Occupancy in Plymouth
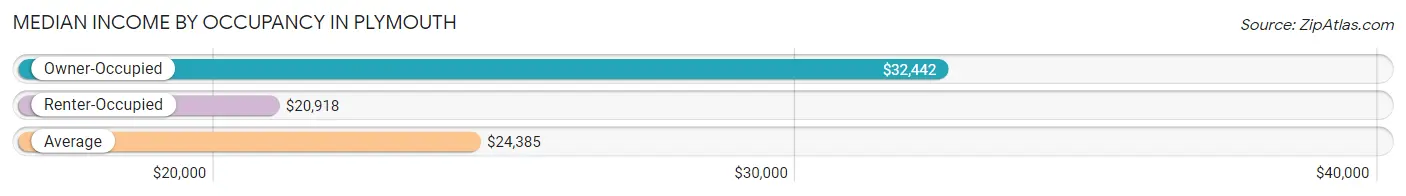
| Occupancy Type | # Households | Median Income |
| Owner-Occupied | 661 (41.8%) | $32,442 |
| Renter-Occupied | 921 (58.2%) | $20,918 |
| Average | 1,582 (100.0%) | $24,385 |
Occupancy by Householder Income Bracket in Plymouth
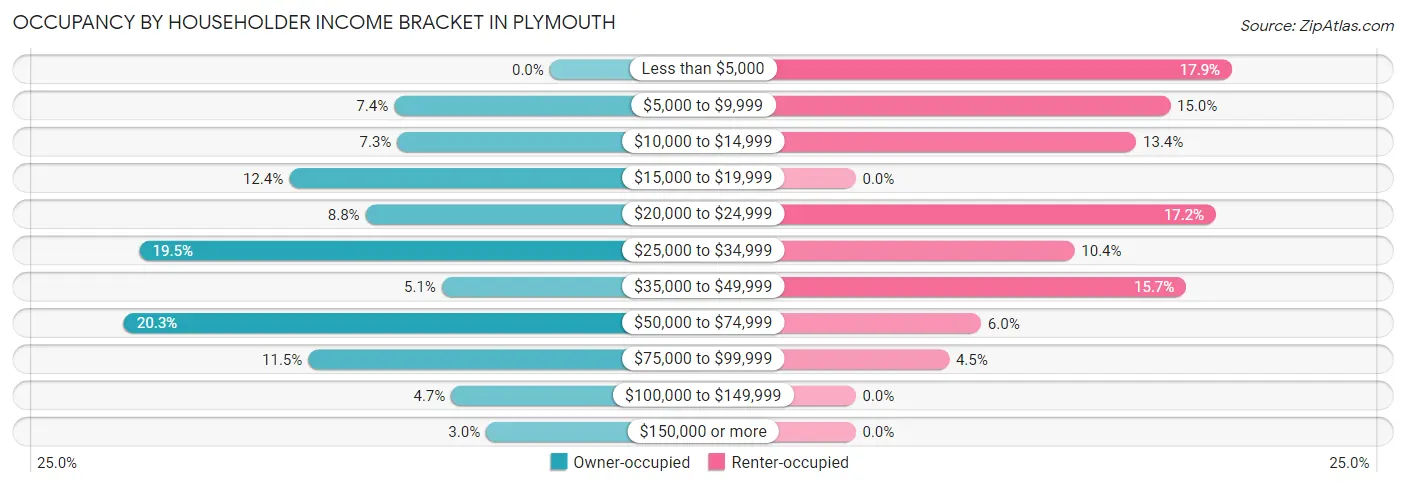
| Income Bracket | Owner-occupied | Renter-occupied |
| Less than $5,000 | 0 (0.0%) | 165 (17.9%) |
| $5,000 to $9,999 | 49 (7.4%) | 138 (15.0%) |
| $10,000 to $14,999 | 48 (7.3%) | 123 (13.4%) |
| $15,000 to $19,999 | 82 (12.4%) | 0 (0.0%) |
| $20,000 to $24,999 | 58 (8.8%) | 158 (17.2%) |
| $25,000 to $34,999 | 129 (19.5%) | 96 (10.4%) |
| $35,000 to $49,999 | 34 (5.1%) | 145 (15.7%) |
| $50,000 to $74,999 | 134 (20.3%) | 55 (6.0%) |
| $75,000 to $99,999 | 76 (11.5%) | 41 (4.4%) |
| $100,000 to $149,999 | 31 (4.7%) | 0 (0.0%) |
| $150,000 or more | 20 (3.0%) | 0 (0.0%) |
| Total | 661 (100.0%) | 921 (100.0%) |
Monthly Housing Cost Tiers in Plymouth
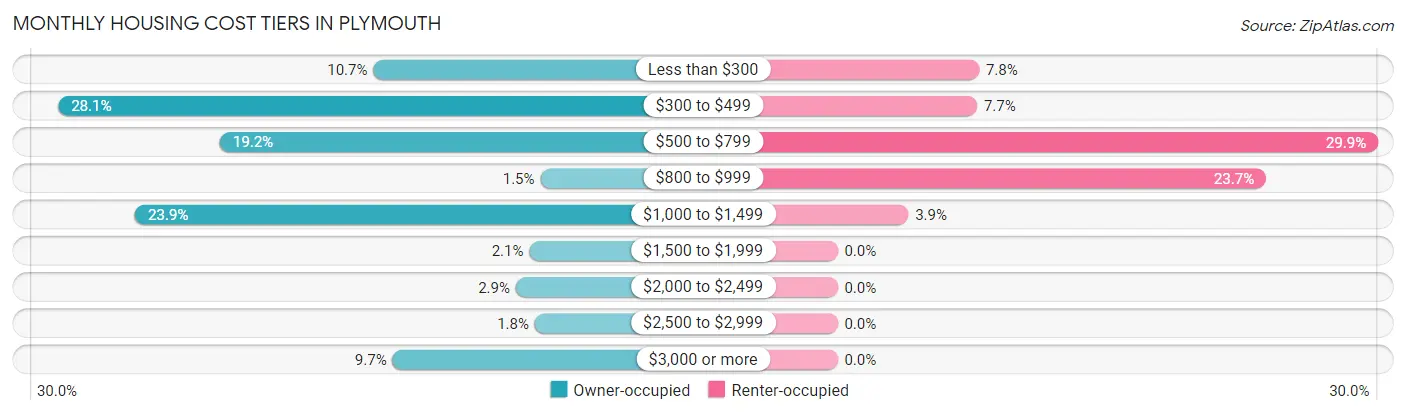
| Monthly Cost | Owner-occupied | Renter-occupied |
| Less than $300 | 71 (10.7%) | 72 (7.8%) |
| $300 to $499 | 186 (28.1%) | 71 (7.7%) |
| $500 to $799 | 127 (19.2%) | 275 (29.9%) |
| $800 to $999 | 10 (1.5%) | 218 (23.7%) |
| $1,000 to $1,499 | 158 (23.9%) | 36 (3.9%) |
| $1,500 to $1,999 | 14 (2.1%) | 0 (0.0%) |
| $2,000 to $2,499 | 19 (2.9%) | 0 (0.0%) |
| $2,500 to $2,999 | 12 (1.8%) | 0 (0.0%) |
| $3,000 or more | 64 (9.7%) | 0 (0.0%) |
| Total | 661 (100.0%) | 921 (100.0%) |
Physical Housing Characteristics in Plymouth
Housing Structures in Plymouth
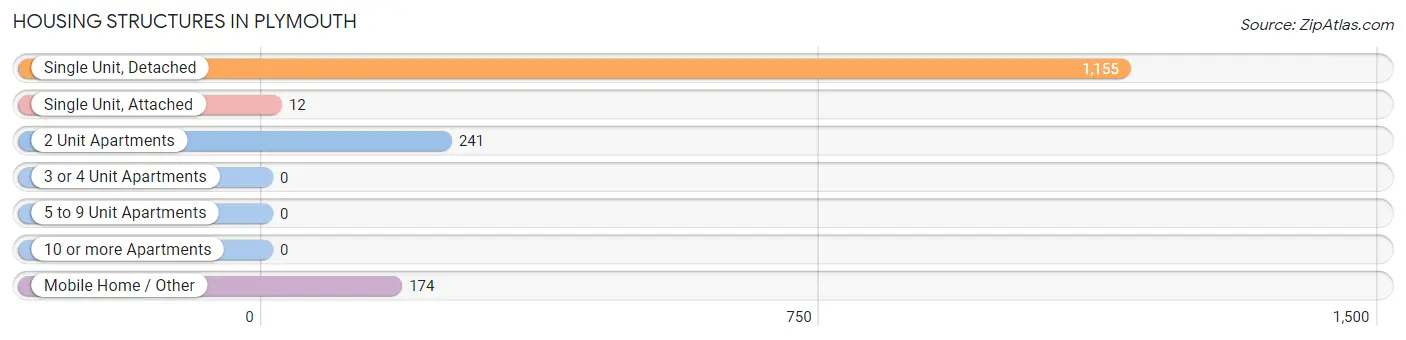
| Structure Type | # Housing Units | % Housing Units |
| Single Unit, Detached | 1,155 | 73.0% |
| Single Unit, Attached | 12 | 0.8% |
| 2 Unit Apartments | 241 | 15.2% |
| 3 or 4 Unit Apartments | 0 | 0.0% |
| 5 to 9 Unit Apartments | 0 | 0.0% |
| 10 or more Apartments | 0 | 0.0% |
| Mobile Home / Other | 174 | 11.0% |
| Total | 1,582 | 100.0% |
Housing Structures by Occupancy in Plymouth
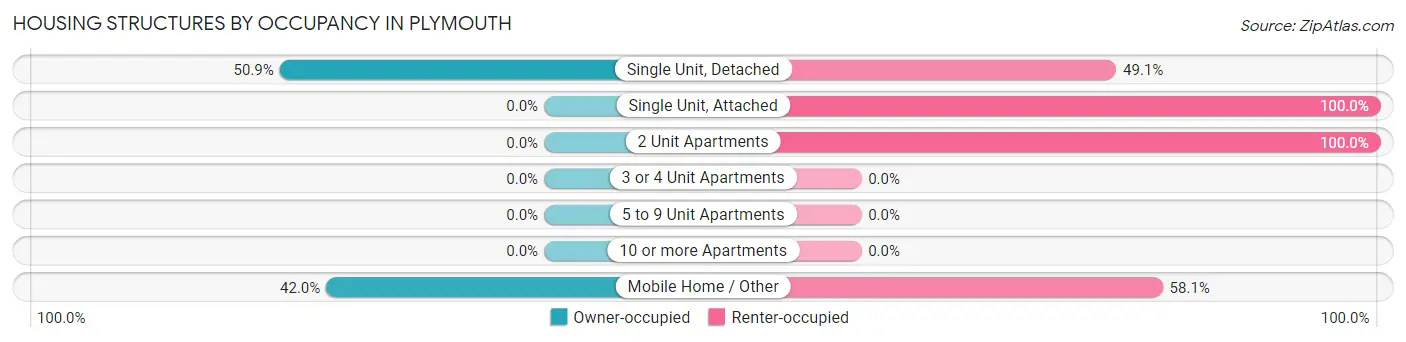
| Structure Type | Owner-occupied | Renter-occupied |
| Single Unit, Detached | 588 (50.9%) | 567 (49.1%) |
| Single Unit, Attached | 0 (0.0%) | 12 (100.0%) |
| 2 Unit Apartments | 0 (0.0%) | 241 (100.0%) |
| 3 or 4 Unit Apartments | 0 (0.0%) | 0 (0.0%) |
| 5 to 9 Unit Apartments | 0 (0.0%) | 0 (0.0%) |
| 10 or more Apartments | 0 (0.0%) | 0 (0.0%) |
| Mobile Home / Other | 73 (41.9%) | 101 (58.1%) |
| Total | 661 (41.8%) | 921 (58.2%) |
Housing Structures by Number of Rooms in Plymouth
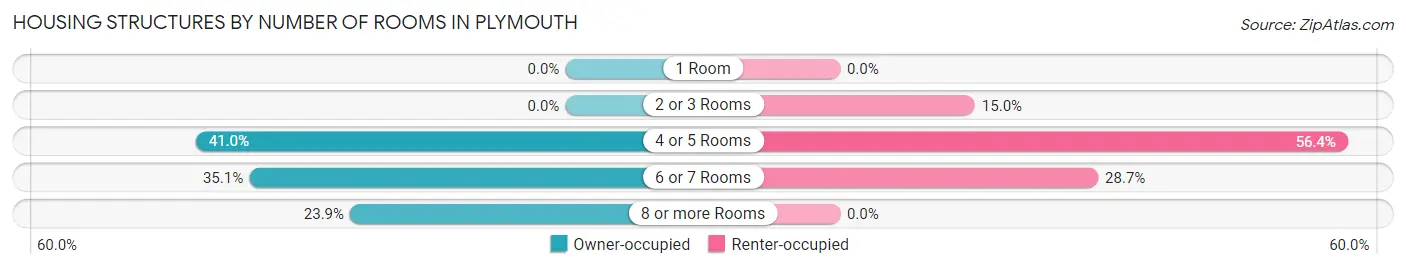
| Number of Rooms | Owner-occupied | Renter-occupied |
| 1 Room | 0 (0.0%) | 0 (0.0%) |
| 2 or 3 Rooms | 0 (0.0%) | 138 (15.0%) |
| 4 or 5 Rooms | 271 (41.0%) | 519 (56.4%) |
| 6 or 7 Rooms | 232 (35.1%) | 264 (28.7%) |
| 8 or more Rooms | 158 (23.9%) | 0 (0.0%) |
| Total | 661 (100.0%) | 921 (100.0%) |
Housing Structure by Heating Type in Plymouth
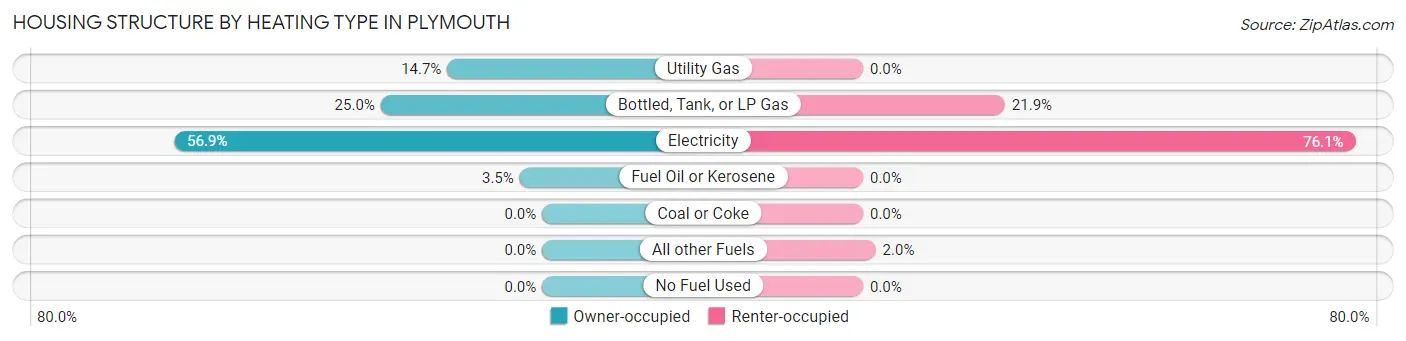
| Heating Type | Owner-occupied | Renter-occupied |
| Utility Gas | 97 (14.7%) | 0 (0.0%) |
| Bottled, Tank, or LP Gas | 165 (25.0%) | 202 (21.9%) |
| Electricity | 376 (56.9%) | 701 (76.1%) |
| Fuel Oil or Kerosene | 23 (3.5%) | 0 (0.0%) |
| Coal or Coke | 0 (0.0%) | 0 (0.0%) |
| All other Fuels | 0 (0.0%) | 18 (1.9%) |
| No Fuel Used | 0 (0.0%) | 0 (0.0%) |
| Total | 661 (100.0%) | 921 (100.0%) |
Household Vehicle Usage in Plymouth
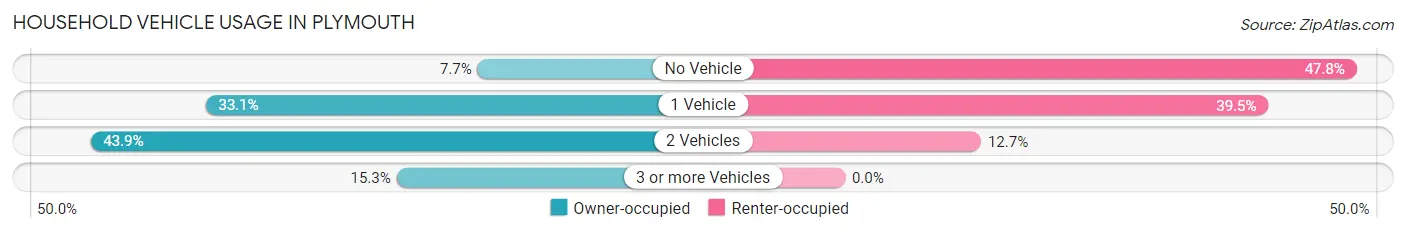
| Vehicles per Household | Owner-occupied | Renter-occupied |
| No Vehicle | 51 (7.7%) | 440 (47.8%) |
| 1 Vehicle | 219 (33.1%) | 364 (39.5%) |
| 2 Vehicles | 290 (43.9%) | 117 (12.7%) |
| 3 or more Vehicles | 101 (15.3%) | 0 (0.0%) |
| Total | 661 (100.0%) | 921 (100.0%) |
Real Estate & Mortgages in Plymouth
Real Estate and Mortgage Overview in Plymouth
| Characteristic | Without Mortgage | With Mortgage |
| Housing Units | 343 | 318 |
| Median Property Value | $87,800 | $101,400 |
| Median Household Income | - | - |
| Monthly Housing Costs | $454 | $64 |
| Real Estate Taxes | $1,235 | $0 |
Property Value by Mortgage Status in Plymouth
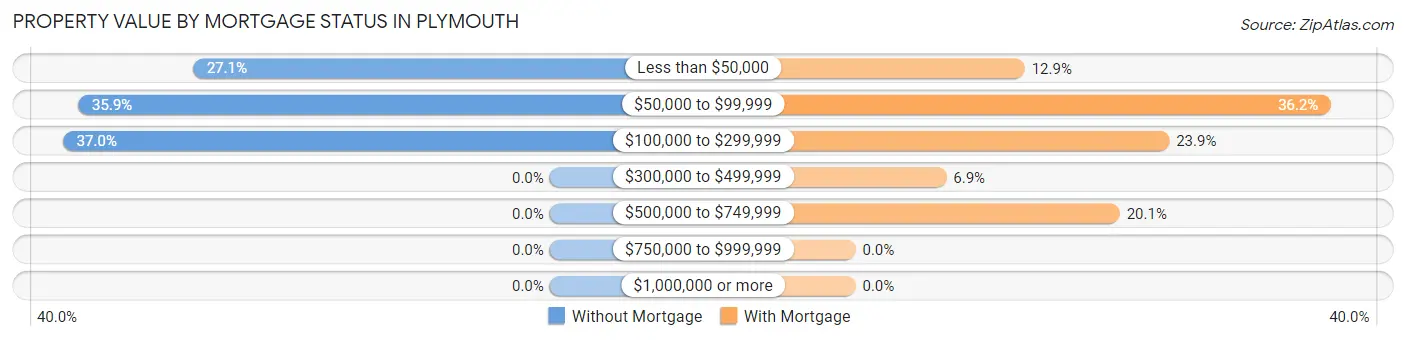
| Property Value | Without Mortgage | With Mortgage |
| Less than $50,000 | 93 (27.1%) | 41 (12.9%) |
| $50,000 to $99,999 | 123 (35.9%) | 115 (36.2%) |
| $100,000 to $299,999 | 127 (37.0%) | 76 (23.9%) |
| $300,000 to $499,999 | 0 (0.0%) | 22 (6.9%) |
| $500,000 to $749,999 | 0 (0.0%) | 64 (20.1%) |
| $750,000 to $999,999 | 0 (0.0%) | 0 (0.0%) |
| $1,000,000 or more | 0 (0.0%) | 0 (0.0%) |
| Total | 343 (100.0%) | 318 (100.0%) |
Household Income by Mortgage Status in Plymouth
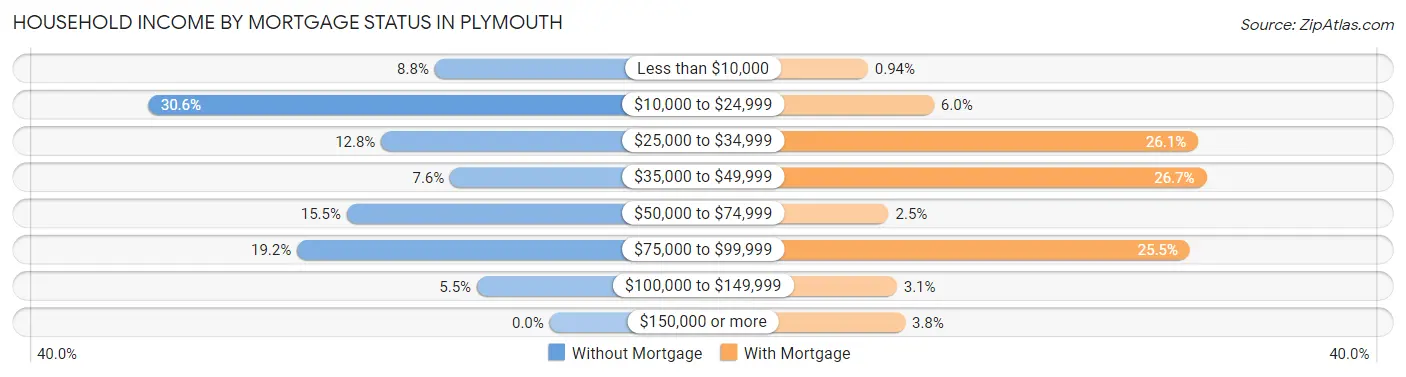
| Household Income | Without Mortgage | With Mortgage |
| Less than $10,000 | 30 (8.7%) | 3 (0.9%) |
| $10,000 to $24,999 | 105 (30.6%) | 19 (6.0%) |
| $25,000 to $34,999 | 44 (12.8%) | 83 (26.1%) |
| $35,000 to $49,999 | 26 (7.6%) | 85 (26.7%) |
| $50,000 to $74,999 | 53 (15.4%) | 8 (2.5%) |
| $75,000 to $99,999 | 66 (19.2%) | 81 (25.5%) |
| $100,000 to $149,999 | 19 (5.5%) | 10 (3.1%) |
| $150,000 or more | 0 (0.0%) | 12 (3.8%) |
| Total | 343 (100.0%) | 318 (100.0%) |
Property Value to Household Income Ratio in Plymouth
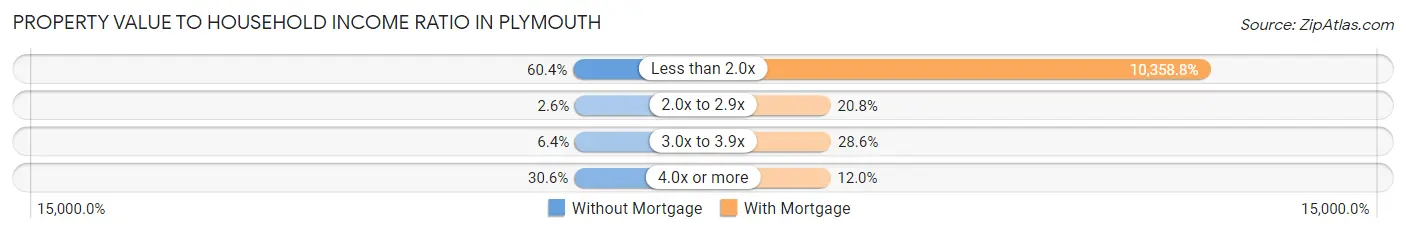
| Value-to-Income Ratio | Without Mortgage | With Mortgage |
| Less than 2.0x | 207 (60.4%) | 32,941 (10,358.8%) |
| 2.0x to 2.9x | 9 (2.6%) | 66 (20.7%) |
| 3.0x to 3.9x | 22 (6.4%) | 91 (28.6%) |
| 4.0x or more | 105 (30.6%) | 38 (11.9%) |
| Total | 343 (100.0%) | 318 (100.0%) |
Real Estate Taxes by Mortgage Status in Plymouth
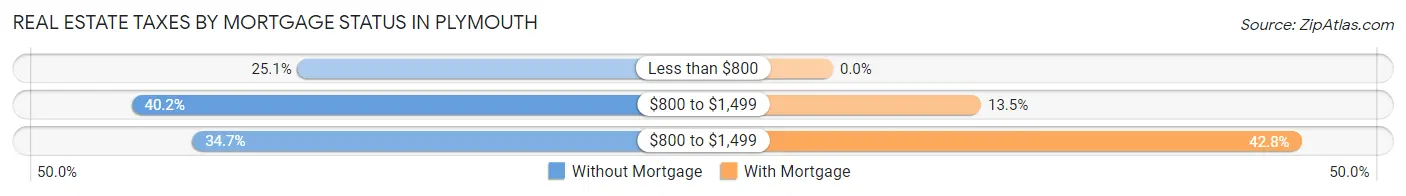
| Property Taxes | Without Mortgage | With Mortgage |
| Less than $800 | 86 (25.1%) | 0 (0.0%) |
| $800 to $1,499 | 138 (40.2%) | 43 (13.5%) |
| $800 to $1,499 | 119 (34.7%) | 136 (42.8%) |
| Total | 343 (100.0%) | 318 (100.0%) |
Health & Disability in Plymouth
Health Insurance Coverage by Age in Plymouth
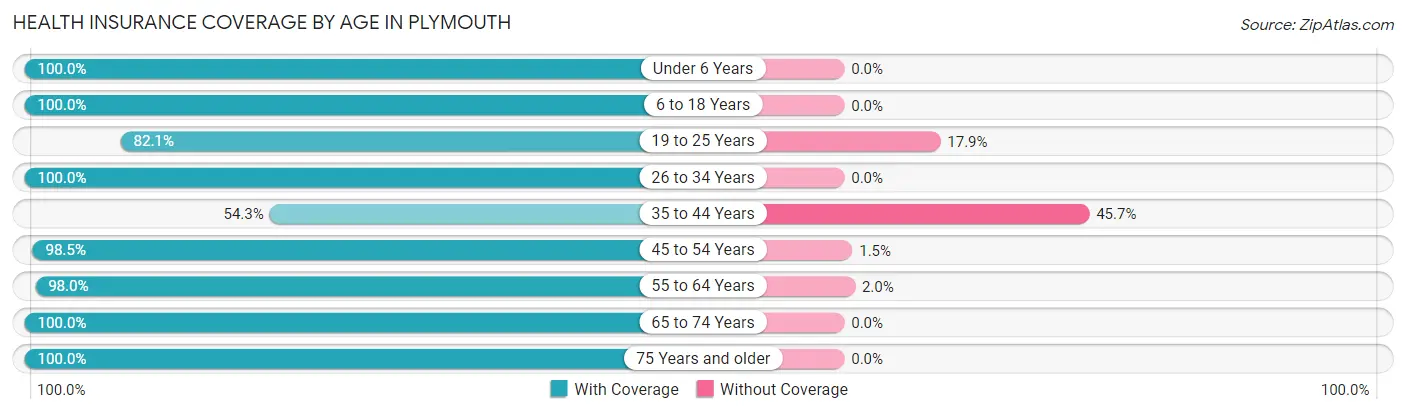
| Age Bracket | With Coverage | Without Coverage |
| Under 6 Years | 215 (100.0%) | 0 (0.0%) |
| 6 to 18 Years | 506 (100.0%) | 0 (0.0%) |
| 19 to 25 Years | 243 (82.1%) | 53 (17.9%) |
| 26 to 34 Years | 312 (100.0%) | 0 (0.0%) |
| 35 to 44 Years | 151 (54.3%) | 127 (45.7%) |
| 45 to 54 Years | 330 (98.5%) | 5 (1.5%) |
| 55 to 64 Years | 493 (98.0%) | 10 (2.0%) |
| 65 to 74 Years | 491 (100.0%) | 0 (0.0%) |
| 75 Years and older | 270 (100.0%) | 0 (0.0%) |
| Total | 3,011 (93.9%) | 195 (6.1%) |
Health Insurance Coverage by Citizenship Status in Plymouth
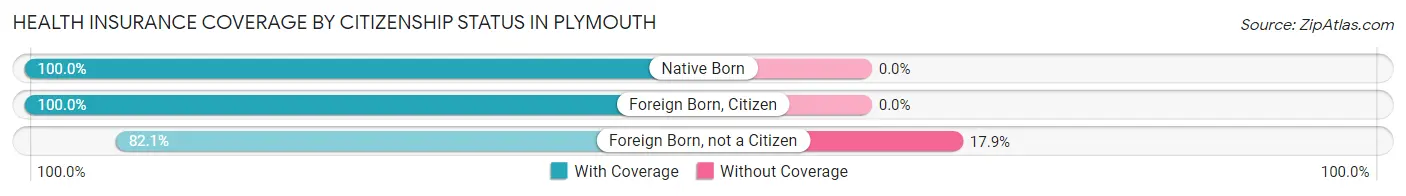
| Citizenship Status | With Coverage | Without Coverage |
| Native Born | 215 (100.0%) | 0 (0.0%) |
| Foreign Born, Citizen | 506 (100.0%) | 0 (0.0%) |
| Foreign Born, not a Citizen | 243 (82.1%) | 53 (17.9%) |
Health Insurance Coverage by Household Income in Plymouth
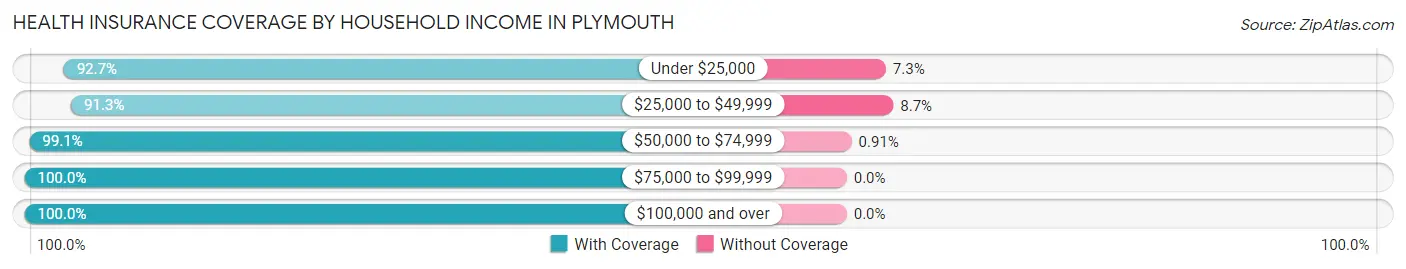
| Household Income | With Coverage | Without Coverage |
| Under $25,000 | 935 (92.7%) | 74 (7.3%) |
| $25,000 to $49,999 | 1,214 (91.3%) | 116 (8.7%) |
| $50,000 to $74,999 | 543 (99.1%) | 5 (0.9%) |
| $75,000 to $99,999 | 164 (100.0%) | 0 (0.0%) |
| $100,000 and over | 134 (100.0%) | 0 (0.0%) |
Public vs Private Health Insurance Coverage by Age in Plymouth
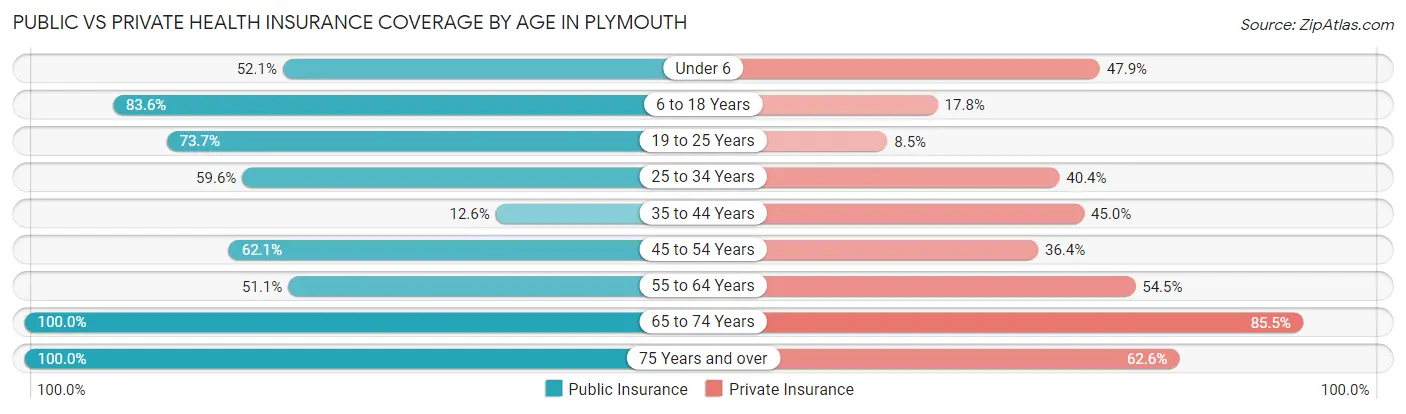
| Age Bracket | Public Insurance | Private Insurance |
| Under 6 | 112 (52.1%) | 103 (47.9%) |
| 6 to 18 Years | 423 (83.6%) | 90 (17.8%) |
| 19 to 25 Years | 218 (73.7%) | 25 (8.5%) |
| 25 to 34 Years | 186 (59.6%) | 126 (40.4%) |
| 35 to 44 Years | 35 (12.6%) | 125 (45.0%) |
| 45 to 54 Years | 208 (62.1%) | 122 (36.4%) |
| 55 to 64 Years | 257 (51.1%) | 274 (54.5%) |
| 65 to 74 Years | 491 (100.0%) | 420 (85.5%) |
| 75 Years and over | 270 (100.0%) | 169 (62.6%) |
| Total | 2,200 (68.6%) | 1,454 (45.4%) |
Disability Status by Sex by Age in Plymouth
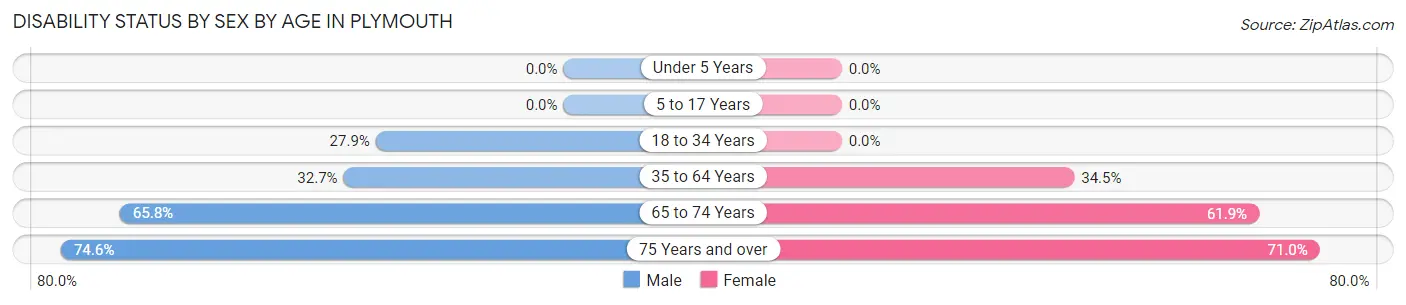
| Age Bracket | Male | Female |
| Under 5 Years | 0 (0.0%) | 0 (0.0%) |
| 5 to 17 Years | 0 (0.0%) | 0 (0.0%) |
| 18 to 34 Years | 119 (27.9%) | 0 (0.0%) |
| 35 to 64 Years | 146 (32.7%) | 231 (34.5%) |
| 65 to 74 Years | 133 (65.8%) | 179 (61.9%) |
| 75 Years and over | 91 (74.6%) | 105 (71.0%) |
Disability Class by Sex by Age in Plymouth
Disability Class: Hearing Difficulty
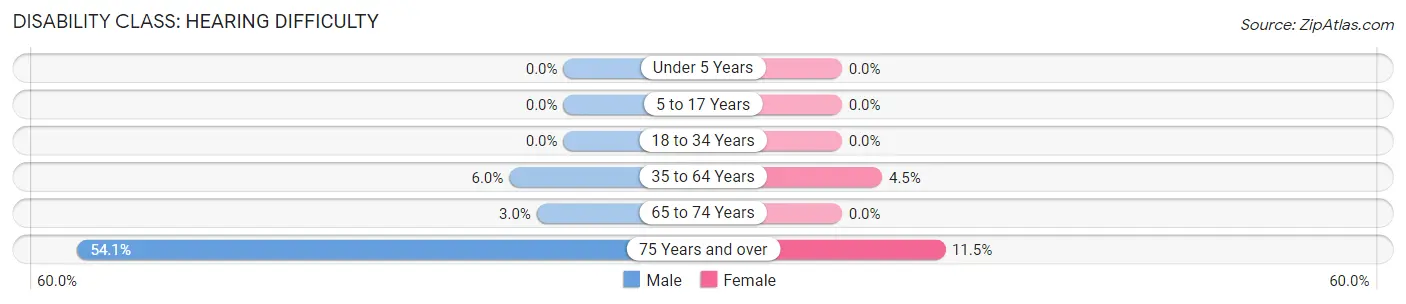
| Age Bracket | Male | Female |
| Under 5 Years | 0 (0.0%) | 0 (0.0%) |
| 5 to 17 Years | 0 (0.0%) | 0 (0.0%) |
| 18 to 34 Years | 0 (0.0%) | 0 (0.0%) |
| 35 to 64 Years | 27 (6.0%) | 30 (4.5%) |
| 65 to 74 Years | 6 (3.0%) | 0 (0.0%) |
| 75 Years and over | 66 (54.1%) | 17 (11.5%) |
Disability Class: Vision Difficulty
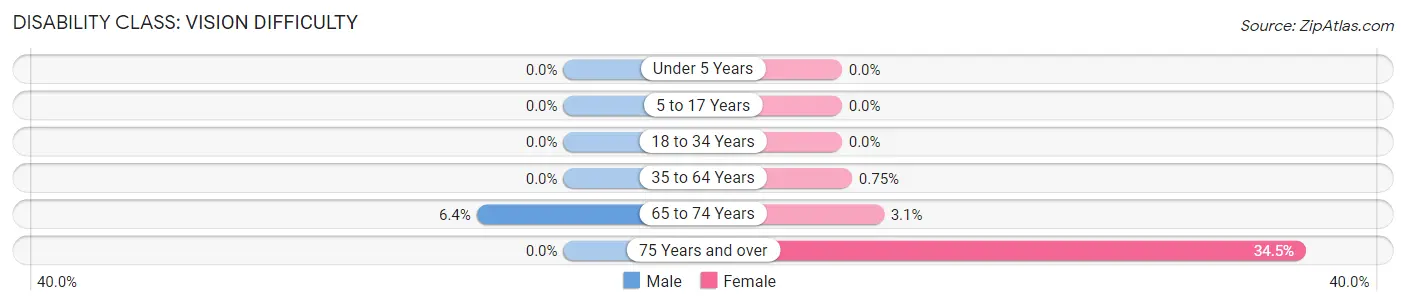
| Age Bracket | Male | Female |
| Under 5 Years | 0 (0.0%) | 0 (0.0%) |
| 5 to 17 Years | 0 (0.0%) | 0 (0.0%) |
| 18 to 34 Years | 0 (0.0%) | 0 (0.0%) |
| 35 to 64 Years | 0 (0.0%) | 5 (0.7%) |
| 65 to 74 Years | 13 (6.4%) | 9 (3.1%) |
| 75 Years and over | 0 (0.0%) | 51 (34.5%) |
Disability Class: Cognitive Difficulty
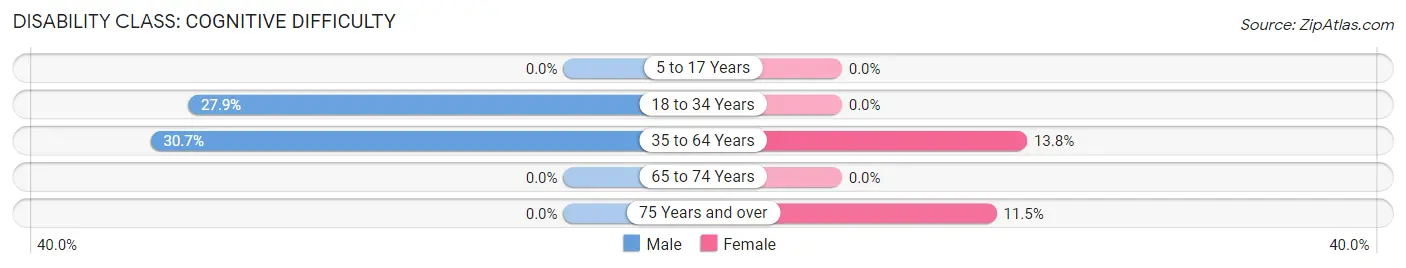
| Age Bracket | Male | Female |
| 5 to 17 Years | 0 (0.0%) | 0 (0.0%) |
| 18 to 34 Years | 119 (27.9%) | 0 (0.0%) |
| 35 to 64 Years | 137 (30.6%) | 92 (13.8%) |
| 65 to 74 Years | 0 (0.0%) | 0 (0.0%) |
| 75 Years and over | 0 (0.0%) | 17 (11.5%) |
Disability Class: Ambulatory Difficulty
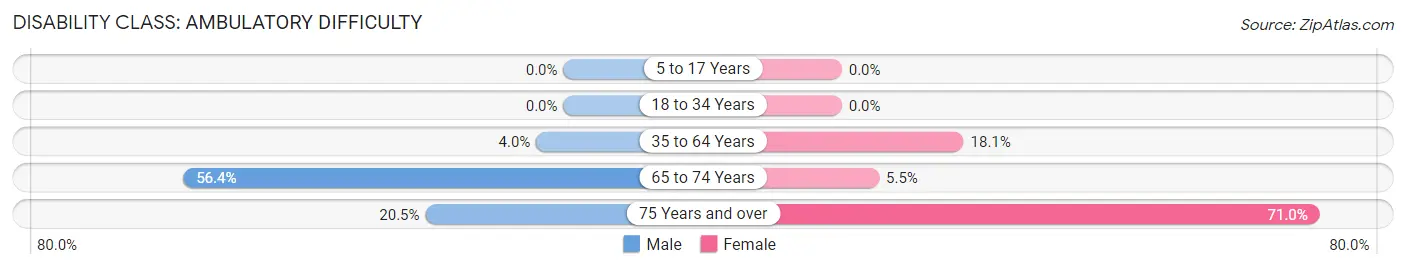
| Age Bracket | Male | Female |
| 5 to 17 Years | 0 (0.0%) | 0 (0.0%) |
| 18 to 34 Years | 0 (0.0%) | 0 (0.0%) |
| 35 to 64 Years | 18 (4.0%) | 121 (18.1%) |
| 65 to 74 Years | 114 (56.4%) | 16 (5.5%) |
| 75 Years and over | 25 (20.5%) | 105 (71.0%) |
Disability Class: Self-Care Difficulty
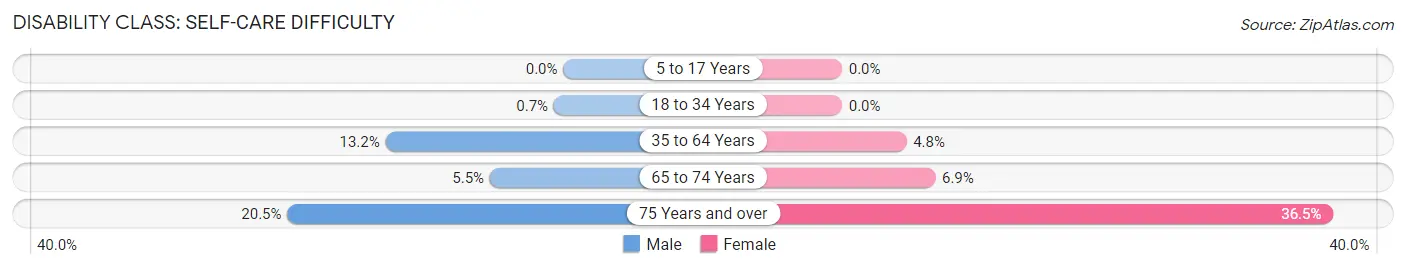
| Age Bracket | Male | Female |
| 5 to 17 Years | 0 (0.0%) | 0 (0.0%) |
| 18 to 34 Years | 3 (0.7%) | 0 (0.0%) |
| 35 to 64 Years | 59 (13.2%) | 32 (4.8%) |
| 65 to 74 Years | 11 (5.4%) | 20 (6.9%) |
| 75 Years and over | 25 (20.5%) | 54 (36.5%) |
Technology Access in Plymouth
Computing Device Access in Plymouth
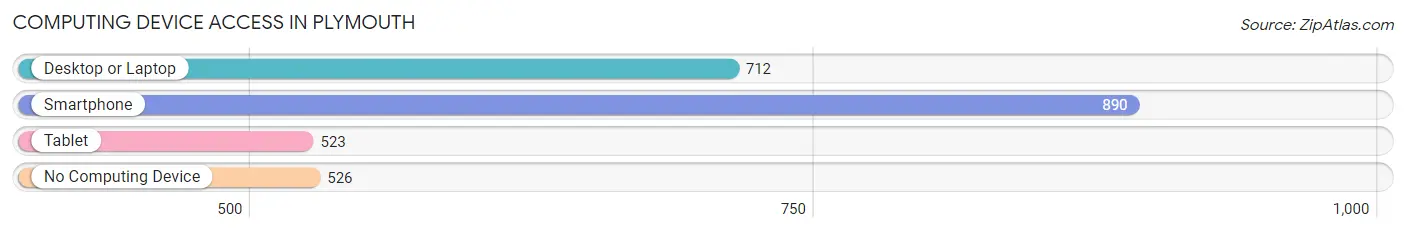
| Device Type | # Households | % Households |
| Desktop or Laptop | 712 | 45.0% |
| Smartphone | 890 | 56.3% |
| Tablet | 523 | 33.1% |
| No Computing Device | 526 | 33.3% |
| Total | 1,582 | 100.0% |
Internet Access in Plymouth
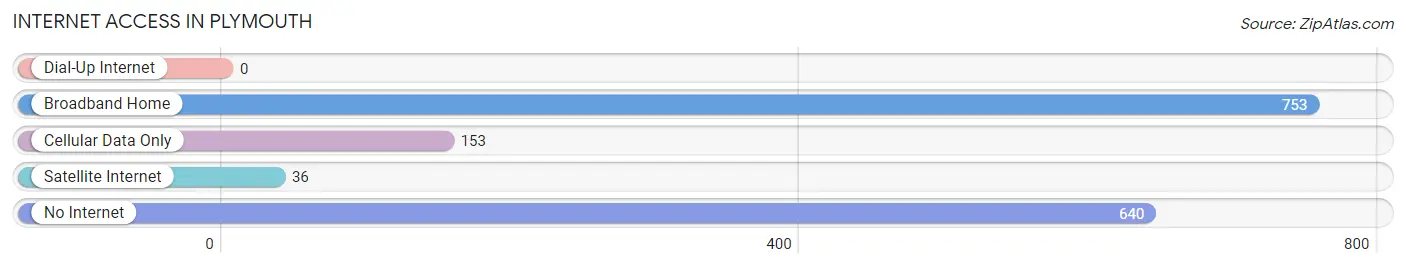
| Internet Type | # Households | % Households |
| Dial-Up Internet | 0 | 0.0% |
| Broadband Home | 753 | 47.6% |
| Cellular Data Only | 153 | 9.7% |
| Satellite Internet | 36 | 2.3% |
| No Internet | 640 | 40.5% |
| Total | 1,582 | 100.0% |
Plymouth Summary
Plymouth is a small town located in Washington County, North Carolina. It is situated on the Roanoke River, approximately 40 miles east of Greenville. The town has a population of approximately 2,000 people and is the county seat of Washington County.
Geography
Plymouth is located in the Coastal Plain region of North Carolina. The town is situated on the Roanoke River, which is a major tributary of the Albemarle Sound. The town is surrounded by a number of small towns and villages, including Creswell, Belhaven, and Pantego. The town is located approximately 40 miles east of Greenville, the largest city in the region.
The town is located in a humid subtropical climate zone, with hot, humid summers and mild winters. The average annual temperature is around 70 degrees Fahrenheit, with an average high of around 90 degrees in the summer and an average low of around 50 degrees in the winter. The town receives an average of around 50 inches of precipitation per year, with most of it falling in the summer months.
Economy
Plymouth’s economy is largely based on agriculture and tourism. The town is home to a number of farms, which produce a variety of crops, including corn, soybeans, cotton, and tobacco. The town is also home to a number of seafood processing plants, which process and package seafood for sale in local markets.
The town is also a popular tourist destination, with a number of attractions, including the Roanoke River Lighthouse, the Washington County Museum, and the Plymouth Rock State Historic Site. The town also hosts a number of festivals and events throughout the year, including the Plymouth Rock Festival and the Washington County Fair.
Demographics
As of the 2010 census, the population of Plymouth was 2,039. The racial makeup of the town was 79.3% White, 17.2% African American, 0.7% Native American, 0.3% Asian, 0.1% Pacific Islander, and 2.4% from other races. The median household income was $30,938, and the median family income was $37,917.
The town is served by the Washington County School District, which includes two elementary schools, one middle school, and one high school. The town is also home to a number of churches, including the Plymouth United Methodist Church, the Plymouth Baptist Church, and the Plymouth Presbyterian Church.
Conclusion
Plymouth is a small town located in Washington County, North Carolina. It is situated on the Roanoke River, approximately 40 miles east of Greenville. The town has a population of approximately 2,000 people and is the county seat of Washington County. The town’s economy is largely based on agriculture and tourism, and the town is home to a number of farms, seafood processing plants, and tourist attractions. The town is served by the Washington County School District, and is home to a number of churches.
Common Questions
What is Per Capita Income in Plymouth?
Per Capita income in Plymouth is $17,266.
What is the Median Family Income in Plymouth?
Median Family Income in Plymouth is $36,006.
What is the Median Household income in Plymouth?
Median Household Income in Plymouth is $24,385.
What is Income or Wage Gap in Plymouth?
Income or Wage Gap in Plymouth is 52.1%.
Women in Plymouth earn 47.9 cents for every dollar earned by a man.
What is Inequality or Gini Index in Plymouth?
Inequality or Gini Index in Plymouth is 0.49.
What is the Total Population of Plymouth?
Total Population of Plymouth is 3,315.
What is the Total Male Population of Plymouth?
Total Male Population of Plymouth is 1,958.
What is the Total Female Population of Plymouth?
Total Female Population of Plymouth is 1,357.
What is the Ratio of Males per 100 Females in Plymouth?
There are 144.29 Males per 100 Females in Plymouth.
What is the Ratio of Females per 100 Males in Plymouth?
There are 69.31 Females per 100 Males in Plymouth.
What is the Median Population Age in Plymouth?
Median Population Age in Plymouth is 46.6 Years.
What is the Average Family Size in Plymouth
Average Family Size in Plymouth is 3.1 People.
What is the Average Household Size in Plymouth
Average Household Size in Plymouth is 2.0 People.
How Large is the Labor Force in Plymouth?
There are 1,162 People in the Labor Forcein in Plymouth.
What is the Percentage of People in the Labor Force in Plymouth?
42.9% of People are in the Labor Force in Plymouth.
What is the Unemployment Rate in Plymouth?
Unemployment Rate in Plymouth is 24.2%.