Maxton, NC Map & Demographics
Maxton Map
Maxton Overview
$15,783
PER CAPITA INCOME
$45,078
AVG FAMILY INCOME
$23,106
AVG HOUSEHOLD INCOME
27.5%
WAGE / INCOME GAP [ % ]
72.5¢/ $1
WAGE / INCOME GAP [ $ ]
$15,686
FAMILY INCOME DEFICIT
0.51
INEQUALITY / GINI INDEX
2,300
TOTAL POPULATION
1,077
MALE POPULATION
1,223
FEMALE POPULATION
88.06
MALES / 100 FEMALES
113.56
FEMALES / 100 MALES
33.2
MEDIAN AGE
3.5
AVG FAMILY SIZE
2.5
AVG HOUSEHOLD SIZE
765
LABOR FORCE [ PEOPLE ]
47.1%
PERCENT IN LABOR FORCE
15.3%
UNEMPLOYMENT RATE
Maxton Zip Codes
Maxton Area Codes
Income in Maxton
Income Overview in Maxton
Per Capita Income in Maxton is $15,783, while median incomes of families and households are $45,078 and $23,106 respectively.
| Characteristic | Number | Measure |
| Per Capita Income | 2,300 | $15,783 |
| Median Family Income | 527 | $45,078 |
| Mean Family Income | 527 | $47,156 |
| Median Household Income | 906 | $23,106 |
| Mean Household Income | 906 | $36,658 |
| Income Deficit | 527 | $15,686 |
| Wage / Income Gap (%) | 2,300 | 27.50% |
| Wage / Income Gap ($) | 2,300 | 72.50¢ per $1 |
| Gini / Inequality Index | 2,300 | 0.51 |
Earnings by Sex in Maxton
Average Earnings in Maxton are $25,756, $33,300 for men and $24,141 for women, a difference of 27.5%.
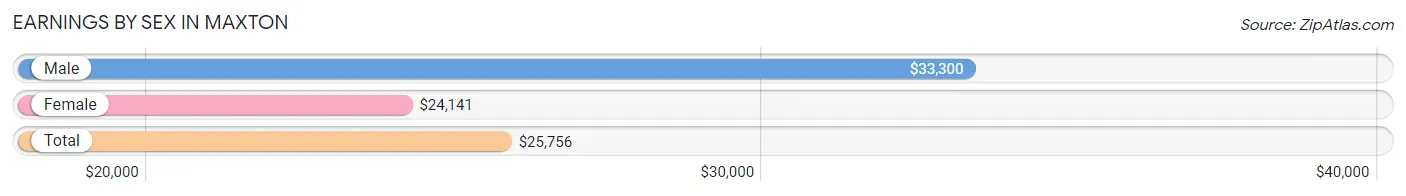
| Sex | Number | Average Earnings |
| Male | 348 (45.8%) | $33,300 |
| Female | 412 (54.2%) | $24,141 |
| Total | 760 (100.0%) | $25,756 |
Earnings by Sex by Income Bracket in Maxton
The most common earnings brackets in Maxton are $45,000 to $49,999 for men (44 | 12.6%) and $25,000 to $29,999 for women (52 | 12.6%).
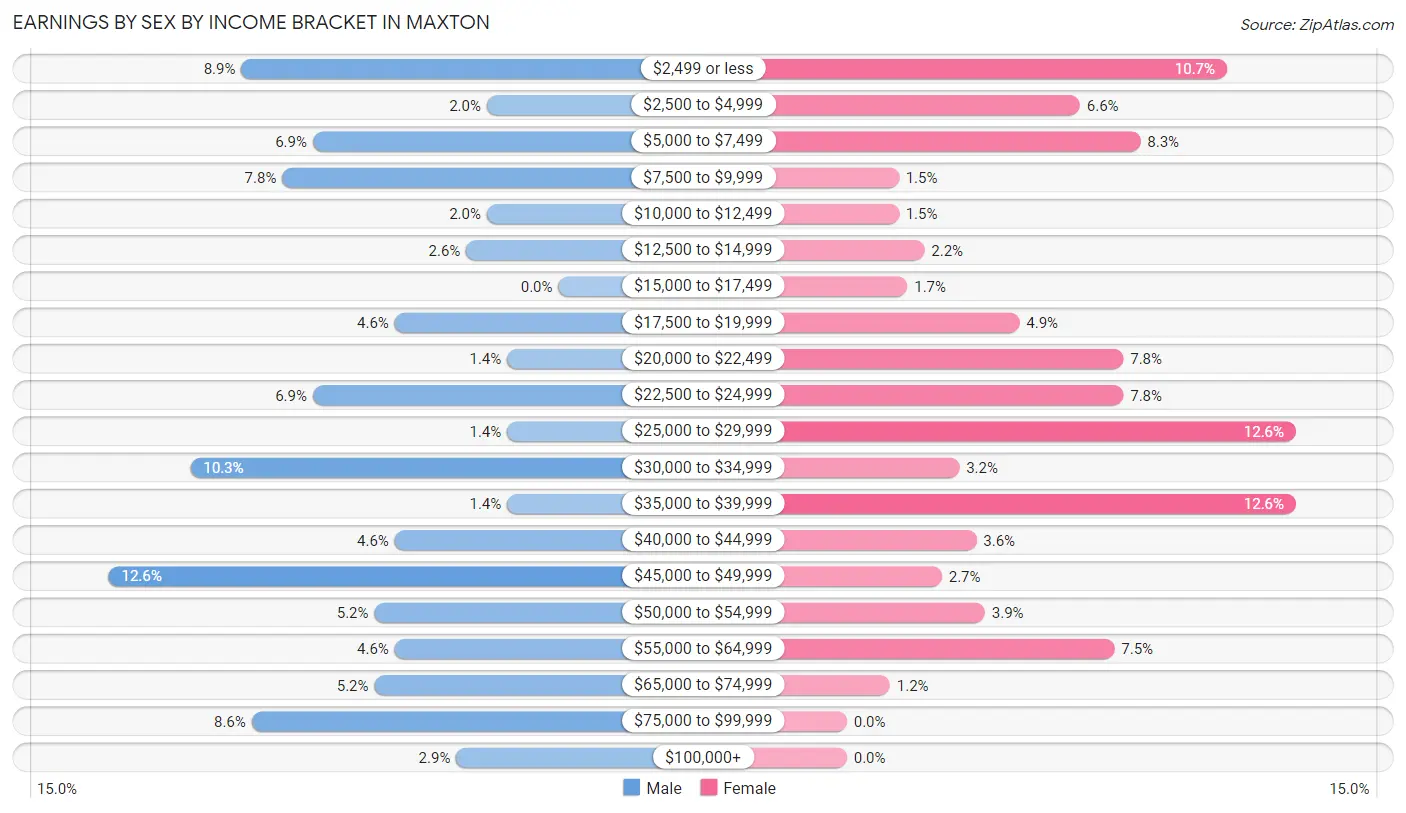
| Income | Male | Female |
| $2,499 or less | 31 (8.9%) | 44 (10.7%) |
| $2,500 to $4,999 | 7 (2.0%) | 27 (6.6%) |
| $5,000 to $7,499 | 24 (6.9%) | 34 (8.3%) |
| $7,500 to $9,999 | 27 (7.8%) | 6 (1.5%) |
| $10,000 to $12,499 | 7 (2.0%) | 6 (1.5%) |
| $12,500 to $14,999 | 9 (2.6%) | 9 (2.2%) |
| $15,000 to $17,499 | 0 (0.0%) | 7 (1.7%) |
| $17,500 to $19,999 | 16 (4.6%) | 20 (4.9%) |
| $20,000 to $22,499 | 5 (1.4%) | 32 (7.8%) |
| $22,500 to $24,999 | 24 (6.9%) | 32 (7.8%) |
| $25,000 to $29,999 | 5 (1.4%) | 52 (12.6%) |
| $30,000 to $34,999 | 36 (10.3%) | 13 (3.2%) |
| $35,000 to $39,999 | 5 (1.4%) | 52 (12.6%) |
| $40,000 to $44,999 | 16 (4.6%) | 15 (3.6%) |
| $45,000 to $49,999 | 44 (12.6%) | 11 (2.7%) |
| $50,000 to $54,999 | 18 (5.2%) | 16 (3.9%) |
| $55,000 to $64,999 | 16 (4.6%) | 31 (7.5%) |
| $65,000 to $74,999 | 18 (5.2%) | 5 (1.2%) |
| $75,000 to $99,999 | 30 (8.6%) | 0 (0.0%) |
| $100,000+ | 10 (2.9%) | 0 (0.0%) |
| Total | 348 (100.0%) | 412 (100.0%) |
Earnings by Sex by Educational Attainment in Maxton
Average earnings in Maxton are $35,500 for men and $25,959 for women, a difference of 26.9%. Men with an educational attainment of high school diploma enjoy the highest average annual earnings of $46,346, while those with college or associate's degree education earn the least with $32,727. Women with an educational attainment of less than high school earn the most with the average annual earnings of $35,987, while those with college or associate's degree education have the smallest earnings of $18,583.
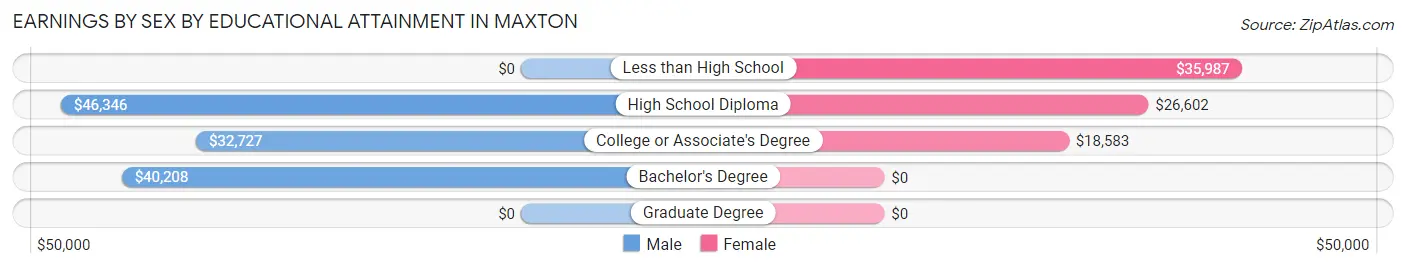
| Educational Attainment | Male Income | Female Income |
| Less than High School | - | - |
| High School Diploma | $46,346 | $26,602 |
| College or Associate's Degree | $32,727 | $18,583 |
| Bachelor's Degree | $40,208 | $0 |
| Graduate Degree | - | - |
| Total | $35,500 | $25,959 |
Family Income in Maxton
Family Income Brackets in Maxton
According to the Maxton family income data, there are 121 families falling into the $50,000 to $74,999 income range, which is the most common income bracket and makes up 23.0% of all families. Conversely, the $150,000 to $199,999 income bracket is the least frequent group with only 5 families (0.9%) belonging to this category.
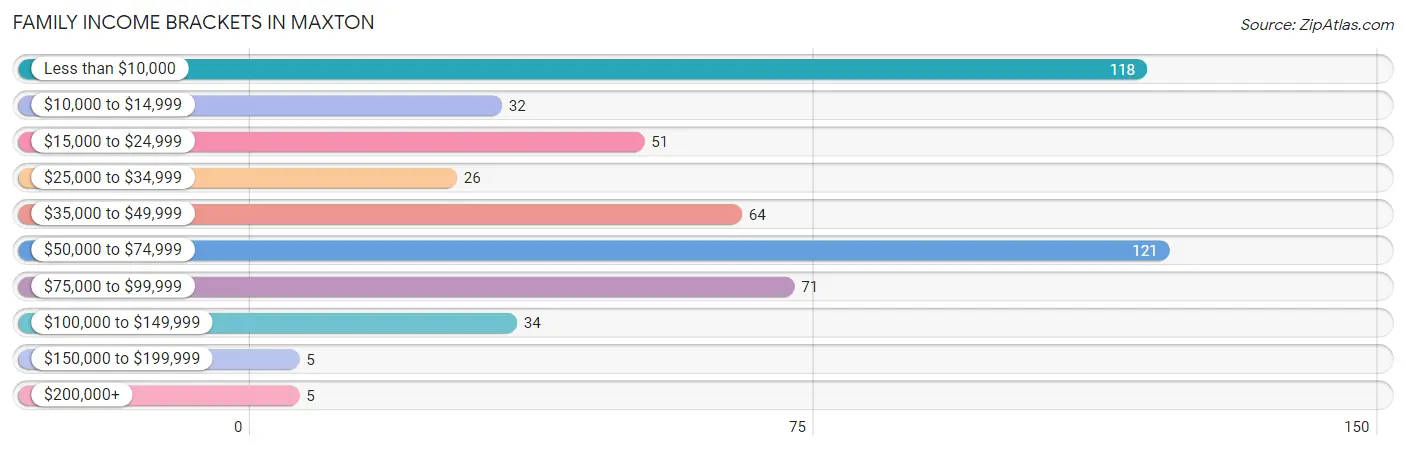
| Income Bracket | # Families | % Families |
| Less than $10,000 | 118 | 22.4% |
| $10,000 to $14,999 | 32 | 6.1% |
| $15,000 to $24,999 | 51 | 9.7% |
| $25,000 to $34,999 | 26 | 4.9% |
| $35,000 to $49,999 | 64 | 12.1% |
| $50,000 to $74,999 | 121 | 23.0% |
| $75,000 to $99,999 | 71 | 13.5% |
| $100,000 to $149,999 | 34 | 6.5% |
| $150,000 to $199,999 | 5 | 0.9% |
| $200,000+ | 5 | 0.9% |
Family Income by Famaliy Size in Maxton
2-person families (270 | 51.2%) account for the highest median family income in Maxton with $53,542 per family, while 2-person families (270 | 51.2%) have the highest median income of $26,771 per family member.
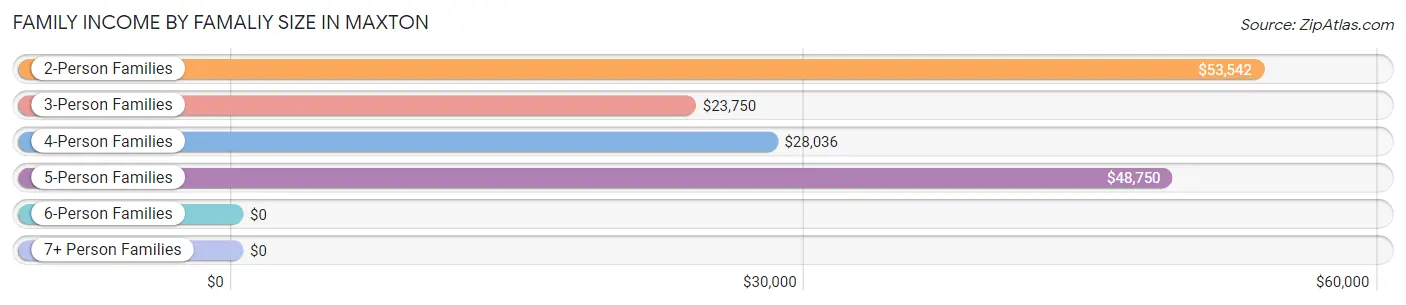
| Income Bracket | # Families | Median Income |
| 2-Person Families | 270 (51.2%) | $53,542 |
| 3-Person Families | 126 (23.9%) | $23,750 |
| 4-Person Families | 45 (8.5%) | $28,036 |
| 5-Person Families | 75 (14.2%) | $48,750 |
| 6-Person Families | 6 (1.1%) | $0 |
| 7+ Person Families | 5 (0.9%) | $0 |
| Total | 527 (100.0%) | $45,078 |
Family Income by Number of Earners in Maxton
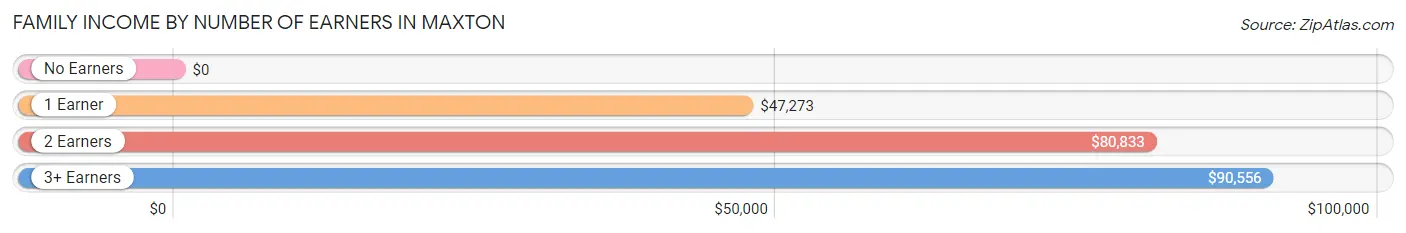
| Number of Earners | # Families | Median Income |
| No Earners | 163 (30.9%) | $0 |
| 1 Earner | 232 (44.0%) | $47,273 |
| 2 Earners | 110 (20.9%) | $80,833 |
| 3+ Earners | 22 (4.2%) | $90,556 |
| Total | 527 (100.0%) | $45,078 |
Household Income in Maxton
Household Income Brackets in Maxton
With 176 households falling in the category, the less than $10,000 income range is the most frequent in Maxton, accounting for 19.4% of all households. In contrast, only 5 households (0.5%) fall into the $150,000 to $199,999 income bracket, making it the least populous group.
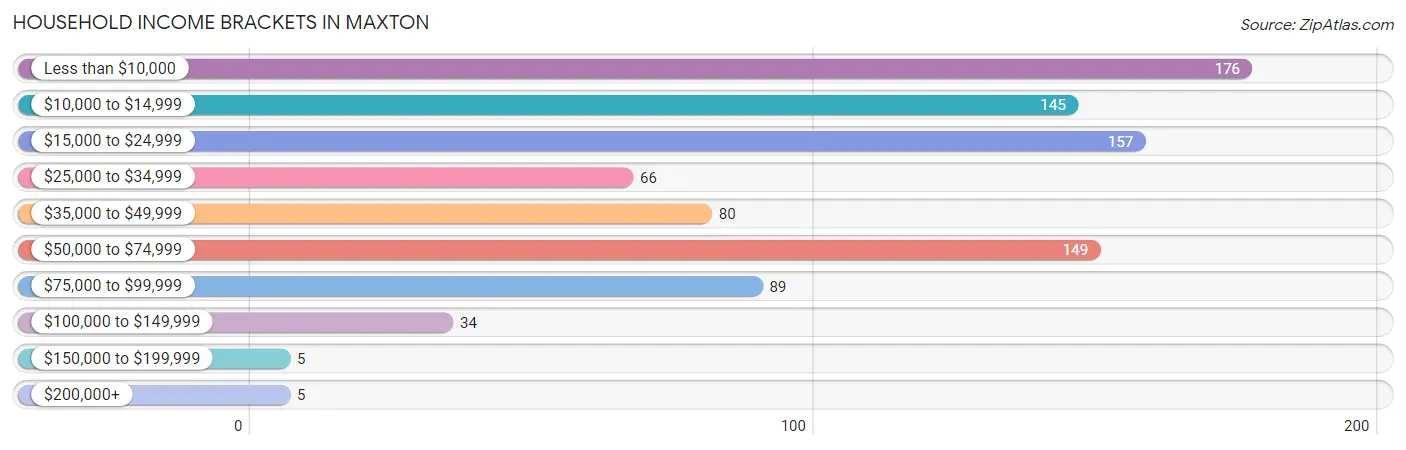
| Income Bracket | # Households | % Households |
| Less than $10,000 | 176 | 19.4% |
| $10,000 to $14,999 | 145 | 16.0% |
| $15,000 to $24,999 | 157 | 17.3% |
| $25,000 to $34,999 | 66 | 7.3% |
| $35,000 to $49,999 | 80 | 8.8% |
| $50,000 to $74,999 | 149 | 16.4% |
| $75,000 to $99,999 | 89 | 9.8% |
| $100,000 to $149,999 | 34 | 3.8% |
| $150,000 to $199,999 | 5 | 0.6% |
| $200,000+ | 5 | 0.6% |
Household Income by Householder Age in Maxton
The median household income in Maxton is $23,106, with the highest median household income of $30,625 found in the 45 to 64 years age bracket for the primary householder. A total of 286 households (31.6%) fall into this category. Meanwhile, the 25 to 44 years age bracket for the primary householder has the lowest median household income of $12,000, with 282 households (31.1%) in this group.
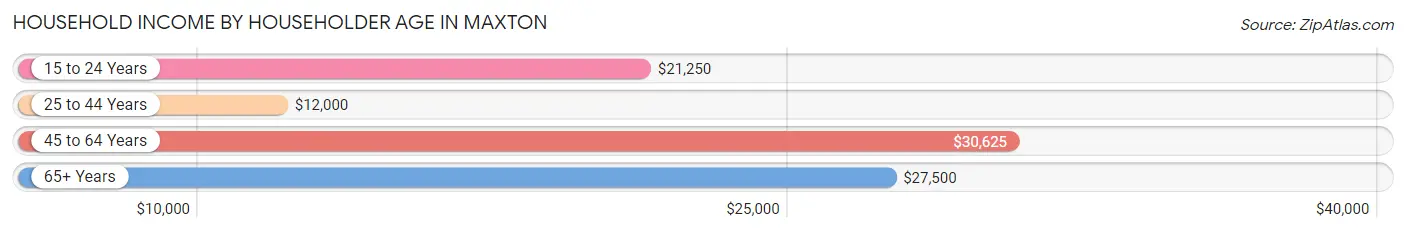
| Income Bracket | # Households | Median Income |
| 15 to 24 Years | 76 (8.4%) | $21,250 |
| 25 to 44 Years | 282 (31.1%) | $12,000 |
| 45 to 64 Years | 286 (31.6%) | $30,625 |
| 65+ Years | 262 (28.9%) | $27,500 |
| Total | 906 (100.0%) | $23,106 |
Poverty in Maxton
Income Below Poverty by Sex and Age in Maxton
With 36.3% poverty level for males and 41.9% for females among the residents of Maxton, 12 to 14 year old males and under 5 year old females are the most vulnerable to poverty, with 31 males (73.8%) and 72 females (78.3%) in their respective age groups living below the poverty level.
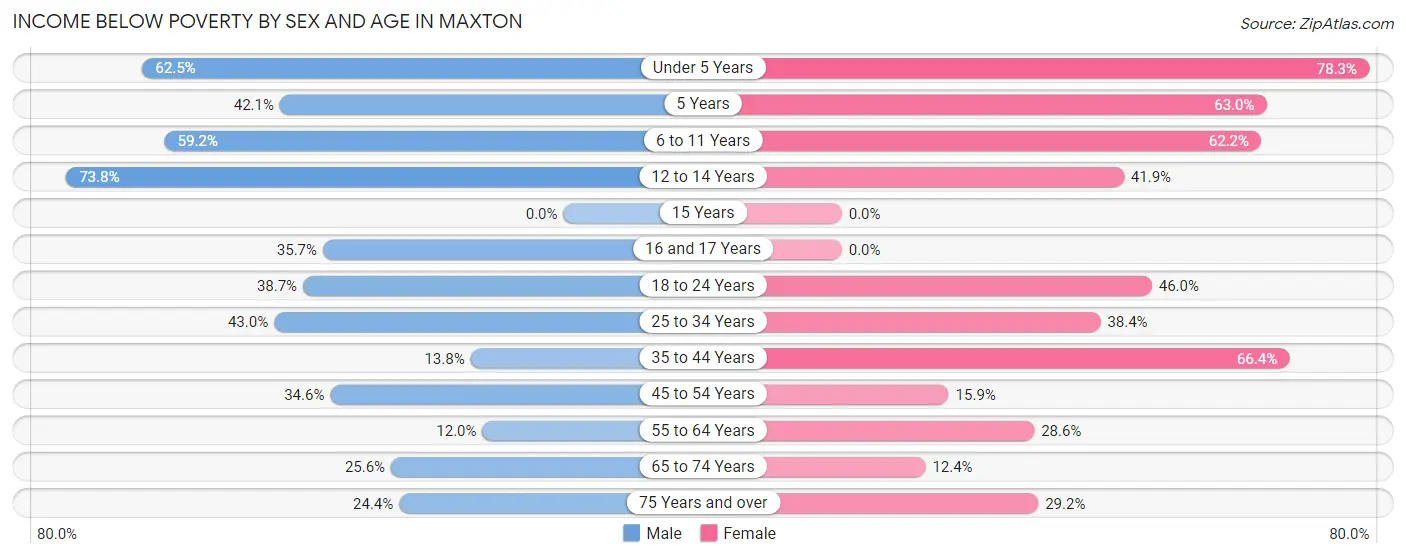
| Age Bracket | Male | Female |
| Under 5 Years | 60 (62.5%) | 72 (78.3%) |
| 5 Years | 8 (42.1%) | 29 (63.0%) |
| 6 to 11 Years | 74 (59.2%) | 84 (62.2%) |
| 12 to 14 Years | 31 (73.8%) | 31 (41.9%) |
| 15 Years | 0 (0.0%) | 0 (0.0%) |
| 16 and 17 Years | 20 (35.7%) | 0 (0.0%) |
| 18 to 24 Years | 29 (38.7%) | 58 (46.0%) |
| 25 to 34 Years | 55 (43.0%) | 63 (38.4%) |
| 35 to 44 Years | 16 (13.8%) | 85 (66.4%) |
| 45 to 54 Years | 36 (34.6%) | 10 (15.9%) |
| 55 to 64 Years | 16 (12.0%) | 44 (28.6%) |
| 65 to 74 Years | 32 (25.6%) | 19 (12.4%) |
| 75 Years and over | 10 (24.4%) | 14 (29.2%) |
| Total | 387 (36.3%) | 509 (41.9%) |
Income Above Poverty by Sex and Age in Maxton
According to the poverty statistics in Maxton, males aged 15 years and females aged 15 years are the age groups that are most secure financially, with 100.0% of males and 100.0% of females in these age groups living above the poverty line.
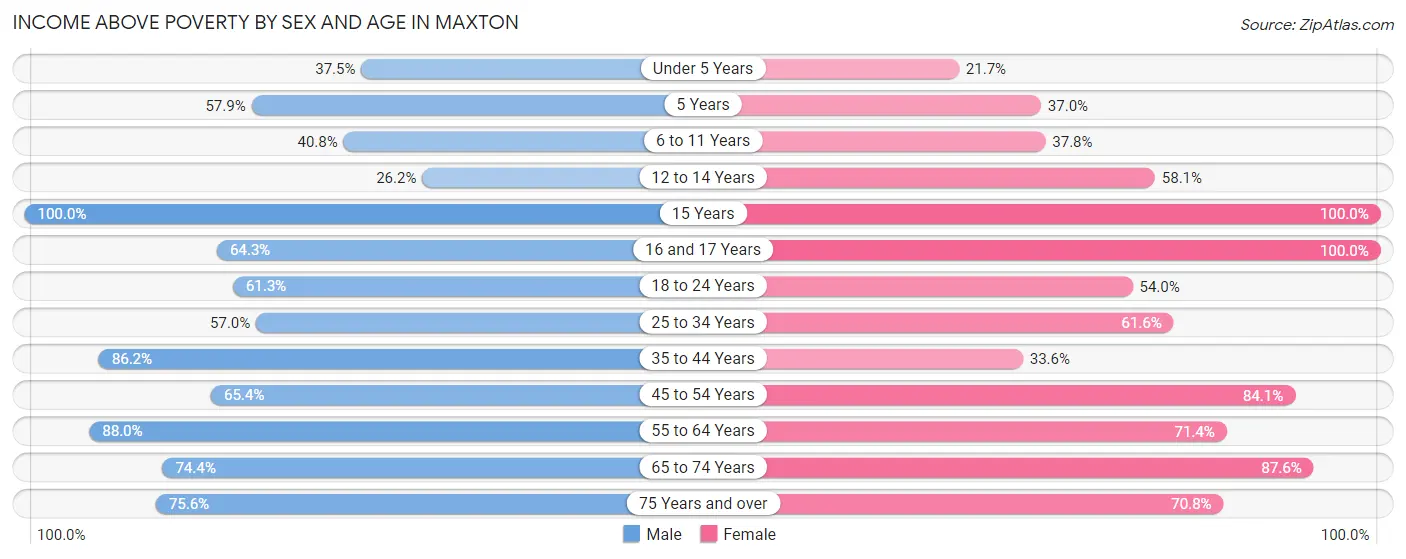
| Age Bracket | Male | Female |
| Under 5 Years | 36 (37.5%) | 20 (21.7%) |
| 5 Years | 11 (57.9%) | 17 (37.0%) |
| 6 to 11 Years | 51 (40.8%) | 51 (37.8%) |
| 12 to 14 Years | 11 (26.2%) | 43 (58.1%) |
| 15 Years | 7 (100.0%) | 22 (100.0%) |
| 16 and 17 Years | 36 (64.3%) | 11 (100.0%) |
| 18 to 24 Years | 46 (61.3%) | 68 (54.0%) |
| 25 to 34 Years | 73 (57.0%) | 101 (61.6%) |
| 35 to 44 Years | 100 (86.2%) | 43 (33.6%) |
| 45 to 54 Years | 68 (65.4%) | 53 (84.1%) |
| 55 to 64 Years | 117 (88.0%) | 110 (71.4%) |
| 65 to 74 Years | 93 (74.4%) | 134 (87.6%) |
| 75 Years and over | 31 (75.6%) | 34 (70.8%) |
| Total | 680 (63.7%) | 707 (58.1%) |
Income Below Poverty Among Married-Couple Families in Maxton
The poverty statistics for married-couple families in Maxton show that 7.4% or 16 of the total 216 families live below the poverty line. Families with 3 or 4 children have the highest poverty rate of 17.1%, comprising of 6 families. On the other hand, families with no children have the lowest poverty rate of 3.3%, which includes 5 families.
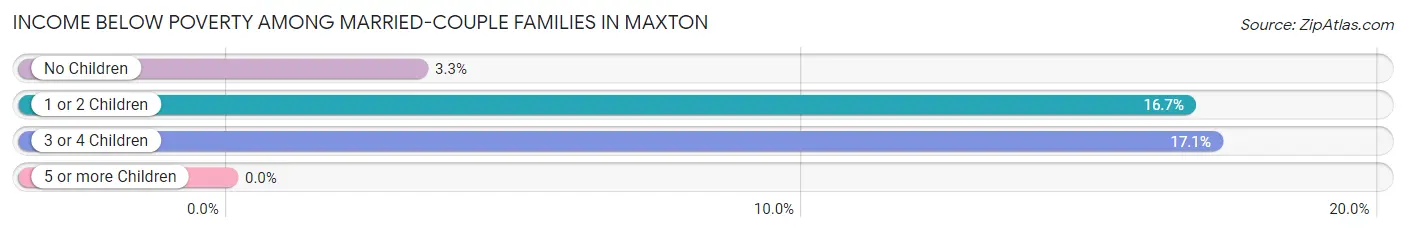
| Children | Above Poverty | Below Poverty |
| No Children | 146 (96.7%) | 5 (3.3%) |
| 1 or 2 Children | 25 (83.3%) | 5 (16.7%) |
| 3 or 4 Children | 29 (82.9%) | 6 (17.1%) |
| 5 or more Children | 0 (0.0%) | 0 (0.0%) |
| Total | 200 (92.6%) | 16 (7.4%) |
Income Below Poverty Among Single-Parent Households in Maxton
According to the poverty data in Maxton, 41.4% or 29 single-father households and 58.9% or 142 single-mother households are living below the poverty line. Among single-father households, those with 1 or 2 children have the highest poverty rate, with 15 households (62.5%) experiencing poverty. Likewise, among single-mother households, those with 5 or more children have the highest poverty rate, with 5 households (100.0%) falling below the poverty line.
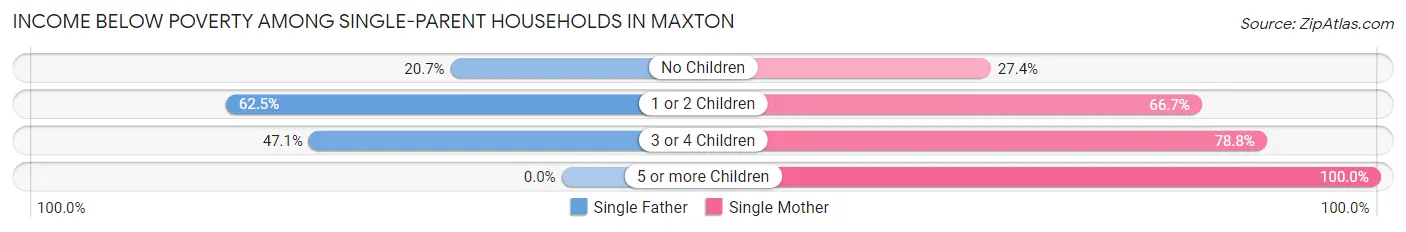
| Children | Single Father | Single Mother |
| No Children | 6 (20.7%) | 17 (27.4%) |
| 1 or 2 Children | 15 (62.5%) | 94 (66.7%) |
| 3 or 4 Children | 8 (47.1%) | 26 (78.8%) |
| 5 or more Children | 0 (0.0%) | 5 (100.0%) |
| Total | 29 (41.4%) | 142 (58.9%) |
Income Below Poverty Among Married-Couple vs Single-Parent Households in Maxton
The poverty data for Maxton shows that 16 of the married-couple family households (7.4%) and 171 of the single-parent households (55.0%) are living below the poverty level. Within the married-couple family households, those with 3 or 4 children have the highest poverty rate, with 6 households (17.1%) falling below the poverty line. Among the single-parent households, those with 5 or more children have the highest poverty rate, with 5 household (100.0%) living below poverty.
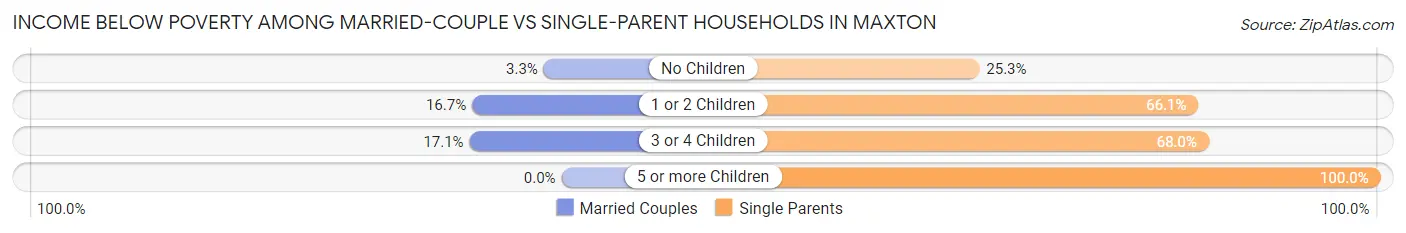
| Children | Married-Couple Families | Single-Parent Households |
| No Children | 5 (3.3%) | 23 (25.3%) |
| 1 or 2 Children | 5 (16.7%) | 109 (66.1%) |
| 3 or 4 Children | 6 (17.1%) | 34 (68.0%) |
| 5 or more Children | 0 (0.0%) | 5 (100.0%) |
| Total | 16 (7.4%) | 171 (55.0%) |
Race in Maxton
The most populous races in Maxton are Black / African American (1,470 | 63.9%), Native / Alaskan (414 | 18.0%), and White / Caucasian (347 | 15.1%).
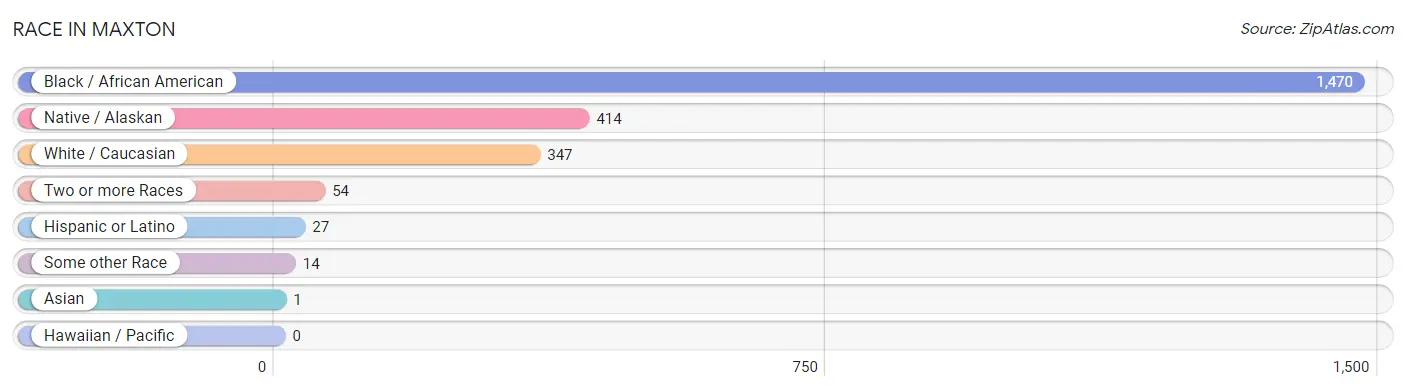
| Race | # Population | % Population |
| Asian | 1 | 0.0% |
| Black / African American | 1,470 | 63.9% |
| Hawaiian / Pacific | 0 | 0.0% |
| Hispanic or Latino | 27 | 1.2% |
| Native / Alaskan | 414 | 18.0% |
| White / Caucasian | 347 | 15.1% |
| Two or more Races | 54 | 2.4% |
| Some other Race | 14 | 0.6% |
| Total | 2,300 | 100.0% |
Ancestry in Maxton
The most populous ancestries reported in Maxton are Lumbee (296 | 12.9%), English (57 | 2.5%), Scotch-Irish (32 | 1.4%), Scottish (30 | 1.3%), and Iroquois (27 | 1.2%), together accounting for 19.2% of all Maxton residents.
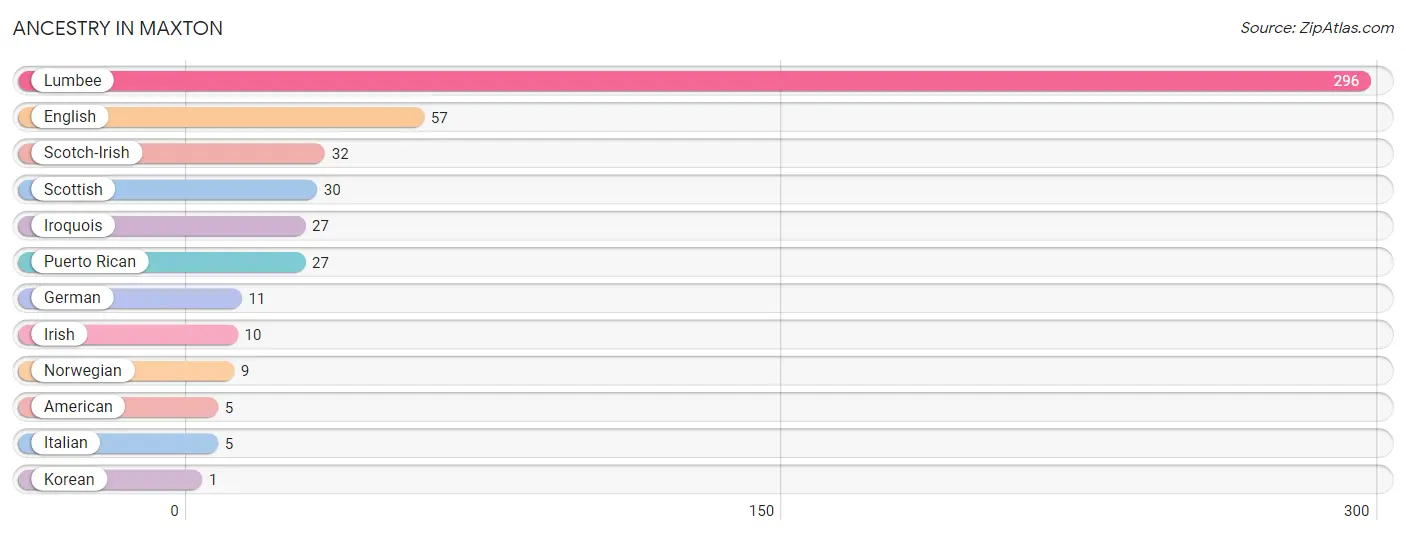
| Ancestry | # Population | % Population |
| American | 5 | 0.2% |
| English | 57 | 2.5% |
| German | 11 | 0.5% |
| Irish | 10 | 0.4% |
| Iroquois | 27 | 1.2% |
| Italian | 5 | 0.2% |
| Korean | 1 | 0.0% |
| Lumbee | 296 | 12.9% |
| Norwegian | 9 | 0.4% |
| Puerto Rican | 27 | 1.2% |
| Scotch-Irish | 32 | 1.4% |
| Scottish | 30 | 1.3% | View All 12 Rows |
Immigrants in Maxton
The most numerous immigrant groups reported in Maxton came from Asia (1 | 0.0%), Philippines (1 | 0.0%), and South Eastern Asia (1 | 0.0%), together accounting for 0.1% of all Maxton residents.
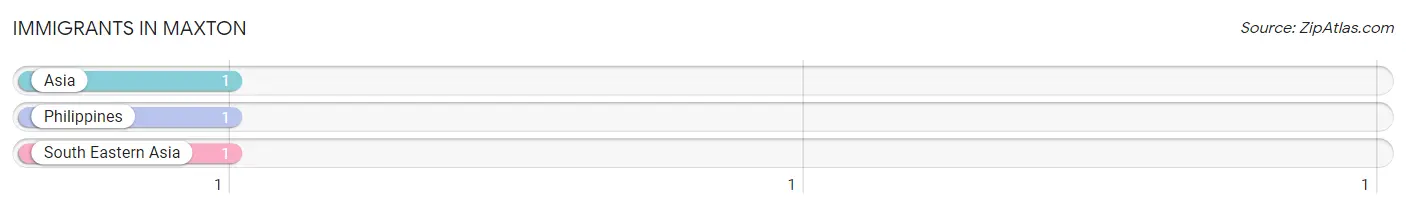
| Immigration Origin | # Population | % Population |
| Asia | 1 | 0.0% |
| Philippines | 1 | 0.0% |
| South Eastern Asia | 1 | 0.0% | View All 3 Rows |
Sex and Age in Maxton
Sex and Age in Maxton
The most populous age groups in Maxton are Under 5 Years (106 | 9.8%) for men and 5 to 9 Years (140 | 11.5%) for women.
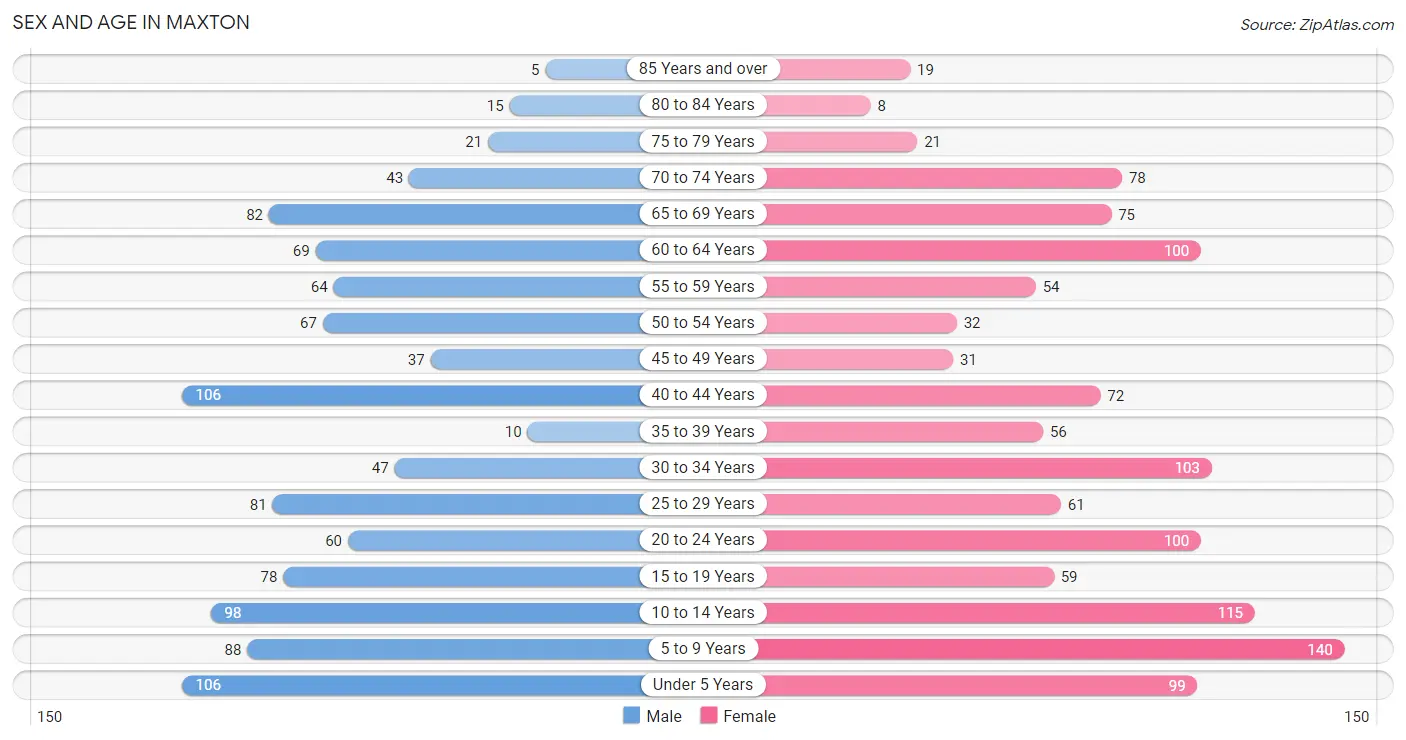
| Age Bracket | Male | Female |
| Under 5 Years | 106 (9.8%) | 99 (8.1%) |
| 5 to 9 Years | 88 (8.2%) | 140 (11.5%) |
| 10 to 14 Years | 98 (9.1%) | 115 (9.4%) |
| 15 to 19 Years | 78 (7.2%) | 59 (4.8%) |
| 20 to 24 Years | 60 (5.6%) | 100 (8.2%) |
| 25 to 29 Years | 81 (7.5%) | 61 (5.0%) |
| 30 to 34 Years | 47 (4.4%) | 103 (8.4%) |
| 35 to 39 Years | 10 (0.9%) | 56 (4.6%) |
| 40 to 44 Years | 106 (9.8%) | 72 (5.9%) |
| 45 to 49 Years | 37 (3.4%) | 31 (2.5%) |
| 50 to 54 Years | 67 (6.2%) | 32 (2.6%) |
| 55 to 59 Years | 64 (5.9%) | 54 (4.4%) |
| 60 to 64 Years | 69 (6.4%) | 100 (8.2%) |
| 65 to 69 Years | 82 (7.6%) | 75 (6.1%) |
| 70 to 74 Years | 43 (4.0%) | 78 (6.4%) |
| 75 to 79 Years | 21 (1.9%) | 21 (1.7%) |
| 80 to 84 Years | 15 (1.4%) | 8 (0.6%) |
| 85 Years and over | 5 (0.5%) | 19 (1.5%) |
| Total | 1,077 (100.0%) | 1,223 (100.0%) |
Families and Households in Maxton
Median Family Size in Maxton
The median family size in Maxton is 3.48 persons per family, with single female/mother families (241 | 45.7%) accounting for the largest median family size of 3.88 persons per family. On the other hand, single male/father families (70 | 13.3%) represent the smallest median family size with 3.01 persons per family.
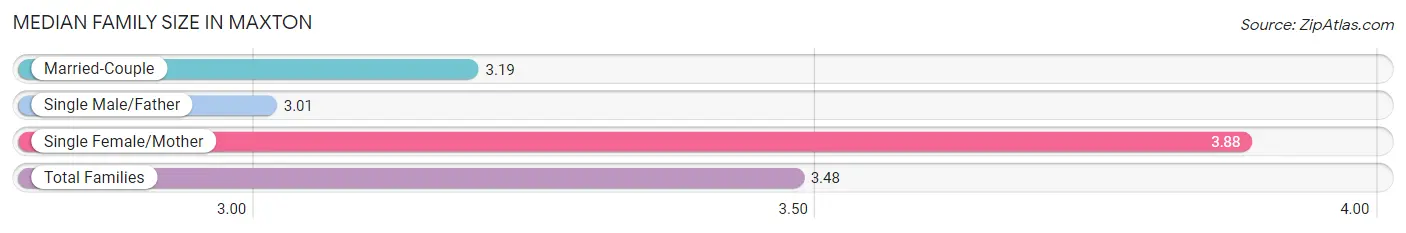
| Family Type | # Families | Family Size |
| Married-Couple | 216 (41.0%) | 3.19 |
| Single Male/Father | 70 (13.3%) | 3.01 |
| Single Female/Mother | 241 (45.7%) | 3.88 |
| Total Families | 527 (100.0%) | 3.48 |
Median Household Size in Maxton
The median household size in Maxton is 2.53 persons per household, with single female/mother households (241 | 26.6%) accounting for the largest median household size of 3.95 persons per household. non-family households (379 | 41.8%) represent the smallest median household size with 1.12 persons per household.
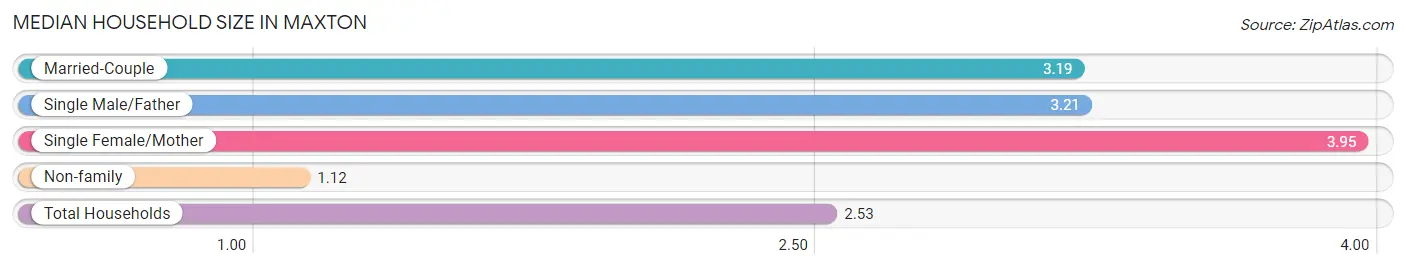
| Household Type | # Households | Household Size |
| Married-Couple | 216 (23.8%) | 3.19 |
| Single Male/Father | 70 (7.7%) | 3.21 |
| Single Female/Mother | 241 (26.6%) | 3.95 |
| Non-family | 379 (41.8%) | 1.12 |
| Total Households | 906 (100.0%) | 2.53 |
Household Size by Marriage Status in Maxton
Out of a total of 906 households in Maxton, 527 (58.2%) are family households, while 379 (41.8%) are nonfamily households. The most numerous type of family households are 2-person households, comprising 266, and the most common type of nonfamily households are 1-person households, comprising 345.
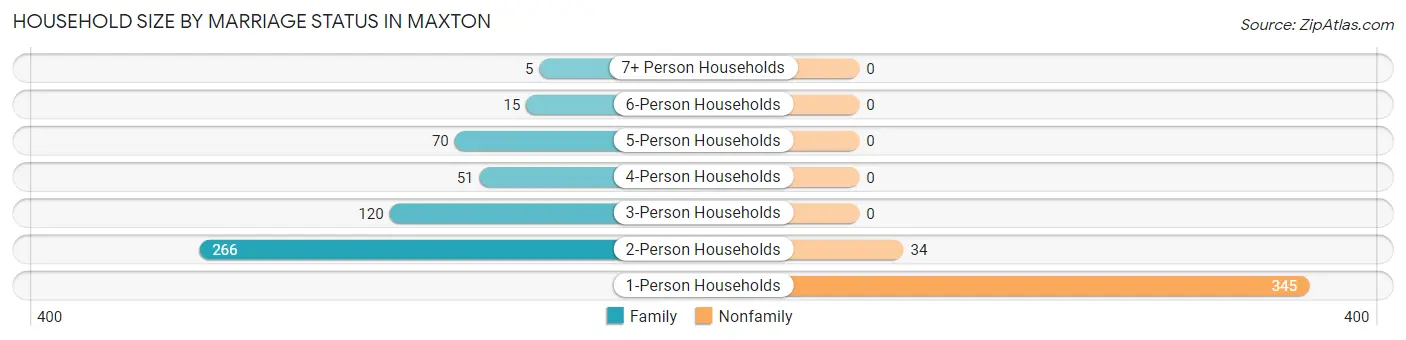
| Household Size | Family Households | Nonfamily Households |
| 1-Person Households | - | 345 (38.1%) |
| 2-Person Households | 266 (29.4%) | 34 (3.7%) |
| 3-Person Households | 120 (13.3%) | 0 (0.0%) |
| 4-Person Households | 51 (5.6%) | 0 (0.0%) |
| 5-Person Households | 70 (7.7%) | 0 (0.0%) |
| 6-Person Households | 15 (1.7%) | 0 (0.0%) |
| 7+ Person Households | 5 (0.5%) | 0 (0.0%) |
| Total | 527 (58.2%) | 379 (41.8%) |
Female Fertility in Maxton
Fertility by Age in Maxton
Average fertility rate in Maxton is 31.0 births per 1,000 women. Women in the age bracket of 15 to 19 years have the highest fertility rate with 153.0 births per 1,000 women. Women in the age bracket of 15 to 19 years acount for 60.0% of all women with births.
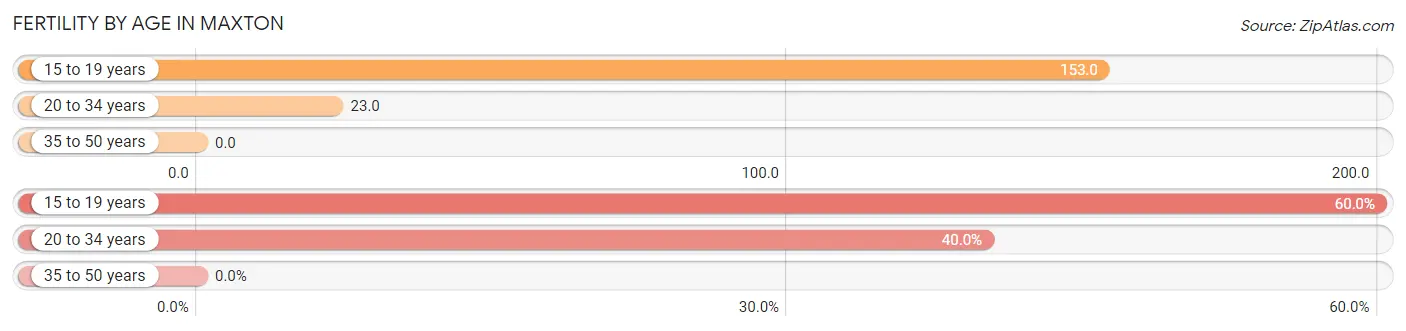
| Age Bracket | Women with Births | Births / 1,000 Women |
| 15 to 19 years | 9 (60.0%) | 153.0 |
| 20 to 34 years | 6 (40.0%) | 23.0 |
| 35 to 50 years | 0 (0.0%) | 0.0 |
| Total | 15 (100.0%) | 31.0 |
Fertility by Age by Marriage Status in Maxton
40.0% of women with births (15) in Maxton are married. The highest percentage of unmarried women with births falls into 15 to 19 years age bracket with 100.0% of them unmarried at the time of birth, while the lowest percentage of unmarried women with births belong to 20 to 34 years age bracket with 0.0% of them unmarried.
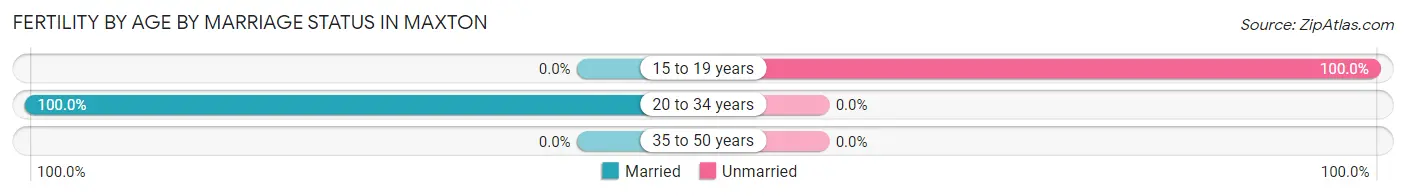
| Age Bracket | Married | Unmarried |
| 15 to 19 years | 0 (0.0%) | 9 (100.0%) |
| 20 to 34 years | 6 (100.0%) | 0 (0.0%) |
| 35 to 50 years | 0 (0.0%) | 0 (0.0%) |
| Total | 6 (40.0%) | 9 (60.0%) |
Fertility by Education in Maxton
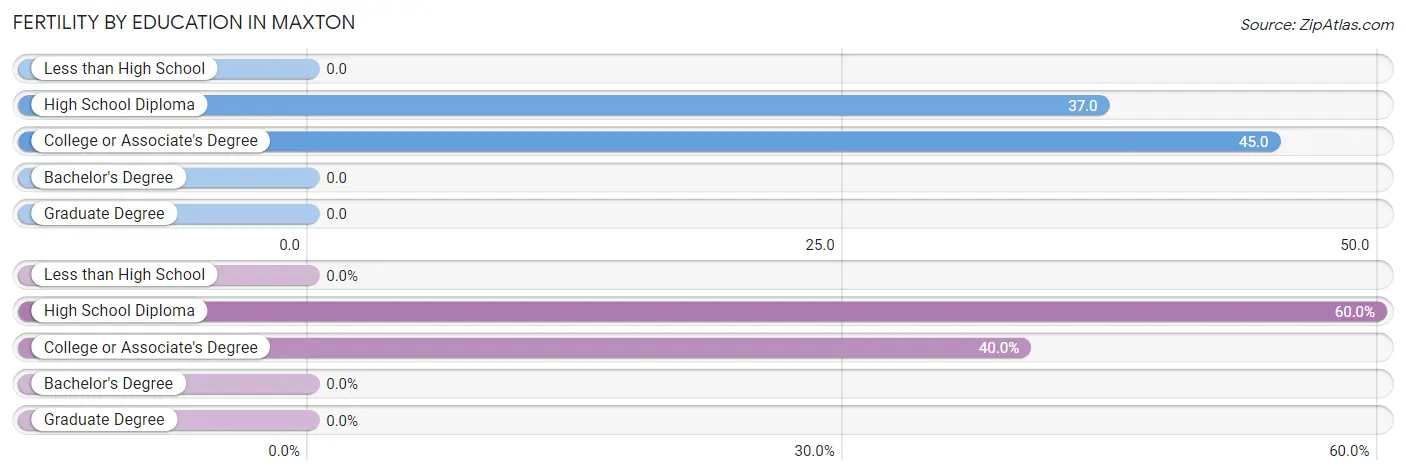
| Educational Attainment | Women with Births | Births / 1,000 Women |
| Less than High School | 0 (0.0%) | 0.0 |
| High School Diploma | 9 (60.0%) | 37.0 |
| College or Associate's Degree | 6 (40.0%) | 45.0 |
| Bachelor's Degree | 0 (0.0%) | 0.0 |
| Graduate Degree | 0 (0.0%) | 0.0 |
| Total | 15 (100.0%) | 31.0 |
Fertility by Education by Marriage Status in Maxton
60.0% of women with births in Maxton are unmarried. Women with the educational attainment of college or associate's degree are most likely to be married with 100.0% of them married at childbirth, while women with the educational attainment of high school diploma are least likely to be married with 100.0% of them unmarried at childbirth.
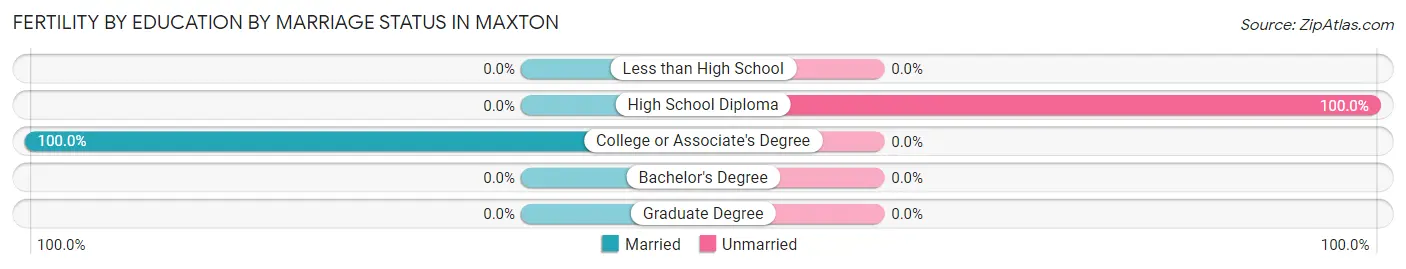
| Educational Attainment | Married | Unmarried |
| Less than High School | 0 (0.0%) | 0 (0.0%) |
| High School Diploma | 0 (0.0%) | 9 (100.0%) |
| College or Associate's Degree | 6 (100.0%) | 0 (0.0%) |
| Bachelor's Degree | 0 (0.0%) | 0 (0.0%) |
| Graduate Degree | 0 (0.0%) | 0 (0.0%) |
| Total | 6 (40.0%) | 9 (60.0%) |
Employment Characteristics in Maxton
Employment by Class of Employer in Maxton
Among the 635 employed individuals in Maxton, private company employees (484 | 76.2%), state government employees (59 | 9.3%), and not-for-profit organizations (32 | 5.0%) make up the most common classes of employment.
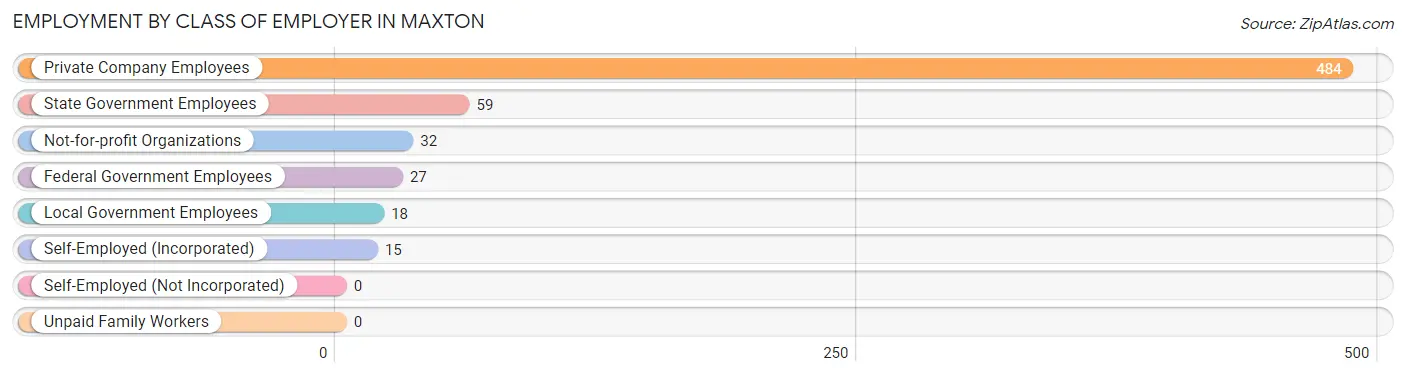
| Employer Class | # Employees | % Employees |
| Private Company Employees | 484 | 76.2% |
| Self-Employed (Incorporated) | 15 | 2.4% |
| Self-Employed (Not Incorporated) | 0 | 0.0% |
| Not-for-profit Organizations | 32 | 5.0% |
| Local Government Employees | 18 | 2.8% |
| State Government Employees | 59 | 9.3% |
| Federal Government Employees | 27 | 4.3% |
| Unpaid Family Workers | 0 | 0.0% |
| Total | 635 | 100.0% |
Employment Status by Age in Maxton
According to the labor force statistics for Maxton, out of the total population over 16 years of age (1,625), 47.1% or 765 individuals are in the labor force, with 15.3% or 117 of them unemployed. The age group with the highest labor force participation rate is 30 to 34 years, with 76.0% or 114 individuals in the labor force. Within the labor force, the 75 years and over age range has the highest percentage of unemployed individuals, with 62.5% or 5 of them being unemployed.
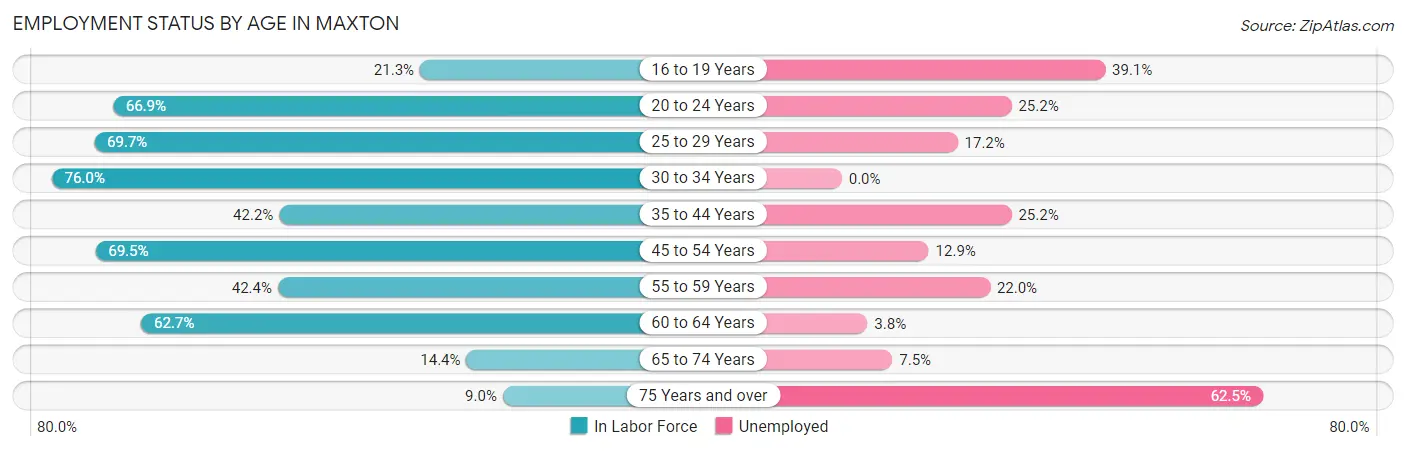
| Age Bracket | In Labor Force | Unemployed |
| 16 to 19 Years | 23 (21.3%) | 9 (39.1%) |
| 20 to 24 Years | 107 (66.9%) | 27 (25.2%) |
| 25 to 29 Years | 99 (69.7%) | 17 (17.2%) |
| 30 to 34 Years | 114 (76.0%) | 0 (0.0%) |
| 35 to 44 Years | 103 (42.2%) | 26 (25.2%) |
| 45 to 54 Years | 116 (69.5%) | 15 (12.9%) |
| 55 to 59 Years | 50 (42.4%) | 11 (22.0%) |
| 60 to 64 Years | 106 (62.7%) | 4 (3.8%) |
| 65 to 74 Years | 40 (14.4%) | 3 (7.5%) |
| 75 Years and over | 8 (9.0%) | 5 (62.5%) |
| Total | 765 (47.1%) | 117 (15.3%) |
Employment Status by Educational Attainment in Maxton
According to labor force statistics for Maxton, 59.4% of individuals (588) out of the total population between 25 and 64 years of age (990) are in the labor force, with 12.4% or 73 of them being unemployed. The group with the highest labor force participation rate are those with the educational attainment of high school diploma, with 63.7% or 262 individuals in the labor force. Within the labor force, individuals with bachelor's degree or higher education have the highest percentage of unemployment, with 17.0% or 9 of them being unemployed.
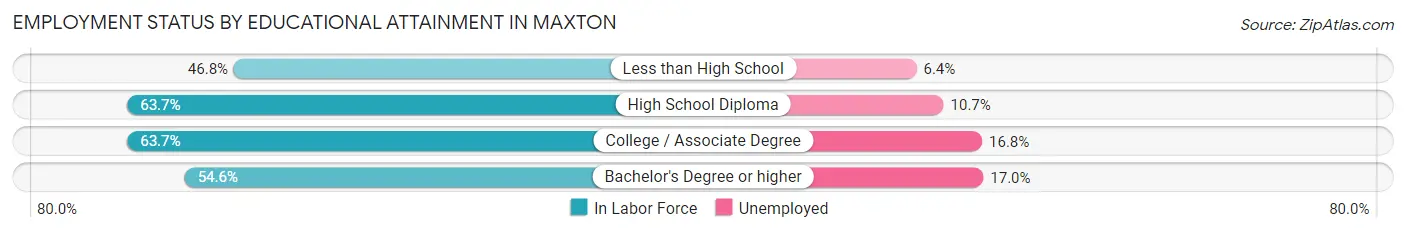
| Educational Attainment | In Labor Force | Unemployed |
| Less than High School | 94 (46.8%) | 13 (6.4%) |
| High School Diploma | 262 (63.7%) | 44 (10.7%) |
| College / Associate Degree | 179 (63.7%) | 47 (16.8%) |
| Bachelor's Degree or higher | 53 (54.6%) | 16 (17.0%) |
| Total | 588 (59.4%) | 123 (12.4%) |
Employment Occupations by Sex in Maxton
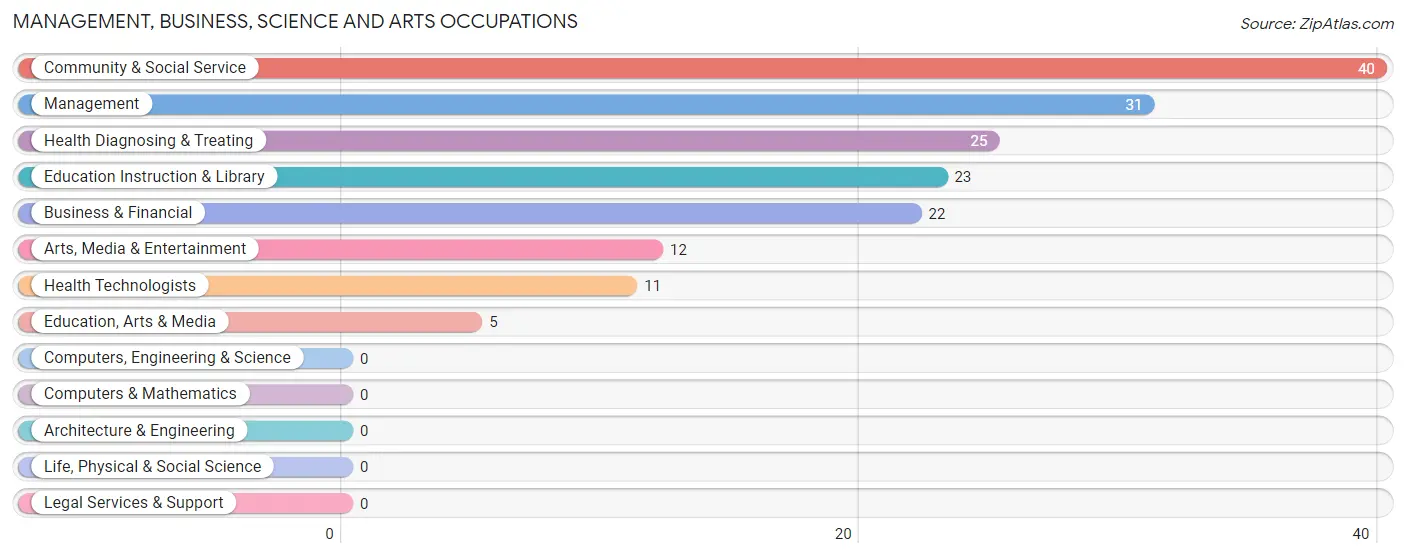
Management, Business, Science and Arts Occupations
The most common Management, Business, Science and Arts occupations in Maxton are Community & Social Service (40 | 6.2%), Management (31 | 4.8%), Health Diagnosing & Treating (25 | 3.8%), Education Instruction & Library (23 | 3.5%), and Business & Financial (22 | 3.4%).
Management, Business, Science and Arts Occupations by Sex
Within the Management, Business, Science and Arts occupations in Maxton, the most male-oriented occupations are Business & Financial (100.0%), Education, Arts & Media (100.0%), and Management (87.1%), while the most female-oriented occupations are Education Instruction & Library (100.0%), Community & Social Service (80.0%), and Health Diagnosing & Treating (76.0%).
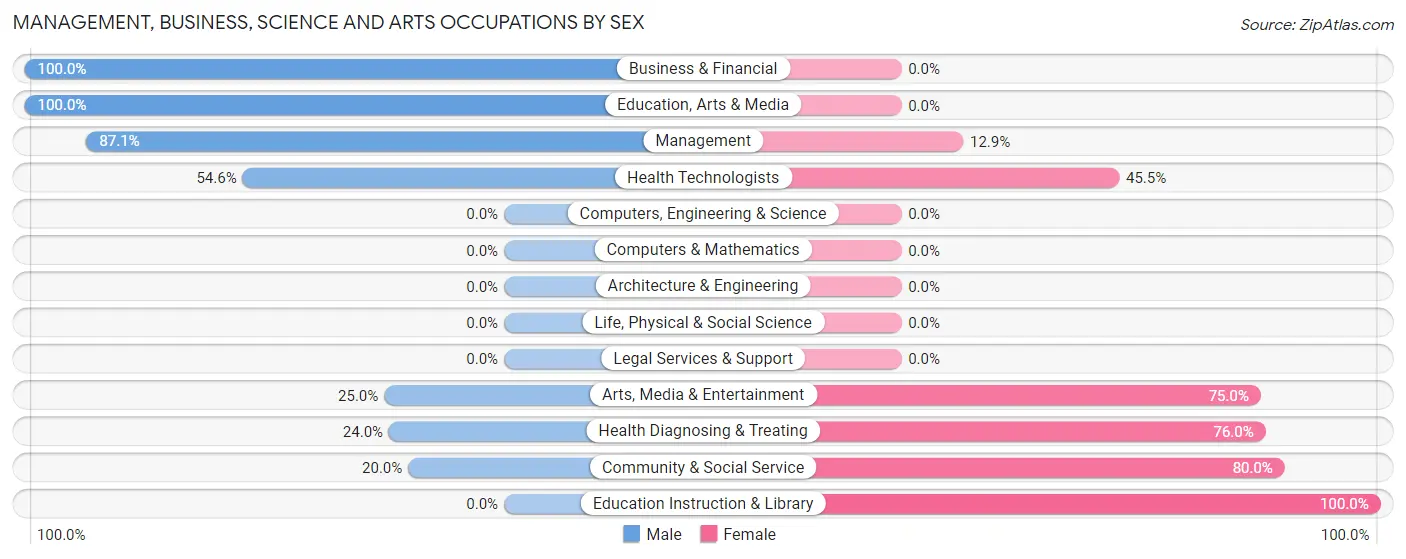
| Occupation | Male | Female |
| Management | 27 (87.1%) | 4 (12.9%) |
| Business & Financial | 22 (100.0%) | 0 (0.0%) |
| Computers, Engineering & Science | 0 (0.0%) | 0 (0.0%) |
| Computers & Mathematics | 0 (0.0%) | 0 (0.0%) |
| Architecture & Engineering | 0 (0.0%) | 0 (0.0%) |
| Life, Physical & Social Science | 0 (0.0%) | 0 (0.0%) |
| Community & Social Service | 8 (20.0%) | 32 (80.0%) |
| Education, Arts & Media | 5 (100.0%) | 0 (0.0%) |
| Legal Services & Support | 0 (0.0%) | 0 (0.0%) |
| Education Instruction & Library | 0 (0.0%) | 23 (100.0%) |
| Arts, Media & Entertainment | 3 (25.0%) | 9 (75.0%) |
| Health Diagnosing & Treating | 6 (24.0%) | 19 (76.0%) |
| Health Technologists | 6 (54.5%) | 5 (45.5%) |
| Total (Category) | 63 (53.4%) | 55 (46.6%) |
| Total (Overall) | 306 (47.1%) | 343 (52.8%) |
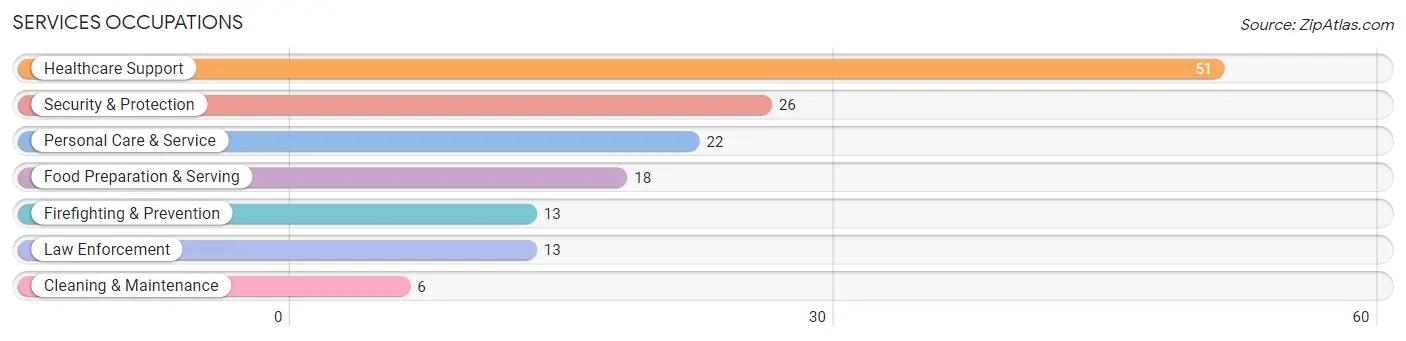
Services Occupations
The most common Services occupations in Maxton are Healthcare Support (51 | 7.9%), Security & Protection (26 | 4.0%), Personal Care & Service (22 | 3.4%), Food Preparation & Serving (18 | 2.8%), and Firefighting & Prevention (13 | 2.0%).
Services Occupations by Sex
Within the Services occupations in Maxton, the most male-oriented occupations are Cleaning & Maintenance (100.0%), Firefighting & Prevention (53.8%), and Food Preparation & Serving (38.9%), while the most female-oriented occupations are Law Enforcement (100.0%), Personal Care & Service (100.0%), and Healthcare Support (90.2%).
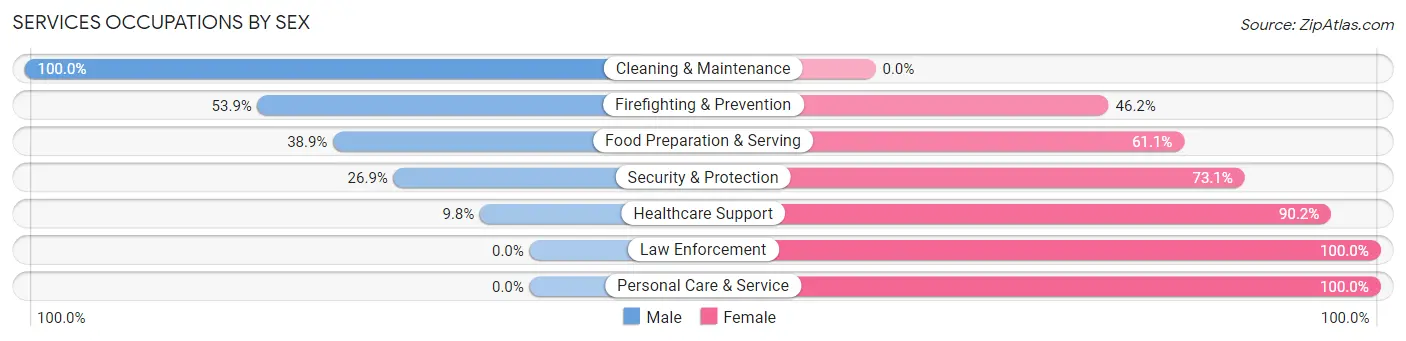
| Occupation | Male | Female |
| Healthcare Support | 5 (9.8%) | 46 (90.2%) |
| Security & Protection | 7 (26.9%) | 19 (73.1%) |
| Firefighting & Prevention | 7 (53.8%) | 6 (46.2%) |
| Law Enforcement | 0 (0.0%) | 13 (100.0%) |
| Food Preparation & Serving | 7 (38.9%) | 11 (61.1%) |
| Cleaning & Maintenance | 6 (100.0%) | 0 (0.0%) |
| Personal Care & Service | 0 (0.0%) | 22 (100.0%) |
| Total (Category) | 25 (20.3%) | 98 (79.7%) |
| Total (Overall) | 306 (47.1%) | 343 (52.8%) |
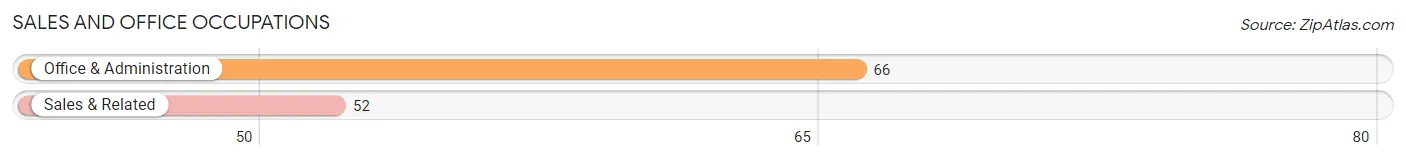
Sales and Office Occupations
The most common Sales and Office occupations in Maxton are Office & Administration (66 | 10.2%), and Sales & Related (52 | 8.0%).
Sales and Office Occupations by Sex
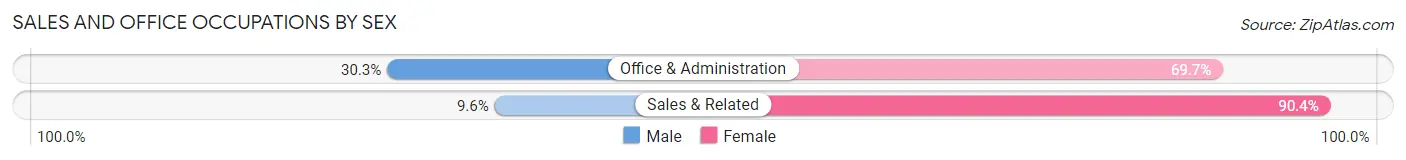
| Occupation | Male | Female |
| Sales & Related | 5 (9.6%) | 47 (90.4%) |
| Office & Administration | 20 (30.3%) | 46 (69.7%) |
| Total (Category) | 25 (21.2%) | 93 (78.8%) |
| Total (Overall) | 306 (47.1%) | 343 (52.8%) |
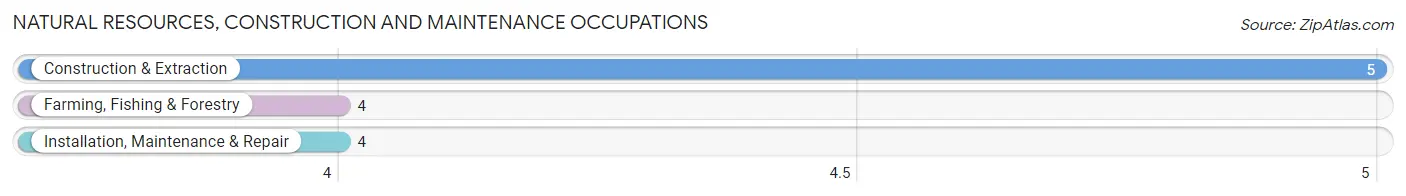
Natural Resources, Construction and Maintenance Occupations
The most common Natural Resources, Construction and Maintenance occupations in Maxton are Construction & Extraction (5 | 0.8%), Farming, Fishing & Forestry (4 | 0.6%), and Installation, Maintenance & Repair (4 | 0.6%).
Natural Resources, Construction and Maintenance Occupations by Sex
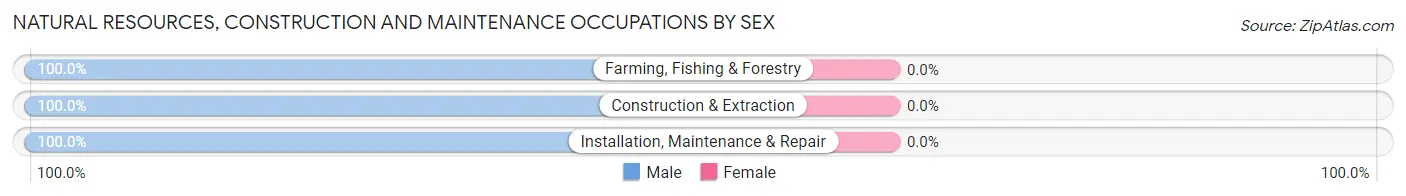
| Occupation | Male | Female |
| Farming, Fishing & Forestry | 4 (100.0%) | 0 (0.0%) |
| Construction & Extraction | 5 (100.0%) | 0 (0.0%) |
| Installation, Maintenance & Repair | 4 (100.0%) | 0 (0.0%) |
| Total (Category) | 13 (100.0%) | 0 (0.0%) |
| Total (Overall) | 306 (47.1%) | 343 (52.8%) |
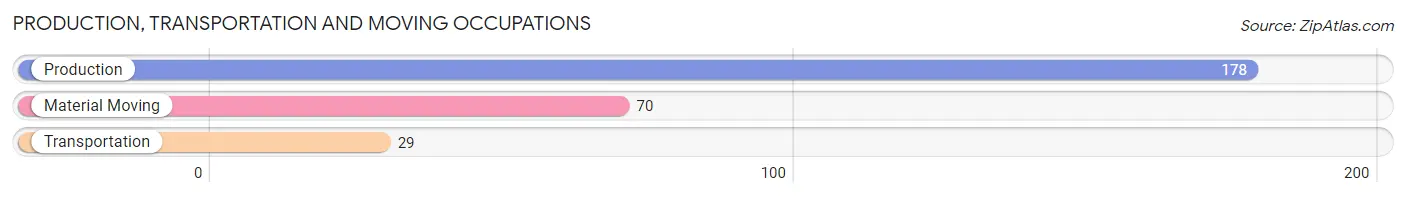
Production, Transportation and Moving Occupations
The most common Production, Transportation and Moving occupations in Maxton are Production (178 | 27.4%), Material Moving (70 | 10.8%), and Transportation (29 | 4.5%).
Production, Transportation and Moving Occupations by Sex
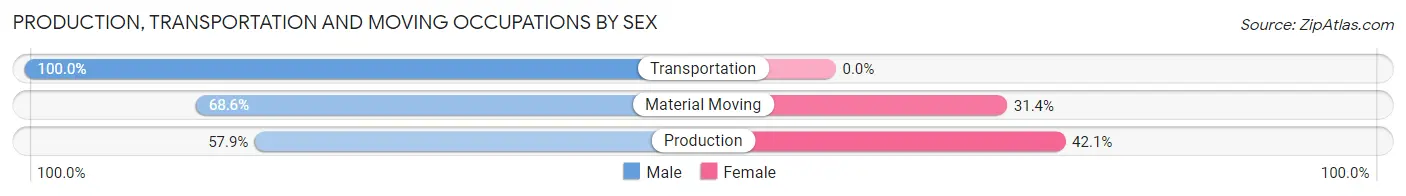
| Occupation | Male | Female |
| Production | 103 (57.9%) | 75 (42.1%) |
| Transportation | 29 (100.0%) | 0 (0.0%) |
| Material Moving | 48 (68.6%) | 22 (31.4%) |
| Total (Category) | 180 (65.0%) | 97 (35.0%) |
| Total (Overall) | 306 (47.1%) | 343 (52.8%) |
Employment Industries by Sex in Maxton
Employment Industries in Maxton
The major employment industries in Maxton include Manufacturing (270 | 41.6%), Health Care & Social Assistance (95 | 14.6%), Retail Trade (83 | 12.8%), Public Administration (58 | 8.9%), and Transportation & Warehousing (39 | 6.0%).
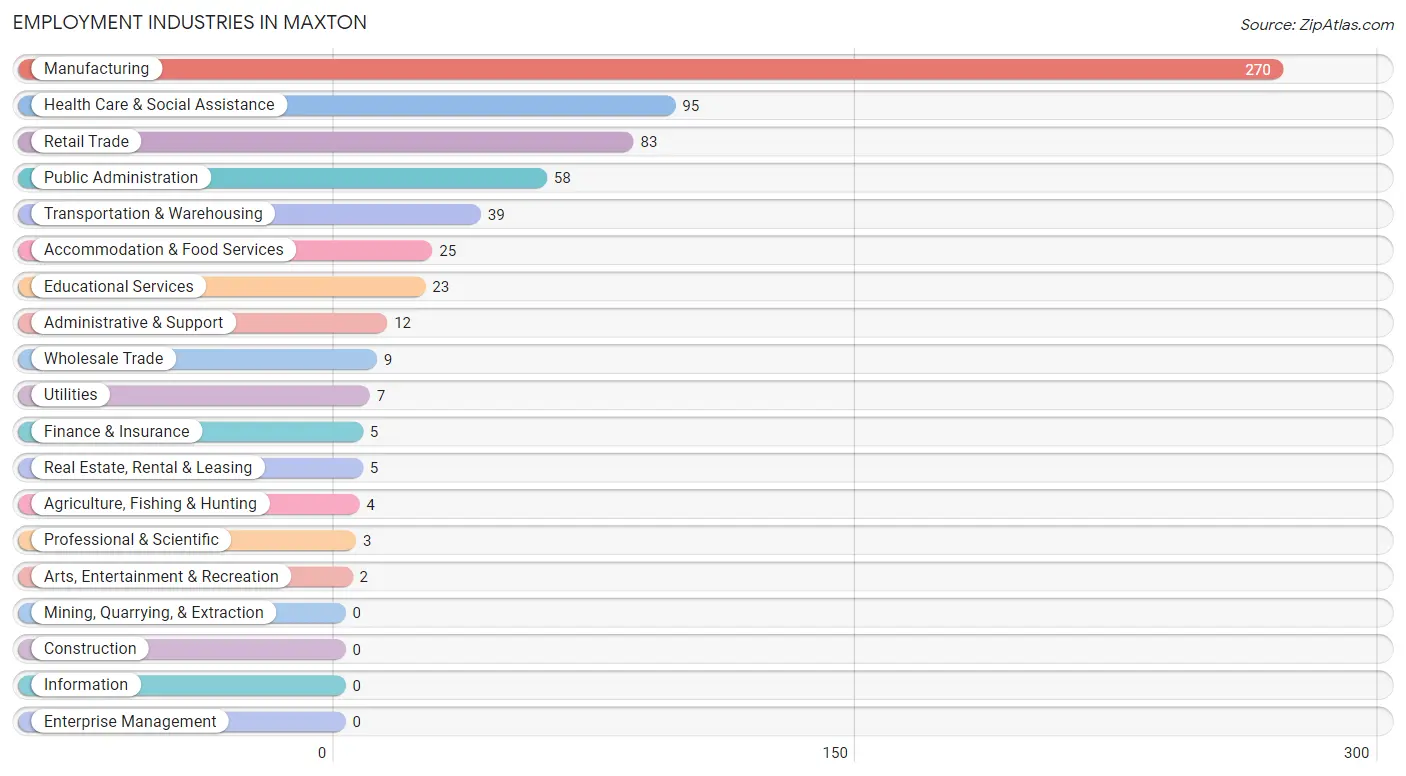
Employment Industries by Sex in Maxton
The Maxton industries that see more men than women are Agriculture, Fishing & Hunting (100.0%), Wholesale Trade (100.0%), and Utilities (100.0%), whereas the industries that tend to have a higher number of women are Finance & Insurance (100.0%), Administrative & Support (100.0%), and Educational Services (100.0%).
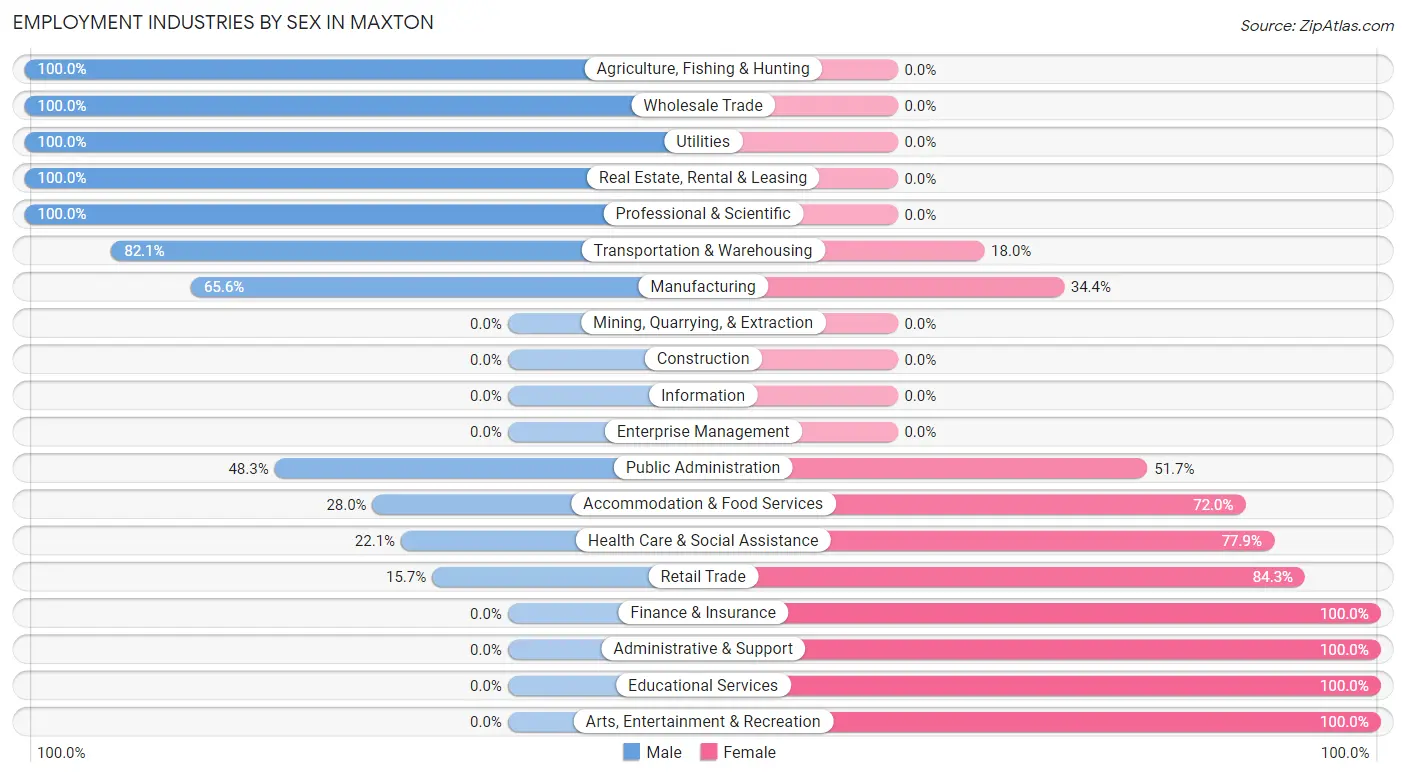
| Industry | Male | Female |
| Agriculture, Fishing & Hunting | 4 (100.0%) | 0 (0.0%) |
| Mining, Quarrying, & Extraction | 0 (0.0%) | 0 (0.0%) |
| Construction | 0 (0.0%) | 0 (0.0%) |
| Manufacturing | 177 (65.6%) | 93 (34.4%) |
| Wholesale Trade | 9 (100.0%) | 0 (0.0%) |
| Retail Trade | 13 (15.7%) | 70 (84.3%) |
| Transportation & Warehousing | 32 (82.1%) | 7 (17.9%) |
| Utilities | 7 (100.0%) | 0 (0.0%) |
| Information | 0 (0.0%) | 0 (0.0%) |
| Finance & Insurance | 0 (0.0%) | 5 (100.0%) |
| Real Estate, Rental & Leasing | 5 (100.0%) | 0 (0.0%) |
| Professional & Scientific | 3 (100.0%) | 0 (0.0%) |
| Enterprise Management | 0 (0.0%) | 0 (0.0%) |
| Administrative & Support | 0 (0.0%) | 12 (100.0%) |
| Educational Services | 0 (0.0%) | 23 (100.0%) |
| Health Care & Social Assistance | 21 (22.1%) | 74 (77.9%) |
| Arts, Entertainment & Recreation | 0 (0.0%) | 2 (100.0%) |
| Accommodation & Food Services | 7 (28.0%) | 18 (72.0%) |
| Public Administration | 28 (48.3%) | 30 (51.7%) |
| Total | 306 (47.1%) | 343 (52.8%) |
Education in Maxton
School Enrollment in Maxton
The most common levels of schooling among the 612 students in Maxton are elementary school (178 | 29.1%), middle school (176 | 28.8%), and high school (103 | 16.8%).
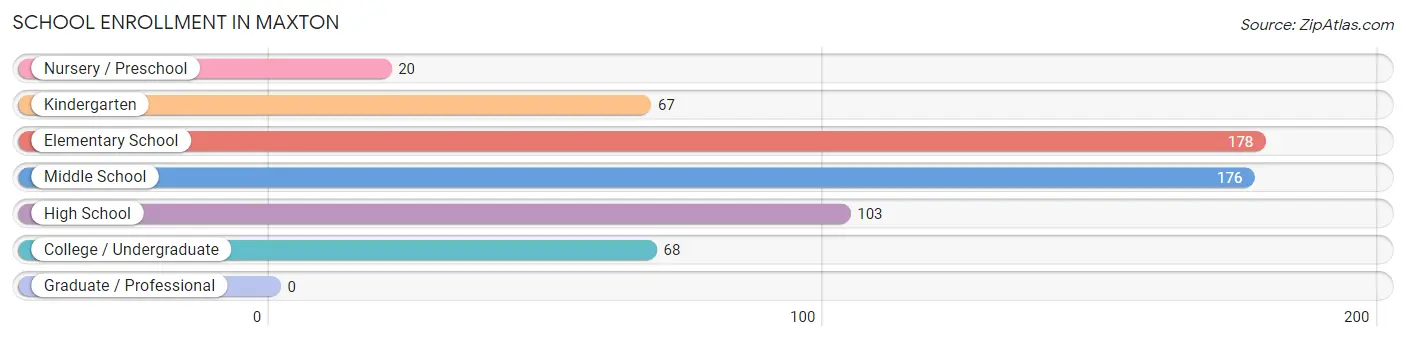
| School Level | # Students | % Students |
| Nursery / Preschool | 20 | 3.3% |
| Kindergarten | 67 | 11.0% |
| Elementary School | 178 | 29.1% |
| Middle School | 176 | 28.8% |
| High School | 103 | 16.8% |
| College / Undergraduate | 68 | 11.1% |
| Graduate / Professional | 0 | 0.0% |
| Total | 612 | 100.0% |
School Enrollment by Age by Funding Source in Maxton
Out of a total of 612 students who are enrolled in schools in Maxton, 6 (1.0%) attend a private institution, while the remaining 606 (99.0%) are enrolled in public schools. The age group of 25 to 34 year olds has the highest likelihood of being enrolled in private schools, with 6 (17.6% in the age bracket) enrolled. Conversely, the age group of 3 to 4 year olds has the lowest likelihood of being enrolled in a private school, with 9 (100.0% in the age bracket) attending a public institution.
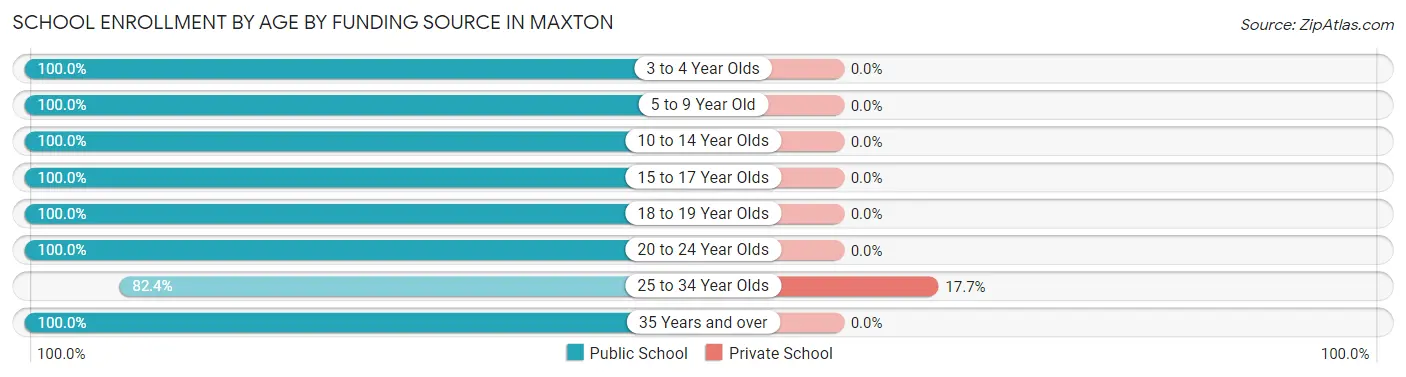
| Age Bracket | Public School | Private School |
| 3 to 4 Year Olds | 9 (100.0%) | 0 (0.0%) |
| 5 to 9 Year Old | 220 (100.0%) | 0 (0.0%) |
| 10 to 14 Year Olds | 207 (100.0%) | 0 (0.0%) |
| 15 to 17 Year Olds | 91 (100.0%) | 0 (0.0%) |
| 18 to 19 Year Olds | 15 (100.0%) | 0 (0.0%) |
| 20 to 24 Year Olds | 15 (100.0%) | 0 (0.0%) |
| 25 to 34 Year Olds | 28 (82.4%) | 6 (17.6%) |
| 35 Years and over | 21 (100.0%) | 0 (0.0%) |
| Total | 606 (99.0%) | 6 (1.0%) |
Educational Attainment by Field of Study in Maxton
Social sciences (36 | 24.0%), education (24 | 16.0%), arts & humanities (20 | 13.3%), bio, nature & agricultural (11 | 7.3%), and computers & mathematics (10 | 6.7%) are the most common fields of study among 150 individuals in Maxton who have obtained a bachelor's degree or higher.
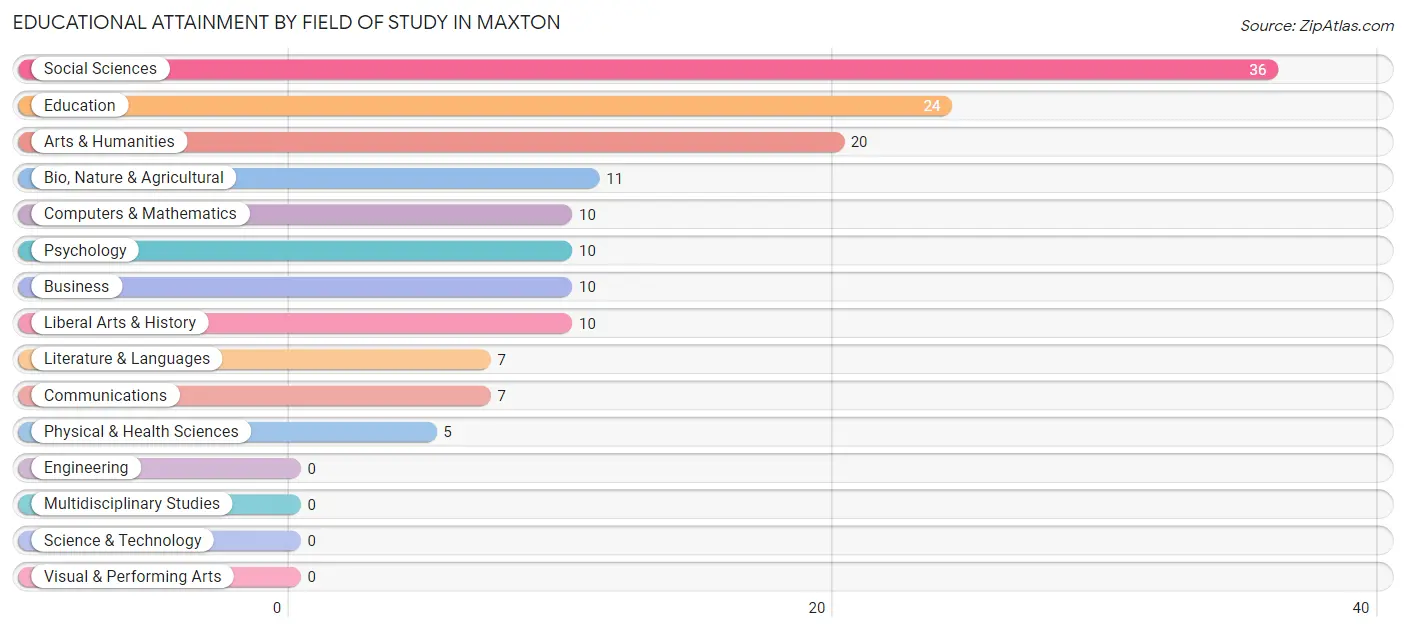
| Field of Study | # Graduates | % Graduates |
| Computers & Mathematics | 10 | 6.7% |
| Bio, Nature & Agricultural | 11 | 7.3% |
| Physical & Health Sciences | 5 | 3.3% |
| Psychology | 10 | 6.7% |
| Social Sciences | 36 | 24.0% |
| Engineering | 0 | 0.0% |
| Multidisciplinary Studies | 0 | 0.0% |
| Science & Technology | 0 | 0.0% |
| Business | 10 | 6.7% |
| Education | 24 | 16.0% |
| Literature & Languages | 7 | 4.7% |
| Liberal Arts & History | 10 | 6.7% |
| Visual & Performing Arts | 0 | 0.0% |
| Communications | 7 | 4.7% |
| Arts & Humanities | 20 | 13.3% |
| Total | 150 | 100.0% |
Transportation & Commute in Maxton
Vehicle Availability by Sex in Maxton
The most prevalent vehicle ownership categories in Maxton are males with 2 vehicles (97, accounting for 32.2%) and females with 2 vehicles (86, making up 29.0%).
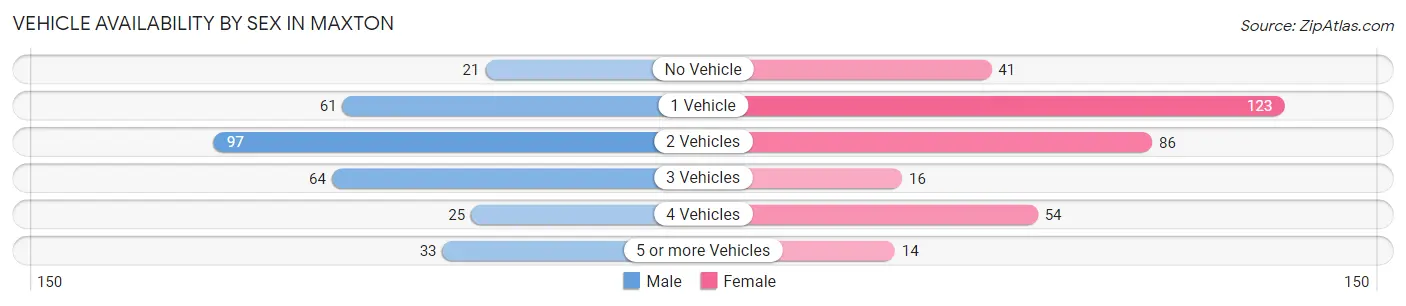
| Vehicles Available | Male | Female |
| No Vehicle | 21 (7.0%) | 41 (12.3%) |
| 1 Vehicle | 61 (20.3%) | 123 (36.8%) |
| 2 Vehicles | 97 (32.2%) | 86 (25.8%) |
| 3 Vehicles | 64 (21.3%) | 16 (4.8%) |
| 4 Vehicles | 25 (8.3%) | 54 (16.2%) |
| 5 or more Vehicles | 33 (11.0%) | 14 (4.2%) |
| Total | 301 (100.0%) | 334 (100.0%) |
Commute Time in Maxton
The most frequently occuring commute durations in Maxton are 10 to 14 minutes (126 commuters, 20.3%), 5 to 9 minutes (106 commuters, 17.1%), and 20 to 24 minutes (95 commuters, 15.3%).
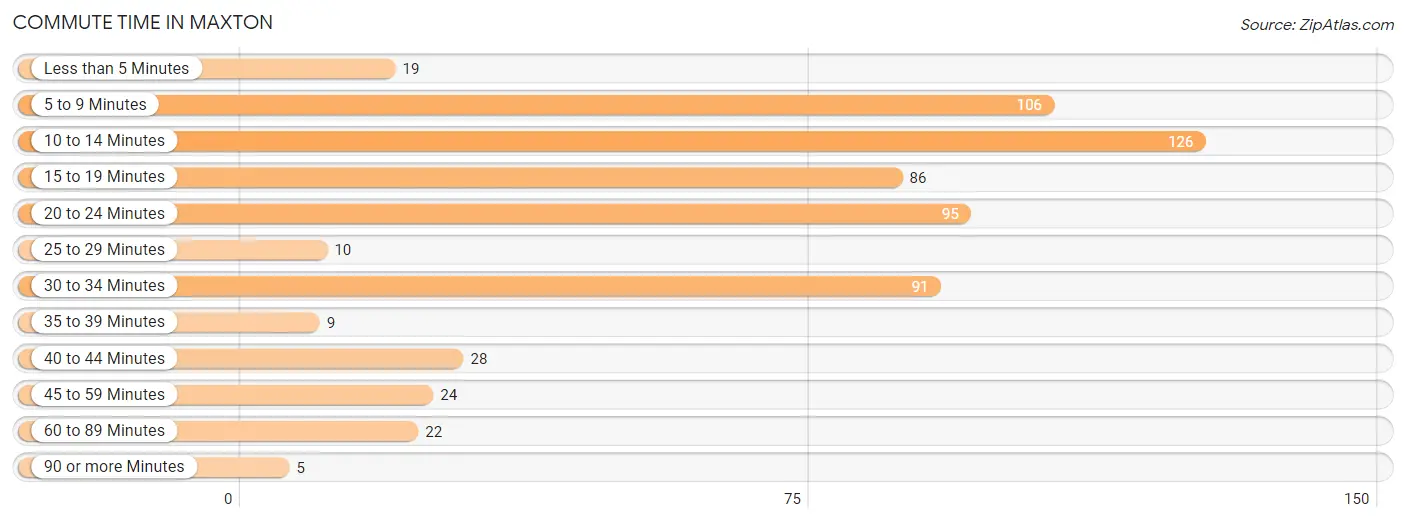
| Commute Time | # Commuters | % Commuters |
| Less than 5 Minutes | 19 | 3.1% |
| 5 to 9 Minutes | 106 | 17.1% |
| 10 to 14 Minutes | 126 | 20.3% |
| 15 to 19 Minutes | 86 | 13.9% |
| 20 to 24 Minutes | 95 | 15.3% |
| 25 to 29 Minutes | 10 | 1.6% |
| 30 to 34 Minutes | 91 | 14.6% |
| 35 to 39 Minutes | 9 | 1.5% |
| 40 to 44 Minutes | 28 | 4.5% |
| 45 to 59 Minutes | 24 | 3.9% |
| 60 to 89 Minutes | 22 | 3.5% |
| 90 or more Minutes | 5 | 0.8% |
Commute Time by Sex in Maxton
The most common commute times in Maxton are 5 to 9 minutes (67 commuters, 22.9%) for males and 10 to 14 minutes (81 commuters, 24.7%) for females.
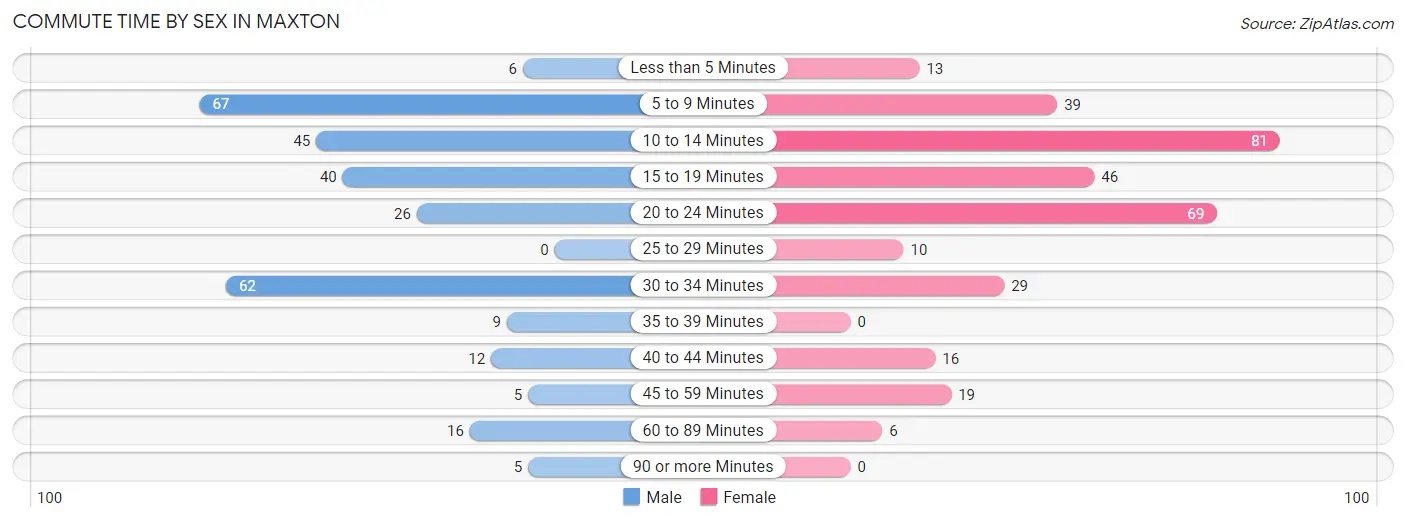
| Commute Time | Male | Female |
| Less than 5 Minutes | 6 (2.1%) | 13 (4.0%) |
| 5 to 9 Minutes | 67 (22.9%) | 39 (11.9%) |
| 10 to 14 Minutes | 45 (15.4%) | 81 (24.7%) |
| 15 to 19 Minutes | 40 (13.7%) | 46 (14.0%) |
| 20 to 24 Minutes | 26 (8.9%) | 69 (21.0%) |
| 25 to 29 Minutes | 0 (0.0%) | 10 (3.0%) |
| 30 to 34 Minutes | 62 (21.2%) | 29 (8.8%) |
| 35 to 39 Minutes | 9 (3.1%) | 0 (0.0%) |
| 40 to 44 Minutes | 12 (4.1%) | 16 (4.9%) |
| 45 to 59 Minutes | 5 (1.7%) | 19 (5.8%) |
| 60 to 89 Minutes | 16 (5.5%) | 6 (1.8%) |
| 90 or more Minutes | 5 (1.7%) | 0 (0.0%) |
Time of Departure to Work by Sex in Maxton
The most frequent times of departure to work in Maxton are 4:00 PM to 11:59 PM (60, 20.5%) for males and 12:00 PM to 3:59 PM (54, 16.5%) for females.
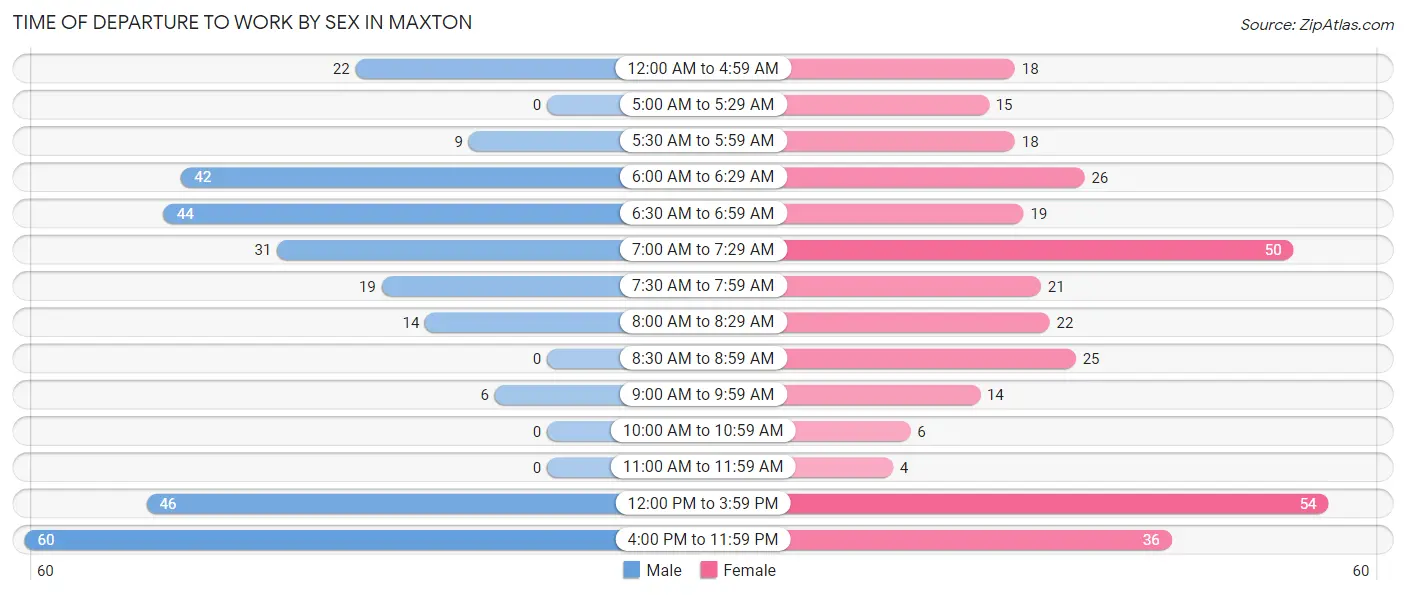
| Time of Departure | Male | Female |
| 12:00 AM to 4:59 AM | 22 (7.5%) | 18 (5.5%) |
| 5:00 AM to 5:29 AM | 0 (0.0%) | 15 (4.6%) |
| 5:30 AM to 5:59 AM | 9 (3.1%) | 18 (5.5%) |
| 6:00 AM to 6:29 AM | 42 (14.3%) | 26 (7.9%) |
| 6:30 AM to 6:59 AM | 44 (15.0%) | 19 (5.8%) |
| 7:00 AM to 7:29 AM | 31 (10.6%) | 50 (15.2%) |
| 7:30 AM to 7:59 AM | 19 (6.5%) | 21 (6.4%) |
| 8:00 AM to 8:29 AM | 14 (4.8%) | 22 (6.7%) |
| 8:30 AM to 8:59 AM | 0 (0.0%) | 25 (7.6%) |
| 9:00 AM to 9:59 AM | 6 (2.1%) | 14 (4.3%) |
| 10:00 AM to 10:59 AM | 0 (0.0%) | 6 (1.8%) |
| 11:00 AM to 11:59 AM | 0 (0.0%) | 4 (1.2%) |
| 12:00 PM to 3:59 PM | 46 (15.7%) | 54 (16.5%) |
| 4:00 PM to 11:59 PM | 60 (20.5%) | 36 (11.0%) |
| Total | 293 (100.0%) | 328 (100.0%) |
Housing Occupancy in Maxton
Occupancy by Ownership in Maxton
Of the total 906 dwellings in Maxton, owner-occupied units account for 396 (43.7%), while renter-occupied units make up 510 (56.3%).
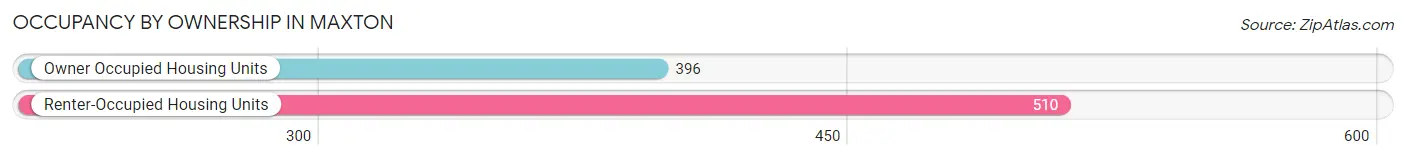
| Occupancy | # Housing Units | % Housing Units |
| Owner Occupied Housing Units | 396 | 43.7% |
| Renter-Occupied Housing Units | 510 | 56.3% |
| Total Occupied Housing Units | 906 | 100.0% |
Occupancy by Household Size in Maxton
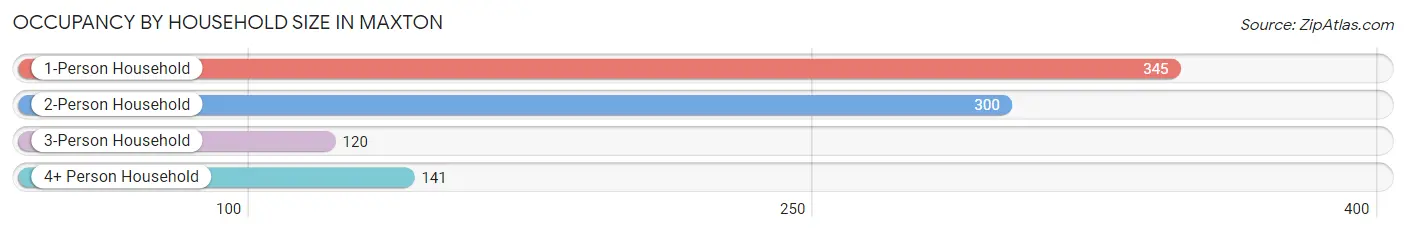
| Household Size | # Housing Units | % Housing Units |
| 1-Person Household | 345 | 38.1% |
| 2-Person Household | 300 | 33.1% |
| 3-Person Household | 120 | 13.3% |
| 4+ Person Household | 141 | 15.6% |
| Total Housing Units | 906 | 100.0% |
Occupancy by Ownership by Household Size in Maxton
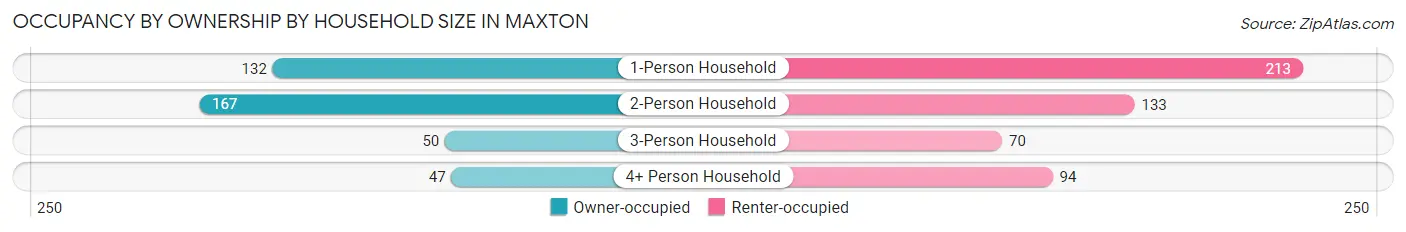
| Household Size | Owner-occupied | Renter-occupied |
| 1-Person Household | 132 (38.3%) | 213 (61.7%) |
| 2-Person Household | 167 (55.7%) | 133 (44.3%) |
| 3-Person Household | 50 (41.7%) | 70 (58.3%) |
| 4+ Person Household | 47 (33.3%) | 94 (66.7%) |
| Total Housing Units | 396 (43.7%) | 510 (56.3%) |
Occupancy by Educational Attainment in Maxton
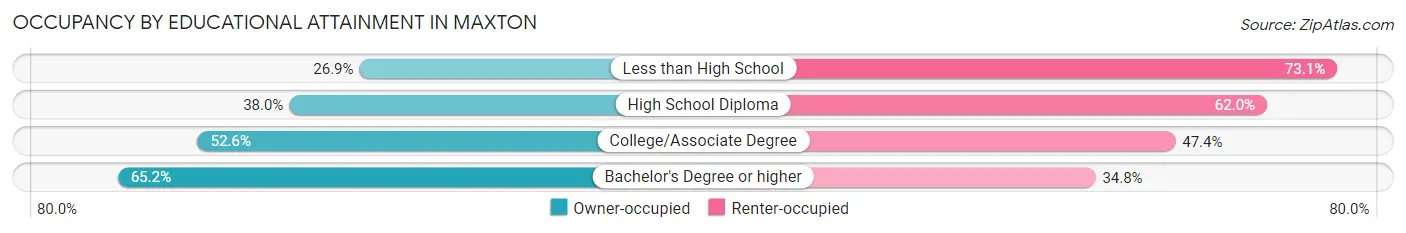
| Household Size | Owner-occupied | Renter-occupied |
| Less than High School | 39 (26.9%) | 106 (73.1%) |
| High School Diploma | 143 (38.0%) | 233 (62.0%) |
| College/Associate Degree | 154 (52.6%) | 139 (47.4%) |
| Bachelor's Degree or higher | 60 (65.2%) | 32 (34.8%) |
Occupancy by Age of Householder in Maxton
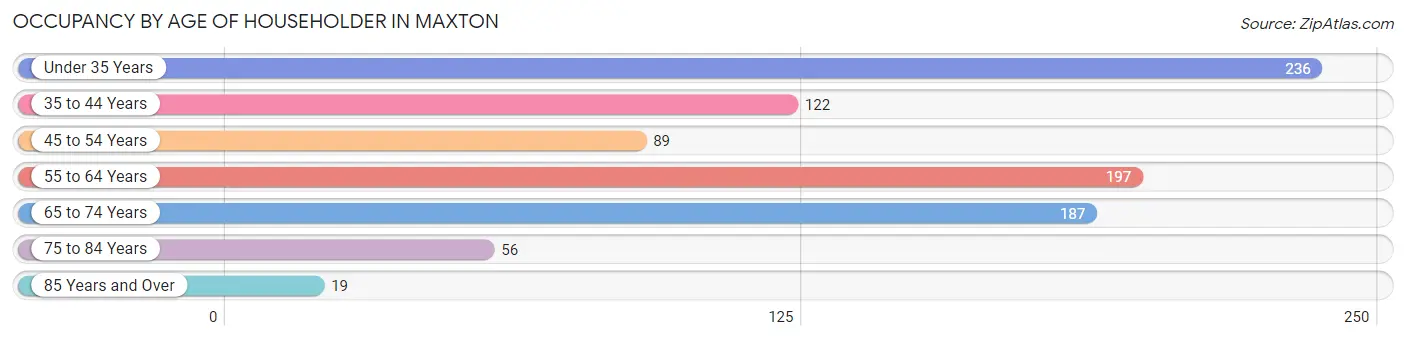
| Age Bracket | # Households | % Households |
| Under 35 Years | 236 | 26.1% |
| 35 to 44 Years | 122 | 13.5% |
| 45 to 54 Years | 89 | 9.8% |
| 55 to 64 Years | 197 | 21.7% |
| 65 to 74 Years | 187 | 20.6% |
| 75 to 84 Years | 56 | 6.2% |
| 85 Years and Over | 19 | 2.1% |
| Total | 906 | 100.0% |
Housing Finances in Maxton
Median Income by Occupancy in Maxton
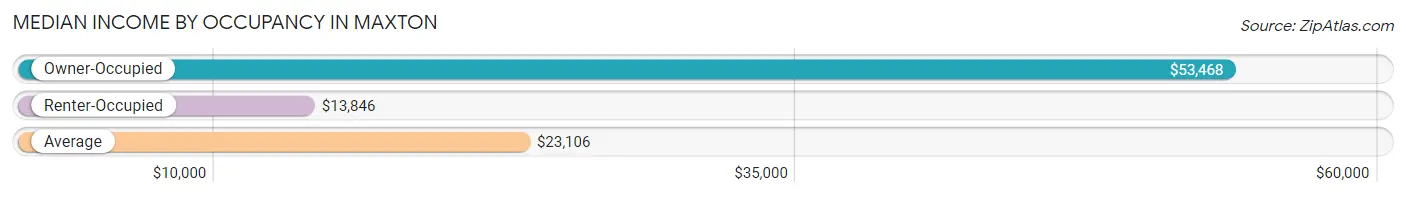
| Occupancy Type | # Households | Median Income |
| Owner-Occupied | 396 (43.7%) | $53,468 |
| Renter-Occupied | 510 (56.3%) | $13,846 |
| Average | 906 (100.0%) | $23,106 |
Occupancy by Householder Income Bracket in Maxton
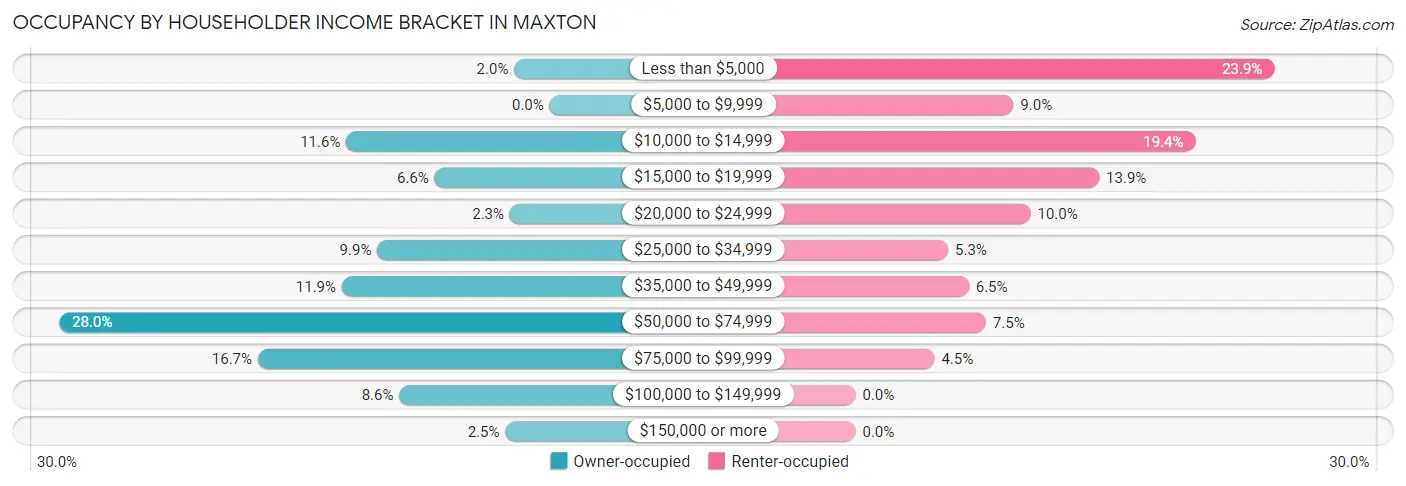
| Income Bracket | Owner-occupied | Renter-occupied |
| Less than $5,000 | 8 (2.0%) | 122 (23.9%) |
| $5,000 to $9,999 | 0 (0.0%) | 46 (9.0%) |
| $10,000 to $14,999 | 46 (11.6%) | 99 (19.4%) |
| $15,000 to $19,999 | 26 (6.6%) | 71 (13.9%) |
| $20,000 to $24,999 | 9 (2.3%) | 51 (10.0%) |
| $25,000 to $34,999 | 39 (9.9%) | 27 (5.3%) |
| $35,000 to $49,999 | 47 (11.9%) | 33 (6.5%) |
| $50,000 to $74,999 | 111 (28.0%) | 38 (7.4%) |
| $75,000 to $99,999 | 66 (16.7%) | 23 (4.5%) |
| $100,000 to $149,999 | 34 (8.6%) | 0 (0.0%) |
| $150,000 or more | 10 (2.5%) | 0 (0.0%) |
| Total | 396 (100.0%) | 510 (100.0%) |
Monthly Housing Cost Tiers in Maxton
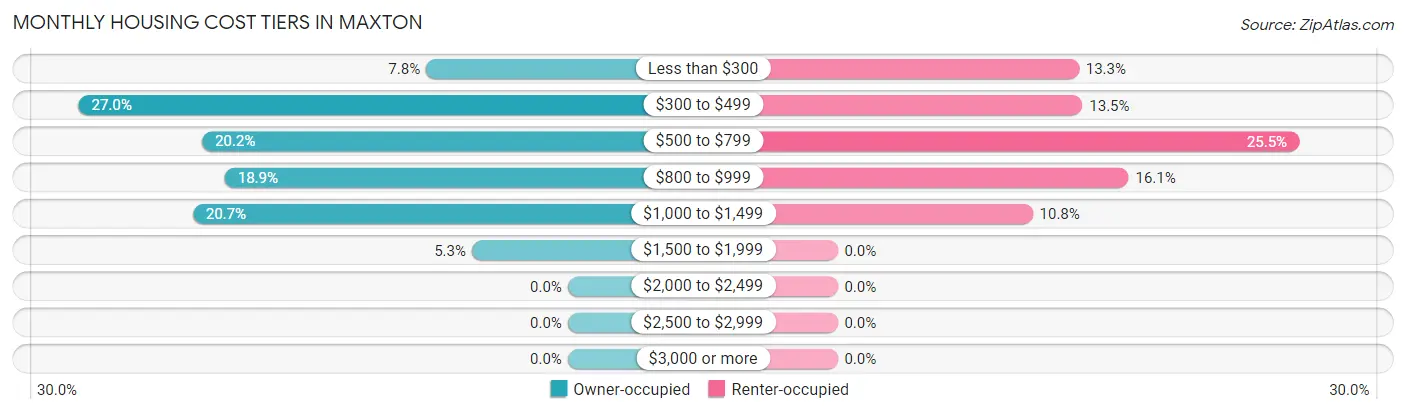
| Monthly Cost | Owner-occupied | Renter-occupied |
| Less than $300 | 31 (7.8%) | 68 (13.3%) |
| $300 to $499 | 107 (27.0%) | 69 (13.5%) |
| $500 to $799 | 80 (20.2%) | 130 (25.5%) |
| $800 to $999 | 75 (18.9%) | 82 (16.1%) |
| $1,000 to $1,499 | 82 (20.7%) | 55 (10.8%) |
| $1,500 to $1,999 | 21 (5.3%) | 0 (0.0%) |
| $2,000 to $2,499 | 0 (0.0%) | 0 (0.0%) |
| $2,500 to $2,999 | 0 (0.0%) | 0 (0.0%) |
| $3,000 or more | 0 (0.0%) | 0 (0.0%) |
| Total | 396 (100.0%) | 510 (100.0%) |
Physical Housing Characteristics in Maxton
Housing Structures in Maxton
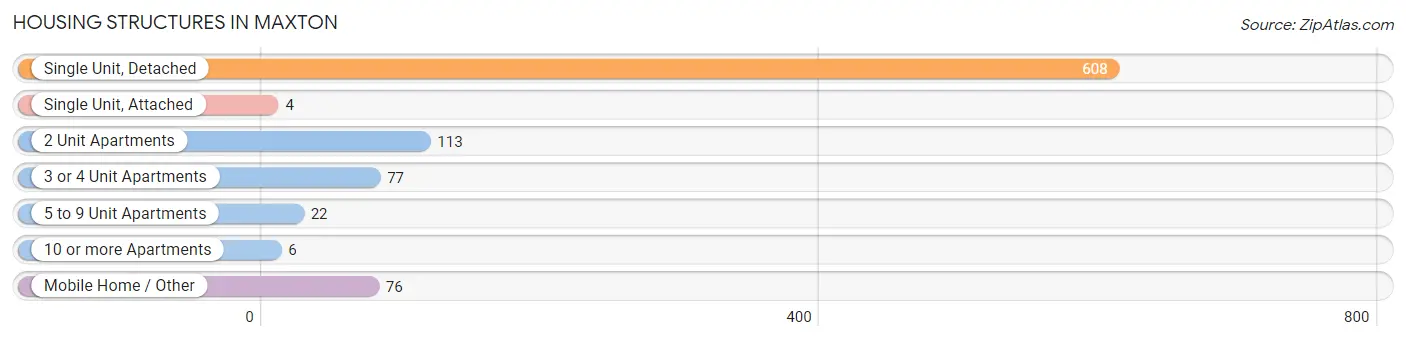
| Structure Type | # Housing Units | % Housing Units |
| Single Unit, Detached | 608 | 67.1% |
| Single Unit, Attached | 4 | 0.4% |
| 2 Unit Apartments | 113 | 12.5% |
| 3 or 4 Unit Apartments | 77 | 8.5% |
| 5 to 9 Unit Apartments | 22 | 2.4% |
| 10 or more Apartments | 6 | 0.7% |
| Mobile Home / Other | 76 | 8.4% |
| Total | 906 | 100.0% |
Housing Structures by Occupancy in Maxton
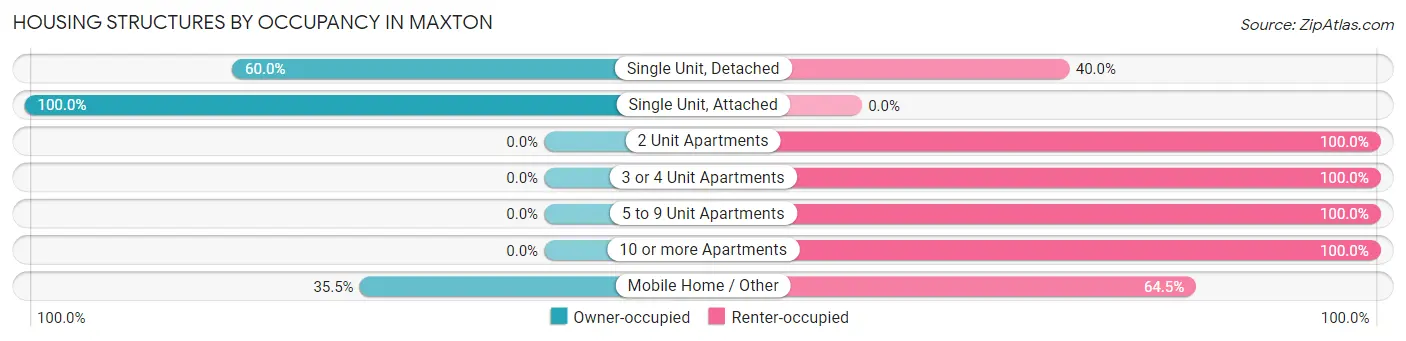
| Structure Type | Owner-occupied | Renter-occupied |
| Single Unit, Detached | 365 (60.0%) | 243 (40.0%) |
| Single Unit, Attached | 4 (100.0%) | 0 (0.0%) |
| 2 Unit Apartments | 0 (0.0%) | 113 (100.0%) |
| 3 or 4 Unit Apartments | 0 (0.0%) | 77 (100.0%) |
| 5 to 9 Unit Apartments | 0 (0.0%) | 22 (100.0%) |
| 10 or more Apartments | 0 (0.0%) | 6 (100.0%) |
| Mobile Home / Other | 27 (35.5%) | 49 (64.5%) |
| Total | 396 (43.7%) | 510 (56.3%) |
Housing Structures by Number of Rooms in Maxton
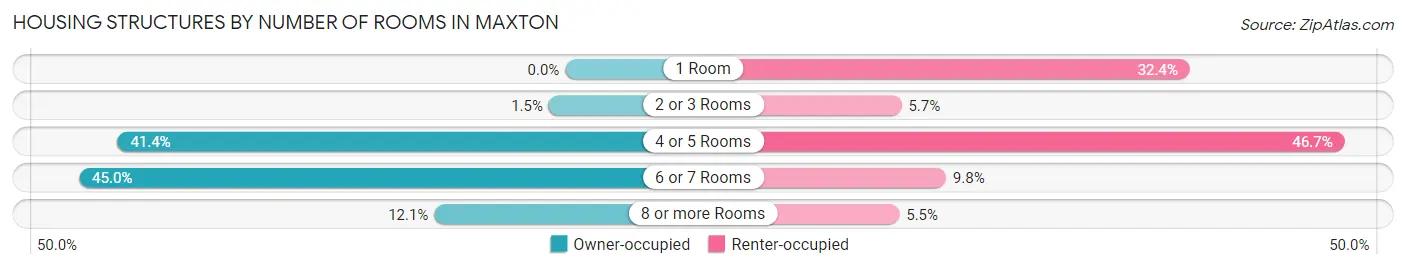
| Number of Rooms | Owner-occupied | Renter-occupied |
| 1 Room | 0 (0.0%) | 165 (32.4%) |
| 2 or 3 Rooms | 6 (1.5%) | 29 (5.7%) |
| 4 or 5 Rooms | 164 (41.4%) | 238 (46.7%) |
| 6 or 7 Rooms | 178 (45.0%) | 50 (9.8%) |
| 8 or more Rooms | 48 (12.1%) | 28 (5.5%) |
| Total | 396 (100.0%) | 510 (100.0%) |
Housing Structure by Heating Type in Maxton
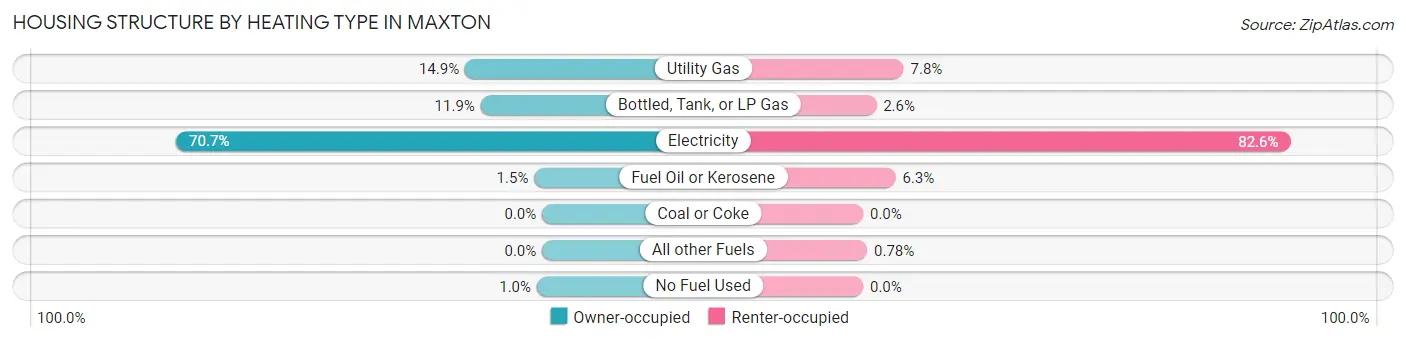
| Heating Type | Owner-occupied | Renter-occupied |
| Utility Gas | 59 (14.9%) | 40 (7.8%) |
| Bottled, Tank, or LP Gas | 47 (11.9%) | 13 (2.5%) |
| Electricity | 280 (70.7%) | 421 (82.6%) |
| Fuel Oil or Kerosene | 6 (1.5%) | 32 (6.3%) |
| Coal or Coke | 0 (0.0%) | 0 (0.0%) |
| All other Fuels | 0 (0.0%) | 4 (0.8%) |
| No Fuel Used | 4 (1.0%) | 0 (0.0%) |
| Total | 396 (100.0%) | 510 (100.0%) |
Household Vehicle Usage in Maxton
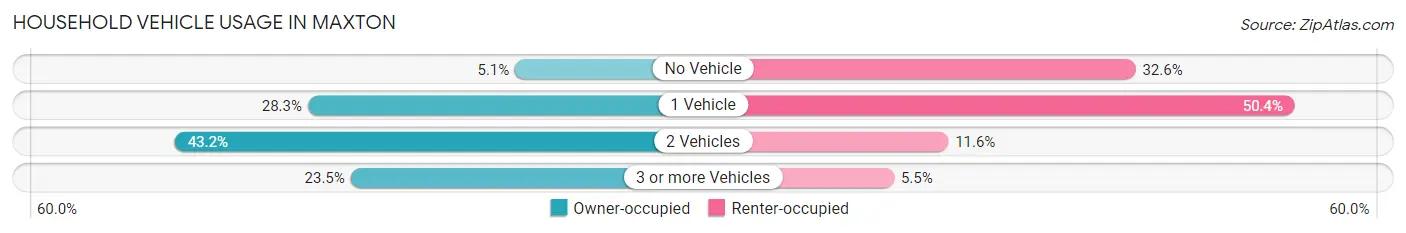
| Vehicles per Household | Owner-occupied | Renter-occupied |
| No Vehicle | 20 (5.1%) | 166 (32.6%) |
| 1 Vehicle | 112 (28.3%) | 257 (50.4%) |
| 2 Vehicles | 171 (43.2%) | 59 (11.6%) |
| 3 or more Vehicles | 93 (23.5%) | 28 (5.5%) |
| Total | 396 (100.0%) | 510 (100.0%) |
Real Estate & Mortgages in Maxton
Real Estate and Mortgage Overview in Maxton
| Characteristic | Without Mortgage | With Mortgage |
| Housing Units | 224 | 172 |
| Median Property Value | $76,300 | $107,500 |
| Median Household Income | $50,909 | $10 |
| Monthly Housing Costs | $454 | $0 |
| Real Estate Taxes | $797 | $18 |
Property Value by Mortgage Status in Maxton
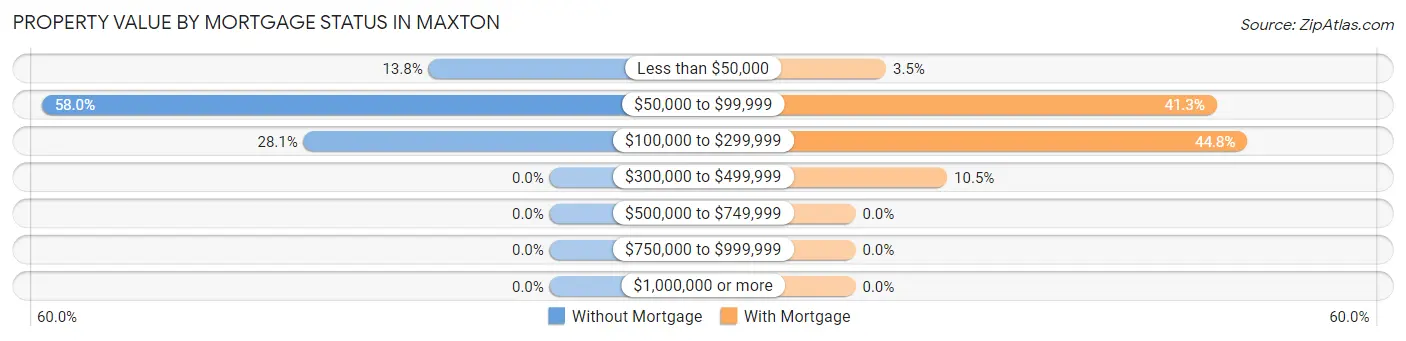
| Property Value | Without Mortgage | With Mortgage |
| Less than $50,000 | 31 (13.8%) | 6 (3.5%) |
| $50,000 to $99,999 | 130 (58.0%) | 71 (41.3%) |
| $100,000 to $299,999 | 63 (28.1%) | 77 (44.8%) |
| $300,000 to $499,999 | 0 (0.0%) | 18 (10.5%) |
| $500,000 to $749,999 | 0 (0.0%) | 0 (0.0%) |
| $750,000 to $999,999 | 0 (0.0%) | 0 (0.0%) |
| $1,000,000 or more | 0 (0.0%) | 0 (0.0%) |
| Total | 224 (100.0%) | 172 (100.0%) |
Household Income by Mortgage Status in Maxton
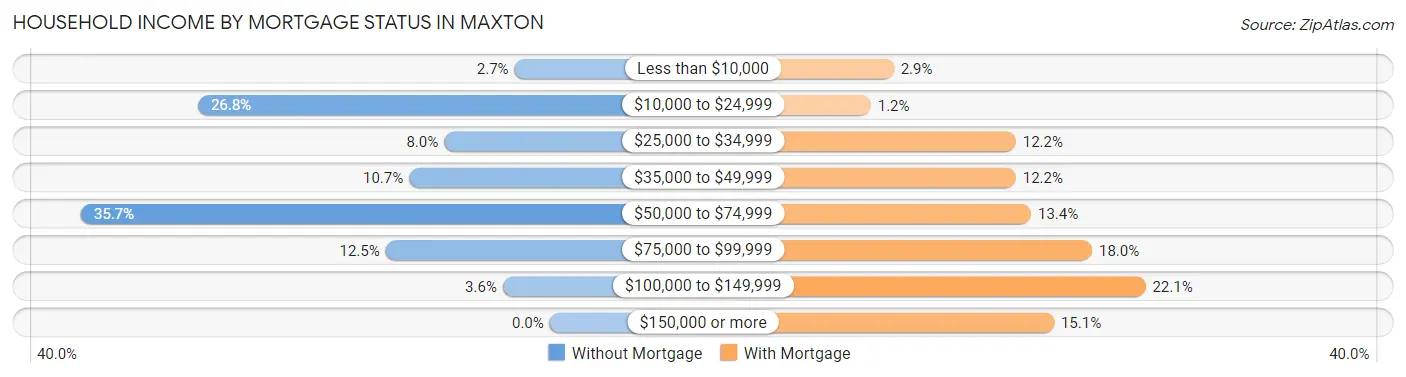
| Household Income | Without Mortgage | With Mortgage |
| Less than $10,000 | 6 (2.7%) | 5 (2.9%) |
| $10,000 to $24,999 | 60 (26.8%) | 2 (1.2%) |
| $25,000 to $34,999 | 18 (8.0%) | 21 (12.2%) |
| $35,000 to $49,999 | 24 (10.7%) | 21 (12.2%) |
| $50,000 to $74,999 | 80 (35.7%) | 23 (13.4%) |
| $75,000 to $99,999 | 28 (12.5%) | 31 (18.0%) |
| $100,000 to $149,999 | 8 (3.6%) | 38 (22.1%) |
| $150,000 or more | 0 (0.0%) | 26 (15.1%) |
| Total | 224 (100.0%) | 172 (100.0%) |
Property Value to Household Income Ratio in Maxton
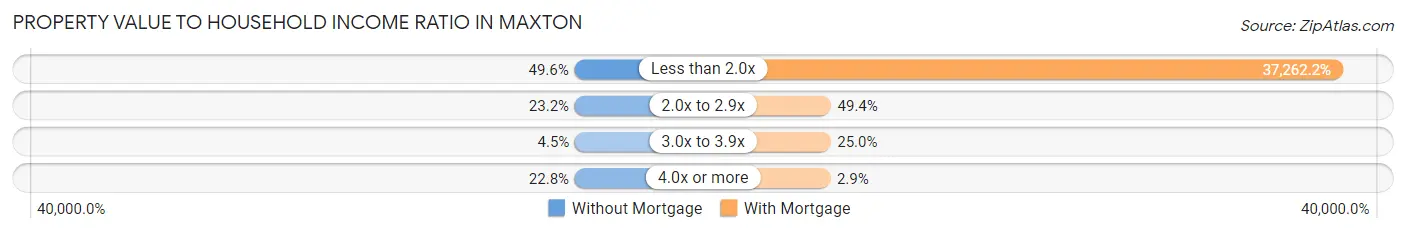
| Value-to-Income Ratio | Without Mortgage | With Mortgage |
| Less than 2.0x | 111 (49.5%) | 64,091 (37,262.2%) |
| 2.0x to 2.9x | 52 (23.2%) | 85 (49.4%) |
| 3.0x to 3.9x | 10 (4.5%) | 43 (25.0%) |
| 4.0x or more | 51 (22.8%) | 5 (2.9%) |
| Total | 224 (100.0%) | 172 (100.0%) |
Real Estate Taxes by Mortgage Status in Maxton
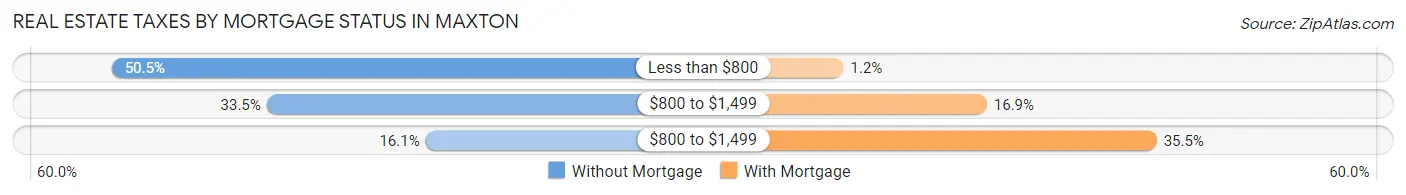
| Property Taxes | Without Mortgage | With Mortgage |
| Less than $800 | 113 (50.4%) | 2 (1.2%) |
| $800 to $1,499 | 75 (33.5%) | 29 (16.9%) |
| $800 to $1,499 | 36 (16.1%) | 61 (35.5%) |
| Total | 224 (100.0%) | 172 (100.0%) |
Health & Disability in Maxton
Health Insurance Coverage by Age in Maxton
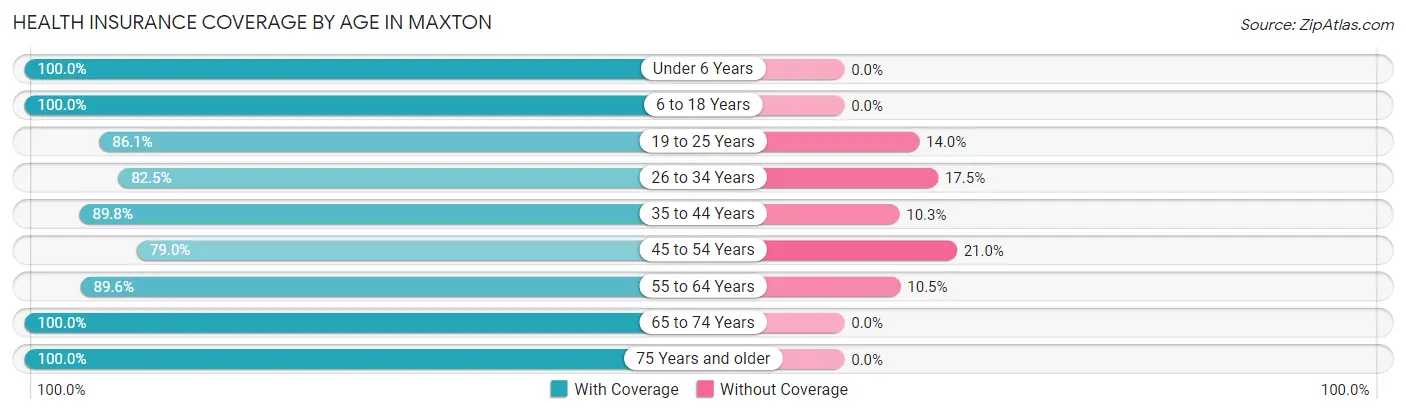
| Age Bracket | With Coverage | Without Coverage |
| Under 6 Years | 270 (100.0%) | 0 (0.0%) |
| 6 to 18 Years | 501 (100.0%) | 0 (0.0%) |
| 19 to 25 Years | 148 (86.1%) | 24 (14.0%) |
| 26 to 34 Years | 241 (82.5%) | 51 (17.5%) |
| 35 to 44 Years | 219 (89.7%) | 25 (10.2%) |
| 45 to 54 Years | 132 (79.0%) | 35 (21.0%) |
| 55 to 64 Years | 257 (89.5%) | 30 (10.4%) |
| 65 to 74 Years | 278 (100.0%) | 0 (0.0%) |
| 75 Years and older | 89 (100.0%) | 0 (0.0%) |
| Total | 2,135 (92.8%) | 165 (7.2%) |
Health Insurance Coverage by Citizenship Status in Maxton
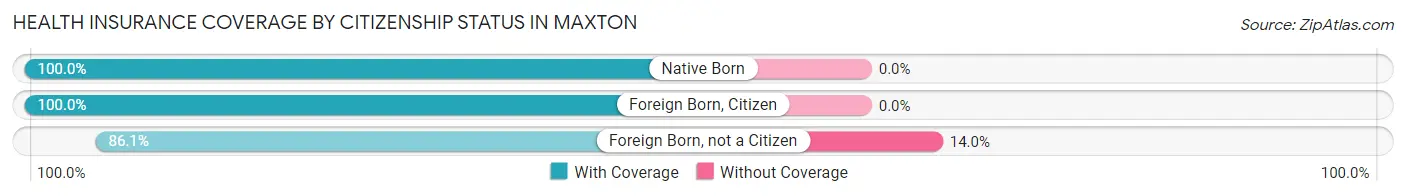
| Citizenship Status | With Coverage | Without Coverage |
| Native Born | 270 (100.0%) | 0 (0.0%) |
| Foreign Born, Citizen | 501 (100.0%) | 0 (0.0%) |
| Foreign Born, not a Citizen | 148 (86.1%) | 24 (14.0%) |
Health Insurance Coverage by Household Income in Maxton
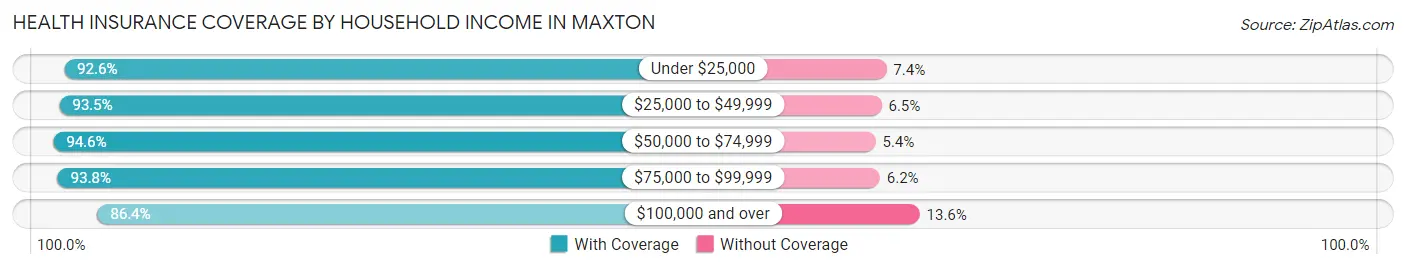
| Household Income | With Coverage | Without Coverage |
| Under $25,000 | 936 (92.6%) | 75 (7.4%) |
| $25,000 to $49,999 | 388 (93.5%) | 27 (6.5%) |
| $50,000 to $74,999 | 456 (94.6%) | 26 (5.4%) |
| $75,000 to $99,999 | 212 (93.8%) | 14 (6.2%) |
| $100,000 and over | 133 (86.4%) | 21 (13.6%) |
Public vs Private Health Insurance Coverage by Age in Maxton
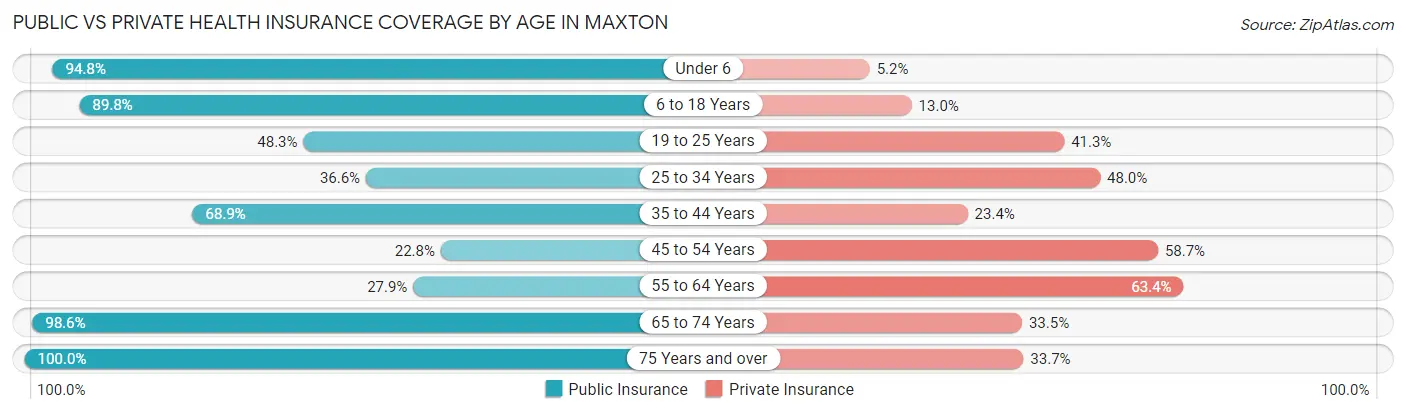
| Age Bracket | Public Insurance | Private Insurance |
| Under 6 | 256 (94.8%) | 14 (5.2%) |
| 6 to 18 Years | 450 (89.8%) | 65 (13.0%) |
| 19 to 25 Years | 83 (48.3%) | 71 (41.3%) |
| 25 to 34 Years | 107 (36.6%) | 140 (47.9%) |
| 35 to 44 Years | 168 (68.9%) | 57 (23.4%) |
| 45 to 54 Years | 38 (22.8%) | 98 (58.7%) |
| 55 to 64 Years | 80 (27.9%) | 182 (63.4%) |
| 65 to 74 Years | 274 (98.6%) | 93 (33.5%) |
| 75 Years and over | 89 (100.0%) | 30 (33.7%) |
| Total | 1,545 (67.2%) | 750 (32.6%) |
Disability Status by Sex by Age in Maxton
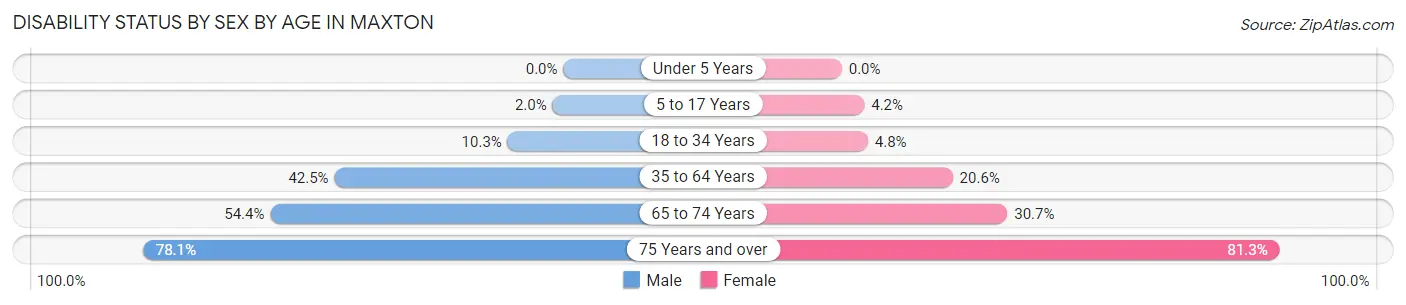
| Age Bracket | Male | Female |
| Under 5 Years | 0 (0.0%) | 0 (0.0%) |
| 5 to 17 Years | 5 (2.0%) | 12 (4.2%) |
| 18 to 34 Years | 21 (10.3%) | 14 (4.8%) |
| 35 to 64 Years | 150 (42.5%) | 71 (20.6%) |
| 65 to 74 Years | 68 (54.4%) | 47 (30.7%) |
| 75 Years and over | 32 (78.0%) | 39 (81.2%) |
Disability Class by Sex by Age in Maxton
Disability Class: Hearing Difficulty
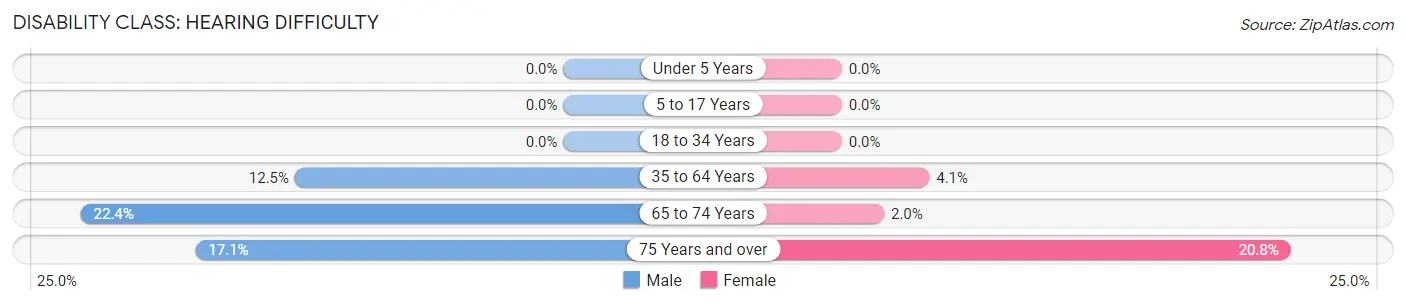
| Age Bracket | Male | Female |
| Under 5 Years | 0 (0.0%) | 0 (0.0%) |
| 5 to 17 Years | 0 (0.0%) | 0 (0.0%) |
| 18 to 34 Years | 0 (0.0%) | 0 (0.0%) |
| 35 to 64 Years | 44 (12.5%) | 14 (4.1%) |
| 65 to 74 Years | 28 (22.4%) | 3 (2.0%) |
| 75 Years and over | 7 (17.1%) | 10 (20.8%) |
Disability Class: Vision Difficulty
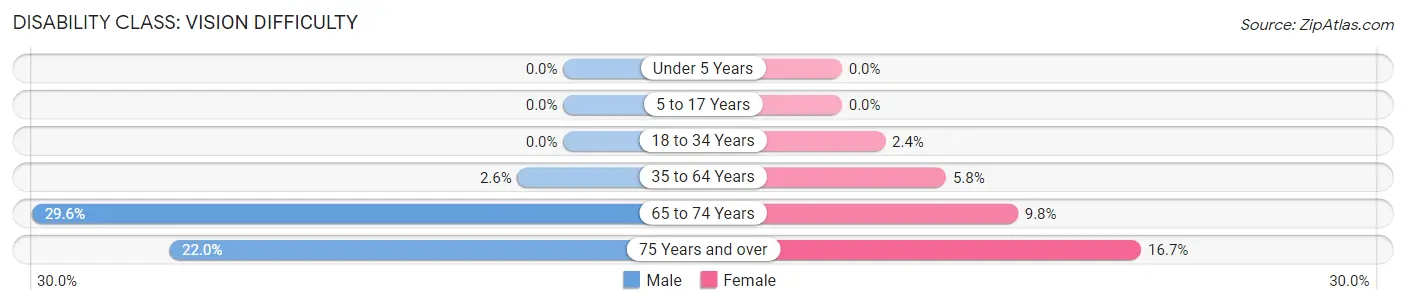
| Age Bracket | Male | Female |
| Under 5 Years | 0 (0.0%) | 0 (0.0%) |
| 5 to 17 Years | 0 (0.0%) | 0 (0.0%) |
| 18 to 34 Years | 0 (0.0%) | 7 (2.4%) |
| 35 to 64 Years | 9 (2.5%) | 20 (5.8%) |
| 65 to 74 Years | 37 (29.6%) | 15 (9.8%) |
| 75 Years and over | 9 (22.0%) | 8 (16.7%) |
Disability Class: Cognitive Difficulty
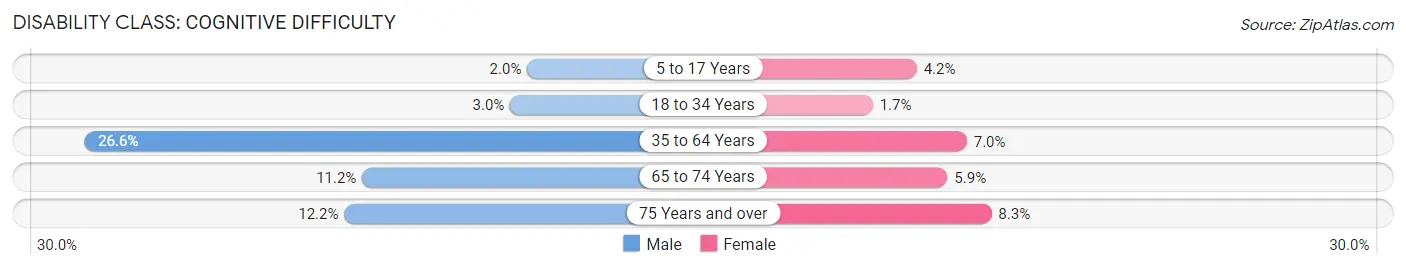
| Age Bracket | Male | Female |
| 5 to 17 Years | 5 (2.0%) | 12 (4.2%) |
| 18 to 34 Years | 6 (3.0%) | 5 (1.7%) |
| 35 to 64 Years | 94 (26.6%) | 24 (7.0%) |
| 65 to 74 Years | 14 (11.2%) | 9 (5.9%) |
| 75 Years and over | 5 (12.2%) | 4 (8.3%) |
Disability Class: Ambulatory Difficulty
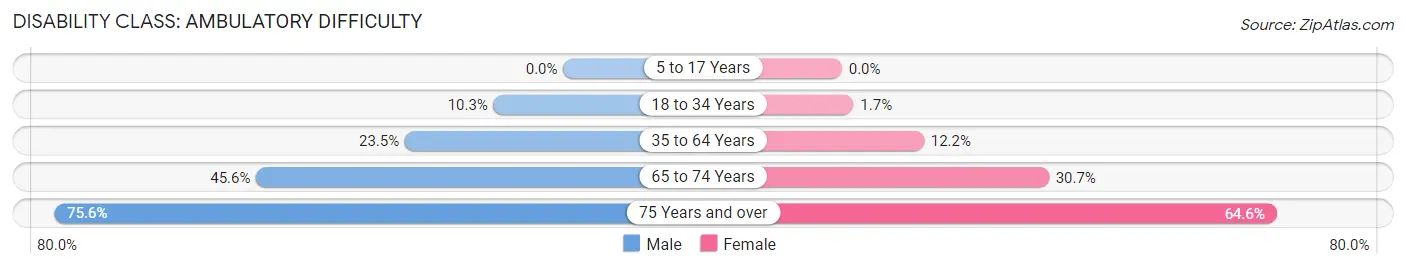
| Age Bracket | Male | Female |
| 5 to 17 Years | 0 (0.0%) | 0 (0.0%) |
| 18 to 34 Years | 21 (10.3%) | 5 (1.7%) |
| 35 to 64 Years | 83 (23.5%) | 42 (12.2%) |
| 65 to 74 Years | 57 (45.6%) | 47 (30.7%) |
| 75 Years and over | 31 (75.6%) | 31 (64.6%) |
Disability Class: Self-Care Difficulty
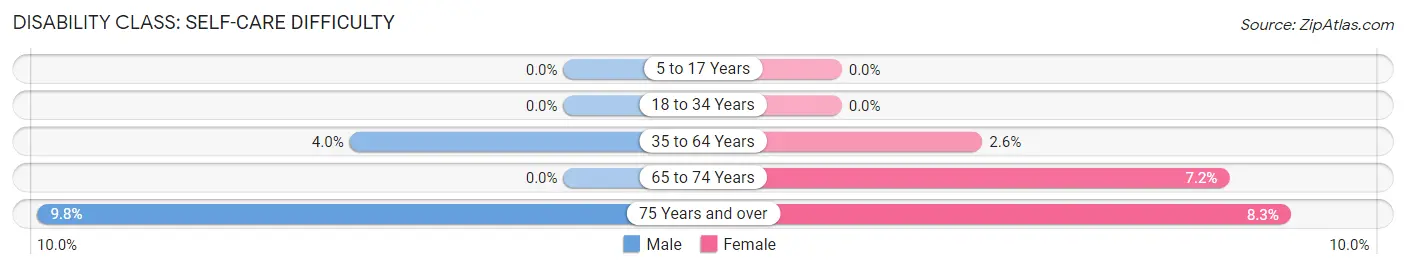
| Age Bracket | Male | Female |
| 5 to 17 Years | 0 (0.0%) | 0 (0.0%) |
| 18 to 34 Years | 0 (0.0%) | 0 (0.0%) |
| 35 to 64 Years | 14 (4.0%) | 9 (2.6%) |
| 65 to 74 Years | 0 (0.0%) | 11 (7.2%) |
| 75 Years and over | 4 (9.8%) | 4 (8.3%) |
Technology Access in Maxton
Computing Device Access in Maxton
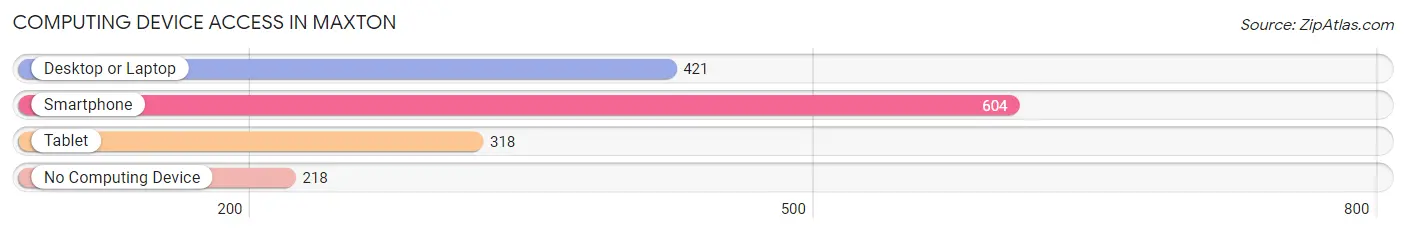
| Device Type | # Households | % Households |
| Desktop or Laptop | 421 | 46.5% |
| Smartphone | 604 | 66.7% |
| Tablet | 318 | 35.1% |
| No Computing Device | 218 | 24.1% |
| Total | 906 | 100.0% |
Internet Access in Maxton
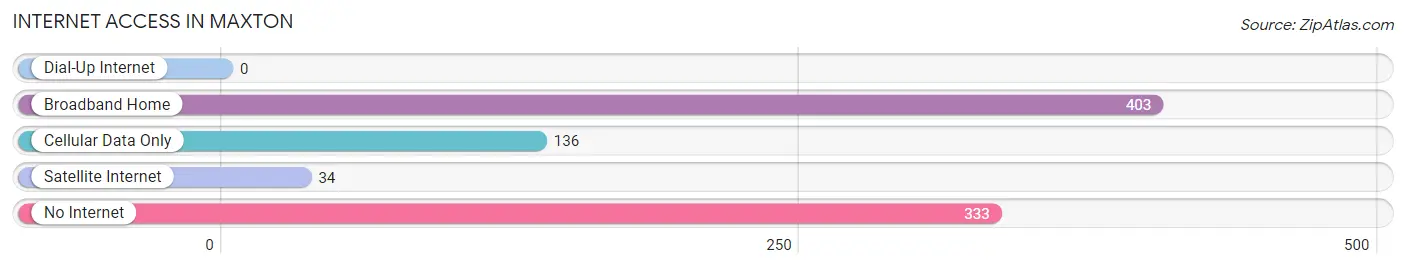
| Internet Type | # Households | % Households |
| Dial-Up Internet | 0 | 0.0% |
| Broadband Home | 403 | 44.5% |
| Cellular Data Only | 136 | 15.0% |
| Satellite Internet | 34 | 3.7% |
| No Internet | 333 | 36.7% |
| Total | 906 | 100.0% |
Maxton Summary
Maxton is a small town located in Robeson County, North Carolina. It is situated in the southeastern corner of the state, near the South Carolina border. The town has a population of approximately 2,500 people and is part of the larger Lumberton metropolitan area.
Geography
Maxton is located in the southeastern corner of Robeson County, North Carolina. It is situated at the intersection of US Highway 74 and NC Highway 71. The town is located approximately 30 miles east of Lumberton, the county seat, and about 60 miles south of Fayetteville. The town is situated in the Coastal Plain region of North Carolina, and is surrounded by a mix of farmland and forests. The town is located near the Lumber River, which flows through the area and provides recreational opportunities for residents.
Climate
Maxton has a humid subtropical climate, with hot, humid summers and mild winters. The average annual temperature is around 70 degrees Fahrenheit, with temperatures reaching the mid-90s during the summer months and dipping into the low-30s during the winter. The town receives an average of 48 inches of precipitation per year, with most of it falling during the summer months.
Demographics
As of the 2010 census, Maxton had a population of 2,521 people. The racial makeup of the town was 57.3% White, 37.2% African American, 0.3% Native American, 0.7% Asian, 0.1% Pacific Islander, and 4.4% from other races. The median household income was $25,938, and the median family income was $31,944. The per capita income was $14,845.
Economy
Maxton’s economy is largely based on agriculture and manufacturing. The town is home to several poultry processing plants, as well as a number of small businesses. The town is also home to a number of retail stores, including a Walmart Supercenter. The town is also home to a number of churches, which provide employment opportunities for local residents.
History
Maxton was founded in 1887 by a group of settlers from Scotland. The town was named after a Scottish town, and the settlers brought with them many of the traditions and customs of their homeland. The town grew slowly, but steadily, and by the early 20th century, it had become a thriving agricultural center. The town was also home to a number of small businesses, including a cotton mill and a furniture factory.
In the mid-20th century, Maxton began to experience a decline in population as many of its residents moved away in search of better economic opportunities. The town’s population has remained relatively stable since then, and it continues to be a small, rural community.
Conclusion
Maxton is a small town located in Robeson County, North Carolina. It is situated in the southeastern corner of the state, near the South Carolina border. The town has a population of approximately 2,500 people and is part of the larger Lumberton metropolitan area. Maxton has a humid subtropical climate, with hot, humid summers and mild winters. The town’s economy is largely based on agriculture and manufacturing, and it is home to several poultry processing plants, as well as a number of small businesses. Maxton was founded in 1887 by a group of settlers from Scotland, and it has remained a small, rural community since then.
Common Questions
What is Per Capita Income in Maxton?
Per Capita income in Maxton is $15,783.
What is the Median Family Income in Maxton?
Median Family Income in Maxton is $45,078.
What is the Median Household income in Maxton?
Median Household Income in Maxton is $23,106.
What is Income or Wage Gap in Maxton?
Income or Wage Gap in Maxton is 27.5%.
Women in Maxton earn 72.5 cents for every dollar earned by a man.
What is Family Income Deficit in Maxton?
Family Income Deficit in Maxton is $15,686.
Families that are below poverty line in Maxton earn $15,686 less on average than the poverty threshold level.
What is Inequality or Gini Index in Maxton?
Inequality or Gini Index in Maxton is 0.51.
What is the Total Population of Maxton?
Total Population of Maxton is 2,300.
What is the Total Male Population of Maxton?
Total Male Population of Maxton is 1,077.
What is the Total Female Population of Maxton?
Total Female Population of Maxton is 1,223.
What is the Ratio of Males per 100 Females in Maxton?
There are 88.06 Males per 100 Females in Maxton.
What is the Ratio of Females per 100 Males in Maxton?
There are 113.56 Females per 100 Males in Maxton.
What is the Median Population Age in Maxton?
Median Population Age in Maxton is 33.2 Years.
What is the Average Family Size in Maxton
Average Family Size in Maxton is 3.5 People.
What is the Average Household Size in Maxton
Average Household Size in Maxton is 2.5 People.
How Large is the Labor Force in Maxton?
There are 765 People in the Labor Forcein in Maxton.
What is the Percentage of People in the Labor Force in Maxton?
47.1% of People are in the Labor Force in Maxton.
What is the Unemployment Rate in Maxton?
Unemployment Rate in Maxton is 15.3%.