Marshallberg, NC Map & Demographics
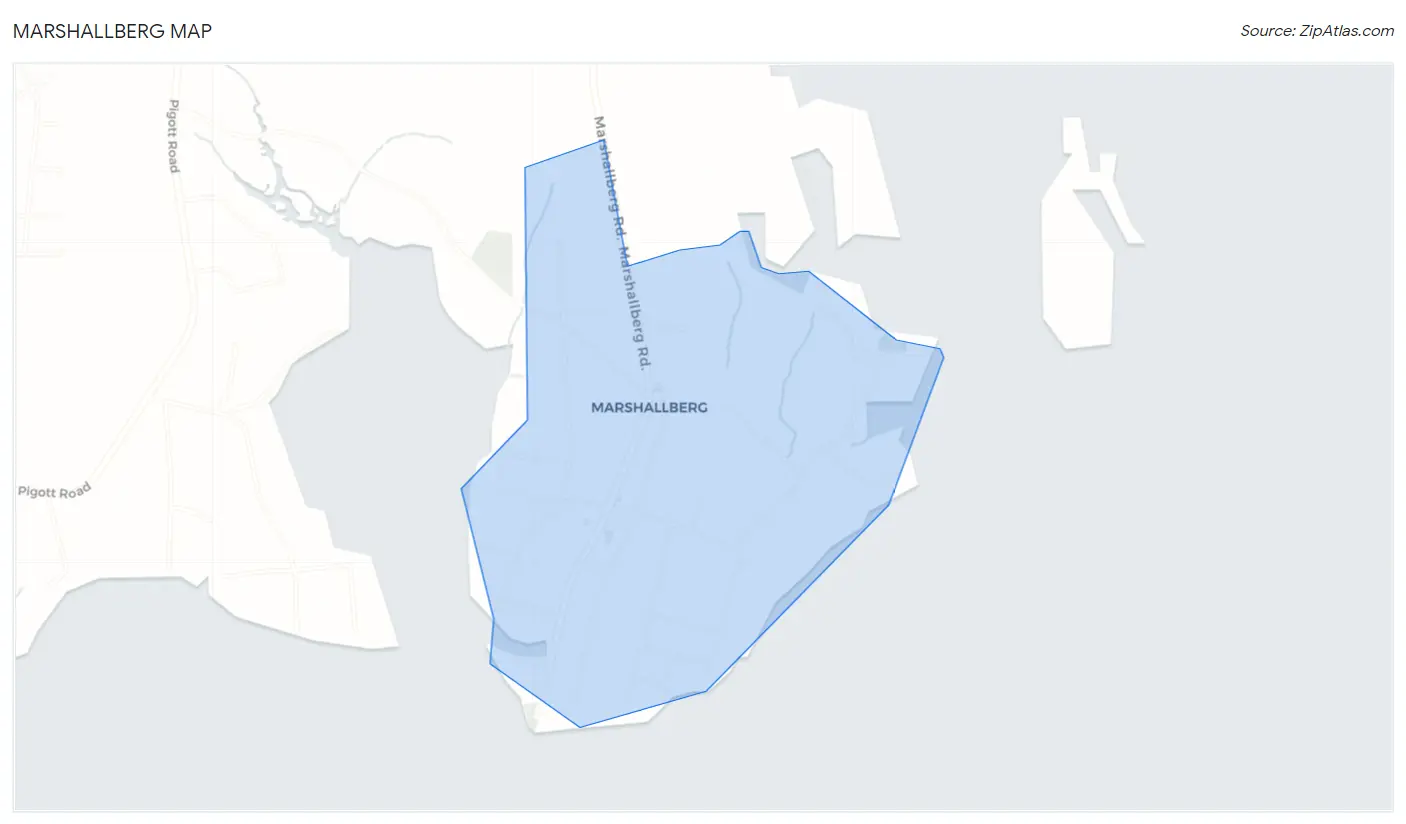
Marshallberg Map
Marshallberg Overview
$47,036
PER CAPITA INCOME
$125,089
AVG FAMILY INCOME
$83,221
AVG HOUSEHOLD INCOME
0.46
INEQUALITY / GINI INDEX
430
TOTAL POPULATION
209
MALE POPULATION
221
FEMALE POPULATION
94.57
MALES / 100 FEMALES
105.74
FEMALES / 100 MALES
56.0
MEDIAN AGE
2.2
AVG FAMILY SIZE
2.2
AVG HOUSEHOLD SIZE
273
LABOR FORCE [ PEOPLE ]
68.1%
PERCENT IN LABOR FORCE
3.7%
UNEMPLOYMENT RATE
Marshallberg Zip Codes
Marshallberg Area Codes
Income in Marshallberg
Income Overview in Marshallberg
Per Capita Income in Marshallberg is $47,036, while median incomes of families and households are $125,089 and $83,221 respectively.
| Characteristic | Number | Measure |
| Per Capita Income | 430 | $47,036 |
| Median Family Income | 137 | $125,089 |
| Mean Family Income | 137 | $128,842 |
| Median Household Income | 191 | $83,221 |
| Mean Household Income | 191 | $103,439 |
| Income Deficit | 137 | $0 |
| Wage / Income Gap (%) | 430 | 0.00% |
| Wage / Income Gap ($) | 430 | 100.00¢ per $1 |
| Gini / Inequality Index | 430 | 0.46 |
Earnings by Sex in Marshallberg
| Sex | Number | Average Earnings |
| Male | 173 (61.1%) | $0 |
| Female | 110 (38.9%) | $0 |
| Total | 283 (100.0%) | $0 |
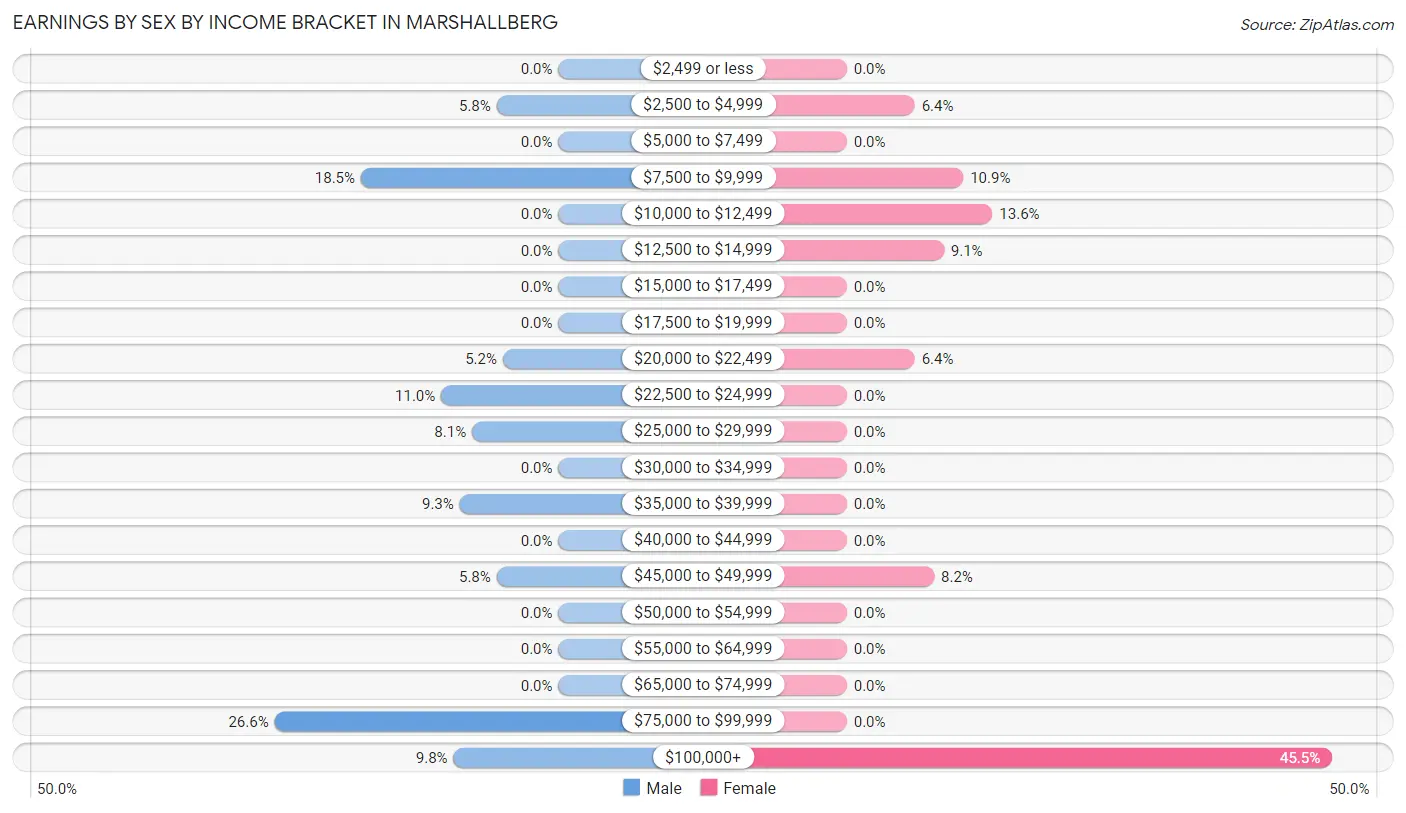
Earnings by Sex by Income Bracket in Marshallberg
The most common earnings brackets in Marshallberg are $75,000 to $99,999 for men (46 | 26.6%) and $100,000+ for women (50 | 45.5%).
| Income | Male | Female |
| $2,499 or less | 0 (0.0%) | 0 (0.0%) |
| $2,500 to $4,999 | 10 (5.8%) | 7 (6.4%) |
| $5,000 to $7,499 | 0 (0.0%) | 0 (0.0%) |
| $7,500 to $9,999 | 32 (18.5%) | 12 (10.9%) |
| $10,000 to $12,499 | 0 (0.0%) | 15 (13.6%) |
| $12,500 to $14,999 | 0 (0.0%) | 10 (9.1%) |
| $15,000 to $17,499 | 0 (0.0%) | 0 (0.0%) |
| $17,500 to $19,999 | 0 (0.0%) | 0 (0.0%) |
| $20,000 to $22,499 | 9 (5.2%) | 7 (6.4%) |
| $22,500 to $24,999 | 19 (11.0%) | 0 (0.0%) |
| $25,000 to $29,999 | 14 (8.1%) | 0 (0.0%) |
| $30,000 to $34,999 | 0 (0.0%) | 0 (0.0%) |
| $35,000 to $39,999 | 16 (9.2%) | 0 (0.0%) |
| $40,000 to $44,999 | 0 (0.0%) | 0 (0.0%) |
| $45,000 to $49,999 | 10 (5.8%) | 9 (8.2%) |
| $50,000 to $54,999 | 0 (0.0%) | 0 (0.0%) |
| $55,000 to $64,999 | 0 (0.0%) | 0 (0.0%) |
| $65,000 to $74,999 | 0 (0.0%) | 0 (0.0%) |
| $75,000 to $99,999 | 46 (26.6%) | 0 (0.0%) |
| $100,000+ | 17 (9.8%) | 50 (45.5%) |
| Total | 173 (100.0%) | 110 (100.0%) |
Earnings by Sex by Educational Attainment in Marshallberg
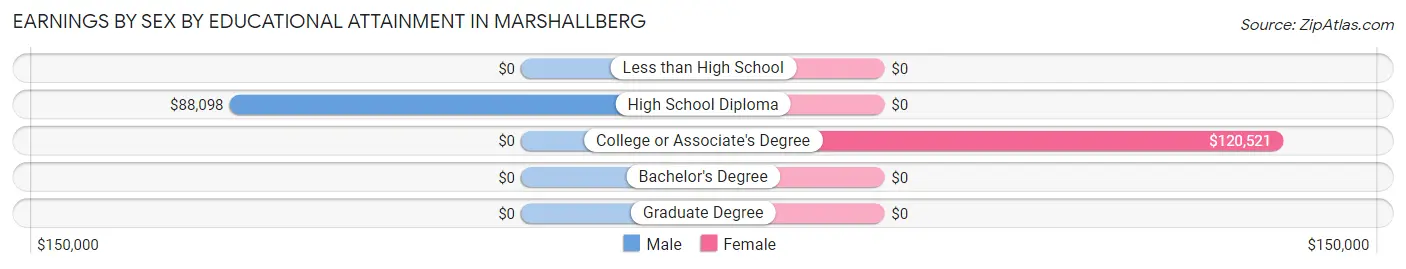
| Educational Attainment | Male Income | Female Income |
| Less than High School | - | - |
| High School Diploma | $88,098 | $0 |
| College or Associate's Degree | - | - |
| Bachelor's Degree | - | - |
| Graduate Degree | - | - |
| Total | - | - |
Family Income in Marshallberg
Family Income Brackets in Marshallberg
According to the Marshallberg family income data, there are 43 families falling into the $200,000+ income range, which is the most common income bracket and makes up 31.4% of all families.
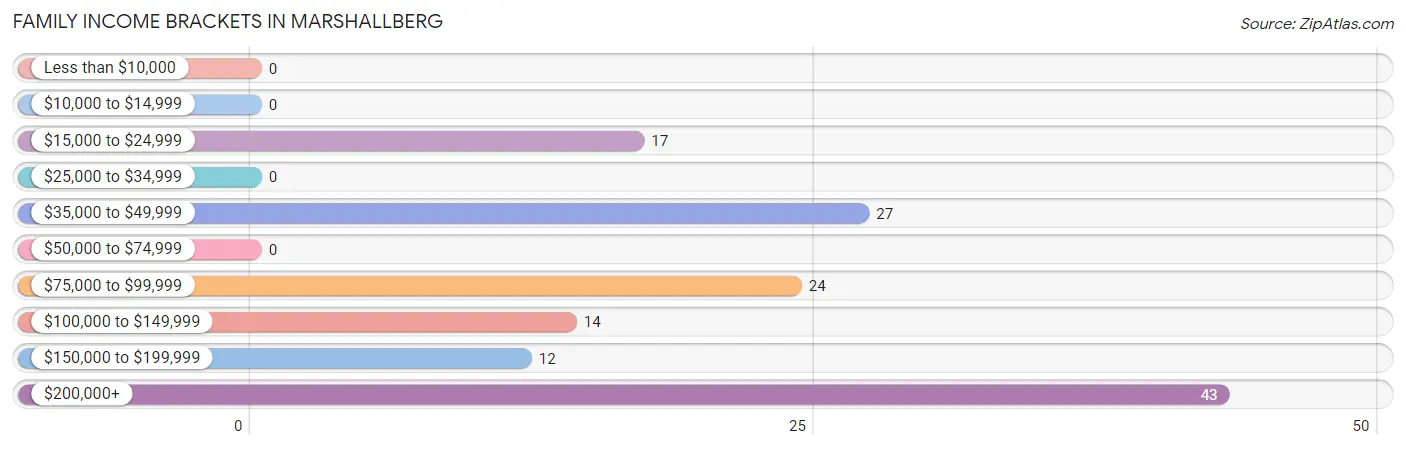
| Income Bracket | # Families | % Families |
| Less than $10,000 | 0 | 0.0% |
| $10,000 to $14,999 | 0 | 0.0% |
| $15,000 to $24,999 | 17 | 12.4% |
| $25,000 to $34,999 | 0 | 0.0% |
| $35,000 to $49,999 | 27 | 19.7% |
| $50,000 to $74,999 | 0 | 0.0% |
| $75,000 to $99,999 | 24 | 17.5% |
| $100,000 to $149,999 | 14 | 10.2% |
| $150,000 to $199,999 | 12 | 8.8% |
| $200,000+ | 43 | 31.4% |
Family Income by Famaliy Size in Marshallberg
2-person families (109 | 79.6%) account for the highest median family income in Marshallberg with $167,604 per family, while 2-person families (109 | 79.6%) have the highest median income of $83,802 per family member.
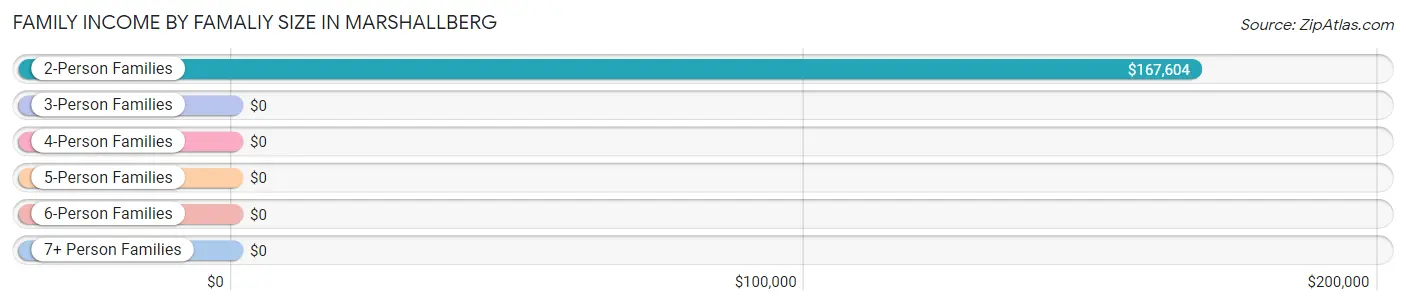
| Income Bracket | # Families | Median Income |
| 2-Person Families | 109 (79.6%) | $167,604 |
| 3-Person Families | 28 (20.4%) | $0 |
| 4-Person Families | 0 (0.0%) | $0 |
| 5-Person Families | 0 (0.0%) | $0 |
| 6-Person Families | 0 (0.0%) | $0 |
| 7+ Person Families | 0 (0.0%) | $0 |
| Total | 137 (100.0%) | $125,089 |
Family Income by Number of Earners in Marshallberg
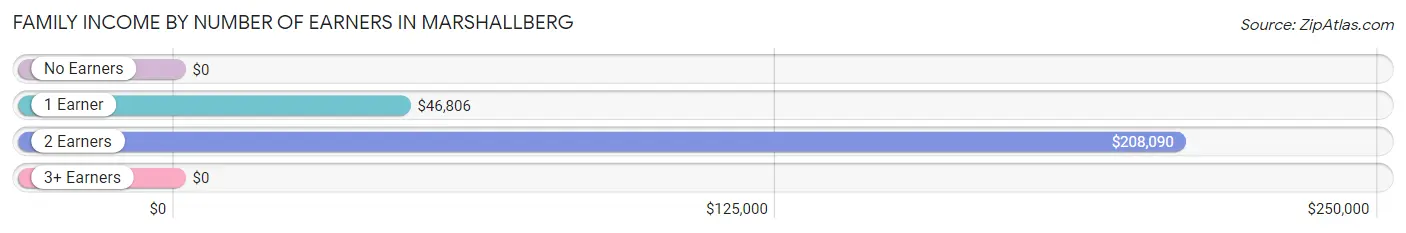
| Number of Earners | # Families | Median Income |
| No Earners | 8 (5.8%) | $0 |
| 1 Earner | 60 (43.8%) | $46,806 |
| 2 Earners | 69 (50.4%) | $208,090 |
| 3+ Earners | 0 (0.0%) | $0 |
| Total | 137 (100.0%) | $125,089 |
Household Income in Marshallberg
Household Income Brackets in Marshallberg
With 44 households falling in the category, the $35,000 to $49,999 income range is the most frequent in Marshallberg, accounting for 23.0% of all households.
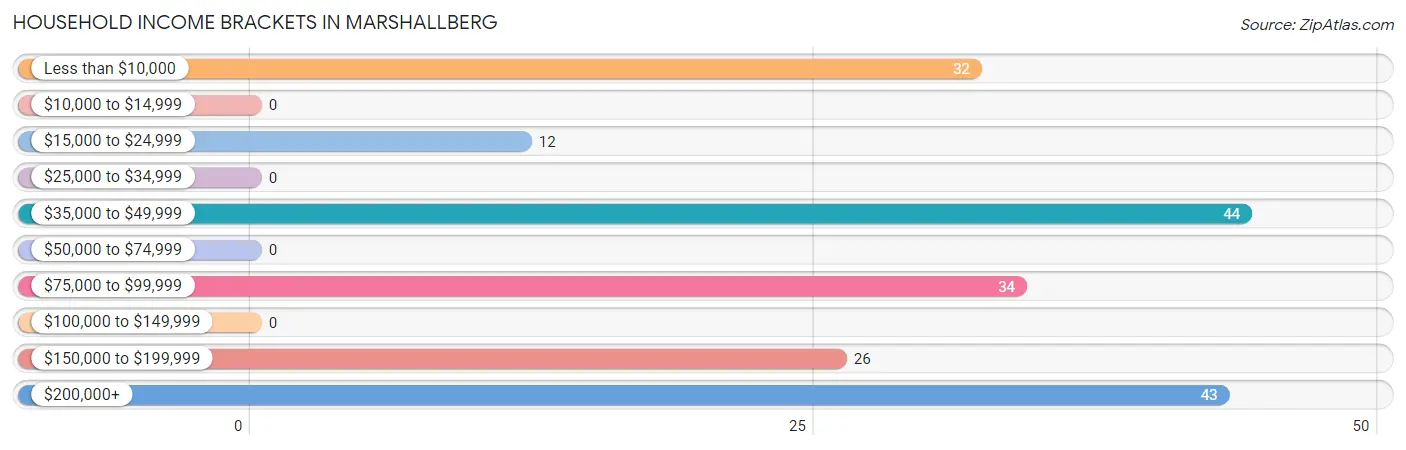
| Income Bracket | # Households | % Households |
| Less than $10,000 | 32 | 16.8% |
| $10,000 to $14,999 | 0 | 0.0% |
| $15,000 to $24,999 | 12 | 6.3% |
| $25,000 to $34,999 | 0 | 0.0% |
| $35,000 to $49,999 | 44 | 23.0% |
| $50,000 to $74,999 | 0 | 0.0% |
| $75,000 to $99,999 | 34 | 17.8% |
| $100,000 to $149,999 | 0 | 0.0% |
| $150,000 to $199,999 | 26 | 13.6% |
| $200,000+ | 43 | 22.5% |
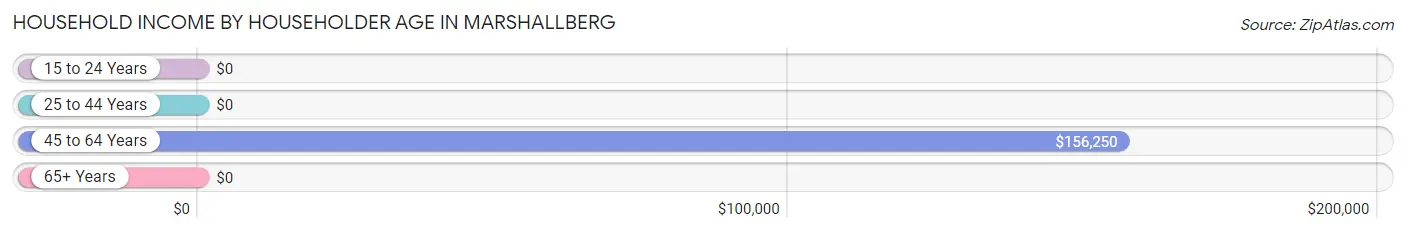
Household Income by Householder Age in Marshallberg
The median household income in Marshallberg is $83,221, with the highest median household income of $156,250 found in the 45 to 64 years age bracket for the primary householder. A total of 110 households (57.6%) fall into this category.
| Income Bracket | # Households | Median Income |
| 15 to 24 Years | 0 (0.0%) | $0 |
| 25 to 44 Years | 26 (13.6%) | $0 |
| 45 to 64 Years | 110 (57.6%) | $156,250 |
| 65+ Years | 55 (28.8%) | $0 |
| Total | 191 (100.0%) | $83,221 |
Poverty in Marshallberg
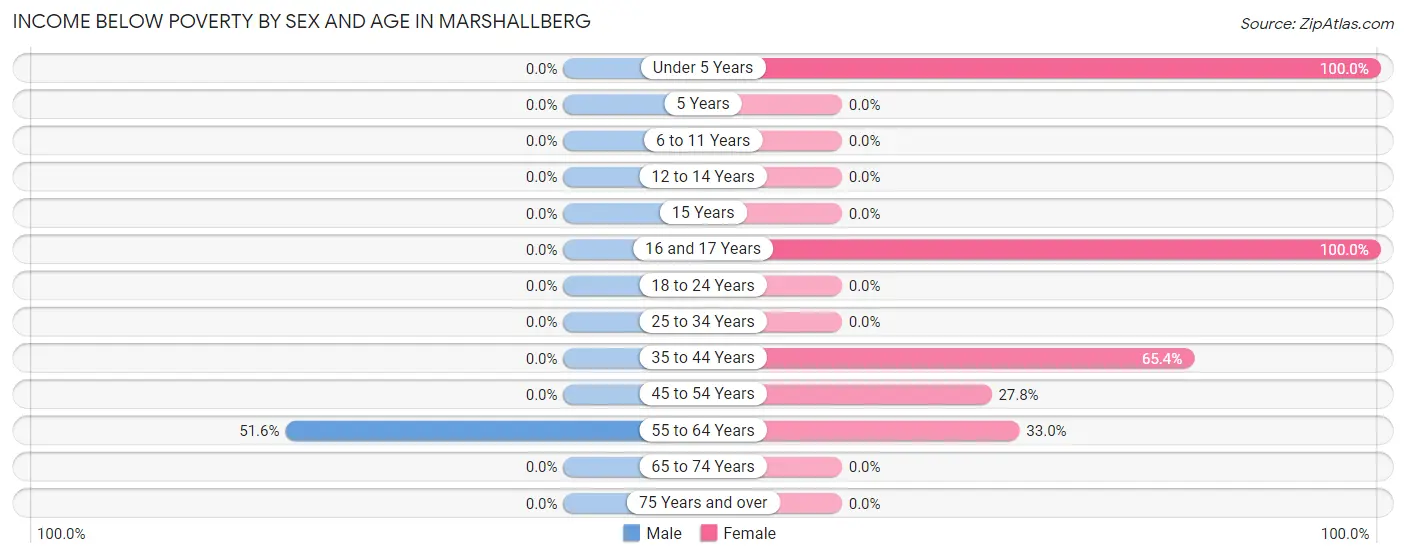
Income Below Poverty by Sex and Age in Marshallberg
With 15.3% poverty level for males and 41.6% for females among the residents of Marshallberg, 55 to 64 year old males and under 5 year old females are the most vulnerable to poverty, with 32 males (51.6%) and 20 females (100.0%) in their respective age groups living below the poverty level.
| Age Bracket | Male | Female |
| Under 5 Years | 0 (0.0%) | 20 (100.0%) |
| 5 Years | 0 (0.0%) | 0 (0.0%) |
| 6 to 11 Years | 0 (0.0%) | 0 (0.0%) |
| 12 to 14 Years | 0 (0.0%) | 0 (0.0%) |
| 15 Years | 0 (0.0%) | 0 (0.0%) |
| 16 and 17 Years | 0 (0.0%) | 15 (100.0%) |
| 18 to 24 Years | 0 (0.0%) | 0 (0.0%) |
| 25 to 34 Years | 0 (0.0%) | 0 (0.0%) |
| 35 to 44 Years | 0 (0.0%) | 17 (65.4%) |
| 45 to 54 Years | 0 (0.0%) | 10 (27.8%) |
| 55 to 64 Years | 32 (51.6%) | 30 (33.0%) |
| 65 to 74 Years | 0 (0.0%) | 0 (0.0%) |
| 75 Years and over | 0 (0.0%) | 0 (0.0%) |
| Total | 32 (15.3%) | 92 (41.6%) |
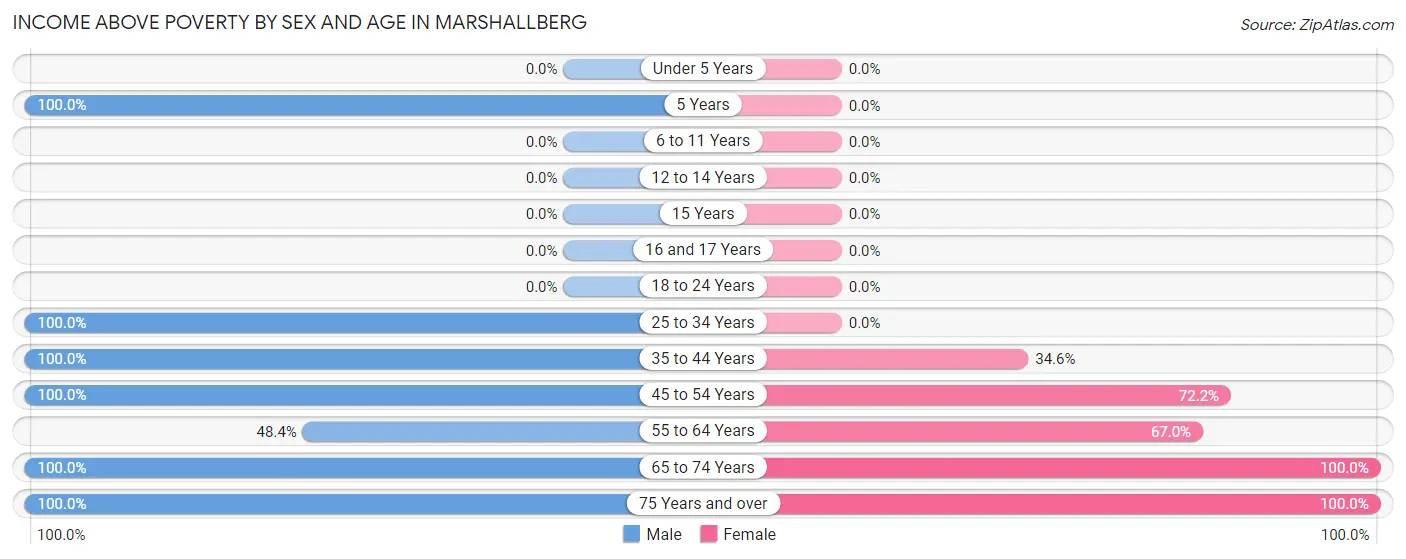
Income Above Poverty by Sex and Age in Marshallberg
According to the poverty statistics in Marshallberg, males aged 5 years and females aged 65 to 74 years are the age groups that are most secure financially, with 100.0% of males and 100.0% of females in these age groups living above the poverty line.
| Age Bracket | Male | Female |
| Under 5 Years | 0 (0.0%) | 0 (0.0%) |
| 5 Years | 9 (100.0%) | 0 (0.0%) |
| 6 to 11 Years | 0 (0.0%) | 0 (0.0%) |
| 12 to 14 Years | 0 (0.0%) | 0 (0.0%) |
| 15 Years | 0 (0.0%) | 0 (0.0%) |
| 16 and 17 Years | 0 (0.0%) | 0 (0.0%) |
| 18 to 24 Years | 0 (0.0%) | 0 (0.0%) |
| 25 to 34 Years | 55 (100.0%) | 0 (0.0%) |
| 35 to 44 Years | 29 (100.0%) | 9 (34.6%) |
| 45 to 54 Years | 10 (100.0%) | 26 (72.2%) |
| 55 to 64 Years | 30 (48.4%) | 61 (67.0%) |
| 65 to 74 Years | 17 (100.0%) | 7 (100.0%) |
| 75 Years and over | 27 (100.0%) | 26 (100.0%) |
| Total | 177 (84.7%) | 129 (58.4%) |
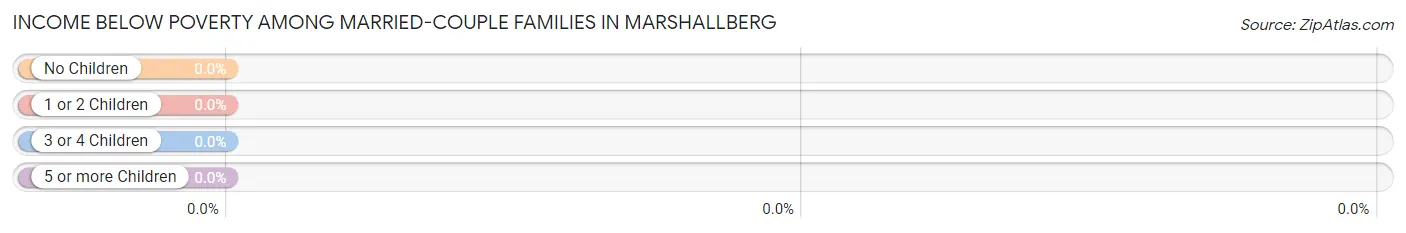
Income Below Poverty Among Married-Couple Families in Marshallberg
| Children | Above Poverty | Below Poverty |
| No Children | 50 (100.0%) | 0 (0.0%) |
| 1 or 2 Children | 0 (0.0%) | 0 (0.0%) |
| 3 or 4 Children | 0 (0.0%) | 0 (0.0%) |
| 5 or more Children | 0 (0.0%) | 0 (0.0%) |
| Total | 50 (100.0%) | 0 (0.0%) |
Income Below Poverty Among Single-Parent Households in Marshallberg
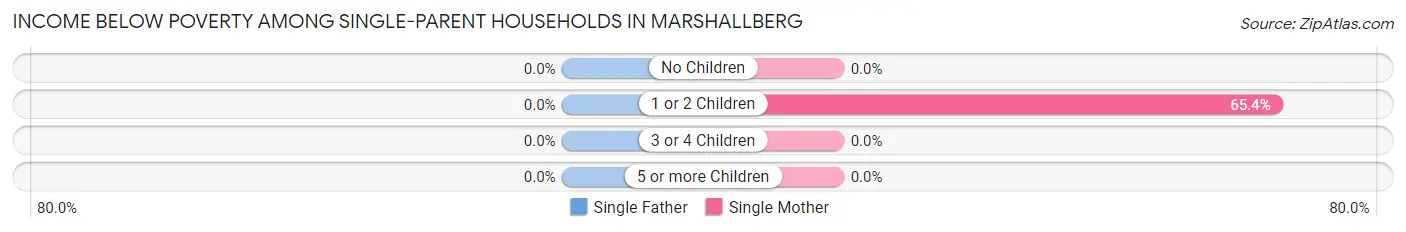
| Children | Single Father | Single Mother |
| No Children | 0 (0.0%) | 0 (0.0%) |
| 1 or 2 Children | 0 (0.0%) | 17 (65.4%) |
| 3 or 4 Children | 0 (0.0%) | 0 (0.0%) |
| 5 or more Children | 0 (0.0%) | 0 (0.0%) |
| Total | 0 (0.0%) | 17 (19.5%) |
Income Below Poverty Among Married-Couple vs Single-Parent Households in Marshallberg
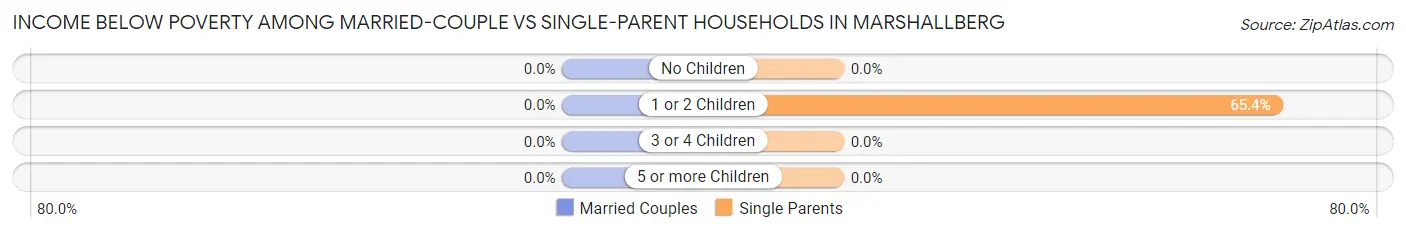
| Children | Married-Couple Families | Single-Parent Households |
| No Children | 0 (0.0%) | 0 (0.0%) |
| 1 or 2 Children | 0 (0.0%) | 17 (65.4%) |
| 3 or 4 Children | 0 (0.0%) | 0 (0.0%) |
| 5 or more Children | 0 (0.0%) | 0 (0.0%) |
| Total | 0 (0.0%) | 17 (19.5%) |
Race in Marshallberg
The most populous races in Marshallberg are , and White / Caucasian (430 | 100.0%).
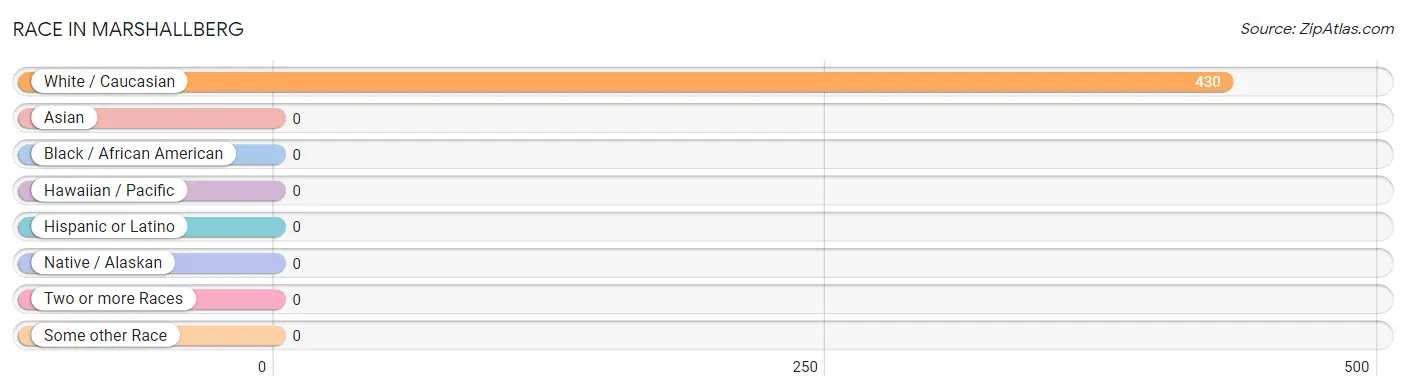
| Race | # Population | % Population |
| Asian | 0 | 0.0% |
| Black / African American | 0 | 0.0% |
| Hawaiian / Pacific | 0 | 0.0% |
| Hispanic or Latino | 0 | 0.0% |
| Native / Alaskan | 0 | 0.0% |
| White / Caucasian | 430 | 100.0% |
| Two or more Races | 0 | 0.0% |
| Some other Race | 0 | 0.0% |
| Total | 430 | 100.0% |
Ancestry in Marshallberg
The most populous ancestries reported in Marshallberg are German (90 | 20.9%), English (89 | 20.7%), Irish (80 | 18.6%), Polish (64 | 14.9%), and Italian (52 | 12.1%), together accounting for 87.2% of all Marshallberg residents.
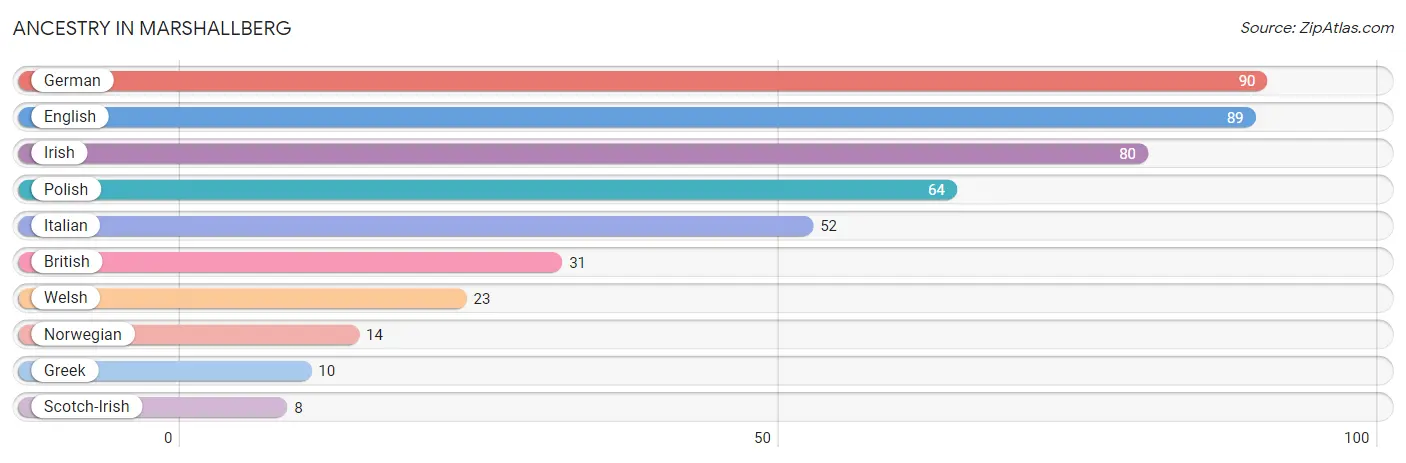
| Ancestry | # Population | % Population |
| British | 31 | 7.2% |
| English | 89 | 20.7% |
| German | 90 | 20.9% |
| Greek | 10 | 2.3% |
| Irish | 80 | 18.6% |
| Italian | 52 | 12.1% |
| Norwegian | 14 | 3.3% |
| Polish | 64 | 14.9% |
| Scotch-Irish | 8 | 1.9% |
| Welsh | 23 | 5.3% | View All 10 Rows |
Immigrants in Marshallberg

| Immigration Origin | # Population | % Population | View All 0 Rows |
Sex and Age in Marshallberg
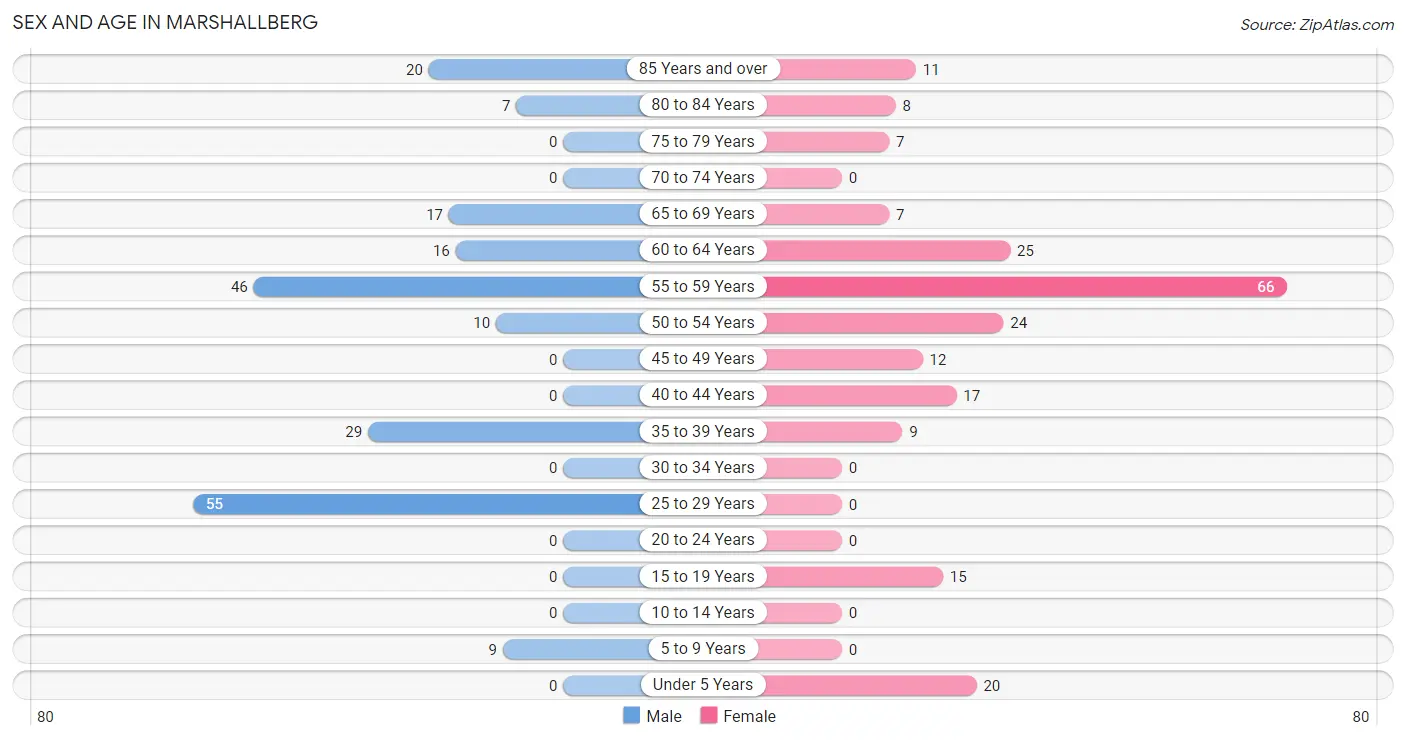
Sex and Age in Marshallberg
The most populous age groups in Marshallberg are 25 to 29 Years (55 | 26.3%) for men and 55 to 59 Years (66 | 29.9%) for women.
| Age Bracket | Male | Female |
| Under 5 Years | 0 (0.0%) | 20 (9.0%) |
| 5 to 9 Years | 9 (4.3%) | 0 (0.0%) |
| 10 to 14 Years | 0 (0.0%) | 0 (0.0%) |
| 15 to 19 Years | 0 (0.0%) | 15 (6.8%) |
| 20 to 24 Years | 0 (0.0%) | 0 (0.0%) |
| 25 to 29 Years | 55 (26.3%) | 0 (0.0%) |
| 30 to 34 Years | 0 (0.0%) | 0 (0.0%) |
| 35 to 39 Years | 29 (13.9%) | 9 (4.1%) |
| 40 to 44 Years | 0 (0.0%) | 17 (7.7%) |
| 45 to 49 Years | 0 (0.0%) | 12 (5.4%) |
| 50 to 54 Years | 10 (4.8%) | 24 (10.9%) |
| 55 to 59 Years | 46 (22.0%) | 66 (29.9%) |
| 60 to 64 Years | 16 (7.7%) | 25 (11.3%) |
| 65 to 69 Years | 17 (8.1%) | 7 (3.2%) |
| 70 to 74 Years | 0 (0.0%) | 0 (0.0%) |
| 75 to 79 Years | 0 (0.0%) | 7 (3.2%) |
| 80 to 84 Years | 7 (3.4%) | 8 (3.6%) |
| 85 Years and over | 20 (9.6%) | 11 (5.0%) |
| Total | 209 (100.0%) | 221 (100.0%) |
Families and Households in Marshallberg
Median Family Size in Marshallberg
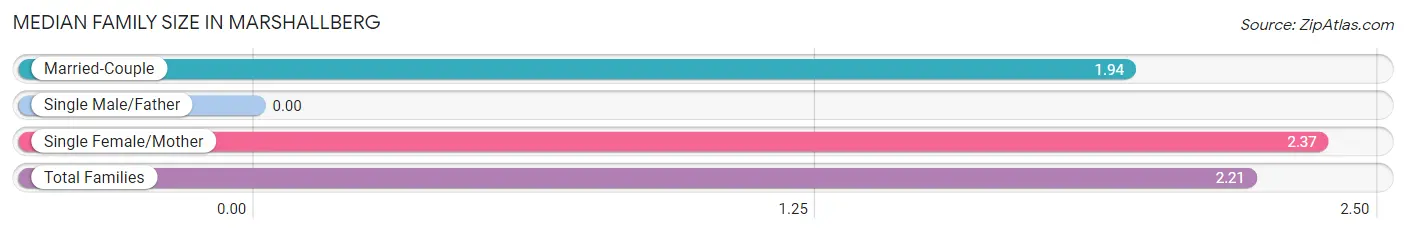
| Family Type | # Families | Family Size |
| Married-Couple | 50 (36.5%) | 1.94 |
| Single Male/Father | 0 (0.0%) | - |
| Single Female/Mother | 87 (63.5%) | 2.37 |
| Total Families | 137 (100.0%) | 2.21 |
Median Household Size in Marshallberg
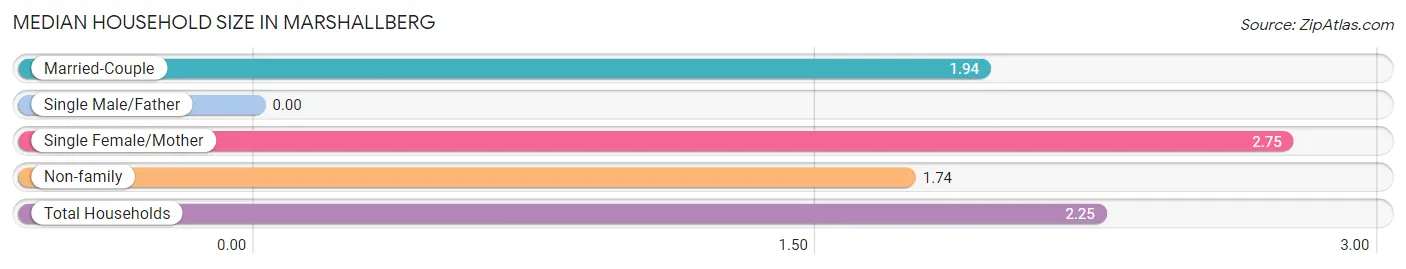
| Household Type | # Households | Household Size |
| Married-Couple | 50 (26.2%) | 1.94 |
| Single Male/Father | 0 (0.0%) | - |
| Single Female/Mother | 87 (45.6%) | 2.75 |
| Non-family | 54 (28.3%) | 1.74 |
| Total Households | 191 (100.0%) | 2.25 |
Household Size by Marriage Status in Marshallberg
Out of a total of 191 households in Marshallberg, 137 (71.7%) are family households, while 54 (28.3%) are nonfamily households. The most numerous type of family households are 2-person households, comprising 95, and the most common type of nonfamily households are 2-person households, comprising 42.
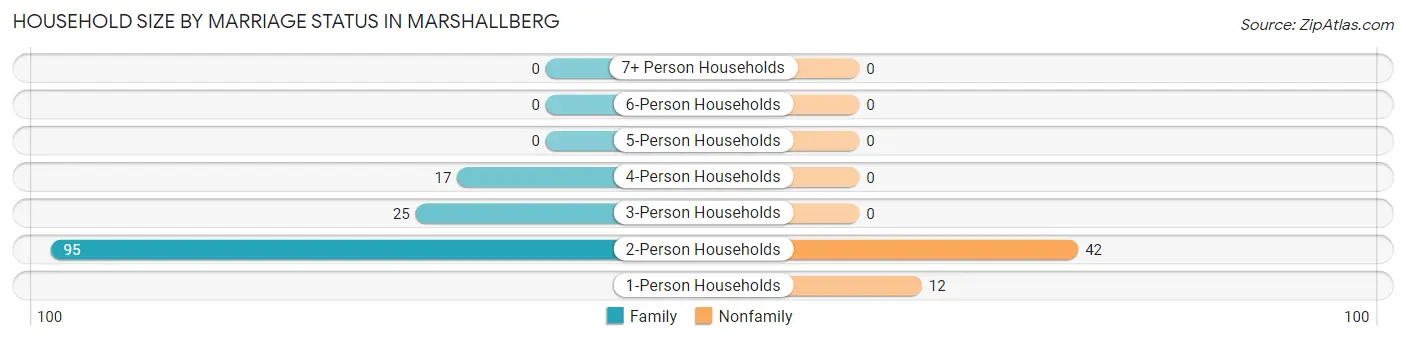
| Household Size | Family Households | Nonfamily Households |
| 1-Person Households | - | 12 (6.3%) |
| 2-Person Households | 95 (49.7%) | 42 (22.0%) |
| 3-Person Households | 25 (13.1%) | 0 (0.0%) |
| 4-Person Households | 17 (8.9%) | 0 (0.0%) |
| 5-Person Households | 0 (0.0%) | 0 (0.0%) |
| 6-Person Households | 0 (0.0%) | 0 (0.0%) |
| 7+ Person Households | 0 (0.0%) | 0 (0.0%) |
| Total | 137 (71.7%) | 54 (28.3%) |
Female Fertility in Marshallberg
Fertility by Age in Marshallberg
| Age Bracket | Women with Births | Births / 1,000 Women |
| 15 to 19 years | 0 (0.0%) | 0.0 |
| 20 to 34 years | 0 (0.0%) | 0.0 |
| 35 to 50 years | 0 (0.0%) | 0.0 |
| Total | 0 (0.0%) | 0.0 |
Fertility by Age by Marriage Status in Marshallberg
| Age Bracket | Married | Unmarried |
| 15 to 19 years | 0 (0.0%) | 0 (0.0%) |
| 20 to 34 years | 0 (0.0%) | 0 (0.0%) |
| 35 to 50 years | 0 (0.0%) | 0 (0.0%) |
| Total | 0 (0.0%) | 0 (0.0%) |
Fertility by Education in Marshallberg
| Educational Attainment | Women with Births | Births / 1,000 Women |
| Less than High School | 0 (0.0%) | 0.0 |
| High School Diploma | 0 (0.0%) | 0.0 |
| College or Associate's Degree | 0 (0.0%) | 0.0 |
| Bachelor's Degree | 0 (0.0%) | 0.0 |
| Graduate Degree | 0 (0.0%) | 0.0 |
| Total | 0 (0.0%) | 0.0 |
Fertility by Education by Marriage Status in Marshallberg
| Educational Attainment | Married | Unmarried |
| Less than High School | 0 (0.0%) | 0 (0.0%) |
| High School Diploma | 0 (0.0%) | 0 (0.0%) |
| College or Associate's Degree | 0 (0.0%) | 0 (0.0%) |
| Bachelor's Degree | 0 (0.0%) | 0 (0.0%) |
| Graduate Degree | 0 (0.0%) | 0 (0.0%) |
| Total | 0 (0.0%) | 0 (0.0%) |
Employment Characteristics in Marshallberg
Employment by Class of Employer in Marshallberg
Among the 256 employed individuals in Marshallberg, self-employed (not incorporated) (104 | 40.6%), private company employees (76 | 29.7%), and federal government employees (50 | 19.5%) make up the most common classes of employment.
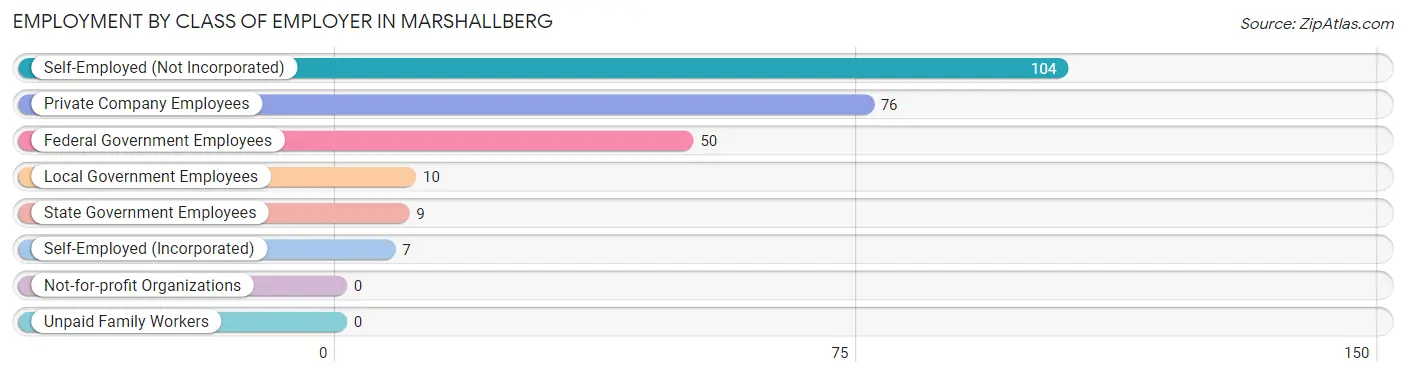
| Employer Class | # Employees | % Employees |
| Private Company Employees | 76 | 29.7% |
| Self-Employed (Incorporated) | 7 | 2.7% |
| Self-Employed (Not Incorporated) | 104 | 40.6% |
| Not-for-profit Organizations | 0 | 0.0% |
| Local Government Employees | 10 | 3.9% |
| State Government Employees | 9 | 3.5% |
| Federal Government Employees | 50 | 19.5% |
| Unpaid Family Workers | 0 | 0.0% |
| Total | 256 | 100.0% |
Employment Status by Age in Marshallberg
According to the labor force statistics for Marshallberg, out of the total population over 16 years of age (401), 68.1% or 273 individuals are in the labor force, with 3.7% or 10 of them unemployed. The age group with the highest labor force participation rate is 16 to 19 years, with 100.0% or 15 individuals in the labor force. Within the labor force, the 45 to 54 years age range has the highest percentage of unemployed individuals, with 27.8% or 10 of them being unemployed.
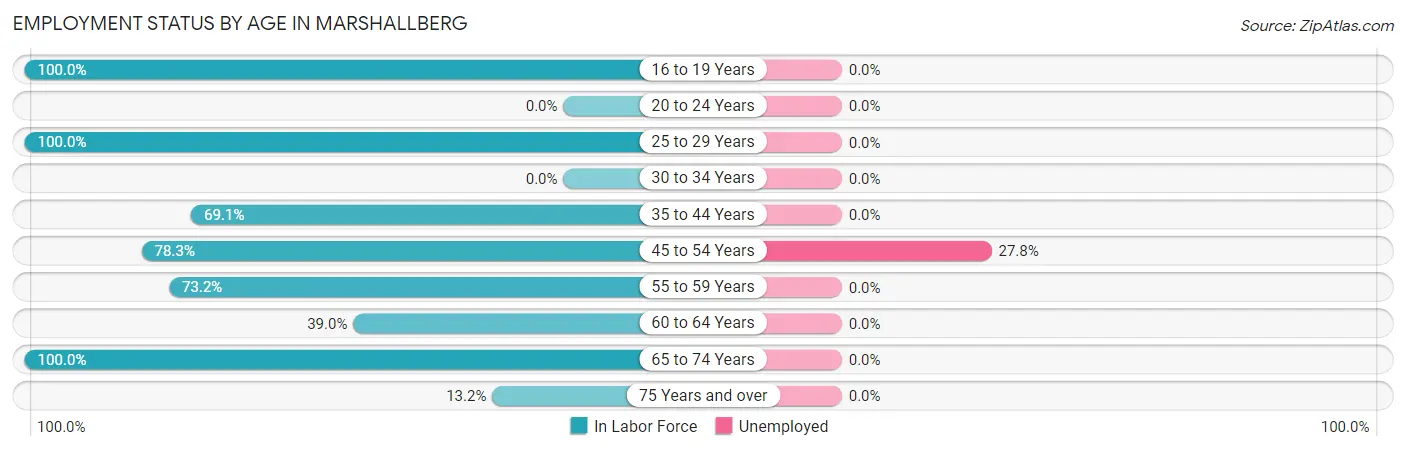
| Age Bracket | In Labor Force | Unemployed |
| 16 to 19 Years | 15 (100.0%) | 0 (0.0%) |
| 20 to 24 Years | 0 (0.0%) | 0 (0.0%) |
| 25 to 29 Years | 55 (100.0%) | 0 (0.0%) |
| 30 to 34 Years | 0 (0.0%) | 0 (0.0%) |
| 35 to 44 Years | 38 (69.1%) | 0 (0.0%) |
| 45 to 54 Years | 36 (78.3%) | 10 (27.8%) |
| 55 to 59 Years | 82 (73.2%) | 0 (0.0%) |
| 60 to 64 Years | 16 (39.0%) | 0 (0.0%) |
| 65 to 74 Years | 24 (100.0%) | 0 (0.0%) |
| 75 Years and over | 7 (13.2%) | 0 (0.0%) |
| Total | 273 (68.1%) | 10 (3.7%) |
Employment Status by Educational Attainment in Marshallberg
According to labor force statistics for Marshallberg, 73.5% of individuals (227) out of the total population between 25 and 64 years of age (309) are in the labor force, with 4.4% or 10 of them being unemployed. The group with the highest labor force participation rate are those with the educational attainment of college / associate degree, with 100.0% or 88 individuals in the labor force. Within the labor force, individuals with high school diploma education have the highest percentage of unemployment, with 14.3% or 10 of them being unemployed.
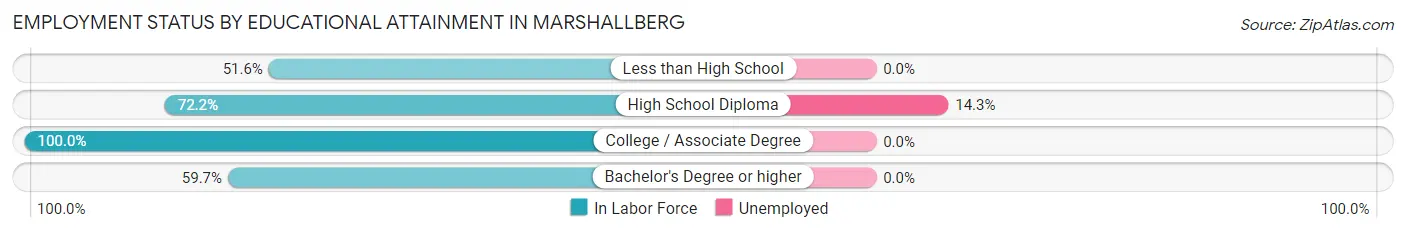
| Educational Attainment | In Labor Force | Unemployed |
| Less than High School | 32 (51.6%) | 0 (0.0%) |
| High School Diploma | 70 (72.2%) | 14 (14.3%) |
| College / Associate Degree | 88 (100.0%) | 0 (0.0%) |
| Bachelor's Degree or higher | 37 (59.7%) | 0 (0.0%) |
| Total | 227 (73.5%) | 14 (4.4%) |
Employment Occupations by Sex in Marshallberg
Management, Business, Science and Arts Occupations
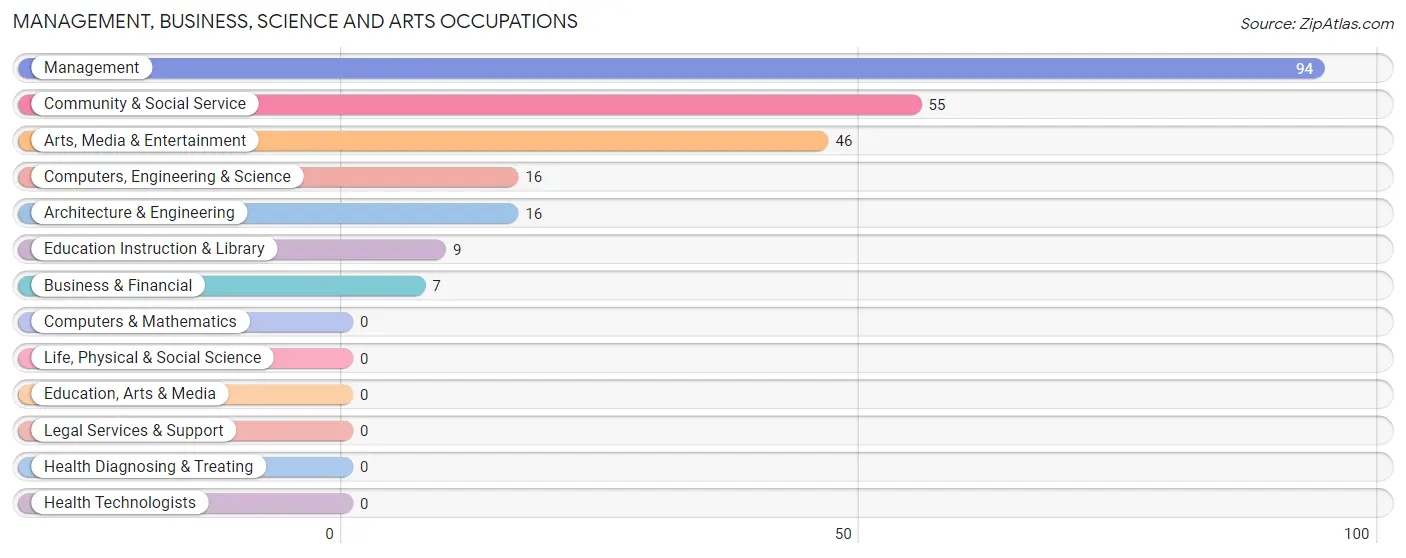
The most common Management, Business, Science and Arts occupations in Marshallberg are Management (94 | 35.7%), Community & Social Service (55 | 20.9%), Arts, Media & Entertainment (46 | 17.5%), Computers, Engineering & Science (16 | 6.1%), and Architecture & Engineering (16 | 6.1%).
Management, Business, Science and Arts Occupations by Sex
Within the Management, Business, Science and Arts occupations in Marshallberg, the most male-oriented occupations are Business & Financial (100.0%), Computers, Engineering & Science (100.0%), and Architecture & Engineering (100.0%), while the most female-oriented occupations are Education Instruction & Library (100.0%), Management (66.0%), and Community & Social Service (16.4%).
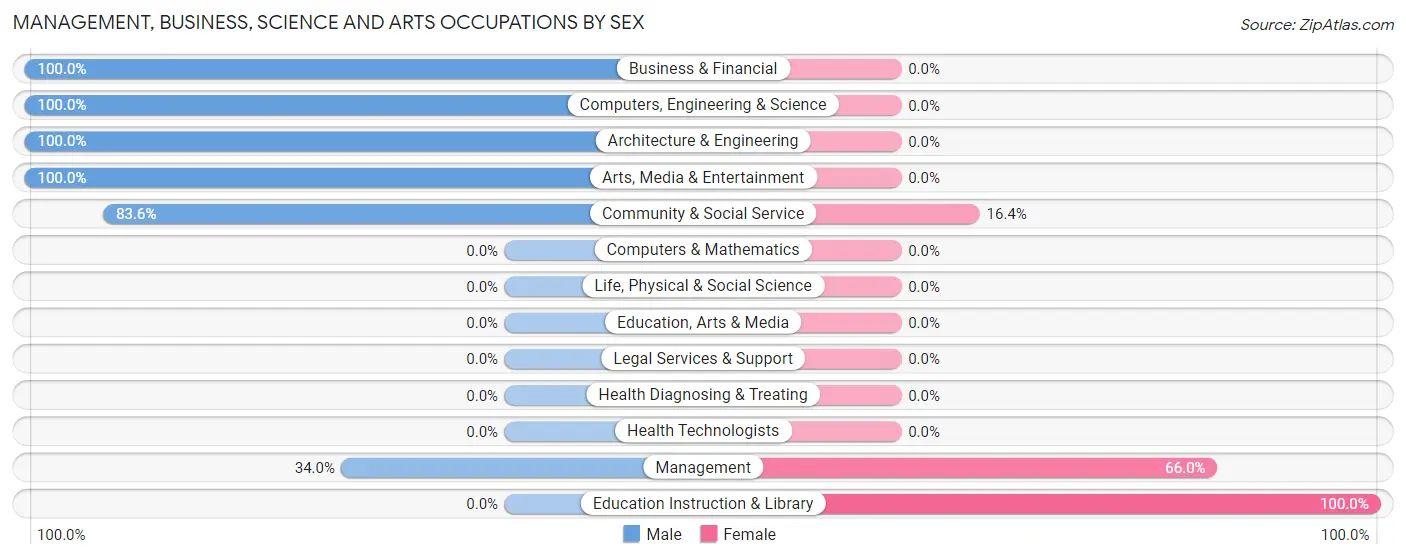
| Occupation | Male | Female |
| Management | 32 (34.0%) | 62 (66.0%) |
| Business & Financial | 7 (100.0%) | 0 (0.0%) |
| Computers, Engineering & Science | 16 (100.0%) | 0 (0.0%) |
| Computers & Mathematics | 0 (0.0%) | 0 (0.0%) |
| Architecture & Engineering | 16 (100.0%) | 0 (0.0%) |
| Life, Physical & Social Science | 0 (0.0%) | 0 (0.0%) |
| Community & Social Service | 46 (83.6%) | 9 (16.4%) |
| Education, Arts & Media | 0 (0.0%) | 0 (0.0%) |
| Legal Services & Support | 0 (0.0%) | 0 (0.0%) |
| Education Instruction & Library | 0 (0.0%) | 9 (100.0%) |
| Arts, Media & Entertainment | 46 (100.0%) | 0 (0.0%) |
| Health Diagnosing & Treating | 0 (0.0%) | 0 (0.0%) |
| Health Technologists | 0 (0.0%) | 0 (0.0%) |
| Total (Category) | 101 (58.7%) | 71 (41.3%) |
| Total (Overall) | 163 (62.0%) | 100 (38.0%) |
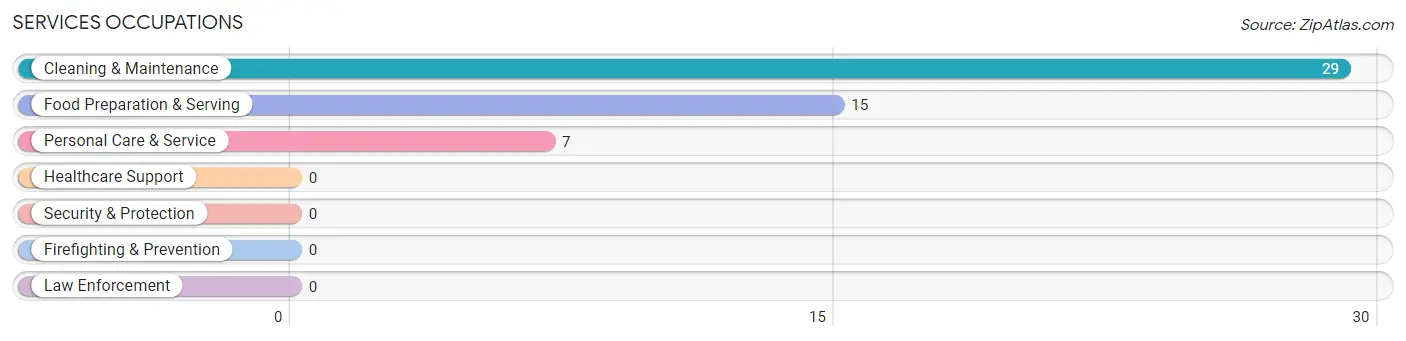
Services Occupations
The most common Services occupations in Marshallberg are Cleaning & Maintenance (29 | 11.0%), Food Preparation & Serving (15 | 5.7%), and Personal Care & Service (7 | 2.7%).
Services Occupations by Sex
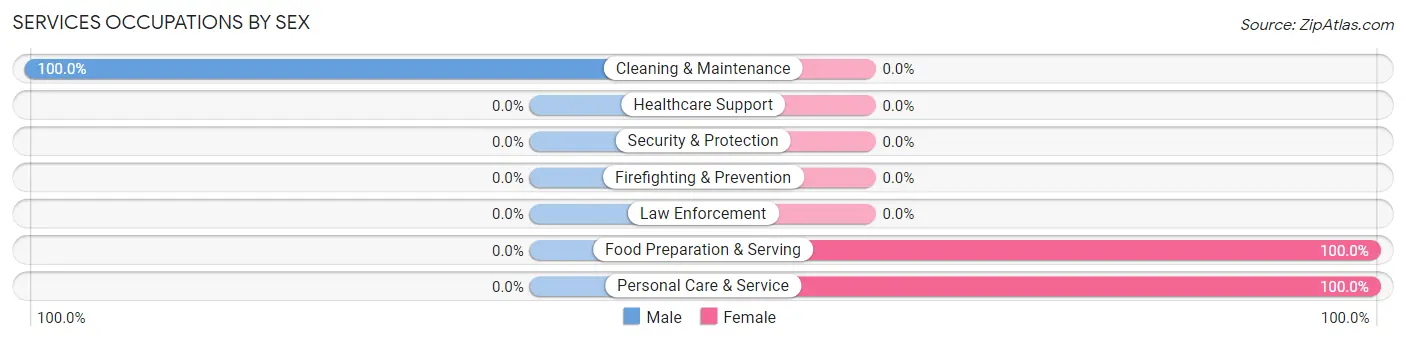
| Occupation | Male | Female |
| Healthcare Support | 0 (0.0%) | 0 (0.0%) |
| Security & Protection | 0 (0.0%) | 0 (0.0%) |
| Firefighting & Prevention | 0 (0.0%) | 0 (0.0%) |
| Law Enforcement | 0 (0.0%) | 0 (0.0%) |
| Food Preparation & Serving | 0 (0.0%) | 15 (100.0%) |
| Cleaning & Maintenance | 29 (100.0%) | 0 (0.0%) |
| Personal Care & Service | 0 (0.0%) | 7 (100.0%) |
| Total (Category) | 29 (56.9%) | 22 (43.1%) |
| Total (Overall) | 163 (62.0%) | 100 (38.0%) |
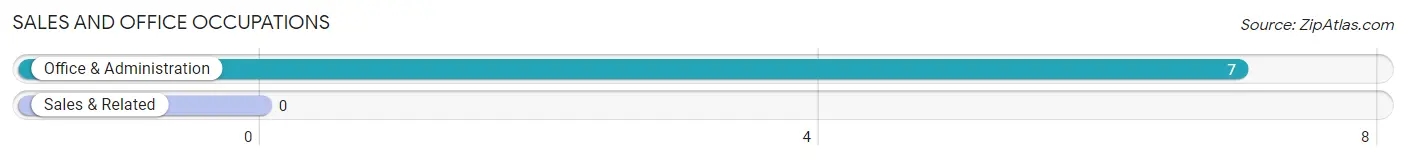
Sales and Office Occupations
The most common Sales and Office occupations in Marshallberg are , and Office & Administration (7 | 2.7%).
Sales and Office Occupations by Sex
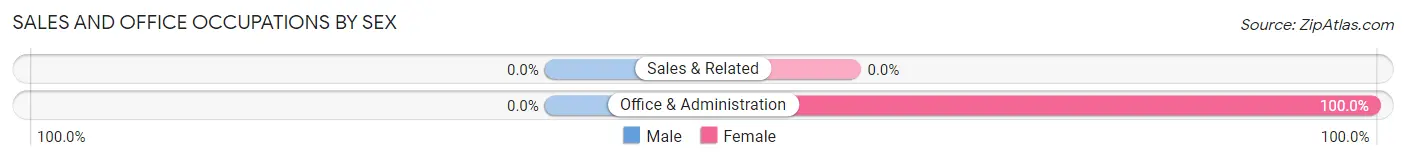
| Occupation | Male | Female |
| Sales & Related | 0 (0.0%) | 0 (0.0%) |
| Office & Administration | 0 (0.0%) | 7 (100.0%) |
| Total (Category) | 0 (0.0%) | 7 (100.0%) |
| Total (Overall) | 163 (62.0%) | 100 (38.0%) |
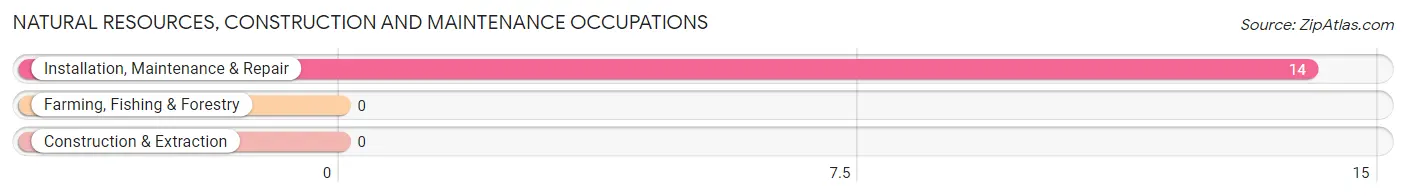
Natural Resources, Construction and Maintenance Occupations
The most common Natural Resources, Construction and Maintenance occupations in Marshallberg are , and Installation, Maintenance & Repair (14 | 5.3%).
Natural Resources, Construction and Maintenance Occupations by Sex
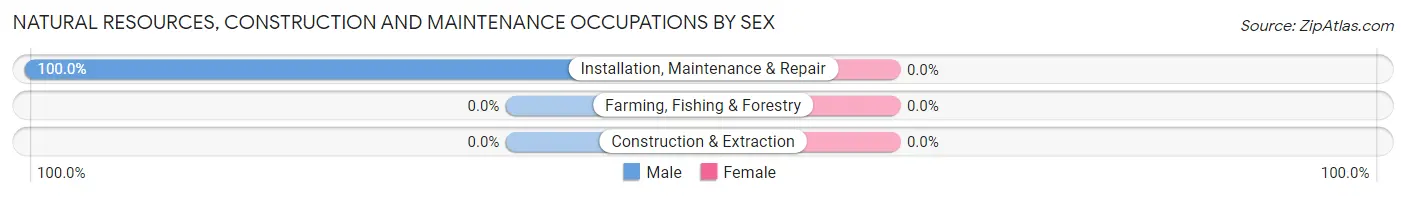
| Occupation | Male | Female |
| Farming, Fishing & Forestry | 0 (0.0%) | 0 (0.0%) |
| Construction & Extraction | 0 (0.0%) | 0 (0.0%) |
| Installation, Maintenance & Repair | 14 (100.0%) | 0 (0.0%) |
| Total (Category) | 14 (100.0%) | 0 (0.0%) |
| Total (Overall) | 163 (62.0%) | 100 (38.0%) |
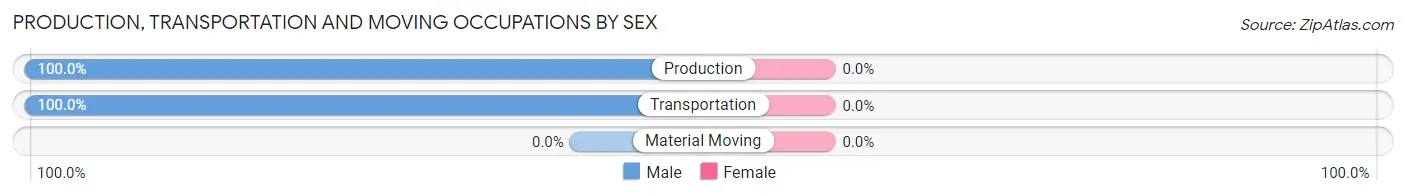
Production, Transportation and Moving Occupations
The most common Production, Transportation and Moving occupations in Marshallberg are Transportation (10 | 3.8%), and Production (9 | 3.4%).
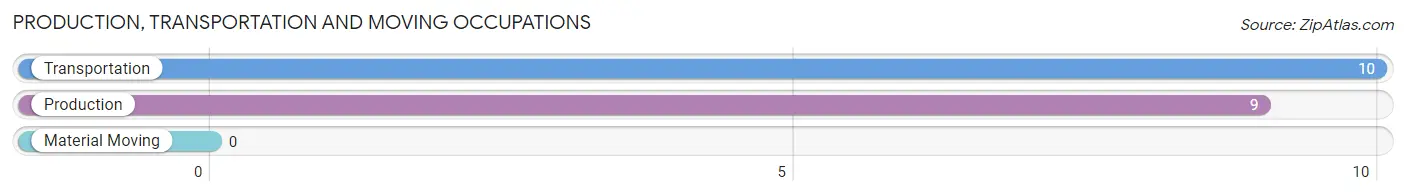
Production, Transportation and Moving Occupations by Sex
| Occupation | Male | Female |
| Production | 9 (100.0%) | 0 (0.0%) |
| Transportation | 10 (100.0%) | 0 (0.0%) |
| Material Moving | 0 (0.0%) | 0 (0.0%) |
| Total (Category) | 19 (100.0%) | 0 (0.0%) |
| Total (Overall) | 163 (62.0%) | 100 (38.0%) |
Employment Industries by Sex in Marshallberg
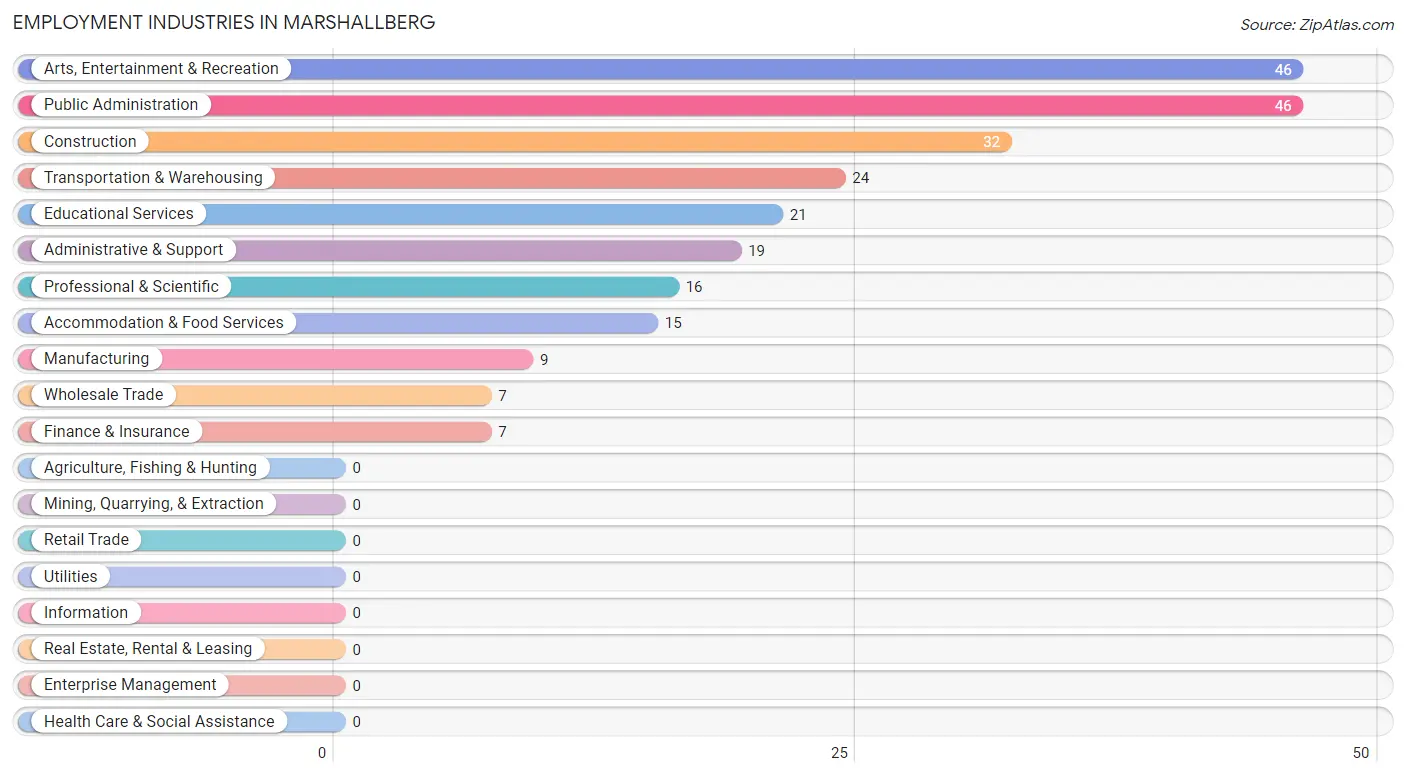
Employment Industries in Marshallberg
The major employment industries in Marshallberg include Arts, Entertainment & Recreation (46 | 17.5%), Public Administration (46 | 17.5%), Construction (32 | 12.2%), Transportation & Warehousing (24 | 9.1%), and Educational Services (21 | 8.0%).
Employment Industries by Sex in Marshallberg
The Marshallberg industries that see more men than women are Construction (100.0%), Manufacturing (100.0%), and Wholesale Trade (100.0%), whereas the industries that tend to have a higher number of women are Finance & Insurance (100.0%), Educational Services (100.0%), and Accommodation & Food Services (100.0%).
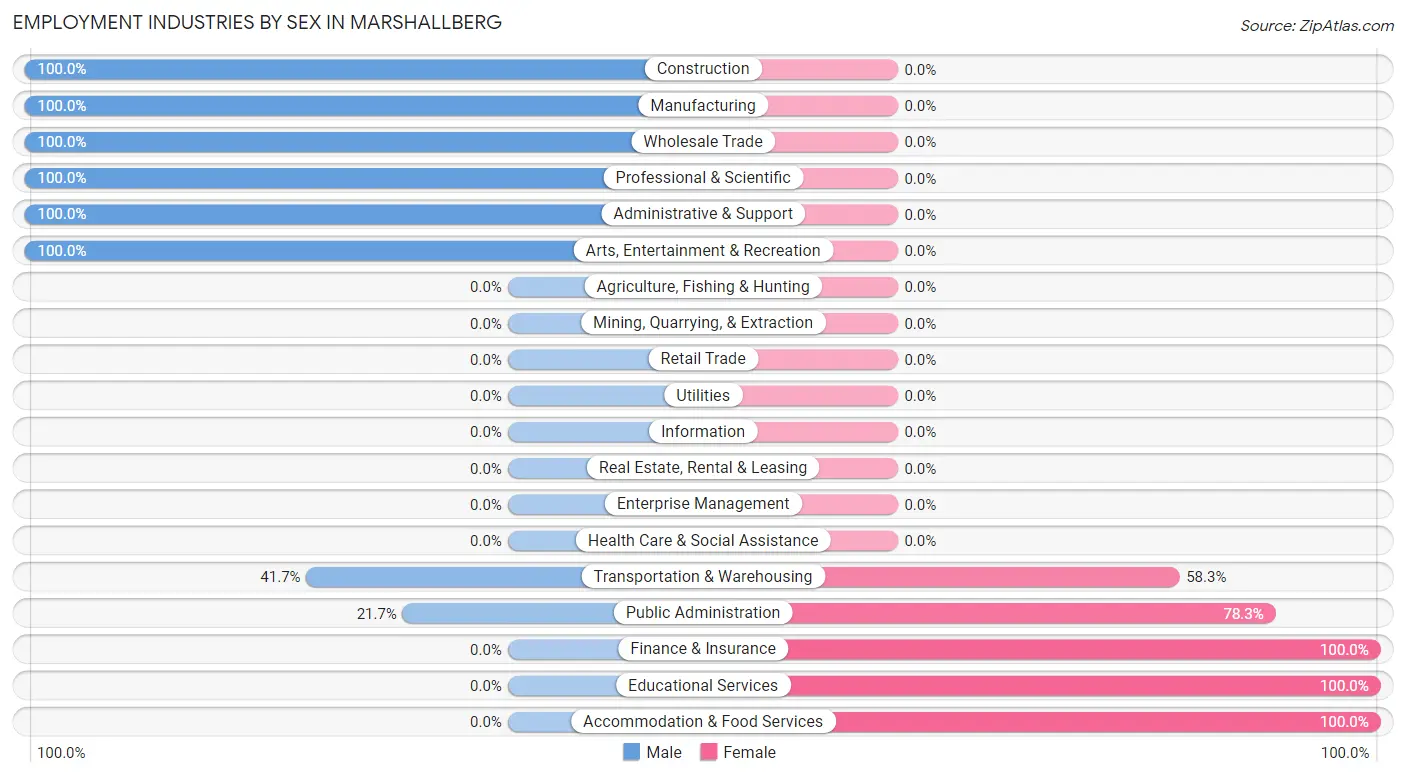
| Industry | Male | Female |
| Agriculture, Fishing & Hunting | 0 (0.0%) | 0 (0.0%) |
| Mining, Quarrying, & Extraction | 0 (0.0%) | 0 (0.0%) |
| Construction | 32 (100.0%) | 0 (0.0%) |
| Manufacturing | 9 (100.0%) | 0 (0.0%) |
| Wholesale Trade | 7 (100.0%) | 0 (0.0%) |
| Retail Trade | 0 (0.0%) | 0 (0.0%) |
| Transportation & Warehousing | 10 (41.7%) | 14 (58.3%) |
| Utilities | 0 (0.0%) | 0 (0.0%) |
| Information | 0 (0.0%) | 0 (0.0%) |
| Finance & Insurance | 0 (0.0%) | 7 (100.0%) |
| Real Estate, Rental & Leasing | 0 (0.0%) | 0 (0.0%) |
| Professional & Scientific | 16 (100.0%) | 0 (0.0%) |
| Enterprise Management | 0 (0.0%) | 0 (0.0%) |
| Administrative & Support | 19 (100.0%) | 0 (0.0%) |
| Educational Services | 0 (0.0%) | 21 (100.0%) |
| Health Care & Social Assistance | 0 (0.0%) | 0 (0.0%) |
| Arts, Entertainment & Recreation | 46 (100.0%) | 0 (0.0%) |
| Accommodation & Food Services | 0 (0.0%) | 15 (100.0%) |
| Public Administration | 10 (21.7%) | 36 (78.3%) |
| Total | 163 (62.0%) | 100 (38.0%) |
Education in Marshallberg
School Enrollment in Marshallberg
The most common levels of schooling among the 24 students in Marshallberg are high school (15 | 62.5%), and kindergarten (9 | 37.5%).
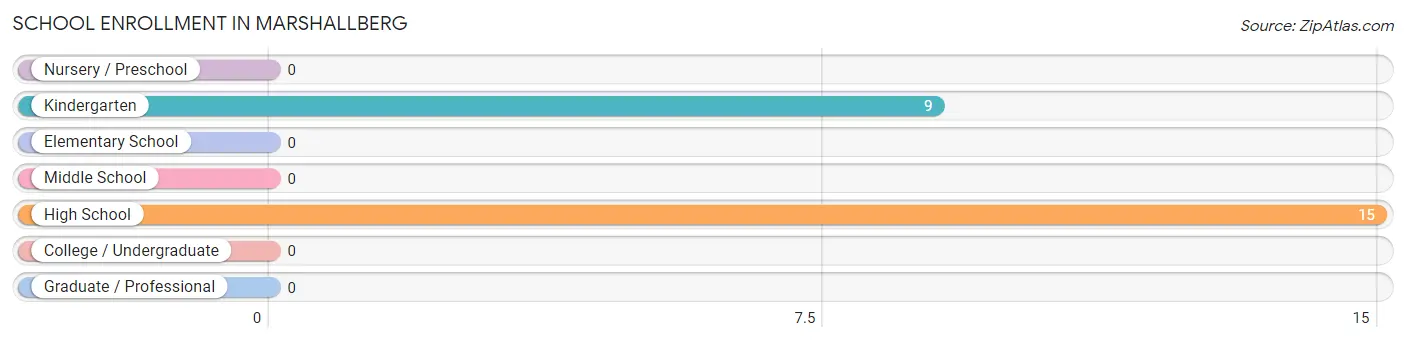
| School Level | # Students | % Students |
| Nursery / Preschool | 0 | 0.0% |
| Kindergarten | 9 | 37.5% |
| Elementary School | 0 | 0.0% |
| Middle School | 0 | 0.0% |
| High School | 15 | 62.5% |
| College / Undergraduate | 0 | 0.0% |
| Graduate / Professional | 0 | 0.0% |
| Total | 24 | 100.0% |
School Enrollment by Age by Funding Source in Marshallberg
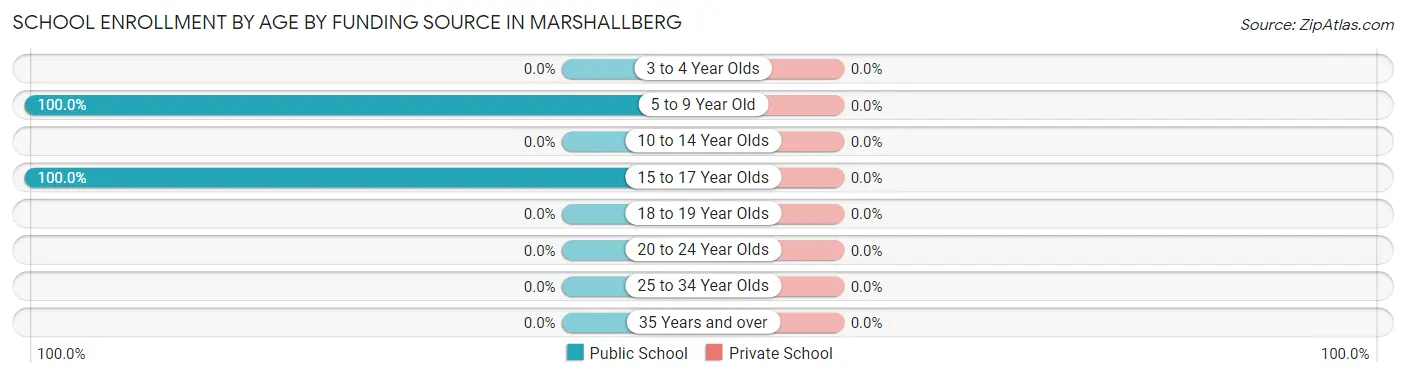
| Age Bracket | Public School | Private School |
| 3 to 4 Year Olds | 0 (0.0%) | 0 (0.0%) |
| 5 to 9 Year Old | 9 (100.0%) | 0 (0.0%) |
| 10 to 14 Year Olds | 0 (0.0%) | 0 (0.0%) |
| 15 to 17 Year Olds | 15 (100.0%) | 0 (0.0%) |
| 18 to 19 Year Olds | 0 (0.0%) | 0 (0.0%) |
| 20 to 24 Year Olds | 0 (0.0%) | 0 (0.0%) |
| 25 to 34 Year Olds | 0 (0.0%) | 0 (0.0%) |
| 35 Years and over | 0 (0.0%) | 0 (0.0%) |
| Total | 24 (100.0%) | 0 (0.0%) |
Educational Attainment by Field of Study in Marshallberg
Social sciences (19 | 26.0%), engineering (16 | 21.9%), bio, nature & agricultural (15 | 20.5%), education (12 | 16.4%), and science & technology (11 | 15.1%) are the most common fields of study among 73 individuals in Marshallberg who have obtained a bachelor's degree or higher.
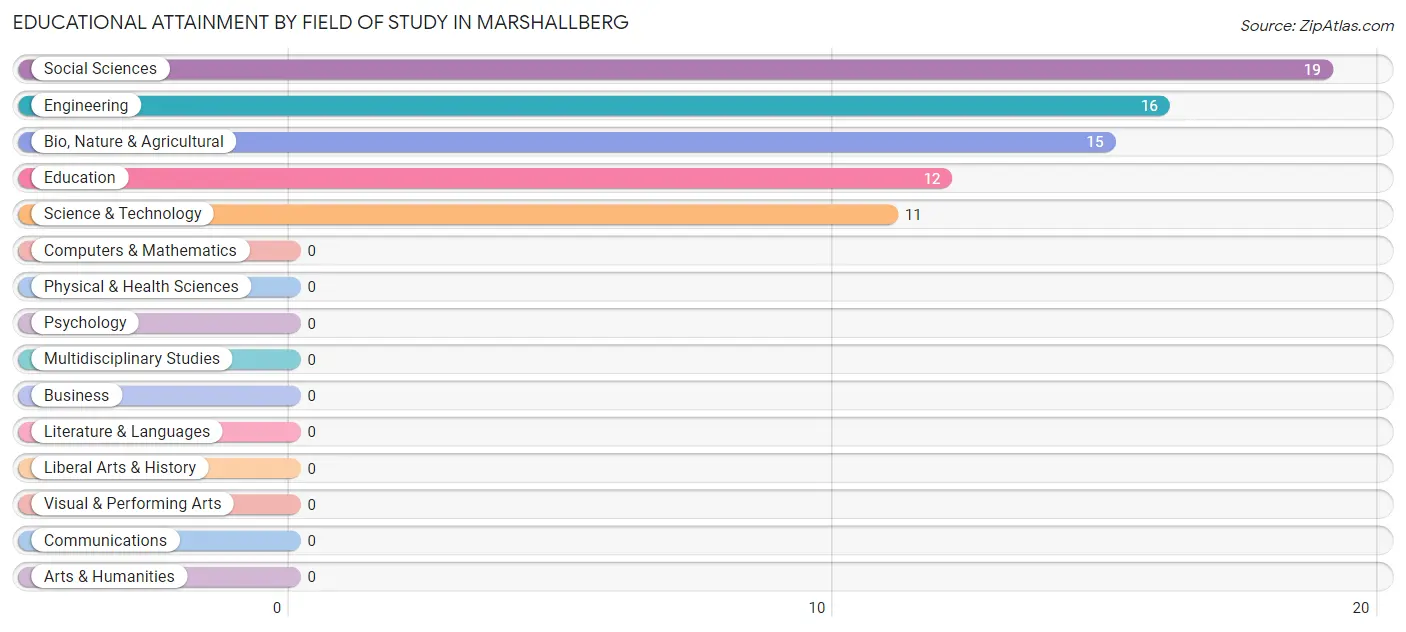
| Field of Study | # Graduates | % Graduates |
| Computers & Mathematics | 0 | 0.0% |
| Bio, Nature & Agricultural | 15 | 20.5% |
| Physical & Health Sciences | 0 | 0.0% |
| Psychology | 0 | 0.0% |
| Social Sciences | 19 | 26.0% |
| Engineering | 16 | 21.9% |
| Multidisciplinary Studies | 0 | 0.0% |
| Science & Technology | 11 | 15.1% |
| Business | 0 | 0.0% |
| Education | 12 | 16.4% |
| Literature & Languages | 0 | 0.0% |
| Liberal Arts & History | 0 | 0.0% |
| Visual & Performing Arts | 0 | 0.0% |
| Communications | 0 | 0.0% |
| Arts & Humanities | 0 | 0.0% |
| Total | 73 | 100.0% |
Transportation & Commute in Marshallberg
Vehicle Availability by Sex in Marshallberg
The most prevalent vehicle ownership categories in Marshallberg are males with 2 vehicles (91, accounting for 55.8%) and females with 2 vehicles (63, making up 97.9%).
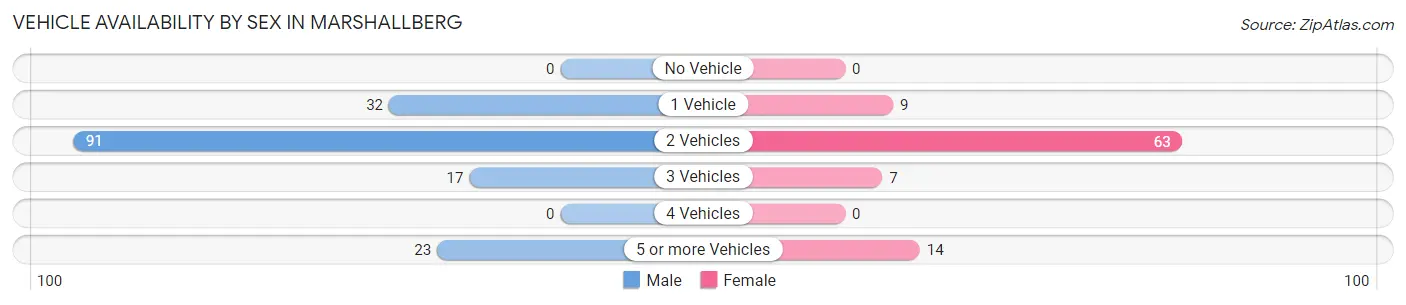
| Vehicles Available | Male | Female |
| No Vehicle | 0 (0.0%) | 0 (0.0%) |
| 1 Vehicle | 32 (19.6%) | 9 (9.7%) |
| 2 Vehicles | 91 (55.8%) | 63 (67.7%) |
| 3 Vehicles | 17 (10.4%) | 7 (7.5%) |
| 4 Vehicles | 0 (0.0%) | 0 (0.0%) |
| 5 or more Vehicles | 23 (14.1%) | 14 (15.0%) |
| Total | 163 (100.0%) | 93 (100.0%) |
Commute Time in Marshallberg
The most frequently occuring commute durations in Marshallberg are 10 to 14 minutes (78 commuters, 37.3%), 30 to 34 minutes (61 commuters, 29.2%), and 45 to 59 minutes (18 commuters, 8.6%).
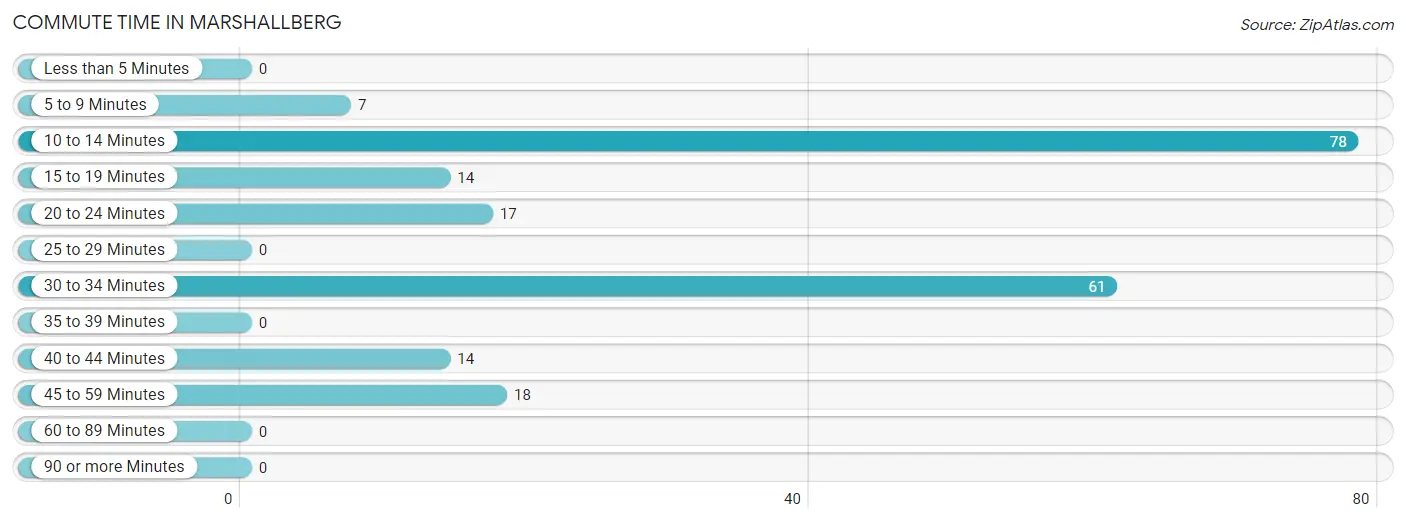
| Commute Time | # Commuters | % Commuters |
| Less than 5 Minutes | 0 | 0.0% |
| 5 to 9 Minutes | 7 | 3.4% |
| 10 to 14 Minutes | 78 | 37.3% |
| 15 to 19 Minutes | 14 | 6.7% |
| 20 to 24 Minutes | 17 | 8.1% |
| 25 to 29 Minutes | 0 | 0.0% |
| 30 to 34 Minutes | 61 | 29.2% |
| 35 to 39 Minutes | 0 | 0.0% |
| 40 to 44 Minutes | 14 | 6.7% |
| 45 to 59 Minutes | 18 | 8.6% |
| 60 to 89 Minutes | 0 | 0.0% |
| 90 or more Minutes | 0 | 0.0% |
Commute Time by Sex in Marshallberg
The most common commute times in Marshallberg are 10 to 14 minutes (78 commuters, 60.9%) for males and 30 to 34 minutes (51 commuters, 63.0%) for females.
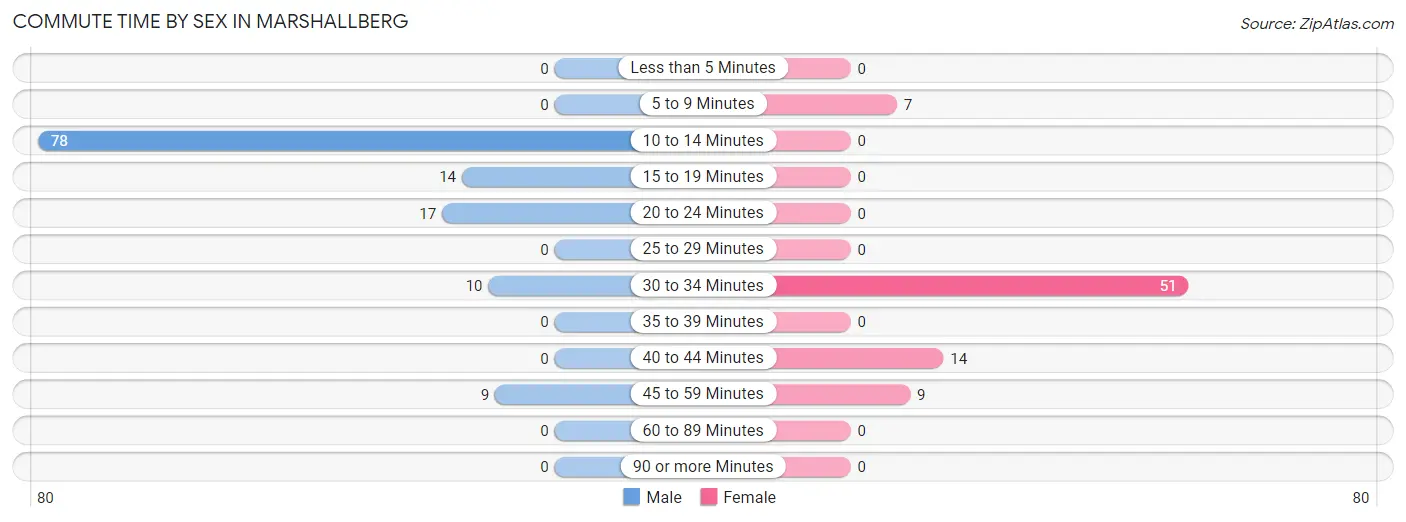
| Commute Time | Male | Female |
| Less than 5 Minutes | 0 (0.0%) | 0 (0.0%) |
| 5 to 9 Minutes | 0 (0.0%) | 7 (8.6%) |
| 10 to 14 Minutes | 78 (60.9%) | 0 (0.0%) |
| 15 to 19 Minutes | 14 (10.9%) | 0 (0.0%) |
| 20 to 24 Minutes | 17 (13.3%) | 0 (0.0%) |
| 25 to 29 Minutes | 0 (0.0%) | 0 (0.0%) |
| 30 to 34 Minutes | 10 (7.8%) | 51 (63.0%) |
| 35 to 39 Minutes | 0 (0.0%) | 0 (0.0%) |
| 40 to 44 Minutes | 0 (0.0%) | 14 (17.3%) |
| 45 to 59 Minutes | 9 (7.0%) | 9 (11.1%) |
| 60 to 89 Minutes | 0 (0.0%) | 0 (0.0%) |
| 90 or more Minutes | 0 (0.0%) | 0 (0.0%) |
Time of Departure to Work by Sex in Marshallberg
The most frequent times of departure to work in Marshallberg are 7:00 AM to 7:29 AM (56, 43.8%) for males and 7:00 AM to 7:29 AM (36, 44.4%) for females.
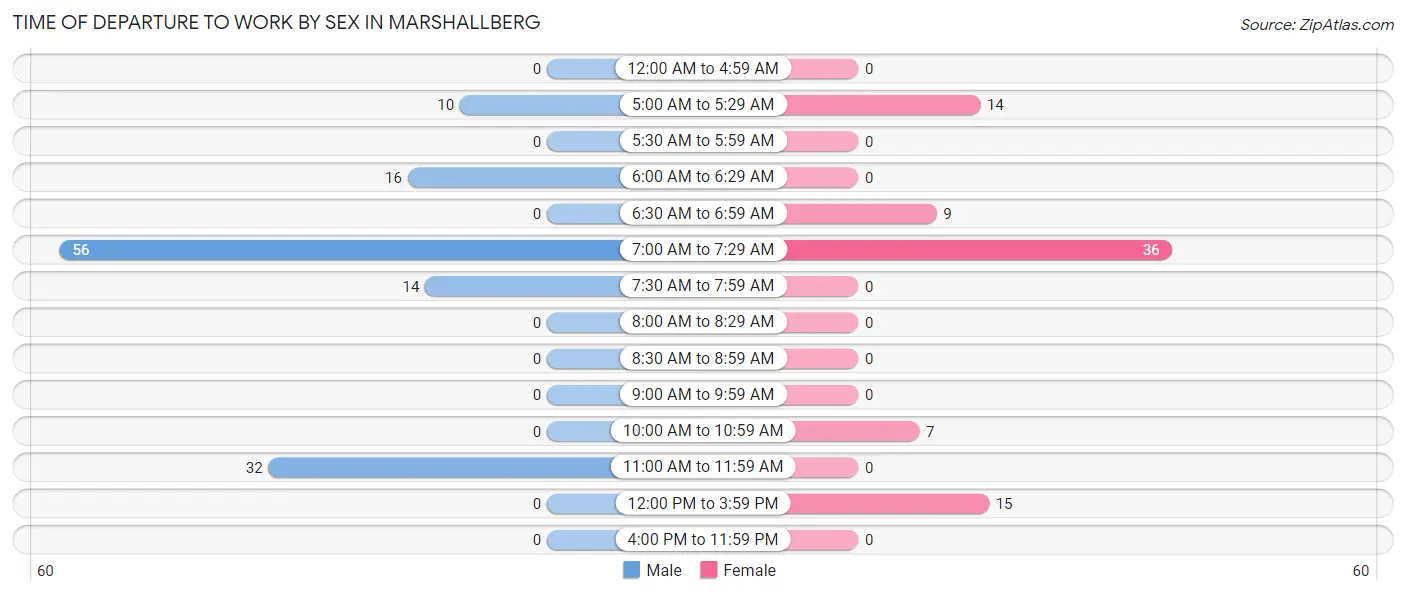
| Time of Departure | Male | Female |
| 12:00 AM to 4:59 AM | 0 (0.0%) | 0 (0.0%) |
| 5:00 AM to 5:29 AM | 10 (7.8%) | 14 (17.3%) |
| 5:30 AM to 5:59 AM | 0 (0.0%) | 0 (0.0%) |
| 6:00 AM to 6:29 AM | 16 (12.5%) | 0 (0.0%) |
| 6:30 AM to 6:59 AM | 0 (0.0%) | 9 (11.1%) |
| 7:00 AM to 7:29 AM | 56 (43.8%) | 36 (44.4%) |
| 7:30 AM to 7:59 AM | 14 (10.9%) | 0 (0.0%) |
| 8:00 AM to 8:29 AM | 0 (0.0%) | 0 (0.0%) |
| 8:30 AM to 8:59 AM | 0 (0.0%) | 0 (0.0%) |
| 9:00 AM to 9:59 AM | 0 (0.0%) | 0 (0.0%) |
| 10:00 AM to 10:59 AM | 0 (0.0%) | 7 (8.6%) |
| 11:00 AM to 11:59 AM | 32 (25.0%) | 0 (0.0%) |
| 12:00 PM to 3:59 PM | 0 (0.0%) | 15 (18.5%) |
| 4:00 PM to 11:59 PM | 0 (0.0%) | 0 (0.0%) |
| Total | 128 (100.0%) | 81 (100.0%) |
Housing Occupancy in Marshallberg
Occupancy by Ownership in Marshallberg
Of the total 191 dwellings in Marshallberg, owner-occupied units account for 142 (74.4%), while renter-occupied units make up 49 (25.7%).
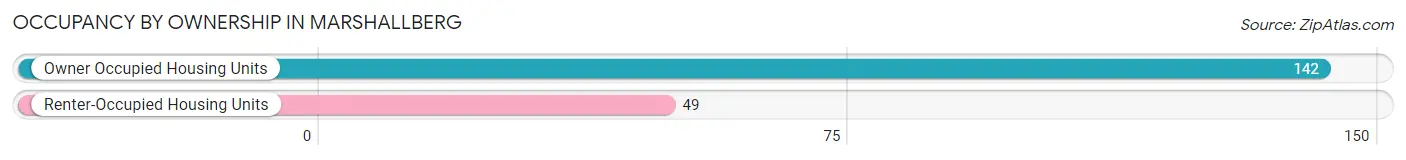
| Occupancy | # Housing Units | % Housing Units |
| Owner Occupied Housing Units | 142 | 74.4% |
| Renter-Occupied Housing Units | 49 | 25.7% |
| Total Occupied Housing Units | 191 | 100.0% |
Occupancy by Household Size in Marshallberg
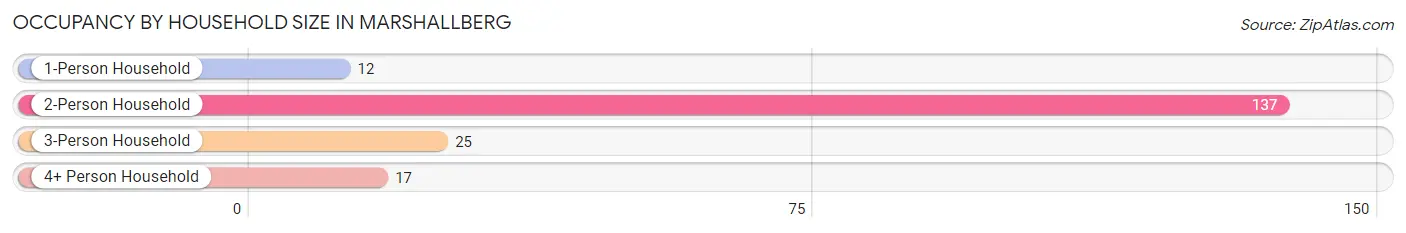
| Household Size | # Housing Units | % Housing Units |
| 1-Person Household | 12 | 6.3% |
| 2-Person Household | 137 | 71.7% |
| 3-Person Household | 25 | 13.1% |
| 4+ Person Household | 17 | 8.9% |
| Total Housing Units | 191 | 100.0% |
Occupancy by Ownership by Household Size in Marshallberg
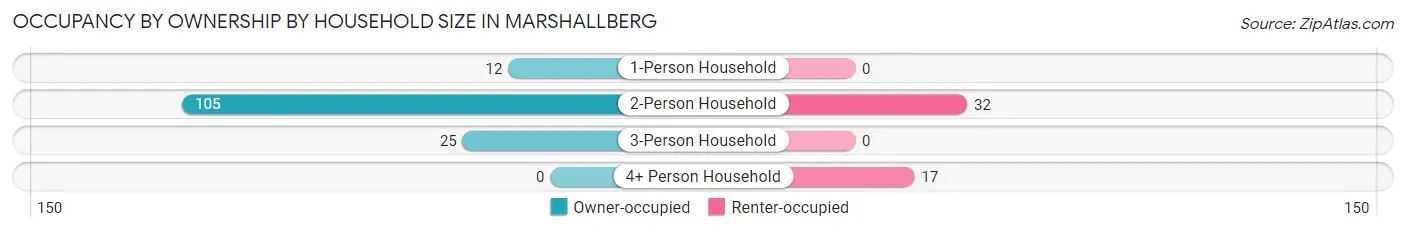
| Household Size | Owner-occupied | Renter-occupied |
| 1-Person Household | 12 (100.0%) | 0 (0.0%) |
| 2-Person Household | 105 (76.6%) | 32 (23.4%) |
| 3-Person Household | 25 (100.0%) | 0 (0.0%) |
| 4+ Person Household | 0 (0.0%) | 17 (100.0%) |
| Total Housing Units | 142 (74.4%) | 49 (25.7%) |
Occupancy by Educational Attainment in Marshallberg
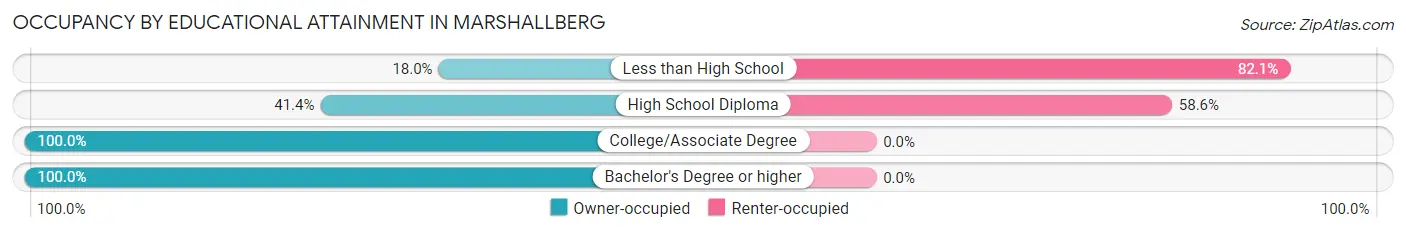
| Household Size | Owner-occupied | Renter-occupied |
| Less than High School | 7 (17.9%) | 32 (82.1%) |
| High School Diploma | 12 (41.4%) | 17 (58.6%) |
| College/Associate Degree | 75 (100.0%) | 0 (0.0%) |
| Bachelor's Degree or higher | 48 (100.0%) | 0 (0.0%) |
Occupancy by Age of Householder in Marshallberg
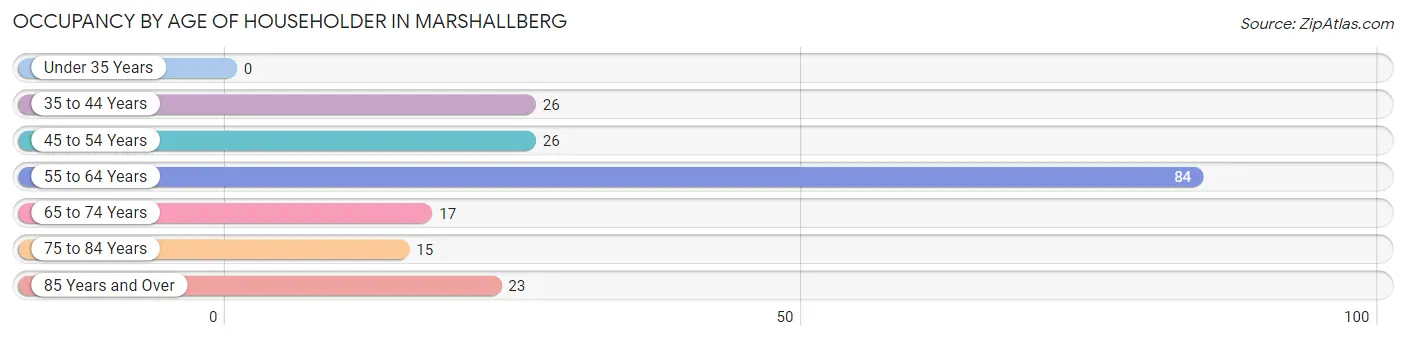
| Age Bracket | # Households | % Households |
| Under 35 Years | 0 | 0.0% |
| 35 to 44 Years | 26 | 13.6% |
| 45 to 54 Years | 26 | 13.6% |
| 55 to 64 Years | 84 | 44.0% |
| 65 to 74 Years | 17 | 8.9% |
| 75 to 84 Years | 15 | 7.9% |
| 85 Years and Over | 23 | 12.0% |
| Total | 191 | 100.0% |
Housing Finances in Marshallberg
Median Income by Occupancy in Marshallberg
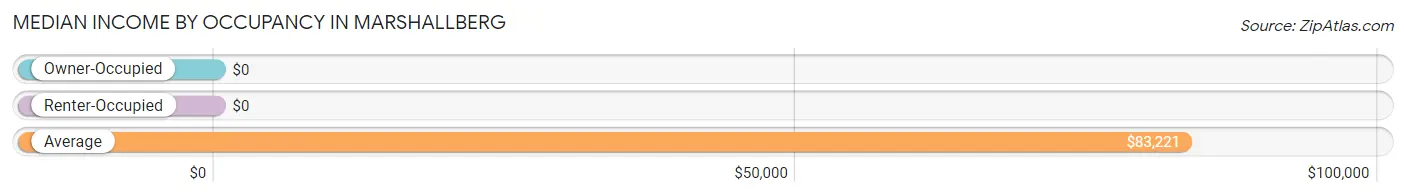
| Occupancy Type | # Households | Median Income |
| Owner-Occupied | 142 (74.4%) | $0 |
| Renter-Occupied | 49 (25.7%) | $0 |
| Average | 191 (100.0%) | $83,221 |
Occupancy by Householder Income Bracket in Marshallberg
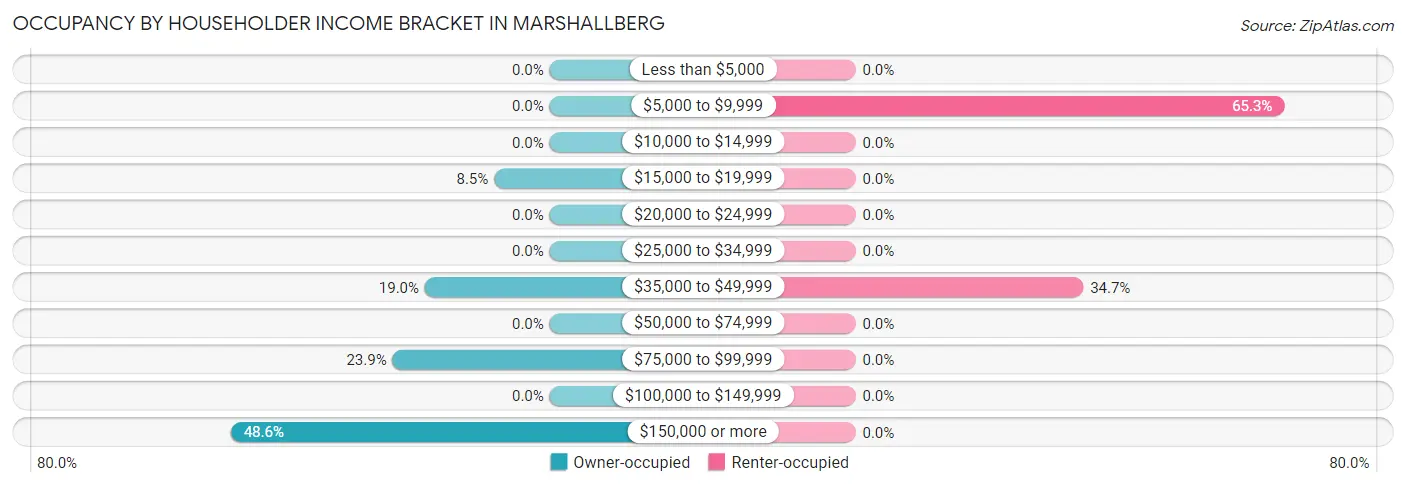
| Income Bracket | Owner-occupied | Renter-occupied |
| Less than $5,000 | 0 (0.0%) | 0 (0.0%) |
| $5,000 to $9,999 | 0 (0.0%) | 32 (65.3%) |
| $10,000 to $14,999 | 0 (0.0%) | 0 (0.0%) |
| $15,000 to $19,999 | 12 (8.5%) | 0 (0.0%) |
| $20,000 to $24,999 | 0 (0.0%) | 0 (0.0%) |
| $25,000 to $34,999 | 0 (0.0%) | 0 (0.0%) |
| $35,000 to $49,999 | 27 (19.0%) | 17 (34.7%) |
| $50,000 to $74,999 | 0 (0.0%) | 0 (0.0%) |
| $75,000 to $99,999 | 34 (23.9%) | 0 (0.0%) |
| $100,000 to $149,999 | 0 (0.0%) | 0 (0.0%) |
| $150,000 or more | 69 (48.6%) | 0 (0.0%) |
| Total | 142 (100.0%) | 49 (100.0%) |
Monthly Housing Cost Tiers in Marshallberg
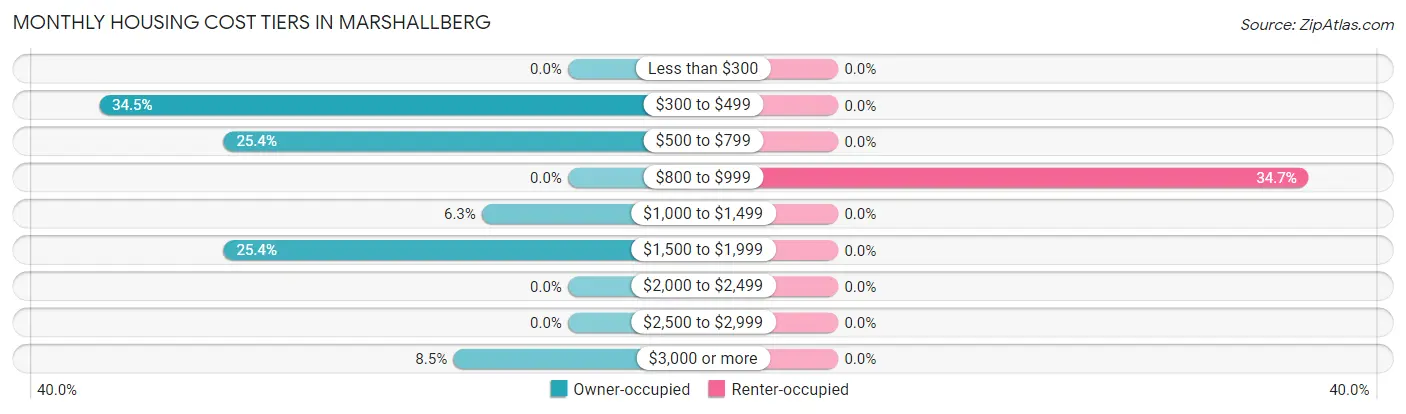
| Monthly Cost | Owner-occupied | Renter-occupied |
| Less than $300 | 0 (0.0%) | 0 (0.0%) |
| $300 to $499 | 49 (34.5%) | 0 (0.0%) |
| $500 to $799 | 36 (25.4%) | 0 (0.0%) |
| $800 to $999 | 0 (0.0%) | 17 (34.7%) |
| $1,000 to $1,499 | 9 (6.3%) | 0 (0.0%) |
| $1,500 to $1,999 | 36 (25.4%) | 0 (0.0%) |
| $2,000 to $2,499 | 0 (0.0%) | 0 (0.0%) |
| $2,500 to $2,999 | 0 (0.0%) | 0 (0.0%) |
| $3,000 or more | 12 (8.5%) | 0 (0.0%) |
| Total | 142 (100.0%) | 49 (100.0%) |
Physical Housing Characteristics in Marshallberg
Housing Structures in Marshallberg
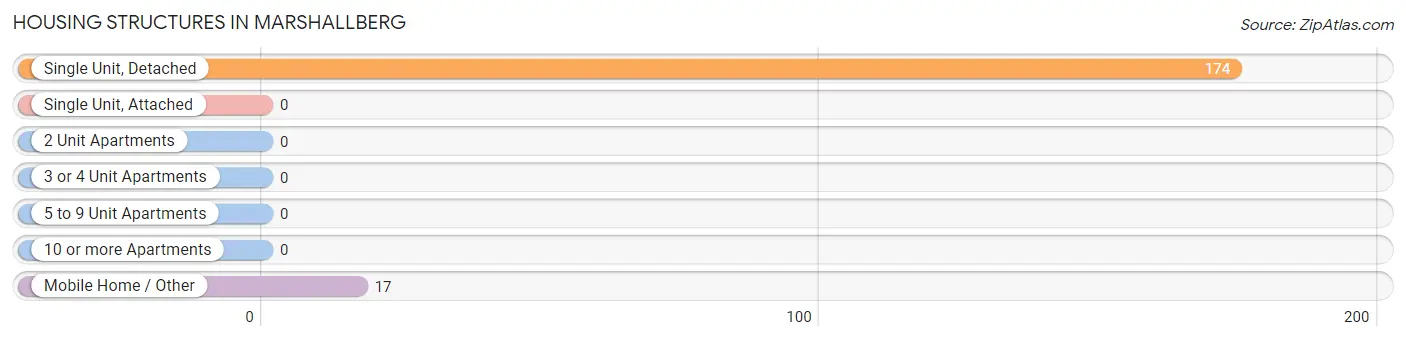
| Structure Type | # Housing Units | % Housing Units |
| Single Unit, Detached | 174 | 91.1% |
| Single Unit, Attached | 0 | 0.0% |
| 2 Unit Apartments | 0 | 0.0% |
| 3 or 4 Unit Apartments | 0 | 0.0% |
| 5 to 9 Unit Apartments | 0 | 0.0% |
| 10 or more Apartments | 0 | 0.0% |
| Mobile Home / Other | 17 | 8.9% |
| Total | 191 | 100.0% |
Housing Structures by Occupancy in Marshallberg
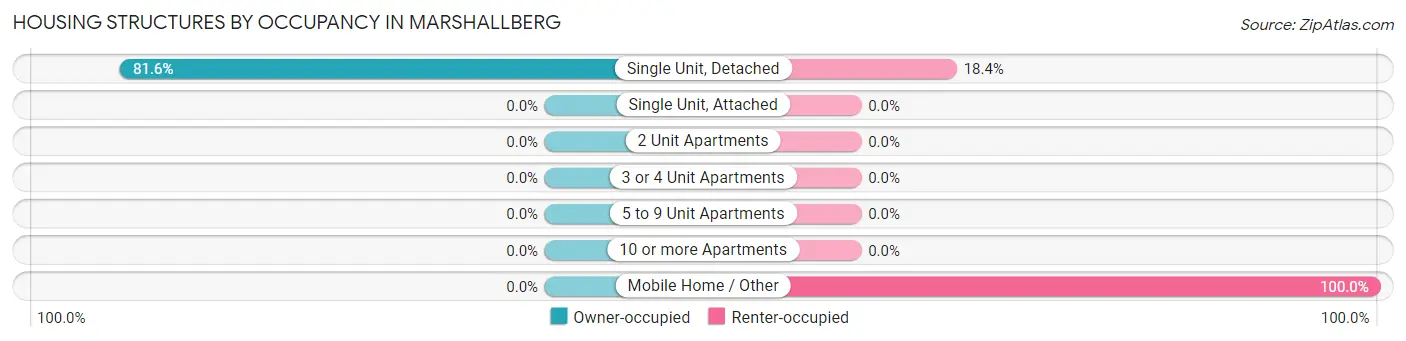
| Structure Type | Owner-occupied | Renter-occupied |
| Single Unit, Detached | 142 (81.6%) | 32 (18.4%) |
| Single Unit, Attached | 0 (0.0%) | 0 (0.0%) |
| 2 Unit Apartments | 0 (0.0%) | 0 (0.0%) |
| 3 or 4 Unit Apartments | 0 (0.0%) | 0 (0.0%) |
| 5 to 9 Unit Apartments | 0 (0.0%) | 0 (0.0%) |
| 10 or more Apartments | 0 (0.0%) | 0 (0.0%) |
| Mobile Home / Other | 0 (0.0%) | 17 (100.0%) |
| Total | 142 (74.4%) | 49 (25.7%) |
Housing Structures by Number of Rooms in Marshallberg
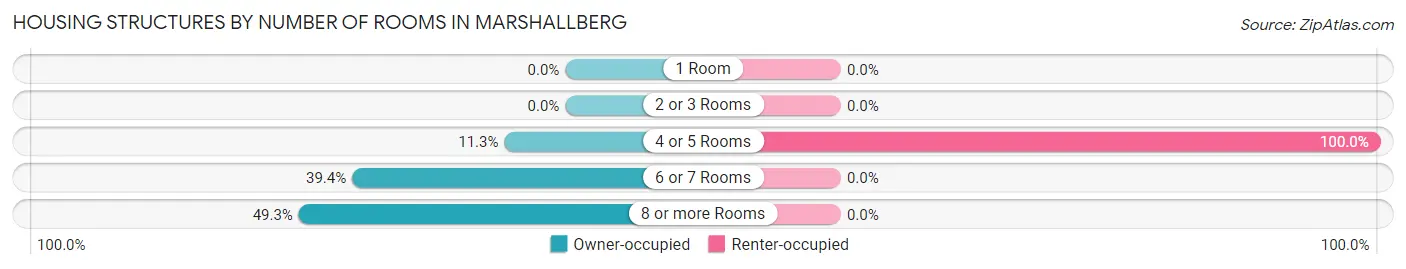
| Number of Rooms | Owner-occupied | Renter-occupied |
| 1 Room | 0 (0.0%) | 0 (0.0%) |
| 2 or 3 Rooms | 0 (0.0%) | 0 (0.0%) |
| 4 or 5 Rooms | 16 (11.3%) | 49 (100.0%) |
| 6 or 7 Rooms | 56 (39.4%) | 0 (0.0%) |
| 8 or more Rooms | 70 (49.3%) | 0 (0.0%) |
| Total | 142 (100.0%) | 49 (100.0%) |
Housing Structure by Heating Type in Marshallberg
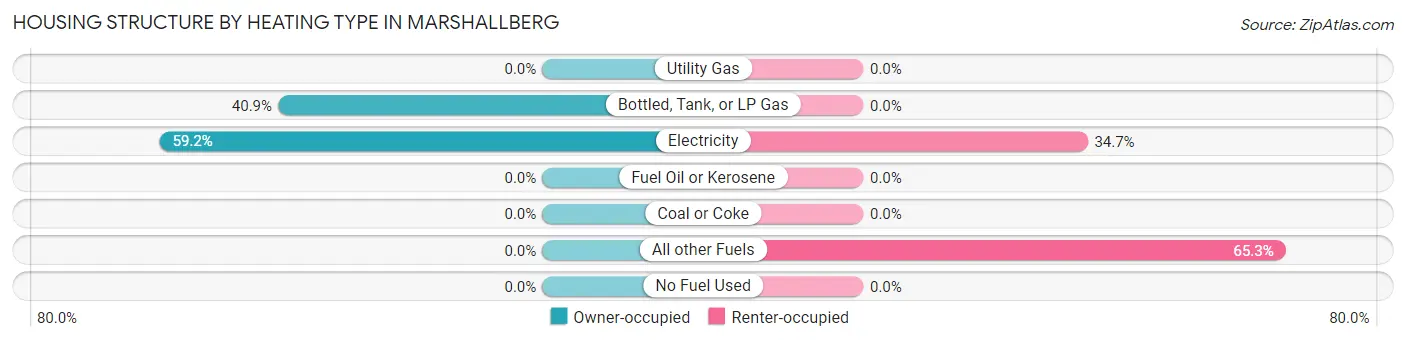
| Heating Type | Owner-occupied | Renter-occupied |
| Utility Gas | 0 (0.0%) | 0 (0.0%) |
| Bottled, Tank, or LP Gas | 58 (40.8%) | 0 (0.0%) |
| Electricity | 84 (59.2%) | 17 (34.7%) |
| Fuel Oil or Kerosene | 0 (0.0%) | 0 (0.0%) |
| Coal or Coke | 0 (0.0%) | 0 (0.0%) |
| All other Fuels | 0 (0.0%) | 32 (65.3%) |
| No Fuel Used | 0 (0.0%) | 0 (0.0%) |
| Total | 142 (100.0%) | 49 (100.0%) |
Household Vehicle Usage in Marshallberg
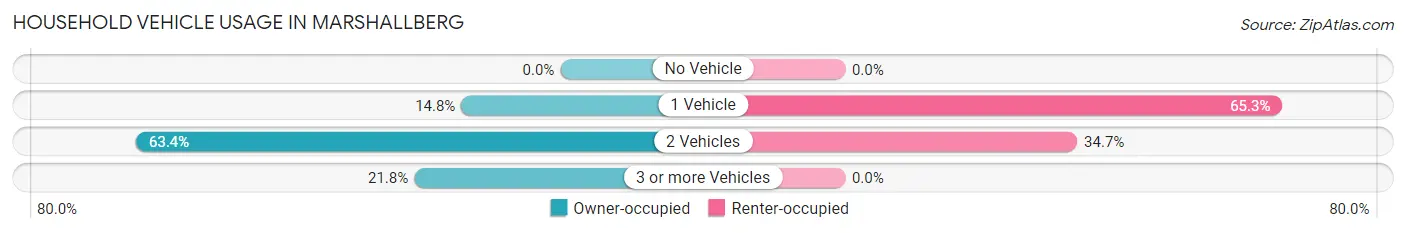
| Vehicles per Household | Owner-occupied | Renter-occupied |
| No Vehicle | 0 (0.0%) | 0 (0.0%) |
| 1 Vehicle | 21 (14.8%) | 32 (65.3%) |
| 2 Vehicles | 90 (63.4%) | 17 (34.7%) |
| 3 or more Vehicles | 31 (21.8%) | 0 (0.0%) |
| Total | 142 (100.0%) | 49 (100.0%) |
Real Estate & Mortgages in Marshallberg
Real Estate and Mortgage Overview in Marshallberg
| Characteristic | Without Mortgage | With Mortgage |
| Housing Units | 75 | 67 |
| Median Property Value | $150,400 | $440,300 |
| Median Household Income | $83,672 | $48 |
| Monthly Housing Costs | $445 | $12 |
| Real Estate Taxes | $1,009 | $0 |
Property Value by Mortgage Status in Marshallberg
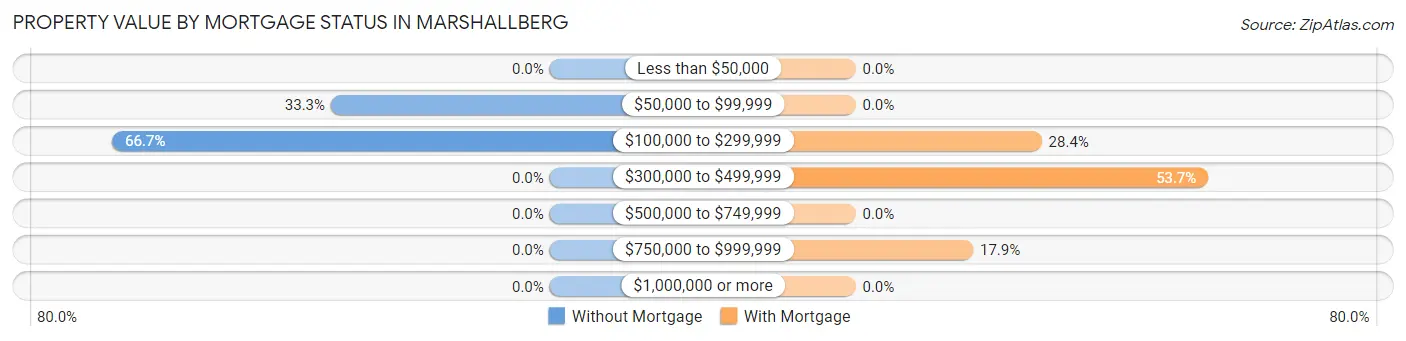
| Property Value | Without Mortgage | With Mortgage |
| Less than $50,000 | 0 (0.0%) | 0 (0.0%) |
| $50,000 to $99,999 | 25 (33.3%) | 0 (0.0%) |
| $100,000 to $299,999 | 50 (66.7%) | 19 (28.4%) |
| $300,000 to $499,999 | 0 (0.0%) | 36 (53.7%) |
| $500,000 to $749,999 | 0 (0.0%) | 0 (0.0%) |
| $750,000 to $999,999 | 0 (0.0%) | 12 (17.9%) |
| $1,000,000 or more | 0 (0.0%) | 0 (0.0%) |
| Total | 75 (100.0%) | 67 (100.0%) |
Household Income by Mortgage Status in Marshallberg
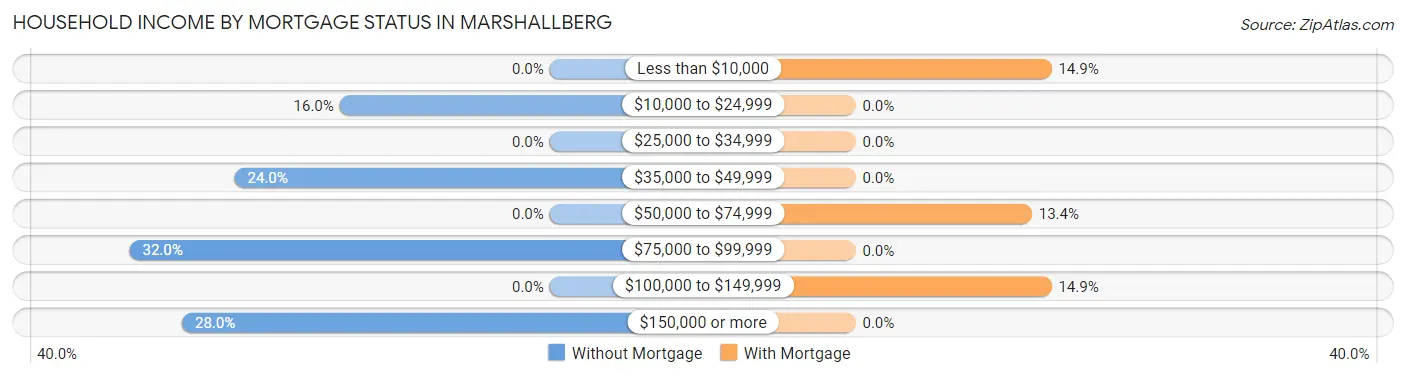
| Household Income | Without Mortgage | With Mortgage |
| Less than $10,000 | 0 (0.0%) | 10 (14.9%) |
| $10,000 to $24,999 | 12 (16.0%) | 0 (0.0%) |
| $25,000 to $34,999 | 0 (0.0%) | 0 (0.0%) |
| $35,000 to $49,999 | 18 (24.0%) | 0 (0.0%) |
| $50,000 to $74,999 | 0 (0.0%) | 9 (13.4%) |
| $75,000 to $99,999 | 24 (32.0%) | 0 (0.0%) |
| $100,000 to $149,999 | 0 (0.0%) | 10 (14.9%) |
| $150,000 or more | 21 (28.0%) | 0 (0.0%) |
| Total | 75 (100.0%) | 67 (100.0%) |
Property Value to Household Income Ratio in Marshallberg
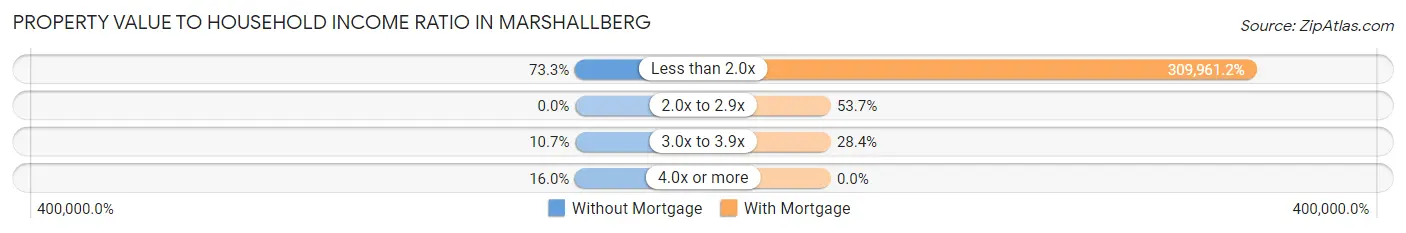
| Value-to-Income Ratio | Without Mortgage | With Mortgage |
| Less than 2.0x | 55 (73.3%) | 207,674 (309,961.2%) |
| 2.0x to 2.9x | 0 (0.0%) | 36 (53.7%) |
| 3.0x to 3.9x | 8 (10.7%) | 19 (28.4%) |
| 4.0x or more | 12 (16.0%) | 0 (0.0%) |
| Total | 75 (100.0%) | 67 (100.0%) |
Real Estate Taxes by Mortgage Status in Marshallberg
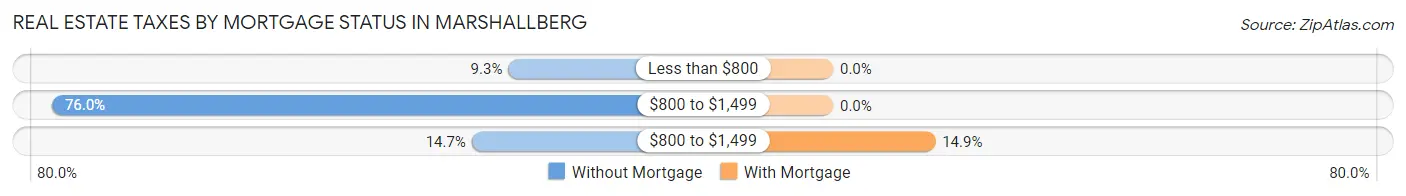
| Property Taxes | Without Mortgage | With Mortgage |
| Less than $800 | 7 (9.3%) | 0 (0.0%) |
| $800 to $1,499 | 57 (76.0%) | 0 (0.0%) |
| $800 to $1,499 | 11 (14.7%) | 10 (14.9%) |
| Total | 75 (100.0%) | 67 (100.0%) |
Health & Disability in Marshallberg
Health Insurance Coverage by Age in Marshallberg
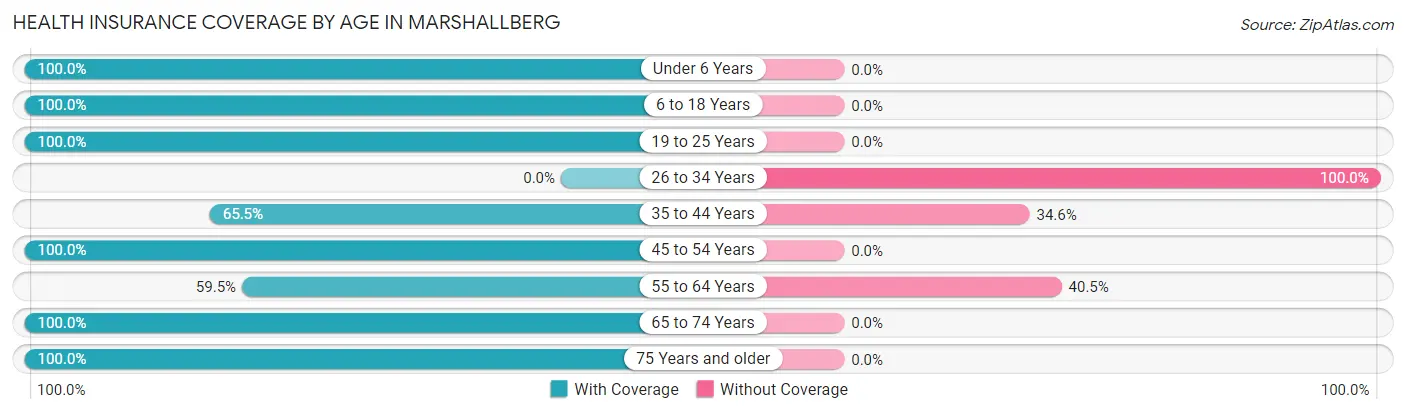
| Age Bracket | With Coverage | Without Coverage |
| Under 6 Years | 29 (100.0%) | 0 (0.0%) |
| 6 to 18 Years | 15 (100.0%) | 0 (0.0%) |
| 19 to 25 Years | 9 (100.0%) | 0 (0.0%) |
| 26 to 34 Years | 0 (0.0%) | 46 (100.0%) |
| 35 to 44 Years | 36 (65.4%) | 19 (34.5%) |
| 45 to 54 Years | 46 (100.0%) | 0 (0.0%) |
| 55 to 64 Years | 91 (59.5%) | 62 (40.5%) |
| 65 to 74 Years | 24 (100.0%) | 0 (0.0%) |
| 75 Years and older | 53 (100.0%) | 0 (0.0%) |
| Total | 303 (70.5%) | 127 (29.5%) |
Health Insurance Coverage by Citizenship Status in Marshallberg
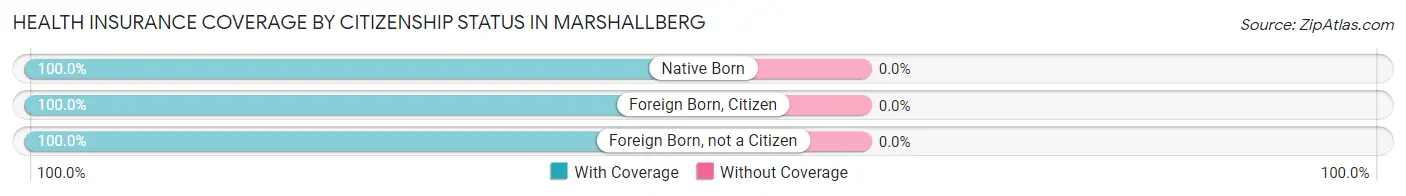
| Citizenship Status | With Coverage | Without Coverage |
| Native Born | 29 (100.0%) | 0 (0.0%) |
| Foreign Born, Citizen | 15 (100.0%) | 0 (0.0%) |
| Foreign Born, not a Citizen | 9 (100.0%) | 0 (0.0%) |
Health Insurance Coverage by Household Income in Marshallberg
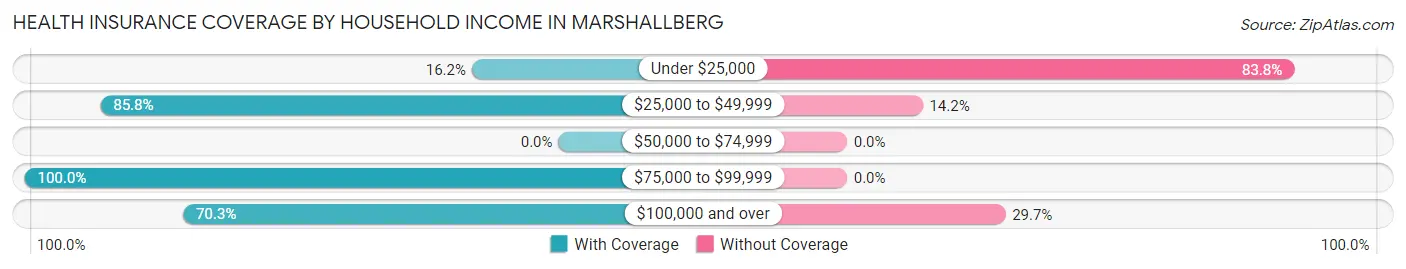
| Household Income | With Coverage | Without Coverage |
| Under $25,000 | 12 (16.2%) | 62 (83.8%) |
| $25,000 to $49,999 | 115 (85.8%) | 19 (14.2%) |
| $50,000 to $74,999 | 0 (0.0%) | 0 (0.0%) |
| $75,000 to $99,999 | 67 (100.0%) | 0 (0.0%) |
| $100,000 and over | 109 (70.3%) | 46 (29.7%) |
Public vs Private Health Insurance Coverage by Age in Marshallberg
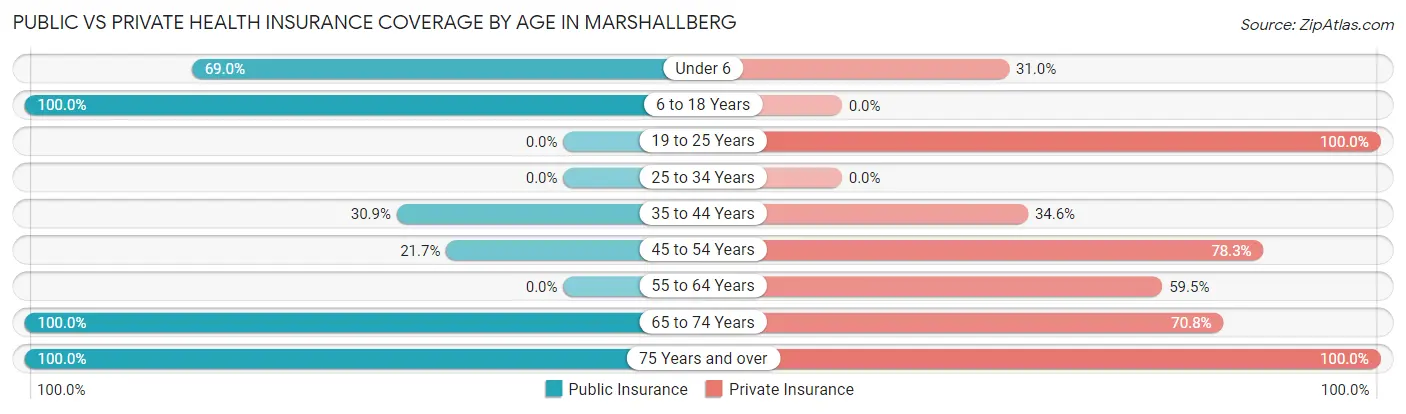
| Age Bracket | Public Insurance | Private Insurance |
| Under 6 | 20 (69.0%) | 9 (31.0%) |
| 6 to 18 Years | 15 (100.0%) | 0 (0.0%) |
| 19 to 25 Years | 0 (0.0%) | 9 (100.0%) |
| 25 to 34 Years | 0 (0.0%) | 0 (0.0%) |
| 35 to 44 Years | 17 (30.9%) | 19 (34.5%) |
| 45 to 54 Years | 10 (21.7%) | 36 (78.3%) |
| 55 to 64 Years | 0 (0.0%) | 91 (59.5%) |
| 65 to 74 Years | 24 (100.0%) | 17 (70.8%) |
| 75 Years and over | 53 (100.0%) | 53 (100.0%) |
| Total | 139 (32.3%) | 234 (54.4%) |
Disability Status by Sex by Age in Marshallberg
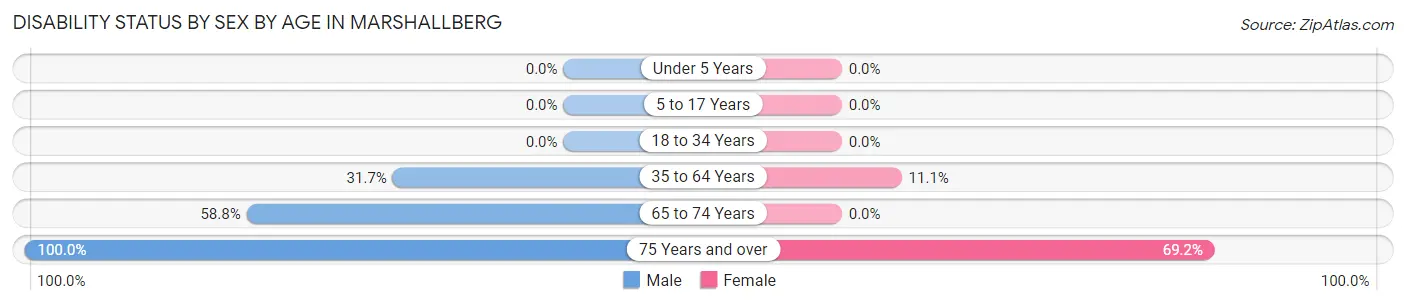
| Age Bracket | Male | Female |
| Under 5 Years | 0 (0.0%) | 0 (0.0%) |
| 5 to 17 Years | 0 (0.0%) | 0 (0.0%) |
| 18 to 34 Years | 0 (0.0%) | 0 (0.0%) |
| 35 to 64 Years | 32 (31.7%) | 17 (11.1%) |
| 65 to 74 Years | 10 (58.8%) | 0 (0.0%) |
| 75 Years and over | 27 (100.0%) | 18 (69.2%) |
Disability Class by Sex by Age in Marshallberg
Disability Class: Hearing Difficulty
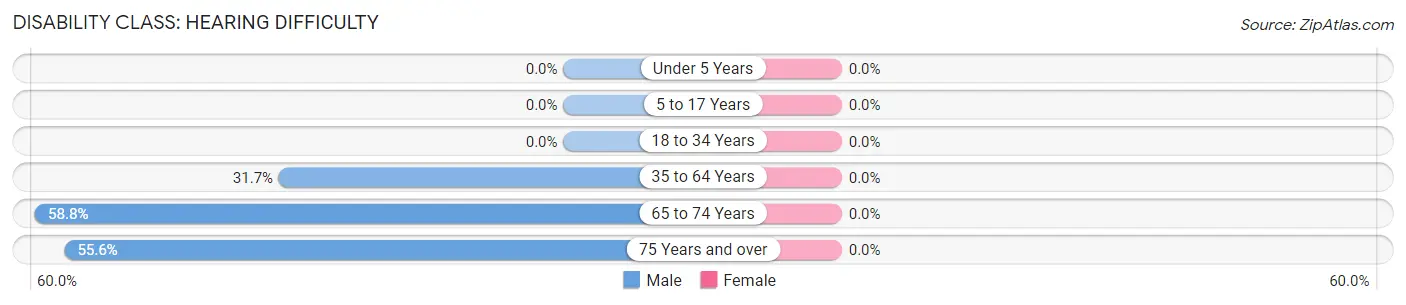
| Age Bracket | Male | Female |
| Under 5 Years | 0 (0.0%) | 0 (0.0%) |
| 5 to 17 Years | 0 (0.0%) | 0 (0.0%) |
| 18 to 34 Years | 0 (0.0%) | 0 (0.0%) |
| 35 to 64 Years | 32 (31.7%) | 0 (0.0%) |
| 65 to 74 Years | 10 (58.8%) | 0 (0.0%) |
| 75 Years and over | 15 (55.6%) | 0 (0.0%) |
Disability Class: Vision Difficulty
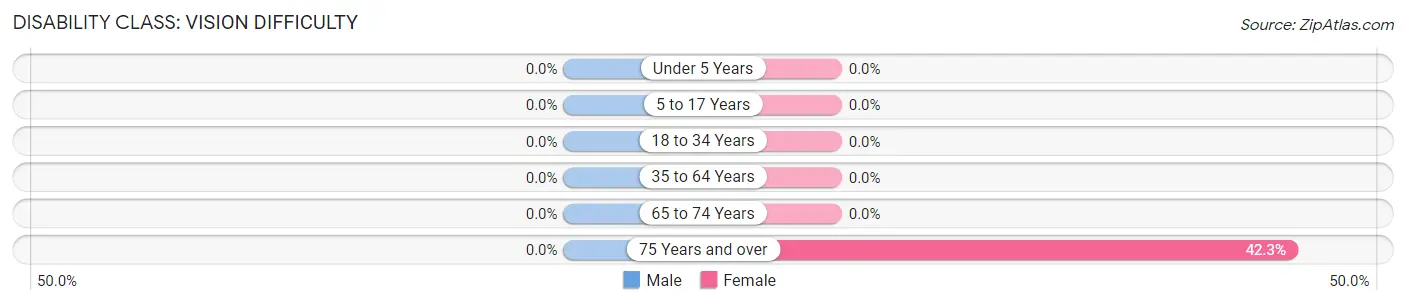
| Age Bracket | Male | Female |
| Under 5 Years | 0 (0.0%) | 0 (0.0%) |
| 5 to 17 Years | 0 (0.0%) | 0 (0.0%) |
| 18 to 34 Years | 0 (0.0%) | 0 (0.0%) |
| 35 to 64 Years | 0 (0.0%) | 0 (0.0%) |
| 65 to 74 Years | 0 (0.0%) | 0 (0.0%) |
| 75 Years and over | 0 (0.0%) | 11 (42.3%) |
Disability Class: Cognitive Difficulty
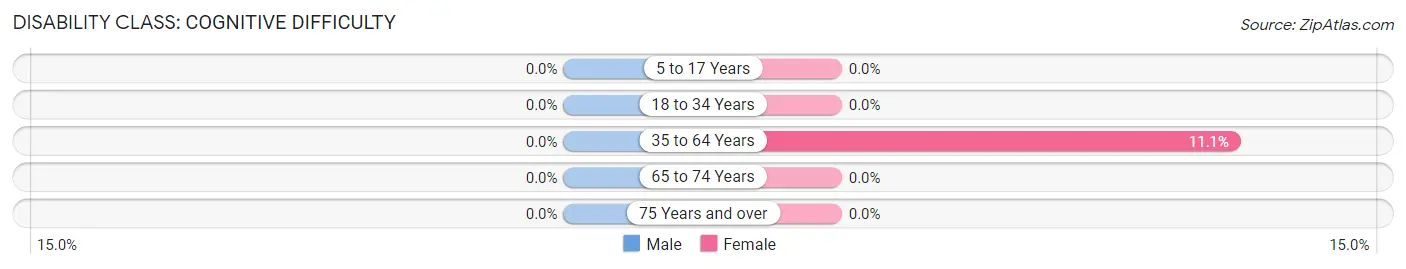
| Age Bracket | Male | Female |
| 5 to 17 Years | 0 (0.0%) | 0 (0.0%) |
| 18 to 34 Years | 0 (0.0%) | 0 (0.0%) |
| 35 to 64 Years | 0 (0.0%) | 17 (11.1%) |
| 65 to 74 Years | 0 (0.0%) | 0 (0.0%) |
| 75 Years and over | 0 (0.0%) | 0 (0.0%) |
Disability Class: Ambulatory Difficulty
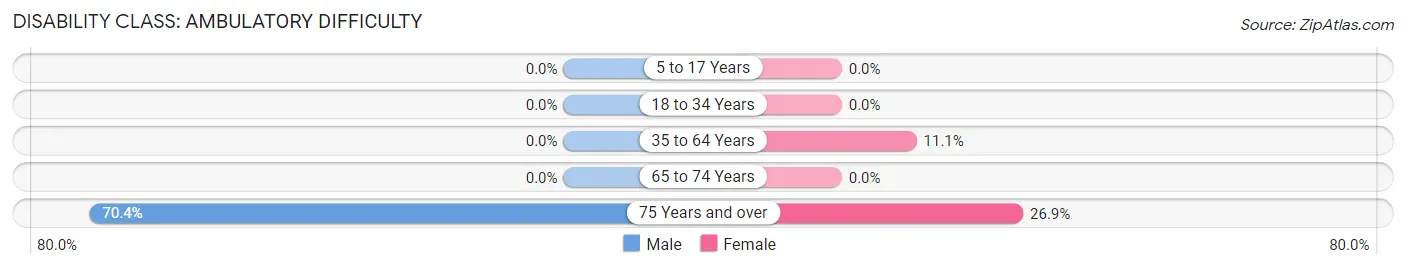
| Age Bracket | Male | Female |
| 5 to 17 Years | 0 (0.0%) | 0 (0.0%) |
| 18 to 34 Years | 0 (0.0%) | 0 (0.0%) |
| 35 to 64 Years | 0 (0.0%) | 17 (11.1%) |
| 65 to 74 Years | 0 (0.0%) | 0 (0.0%) |
| 75 Years and over | 19 (70.4%) | 7 (26.9%) |
Disability Class: Self-Care Difficulty
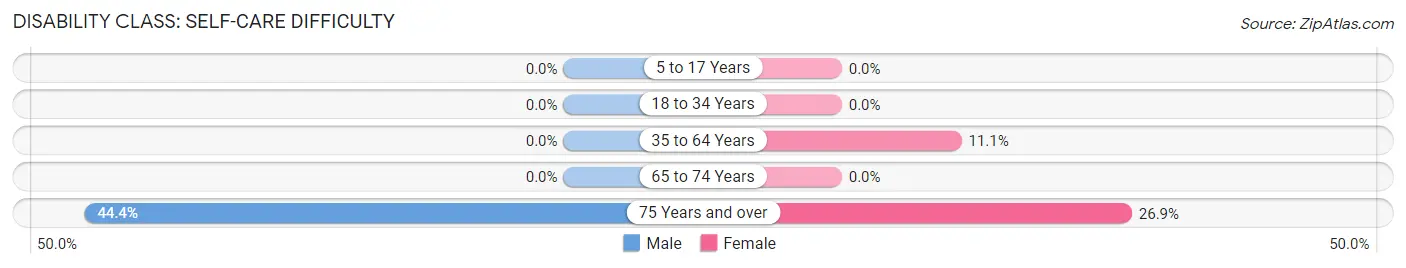
| Age Bracket | Male | Female |
| 5 to 17 Years | 0 (0.0%) | 0 (0.0%) |
| 18 to 34 Years | 0 (0.0%) | 0 (0.0%) |
| 35 to 64 Years | 0 (0.0%) | 17 (11.1%) |
| 65 to 74 Years | 0 (0.0%) | 0 (0.0%) |
| 75 Years and over | 12 (44.4%) | 7 (26.9%) |
Technology Access in Marshallberg
Computing Device Access in Marshallberg
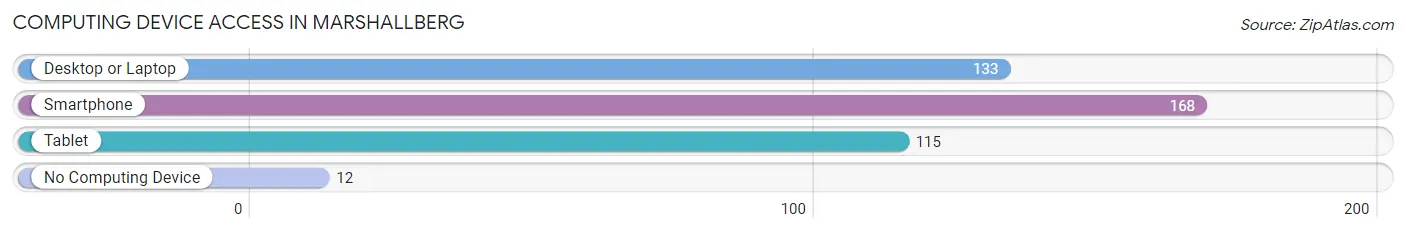
| Device Type | # Households | % Households |
| Desktop or Laptop | 133 | 69.6% |
| Smartphone | 168 | 88.0% |
| Tablet | 115 | 60.2% |
| No Computing Device | 12 | 6.3% |
| Total | 191 | 100.0% |
Internet Access in Marshallberg
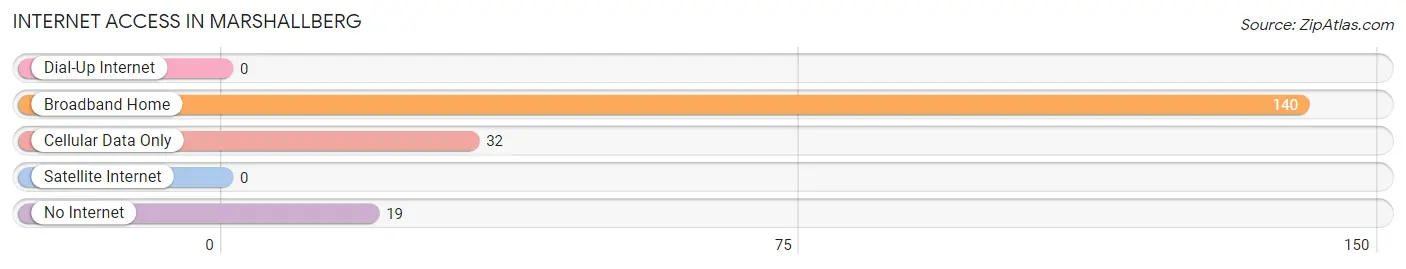
| Internet Type | # Households | % Households |
| Dial-Up Internet | 0 | 0.0% |
| Broadband Home | 140 | 73.3% |
| Cellular Data Only | 32 | 16.8% |
| Satellite Internet | 0 | 0.0% |
| No Internet | 19 | 10.0% |
| Total | 191 | 100.0% |
Marshallberg Summary
Marshallberg is a small unincorporated community located in Carteret County, North Carolina. It is situated on the western shore of Core Sound, a large estuary that separates the mainland from the Outer Banks. The community is located approximately 30 miles northeast of Morehead City and is part of the Crystal Coast region.
History
Marshallberg was first settled in the late 1700s by a group of fishermen and farmers from the mainland. The community was named after a local family, the Marshalls, who owned a large tract of land in the area. The first post office was established in 1883 and the town was incorporated in 1891.
In the early 1900s, Marshallberg was a thriving fishing village. The town was home to several fish houses, a cannery, and a fish market. The town also had a school, a church, and a general store.
In the 1950s, the fishing industry began to decline and the town’s population began to dwindle. In the 1970s, the town was revitalized by the development of a marina and a seafood processing plant. The marina and seafood plant remain in operation today.
Geography
Marshallberg is located on the western shore of Core Sound, a large estuary that separates the mainland from the Outer Banks. The town is situated on a peninsula that juts out into the sound. The town is surrounded by marshland and is bordered by the Atlantic Ocean to the east.
The town is located approximately 30 miles northeast of Morehead City and is part of the Crystal Coast region. The town is accessible by boat or by car via NC Highway 12.
Economy
The economy of Marshallberg is largely based on fishing and seafood processing. The town is home to several fish houses, a cannery, and a fish market. The town also has a marina and a seafood processing plant.
The town is also home to several small businesses, including a grocery store, a hardware store, and a restaurant.
Demographics
As of the 2010 census, the population of Marshallberg was 1,092. The racial makeup of the town was 94.3% White, 2.2% African American, 0.7% Native American, 0.7% Asian, 0.2% Pacific Islander, and 1.9% from other races.
The median household income in Marshallberg was $37,917, and the median family income was $45,313. The per capita income was $19,945. About 11.3% of families and 14.2% of the population were below the poverty line.
Conclusion
Marshallberg is a small unincorporated community located in Carteret County, North Carolina. It is situated on the western shore of Core Sound, a large estuary that separates the mainland from the Outer Banks. The town is home to several fish houses, a cannery, and a fish market. The town also has a marina and a seafood processing plant. The economy of Marshallberg is largely based on fishing and seafood processing. As of the 2010 census, the population of Marshallberg was 1,092. The median household income in Marshallberg was $37,917, and the median family income was $45,313. The town is a popular destination for fishing and other outdoor activities.
Common Questions
What is Per Capita Income in Marshallberg?
Per Capita income in Marshallberg is $47,036.
What is the Median Family Income in Marshallberg?
Median Family Income in Marshallberg is $125,089.
What is the Median Household income in Marshallberg?
Median Household Income in Marshallberg is $83,221.
What is Inequality or Gini Index in Marshallberg?
Inequality or Gini Index in Marshallberg is 0.46.
What is the Total Population of Marshallberg?
Total Population of Marshallberg is 430.
What is the Total Male Population of Marshallberg?
Total Male Population of Marshallberg is 209.
What is the Total Female Population of Marshallberg?
Total Female Population of Marshallberg is 221.
What is the Ratio of Males per 100 Females in Marshallberg?
There are 94.57 Males per 100 Females in Marshallberg.
What is the Ratio of Females per 100 Males in Marshallberg?
There are 105.74 Females per 100 Males in Marshallberg.
What is the Median Population Age in Marshallberg?
Median Population Age in Marshallberg is 56.0 Years.
What is the Average Family Size in Marshallberg
Average Family Size in Marshallberg is 2.2 People.
What is the Average Household Size in Marshallberg
Average Household Size in Marshallberg is 2.2 People.
How Large is the Labor Force in Marshallberg?
There are 273 People in the Labor Forcein in Marshallberg.
What is the Percentage of People in the Labor Force in Marshallberg?
68.1% of People are in the Labor Force in Marshallberg.
What is the Unemployment Rate in Marshallberg?
Unemployment Rate in Marshallberg is 3.7%.