Rockingham, NC Map & Demographics
Rockingham Map
Rockingham Overview
$25,836
PER CAPITA INCOME
$58,448
AVG FAMILY INCOME
$38,750
AVG HOUSEHOLD INCOME
51.2%
WAGE / INCOME GAP [ % ]
48.8¢/ $1
WAGE / INCOME GAP [ $ ]
0.48
INEQUALITY / GINI INDEX
9,174
TOTAL POPULATION
4,296
MALE POPULATION
4,878
FEMALE POPULATION
88.07
MALES / 100 FEMALES
113.55
FEMALES / 100 MALES
40.0
MEDIAN AGE
3.1
AVG FAMILY SIZE
2.4
AVG HOUSEHOLD SIZE
4,201
LABOR FORCE [ PEOPLE ]
59.2%
PERCENT IN LABOR FORCE
7.2%
UNEMPLOYMENT RATE
Rockingham Zip Codes
Rockingham Area Codes
Income in Rockingham
Income Overview in Rockingham
Per Capita Income in Rockingham is $25,836, while median incomes of families and households are $58,448 and $38,750 respectively.
| Characteristic | Number | Measure |
| Per Capita Income | 9,174 | $25,836 |
| Median Family Income | 2,330 | $58,448 |
| Mean Family Income | 2,330 | $67,432 |
| Median Household Income | 3,820 | $38,750 |
| Mean Household Income | 3,820 | $55,756 |
| Income Deficit | 2,330 | $0 |
| Wage / Income Gap (%) | 9,174 | 51.24% |
| Wage / Income Gap ($) | 9,174 | 48.76¢ per $1 |
| Gini / Inequality Index | 9,174 | 0.48 |
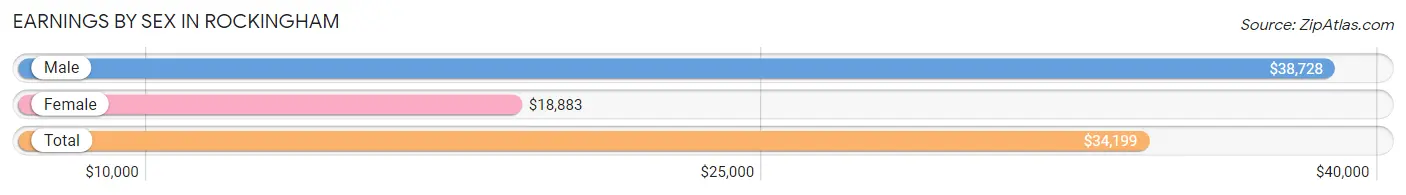
Earnings by Sex in Rockingham
Average Earnings in Rockingham are $34,199, $38,728 for men and $18,883 for women, a difference of 51.2%.
| Sex | Number | Average Earnings |
| Male | 2,103 (50.3%) | $38,728 |
| Female | 2,081 (49.7%) | $18,883 |
| Total | 4,184 (100.0%) | $34,199 |
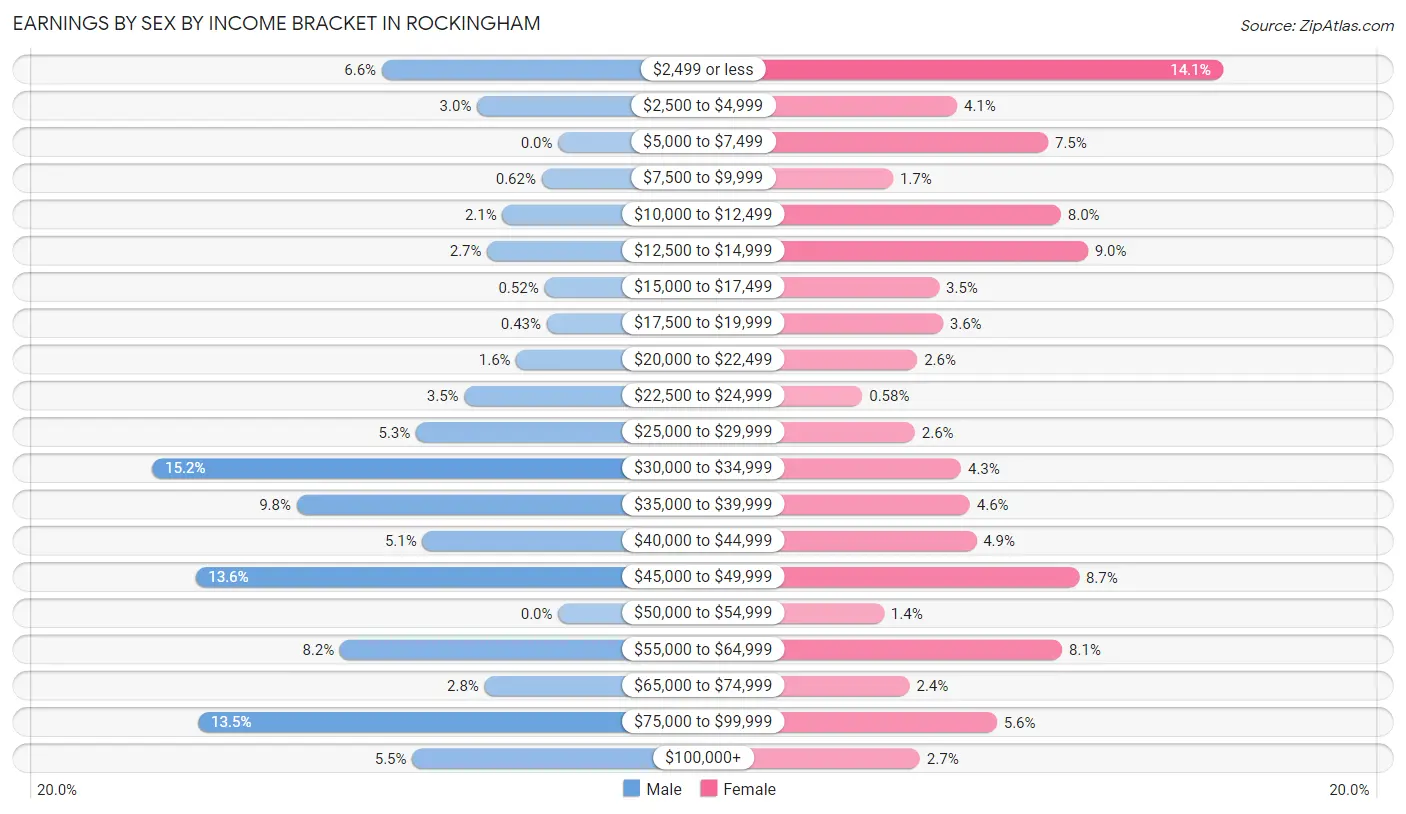
Earnings by Sex by Income Bracket in Rockingham
The most common earnings brackets in Rockingham are $30,000 to $34,999 for men (320 | 15.2%) and $2,499 or less for women (293 | 14.1%).
| Income | Male | Female |
| $2,499 or less | 139 (6.6%) | 293 (14.1%) |
| $2,500 to $4,999 | 64 (3.0%) | 86 (4.1%) |
| $5,000 to $7,499 | 0 (0.0%) | 157 (7.5%) |
| $7,500 to $9,999 | 13 (0.6%) | 36 (1.7%) |
| $10,000 to $12,499 | 44 (2.1%) | 167 (8.0%) |
| $12,500 to $14,999 | 56 (2.7%) | 188 (9.0%) |
| $15,000 to $17,499 | 11 (0.5%) | 72 (3.5%) |
| $17,500 to $19,999 | 9 (0.4%) | 75 (3.6%) |
| $20,000 to $22,499 | 33 (1.6%) | 55 (2.6%) |
| $22,500 to $24,999 | 74 (3.5%) | 12 (0.6%) |
| $25,000 to $29,999 | 112 (5.3%) | 53 (2.5%) |
| $30,000 to $34,999 | 320 (15.2%) | 89 (4.3%) |
| $35,000 to $39,999 | 206 (9.8%) | 96 (4.6%) |
| $40,000 to $44,999 | 107 (5.1%) | 101 (4.9%) |
| $45,000 to $49,999 | 286 (13.6%) | 181 (8.7%) |
| $50,000 to $54,999 | 0 (0.0%) | 29 (1.4%) |
| $55,000 to $64,999 | 172 (8.2%) | 168 (8.1%) |
| $65,000 to $74,999 | 58 (2.8%) | 49 (2.4%) |
| $75,000 to $99,999 | 284 (13.5%) | 117 (5.6%) |
| $100,000+ | 115 (5.5%) | 57 (2.7%) |
| Total | 2,103 (100.0%) | 2,081 (100.0%) |
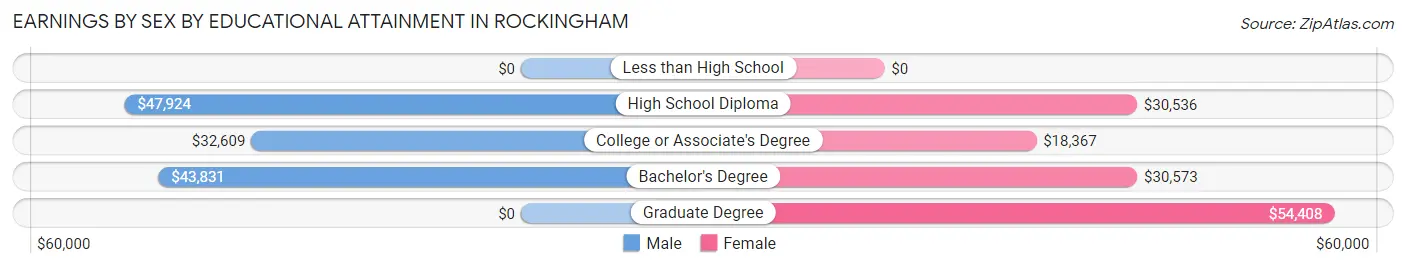
Earnings by Sex by Educational Attainment in Rockingham
Average earnings in Rockingham are $40,370 for men and $21,091 for women, a difference of 47.8%. Men with an educational attainment of high school diploma enjoy the highest average annual earnings of $47,924, while those with college or associate's degree education earn the least with $32,609. Women with an educational attainment of graduate degree earn the most with the average annual earnings of $54,408, while those with college or associate's degree education have the smallest earnings of $18,367.
| Educational Attainment | Male Income | Female Income |
| Less than High School | - | - |
| High School Diploma | $47,924 | $30,536 |
| College or Associate's Degree | $32,609 | $18,367 |
| Bachelor's Degree | $43,831 | $30,573 |
| Graduate Degree | - | - |
| Total | $40,370 | $21,091 |
Family Income in Rockingham
Family Income Brackets in Rockingham
According to the Rockingham family income data, there are 412 families falling into the $75,000 to $99,999 income range, which is the most common income bracket and makes up 17.7% of all families. Conversely, the $150,000 to $199,999 income bracket is the least frequent group with only 40 families (1.7%) belonging to this category.
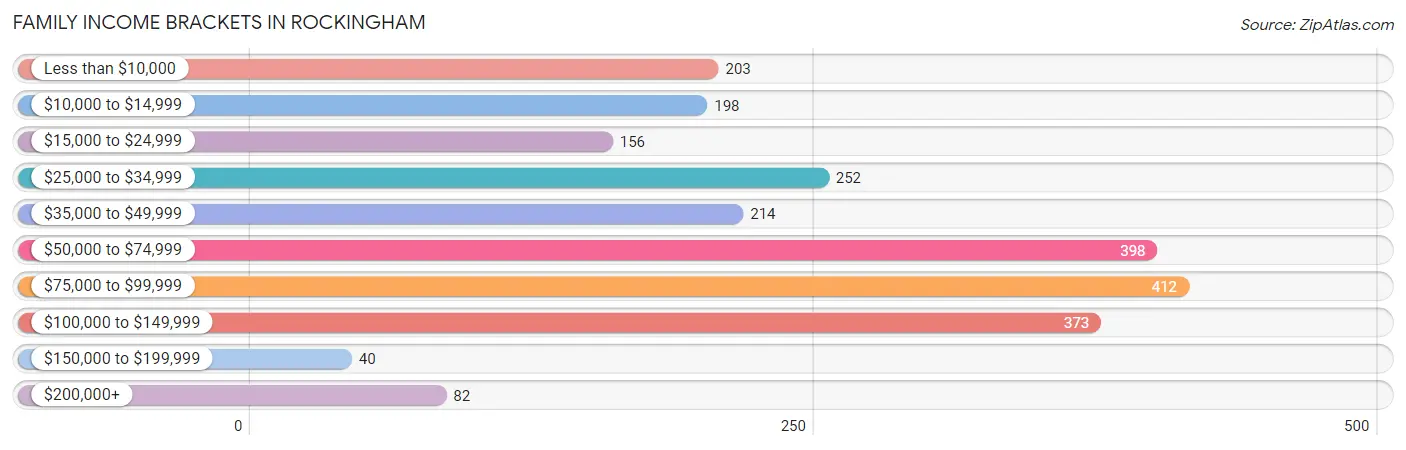
| Income Bracket | # Families | % Families |
| Less than $10,000 | 203 | 8.7% |
| $10,000 to $14,999 | 198 | 8.5% |
| $15,000 to $24,999 | 156 | 6.7% |
| $25,000 to $34,999 | 252 | 10.8% |
| $35,000 to $49,999 | 214 | 9.2% |
| $50,000 to $74,999 | 398 | 17.1% |
| $75,000 to $99,999 | 412 | 17.7% |
| $100,000 to $149,999 | 373 | 16.0% |
| $150,000 to $199,999 | 40 | 1.7% |
| $200,000+ | 82 | 3.5% |
Family Income by Famaliy Size in Rockingham
2-person families (1,266 | 54.3%) account for the highest median family income in Rockingham with $59,403 per family, while 2-person families (1,266 | 54.3%) have the highest median income of $29,702 per family member.
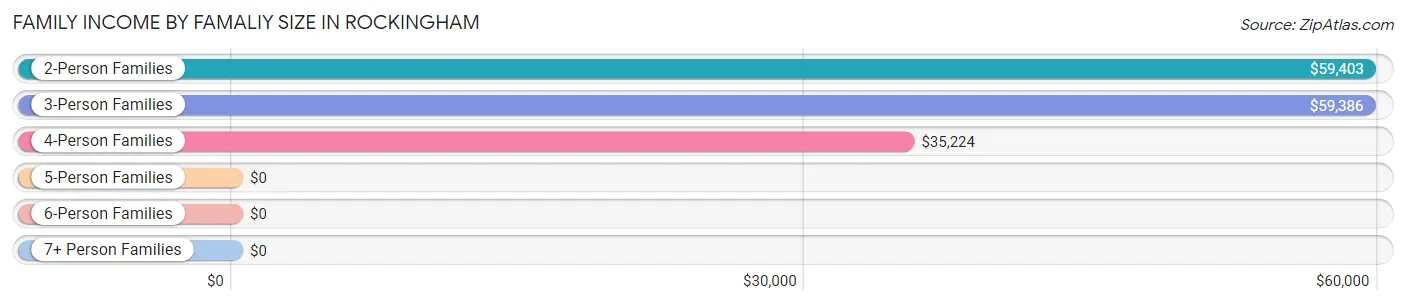
| Income Bracket | # Families | Median Income |
| 2-Person Families | 1,266 (54.3%) | $59,403 |
| 3-Person Families | 582 (25.0%) | $59,386 |
| 4-Person Families | 273 (11.7%) | $35,224 |
| 5-Person Families | 209 (9.0%) | $0 |
| 6-Person Families | 0 (0.0%) | $0 |
| 7+ Person Families | 0 (0.0%) | $0 |
| Total | 2,330 (100.0%) | $58,448 |
Family Income by Number of Earners in Rockingham
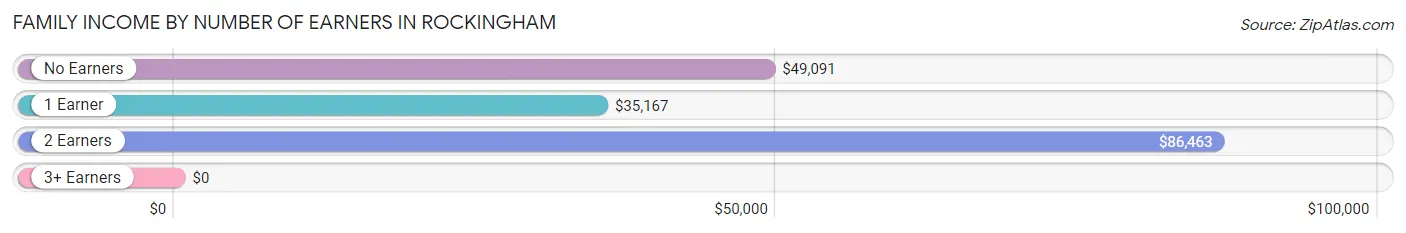
| Number of Earners | # Families | Median Income |
| No Earners | 486 (20.9%) | $49,091 |
| 1 Earner | 906 (38.9%) | $35,167 |
| 2 Earners | 861 (36.9%) | $86,463 |
| 3+ Earners | 77 (3.3%) | $0 |
| Total | 2,330 (100.0%) | $58,448 |
Household Income in Rockingham
Household Income Brackets in Rockingham
With 607 households falling in the category, the $10,000 to $14,999 income range is the most frequent in Rockingham, accounting for 15.9% of all households. In contrast, only 57 households (1.5%) fall into the $150,000 to $199,999 income bracket, making it the least populous group.
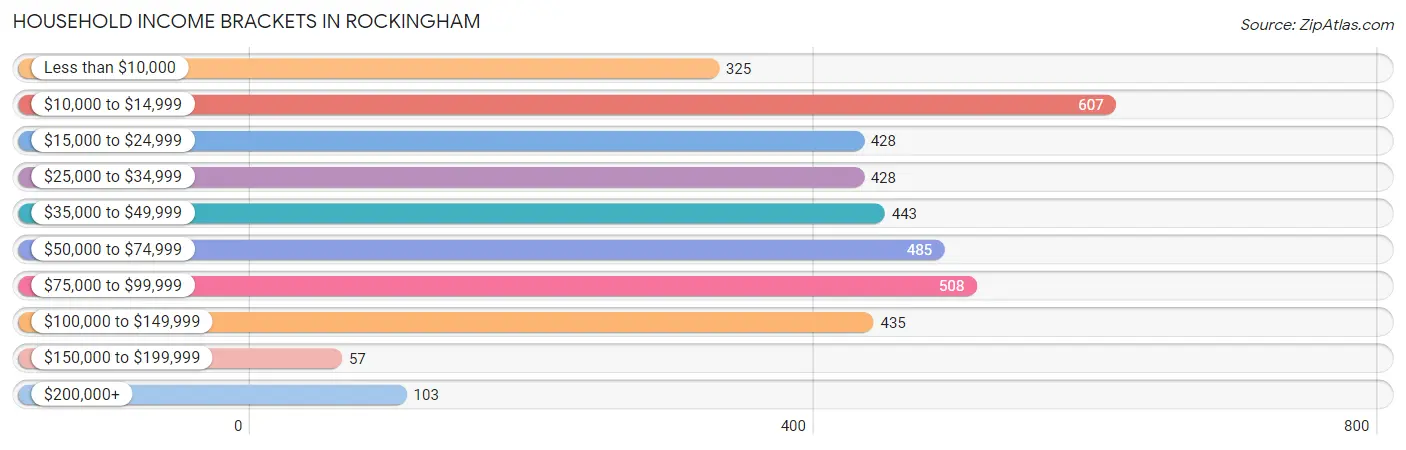
| Income Bracket | # Households | % Households |
| Less than $10,000 | 325 | 8.5% |
| $10,000 to $14,999 | 607 | 15.9% |
| $15,000 to $24,999 | 428 | 11.2% |
| $25,000 to $34,999 | 428 | 11.2% |
| $35,000 to $49,999 | 443 | 11.6% |
| $50,000 to $74,999 | 485 | 12.7% |
| $75,000 to $99,999 | 508 | 13.3% |
| $100,000 to $149,999 | 435 | 11.4% |
| $150,000 to $199,999 | 57 | 1.5% |
| $200,000+ | 103 | 2.7% |
Household Income by Householder Age in Rockingham
The median household income in Rockingham is $38,750, with the highest median household income of $58,412 found in the 45 to 64 years age bracket for the primary householder. A total of 1,457 households (38.1%) fall into this category. Meanwhile, the 15 to 24 years age bracket for the primary householder has the lowest median household income of $0, with 197 households (5.2%) in this group.
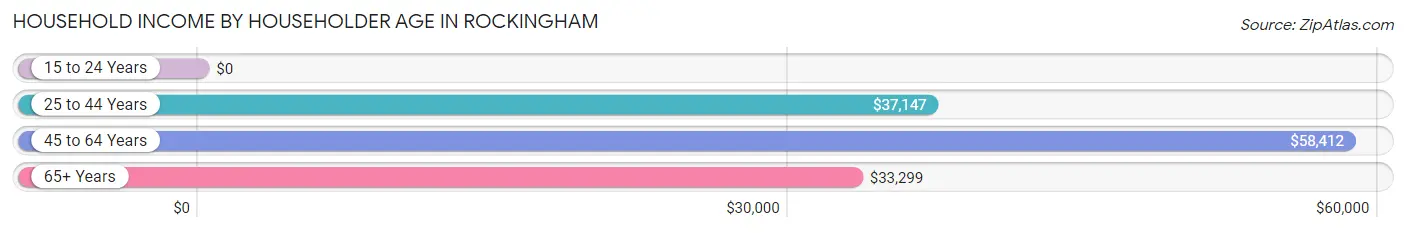
| Income Bracket | # Households | Median Income |
| 15 to 24 Years | 197 (5.2%) | $0 |
| 25 to 44 Years | 1,001 (26.2%) | $37,147 |
| 45 to 64 Years | 1,457 (38.1%) | $58,412 |
| 65+ Years | 1,165 (30.5%) | $33,299 |
| Total | 3,820 (100.0%) | $38,750 |
Poverty in Rockingham
Income Below Poverty by Sex and Age in Rockingham
With 20.8% poverty level for males and 34.6% for females among the residents of Rockingham, 5 year old males and 15 year old females are the most vulnerable to poverty, with 52 males (100.0%) and 75 females (69.4%) in their respective age groups living below the poverty level.
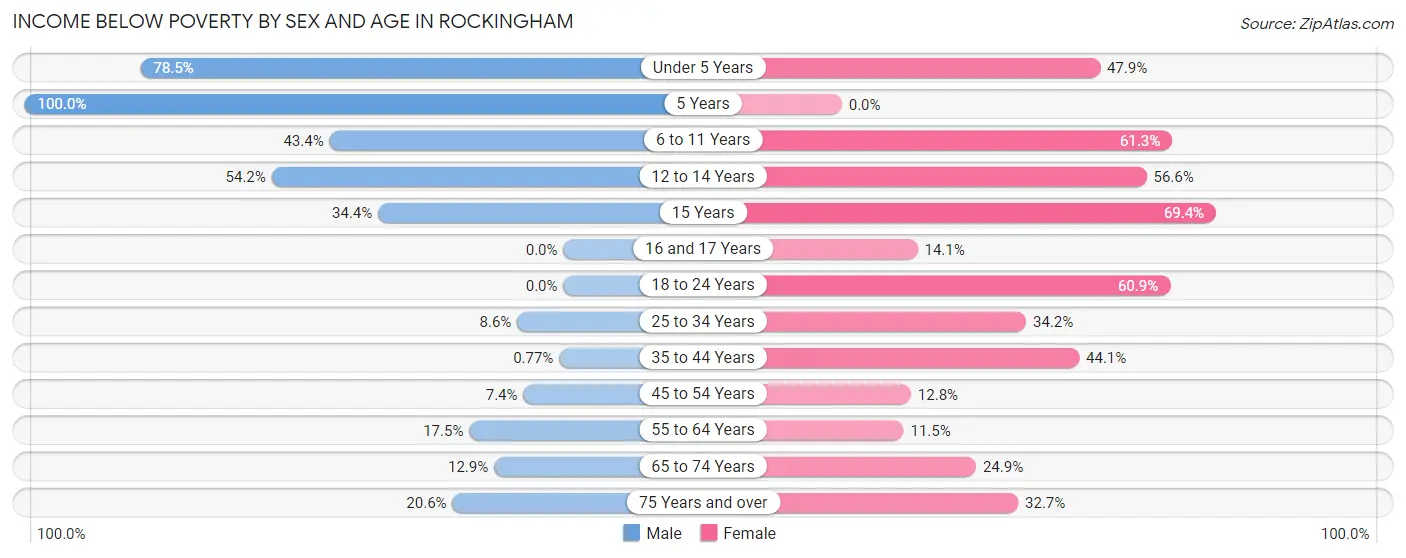
| Age Bracket | Male | Female |
| Under 5 Years | 157 (78.5%) | 150 (47.9%) |
| 5 Years | 52 (100.0%) | 0 (0.0%) |
| 6 to 11 Years | 201 (43.4%) | 263 (61.3%) |
| 12 to 14 Years | 137 (54.1%) | 99 (56.6%) |
| 15 Years | 11 (34.4%) | 75 (69.4%) |
| 16 and 17 Years | 0 (0.0%) | 9 (14.1%) |
| 18 to 24 Years | 0 (0.0%) | 173 (60.9%) |
| 25 to 34 Years | 52 (8.6%) | 220 (34.2%) |
| 35 to 44 Years | 3 (0.8%) | 237 (44.1%) |
| 45 to 54 Years | 32 (7.4%) | 69 (12.8%) |
| 55 to 64 Years | 109 (17.5%) | 81 (11.5%) |
| 65 to 74 Years | 58 (12.9%) | 136 (24.9%) |
| 75 Years and over | 56 (20.6%) | 145 (32.7%) |
| Total | 868 (20.8%) | 1,657 (34.6%) |
Income Above Poverty by Sex and Age in Rockingham
According to the poverty statistics in Rockingham, males aged 16 and 17 years and females aged 55 to 64 years are the age groups that are most secure financially, with 100.0% of males and 88.5% of females in these age groups living above the poverty line.
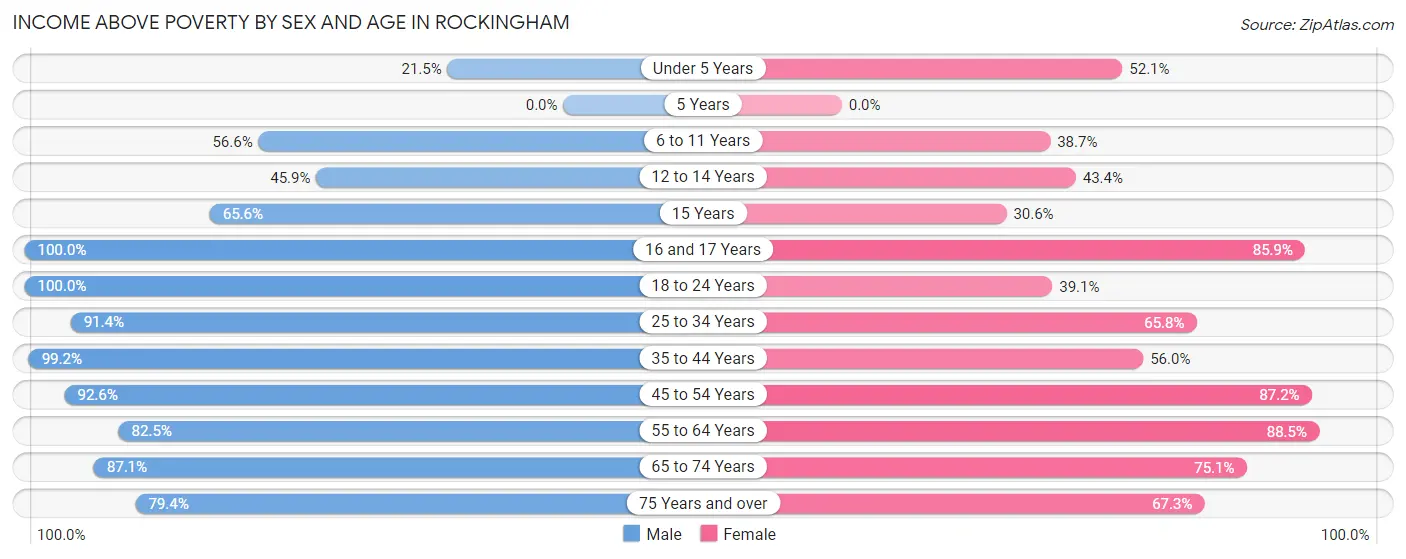
| Age Bracket | Male | Female |
| Under 5 Years | 43 (21.5%) | 163 (52.1%) |
| 5 Years | 0 (0.0%) | 0 (0.0%) |
| 6 to 11 Years | 262 (56.6%) | 166 (38.7%) |
| 12 to 14 Years | 116 (45.9%) | 76 (43.4%) |
| 15 Years | 21 (65.6%) | 33 (30.6%) |
| 16 and 17 Years | 53 (100.0%) | 55 (85.9%) |
| 18 to 24 Years | 347 (100.0%) | 111 (39.1%) |
| 25 to 34 Years | 555 (91.4%) | 423 (65.8%) |
| 35 to 44 Years | 385 (99.2%) | 301 (55.9%) |
| 45 to 54 Years | 399 (92.6%) | 469 (87.2%) |
| 55 to 64 Years | 515 (82.5%) | 626 (88.5%) |
| 65 to 74 Years | 393 (87.1%) | 410 (75.1%) |
| 75 Years and over | 216 (79.4%) | 298 (67.3%) |
| Total | 3,305 (79.2%) | 3,131 (65.4%) |
Income Below Poverty Among Married-Couple Families in Rockingham
The poverty statistics for married-couple families in Rockingham show that 4.4% or 58 of the total 1,318 families live below the poverty line. Families with 1 or 2 children have the highest poverty rate of 10.3%, comprising of 36 families. On the other hand, families with 3 or 4 children have the lowest poverty rate of 0.0%, which includes 0 families.
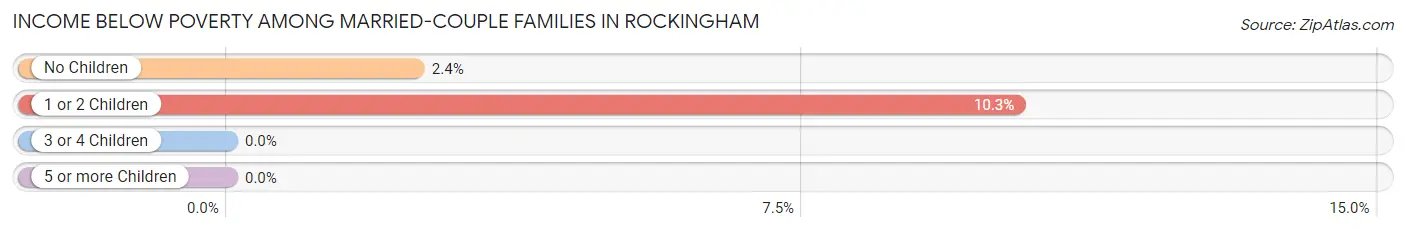
| Children | Above Poverty | Below Poverty |
| No Children | 878 (97.6%) | 22 (2.4%) |
| 1 or 2 Children | 314 (89.7%) | 36 (10.3%) |
| 3 or 4 Children | 68 (100.0%) | 0 (0.0%) |
| 5 or more Children | 0 (0.0%) | 0 (0.0%) |
| Total | 1,260 (95.6%) | 58 (4.4%) |
Income Below Poverty Among Single-Parent Households in Rockingham
According to the poverty data in Rockingham, 21.4% or 52 single-father households and 58.5% or 450 single-mother households are living below the poverty line. Among single-father households, those with 1 or 2 children have the highest poverty rate, with 52 households (37.1%) experiencing poverty. Likewise, among single-mother households, those with 3 or 4 children have the highest poverty rate, with 213 households (100.0%) falling below the poverty line.
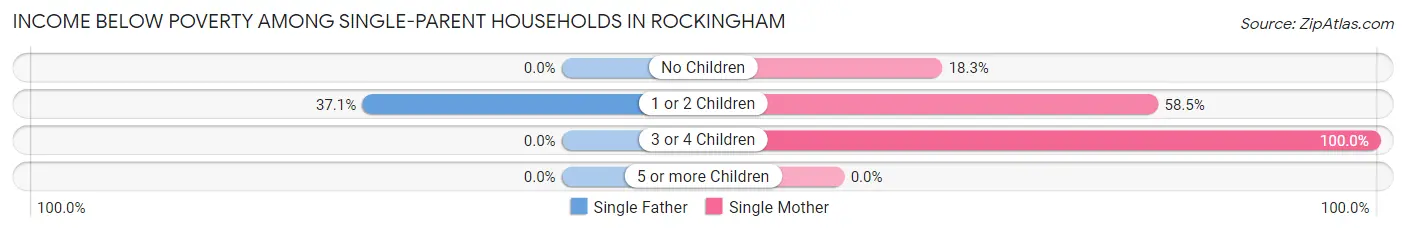
| Children | Single Father | Single Mother |
| No Children | 0 (0.0%) | 40 (18.3%) |
| 1 or 2 Children | 52 (37.1%) | 197 (58.5%) |
| 3 or 4 Children | 0 (0.0%) | 213 (100.0%) |
| 5 or more Children | 0 (0.0%) | 0 (0.0%) |
| Total | 52 (21.4%) | 450 (58.5%) |
Income Below Poverty Among Married-Couple vs Single-Parent Households in Rockingham
The poverty data for Rockingham shows that 58 of the married-couple family households (4.4%) and 502 of the single-parent households (49.6%) are living below the poverty level. Within the married-couple family households, those with 1 or 2 children have the highest poverty rate, with 36 households (10.3%) falling below the poverty line. Among the single-parent households, those with 3 or 4 children have the highest poverty rate, with 213 household (100.0%) living below poverty.
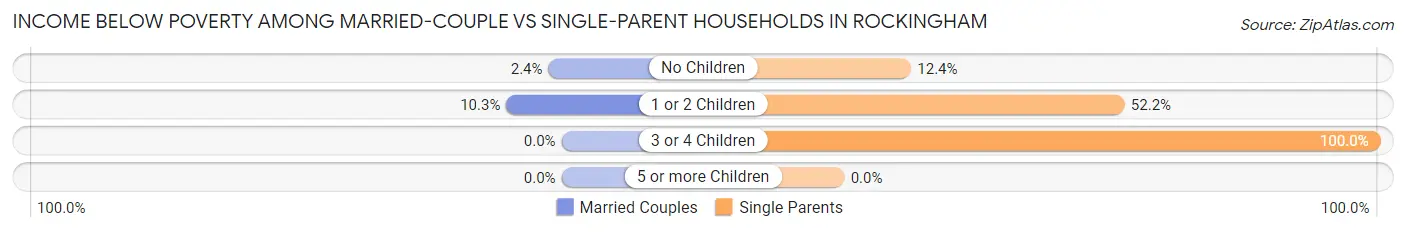
| Children | Married-Couple Families | Single-Parent Households |
| No Children | 22 (2.4%) | 40 (12.4%) |
| 1 or 2 Children | 36 (10.3%) | 249 (52.2%) |
| 3 or 4 Children | 0 (0.0%) | 213 (100.0%) |
| 5 or more Children | 0 (0.0%) | 0 (0.0%) |
| Total | 58 (4.4%) | 502 (49.6%) |
Race in Rockingham
The most populous races in Rockingham are White / Caucasian (5,279 | 57.5%), Black / African American (3,256 | 35.5%), and Hispanic or Latino (827 | 9.0%).
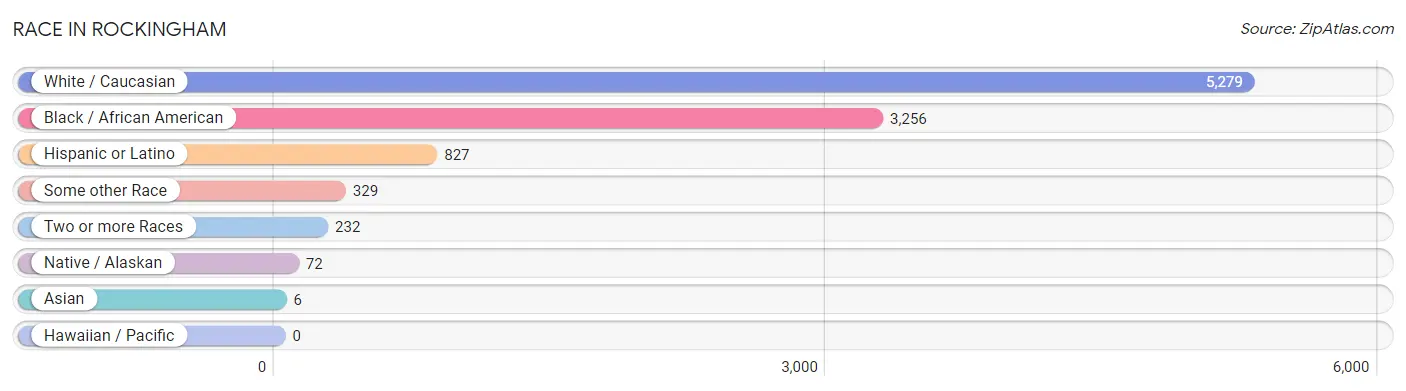
| Race | # Population | % Population |
| Asian | 6 | 0.1% |
| Black / African American | 3,256 | 35.5% |
| Hawaiian / Pacific | 0 | 0.0% |
| Hispanic or Latino | 827 | 9.0% |
| Native / Alaskan | 72 | 0.8% |
| White / Caucasian | 5,279 | 57.5% |
| Two or more Races | 232 | 2.5% |
| Some other Race | 329 | 3.6% |
| Total | 9,174 | 100.0% |
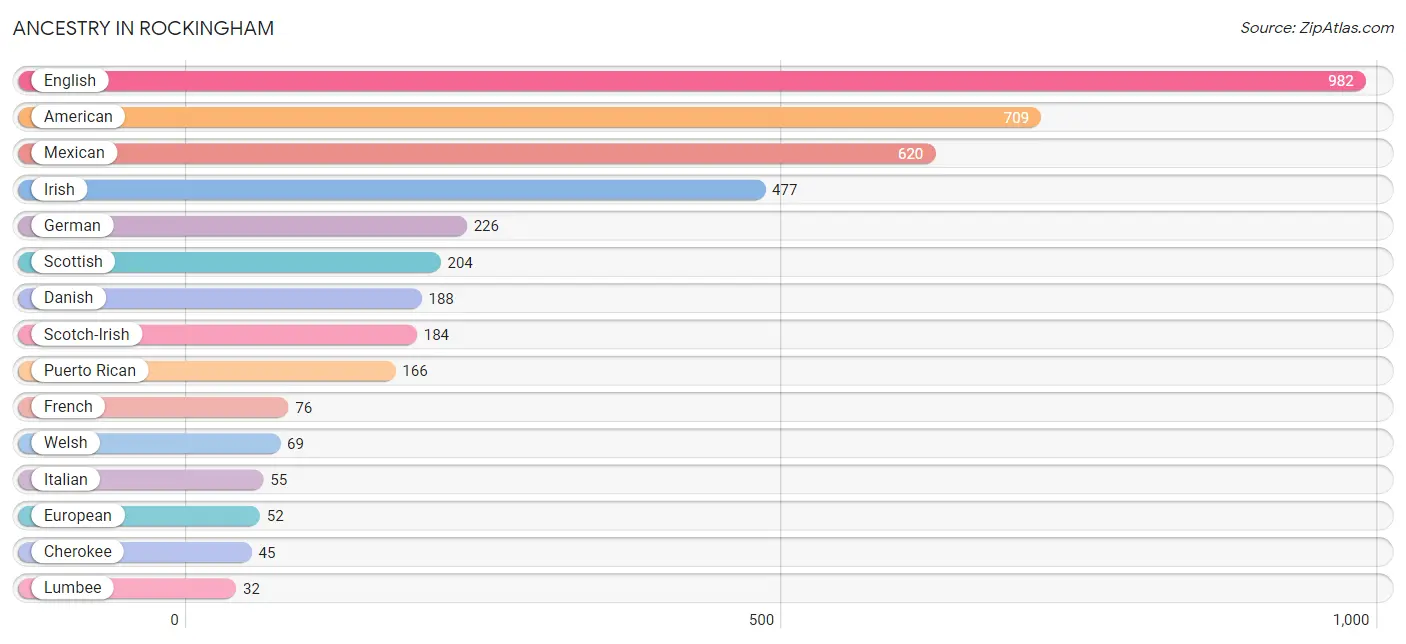
Ancestry in Rockingham
The most populous ancestries reported in Rockingham are English (982 | 10.7%), American (709 | 7.7%), Mexican (620 | 6.8%), Irish (477 | 5.2%), and German (226 | 2.5%), together accounting for 32.9% of all Rockingham residents.
| Ancestry | # Population | % Population |
| African | 8 | 0.1% |
| American | 709 | 7.7% |
| British | 18 | 0.2% |
| Central American | 29 | 0.3% |
| Cherokee | 45 | 0.5% |
| Danish | 188 | 2.1% |
| Dutch | 11 | 0.1% |
| English | 982 | 10.7% |
| European | 52 | 0.6% |
| Finnish | 12 | 0.1% |
| French | 76 | 0.8% |
| French Canadian | 16 | 0.2% |
| German | 226 | 2.5% |
| Greek | 27 | 0.3% |
| Hungarian | 12 | 0.1% |
| Irish | 477 | 5.2% |
| Italian | 55 | 0.6% |
| Jamaican | 1 | 0.0% |
| Lumbee | 32 | 0.4% |
| Mexican | 620 | 6.8% |
| Northern European | 9 | 0.1% |
| Polish | 16 | 0.2% |
| Puerto Rican | 166 | 1.8% |
| Salvadoran | 29 | 0.3% |
| Scandinavian | 8 | 0.1% |
| Scotch-Irish | 184 | 2.0% |
| Scottish | 204 | 2.2% |
| Subsaharan African | 8 | 0.1% |
| Thai | 6 | 0.1% |
| Tohono O'Odham | 21 | 0.2% |
| Ukrainian | 8 | 0.1% |
| Welsh | 69 | 0.7% | View All 32 Rows |
Immigrants in Rockingham
The most numerous immigrant groups reported in Rockingham came from Latin America (282 | 3.1%), Central America (254 | 2.8%), Mexico (254 | 2.8%), South America (28 | 0.3%), and Guyana (22 | 0.2%), together accounting for 9.2% of all Rockingham residents.
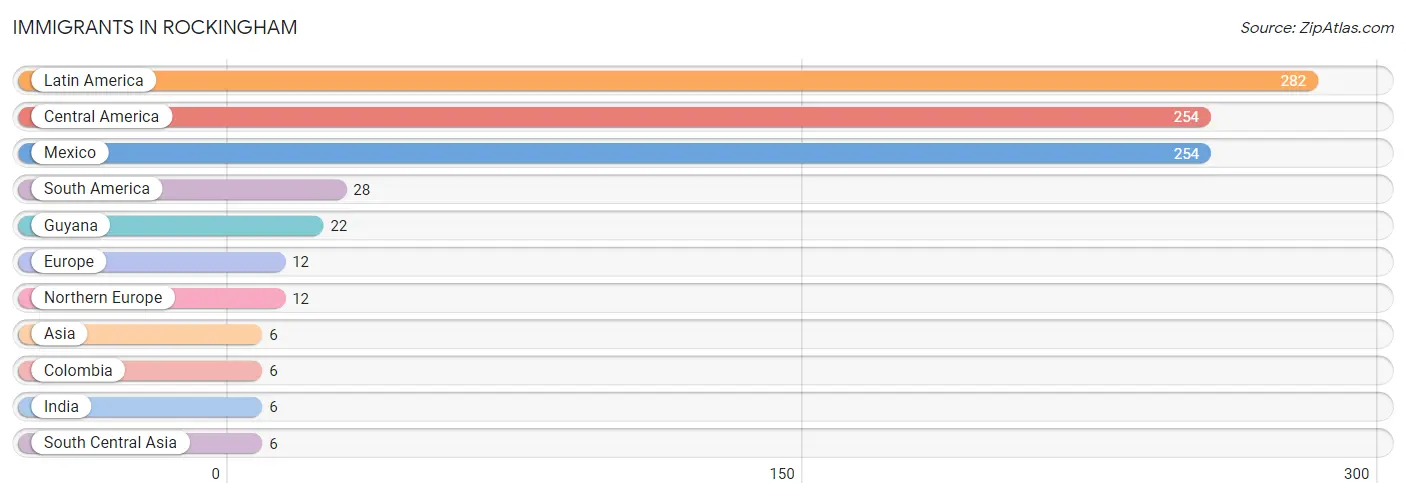
| Immigration Origin | # Population | % Population |
| Asia | 6 | 0.1% |
| Central America | 254 | 2.8% |
| Colombia | 6 | 0.1% |
| Europe | 12 | 0.1% |
| Guyana | 22 | 0.2% |
| India | 6 | 0.1% |
| Latin America | 282 | 3.1% |
| Mexico | 254 | 2.8% |
| Northern Europe | 12 | 0.1% |
| South America | 28 | 0.3% |
| South Central Asia | 6 | 0.1% | View All 11 Rows |
Sex and Age in Rockingham
Sex and Age in Rockingham
The most populous age groups in Rockingham are 10 to 14 Years (467 | 10.9%) for men and 10 to 14 Years (543 | 11.1%) for women.
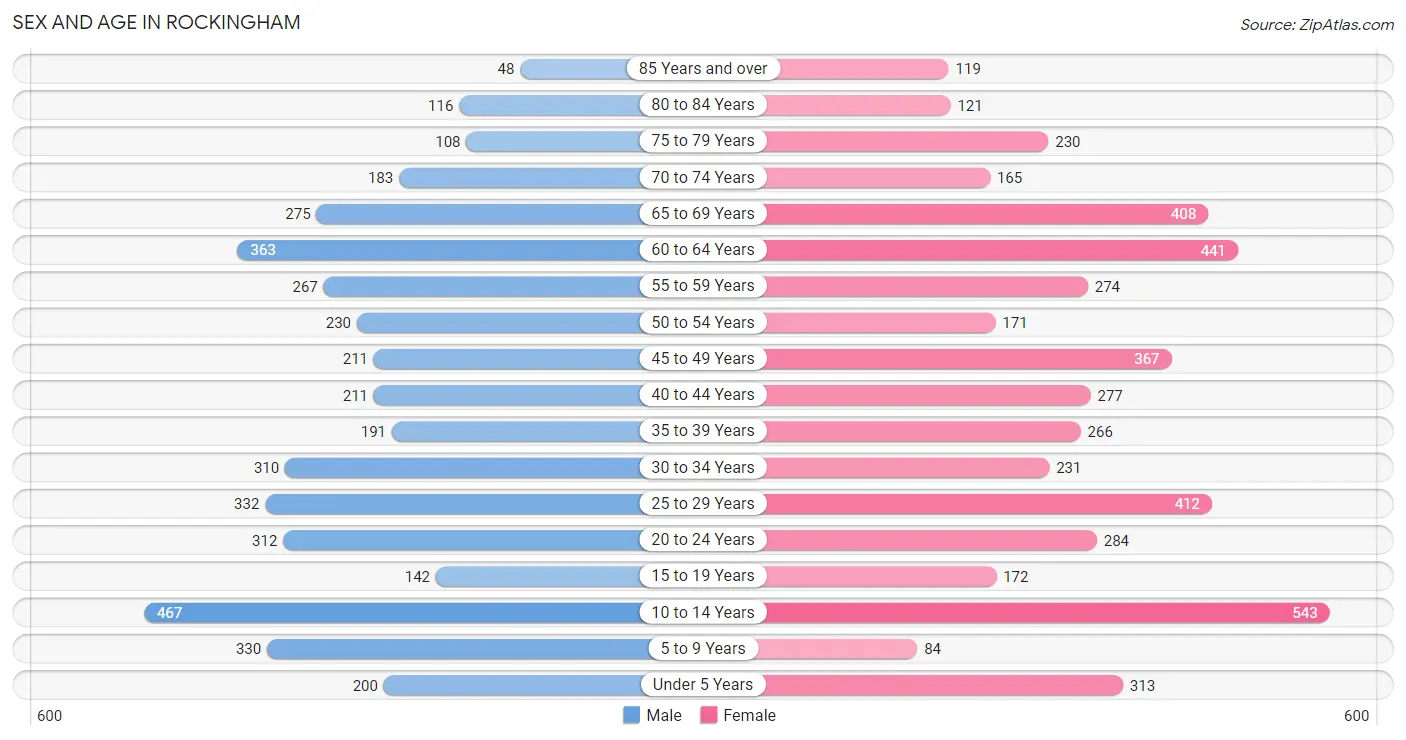
| Age Bracket | Male | Female |
| Under 5 Years | 200 (4.7%) | 313 (6.4%) |
| 5 to 9 Years | 330 (7.7%) | 84 (1.7%) |
| 10 to 14 Years | 467 (10.9%) | 543 (11.1%) |
| 15 to 19 Years | 142 (3.3%) | 172 (3.5%) |
| 20 to 24 Years | 312 (7.3%) | 284 (5.8%) |
| 25 to 29 Years | 332 (7.7%) | 412 (8.5%) |
| 30 to 34 Years | 310 (7.2%) | 231 (4.7%) |
| 35 to 39 Years | 191 (4.4%) | 266 (5.4%) |
| 40 to 44 Years | 211 (4.9%) | 277 (5.7%) |
| 45 to 49 Years | 211 (4.9%) | 367 (7.5%) |
| 50 to 54 Years | 230 (5.3%) | 171 (3.5%) |
| 55 to 59 Years | 267 (6.2%) | 274 (5.6%) |
| 60 to 64 Years | 363 (8.5%) | 441 (9.0%) |
| 65 to 69 Years | 275 (6.4%) | 408 (8.4%) |
| 70 to 74 Years | 183 (4.3%) | 165 (3.4%) |
| 75 to 79 Years | 108 (2.5%) | 230 (4.7%) |
| 80 to 84 Years | 116 (2.7%) | 121 (2.5%) |
| 85 Years and over | 48 (1.1%) | 119 (2.4%) |
| Total | 4,296 (100.0%) | 4,878 (100.0%) |
Families and Households in Rockingham
Median Family Size in Rockingham
The median family size in Rockingham is 3.07 persons per family, with single female/mother families (769 | 33.0%) accounting for the largest median family size of 3.5 persons per family. On the other hand, married-couple families (1,318 | 56.6%) represent the smallest median family size with 2.78 persons per family.
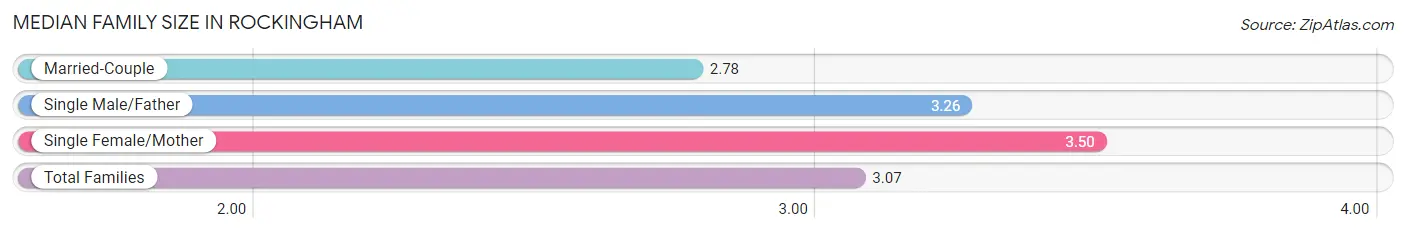
| Family Type | # Families | Family Size |
| Married-Couple | 1,318 (56.6%) | 2.78 |
| Single Male/Father | 243 (10.4%) | 3.26 |
| Single Female/Mother | 769 (33.0%) | 3.50 |
| Total Families | 2,330 (100.0%) | 3.07 |
Median Household Size in Rockingham
The median household size in Rockingham is 2.35 persons per household, with single female/mother households (769 | 20.1%) accounting for the largest median household size of 3.77 persons per household. non-family households (1,490 | 39.0%) represent the smallest median household size with 1.09 persons per household.
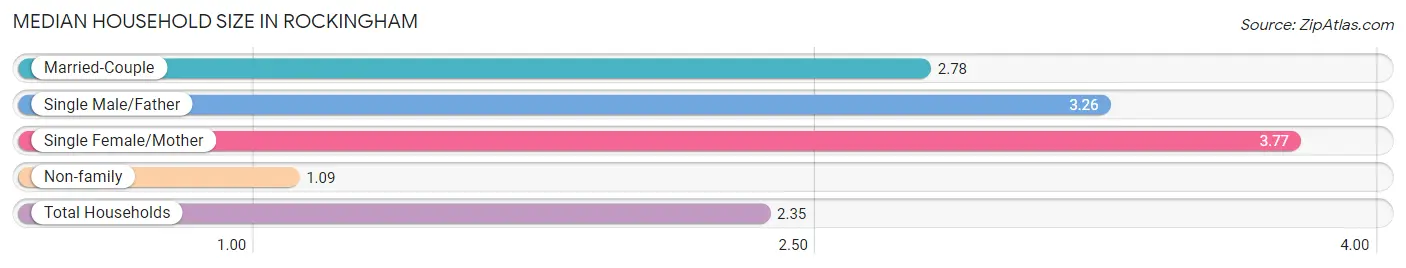
| Household Type | # Households | Household Size |
| Married-Couple | 1,318 (34.5%) | 2.78 |
| Single Male/Father | 243 (6.4%) | 3.26 |
| Single Female/Mother | 769 (20.1%) | 3.77 |
| Non-family | 1,490 (39.0%) | 1.09 |
| Total Households | 3,820 (100.0%) | 2.35 |
Household Size by Marriage Status in Rockingham
Out of a total of 3,820 households in Rockingham, 2,330 (61.0%) are family households, while 1,490 (39.0%) are nonfamily households. The most numerous type of family households are 2-person households, comprising 1,190, and the most common type of nonfamily households are 1-person households, comprising 1,358.
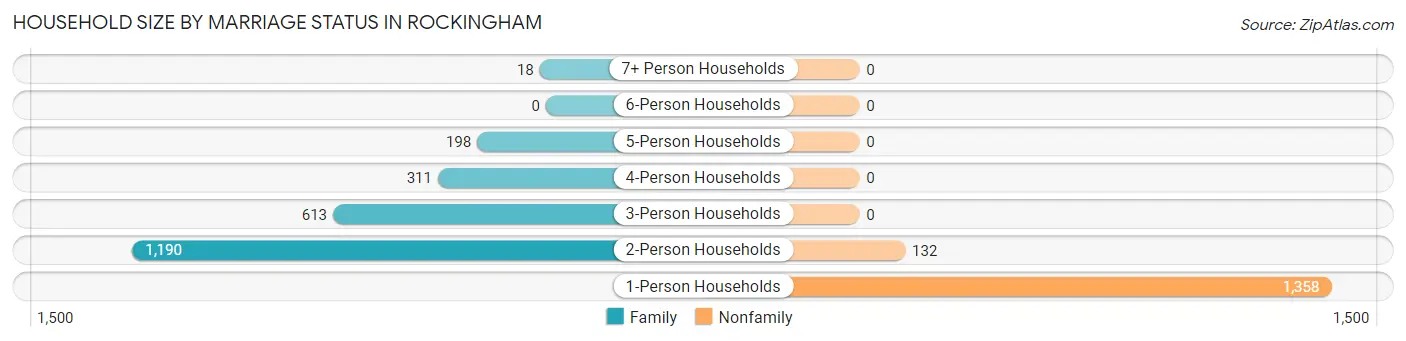
| Household Size | Family Households | Nonfamily Households |
| 1-Person Households | - | 1,358 (35.5%) |
| 2-Person Households | 1,190 (31.1%) | 132 (3.5%) |
| 3-Person Households | 613 (16.1%) | 0 (0.0%) |
| 4-Person Households | 311 (8.1%) | 0 (0.0%) |
| 5-Person Households | 198 (5.2%) | 0 (0.0%) |
| 6-Person Households | 0 (0.0%) | 0 (0.0%) |
| 7+ Person Households | 18 (0.5%) | 0 (0.0%) |
| Total | 2,330 (61.0%) | 1,490 (39.0%) |
Female Fertility in Rockingham
Fertility by Age in Rockingham
Average fertility rate in Rockingham is 35.0 births per 1,000 women. Women in the age bracket of 20 to 34 years have the highest fertility rate with 52.0 births per 1,000 women. Women in the age bracket of 20 to 34 years acount for 68.6% of all women with births.
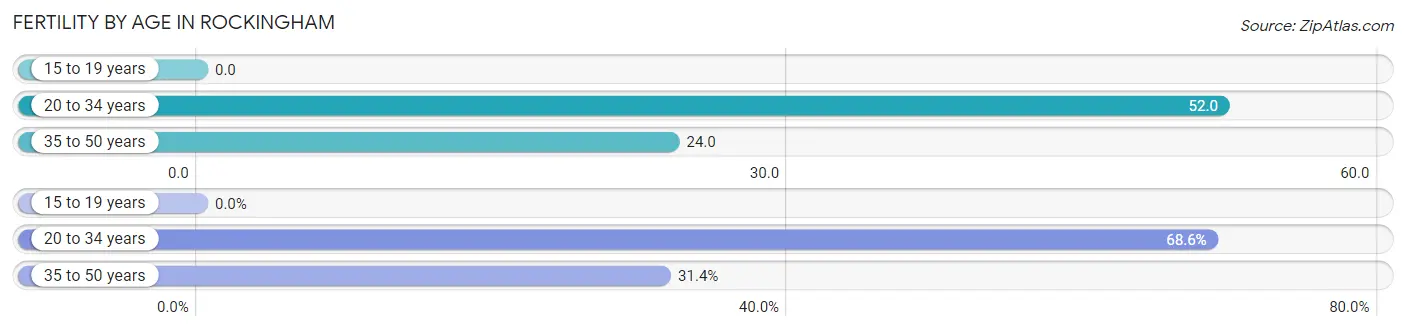
| Age Bracket | Women with Births | Births / 1,000 Women |
| 15 to 19 years | 0 (0.0%) | 0.0 |
| 20 to 34 years | 48 (68.6%) | 52.0 |
| 35 to 50 years | 22 (31.4%) | 24.0 |
| Total | 70 (100.0%) | 35.0 |
Fertility by Age by Marriage Status in Rockingham
42.9% of women with births (70) in Rockingham are married. The highest percentage of unmarried women with births falls into 35 to 50 years age bracket with 100.0% of them unmarried at the time of birth, while the lowest percentage of unmarried women with births belong to 20 to 34 years age bracket with 37.5% of them unmarried.
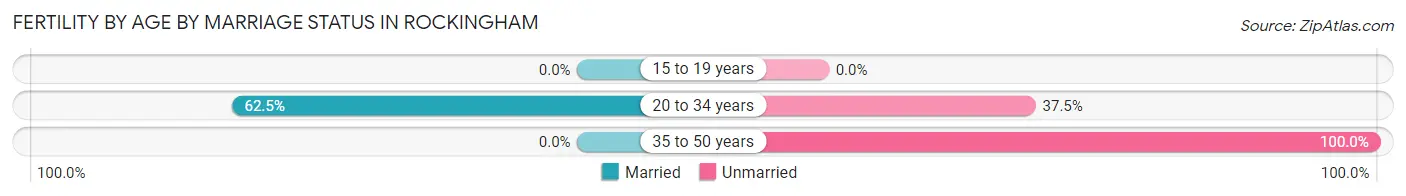
| Age Bracket | Married | Unmarried |
| 15 to 19 years | 0 (0.0%) | 0 (0.0%) |
| 20 to 34 years | 30 (62.5%) | 18 (37.5%) |
| 35 to 50 years | 0 (0.0%) | 22 (100.0%) |
| Total | 30 (42.9%) | 40 (57.1%) |
Fertility by Education in Rockingham
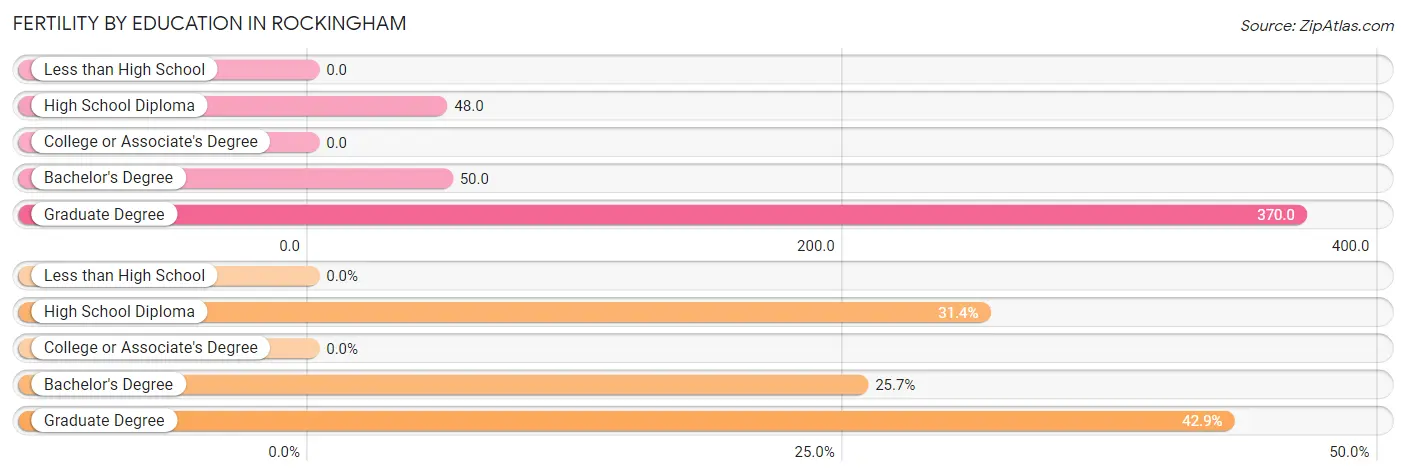
| Educational Attainment | Women with Births | Births / 1,000 Women |
| Less than High School | 0 (0.0%) | 0.0 |
| High School Diploma | 22 (31.4%) | 48.0 |
| College or Associate's Degree | 0 (0.0%) | 0.0 |
| Bachelor's Degree | 18 (25.7%) | 50.0 |
| Graduate Degree | 30 (42.9%) | 370.0 |
| Total | 70 (100.0%) | 35.0 |
Fertility by Education by Marriage Status in Rockingham
57.1% of women with births in Rockingham are unmarried. Women with the educational attainment of graduate degree are most likely to be married with 100.0% of them married at childbirth, while women with the educational attainment of high school diploma are least likely to be married with 100.0% of them unmarried at childbirth.
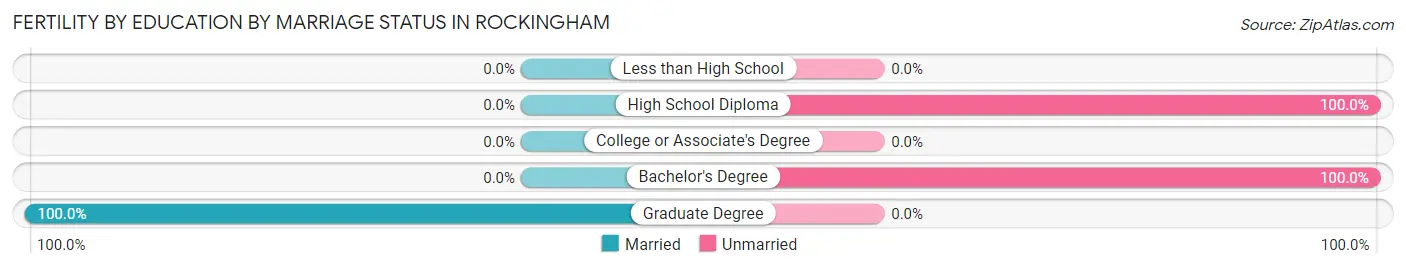
| Educational Attainment | Married | Unmarried |
| Less than High School | 0 (0.0%) | 0 (0.0%) |
| High School Diploma | 0 (0.0%) | 22 (100.0%) |
| College or Associate's Degree | 0 (0.0%) | 0 (0.0%) |
| Bachelor's Degree | 0 (0.0%) | 18 (100.0%) |
| Graduate Degree | 30 (100.0%) | 0 (0.0%) |
| Total | 30 (42.9%) | 40 (57.1%) |
Employment Characteristics in Rockingham
Employment by Class of Employer in Rockingham
Among the 3,755 employed individuals in Rockingham, private company employees (2,722 | 72.5%), state government employees (404 | 10.8%), and local government employees (348 | 9.3%) make up the most common classes of employment.
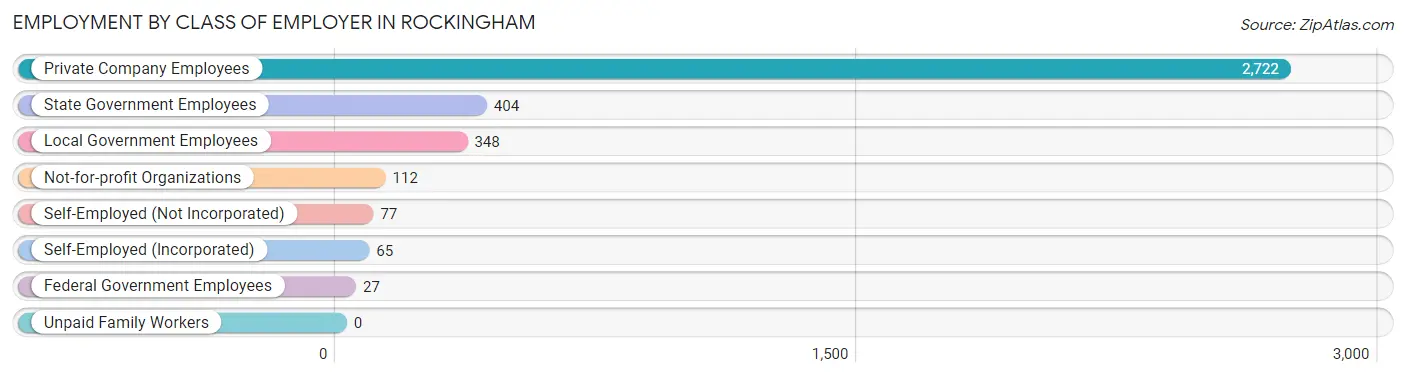
| Employer Class | # Employees | % Employees |
| Private Company Employees | 2,722 | 72.5% |
| Self-Employed (Incorporated) | 65 | 1.7% |
| Self-Employed (Not Incorporated) | 77 | 2.1% |
| Not-for-profit Organizations | 112 | 3.0% |
| Local Government Employees | 348 | 9.3% |
| State Government Employees | 404 | 10.8% |
| Federal Government Employees | 27 | 0.7% |
| Unpaid Family Workers | 0 | 0.0% |
| Total | 3,755 | 100.0% |
Employment Status by Age in Rockingham
According to the labor force statistics for Rockingham, out of the total population over 16 years of age (7,097), 59.2% or 4,201 individuals are in the labor force, with 7.2% or 302 of them unemployed. The age group with the highest labor force participation rate is 20 to 24 years, with 93.8% or 559 individuals in the labor force. Within the labor force, the 30 to 34 years age range has the highest percentage of unemployed individuals, with 17.6% or 81 of them being unemployed.
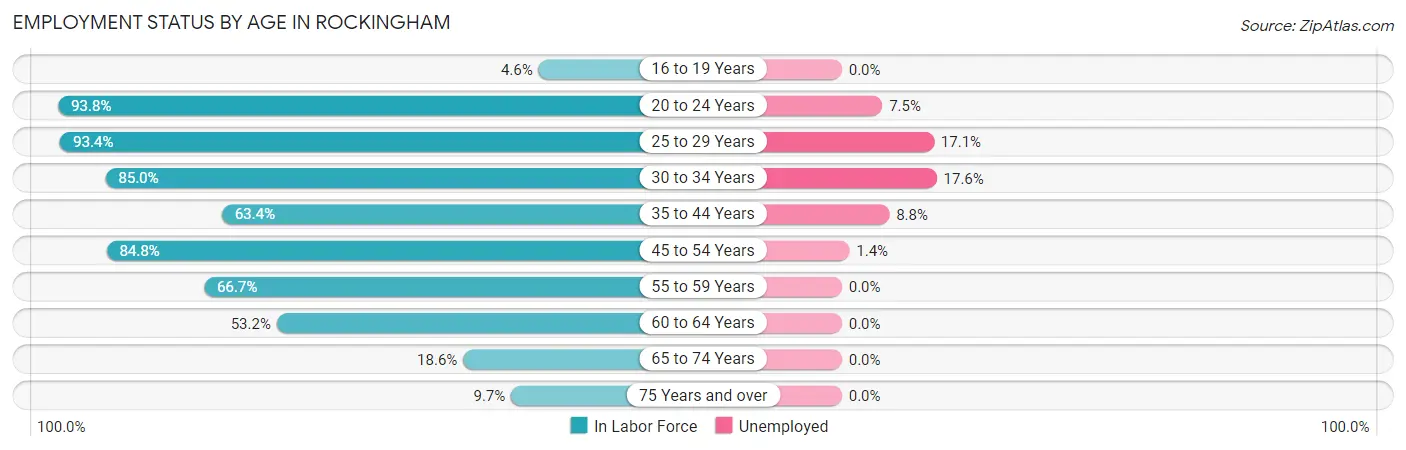
| Age Bracket | In Labor Force | Unemployed |
| 16 to 19 Years | 8 (4.6%) | 0 (0.0%) |
| 20 to 24 Years | 559 (93.8%) | 42 (7.5%) |
| 25 to 29 Years | 695 (93.4%) | 119 (17.1%) |
| 30 to 34 Years | 460 (85.0%) | 81 (17.6%) |
| 35 to 44 Years | 599 (63.4%) | 53 (8.8%) |
| 45 to 54 Years | 830 (84.8%) | 12 (1.4%) |
| 55 to 59 Years | 361 (66.7%) | 0 (0.0%) |
| 60 to 64 Years | 428 (53.2%) | 0 (0.0%) |
| 65 to 74 Years | 192 (18.6%) | 0 (0.0%) |
| 75 Years and over | 72 (9.7%) | 0 (0.0%) |
| Total | 4,201 (59.2%) | 302 (7.2%) |
Employment Status by Educational Attainment in Rockingham
According to labor force statistics for Rockingham, 74.1% of individuals (3,375) out of the total population between 25 and 64 years of age (4,554) are in the labor force, with 7.8% or 263 of them being unemployed. The group with the highest labor force participation rate are those with the educational attainment of bachelor's degree or higher, with 85.8% or 760 individuals in the labor force. Within the labor force, individuals with college / associate degree education have the highest percentage of unemployment, with 12.7% or 184 of them being unemployed.
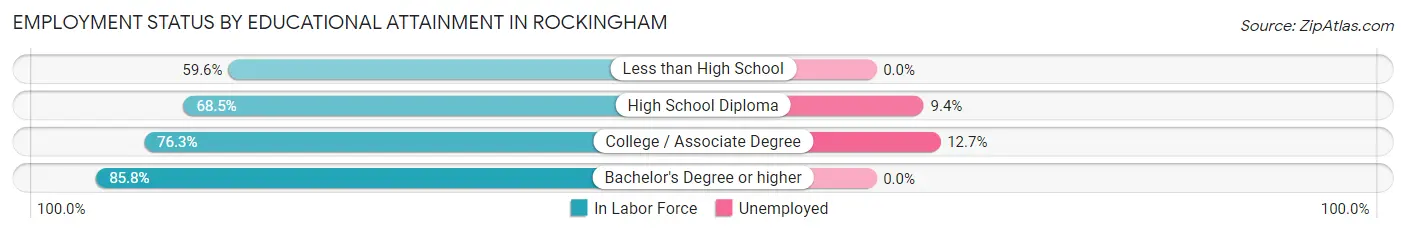
| Educational Attainment | In Labor Force | Unemployed |
| Less than High School | 323 (59.6%) | 0 (0.0%) |
| High School Diploma | 840 (68.5%) | 115 (9.4%) |
| College / Associate Degree | 1,449 (76.3%) | 241 (12.7%) |
| Bachelor's Degree or higher | 760 (85.8%) | 0 (0.0%) |
| Total | 3,375 (74.1%) | 355 (7.8%) |
Employment Occupations by Sex in Rockingham
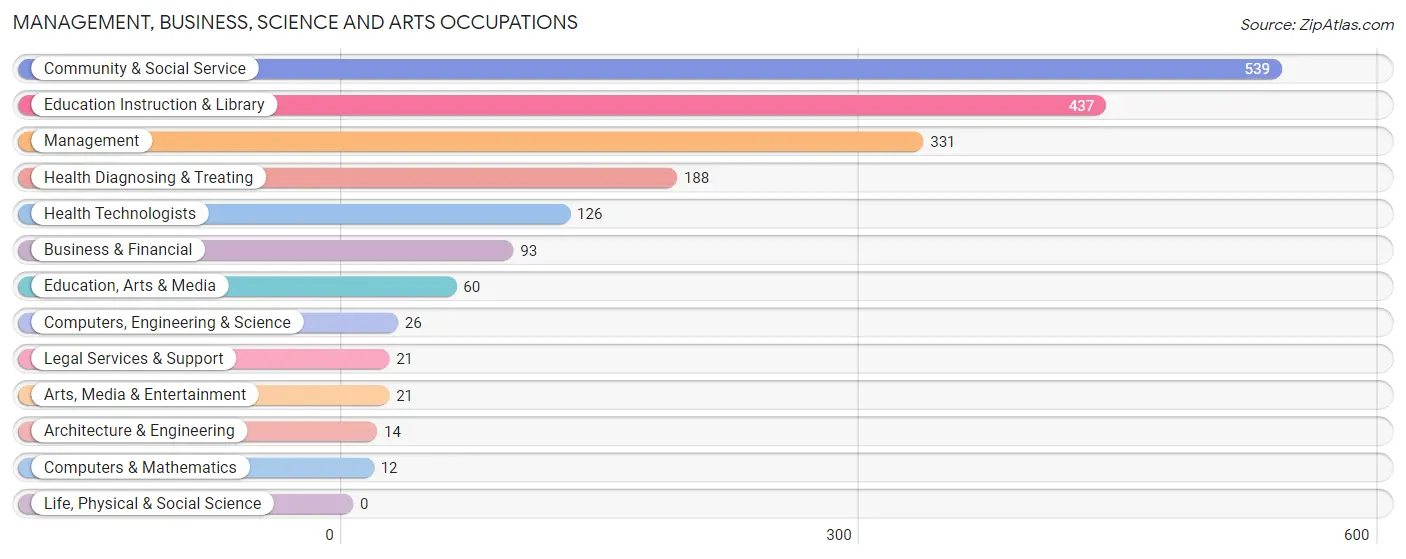
Management, Business, Science and Arts Occupations
The most common Management, Business, Science and Arts occupations in Rockingham are Community & Social Service (539 | 13.9%), Education Instruction & Library (437 | 11.3%), Management (331 | 8.5%), Health Diagnosing & Treating (188 | 4.9%), and Health Technologists (126 | 3.3%).
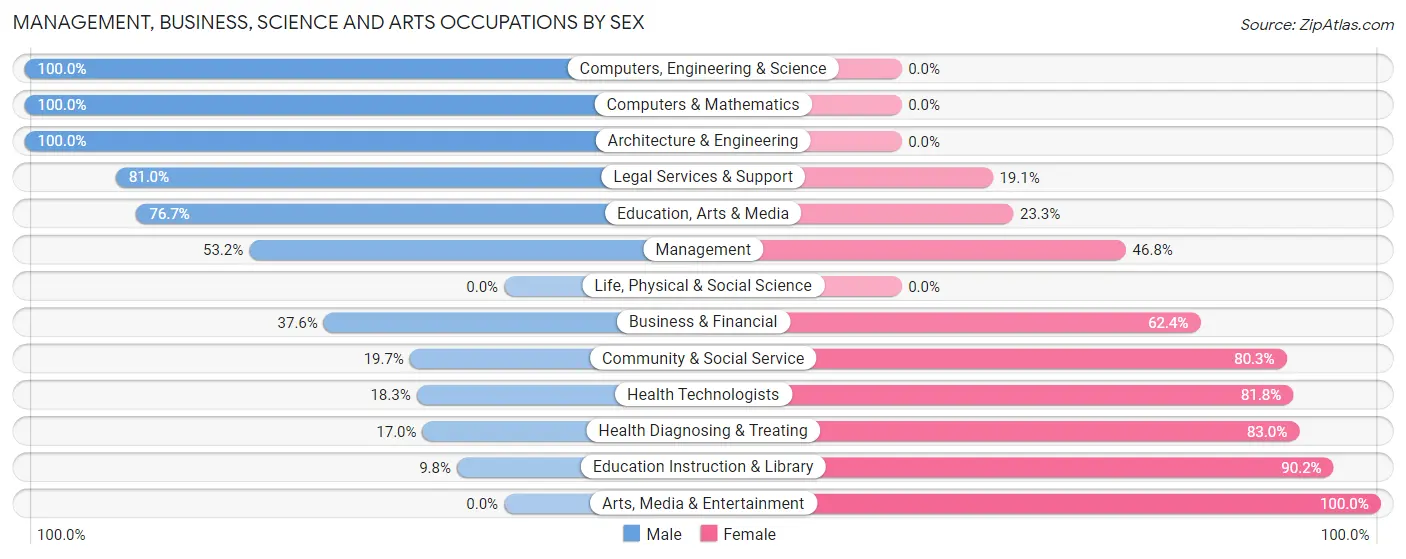
Management, Business, Science and Arts Occupations by Sex
Within the Management, Business, Science and Arts occupations in Rockingham, the most male-oriented occupations are Computers, Engineering & Science (100.0%), Computers & Mathematics (100.0%), and Architecture & Engineering (100.0%), while the most female-oriented occupations are Arts, Media & Entertainment (100.0%), Education Instruction & Library (90.2%), and Health Diagnosing & Treating (83.0%).
| Occupation | Male | Female |
| Management | 176 (53.2%) | 155 (46.8%) |
| Business & Financial | 35 (37.6%) | 58 (62.4%) |
| Computers, Engineering & Science | 26 (100.0%) | 0 (0.0%) |
| Computers & Mathematics | 12 (100.0%) | 0 (0.0%) |
| Architecture & Engineering | 14 (100.0%) | 0 (0.0%) |
| Life, Physical & Social Science | 0 (0.0%) | 0 (0.0%) |
| Community & Social Service | 106 (19.7%) | 433 (80.3%) |
| Education, Arts & Media | 46 (76.7%) | 14 (23.3%) |
| Legal Services & Support | 17 (80.9%) | 4 (19.1%) |
| Education Instruction & Library | 43 (9.8%) | 394 (90.2%) |
| Arts, Media & Entertainment | 0 (0.0%) | 21 (100.0%) |
| Health Diagnosing & Treating | 32 (17.0%) | 156 (83.0%) |
| Health Technologists | 23 (18.2%) | 103 (81.8%) |
| Total (Category) | 375 (31.9%) | 802 (68.1%) |
| Total (Overall) | 1,981 (51.1%) | 1,894 (48.9%) |
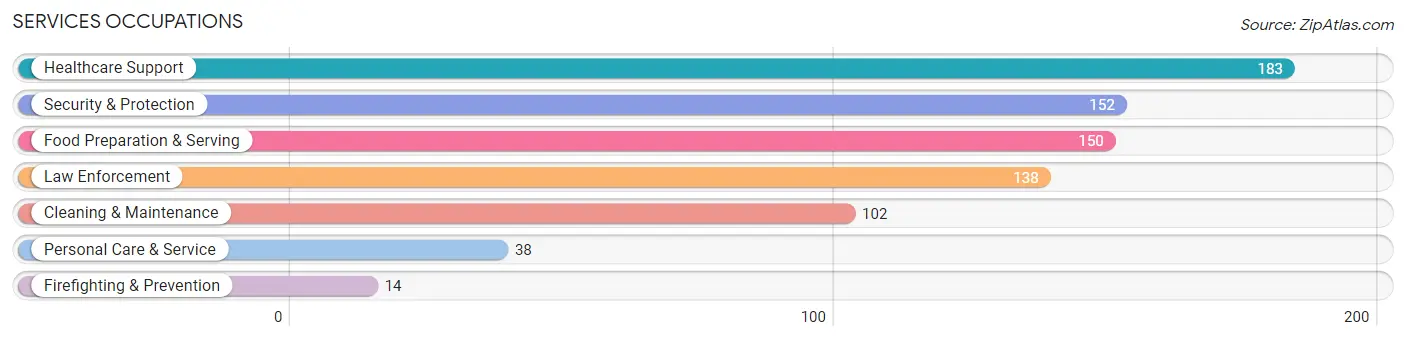
Services Occupations
The most common Services occupations in Rockingham are Healthcare Support (183 | 4.7%), Security & Protection (152 | 3.9%), Food Preparation & Serving (150 | 3.9%), Law Enforcement (138 | 3.6%), and Cleaning & Maintenance (102 | 2.6%).
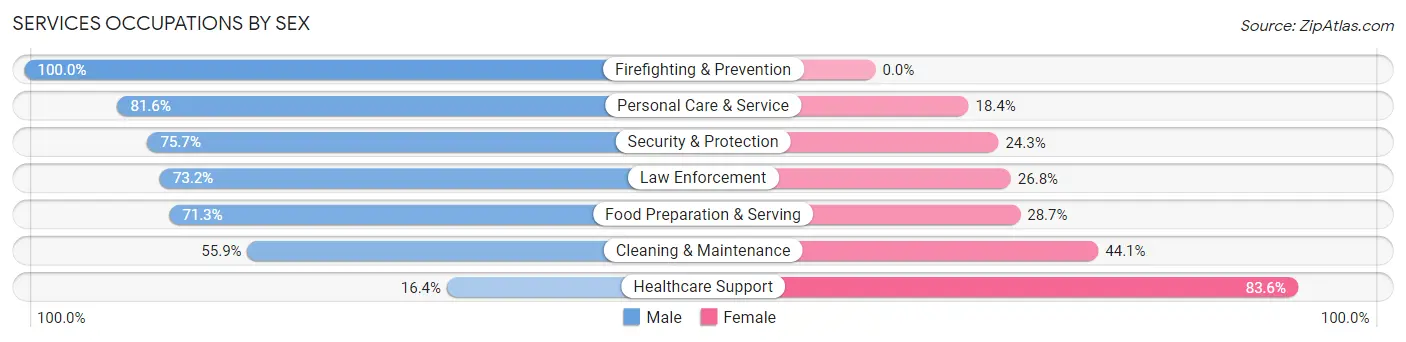
Services Occupations by Sex
Within the Services occupations in Rockingham, the most male-oriented occupations are Firefighting & Prevention (100.0%), Personal Care & Service (81.6%), and Security & Protection (75.7%), while the most female-oriented occupations are Healthcare Support (83.6%), Cleaning & Maintenance (44.1%), and Food Preparation & Serving (28.7%).
| Occupation | Male | Female |
| Healthcare Support | 30 (16.4%) | 153 (83.6%) |
| Security & Protection | 115 (75.7%) | 37 (24.3%) |
| Firefighting & Prevention | 14 (100.0%) | 0 (0.0%) |
| Law Enforcement | 101 (73.2%) | 37 (26.8%) |
| Food Preparation & Serving | 107 (71.3%) | 43 (28.7%) |
| Cleaning & Maintenance | 57 (55.9%) | 45 (44.1%) |
| Personal Care & Service | 31 (81.6%) | 7 (18.4%) |
| Total (Category) | 340 (54.4%) | 285 (45.6%) |
| Total (Overall) | 1,981 (51.1%) | 1,894 (48.9%) |
Sales and Office Occupations
The most common Sales and Office occupations in Rockingham are Sales & Related (577 | 14.9%), and Office & Administration (204 | 5.3%).
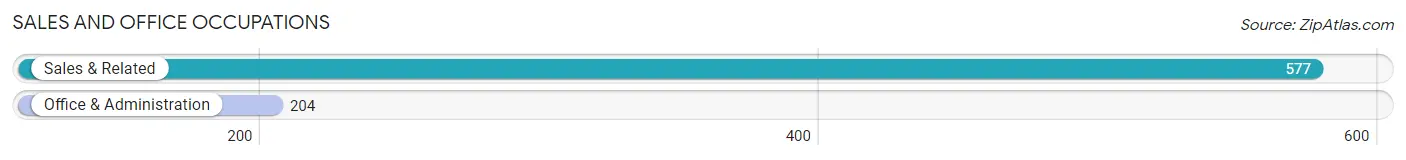
Sales and Office Occupations by Sex
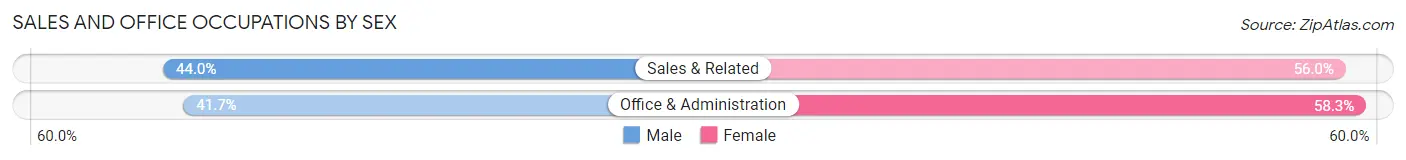
| Occupation | Male | Female |
| Sales & Related | 254 (44.0%) | 323 (56.0%) |
| Office & Administration | 85 (41.7%) | 119 (58.3%) |
| Total (Category) | 339 (43.4%) | 442 (56.6%) |
| Total (Overall) | 1,981 (51.1%) | 1,894 (48.9%) |
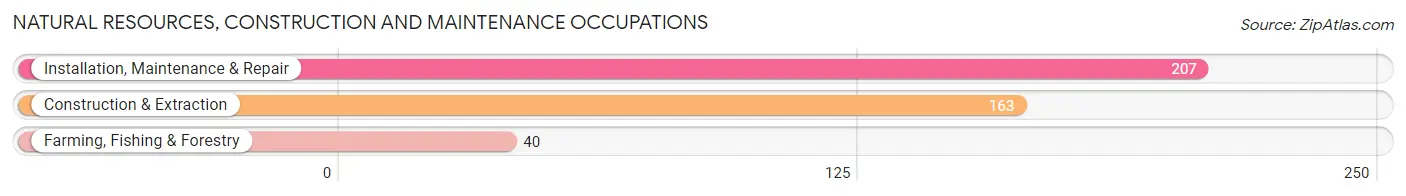
Natural Resources, Construction and Maintenance Occupations
The most common Natural Resources, Construction and Maintenance occupations in Rockingham are Installation, Maintenance & Repair (207 | 5.3%), Construction & Extraction (163 | 4.2%), and Farming, Fishing & Forestry (40 | 1.0%).
Natural Resources, Construction and Maintenance Occupations by Sex
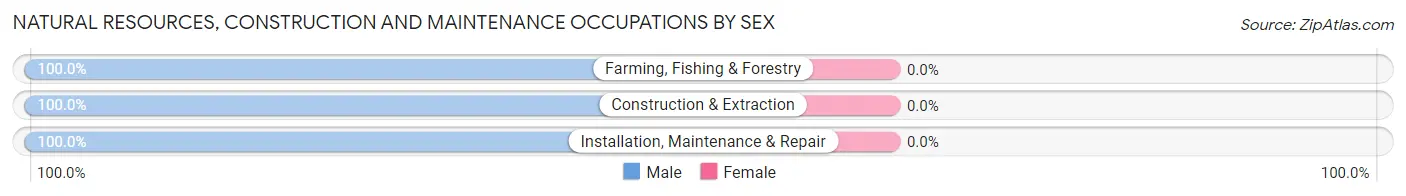
| Occupation | Male | Female |
| Farming, Fishing & Forestry | 40 (100.0%) | 0 (0.0%) |
| Construction & Extraction | 163 (100.0%) | 0 (0.0%) |
| Installation, Maintenance & Repair | 207 (100.0%) | 0 (0.0%) |
| Total (Category) | 410 (100.0%) | 0 (0.0%) |
| Total (Overall) | 1,981 (51.1%) | 1,894 (48.9%) |
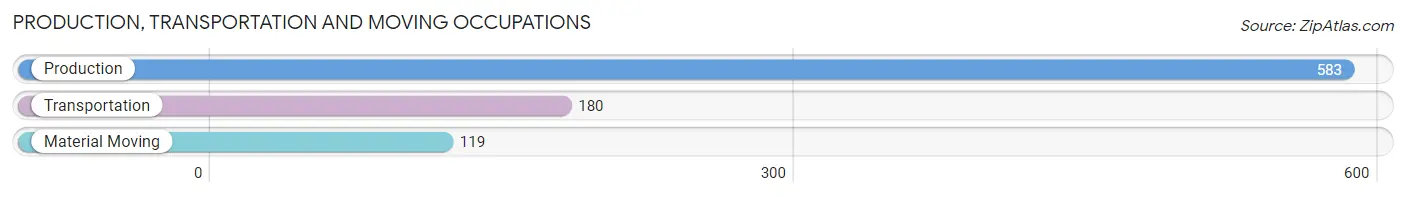
Production, Transportation and Moving Occupations
The most common Production, Transportation and Moving occupations in Rockingham are Production (583 | 15.0%), Transportation (180 | 4.6%), and Material Moving (119 | 3.1%).
Production, Transportation and Moving Occupations by Sex
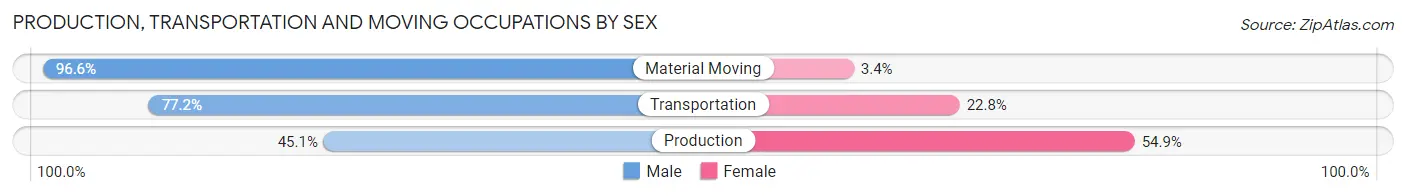
| Occupation | Male | Female |
| Production | 263 (45.1%) | 320 (54.9%) |
| Transportation | 139 (77.2%) | 41 (22.8%) |
| Material Moving | 115 (96.6%) | 4 (3.4%) |
| Total (Category) | 517 (58.6%) | 365 (41.4%) |
| Total (Overall) | 1,981 (51.1%) | 1,894 (48.9%) |
Employment Industries by Sex in Rockingham
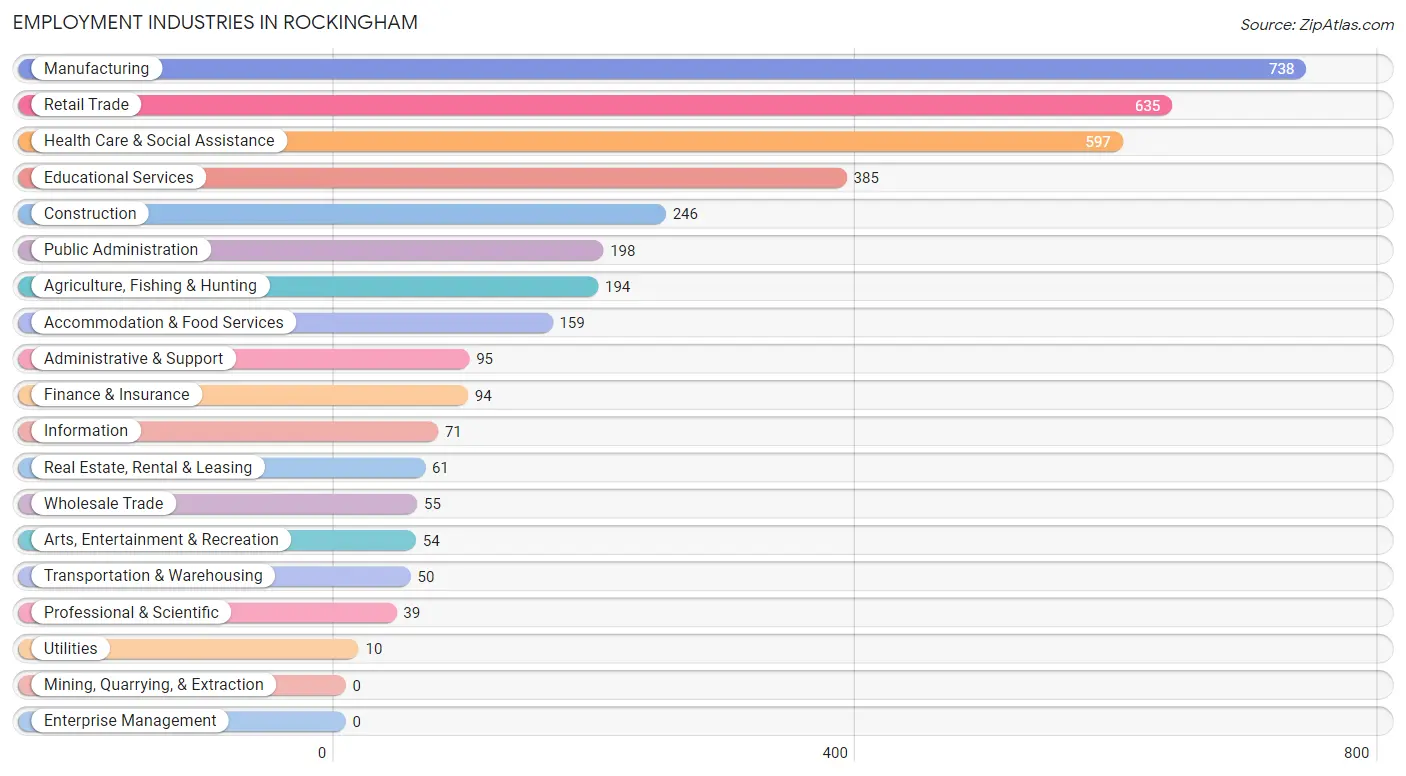
Employment Industries in Rockingham
The major employment industries in Rockingham include Manufacturing (738 | 19.1%), Retail Trade (635 | 16.4%), Health Care & Social Assistance (597 | 15.4%), Educational Services (385 | 9.9%), and Construction (246 | 6.4%).
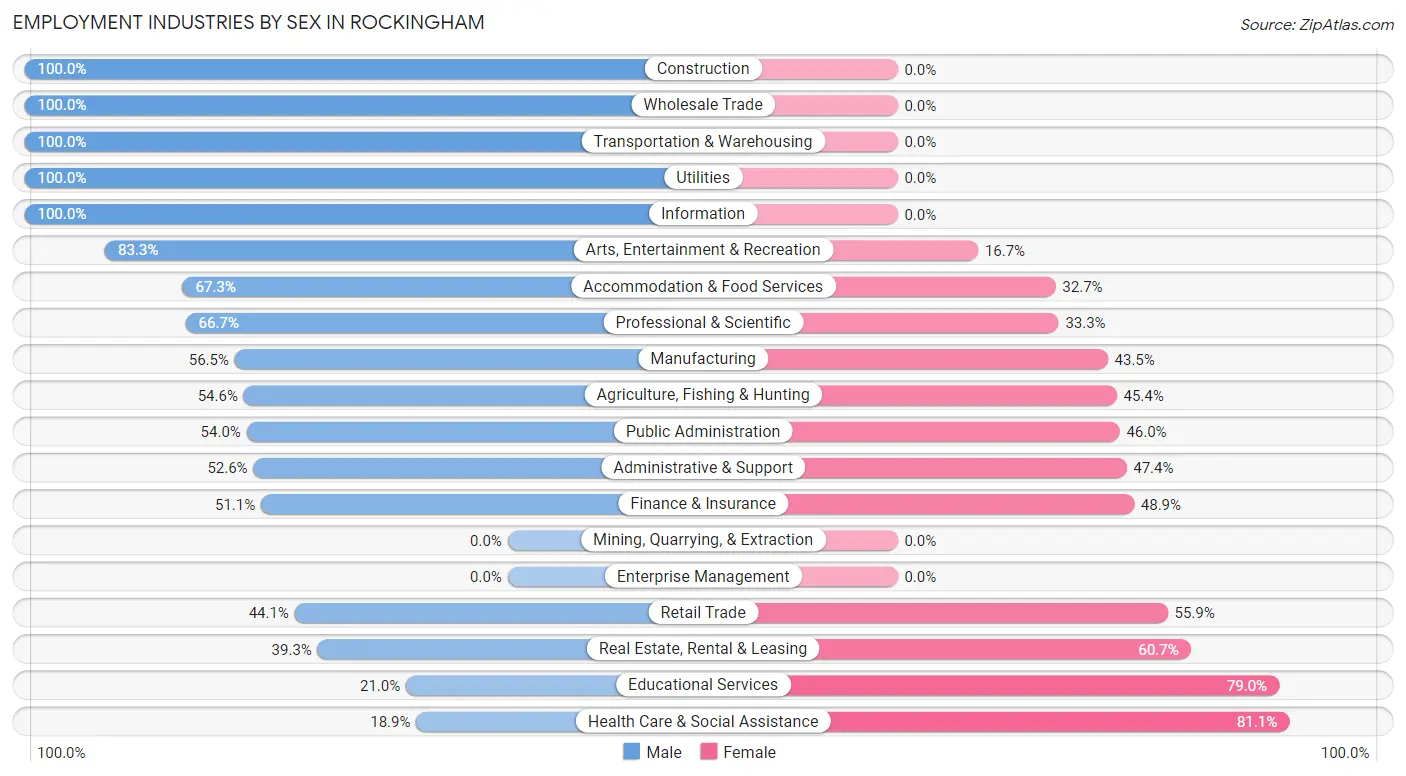
Employment Industries by Sex in Rockingham
The Rockingham industries that see more men than women are Construction (100.0%), Wholesale Trade (100.0%), and Transportation & Warehousing (100.0%), whereas the industries that tend to have a higher number of women are Health Care & Social Assistance (81.1%), Educational Services (79.0%), and Real Estate, Rental & Leasing (60.7%).
| Industry | Male | Female |
| Agriculture, Fishing & Hunting | 106 (54.6%) | 88 (45.4%) |
| Mining, Quarrying, & Extraction | 0 (0.0%) | 0 (0.0%) |
| Construction | 246 (100.0%) | 0 (0.0%) |
| Manufacturing | 417 (56.5%) | 321 (43.5%) |
| Wholesale Trade | 55 (100.0%) | 0 (0.0%) |
| Retail Trade | 280 (44.1%) | 355 (55.9%) |
| Transportation & Warehousing | 50 (100.0%) | 0 (0.0%) |
| Utilities | 10 (100.0%) | 0 (0.0%) |
| Information | 71 (100.0%) | 0 (0.0%) |
| Finance & Insurance | 48 (51.1%) | 46 (48.9%) |
| Real Estate, Rental & Leasing | 24 (39.3%) | 37 (60.7%) |
| Professional & Scientific | 26 (66.7%) | 13 (33.3%) |
| Enterprise Management | 0 (0.0%) | 0 (0.0%) |
| Administrative & Support | 50 (52.6%) | 45 (47.4%) |
| Educational Services | 81 (21.0%) | 304 (79.0%) |
| Health Care & Social Assistance | 113 (18.9%) | 484 (81.1%) |
| Arts, Entertainment & Recreation | 45 (83.3%) | 9 (16.7%) |
| Accommodation & Food Services | 107 (67.3%) | 52 (32.7%) |
| Public Administration | 107 (54.0%) | 91 (46.0%) |
| Total | 1,981 (51.1%) | 1,894 (48.9%) |
Education in Rockingham
School Enrollment in Rockingham
The most common levels of schooling among the 2,155 students in Rockingham are middle school (942 | 43.7%), college / undergraduate (334 | 15.5%), and high school (322 | 14.9%).
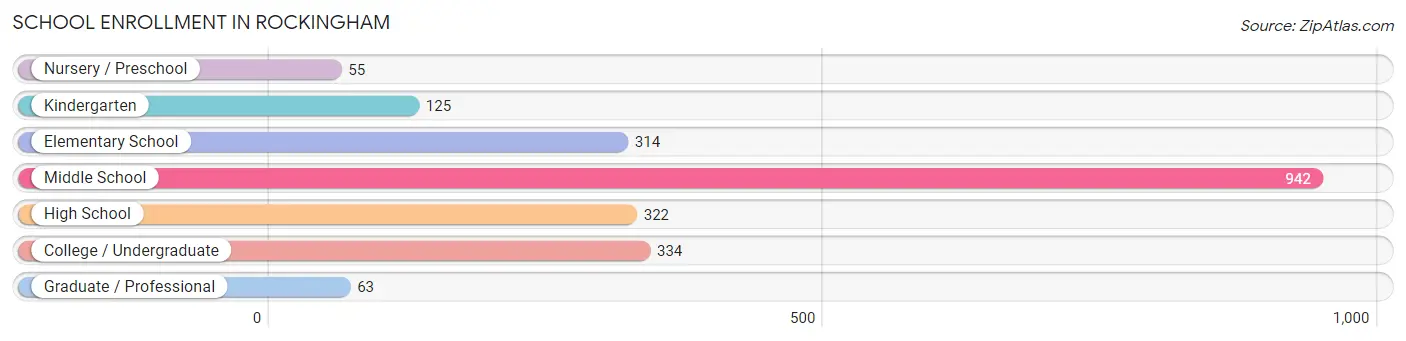
| School Level | # Students | % Students |
| Nursery / Preschool | 55 | 2.5% |
| Kindergarten | 125 | 5.8% |
| Elementary School | 314 | 14.6% |
| Middle School | 942 | 43.7% |
| High School | 322 | 14.9% |
| College / Undergraduate | 334 | 15.5% |
| Graduate / Professional | 63 | 2.9% |
| Total | 2,155 | 100.0% |
School Enrollment by Age by Funding Source in Rockingham
Out of a total of 2,155 students who are enrolled in schools in Rockingham, 60 (2.8%) attend a private institution, while the remaining 2,095 (97.2%) are enrolled in public schools. The age group of 15 to 17 year olds has the highest likelihood of being enrolled in private schools, with 30 (11.6% in the age bracket) enrolled. Conversely, the age group of 3 to 4 year olds has the lowest likelihood of being enrolled in a private school, with 55 (100.0% in the age bracket) attending a public institution.
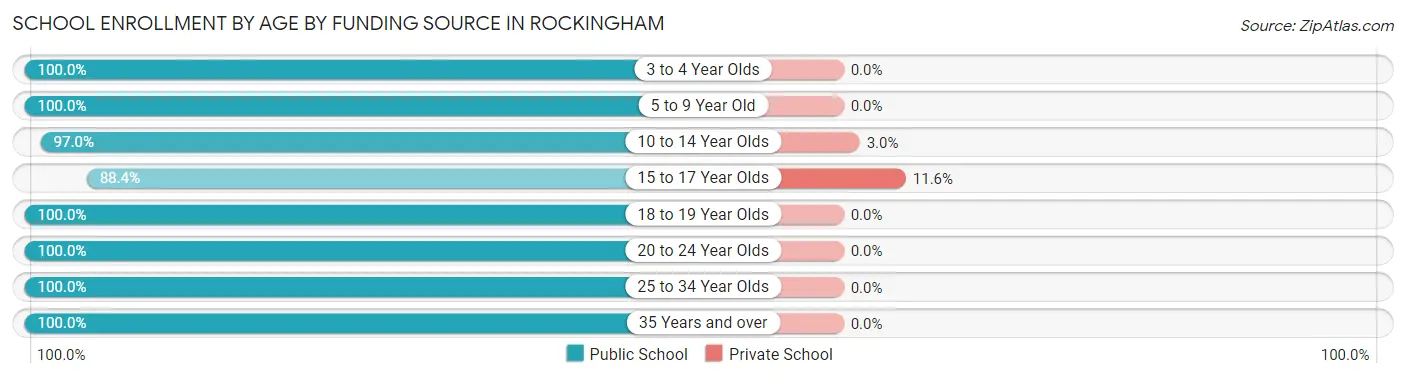
| Age Bracket | Public School | Private School |
| 3 to 4 Year Olds | 55 (100.0%) | 0 (0.0%) |
| 5 to 9 Year Old | 395 (100.0%) | 0 (0.0%) |
| 10 to 14 Year Olds | 973 (97.0%) | 30 (3.0%) |
| 15 to 17 Year Olds | 229 (88.4%) | 30 (11.6%) |
| 18 to 19 Year Olds | 53 (100.0%) | 0 (0.0%) |
| 20 to 24 Year Olds | 95 (100.0%) | 0 (0.0%) |
| 25 to 34 Year Olds | 142 (100.0%) | 0 (0.0%) |
| 35 Years and over | 153 (100.0%) | 0 (0.0%) |
| Total | 2,095 (97.2%) | 60 (2.8%) |
Educational Attainment by Field of Study in Rockingham
Education (290 | 21.0%), psychology (204 | 14.7%), science & technology (202 | 14.6%), business (187 | 13.5%), and arts & humanities (168 | 12.1%) are the most common fields of study among 1,383 individuals in Rockingham who have obtained a bachelor's degree or higher.
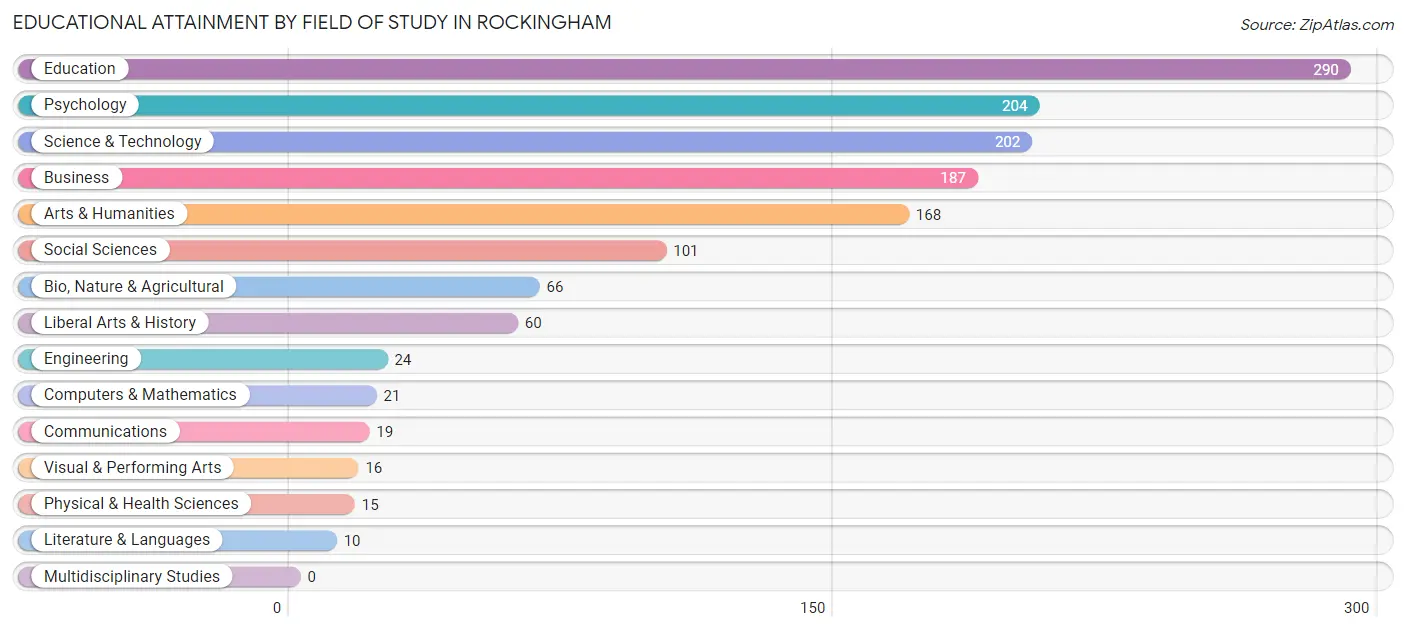
| Field of Study | # Graduates | % Graduates |
| Computers & Mathematics | 21 | 1.5% |
| Bio, Nature & Agricultural | 66 | 4.8% |
| Physical & Health Sciences | 15 | 1.1% |
| Psychology | 204 | 14.7% |
| Social Sciences | 101 | 7.3% |
| Engineering | 24 | 1.7% |
| Multidisciplinary Studies | 0 | 0.0% |
| Science & Technology | 202 | 14.6% |
| Business | 187 | 13.5% |
| Education | 290 | 21.0% |
| Literature & Languages | 10 | 0.7% |
| Liberal Arts & History | 60 | 4.3% |
| Visual & Performing Arts | 16 | 1.2% |
| Communications | 19 | 1.4% |
| Arts & Humanities | 168 | 12.1% |
| Total | 1,383 | 100.0% |
Transportation & Commute in Rockingham
Vehicle Availability by Sex in Rockingham
The most prevalent vehicle ownership categories in Rockingham are males with 2 vehicles (995, accounting for 50.3%) and females with 2 vehicles (599, making up 56.1%).
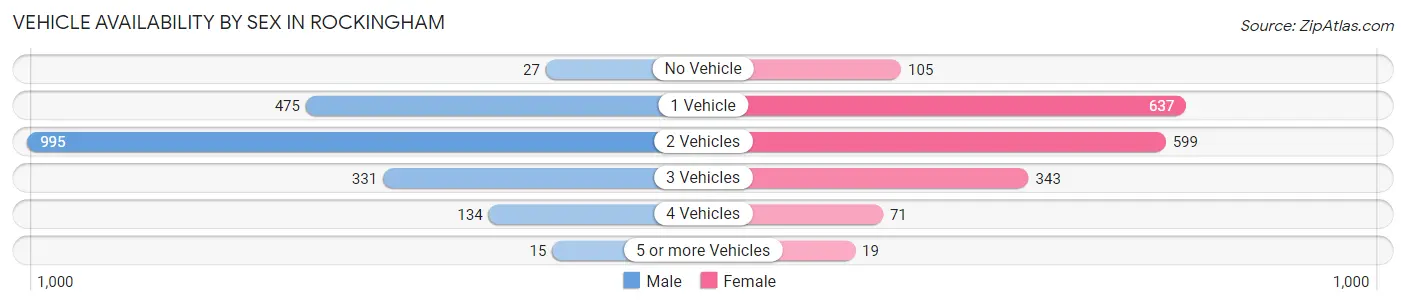
| Vehicles Available | Male | Female |
| No Vehicle | 27 (1.4%) | 105 (5.9%) |
| 1 Vehicle | 475 (24.0%) | 637 (35.9%) |
| 2 Vehicles | 995 (50.3%) | 599 (33.8%) |
| 3 Vehicles | 331 (16.7%) | 343 (19.3%) |
| 4 Vehicles | 134 (6.8%) | 71 (4.0%) |
| 5 or more Vehicles | 15 (0.8%) | 19 (1.1%) |
| Total | 1,977 (100.0%) | 1,774 (100.0%) |
Commute Time in Rockingham
The most frequently occuring commute durations in Rockingham are 15 to 19 minutes (746 commuters, 20.2%), 5 to 9 minutes (678 commuters, 18.3%), and 30 to 34 minutes (403 commuters, 10.9%).
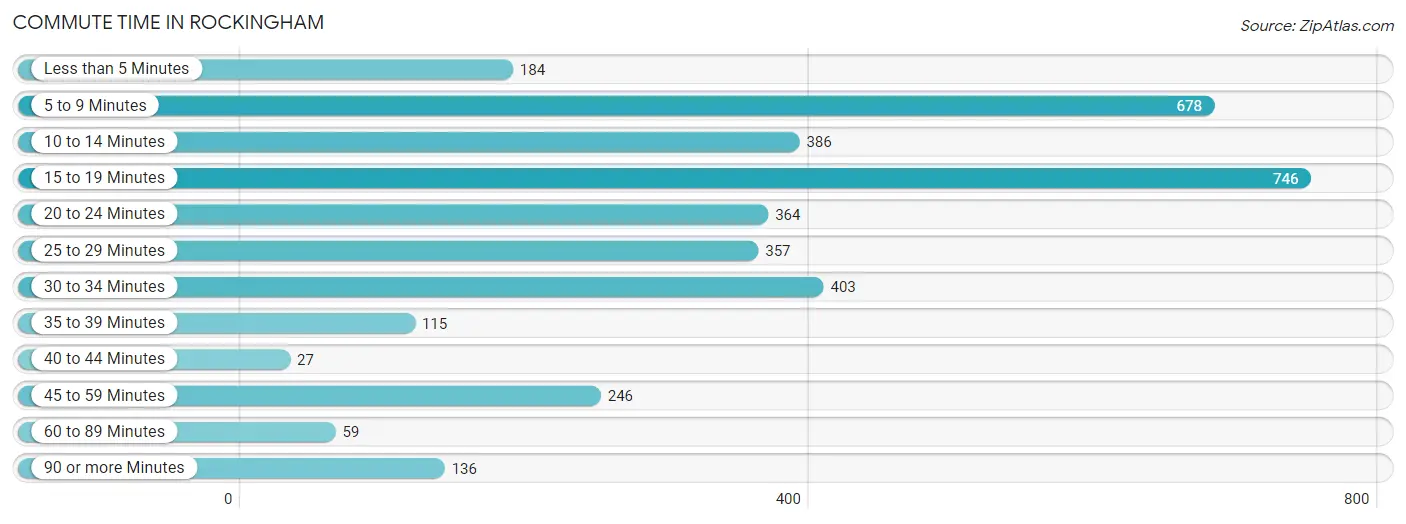
| Commute Time | # Commuters | % Commuters |
| Less than 5 Minutes | 184 | 5.0% |
| 5 to 9 Minutes | 678 | 18.3% |
| 10 to 14 Minutes | 386 | 10.4% |
| 15 to 19 Minutes | 746 | 20.2% |
| 20 to 24 Minutes | 364 | 9.8% |
| 25 to 29 Minutes | 357 | 9.7% |
| 30 to 34 Minutes | 403 | 10.9% |
| 35 to 39 Minutes | 115 | 3.1% |
| 40 to 44 Minutes | 27 | 0.7% |
| 45 to 59 Minutes | 246 | 6.7% |
| 60 to 89 Minutes | 59 | 1.6% |
| 90 or more Minutes | 136 | 3.7% |
Commute Time by Sex in Rockingham
The most common commute times in Rockingham are 15 to 19 minutes (630 commuters, 32.5%) for males and 5 to 9 minutes (400 commuters, 22.7%) for females.
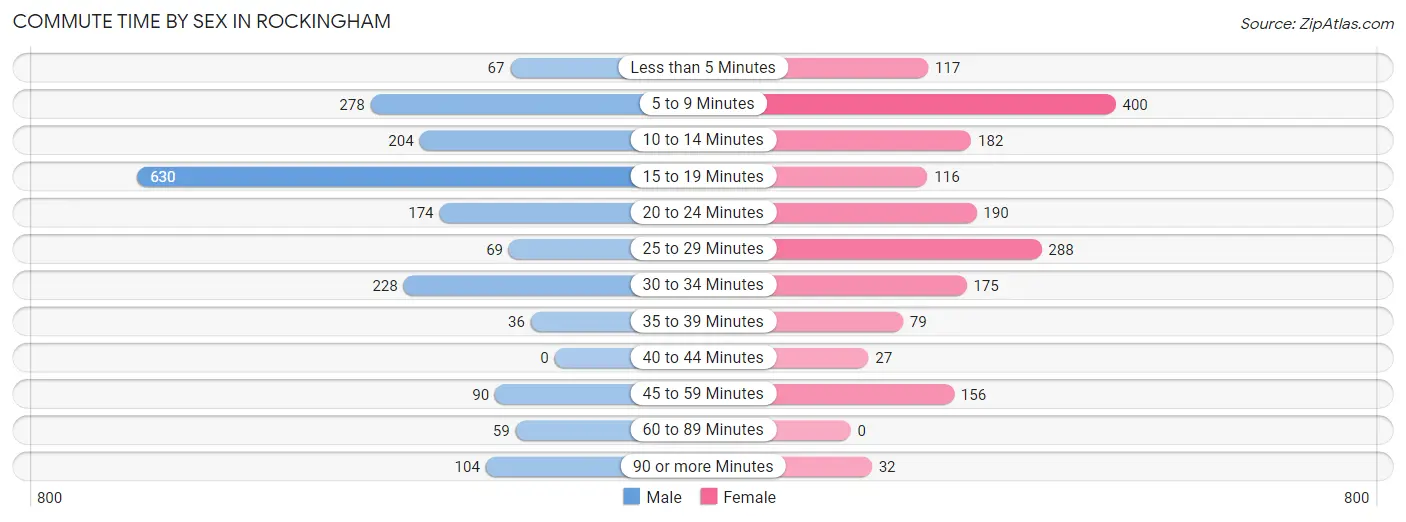
| Commute Time | Male | Female |
| Less than 5 Minutes | 67 (3.5%) | 117 (6.6%) |
| 5 to 9 Minutes | 278 (14.3%) | 400 (22.7%) |
| 10 to 14 Minutes | 204 (10.5%) | 182 (10.3%) |
| 15 to 19 Minutes | 630 (32.5%) | 116 (6.6%) |
| 20 to 24 Minutes | 174 (9.0%) | 190 (10.8%) |
| 25 to 29 Minutes | 69 (3.6%) | 288 (16.4%) |
| 30 to 34 Minutes | 228 (11.8%) | 175 (9.9%) |
| 35 to 39 Minutes | 36 (1.9%) | 79 (4.5%) |
| 40 to 44 Minutes | 0 (0.0%) | 27 (1.5%) |
| 45 to 59 Minutes | 90 (4.6%) | 156 (8.8%) |
| 60 to 89 Minutes | 59 (3.0%) | 0 (0.0%) |
| 90 or more Minutes | 104 (5.4%) | 32 (1.8%) |
Time of Departure to Work by Sex in Rockingham
The most frequent times of departure to work in Rockingham are 7:00 AM to 7:29 AM (442, 22.8%) for males and 7:30 AM to 7:59 AM (399, 22.6%) for females.
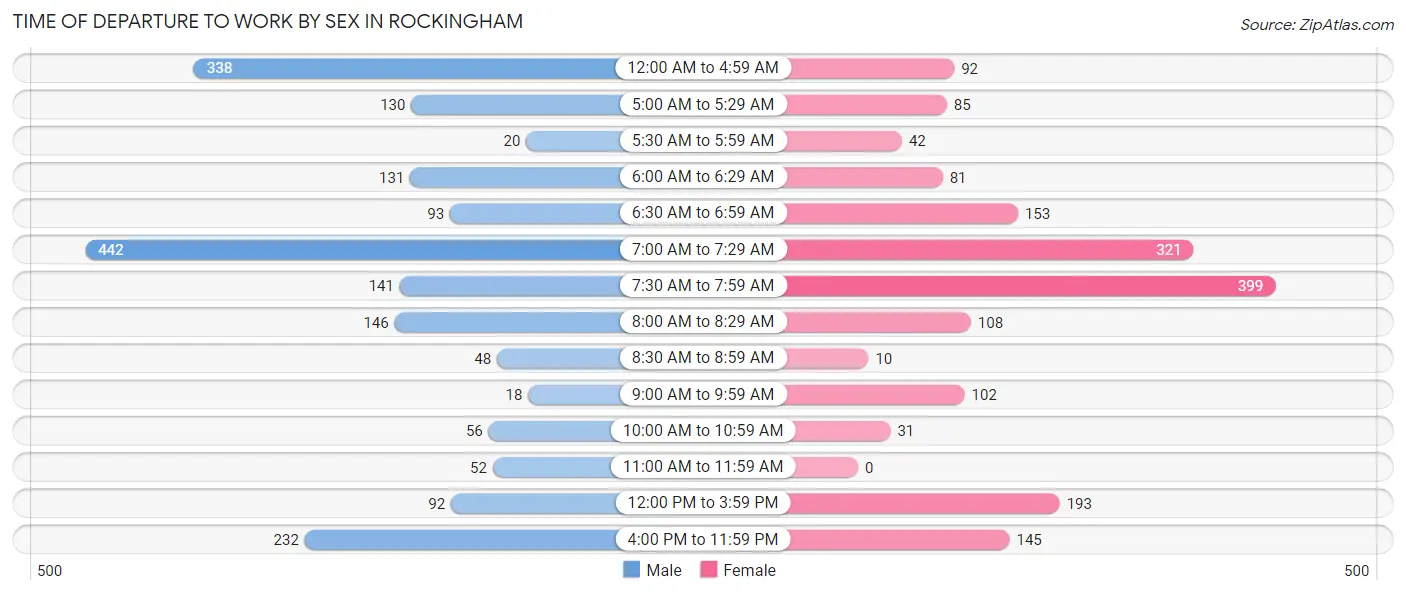
| Time of Departure | Male | Female |
| 12:00 AM to 4:59 AM | 338 (17.4%) | 92 (5.2%) |
| 5:00 AM to 5:29 AM | 130 (6.7%) | 85 (4.8%) |
| 5:30 AM to 5:59 AM | 20 (1.0%) | 42 (2.4%) |
| 6:00 AM to 6:29 AM | 131 (6.8%) | 81 (4.6%) |
| 6:30 AM to 6:59 AM | 93 (4.8%) | 153 (8.7%) |
| 7:00 AM to 7:29 AM | 442 (22.8%) | 321 (18.2%) |
| 7:30 AM to 7:59 AM | 141 (7.3%) | 399 (22.6%) |
| 8:00 AM to 8:29 AM | 146 (7.5%) | 108 (6.1%) |
| 8:30 AM to 8:59 AM | 48 (2.5%) | 10 (0.6%) |
| 9:00 AM to 9:59 AM | 18 (0.9%) | 102 (5.8%) |
| 10:00 AM to 10:59 AM | 56 (2.9%) | 31 (1.8%) |
| 11:00 AM to 11:59 AM | 52 (2.7%) | 0 (0.0%) |
| 12:00 PM to 3:59 PM | 92 (4.7%) | 193 (11.0%) |
| 4:00 PM to 11:59 PM | 232 (12.0%) | 145 (8.2%) |
| Total | 1,939 (100.0%) | 1,762 (100.0%) |
Housing Occupancy in Rockingham
Occupancy by Ownership in Rockingham
Of the total 3,820 dwellings in Rockingham, owner-occupied units account for 2,146 (56.2%), while renter-occupied units make up 1,674 (43.8%).
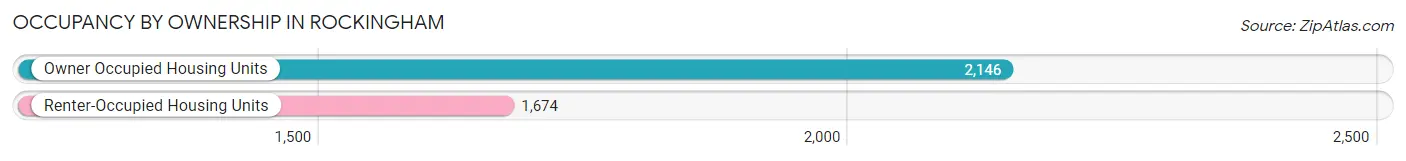
| Occupancy | # Housing Units | % Housing Units |
| Owner Occupied Housing Units | 2,146 | 56.2% |
| Renter-Occupied Housing Units | 1,674 | 43.8% |
| Total Occupied Housing Units | 3,820 | 100.0% |
Occupancy by Household Size in Rockingham
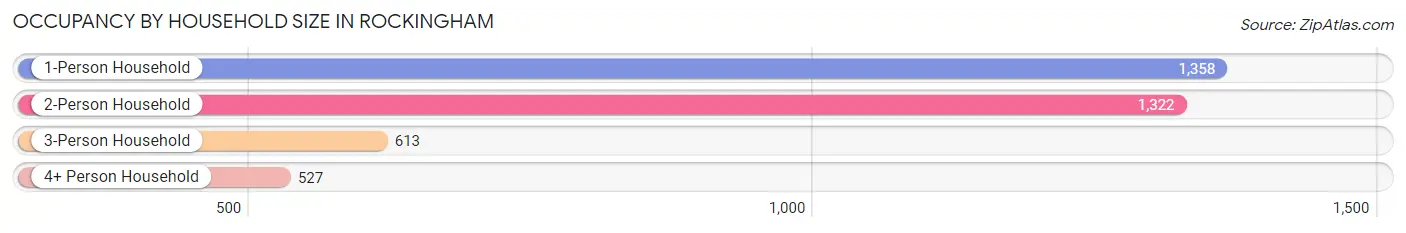
| Household Size | # Housing Units | % Housing Units |
| 1-Person Household | 1,358 | 35.5% |
| 2-Person Household | 1,322 | 34.6% |
| 3-Person Household | 613 | 16.1% |
| 4+ Person Household | 527 | 13.8% |
| Total Housing Units | 3,820 | 100.0% |
Occupancy by Ownership by Household Size in Rockingham
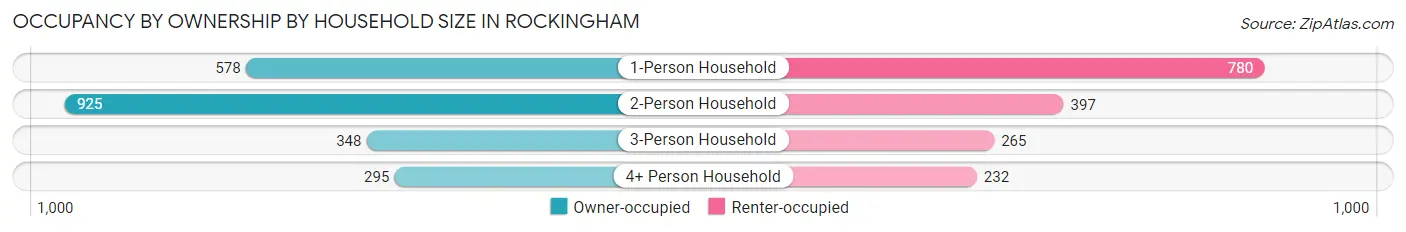
| Household Size | Owner-occupied | Renter-occupied |
| 1-Person Household | 578 (42.6%) | 780 (57.4%) |
| 2-Person Household | 925 (70.0%) | 397 (30.0%) |
| 3-Person Household | 348 (56.8%) | 265 (43.2%) |
| 4+ Person Household | 295 (56.0%) | 232 (44.0%) |
| Total Housing Units | 2,146 (56.2%) | 1,674 (43.8%) |
Occupancy by Educational Attainment in Rockingham
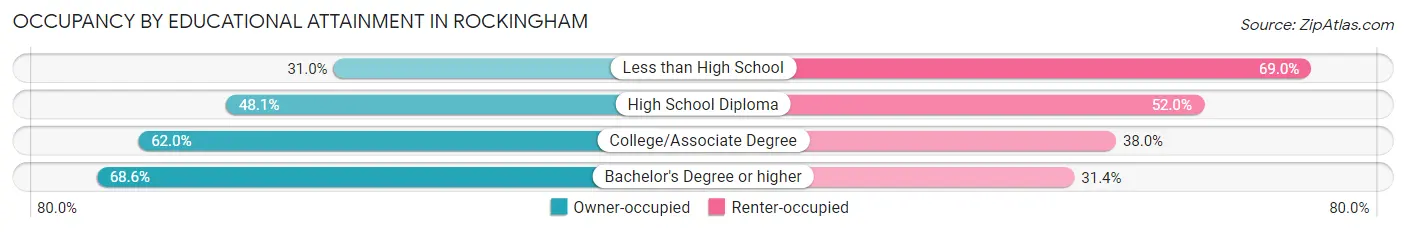
| Household Size | Owner-occupied | Renter-occupied |
| Less than High School | 111 (31.0%) | 247 (69.0%) |
| High School Diploma | 553 (48.0%) | 598 (51.9%) |
| College/Associate Degree | 963 (62.0%) | 591 (38.0%) |
| Bachelor's Degree or higher | 519 (68.6%) | 238 (31.4%) |
Occupancy by Age of Householder in Rockingham
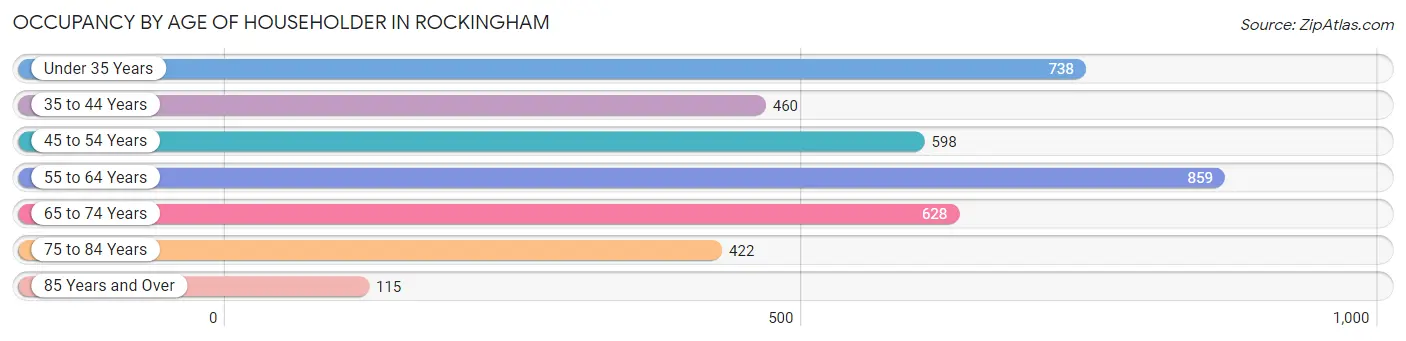
| Age Bracket | # Households | % Households |
| Under 35 Years | 738 | 19.3% |
| 35 to 44 Years | 460 | 12.0% |
| 45 to 54 Years | 598 | 15.7% |
| 55 to 64 Years | 859 | 22.5% |
| 65 to 74 Years | 628 | 16.4% |
| 75 to 84 Years | 422 | 11.1% |
| 85 Years and Over | 115 | 3.0% |
| Total | 3,820 | 100.0% |
Housing Finances in Rockingham
Median Income by Occupancy in Rockingham
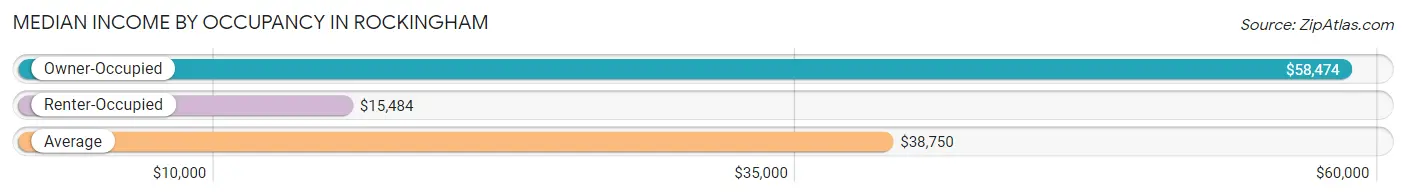
| Occupancy Type | # Households | Median Income |
| Owner-Occupied | 2,146 (56.2%) | $58,474 |
| Renter-Occupied | 1,674 (43.8%) | $15,484 |
| Average | 3,820 (100.0%) | $38,750 |
Occupancy by Householder Income Bracket in Rockingham
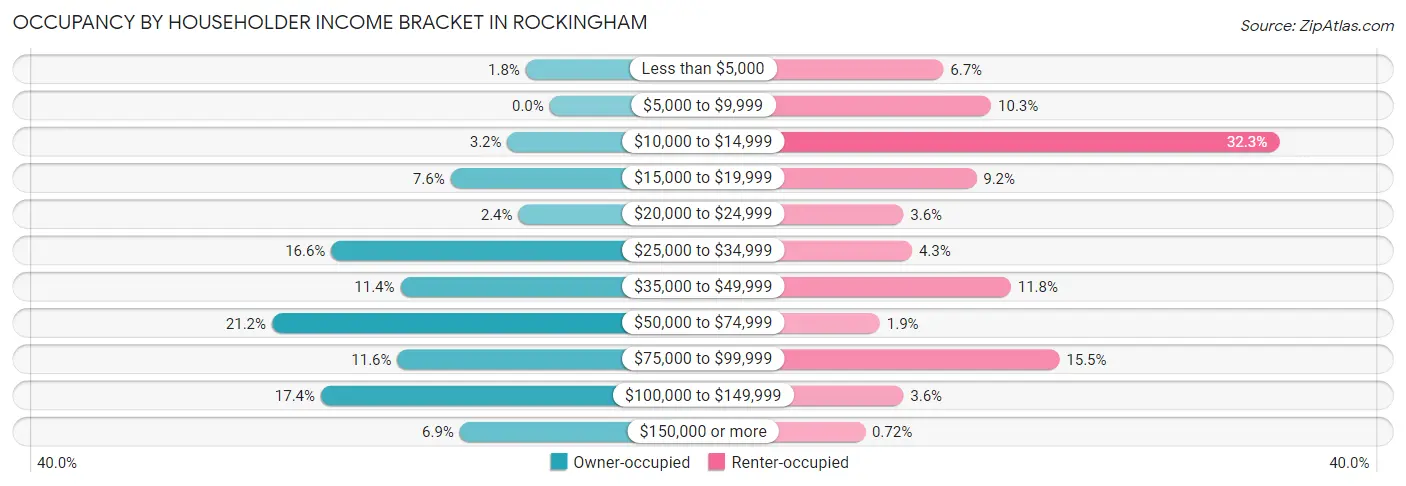
| Income Bracket | Owner-occupied | Renter-occupied |
| Less than $5,000 | 39 (1.8%) | 112 (6.7%) |
| $5,000 to $9,999 | 0 (0.0%) | 173 (10.3%) |
| $10,000 to $14,999 | 69 (3.2%) | 540 (32.3%) |
| $15,000 to $19,999 | 162 (7.5%) | 154 (9.2%) |
| $20,000 to $24,999 | 51 (2.4%) | 61 (3.6%) |
| $25,000 to $34,999 | 357 (16.6%) | 72 (4.3%) |
| $35,000 to $49,999 | 244 (11.4%) | 198 (11.8%) |
| $50,000 to $74,999 | 454 (21.2%) | 31 (1.8%) |
| $75,000 to $99,999 | 249 (11.6%) | 260 (15.5%) |
| $100,000 to $149,999 | 374 (17.4%) | 61 (3.6%) |
| $150,000 or more | 147 (6.9%) | 12 (0.7%) |
| Total | 2,146 (100.0%) | 1,674 (100.0%) |
Monthly Housing Cost Tiers in Rockingham
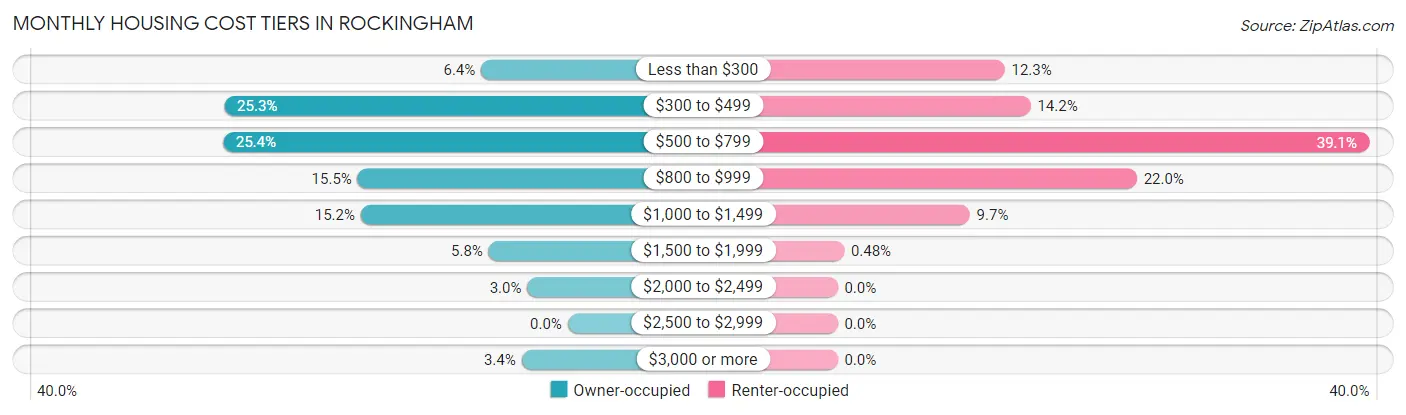
| Monthly Cost | Owner-occupied | Renter-occupied |
| Less than $300 | 137 (6.4%) | 206 (12.3%) |
| $300 to $499 | 543 (25.3%) | 238 (14.2%) |
| $500 to $799 | 545 (25.4%) | 655 (39.1%) |
| $800 to $999 | 332 (15.5%) | 369 (22.0%) |
| $1,000 to $1,499 | 327 (15.2%) | 163 (9.7%) |
| $1,500 to $1,999 | 125 (5.8%) | 8 (0.5%) |
| $2,000 to $2,499 | 64 (3.0%) | 0 (0.0%) |
| $2,500 to $2,999 | 0 (0.0%) | 0 (0.0%) |
| $3,000 or more | 73 (3.4%) | 0 (0.0%) |
| Total | 2,146 (100.0%) | 1,674 (100.0%) |
Physical Housing Characteristics in Rockingham
Housing Structures in Rockingham
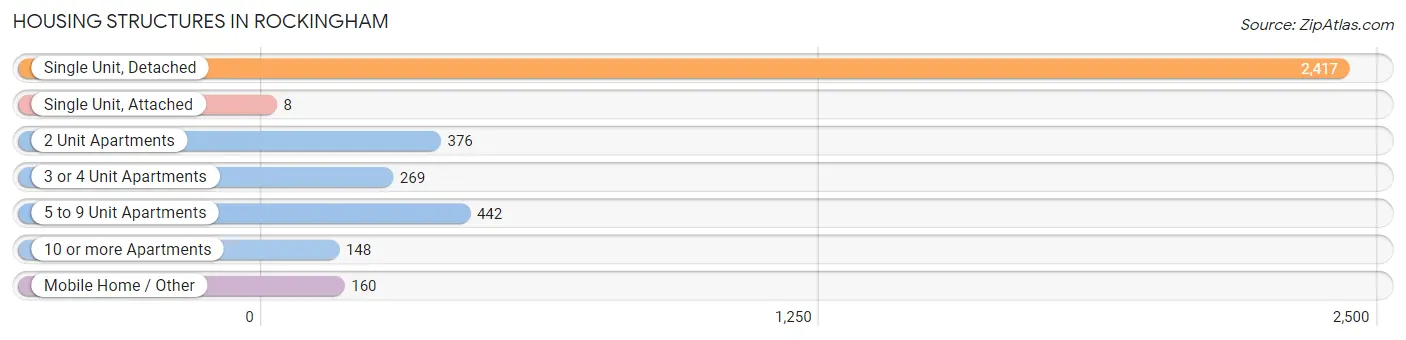
| Structure Type | # Housing Units | % Housing Units |
| Single Unit, Detached | 2,417 | 63.3% |
| Single Unit, Attached | 8 | 0.2% |
| 2 Unit Apartments | 376 | 9.8% |
| 3 or 4 Unit Apartments | 269 | 7.0% |
| 5 to 9 Unit Apartments | 442 | 11.6% |
| 10 or more Apartments | 148 | 3.9% |
| Mobile Home / Other | 160 | 4.2% |
| Total | 3,820 | 100.0% |
Housing Structures by Occupancy in Rockingham
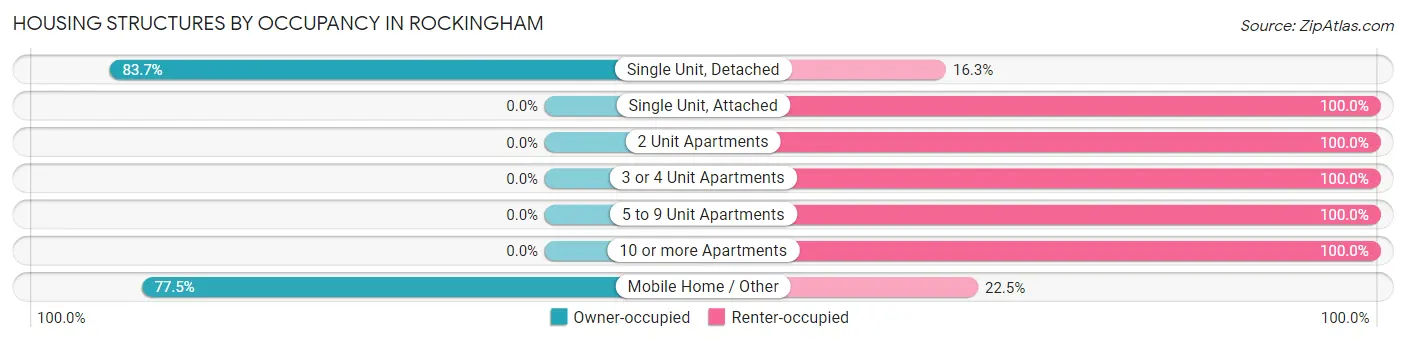
| Structure Type | Owner-occupied | Renter-occupied |
| Single Unit, Detached | 2,022 (83.7%) | 395 (16.3%) |
| Single Unit, Attached | 0 (0.0%) | 8 (100.0%) |
| 2 Unit Apartments | 0 (0.0%) | 376 (100.0%) |
| 3 or 4 Unit Apartments | 0 (0.0%) | 269 (100.0%) |
| 5 to 9 Unit Apartments | 0 (0.0%) | 442 (100.0%) |
| 10 or more Apartments | 0 (0.0%) | 148 (100.0%) |
| Mobile Home / Other | 124 (77.5%) | 36 (22.5%) |
| Total | 2,146 (56.2%) | 1,674 (43.8%) |
Housing Structures by Number of Rooms in Rockingham
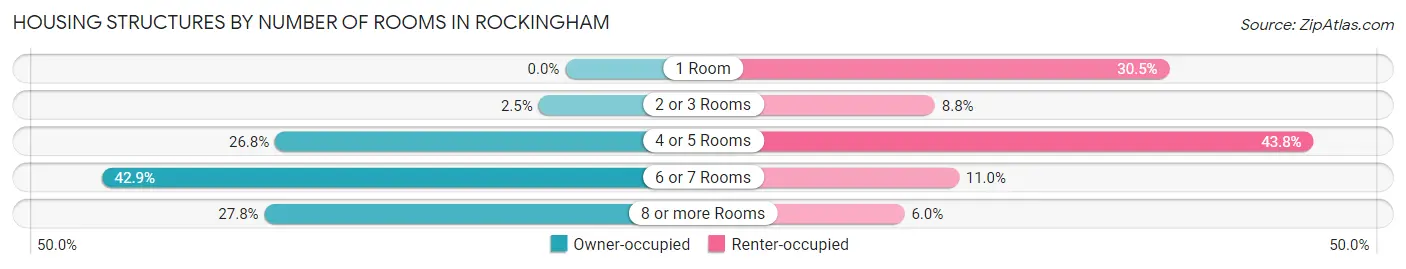
| Number of Rooms | Owner-occupied | Renter-occupied |
| 1 Room | 0 (0.0%) | 510 (30.5%) |
| 2 or 3 Rooms | 53 (2.5%) | 147 (8.8%) |
| 4 or 5 Rooms | 576 (26.8%) | 733 (43.8%) |
| 6 or 7 Rooms | 920 (42.9%) | 184 (11.0%) |
| 8 or more Rooms | 597 (27.8%) | 100 (6.0%) |
| Total | 2,146 (100.0%) | 1,674 (100.0%) |
Housing Structure by Heating Type in Rockingham
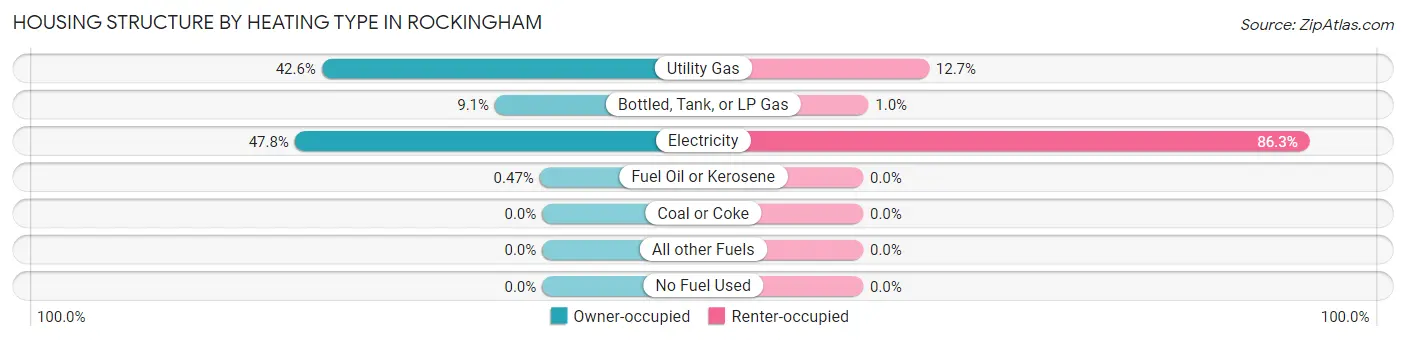
| Heating Type | Owner-occupied | Renter-occupied |
| Utility Gas | 914 (42.6%) | 213 (12.7%) |
| Bottled, Tank, or LP Gas | 196 (9.1%) | 17 (1.0%) |
| Electricity | 1,026 (47.8%) | 1,444 (86.3%) |
| Fuel Oil or Kerosene | 10 (0.5%) | 0 (0.0%) |
| Coal or Coke | 0 (0.0%) | 0 (0.0%) |
| All other Fuels | 0 (0.0%) | 0 (0.0%) |
| No Fuel Used | 0 (0.0%) | 0 (0.0%) |
| Total | 2,146 (100.0%) | 1,674 (100.0%) |
Household Vehicle Usage in Rockingham
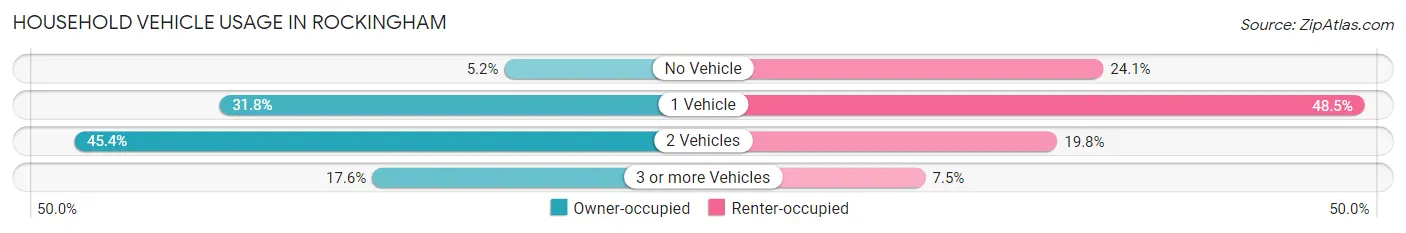
| Vehicles per Household | Owner-occupied | Renter-occupied |
| No Vehicle | 112 (5.2%) | 404 (24.1%) |
| 1 Vehicle | 683 (31.8%) | 812 (48.5%) |
| 2 Vehicles | 974 (45.4%) | 332 (19.8%) |
| 3 or more Vehicles | 377 (17.6%) | 126 (7.5%) |
| Total | 2,146 (100.0%) | 1,674 (100.0%) |
Real Estate & Mortgages in Rockingham
Real Estate and Mortgage Overview in Rockingham
| Characteristic | Without Mortgage | With Mortgage |
| Housing Units | 1,019 | 1,127 |
| Median Property Value | $105,600 | $142,400 |
| Median Household Income | $58,370 | $86 |
| Monthly Housing Costs | $419 | $73 |
| Real Estate Taxes | $1,093 | $11 |
Property Value by Mortgage Status in Rockingham
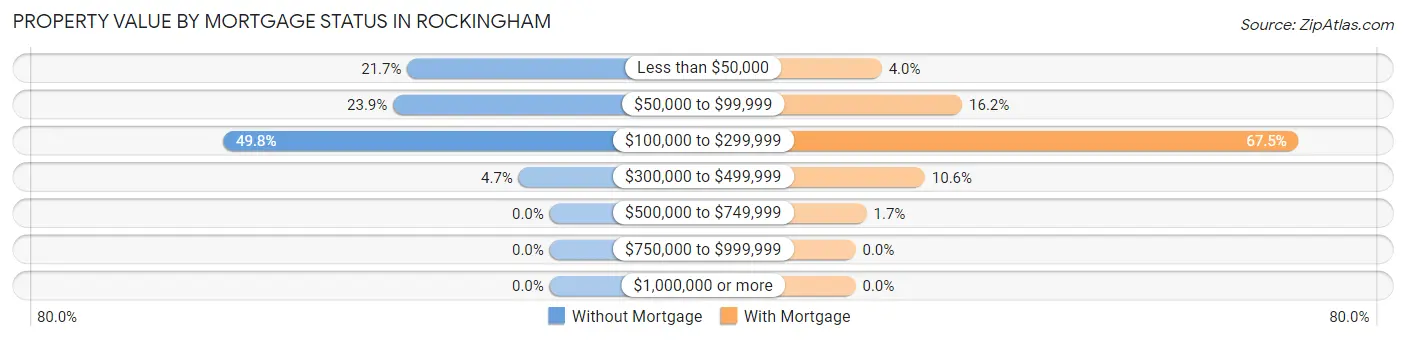
| Property Value | Without Mortgage | With Mortgage |
| Less than $50,000 | 221 (21.7%) | 45 (4.0%) |
| $50,000 to $99,999 | 243 (23.8%) | 183 (16.2%) |
| $100,000 to $299,999 | 507 (49.7%) | 761 (67.5%) |
| $300,000 to $499,999 | 48 (4.7%) | 119 (10.6%) |
| $500,000 to $749,999 | 0 (0.0%) | 19 (1.7%) |
| $750,000 to $999,999 | 0 (0.0%) | 0 (0.0%) |
| $1,000,000 or more | 0 (0.0%) | 0 (0.0%) |
| Total | 1,019 (100.0%) | 1,127 (100.0%) |
Household Income by Mortgage Status in Rockingham
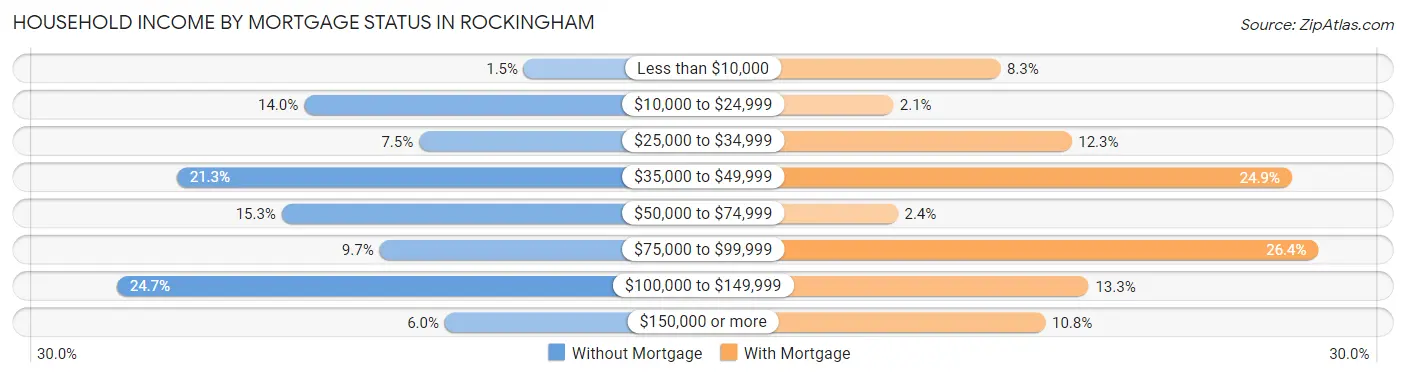
| Household Income | Without Mortgage | With Mortgage |
| Less than $10,000 | 15 (1.5%) | 93 (8.3%) |
| $10,000 to $24,999 | 143 (14.0%) | 24 (2.1%) |
| $25,000 to $34,999 | 76 (7.5%) | 139 (12.3%) |
| $35,000 to $49,999 | 217 (21.3%) | 281 (24.9%) |
| $50,000 to $74,999 | 156 (15.3%) | 27 (2.4%) |
| $75,000 to $99,999 | 99 (9.7%) | 298 (26.4%) |
| $100,000 to $149,999 | 252 (24.7%) | 150 (13.3%) |
| $150,000 or more | 61 (6.0%) | 122 (10.8%) |
| Total | 1,019 (100.0%) | 1,127 (100.0%) |
Property Value to Household Income Ratio in Rockingham
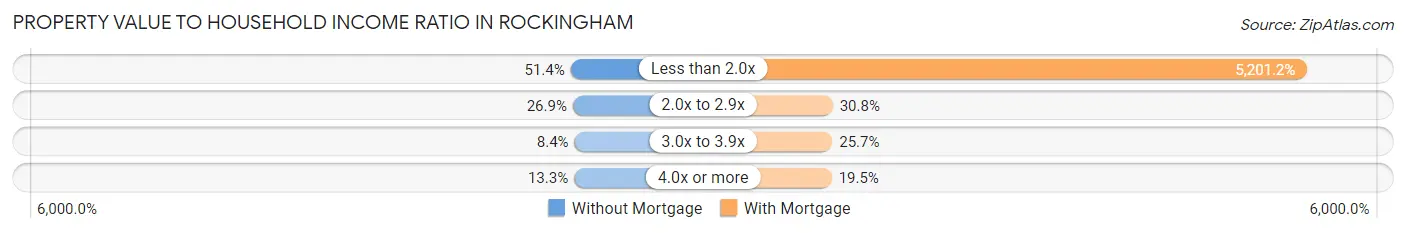
| Value-to-Income Ratio | Without Mortgage | With Mortgage |
| Less than 2.0x | 524 (51.4%) | 58,618 (5,201.2%) |
| 2.0x to 2.9x | 274 (26.9%) | 347 (30.8%) |
| 3.0x to 3.9x | 86 (8.4%) | 290 (25.7%) |
| 4.0x or more | 135 (13.3%) | 220 (19.5%) |
| Total | 1,019 (100.0%) | 1,127 (100.0%) |
Real Estate Taxes by Mortgage Status in Rockingham
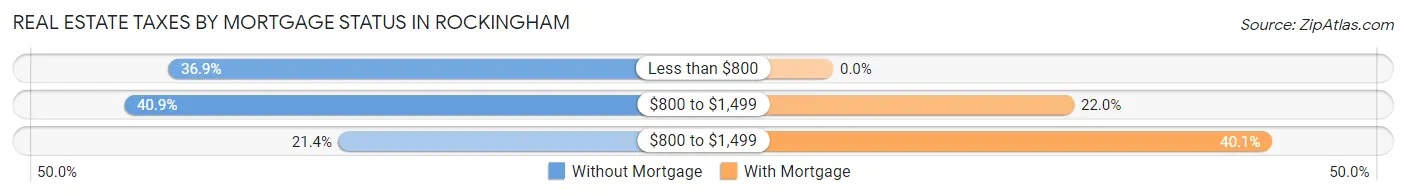
| Property Taxes | Without Mortgage | With Mortgage |
| Less than $800 | 376 (36.9%) | 0 (0.0%) |
| $800 to $1,499 | 417 (40.9%) | 248 (22.0%) |
| $800 to $1,499 | 218 (21.4%) | 452 (40.1%) |
| Total | 1,019 (100.0%) | 1,127 (100.0%) |
Health & Disability in Rockingham
Health Insurance Coverage by Age in Rockingham
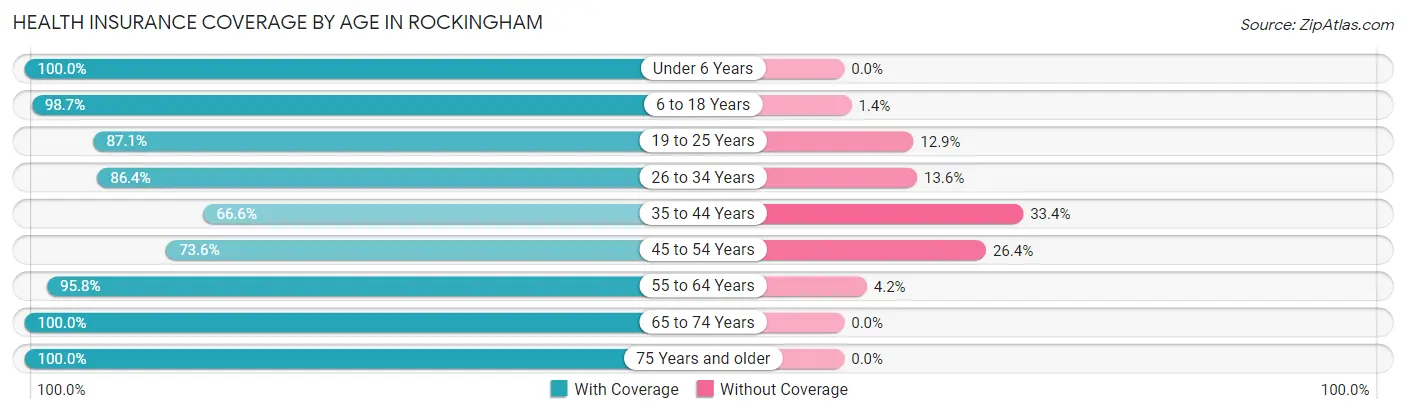
| Age Bracket | With Coverage | Without Coverage |
| Under 6 Years | 565 (100.0%) | 0 (0.0%) |
| 6 to 18 Years | 1,607 (98.7%) | 22 (1.3%) |
| 19 to 25 Years | 812 (87.1%) | 120 (12.9%) |
| 26 to 34 Years | 797 (86.4%) | 125 (13.6%) |
| 35 to 44 Years | 617 (66.6%) | 309 (33.4%) |
| 45 to 54 Years | 713 (73.6%) | 256 (26.4%) |
| 55 to 64 Years | 1,275 (95.8%) | 56 (4.2%) |
| 65 to 74 Years | 997 (100.0%) | 0 (0.0%) |
| 75 Years and older | 715 (100.0%) | 0 (0.0%) |
| Total | 8,098 (90.1%) | 888 (9.9%) |
Health Insurance Coverage by Citizenship Status in Rockingham
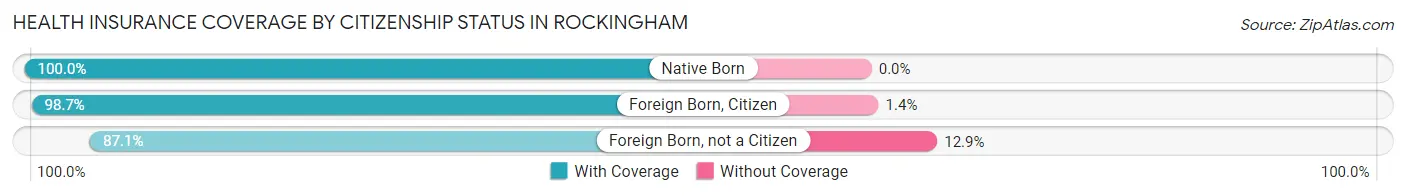
| Citizenship Status | With Coverage | Without Coverage |
| Native Born | 565 (100.0%) | 0 (0.0%) |
| Foreign Born, Citizen | 1,607 (98.7%) | 22 (1.3%) |
| Foreign Born, not a Citizen | 812 (87.1%) | 120 (12.9%) |
Health Insurance Coverage by Household Income in Rockingham
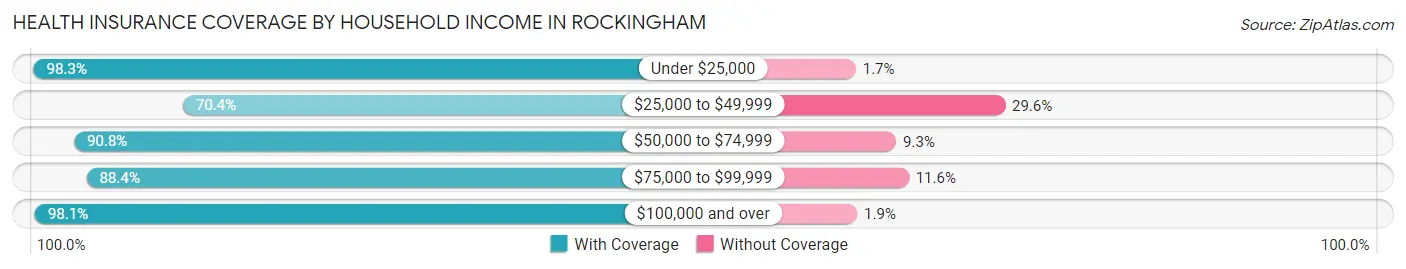
| Household Income | With Coverage | Without Coverage |
| Under $25,000 | 2,616 (98.3%) | 45 (1.7%) |
| $25,000 to $49,999 | 1,142 (70.4%) | 481 (29.6%) |
| $50,000 to $74,999 | 1,157 (90.7%) | 118 (9.2%) |
| $75,000 to $99,999 | 1,593 (88.4%) | 209 (11.6%) |
| $100,000 and over | 1,564 (98.1%) | 31 (1.9%) |
Public vs Private Health Insurance Coverage by Age in Rockingham
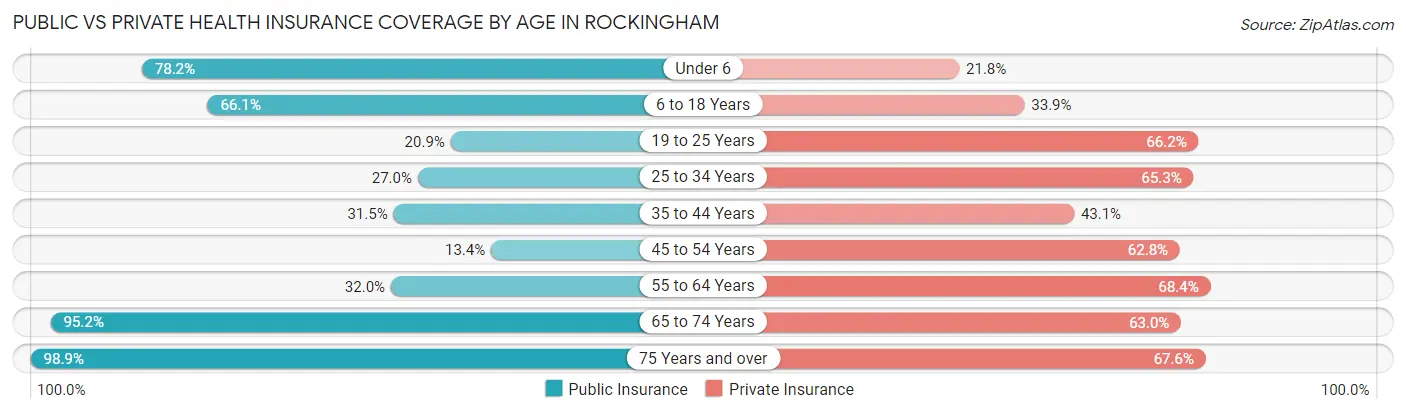
| Age Bracket | Public Insurance | Private Insurance |
| Under 6 | 442 (78.2%) | 123 (21.8%) |
| 6 to 18 Years | 1,076 (66.0%) | 552 (33.9%) |
| 19 to 25 Years | 195 (20.9%) | 617 (66.2%) |
| 25 to 34 Years | 249 (27.0%) | 602 (65.3%) |
| 35 to 44 Years | 292 (31.5%) | 399 (43.1%) |
| 45 to 54 Years | 130 (13.4%) | 608 (62.7%) |
| 55 to 64 Years | 426 (32.0%) | 911 (68.4%) |
| 65 to 74 Years | 949 (95.2%) | 628 (63.0%) |
| 75 Years and over | 707 (98.9%) | 483 (67.5%) |
| Total | 4,466 (49.7%) | 4,923 (54.8%) |
Disability Status by Sex by Age in Rockingham
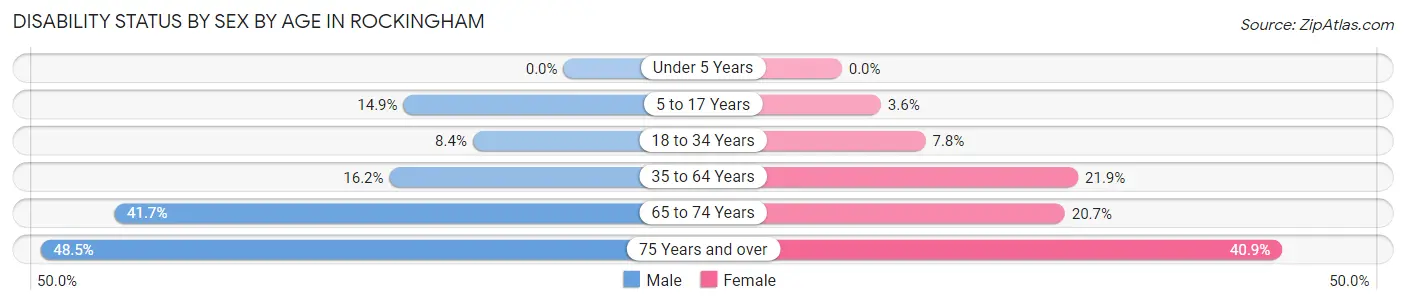
| Age Bracket | Male | Female |
| Under 5 Years | 0 (0.0%) | 0 (0.0%) |
| 5 to 17 Years | 131 (14.8%) | 29 (3.6%) |
| 18 to 34 Years | 78 (8.4%) | 72 (7.8%) |
| 35 to 64 Years | 233 (16.2%) | 391 (21.9%) |
| 65 to 74 Years | 188 (41.7%) | 113 (20.7%) |
| 75 Years and over | 132 (48.5%) | 181 (40.9%) |
Disability Class by Sex by Age in Rockingham
Disability Class: Hearing Difficulty
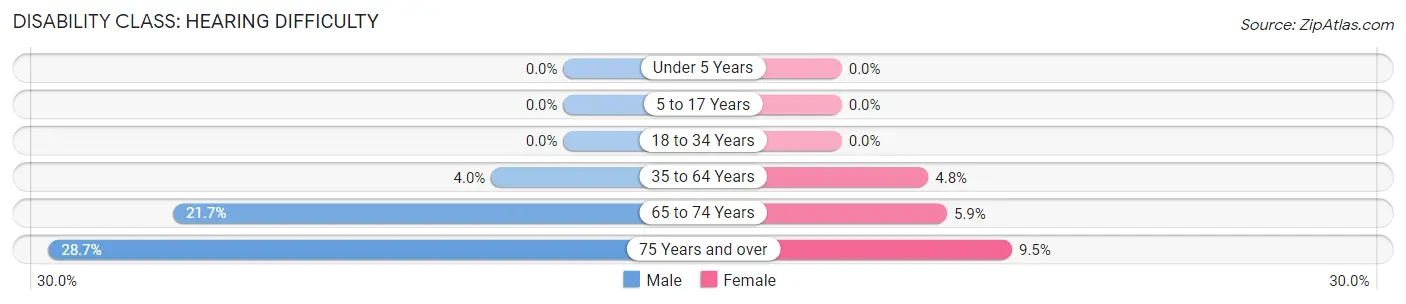
| Age Bracket | Male | Female |
| Under 5 Years | 0 (0.0%) | 0 (0.0%) |
| 5 to 17 Years | 0 (0.0%) | 0 (0.0%) |
| 18 to 34 Years | 0 (0.0%) | 0 (0.0%) |
| 35 to 64 Years | 58 (4.0%) | 86 (4.8%) |
| 65 to 74 Years | 98 (21.7%) | 32 (5.9%) |
| 75 Years and over | 78 (28.7%) | 42 (9.5%) |
Disability Class: Vision Difficulty
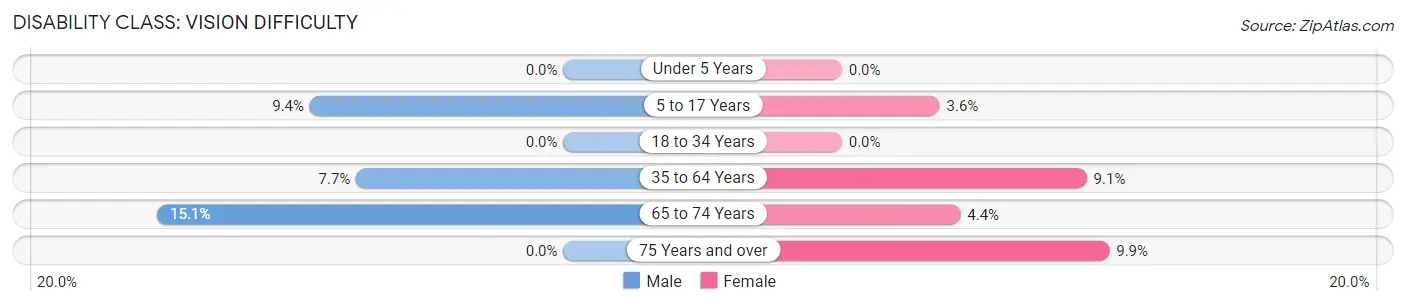
| Age Bracket | Male | Female |
| Under 5 Years | 0 (0.0%) | 0 (0.0%) |
| 5 to 17 Years | 83 (9.4%) | 29 (3.6%) |
| 18 to 34 Years | 0 (0.0%) | 0 (0.0%) |
| 35 to 64 Years | 111 (7.7%) | 162 (9.1%) |
| 65 to 74 Years | 68 (15.1%) | 24 (4.4%) |
| 75 Years and over | 0 (0.0%) | 44 (9.9%) |
Disability Class: Cognitive Difficulty
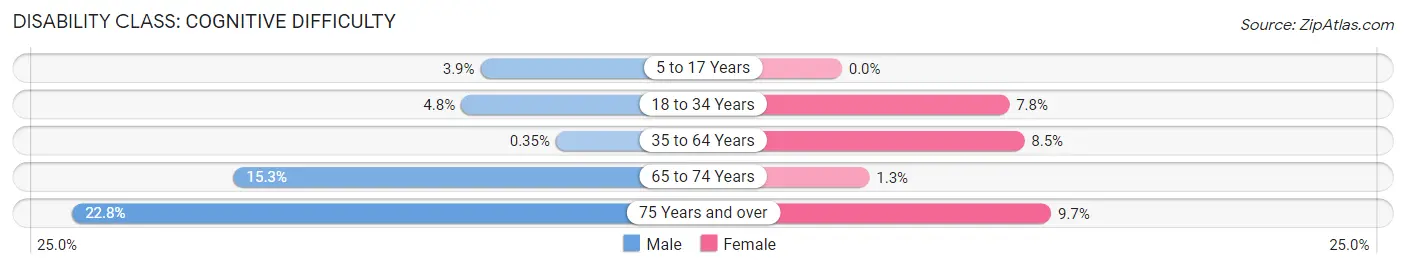
| Age Bracket | Male | Female |
| 5 to 17 Years | 34 (3.8%) | 0 (0.0%) |
| 18 to 34 Years | 44 (4.8%) | 72 (7.8%) |
| 35 to 64 Years | 5 (0.4%) | 151 (8.5%) |
| 65 to 74 Years | 69 (15.3%) | 7 (1.3%) |
| 75 Years and over | 62 (22.8%) | 43 (9.7%) |
Disability Class: Ambulatory Difficulty
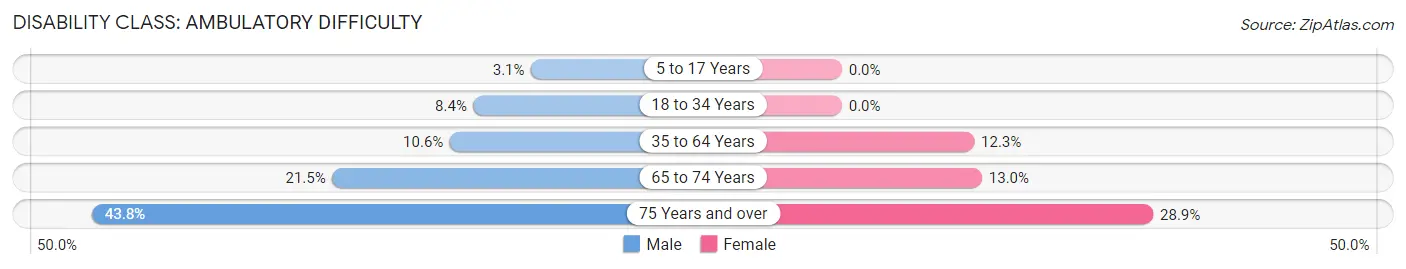
| Age Bracket | Male | Female |
| 5 to 17 Years | 27 (3.1%) | 0 (0.0%) |
| 18 to 34 Years | 78 (8.4%) | 0 (0.0%) |
| 35 to 64 Years | 153 (10.6%) | 219 (12.3%) |
| 65 to 74 Years | 97 (21.5%) | 71 (13.0%) |
| 75 Years and over | 119 (43.8%) | 128 (28.9%) |
Disability Class: Self-Care Difficulty
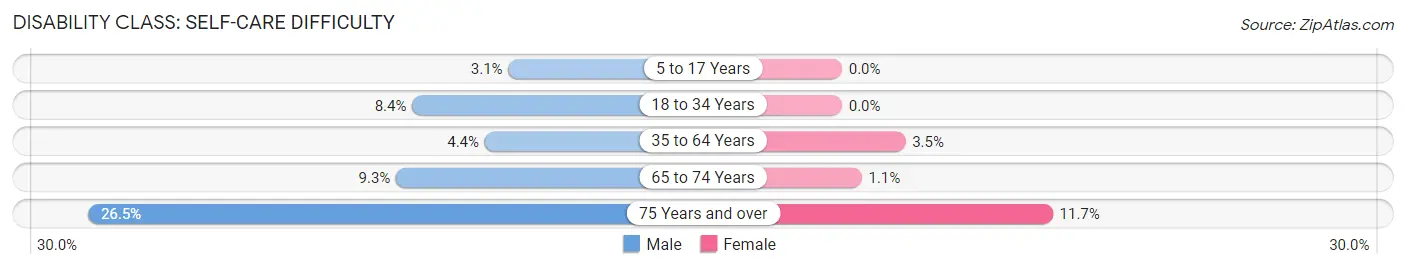
| Age Bracket | Male | Female |
| 5 to 17 Years | 27 (3.1%) | 0 (0.0%) |
| 18 to 34 Years | 78 (8.4%) | 0 (0.0%) |
| 35 to 64 Years | 63 (4.4%) | 63 (3.5%) |
| 65 to 74 Years | 42 (9.3%) | 6 (1.1%) |
| 75 Years and over | 72 (26.5%) | 52 (11.7%) |
Technology Access in Rockingham
Computing Device Access in Rockingham
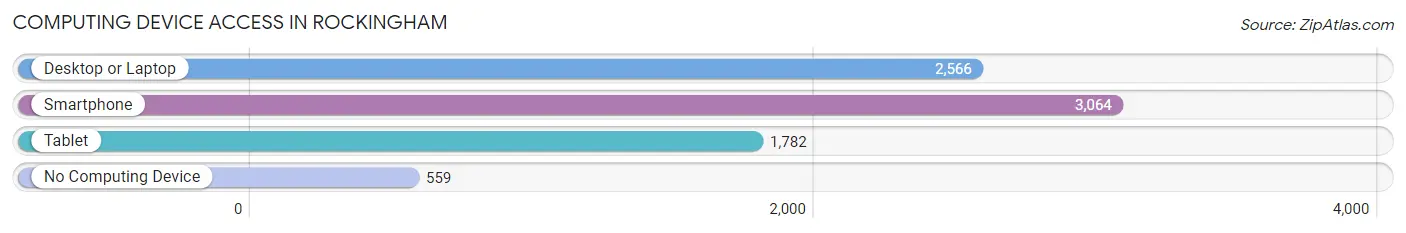
| Device Type | # Households | % Households |
| Desktop or Laptop | 2,566 | 67.2% |
| Smartphone | 3,064 | 80.2% |
| Tablet | 1,782 | 46.7% |
| No Computing Device | 559 | 14.6% |
| Total | 3,820 | 100.0% |
Internet Access in Rockingham
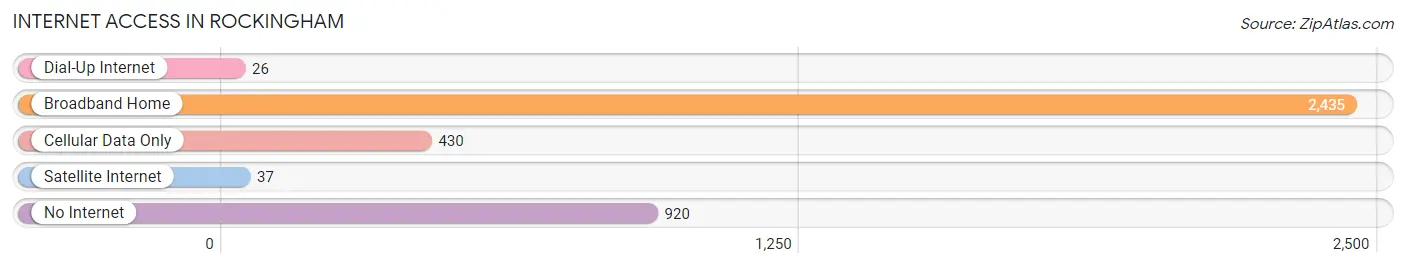
| Internet Type | # Households | % Households |
| Dial-Up Internet | 26 | 0.7% |
| Broadband Home | 2,435 | 63.7% |
| Cellular Data Only | 430 | 11.3% |
| Satellite Internet | 37 | 1.0% |
| No Internet | 920 | 24.1% |
| Total | 3,820 | 100.0% |
Rockingham Summary
Rockingham is a city located in Richmond County, North Carolina, United States. It is the county seat of Richmond County and is located in the heart of the Piedmont region of North Carolina. The population was 9,558 at the 2010 census.
Geography
Rockingham is located at 34°55'25" North, 79°45'25" West (34.923862, -79.756945). According to the United States Census Bureau, the city has a total area of 8.2 square miles (21.2 km2), of which 8.1 square miles (21.0 km2) is land and 0.1 square miles (0.2 km2) is water.
Rockingham is located in the Piedmont region of North Carolina, which is characterized by rolling hills and flat plains. The city is situated on the banks of the Deep River, which is a tributary of the Cape Fear River. The city is also located near the Uwharrie National Forest, which is a popular destination for outdoor recreation.
History
Rockingham was founded in 1785 by William Richardson, a Revolutionary War veteran. The city was named after the Earl of Rockingham, a British Prime Minister. The city was incorporated in 1873 and has since grown to become the county seat of Richmond County.
Rockingham has a rich history of industry and commerce. The city was once home to a thriving textile industry, which provided jobs for many of the city’s residents. The city was also home to a large furniture manufacturing industry, which provided jobs for many of the city’s residents.
Economy
Rockingham’s economy is largely based on agriculture and manufacturing. The city is home to a number of large agricultural operations, including poultry, beef, and dairy farms. The city is also home to a number of manufacturing operations, including furniture, textiles, and automotive parts.
The city is also home to a number of retail and service businesses, including restaurants, banks, and other businesses. The city is also home to a number of medical facilities, including a hospital and several medical clinics.
Demographics
As of the 2010 census, the population of Rockingham was 9,558. The racial makeup of the city was 63.2% White, 33.3% African American, 0.4% Native American, 0.7% Asian, 0.1% Pacific Islander, and 1.3% from other races. Hispanic or Latino of any race were 2.2% of the population.
The median income for a household in the city was $30,945, and the median income for a family was $37,945. The per capita income for the city was $17,845. About 18.2% of families and 22.2% of the population were below the poverty line, including 33.3% of those under age 18 and 16.2% of those age 65 or over.
Conclusion
Rockingham is a city located in Richmond County, North Carolina. It is the county seat of Richmond County and is located in the heart of the Piedmont region of North Carolina. The city has a rich history of industry and commerce and is home to a number of large agricultural and manufacturing operations. The population of Rockingham was 9,558 at the 2010 census, and the median income for a household in the city was $30,945. Rockingham is a vibrant city with a diverse economy and a rich history.
Common Questions
What is Per Capita Income in Rockingham?
Per Capita income in Rockingham is $25,836.
What is the Median Family Income in Rockingham?
Median Family Income in Rockingham is $58,448.
What is the Median Household income in Rockingham?
Median Household Income in Rockingham is $38,750.
What is Income or Wage Gap in Rockingham?
Income or Wage Gap in Rockingham is 51.2%.
Women in Rockingham earn 48.8 cents for every dollar earned by a man.
What is Inequality or Gini Index in Rockingham?
Inequality or Gini Index in Rockingham is 0.48.
What is the Total Population of Rockingham?
Total Population of Rockingham is 9,174.
What is the Total Male Population of Rockingham?
Total Male Population of Rockingham is 4,296.
What is the Total Female Population of Rockingham?
Total Female Population of Rockingham is 4,878.
What is the Ratio of Males per 100 Females in Rockingham?
There are 88.07 Males per 100 Females in Rockingham.
What is the Ratio of Females per 100 Males in Rockingham?
There are 113.55 Females per 100 Males in Rockingham.
What is the Median Population Age in Rockingham?
Median Population Age in Rockingham is 40.0 Years.
What is the Average Family Size in Rockingham
Average Family Size in Rockingham is 3.1 People.
What is the Average Household Size in Rockingham
Average Household Size in Rockingham is 2.4 People.
How Large is the Labor Force in Rockingham?
There are 4,201 People in the Labor Forcein in Rockingham.
What is the Percentage of People in the Labor Force in Rockingham?
59.2% of People are in the Labor Force in Rockingham.
What is the Unemployment Rate in Rockingham?
Unemployment Rate in Rockingham is 7.2%.