Cofield, NC Map & Demographics
Cofield Map
Cofield Overview
$40,777
PER CAPITA INCOME
$58,750
AVG FAMILY INCOME
$60,417
AVG HOUSEHOLD INCOME
7.5%
WAGE / INCOME GAP [ % ]
92.5¢/ $1
WAGE / INCOME GAP [ $ ]
0.60
INEQUALITY / GINI INDEX
384
TOTAL POPULATION
230
MALE POPULATION
154
FEMALE POPULATION
149.35
MALES / 100 FEMALES
66.96
FEMALES / 100 MALES
40.0
MEDIAN AGE
2.7
AVG FAMILY SIZE
2.2
AVG HOUSEHOLD SIZE
194
LABOR FORCE [ PEOPLE ]
62.0%
PERCENT IN LABOR FORCE
17.5%
UNEMPLOYMENT RATE
Cofield Zip Codes
Cofield Area Codes
Income in Cofield
Income Overview in Cofield
Per Capita Income in Cofield is $40,777, while median incomes of families and households are $58,750 and $60,417 respectively.
| Characteristic | Number | Measure |
| Per Capita Income | 384 | $40,777 |
| Median Family Income | 116 | $58,750 |
| Mean Family Income | 116 | $108,111 |
| Median Household Income | 173 | $60,417 |
| Mean Household Income | 173 | $95,406 |
| Income Deficit | 116 | $0 |
| Wage / Income Gap (%) | 384 | 7.49% |
| Wage / Income Gap ($) | 384 | 92.51¢ per $1 |
| Gini / Inequality Index | 384 | 0.60 |
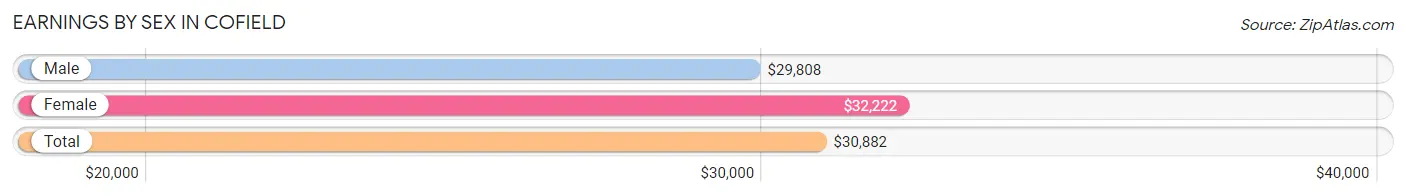
Earnings by Sex in Cofield
Average Earnings in Cofield are $30,882, $29,808 for men and $32,222 for women, a difference of 7.5%.
| Sex | Number | Average Earnings |
| Male | 106 (56.4%) | $29,808 |
| Female | 82 (43.6%) | $32,222 |
| Total | 188 (100.0%) | $30,882 |
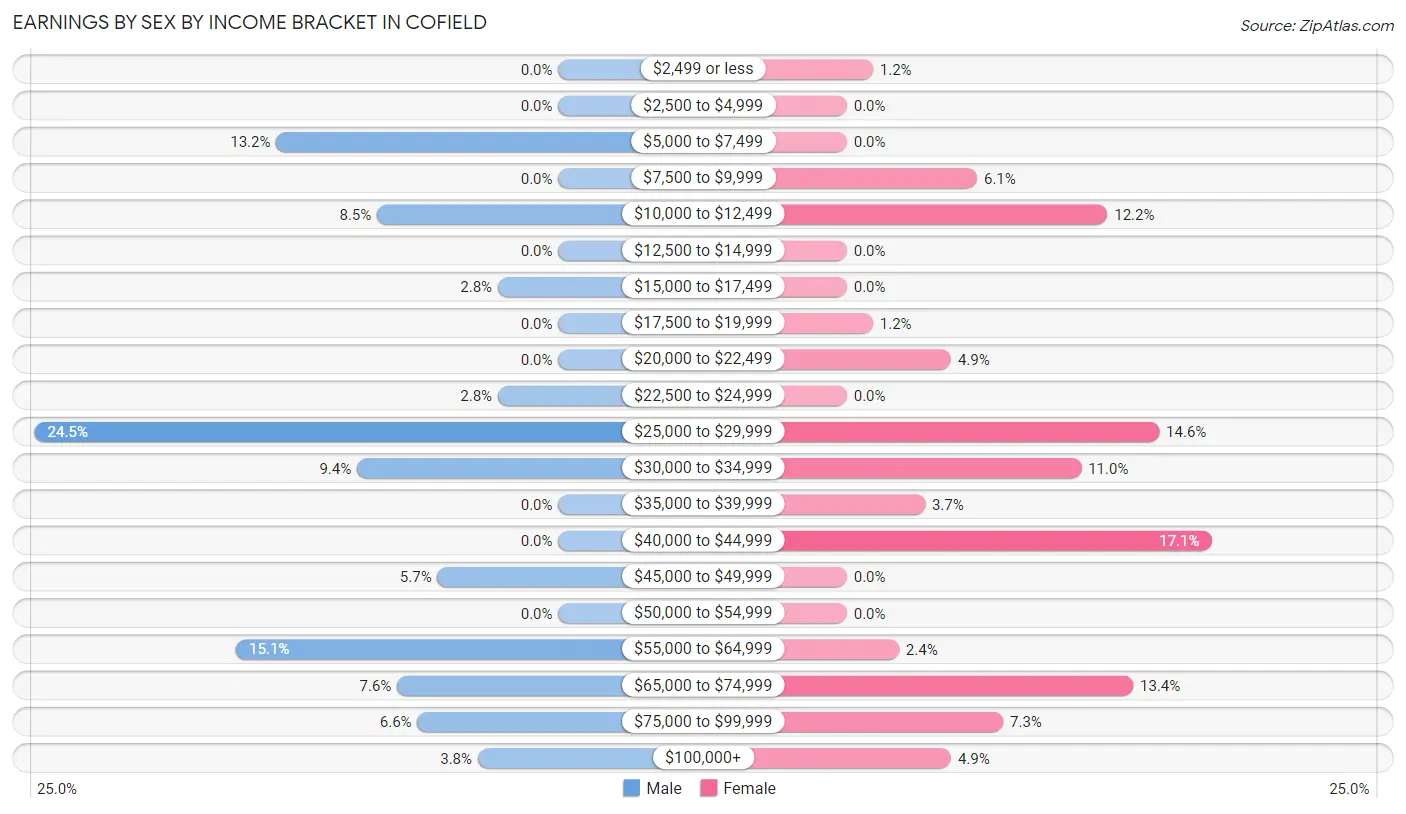
Earnings by Sex by Income Bracket in Cofield
The most common earnings brackets in Cofield are $25,000 to $29,999 for men (26 | 24.5%) and $40,000 to $44,999 for women (14 | 17.1%).
| Income | Male | Female |
| $2,499 or less | 0 (0.0%) | 1 (1.2%) |
| $2,500 to $4,999 | 0 (0.0%) | 0 (0.0%) |
| $5,000 to $7,499 | 14 (13.2%) | 0 (0.0%) |
| $7,500 to $9,999 | 0 (0.0%) | 5 (6.1%) |
| $10,000 to $12,499 | 9 (8.5%) | 10 (12.2%) |
| $12,500 to $14,999 | 0 (0.0%) | 0 (0.0%) |
| $15,000 to $17,499 | 3 (2.8%) | 0 (0.0%) |
| $17,500 to $19,999 | 0 (0.0%) | 1 (1.2%) |
| $20,000 to $22,499 | 0 (0.0%) | 4 (4.9%) |
| $22,500 to $24,999 | 3 (2.8%) | 0 (0.0%) |
| $25,000 to $29,999 | 26 (24.5%) | 12 (14.6%) |
| $30,000 to $34,999 | 10 (9.4%) | 9 (11.0%) |
| $35,000 to $39,999 | 0 (0.0%) | 3 (3.7%) |
| $40,000 to $44,999 | 0 (0.0%) | 14 (17.1%) |
| $45,000 to $49,999 | 6 (5.7%) | 0 (0.0%) |
| $50,000 to $54,999 | 0 (0.0%) | 0 (0.0%) |
| $55,000 to $64,999 | 16 (15.1%) | 2 (2.4%) |
| $65,000 to $74,999 | 8 (7.5%) | 11 (13.4%) |
| $75,000 to $99,999 | 7 (6.6%) | 6 (7.3%) |
| $100,000+ | 4 (3.8%) | 4 (4.9%) |
| Total | 106 (100.0%) | 82 (100.0%) |
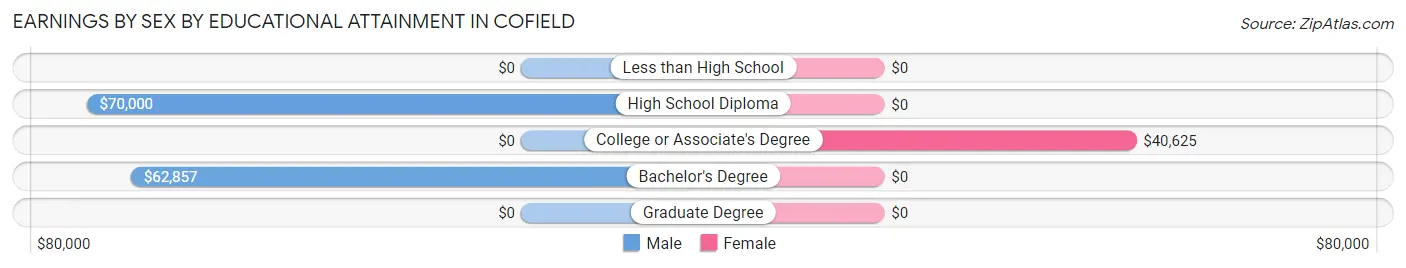
Earnings by Sex by Educational Attainment in Cofield
Average earnings in Cofield are $45,208 for men and $32,222 for women, a difference of 28.7%. Men with an educational attainment of high school diploma enjoy the highest average annual earnings of $70,000, while those with bachelor's degree education earn the least with $62,857. Women with an educational attainment of college or associate's degree earn the most with the average annual earnings of $40,625, while those with college or associate's degree education have the smallest earnings of $40,625.
| Educational Attainment | Male Income | Female Income |
| Less than High School | - | - |
| High School Diploma | $70,000 | $0 |
| College or Associate's Degree | - | - |
| Bachelor's Degree | $62,857 | $0 |
| Graduate Degree | - | - |
| Total | $45,208 | $32,222 |
Family Income in Cofield
Family Income Brackets in Cofield
According to the Cofield family income data, there are 22 families falling into the $100,000 to $149,999 income range, which is the most common income bracket and makes up 19.0% of all families.
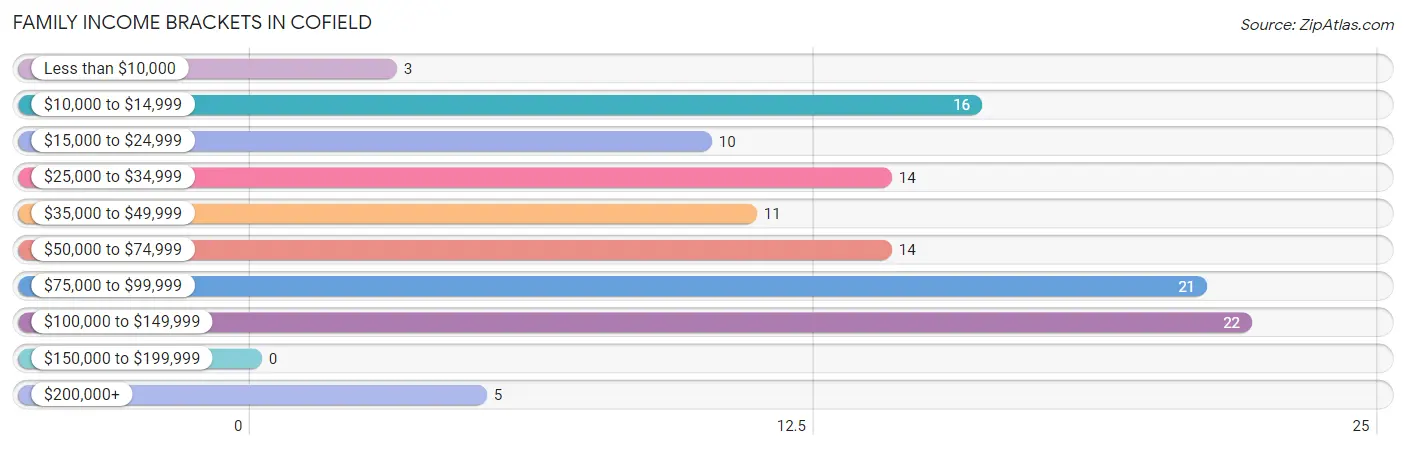
| Income Bracket | # Families | % Families |
| Less than $10,000 | 3 | 2.6% |
| $10,000 to $14,999 | 16 | 13.8% |
| $15,000 to $24,999 | 10 | 8.6% |
| $25,000 to $34,999 | 14 | 12.1% |
| $35,000 to $49,999 | 11 | 9.5% |
| $50,000 to $74,999 | 14 | 12.1% |
| $75,000 to $99,999 | 21 | 18.1% |
| $100,000 to $149,999 | 22 | 19.0% |
| $150,000 to $199,999 | 0 | 0.0% |
| $200,000+ | 5 | 4.3% |
Family Income by Famaliy Size in Cofield
3-person families (14 | 12.1%) account for the highest median family income in Cofield with $99,000 per family, while 3-person families (14 | 12.1%) have the highest median income of $33,000 per family member.
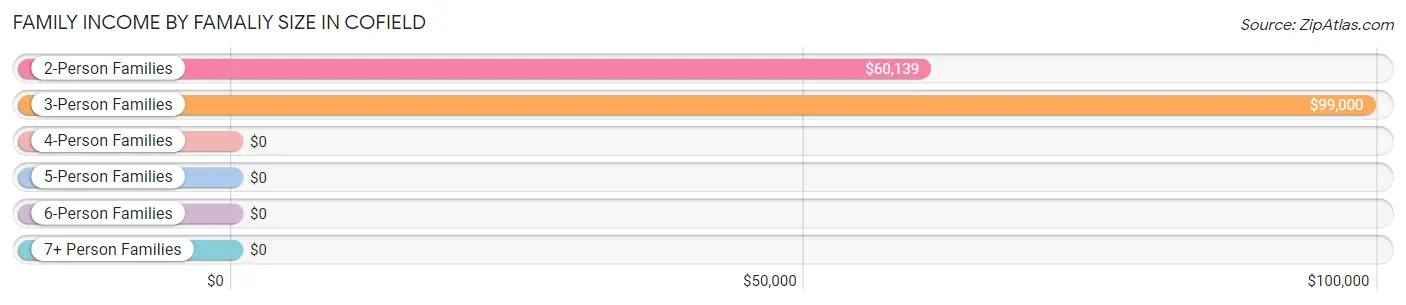
| Income Bracket | # Families | Median Income |
| 2-Person Families | 75 (64.7%) | $60,139 |
| 3-Person Families | 14 (12.1%) | $99,000 |
| 4-Person Families | 21 (18.1%) | $0 |
| 5-Person Families | 6 (5.2%) | $0 |
| 6-Person Families | 0 (0.0%) | $0 |
| 7+ Person Families | 0 (0.0%) | $0 |
| Total | 116 (100.0%) | $58,750 |
Family Income by Number of Earners in Cofield
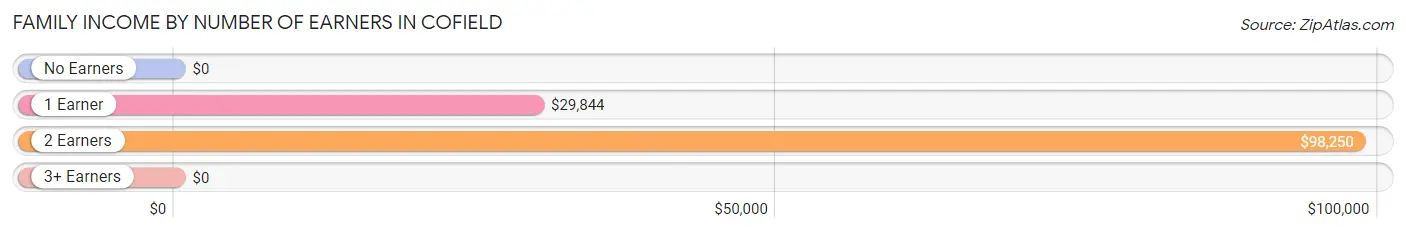
| Number of Earners | # Families | Median Income |
| No Earners | 32 (27.6%) | $0 |
| 1 Earner | 33 (28.4%) | $29,844 |
| 2 Earners | 51 (44.0%) | $98,250 |
| 3+ Earners | 0 (0.0%) | $0 |
| Total | 116 (100.0%) | $58,750 |
Household Income in Cofield
Household Income Brackets in Cofield
With 27 households falling in the category, the $75,000 to $99,999 income range is the most frequent in Cofield, accounting for 15.6% of all households.
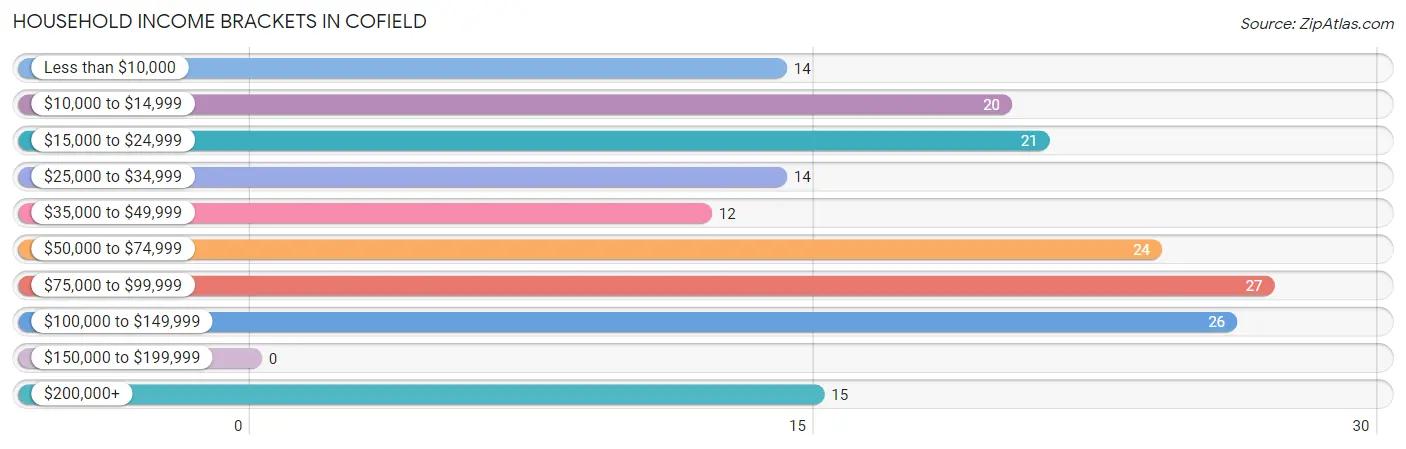
| Income Bracket | # Households | % Households |
| Less than $10,000 | 14 | 8.1% |
| $10,000 to $14,999 | 20 | 11.6% |
| $15,000 to $24,999 | 21 | 12.1% |
| $25,000 to $34,999 | 14 | 8.1% |
| $35,000 to $49,999 | 12 | 6.9% |
| $50,000 to $74,999 | 24 | 13.9% |
| $75,000 to $99,999 | 27 | 15.6% |
| $100,000 to $149,999 | 26 | 15.0% |
| $150,000 to $199,999 | 0 | 0.0% |
| $200,000+ | 15 | 8.7% |
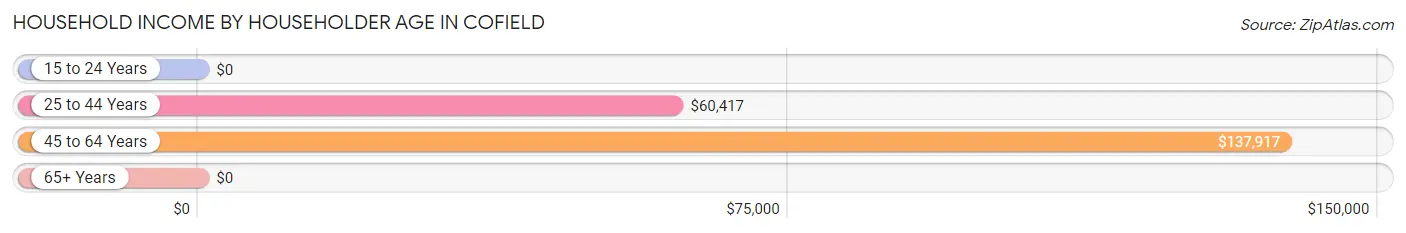
Household Income by Householder Age in Cofield
The median household income in Cofield is $60,417, with the highest median household income of $137,917 found in the 45 to 64 years age bracket for the primary householder. A total of 30 households (17.3%) fall into this category. Meanwhile, the 15 to 24 years age bracket for the primary householder has the lowest median household income of $0, with 7 households (4.1%) in this group.
| Income Bracket | # Households | Median Income |
| 15 to 24 Years | 7 (4.1%) | $0 |
| 25 to 44 Years | 79 (45.7%) | $60,417 |
| 45 to 64 Years | 30 (17.3%) | $137,917 |
| 65+ Years | 57 (33.0%) | $0 |
| Total | 173 (100.0%) | $60,417 |
Poverty in Cofield
Income Below Poverty by Sex and Age in Cofield
With 23.9% poverty level for males and 28.6% for females among the residents of Cofield, 45 to 54 year old males and under 5 year old females are the most vulnerable to poverty, with 6 males (75.0%) and 3 females (100.0%) in their respective age groups living below the poverty level.
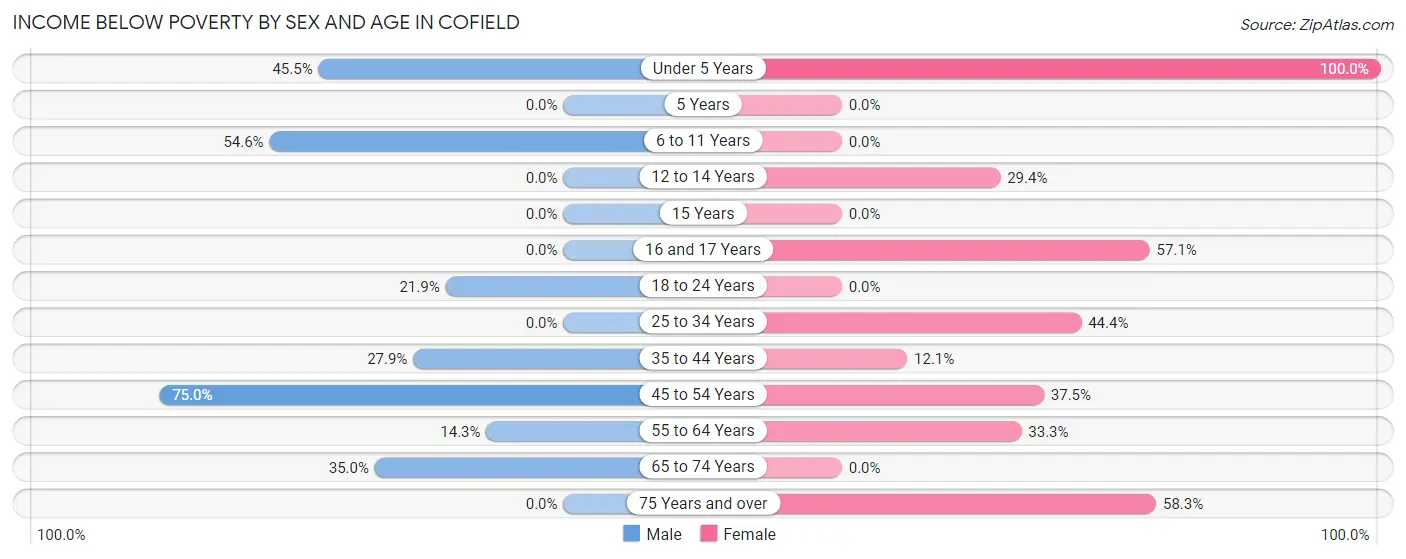
| Age Bracket | Male | Female |
| Under 5 Years | 5 (45.5%) | 3 (100.0%) |
| 5 Years | 0 (0.0%) | 0 (0.0%) |
| 6 to 11 Years | 12 (54.5%) | 0 (0.0%) |
| 12 to 14 Years | 0 (0.0%) | 5 (29.4%) |
| 15 Years | 0 (0.0%) | 0 (0.0%) |
| 16 and 17 Years | 0 (0.0%) | 4 (57.1%) |
| 18 to 24 Years | 7 (21.9%) | 0 (0.0%) |
| 25 to 34 Years | 0 (0.0%) | 4 (44.4%) |
| 35 to 44 Years | 17 (27.9%) | 4 (12.1%) |
| 45 to 54 Years | 6 (75.0%) | 6 (37.5%) |
| 55 to 64 Years | 1 (14.3%) | 11 (33.3%) |
| 65 to 74 Years | 7 (35.0%) | 0 (0.0%) |
| 75 Years and over | 0 (0.0%) | 7 (58.3%) |
| Total | 55 (23.9%) | 44 (28.6%) |
Income Above Poverty by Sex and Age in Cofield
According to the poverty statistics in Cofield, males aged 12 to 14 years and females aged 65 to 74 years are the age groups that are most secure financially, with 100.0% of males and 100.0% of females in these age groups living above the poverty line.
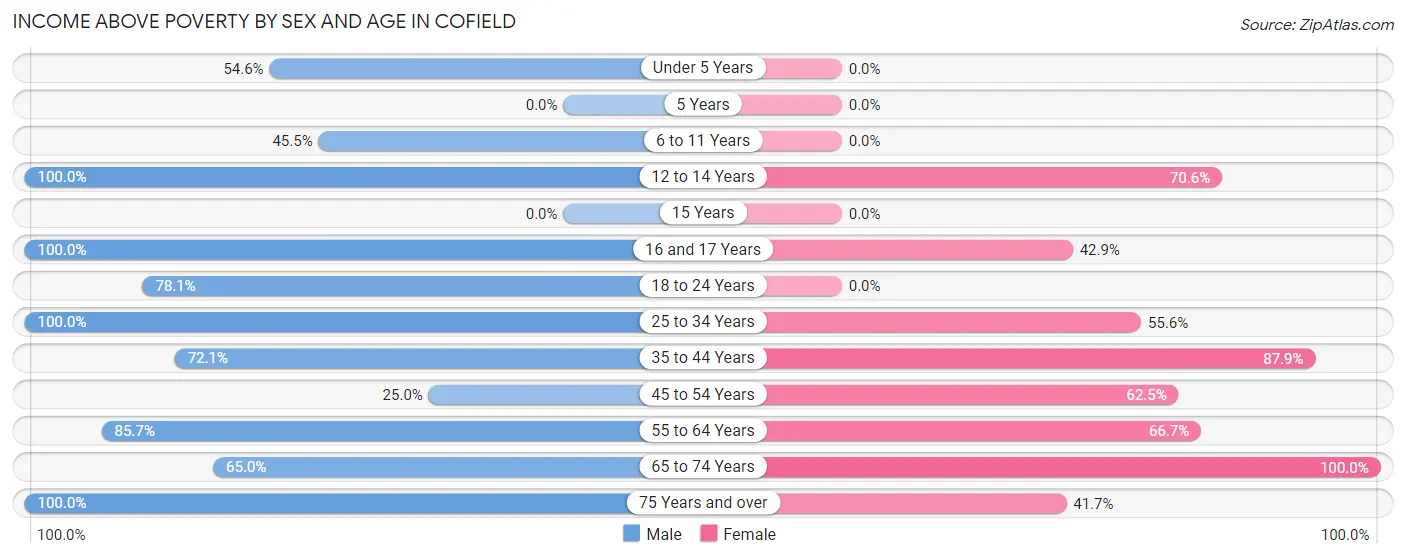
| Age Bracket | Male | Female |
| Under 5 Years | 6 (54.5%) | 0 (0.0%) |
| 5 Years | 0 (0.0%) | 0 (0.0%) |
| 6 to 11 Years | 10 (45.5%) | 0 (0.0%) |
| 12 to 14 Years | 18 (100.0%) | 12 (70.6%) |
| 15 Years | 0 (0.0%) | 0 (0.0%) |
| 16 and 17 Years | 2 (100.0%) | 3 (42.9%) |
| 18 to 24 Years | 25 (78.1%) | 0 (0.0%) |
| 25 to 34 Years | 35 (100.0%) | 5 (55.6%) |
| 35 to 44 Years | 44 (72.1%) | 29 (87.9%) |
| 45 to 54 Years | 2 (25.0%) | 10 (62.5%) |
| 55 to 64 Years | 6 (85.7%) | 22 (66.7%) |
| 65 to 74 Years | 13 (65.0%) | 24 (100.0%) |
| 75 Years and over | 14 (100.0%) | 5 (41.7%) |
| Total | 175 (76.1%) | 110 (71.4%) |
Income Below Poverty Among Married-Couple Families in Cofield
The poverty statistics for married-couple families in Cofield show that 10.4% or 5 of the total 48 families live below the poverty line. Families with 1 or 2 children have the highest poverty rate of 31.2%, comprising of 5 families. On the other hand, families with no children have the lowest poverty rate of 0.0%, which includes 0 families.
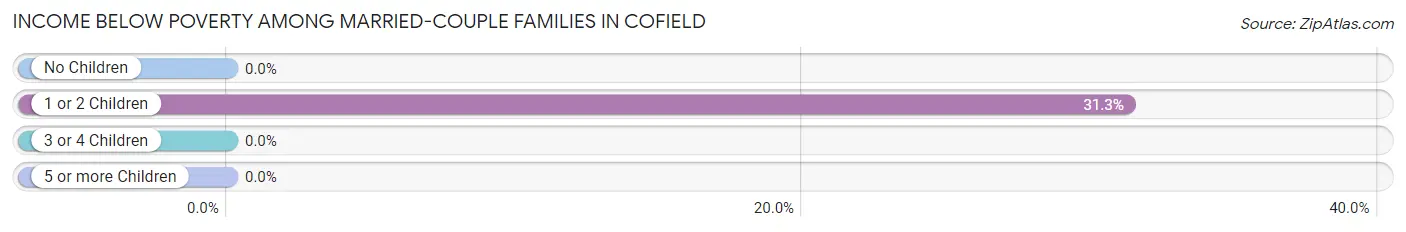
| Children | Above Poverty | Below Poverty |
| No Children | 26 (100.0%) | 0 (0.0%) |
| 1 or 2 Children | 11 (68.8%) | 5 (31.2%) |
| 3 or 4 Children | 6 (100.0%) | 0 (0.0%) |
| 5 or more Children | 0 (0.0%) | 0 (0.0%) |
| Total | 43 (89.6%) | 5 (10.4%) |
Income Below Poverty Among Single-Parent Households in Cofield
According to the poverty data in Cofield, 50.0% or 16 single-father households and 8.3% or 3 single-mother households are living below the poverty line. Among single-father households, those with no children have the highest poverty rate, with 9 households (100.0%) experiencing poverty. Likewise, among single-mother households, those with 1 or 2 children have the highest poverty rate, with 3 households (18.8%) falling below the poverty line.
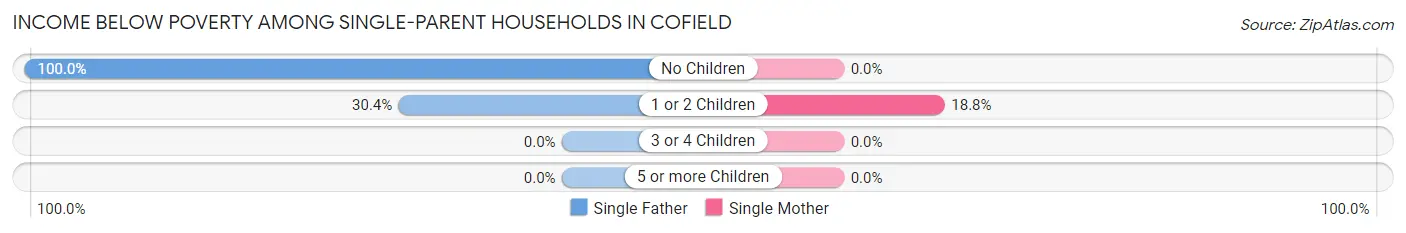
| Children | Single Father | Single Mother |
| No Children | 9 (100.0%) | 0 (0.0%) |
| 1 or 2 Children | 7 (30.4%) | 3 (18.8%) |
| 3 or 4 Children | 0 (0.0%) | 0 (0.0%) |
| 5 or more Children | 0 (0.0%) | 0 (0.0%) |
| Total | 16 (50.0%) | 3 (8.3%) |
Income Below Poverty Among Married-Couple vs Single-Parent Households in Cofield
The poverty data for Cofield shows that 5 of the married-couple family households (10.4%) and 19 of the single-parent households (27.9%) are living below the poverty level. Within the married-couple family households, those with 1 or 2 children have the highest poverty rate, with 5 households (31.2%) falling below the poverty line. Among the single-parent households, those with no children have the highest poverty rate, with 9 household (31.0%) living below poverty.
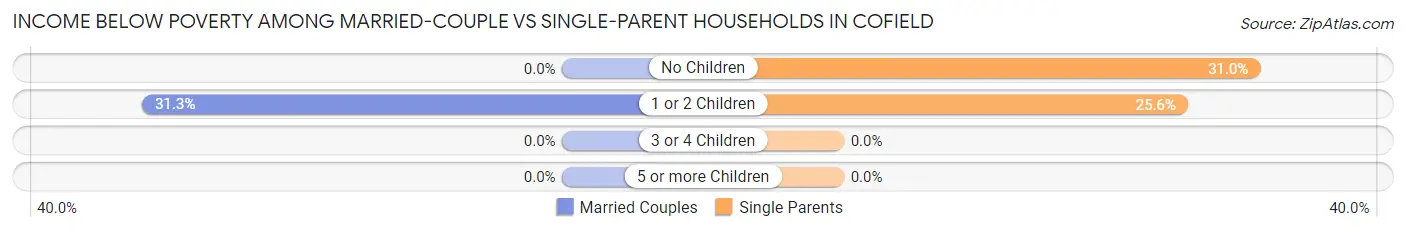
| Children | Married-Couple Families | Single-Parent Households |
| No Children | 0 (0.0%) | 9 (31.0%) |
| 1 or 2 Children | 5 (31.2%) | 10 (25.6%) |
| 3 or 4 Children | 0 (0.0%) | 0 (0.0%) |
| 5 or more Children | 0 (0.0%) | 0 (0.0%) |
| Total | 5 (10.4%) | 19 (27.9%) |
Race in Cofield
The most populous races in Cofield are Black / African American (314 | 81.8%), White / Caucasian (37 | 9.6%), and Hispanic or Latino (21 | 5.5%).
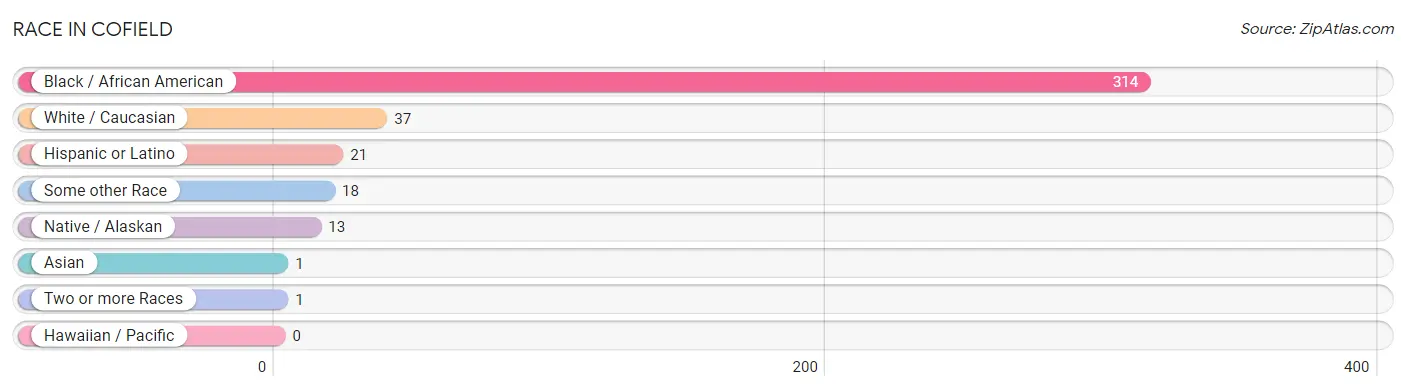
| Race | # Population | % Population |
| Asian | 1 | 0.3% |
| Black / African American | 314 | 81.8% |
| Hawaiian / Pacific | 0 | 0.0% |
| Hispanic or Latino | 21 | 5.5% |
| Native / Alaskan | 13 | 3.4% |
| White / Caucasian | 37 | 9.6% |
| Two or more Races | 1 | 0.3% |
| Some other Race | 18 | 4.7% |
| Total | 384 | 100.0% |
Ancestry in Cofield
The most populous ancestries reported in Cofield are Mexican (21 | 5.5%), American (14 | 3.6%), Cherokee (4 | 1.0%), English (2 | 0.5%), and Burmese (1 | 0.3%), together accounting for 10.9% of all Cofield residents.
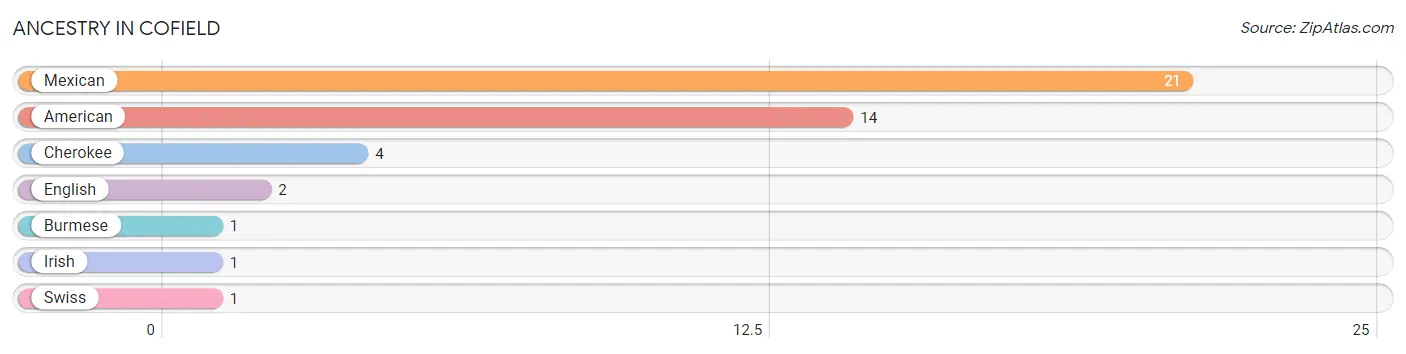
| Ancestry | # Population | % Population |
| American | 14 | 3.6% |
| Burmese | 1 | 0.3% |
| Cherokee | 4 | 1.0% |
| English | 2 | 0.5% |
| Irish | 1 | 0.3% |
| Mexican | 21 | 5.5% |
| Swiss | 1 | 0.3% | View All 7 Rows |
Immigrants in Cofield
The most numerous immigrant groups reported in Cofield came from Central America (18 | 4.7%), Latin America (18 | 4.7%), Mexico (18 | 4.7%), Asia (1 | 0.3%), and Eastern Asia (1 | 0.3%), together accounting for 14.6% of all Cofield residents.
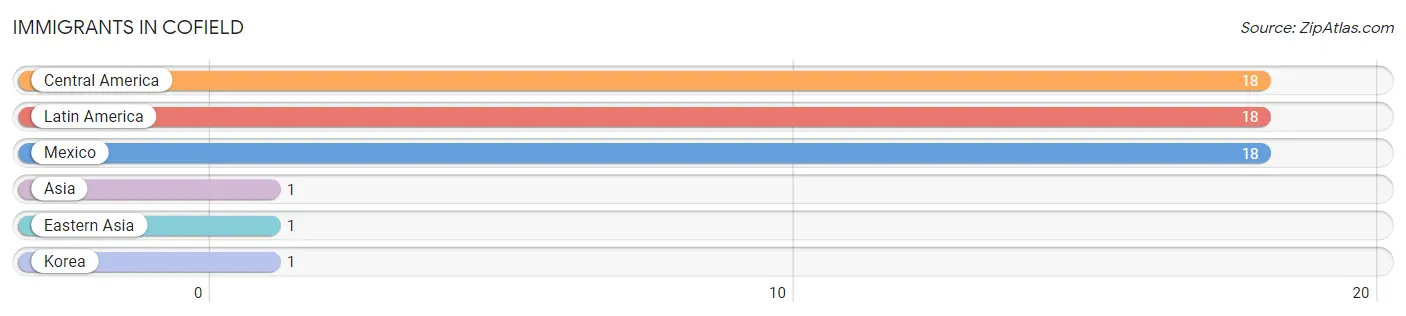
| Immigration Origin | # Population | % Population |
| Asia | 1 | 0.3% |
| Central America | 18 | 4.7% |
| Eastern Asia | 1 | 0.3% |
| Korea | 1 | 0.3% |
| Latin America | 18 | 4.7% |
| Mexico | 18 | 4.7% | View All 6 Rows |
Sex and Age in Cofield
Sex and Age in Cofield
The most populous age groups in Cofield are 40 to 44 Years (37 | 16.1%) for men and 60 to 64 Years (27 | 17.5%) for women.
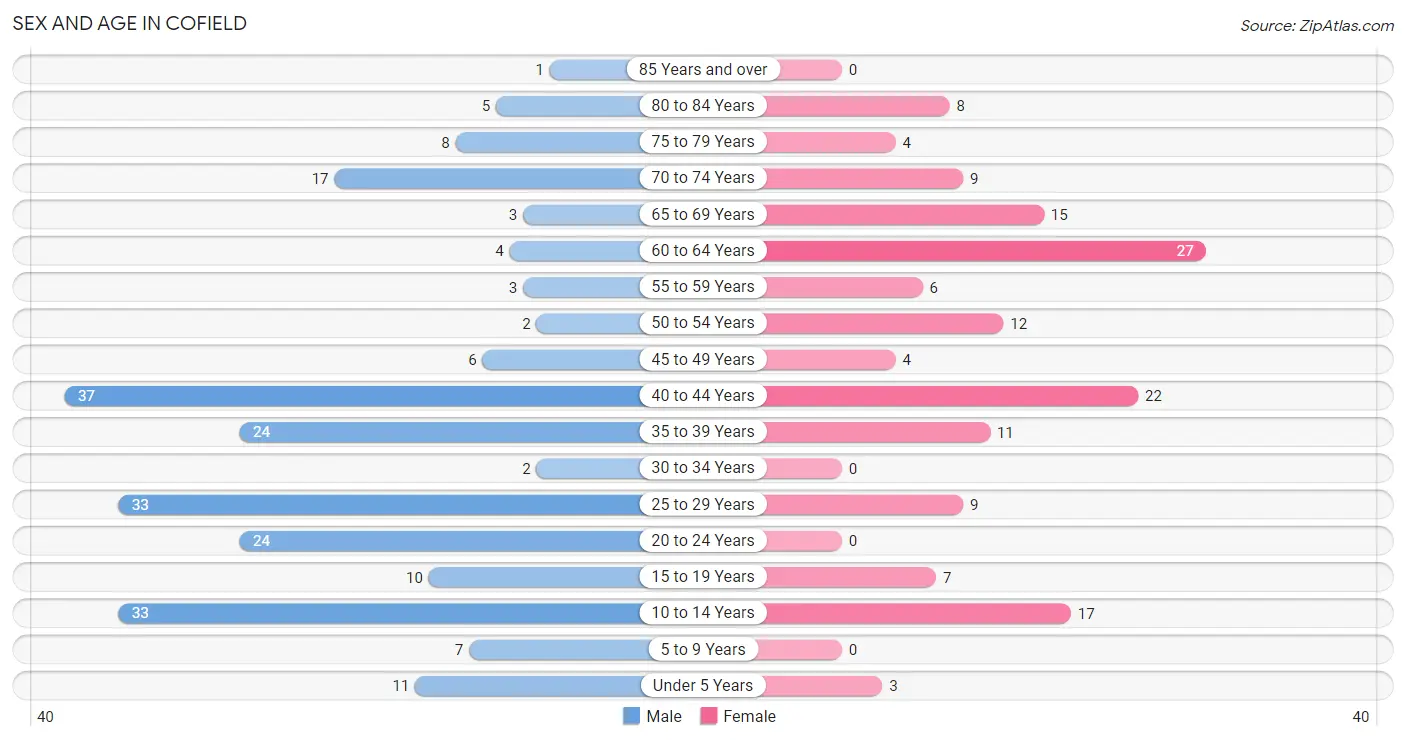
| Age Bracket | Male | Female |
| Under 5 Years | 11 (4.8%) | 3 (1.9%) |
| 5 to 9 Years | 7 (3.0%) | 0 (0.0%) |
| 10 to 14 Years | 33 (14.3%) | 17 (11.0%) |
| 15 to 19 Years | 10 (4.3%) | 7 (4.5%) |
| 20 to 24 Years | 24 (10.4%) | 0 (0.0%) |
| 25 to 29 Years | 33 (14.3%) | 9 (5.8%) |
| 30 to 34 Years | 2 (0.9%) | 0 (0.0%) |
| 35 to 39 Years | 24 (10.4%) | 11 (7.1%) |
| 40 to 44 Years | 37 (16.1%) | 22 (14.3%) |
| 45 to 49 Years | 6 (2.6%) | 4 (2.6%) |
| 50 to 54 Years | 2 (0.9%) | 12 (7.8%) |
| 55 to 59 Years | 3 (1.3%) | 6 (3.9%) |
| 60 to 64 Years | 4 (1.7%) | 27 (17.5%) |
| 65 to 69 Years | 3 (1.3%) | 15 (9.7%) |
| 70 to 74 Years | 17 (7.4%) | 9 (5.8%) |
| 75 to 79 Years | 8 (3.5%) | 4 (2.6%) |
| 80 to 84 Years | 5 (2.2%) | 8 (5.2%) |
| 85 Years and over | 1 (0.4%) | 0 (0.0%) |
| Total | 230 (100.0%) | 154 (100.0%) |
Families and Households in Cofield
Median Family Size in Cofield
The median family size in Cofield is 2.69 persons per family, with married-couple families (48 | 41.4%) accounting for the largest median family size of 3.21 persons per family. On the other hand, single male/father families (32 | 27.6%) represent the smallest median family size with 1.84 persons per family.
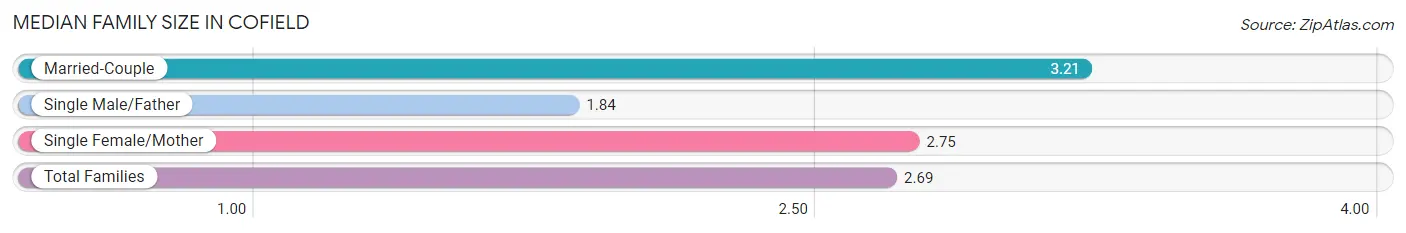
| Family Type | # Families | Family Size |
| Married-Couple | 48 (41.4%) | 3.21 |
| Single Male/Father | 32 (27.6%) | 1.84 |
| Single Female/Mother | 36 (31.0%) | 2.75 |
| Total Families | 116 (100.0%) | 2.69 |
Median Household Size in Cofield
The median household size in Cofield is 2.22 persons per household, with married-couple households (48 | 27.8%) accounting for the largest median household size of 3.21 persons per household. non-family households (57 | 33.0%) represent the smallest median household size with 1.05 persons per household.
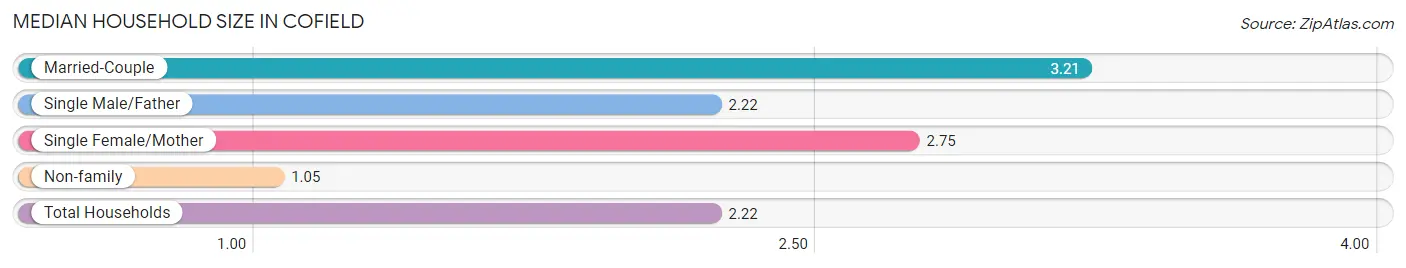
| Household Type | # Households | Household Size |
| Married-Couple | 48 (27.8%) | 3.21 |
| Single Male/Father | 32 (18.5%) | 2.22 |
| Single Female/Mother | 36 (20.8%) | 2.75 |
| Non-family | 57 (33.0%) | 1.05 |
| Total Households | 173 (100.0%) | 2.22 |
Household Size by Marriage Status in Cofield
Out of a total of 173 households in Cofield, 116 (67.0%) are family households, while 57 (33.0%) are nonfamily households. The most numerous type of family households are 2-person households, comprising 69, and the most common type of nonfamily households are 1-person households, comprising 47.
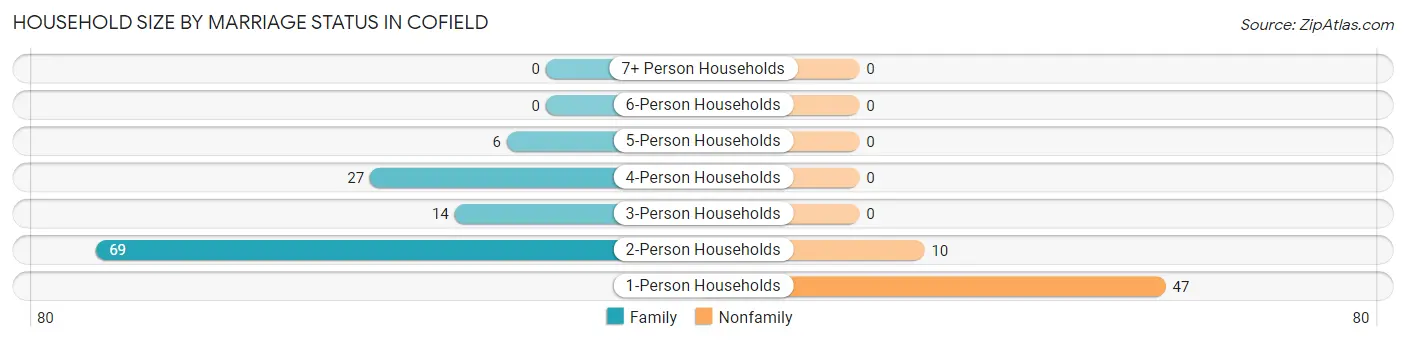
| Household Size | Family Households | Nonfamily Households |
| 1-Person Households | - | 47 (27.2%) |
| 2-Person Households | 69 (39.9%) | 10 (5.8%) |
| 3-Person Households | 14 (8.1%) | 0 (0.0%) |
| 4-Person Households | 27 (15.6%) | 0 (0.0%) |
| 5-Person Households | 6 (3.5%) | 0 (0.0%) |
| 6-Person Households | 0 (0.0%) | 0 (0.0%) |
| 7+ Person Households | 0 (0.0%) | 0 (0.0%) |
| Total | 116 (67.0%) | 57 (33.0%) |
Female Fertility in Cofield
Fertility by Age in Cofield
Average fertility rate in Cofield is 17.0 births per 1,000 women. Women in the age bracket of 20 to 34 years have the highest fertility rate with 111.0 births per 1,000 women. Women in the age bracket of 20 to 34 years acount for 100.0% of all women with births.
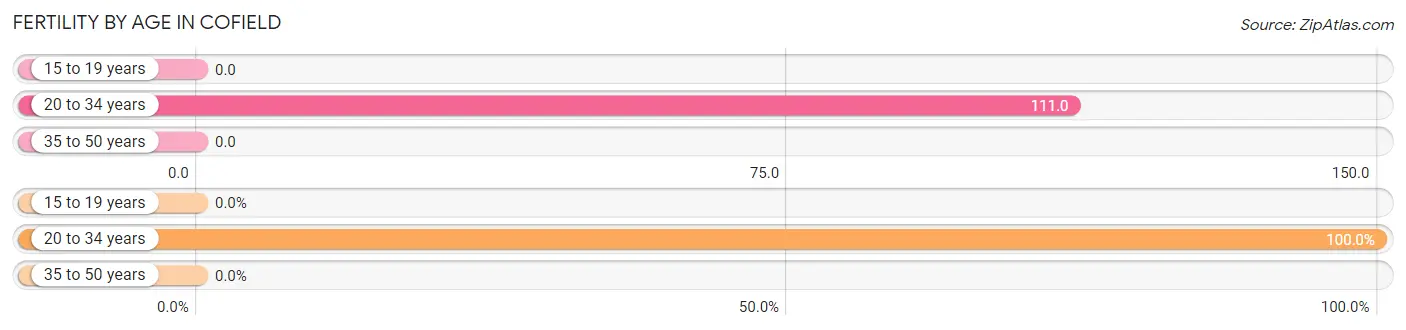
| Age Bracket | Women with Births | Births / 1,000 Women |
| 15 to 19 years | 0 (0.0%) | 0.0 |
| 20 to 34 years | 1 (100.0%) | 111.0 |
| 35 to 50 years | 0 (0.0%) | 0.0 |
| Total | 1 (100.0%) | 17.0 |
Fertility by Age by Marriage Status in Cofield
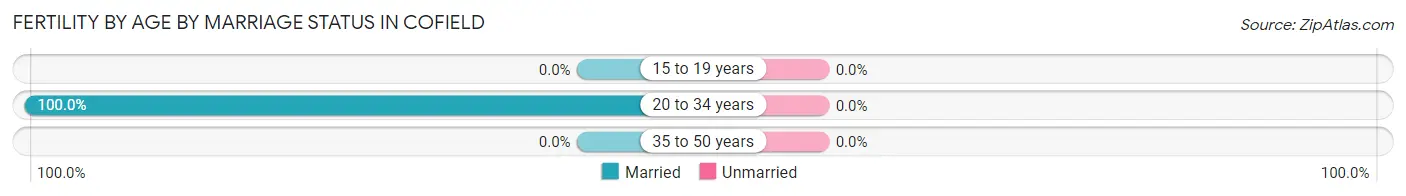
| Age Bracket | Married | Unmarried |
| 15 to 19 years | 0 (0.0%) | 0 (0.0%) |
| 20 to 34 years | 1 (100.0%) | 0 (0.0%) |
| 35 to 50 years | 0 (0.0%) | 0 (0.0%) |
| Total | 1 (100.0%) | 0 (0.0%) |
Fertility by Education in Cofield
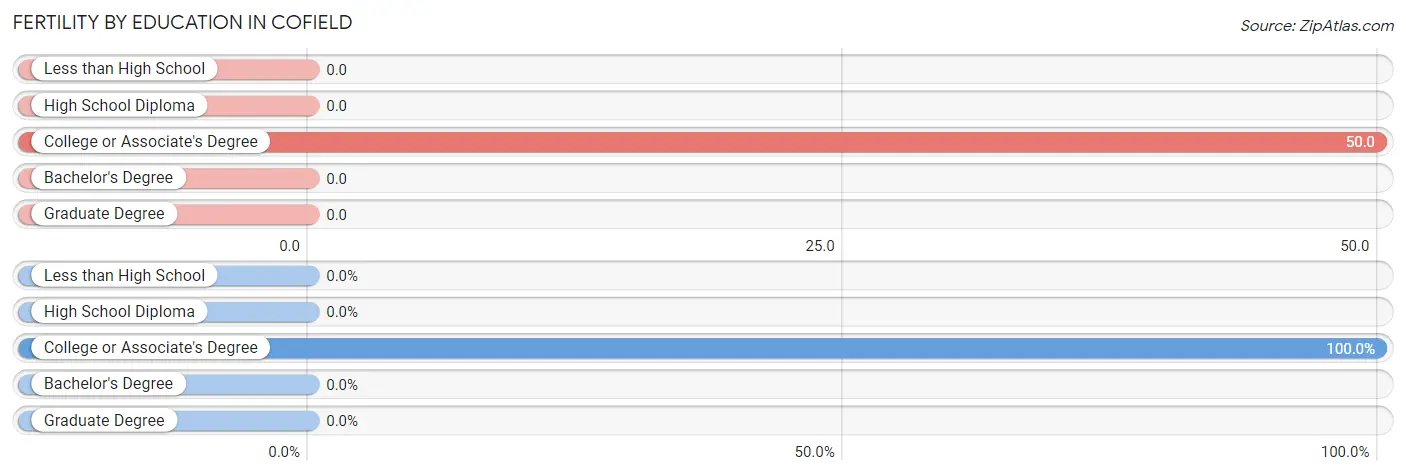
| Educational Attainment | Women with Births | Births / 1,000 Women |
| Less than High School | 0 (0.0%) | 0.0 |
| High School Diploma | 0 (0.0%) | 0.0 |
| College or Associate's Degree | 1 (100.0%) | 50.0 |
| Bachelor's Degree | 0 (0.0%) | 0.0 |
| Graduate Degree | 0 (0.0%) | 0.0 |
| Total | 1 (100.0%) | 17.0 |
Fertility by Education by Marriage Status in Cofield
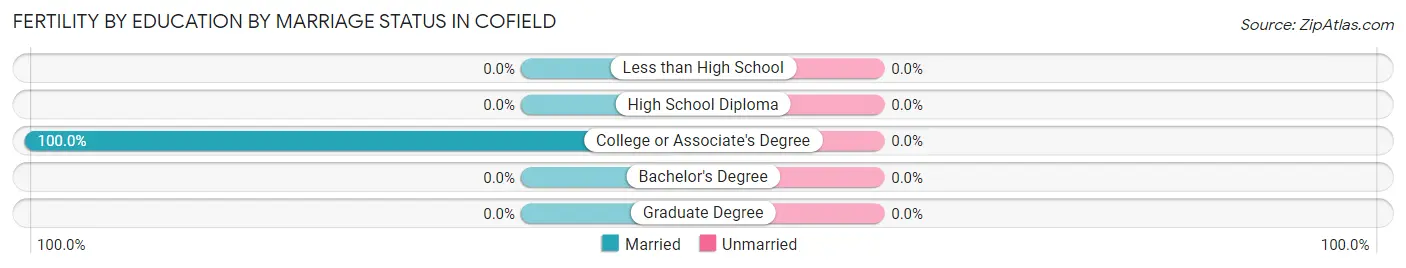
| Educational Attainment | Married | Unmarried |
| Less than High School | 0 (0.0%) | 0 (0.0%) |
| High School Diploma | 0 (0.0%) | 0 (0.0%) |
| College or Associate's Degree | 1 (100.0%) | 0 (0.0%) |
| Bachelor's Degree | 0 (0.0%) | 0 (0.0%) |
| Graduate Degree | 0 (0.0%) | 0 (0.0%) |
| Total | 1 (100.0%) | 0 (0.0%) |
Employment Characteristics in Cofield
Employment by Class of Employer in Cofield
Among the 160 employed individuals in Cofield, private company employees (108 | 67.5%), state government employees (17 | 10.6%), and self-employed (not incorporated) (15 | 9.4%) make up the most common classes of employment.
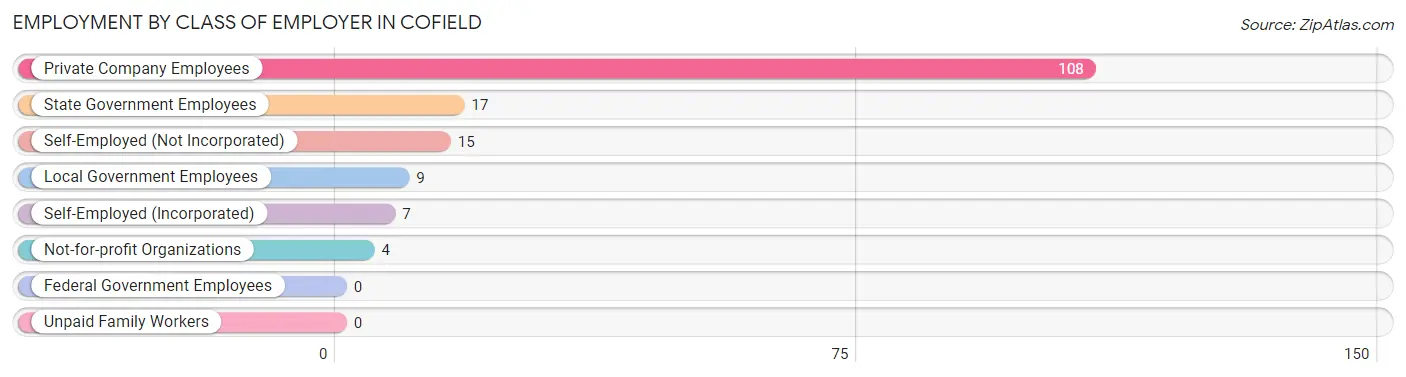
| Employer Class | # Employees | % Employees |
| Private Company Employees | 108 | 67.5% |
| Self-Employed (Incorporated) | 7 | 4.4% |
| Self-Employed (Not Incorporated) | 15 | 9.4% |
| Not-for-profit Organizations | 4 | 2.5% |
| Local Government Employees | 9 | 5.6% |
| State Government Employees | 17 | 10.6% |
| Federal Government Employees | 0 | 0.0% |
| Unpaid Family Workers | 0 | 0.0% |
| Total | 160 | 100.0% |
Employment Status by Age in Cofield
According to the labor force statistics for Cofield, out of the total population over 16 years of age (313), 62.0% or 194 individuals are in the labor force, with 17.5% or 34 of them unemployed. The age group with the highest labor force participation rate is 30 to 34 years, with 100.0% or 2 individuals in the labor force. Within the labor force, the 25 to 29 years age range has the highest percentage of unemployed individuals, with 52.6% or 20 of them being unemployed.
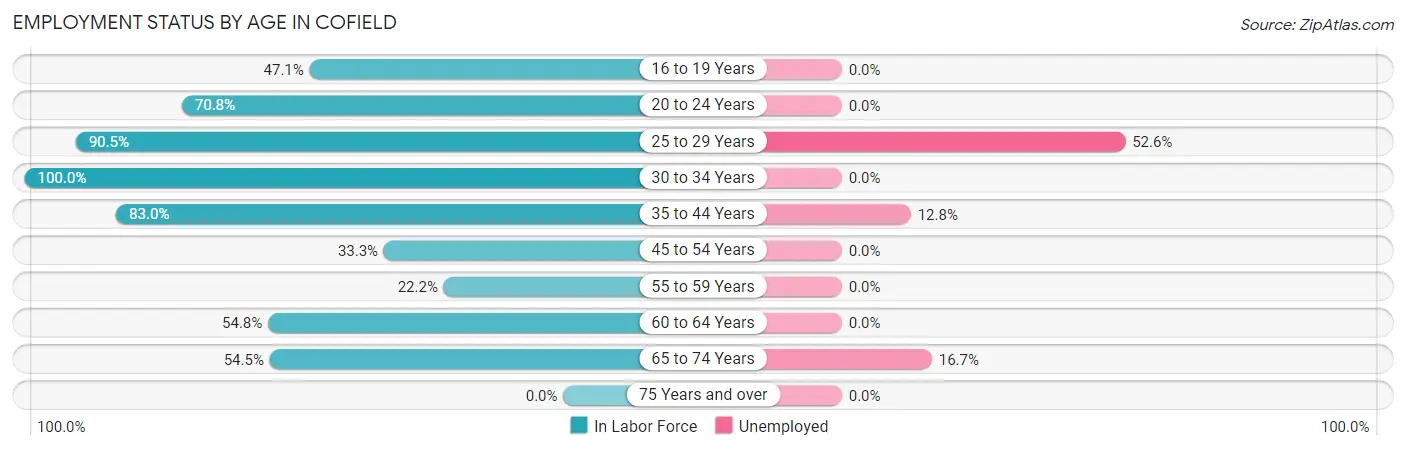
| Age Bracket | In Labor Force | Unemployed |
| 16 to 19 Years | 8 (47.1%) | 0 (0.0%) |
| 20 to 24 Years | 17 (70.8%) | 0 (0.0%) |
| 25 to 29 Years | 38 (90.5%) | 20 (52.6%) |
| 30 to 34 Years | 2 (100.0%) | 0 (0.0%) |
| 35 to 44 Years | 78 (83.0%) | 10 (12.8%) |
| 45 to 54 Years | 8 (33.3%) | 0 (0.0%) |
| 55 to 59 Years | 2 (22.2%) | 0 (0.0%) |
| 60 to 64 Years | 17 (54.8%) | 0 (0.0%) |
| 65 to 74 Years | 24 (54.5%) | 4 (16.7%) |
| 75 Years and over | 0 (0.0%) | 0 (0.0%) |
| Total | 194 (62.0%) | 34 (17.5%) |
Employment Status by Educational Attainment in Cofield
According to labor force statistics for Cofield, 71.8% of individuals (145) out of the total population between 25 and 64 years of age (202) are in the labor force, with 20.7% or 30 of them being unemployed. The group with the highest labor force participation rate are those with the educational attainment of bachelor's degree or higher, with 91.9% or 34 individuals in the labor force. Within the labor force, individuals with college / associate degree education have the highest percentage of unemployment, with 46.2% or 30 of them being unemployed.
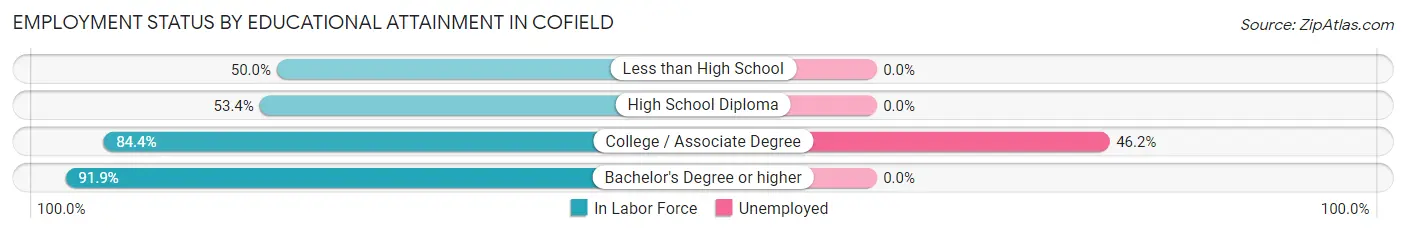
| Educational Attainment | In Labor Force | Unemployed |
| Less than High School | 15 (50.0%) | 0 (0.0%) |
| High School Diploma | 31 (53.4%) | 0 (0.0%) |
| College / Associate Degree | 65 (84.4%) | 36 (46.2%) |
| Bachelor's Degree or higher | 34 (91.9%) | 0 (0.0%) |
| Total | 145 (71.8%) | 42 (20.7%) |
Employment Occupations by Sex in Cofield
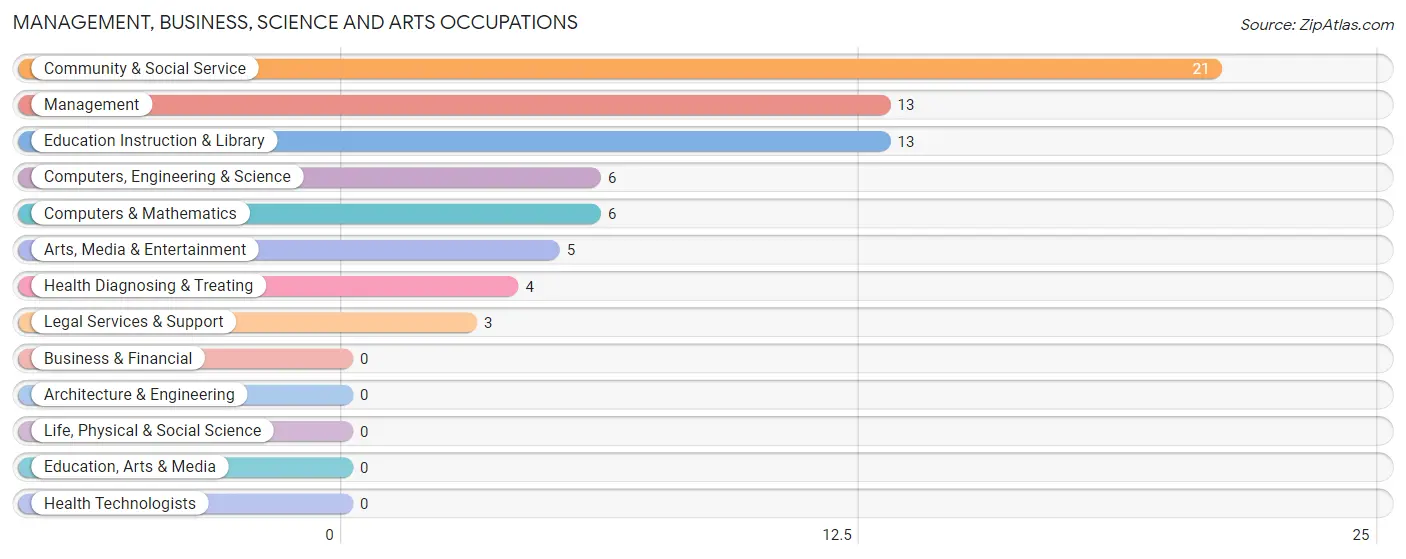
Management, Business, Science and Arts Occupations
The most common Management, Business, Science and Arts occupations in Cofield are Community & Social Service (21 | 13.1%), Management (13 | 8.1%), Education Instruction & Library (13 | 8.1%), Computers, Engineering & Science (6 | 3.7%), and Computers & Mathematics (6 | 3.7%).
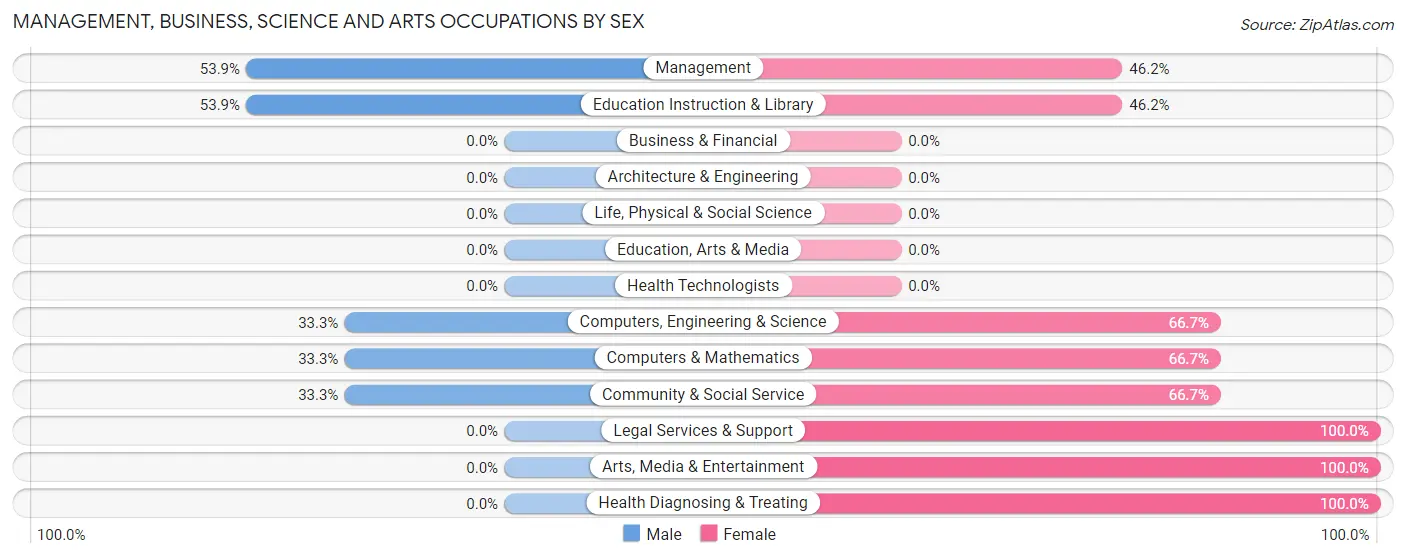
Management, Business, Science and Arts Occupations by Sex
Within the Management, Business, Science and Arts occupations in Cofield, the most male-oriented occupations are Management (53.8%), Education Instruction & Library (53.8%), and Computers, Engineering & Science (33.3%), while the most female-oriented occupations are Legal Services & Support (100.0%), Arts, Media & Entertainment (100.0%), and Health Diagnosing & Treating (100.0%).
| Occupation | Male | Female |
| Management | 7 (53.8%) | 6 (46.2%) |
| Business & Financial | 0 (0.0%) | 0 (0.0%) |
| Computers, Engineering & Science | 2 (33.3%) | 4 (66.7%) |
| Computers & Mathematics | 2 (33.3%) | 4 (66.7%) |
| Architecture & Engineering | 0 (0.0%) | 0 (0.0%) |
| Life, Physical & Social Science | 0 (0.0%) | 0 (0.0%) |
| Community & Social Service | 7 (33.3%) | 14 (66.7%) |
| Education, Arts & Media | 0 (0.0%) | 0 (0.0%) |
| Legal Services & Support | 0 (0.0%) | 3 (100.0%) |
| Education Instruction & Library | 7 (53.8%) | 6 (46.2%) |
| Arts, Media & Entertainment | 0 (0.0%) | 5 (100.0%) |
| Health Diagnosing & Treating | 0 (0.0%) | 4 (100.0%) |
| Health Technologists | 0 (0.0%) | 0 (0.0%) |
| Total (Category) | 16 (36.4%) | 28 (63.6%) |
| Total (Overall) | 79 (49.4%) | 81 (50.6%) |
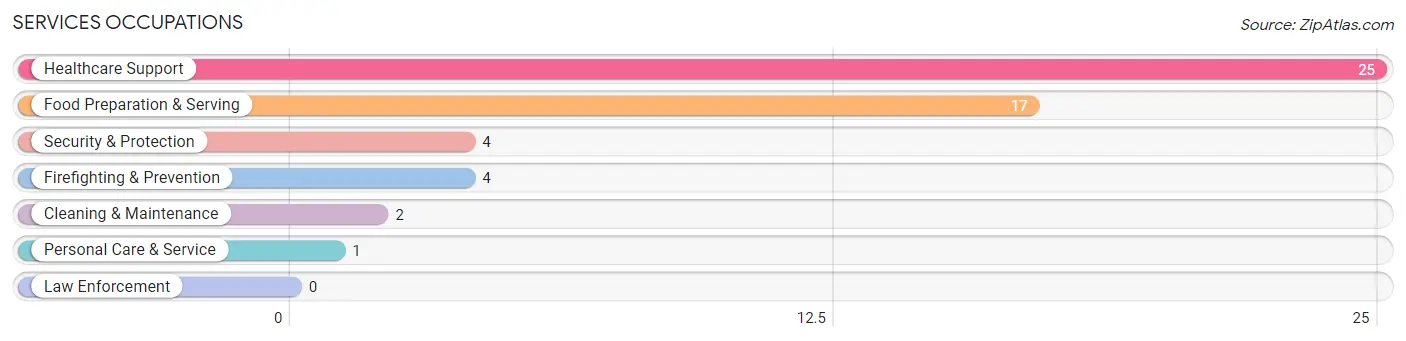
Services Occupations
The most common Services occupations in Cofield are Healthcare Support (25 | 15.6%), Food Preparation & Serving (17 | 10.6%), Security & Protection (4 | 2.5%), Firefighting & Prevention (4 | 2.5%), and Cleaning & Maintenance (2 | 1.3%).
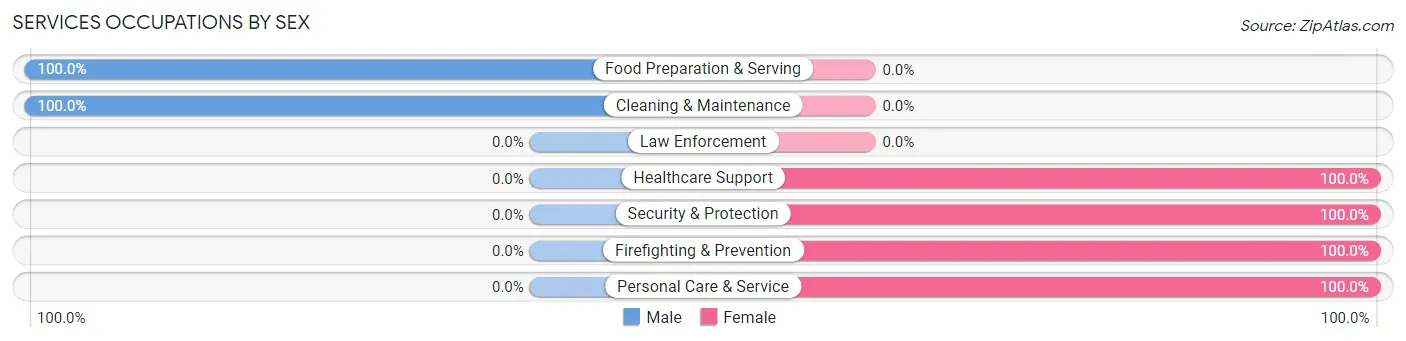
Services Occupations by Sex
Within the Services occupations in Cofield, the most male-oriented occupations are Food Preparation & Serving (100.0%), and Cleaning & Maintenance (100.0%), while the most female-oriented occupations are Healthcare Support (100.0%), Security & Protection (100.0%), and Firefighting & Prevention (100.0%).
| Occupation | Male | Female |
| Healthcare Support | 0 (0.0%) | 25 (100.0%) |
| Security & Protection | 0 (0.0%) | 4 (100.0%) |
| Firefighting & Prevention | 0 (0.0%) | 4 (100.0%) |
| Law Enforcement | 0 (0.0%) | 0 (0.0%) |
| Food Preparation & Serving | 17 (100.0%) | 0 (0.0%) |
| Cleaning & Maintenance | 2 (100.0%) | 0 (0.0%) |
| Personal Care & Service | 0 (0.0%) | 1 (100.0%) |
| Total (Category) | 19 (38.8%) | 30 (61.2%) |
| Total (Overall) | 79 (49.4%) | 81 (50.6%) |
Sales and Office Occupations
The most common Sales and Office occupations in Cofield are , and Office & Administration (8 | 5.0%).
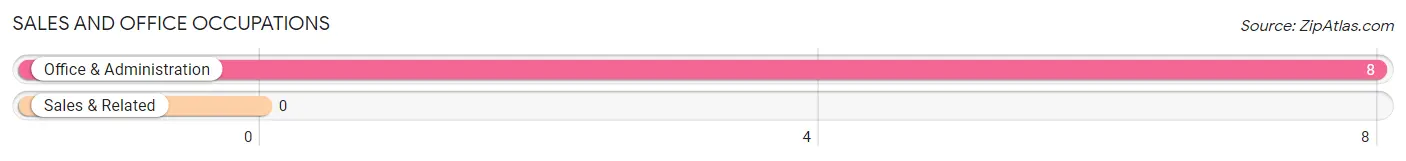
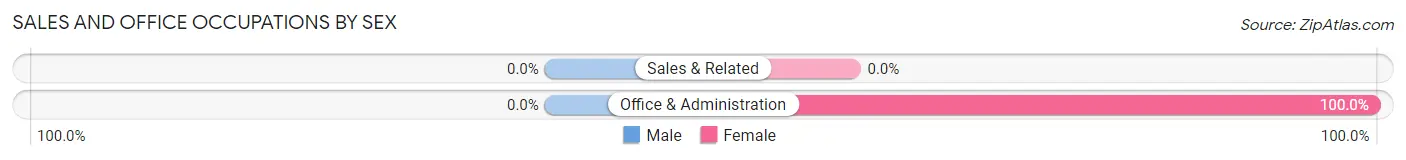
Sales and Office Occupations by Sex
| Occupation | Male | Female |
| Sales & Related | 0 (0.0%) | 0 (0.0%) |
| Office & Administration | 0 (0.0%) | 8 (100.0%) |
| Total (Category) | 0 (0.0%) | 8 (100.0%) |
| Total (Overall) | 79 (49.4%) | 81 (50.6%) |
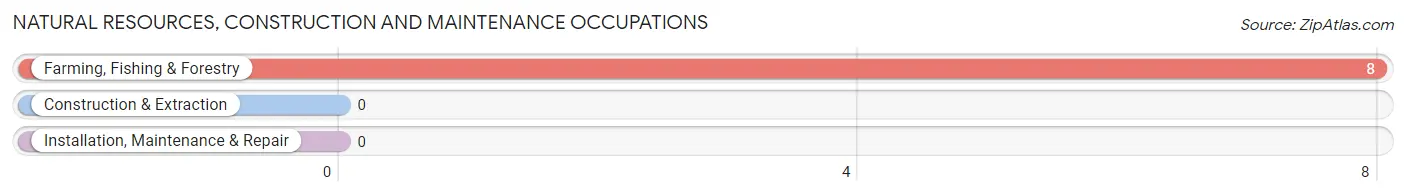
Natural Resources, Construction and Maintenance Occupations
The most common Natural Resources, Construction and Maintenance occupations in Cofield are , and Farming, Fishing & Forestry (8 | 5.0%).
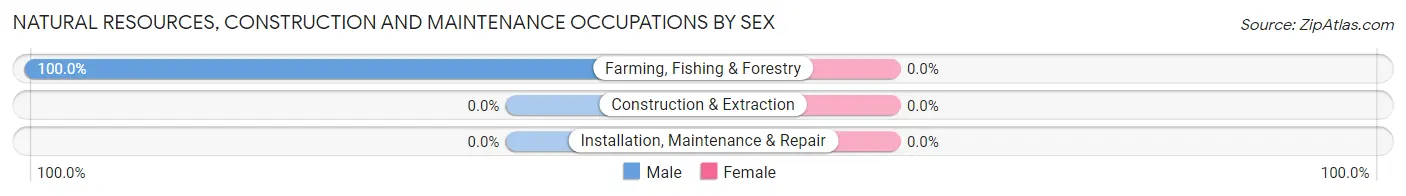
Natural Resources, Construction and Maintenance Occupations by Sex
| Occupation | Male | Female |
| Farming, Fishing & Forestry | 8 (100.0%) | 0 (0.0%) |
| Construction & Extraction | 0 (0.0%) | 0 (0.0%) |
| Installation, Maintenance & Repair | 0 (0.0%) | 0 (0.0%) |
| Total (Category) | 8 (100.0%) | 0 (0.0%) |
| Total (Overall) | 79 (49.4%) | 81 (50.6%) |
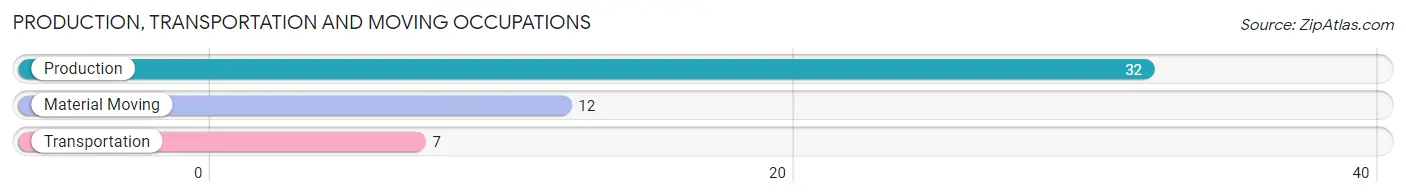
Production, Transportation and Moving Occupations
The most common Production, Transportation and Moving occupations in Cofield are Production (32 | 20.0%), Material Moving (12 | 7.5%), and Transportation (7 | 4.4%).
Production, Transportation and Moving Occupations by Sex
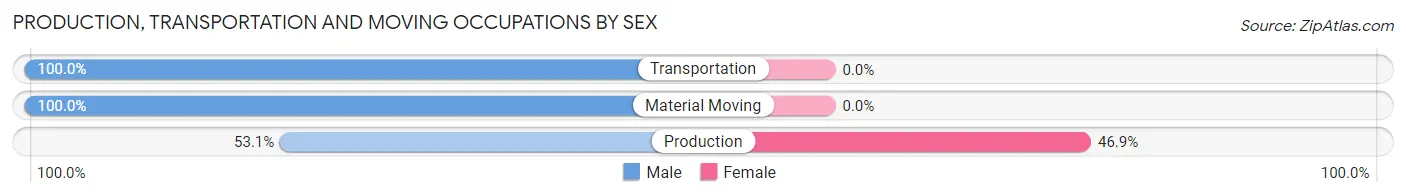
| Occupation | Male | Female |
| Production | 17 (53.1%) | 15 (46.9%) |
| Transportation | 7 (100.0%) | 0 (0.0%) |
| Material Moving | 12 (100.0%) | 0 (0.0%) |
| Total (Category) | 36 (70.6%) | 15 (29.4%) |
| Total (Overall) | 79 (49.4%) | 81 (50.6%) |
Employment Industries by Sex in Cofield
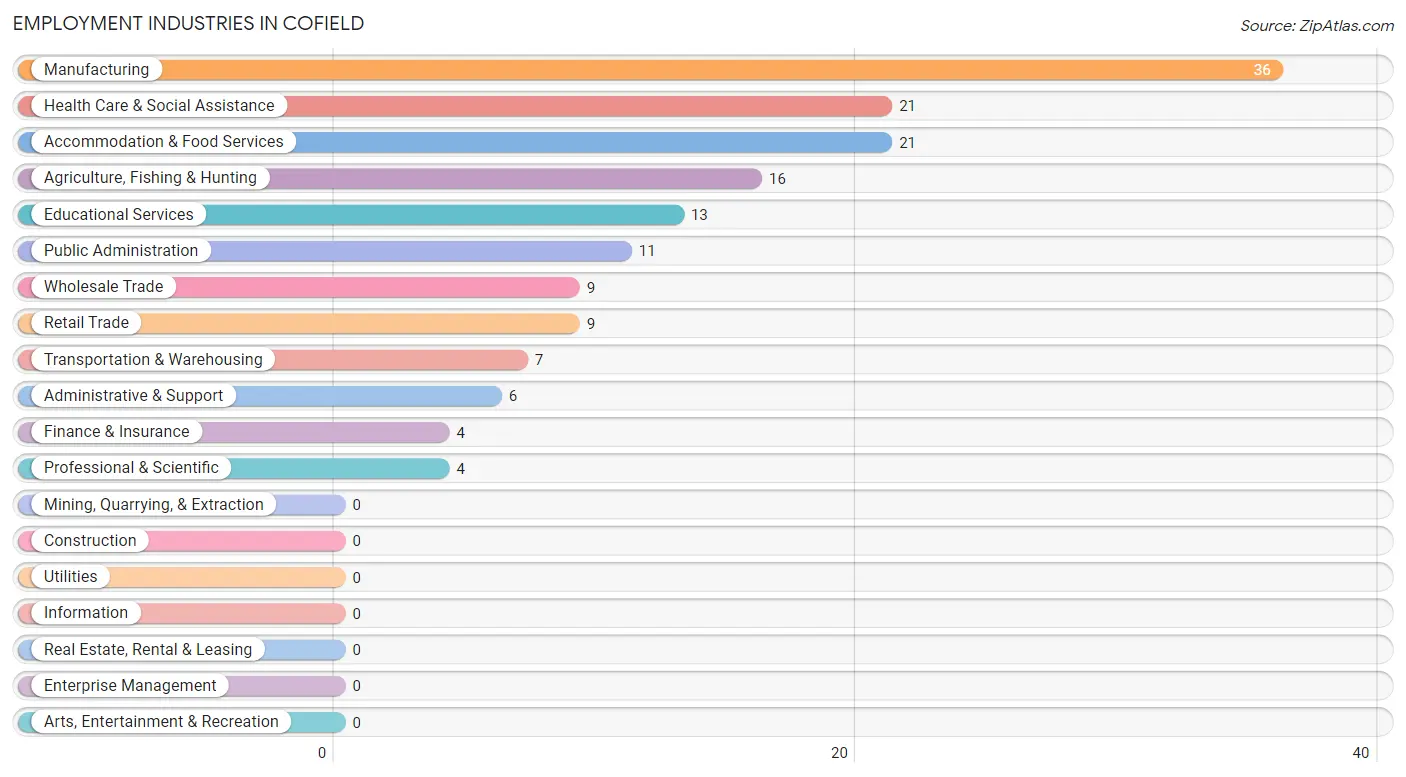
Employment Industries in Cofield
The major employment industries in Cofield include Manufacturing (36 | 22.5%), Health Care & Social Assistance (21 | 13.1%), Accommodation & Food Services (21 | 13.1%), Agriculture, Fishing & Hunting (16 | 10.0%), and Educational Services (13 | 8.1%).
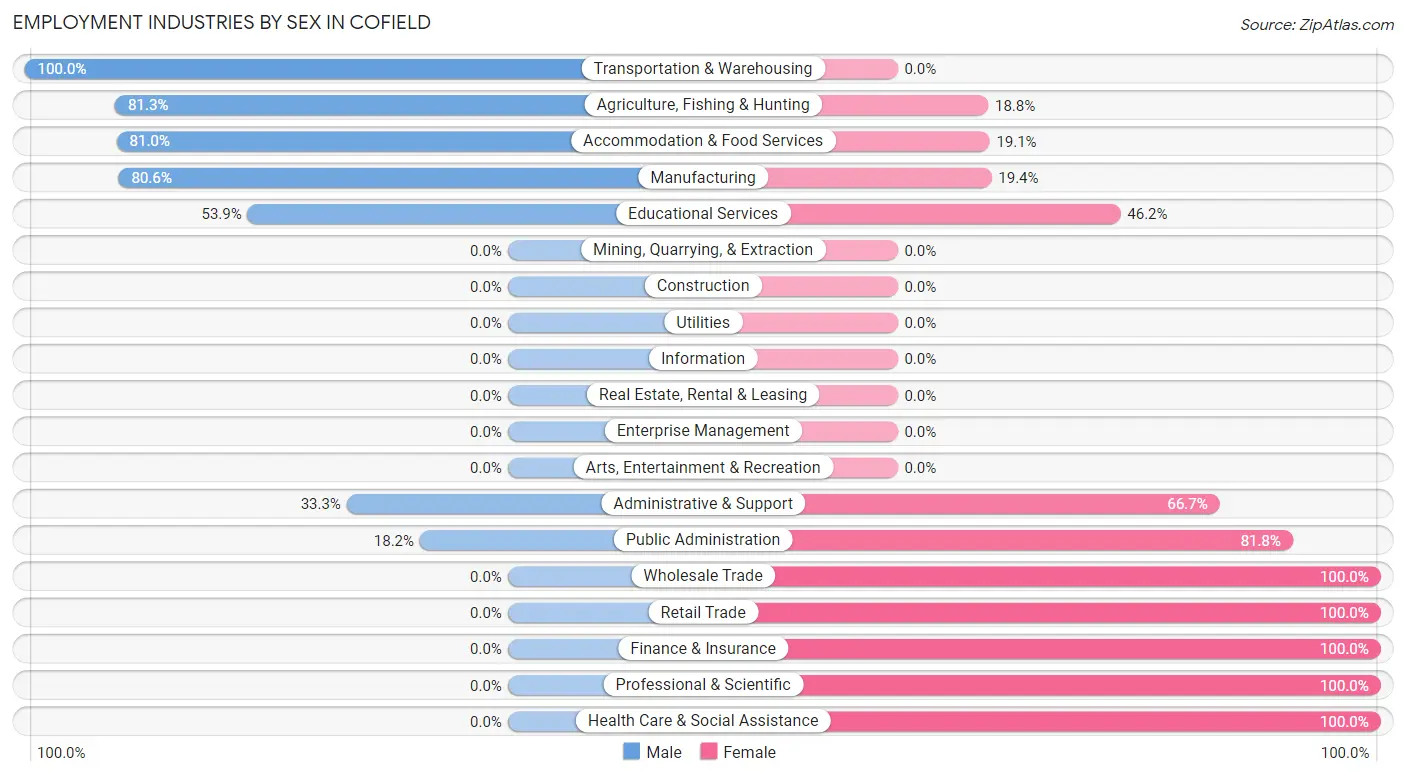
Employment Industries by Sex in Cofield
The Cofield industries that see more men than women are Transportation & Warehousing (100.0%), Agriculture, Fishing & Hunting (81.2%), and Accommodation & Food Services (80.9%), whereas the industries that tend to have a higher number of women are Wholesale Trade (100.0%), Retail Trade (100.0%), and Finance & Insurance (100.0%).
| Industry | Male | Female |
| Agriculture, Fishing & Hunting | 13 (81.2%) | 3 (18.8%) |
| Mining, Quarrying, & Extraction | 0 (0.0%) | 0 (0.0%) |
| Construction | 0 (0.0%) | 0 (0.0%) |
| Manufacturing | 29 (80.6%) | 7 (19.4%) |
| Wholesale Trade | 0 (0.0%) | 9 (100.0%) |
| Retail Trade | 0 (0.0%) | 9 (100.0%) |
| Transportation & Warehousing | 7 (100.0%) | 0 (0.0%) |
| Utilities | 0 (0.0%) | 0 (0.0%) |
| Information | 0 (0.0%) | 0 (0.0%) |
| Finance & Insurance | 0 (0.0%) | 4 (100.0%) |
| Real Estate, Rental & Leasing | 0 (0.0%) | 0 (0.0%) |
| Professional & Scientific | 0 (0.0%) | 4 (100.0%) |
| Enterprise Management | 0 (0.0%) | 0 (0.0%) |
| Administrative & Support | 2 (33.3%) | 4 (66.7%) |
| Educational Services | 7 (53.8%) | 6 (46.2%) |
| Health Care & Social Assistance | 0 (0.0%) | 21 (100.0%) |
| Arts, Entertainment & Recreation | 0 (0.0%) | 0 (0.0%) |
| Accommodation & Food Services | 17 (80.9%) | 4 (19.1%) |
| Public Administration | 2 (18.2%) | 9 (81.8%) |
| Total | 79 (49.4%) | 81 (50.6%) |
Education in Cofield
School Enrollment in Cofield
The most common levels of schooling among the 75 students in Cofield are middle school (30 | 40.0%), high school (19 | 25.3%), and elementary school (16 | 21.3%).
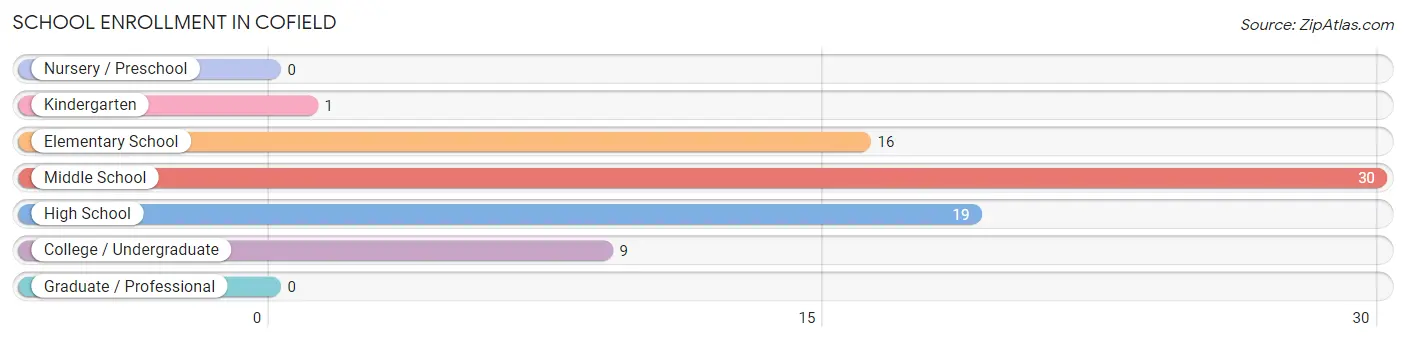
| School Level | # Students | % Students |
| Nursery / Preschool | 0 | 0.0% |
| Kindergarten | 1 | 1.3% |
| Elementary School | 16 | 21.3% |
| Middle School | 30 | 40.0% |
| High School | 19 | 25.3% |
| College / Undergraduate | 9 | 12.0% |
| Graduate / Professional | 0 | 0.0% |
| Total | 75 | 100.0% |
School Enrollment by Age by Funding Source in Cofield
Out of a total of 75 students who are enrolled in schools in Cofield, 10 (13.3%) attend a private institution, while the remaining 65 (86.7%) are enrolled in public schools. The age group of 10 to 14 year olds has the highest likelihood of being enrolled in private schools, with 10 (20.0% in the age bracket) enrolled. Conversely, the age group of 5 to 9 year old has the lowest likelihood of being enrolled in a private school, with 7 (100.0% in the age bracket) attending a public institution.
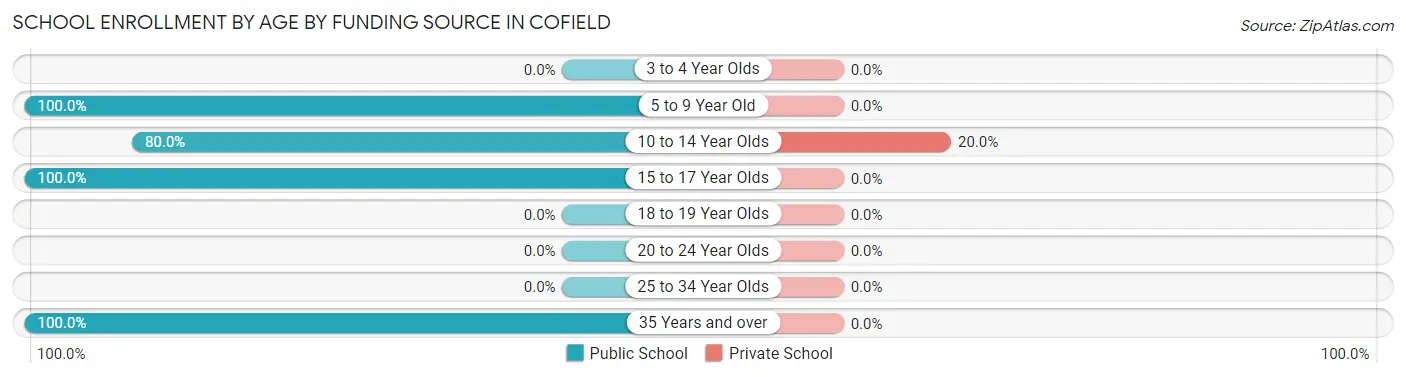
| Age Bracket | Public School | Private School |
| 3 to 4 Year Olds | 0 (0.0%) | 0 (0.0%) |
| 5 to 9 Year Old | 7 (100.0%) | 0 (0.0%) |
| 10 to 14 Year Olds | 40 (80.0%) | 10 (20.0%) |
| 15 to 17 Year Olds | 9 (100.0%) | 0 (0.0%) |
| 18 to 19 Year Olds | 0 (0.0%) | 0 (0.0%) |
| 20 to 24 Year Olds | 0 (0.0%) | 0 (0.0%) |
| 25 to 34 Year Olds | 0 (0.0%) | 0 (0.0%) |
| 35 Years and over | 9 (100.0%) | 0 (0.0%) |
| Total | 65 (86.7%) | 10 (13.3%) |
Educational Attainment by Field of Study in Cofield
Physical & health sciences (10 | 20.4%), business (7 | 14.3%), education (7 | 14.3%), communications (7 | 14.3%), and bio, nature & agricultural (6 | 12.2%) are the most common fields of study among 49 individuals in Cofield who have obtained a bachelor's degree or higher.
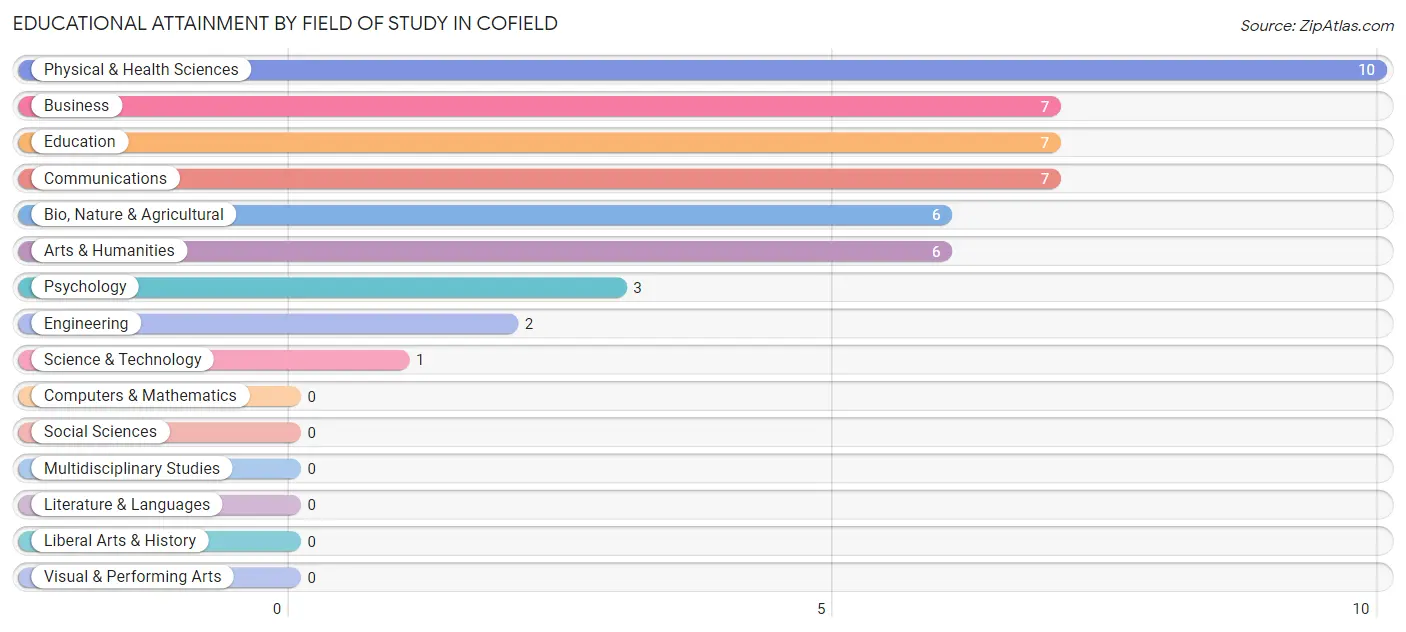
| Field of Study | # Graduates | % Graduates |
| Computers & Mathematics | 0 | 0.0% |
| Bio, Nature & Agricultural | 6 | 12.2% |
| Physical & Health Sciences | 10 | 20.4% |
| Psychology | 3 | 6.1% |
| Social Sciences | 0 | 0.0% |
| Engineering | 2 | 4.1% |
| Multidisciplinary Studies | 0 | 0.0% |
| Science & Technology | 1 | 2.0% |
| Business | 7 | 14.3% |
| Education | 7 | 14.3% |
| Literature & Languages | 0 | 0.0% |
| Liberal Arts & History | 0 | 0.0% |
| Visual & Performing Arts | 0 | 0.0% |
| Communications | 7 | 14.3% |
| Arts & Humanities | 6 | 12.2% |
| Total | 49 | 100.0% |
Transportation & Commute in Cofield
Vehicle Availability by Sex in Cofield
The most prevalent vehicle ownership categories in Cofield are males with 3 vehicles (36, accounting for 45.6%) and females with 3 vehicles (39, making up 44.4%).
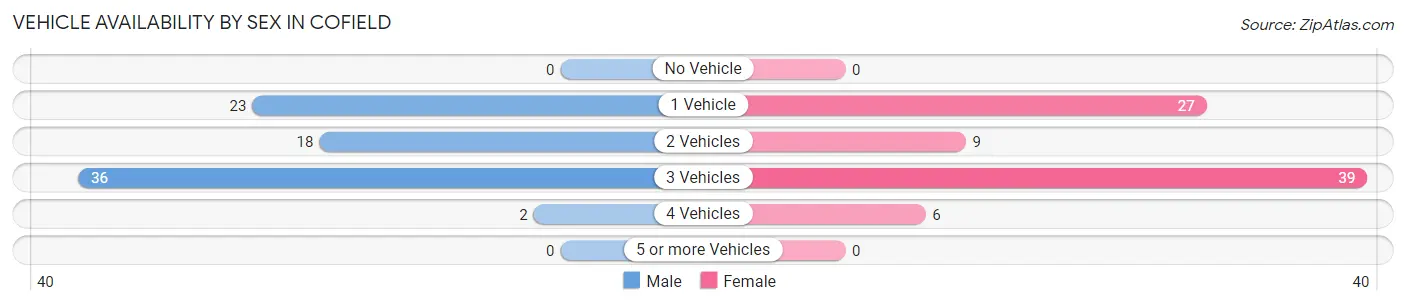
| Vehicles Available | Male | Female |
| No Vehicle | 0 (0.0%) | 0 (0.0%) |
| 1 Vehicle | 23 (29.1%) | 27 (33.3%) |
| 2 Vehicles | 18 (22.8%) | 9 (11.1%) |
| 3 Vehicles | 36 (45.6%) | 39 (48.1%) |
| 4 Vehicles | 2 (2.5%) | 6 (7.4%) |
| 5 or more Vehicles | 0 (0.0%) | 0 (0.0%) |
| Total | 79 (100.0%) | 81 (100.0%) |
Commute Time in Cofield
The most frequently occuring commute durations in Cofield are 10 to 14 minutes (44 commuters, 28.2%), 15 to 19 minutes (36 commuters, 23.1%), and 20 to 24 minutes (19 commuters, 12.2%).
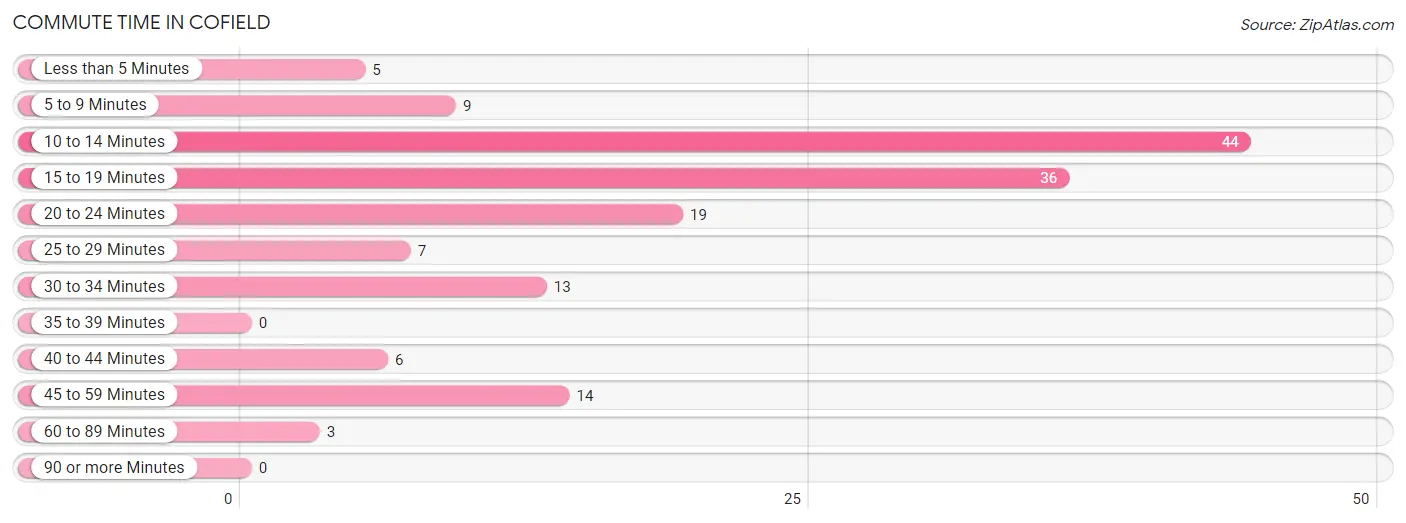
| Commute Time | # Commuters | % Commuters |
| Less than 5 Minutes | 5 | 3.2% |
| 5 to 9 Minutes | 9 | 5.8% |
| 10 to 14 Minutes | 44 | 28.2% |
| 15 to 19 Minutes | 36 | 23.1% |
| 20 to 24 Minutes | 19 | 12.2% |
| 25 to 29 Minutes | 7 | 4.5% |
| 30 to 34 Minutes | 13 | 8.3% |
| 35 to 39 Minutes | 0 | 0.0% |
| 40 to 44 Minutes | 6 | 3.8% |
| 45 to 59 Minutes | 14 | 9.0% |
| 60 to 89 Minutes | 3 | 1.9% |
| 90 or more Minutes | 0 | 0.0% |
Commute Time by Sex in Cofield
The most common commute times in Cofield are 10 to 14 minutes (44 commuters, 55.7%) for males and 15 to 19 minutes (24 commuters, 31.2%) for females.
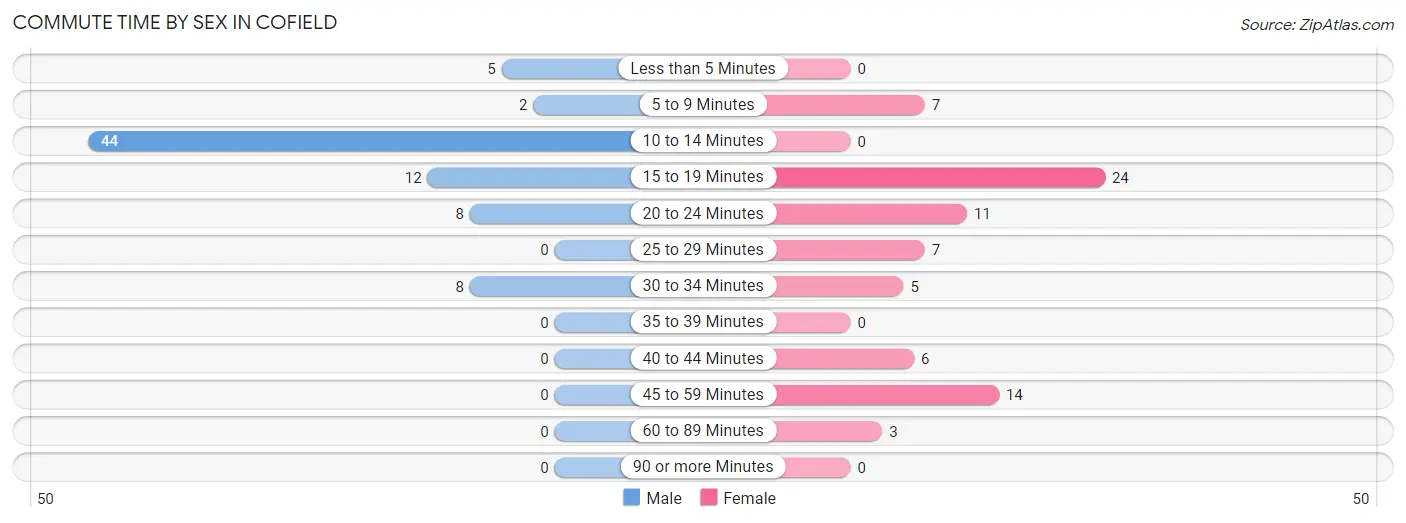
| Commute Time | Male | Female |
| Less than 5 Minutes | 5 (6.3%) | 0 (0.0%) |
| 5 to 9 Minutes | 2 (2.5%) | 7 (9.1%) |
| 10 to 14 Minutes | 44 (55.7%) | 0 (0.0%) |
| 15 to 19 Minutes | 12 (15.2%) | 24 (31.2%) |
| 20 to 24 Minutes | 8 (10.1%) | 11 (14.3%) |
| 25 to 29 Minutes | 0 (0.0%) | 7 (9.1%) |
| 30 to 34 Minutes | 8 (10.1%) | 5 (6.5%) |
| 35 to 39 Minutes | 0 (0.0%) | 0 (0.0%) |
| 40 to 44 Minutes | 0 (0.0%) | 6 (7.8%) |
| 45 to 59 Minutes | 0 (0.0%) | 14 (18.2%) |
| 60 to 89 Minutes | 0 (0.0%) | 3 (3.9%) |
| 90 or more Minutes | 0 (0.0%) | 0 (0.0%) |
Time of Departure to Work by Sex in Cofield
The most frequent times of departure to work in Cofield are 7:00 AM to 7:29 AM (28, 35.4%) for males and 8:00 AM to 8:29 AM (25, 32.5%) for females.
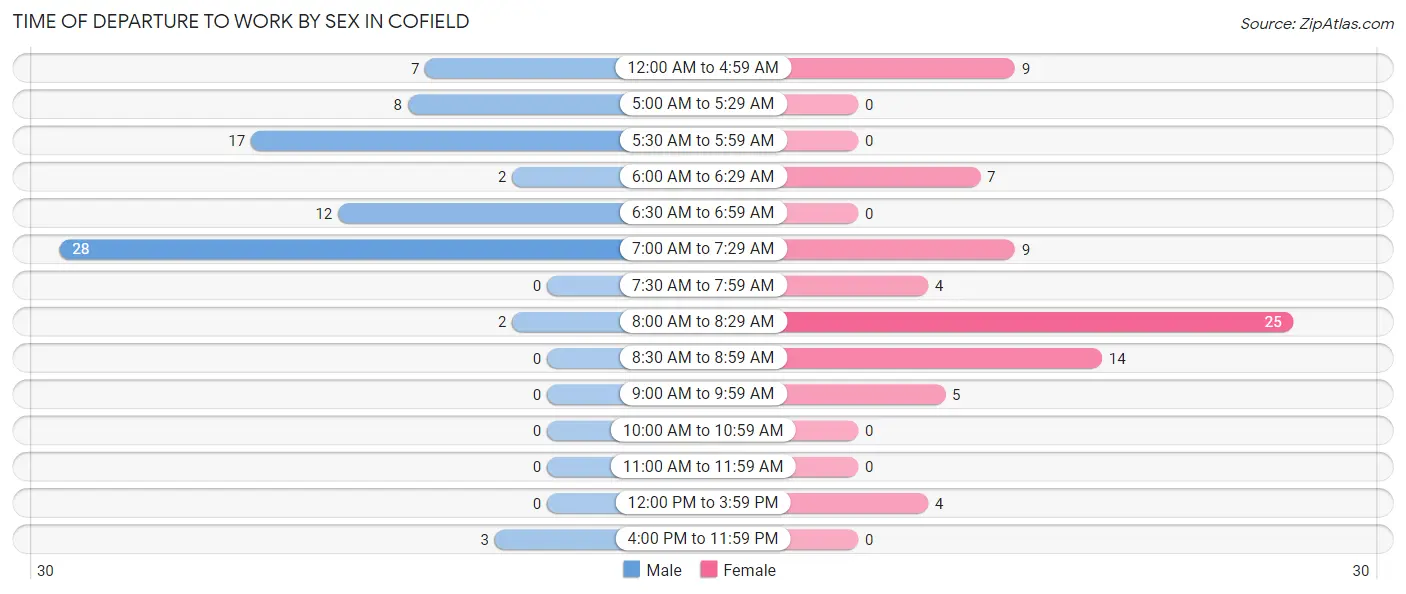
| Time of Departure | Male | Female |
| 12:00 AM to 4:59 AM | 7 (8.9%) | 9 (11.7%) |
| 5:00 AM to 5:29 AM | 8 (10.1%) | 0 (0.0%) |
| 5:30 AM to 5:59 AM | 17 (21.5%) | 0 (0.0%) |
| 6:00 AM to 6:29 AM | 2 (2.5%) | 7 (9.1%) |
| 6:30 AM to 6:59 AM | 12 (15.2%) | 0 (0.0%) |
| 7:00 AM to 7:29 AM | 28 (35.4%) | 9 (11.7%) |
| 7:30 AM to 7:59 AM | 0 (0.0%) | 4 (5.2%) |
| 8:00 AM to 8:29 AM | 2 (2.5%) | 25 (32.5%) |
| 8:30 AM to 8:59 AM | 0 (0.0%) | 14 (18.2%) |
| 9:00 AM to 9:59 AM | 0 (0.0%) | 5 (6.5%) |
| 10:00 AM to 10:59 AM | 0 (0.0%) | 0 (0.0%) |
| 11:00 AM to 11:59 AM | 0 (0.0%) | 0 (0.0%) |
| 12:00 PM to 3:59 PM | 0 (0.0%) | 4 (5.2%) |
| 4:00 PM to 11:59 PM | 3 (3.8%) | 0 (0.0%) |
| Total | 79 (100.0%) | 77 (100.0%) |
Housing Occupancy in Cofield
Occupancy by Ownership in Cofield
Of the total 173 dwellings in Cofield, owner-occupied units account for 105 (60.7%), while renter-occupied units make up 68 (39.3%).
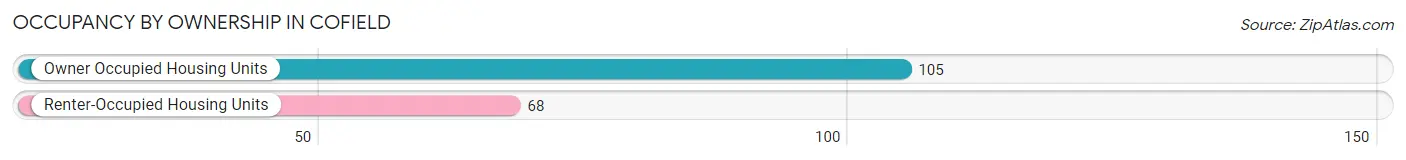
| Occupancy | # Housing Units | % Housing Units |
| Owner Occupied Housing Units | 105 | 60.7% |
| Renter-Occupied Housing Units | 68 | 39.3% |
| Total Occupied Housing Units | 173 | 100.0% |
Occupancy by Household Size in Cofield
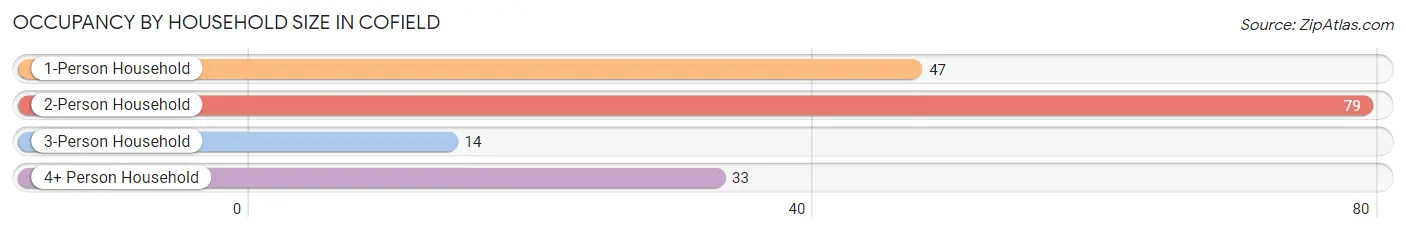
| Household Size | # Housing Units | % Housing Units |
| 1-Person Household | 47 | 27.2% |
| 2-Person Household | 79 | 45.7% |
| 3-Person Household | 14 | 8.1% |
| 4+ Person Household | 33 | 19.1% |
| Total Housing Units | 173 | 100.0% |
Occupancy by Ownership by Household Size in Cofield
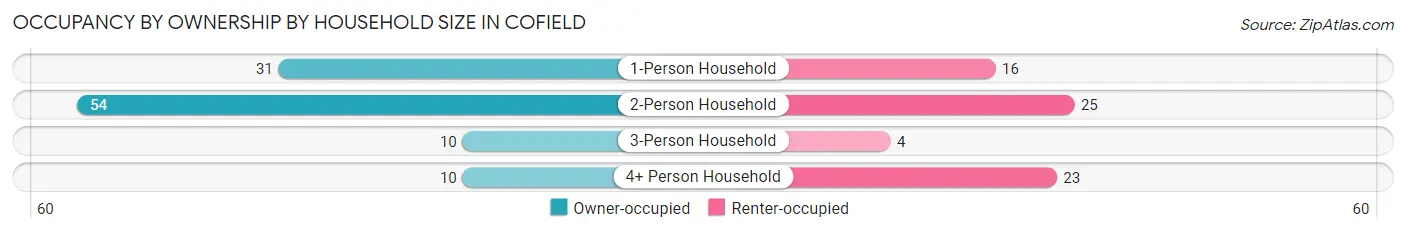
| Household Size | Owner-occupied | Renter-occupied |
| 1-Person Household | 31 (66.0%) | 16 (34.0%) |
| 2-Person Household | 54 (68.3%) | 25 (31.7%) |
| 3-Person Household | 10 (71.4%) | 4 (28.6%) |
| 4+ Person Household | 10 (30.3%) | 23 (69.7%) |
| Total Housing Units | 105 (60.7%) | 68 (39.3%) |
Occupancy by Educational Attainment in Cofield
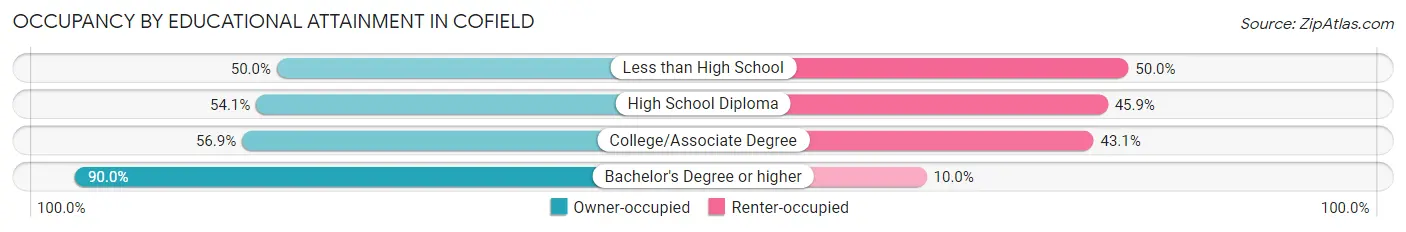
| Household Size | Owner-occupied | Renter-occupied |
| Less than High School | 12 (50.0%) | 12 (50.0%) |
| High School Diploma | 33 (54.1%) | 28 (45.9%) |
| College/Associate Degree | 33 (56.9%) | 25 (43.1%) |
| Bachelor's Degree or higher | 27 (90.0%) | 3 (10.0%) |
Occupancy by Age of Householder in Cofield
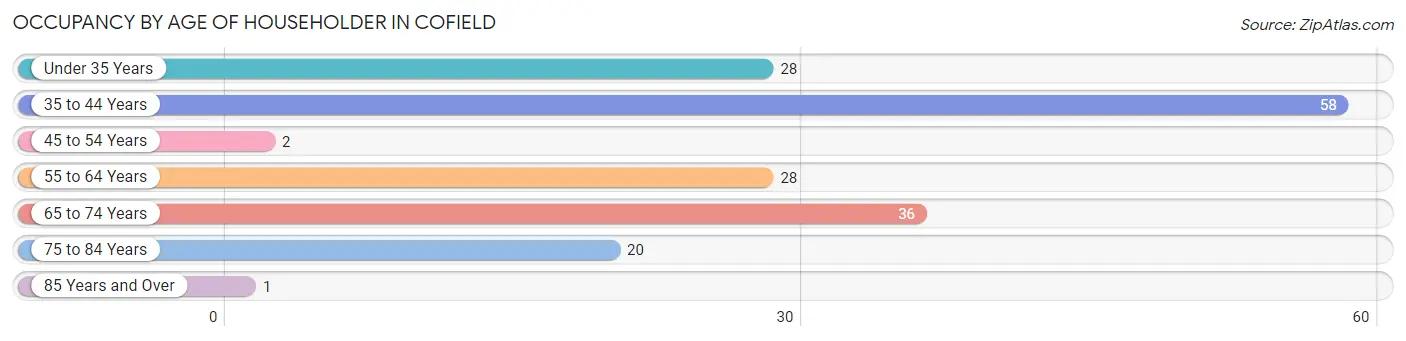
| Age Bracket | # Households | % Households |
| Under 35 Years | 28 | 16.2% |
| 35 to 44 Years | 58 | 33.5% |
| 45 to 54 Years | 2 | 1.2% |
| 55 to 64 Years | 28 | 16.2% |
| 65 to 74 Years | 36 | 20.8% |
| 75 to 84 Years | 20 | 11.6% |
| 85 Years and Over | 1 | 0.6% |
| Total | 173 | 100.0% |
Housing Finances in Cofield
Median Income by Occupancy in Cofield
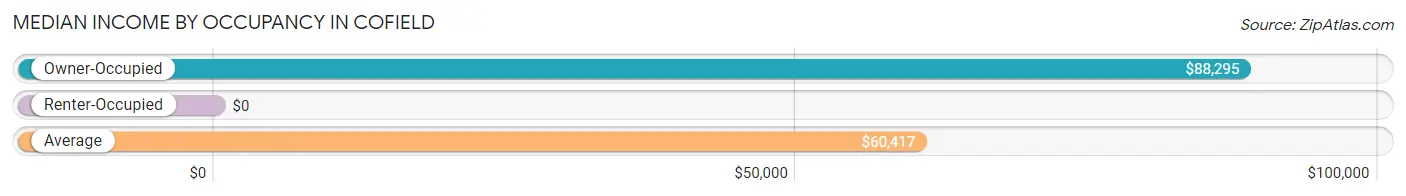
| Occupancy Type | # Households | Median Income |
| Owner-Occupied | 105 (60.7%) | $88,295 |
| Renter-Occupied | 68 (39.3%) | $0 |
| Average | 173 (100.0%) | $60,417 |
Occupancy by Householder Income Bracket in Cofield
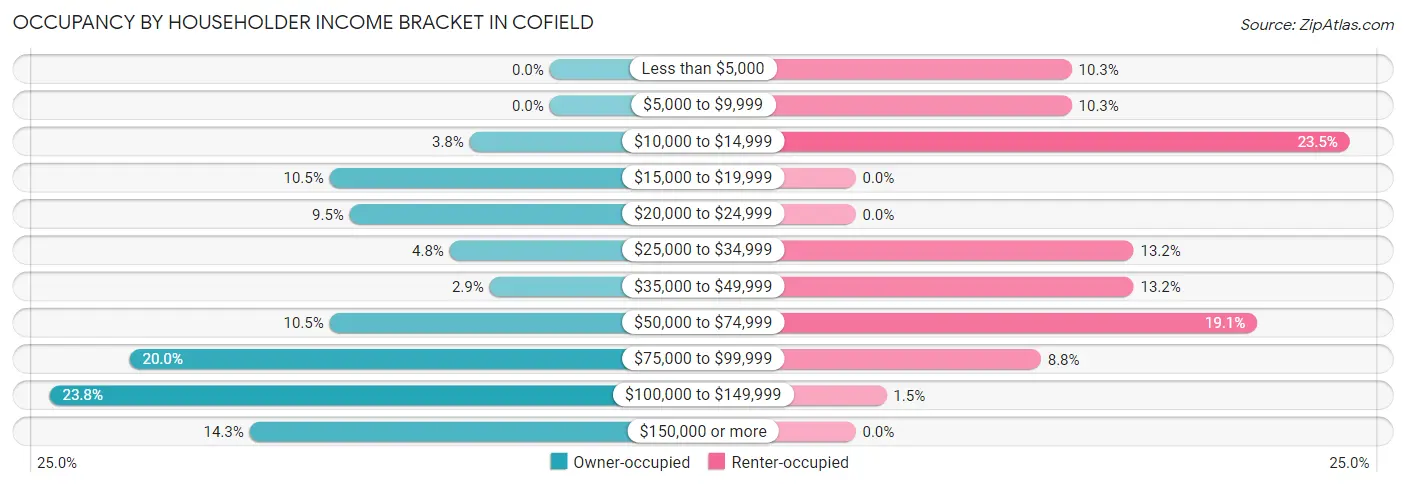
| Income Bracket | Owner-occupied | Renter-occupied |
| Less than $5,000 | 0 (0.0%) | 7 (10.3%) |
| $5,000 to $9,999 | 0 (0.0%) | 7 (10.3%) |
| $10,000 to $14,999 | 4 (3.8%) | 16 (23.5%) |
| $15,000 to $19,999 | 11 (10.5%) | 0 (0.0%) |
| $20,000 to $24,999 | 10 (9.5%) | 0 (0.0%) |
| $25,000 to $34,999 | 5 (4.8%) | 9 (13.2%) |
| $35,000 to $49,999 | 3 (2.9%) | 9 (13.2%) |
| $50,000 to $74,999 | 11 (10.5%) | 13 (19.1%) |
| $75,000 to $99,999 | 21 (20.0%) | 6 (8.8%) |
| $100,000 to $149,999 | 25 (23.8%) | 1 (1.5%) |
| $150,000 or more | 15 (14.3%) | 0 (0.0%) |
| Total | 105 (100.0%) | 68 (100.0%) |
Monthly Housing Cost Tiers in Cofield
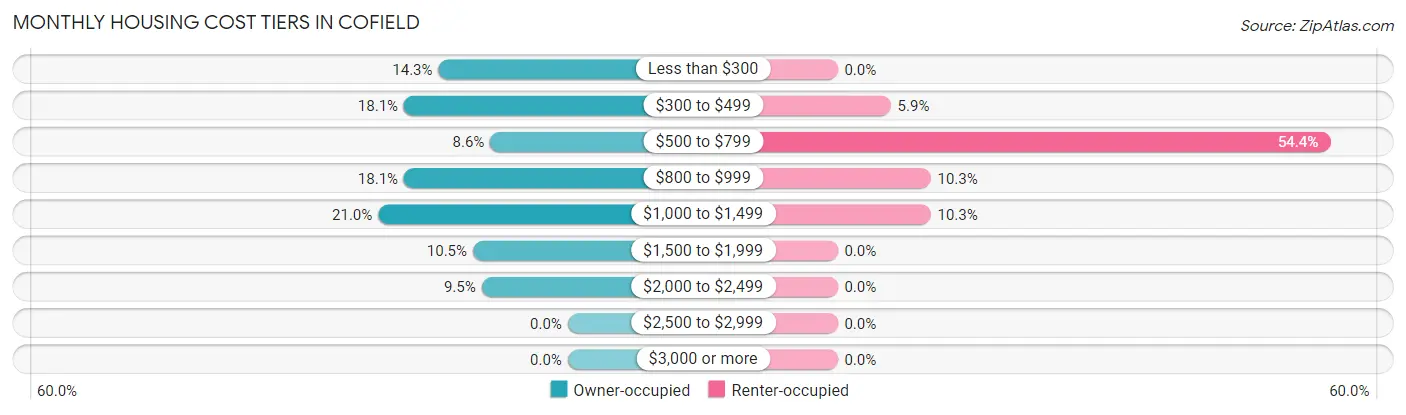
| Monthly Cost | Owner-occupied | Renter-occupied |
| Less than $300 | 15 (14.3%) | 0 (0.0%) |
| $300 to $499 | 19 (18.1%) | 4 (5.9%) |
| $500 to $799 | 9 (8.6%) | 37 (54.4%) |
| $800 to $999 | 19 (18.1%) | 7 (10.3%) |
| $1,000 to $1,499 | 22 (20.9%) | 7 (10.3%) |
| $1,500 to $1,999 | 11 (10.5%) | 0 (0.0%) |
| $2,000 to $2,499 | 10 (9.5%) | 0 (0.0%) |
| $2,500 to $2,999 | 0 (0.0%) | 0 (0.0%) |
| $3,000 or more | 0 (0.0%) | 0 (0.0%) |
| Total | 105 (100.0%) | 68 (100.0%) |
Physical Housing Characteristics in Cofield
Housing Structures in Cofield
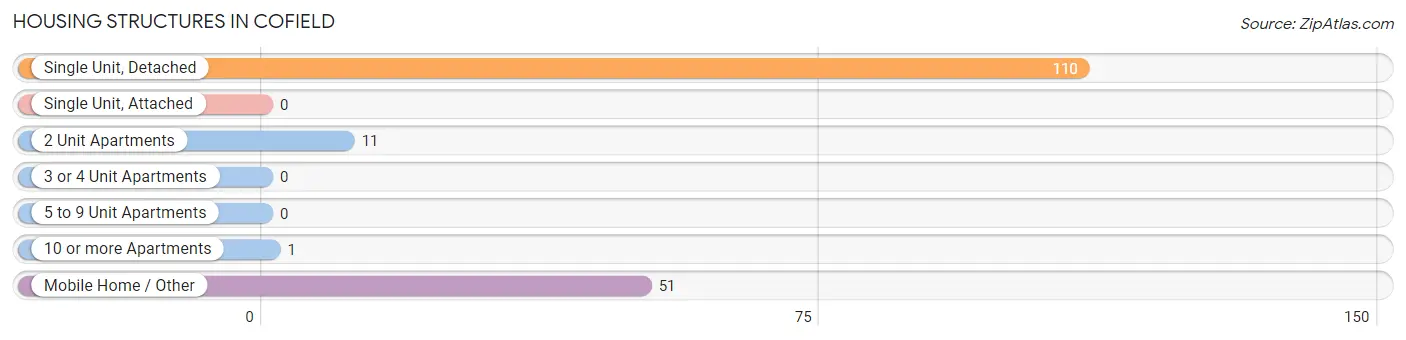
| Structure Type | # Housing Units | % Housing Units |
| Single Unit, Detached | 110 | 63.6% |
| Single Unit, Attached | 0 | 0.0% |
| 2 Unit Apartments | 11 | 6.4% |
| 3 or 4 Unit Apartments | 0 | 0.0% |
| 5 to 9 Unit Apartments | 0 | 0.0% |
| 10 or more Apartments | 1 | 0.6% |
| Mobile Home / Other | 51 | 29.5% |
| Total | 173 | 100.0% |
Housing Structures by Occupancy in Cofield
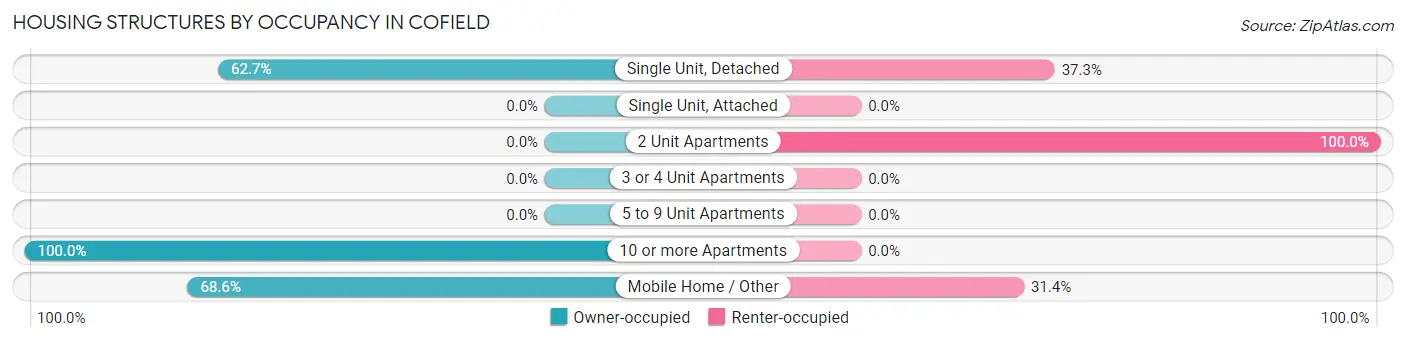
| Structure Type | Owner-occupied | Renter-occupied |
| Single Unit, Detached | 69 (62.7%) | 41 (37.3%) |
| Single Unit, Attached | 0 (0.0%) | 0 (0.0%) |
| 2 Unit Apartments | 0 (0.0%) | 11 (100.0%) |
| 3 or 4 Unit Apartments | 0 (0.0%) | 0 (0.0%) |
| 5 to 9 Unit Apartments | 0 (0.0%) | 0 (0.0%) |
| 10 or more Apartments | 1 (100.0%) | 0 (0.0%) |
| Mobile Home / Other | 35 (68.6%) | 16 (31.4%) |
| Total | 105 (60.7%) | 68 (39.3%) |
Housing Structures by Number of Rooms in Cofield
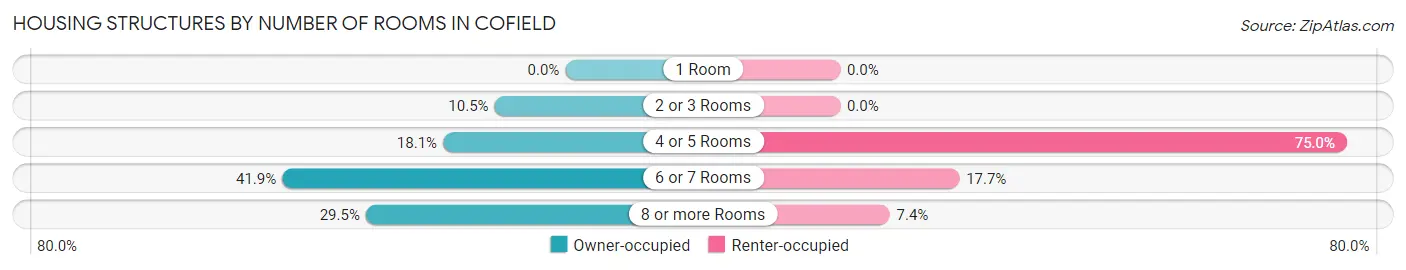
| Number of Rooms | Owner-occupied | Renter-occupied |
| 1 Room | 0 (0.0%) | 0 (0.0%) |
| 2 or 3 Rooms | 11 (10.5%) | 0 (0.0%) |
| 4 or 5 Rooms | 19 (18.1%) | 51 (75.0%) |
| 6 or 7 Rooms | 44 (41.9%) | 12 (17.6%) |
| 8 or more Rooms | 31 (29.5%) | 5 (7.3%) |
| Total | 105 (100.0%) | 68 (100.0%) |
Housing Structure by Heating Type in Cofield
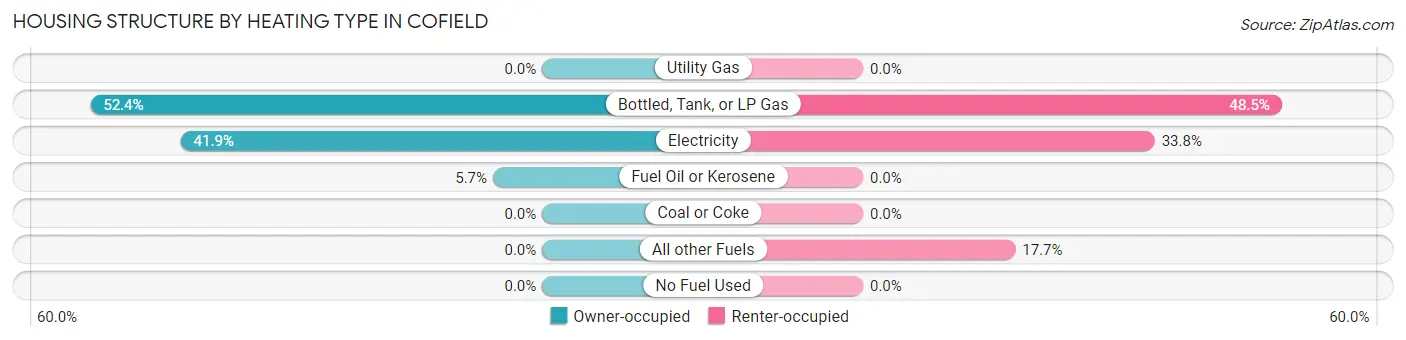
| Heating Type | Owner-occupied | Renter-occupied |
| Utility Gas | 0 (0.0%) | 0 (0.0%) |
| Bottled, Tank, or LP Gas | 55 (52.4%) | 33 (48.5%) |
| Electricity | 44 (41.9%) | 23 (33.8%) |
| Fuel Oil or Kerosene | 6 (5.7%) | 0 (0.0%) |
| Coal or Coke | 0 (0.0%) | 0 (0.0%) |
| All other Fuels | 0 (0.0%) | 12 (17.6%) |
| No Fuel Used | 0 (0.0%) | 0 (0.0%) |
| Total | 105 (100.0%) | 68 (100.0%) |
Household Vehicle Usage in Cofield
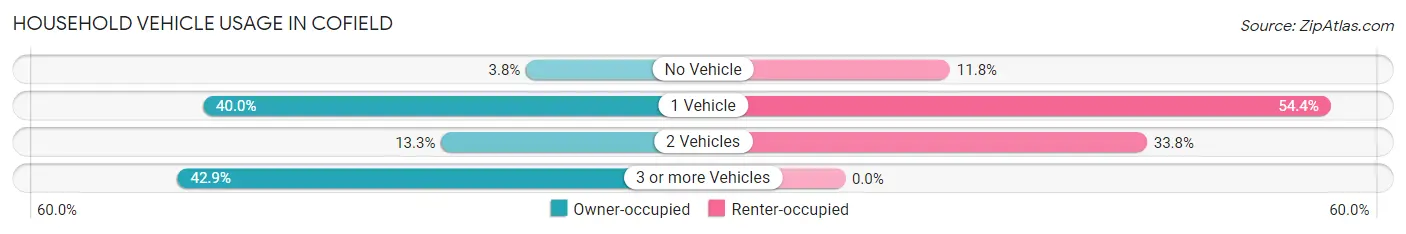
| Vehicles per Household | Owner-occupied | Renter-occupied |
| No Vehicle | 4 (3.8%) | 8 (11.8%) |
| 1 Vehicle | 42 (40.0%) | 37 (54.4%) |
| 2 Vehicles | 14 (13.3%) | 23 (33.8%) |
| 3 or more Vehicles | 45 (42.9%) | 0 (0.0%) |
| Total | 105 (100.0%) | 68 (100.0%) |
Real Estate & Mortgages in Cofield
Real Estate and Mortgage Overview in Cofield
| Characteristic | Without Mortgage | With Mortgage |
| Housing Units | 40 | 65 |
| Median Property Value | $34,300 | $97,100 |
| Median Household Income | $88,182 | $10 |
| Monthly Housing Costs | $413 | $0 |
| Real Estate Taxes | $495 | $12 |
Property Value by Mortgage Status in Cofield
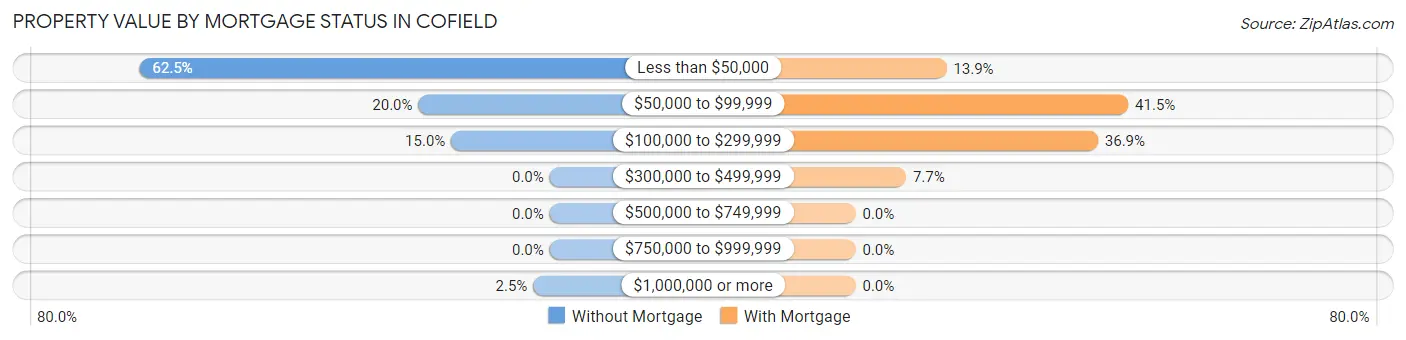
| Property Value | Without Mortgage | With Mortgage |
| Less than $50,000 | 25 (62.5%) | 9 (13.9%) |
| $50,000 to $99,999 | 8 (20.0%) | 27 (41.5%) |
| $100,000 to $299,999 | 6 (15.0%) | 24 (36.9%) |
| $300,000 to $499,999 | 0 (0.0%) | 5 (7.7%) |
| $500,000 to $749,999 | 0 (0.0%) | 0 (0.0%) |
| $750,000 to $999,999 | 0 (0.0%) | 0 (0.0%) |
| $1,000,000 or more | 1 (2.5%) | 0 (0.0%) |
| Total | 40 (100.0%) | 65 (100.0%) |
Household Income by Mortgage Status in Cofield
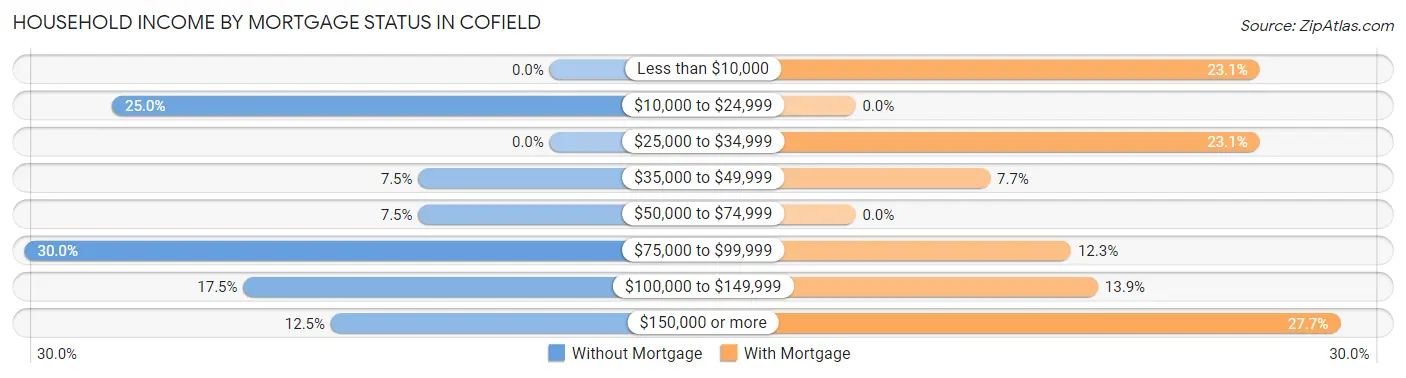
| Household Income | Without Mortgage | With Mortgage |
| Less than $10,000 | 0 (0.0%) | 15 (23.1%) |
| $10,000 to $24,999 | 10 (25.0%) | 0 (0.0%) |
| $25,000 to $34,999 | 0 (0.0%) | 15 (23.1%) |
| $35,000 to $49,999 | 3 (7.5%) | 5 (7.7%) |
| $50,000 to $74,999 | 3 (7.5%) | 0 (0.0%) |
| $75,000 to $99,999 | 12 (30.0%) | 8 (12.3%) |
| $100,000 to $149,999 | 7 (17.5%) | 9 (13.9%) |
| $150,000 or more | 5 (12.5%) | 18 (27.7%) |
| Total | 40 (100.0%) | 65 (100.0%) |
Property Value to Household Income Ratio in Cofield
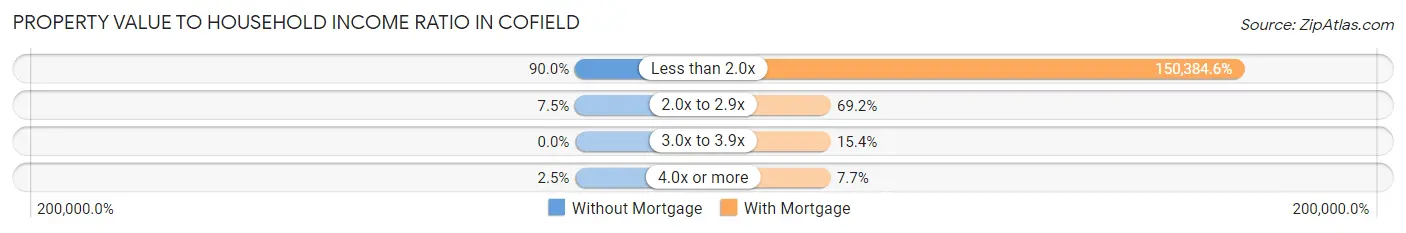
| Value-to-Income Ratio | Without Mortgage | With Mortgage |
| Less than 2.0x | 36 (90.0%) | 97,750 (150,384.6%) |
| 2.0x to 2.9x | 3 (7.5%) | 45 (69.2%) |
| 3.0x to 3.9x | 0 (0.0%) | 10 (15.4%) |
| 4.0x or more | 1 (2.5%) | 5 (7.7%) |
| Total | 40 (100.0%) | 65 (100.0%) |
Real Estate Taxes by Mortgage Status in Cofield
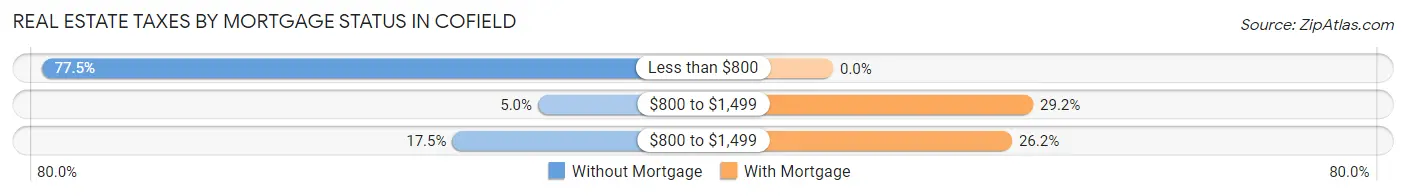
| Property Taxes | Without Mortgage | With Mortgage |
| Less than $800 | 31 (77.5%) | 0 (0.0%) |
| $800 to $1,499 | 2 (5.0%) | 19 (29.2%) |
| $800 to $1,499 | 7 (17.5%) | 17 (26.2%) |
| Total | 40 (100.0%) | 65 (100.0%) |
Health & Disability in Cofield
Health Insurance Coverage by Age in Cofield
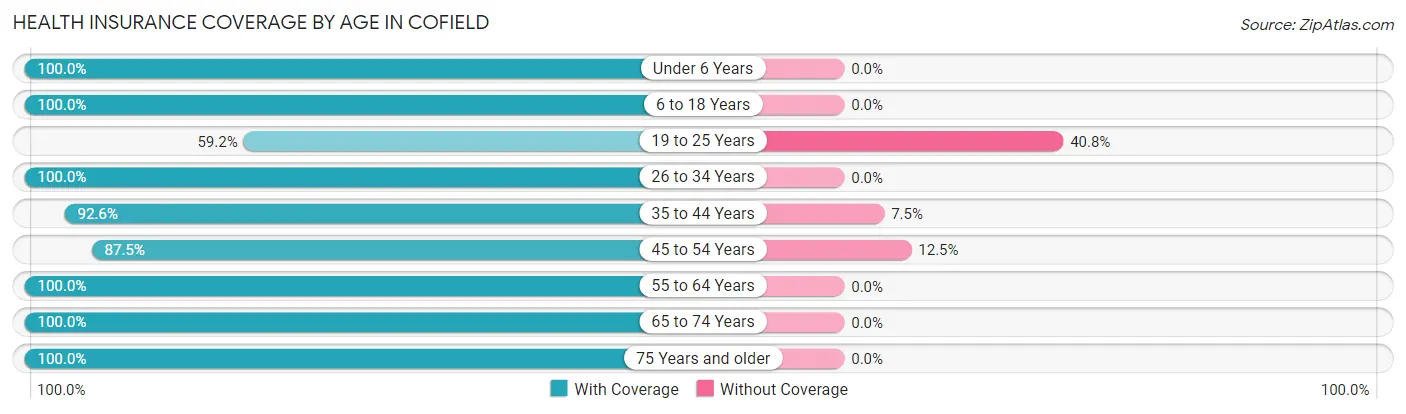
| Age Bracket | With Coverage | Without Coverage |
| Under 6 Years | 14 (100.0%) | 0 (0.0%) |
| 6 to 18 Years | 74 (100.0%) | 0 (0.0%) |
| 19 to 25 Years | 29 (59.2%) | 20 (40.8%) |
| 26 to 34 Years | 19 (100.0%) | 0 (0.0%) |
| 35 to 44 Years | 87 (92.5%) | 7 (7.4%) |
| 45 to 54 Years | 21 (87.5%) | 3 (12.5%) |
| 55 to 64 Years | 40 (100.0%) | 0 (0.0%) |
| 65 to 74 Years | 44 (100.0%) | 0 (0.0%) |
| 75 Years and older | 26 (100.0%) | 0 (0.0%) |
| Total | 354 (92.2%) | 30 (7.8%) |
Health Insurance Coverage by Citizenship Status in Cofield
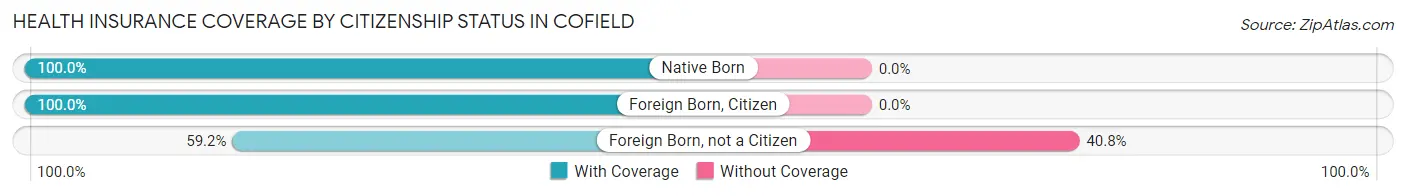
| Citizenship Status | With Coverage | Without Coverage |
| Native Born | 14 (100.0%) | 0 (0.0%) |
| Foreign Born, Citizen | 74 (100.0%) | 0 (0.0%) |
| Foreign Born, not a Citizen | 29 (59.2%) | 20 (40.8%) |
Health Insurance Coverage by Household Income in Cofield
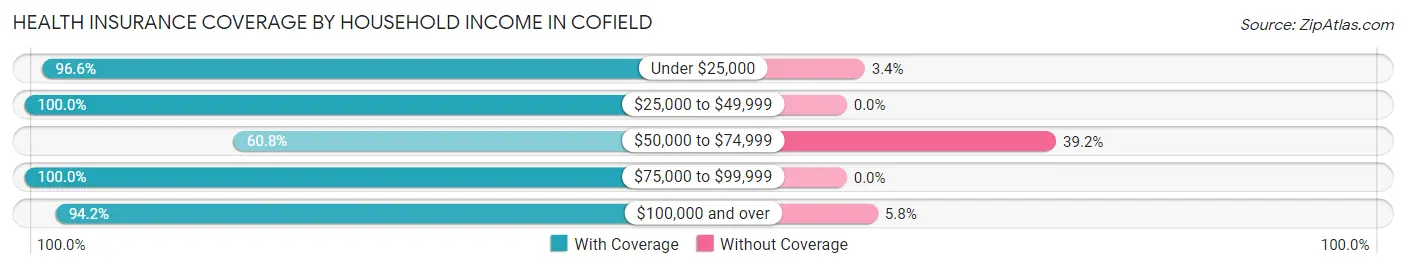
| Household Income | With Coverage | Without Coverage |
| Under $25,000 | 86 (96.6%) | 3 (3.4%) |
| $25,000 to $49,999 | 58 (100.0%) | 0 (0.0%) |
| $50,000 to $74,999 | 31 (60.8%) | 20 (39.2%) |
| $75,000 to $99,999 | 66 (100.0%) | 0 (0.0%) |
| $100,000 and over | 113 (94.2%) | 7 (5.8%) |
Public vs Private Health Insurance Coverage by Age in Cofield
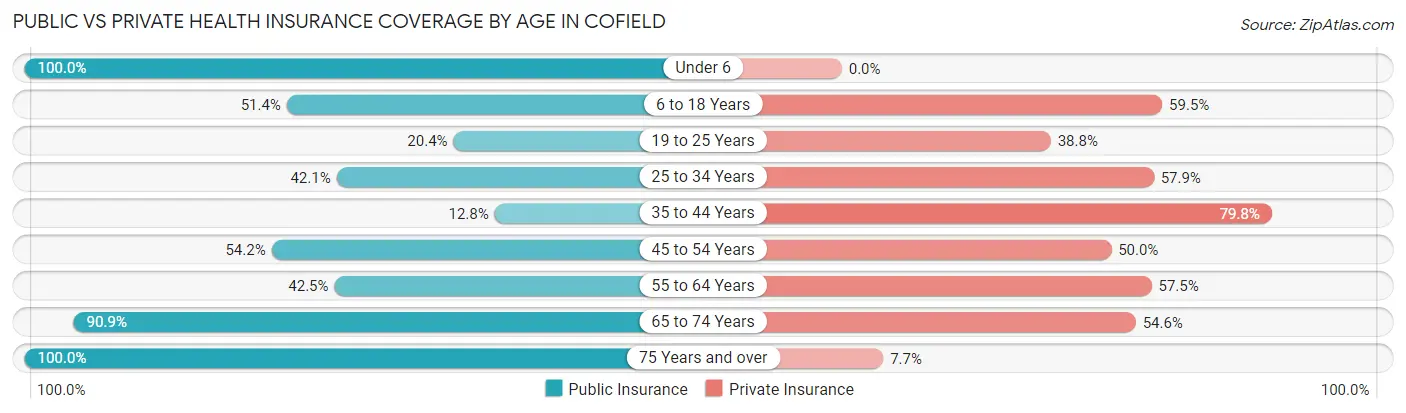
| Age Bracket | Public Insurance | Private Insurance |
| Under 6 | 14 (100.0%) | 0 (0.0%) |
| 6 to 18 Years | 38 (51.3%) | 44 (59.5%) |
| 19 to 25 Years | 10 (20.4%) | 19 (38.8%) |
| 25 to 34 Years | 8 (42.1%) | 11 (57.9%) |
| 35 to 44 Years | 12 (12.8%) | 75 (79.8%) |
| 45 to 54 Years | 13 (54.2%) | 12 (50.0%) |
| 55 to 64 Years | 17 (42.5%) | 23 (57.5%) |
| 65 to 74 Years | 40 (90.9%) | 24 (54.5%) |
| 75 Years and over | 26 (100.0%) | 2 (7.7%) |
| Total | 178 (46.4%) | 210 (54.7%) |
Disability Status by Sex by Age in Cofield
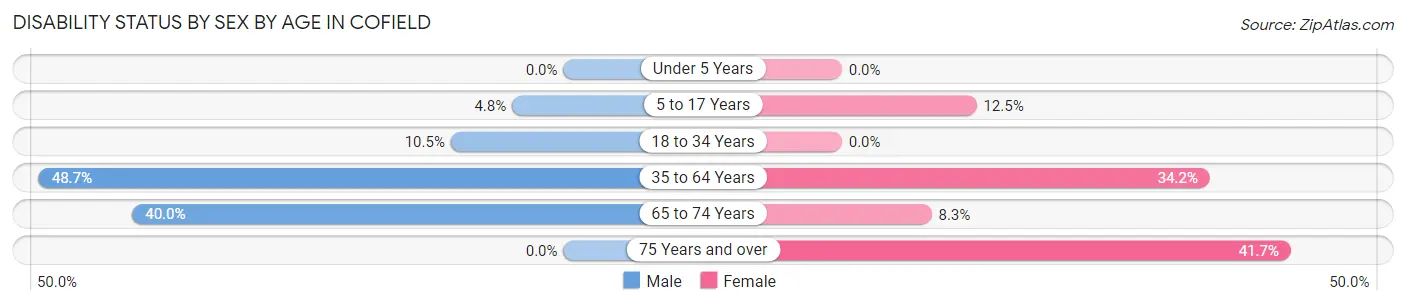
| Age Bracket | Male | Female |
| Under 5 Years | 0 (0.0%) | 0 (0.0%) |
| 5 to 17 Years | 2 (4.8%) | 3 (12.5%) |
| 18 to 34 Years | 7 (10.4%) | 0 (0.0%) |
| 35 to 64 Years | 37 (48.7%) | 28 (34.2%) |
| 65 to 74 Years | 8 (40.0%) | 2 (8.3%) |
| 75 Years and over | 0 (0.0%) | 5 (41.7%) |
Disability Class by Sex by Age in Cofield
Disability Class: Hearing Difficulty
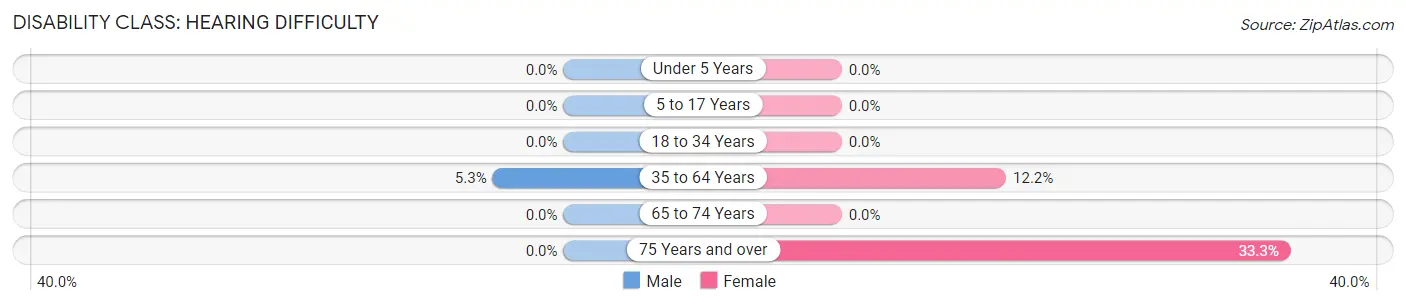
| Age Bracket | Male | Female |
| Under 5 Years | 0 (0.0%) | 0 (0.0%) |
| 5 to 17 Years | 0 (0.0%) | 0 (0.0%) |
| 18 to 34 Years | 0 (0.0%) | 0 (0.0%) |
| 35 to 64 Years | 4 (5.3%) | 10 (12.2%) |
| 65 to 74 Years | 0 (0.0%) | 0 (0.0%) |
| 75 Years and over | 0 (0.0%) | 4 (33.3%) |
Disability Class: Vision Difficulty
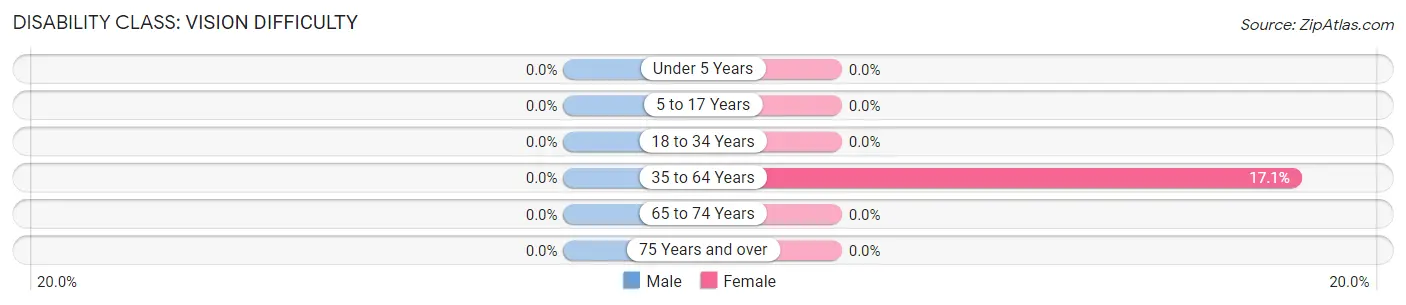
| Age Bracket | Male | Female |
| Under 5 Years | 0 (0.0%) | 0 (0.0%) |
| 5 to 17 Years | 0 (0.0%) | 0 (0.0%) |
| 18 to 34 Years | 0 (0.0%) | 0 (0.0%) |
| 35 to 64 Years | 0 (0.0%) | 14 (17.1%) |
| 65 to 74 Years | 0 (0.0%) | 0 (0.0%) |
| 75 Years and over | 0 (0.0%) | 0 (0.0%) |
Disability Class: Cognitive Difficulty
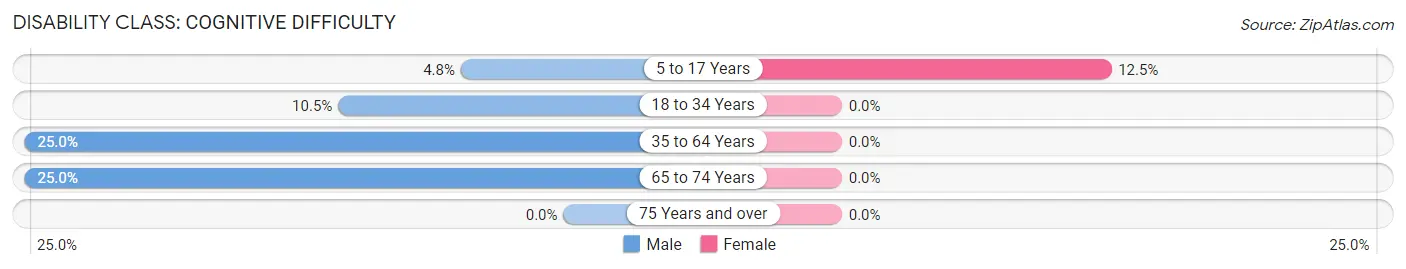
| Age Bracket | Male | Female |
| 5 to 17 Years | 2 (4.8%) | 3 (12.5%) |
| 18 to 34 Years | 7 (10.4%) | 0 (0.0%) |
| 35 to 64 Years | 19 (25.0%) | 0 (0.0%) |
| 65 to 74 Years | 5 (25.0%) | 0 (0.0%) |
| 75 Years and over | 0 (0.0%) | 0 (0.0%) |
Disability Class: Ambulatory Difficulty
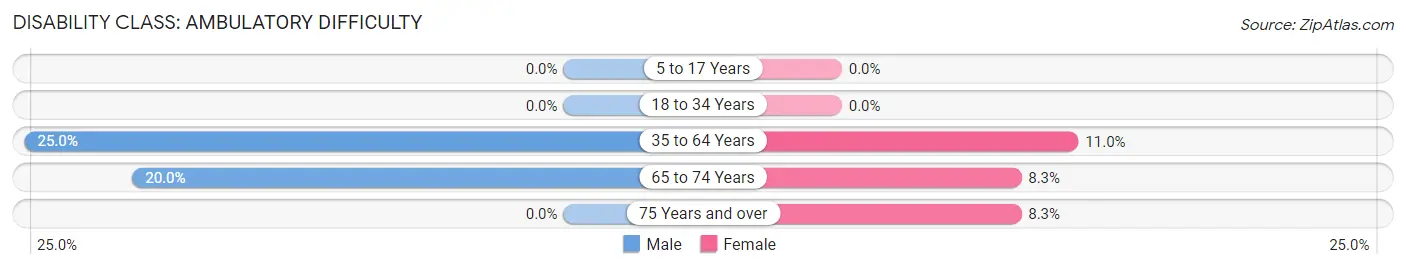
| Age Bracket | Male | Female |
| 5 to 17 Years | 0 (0.0%) | 0 (0.0%) |
| 18 to 34 Years | 0 (0.0%) | 0 (0.0%) |
| 35 to 64 Years | 19 (25.0%) | 9 (11.0%) |
| 65 to 74 Years | 4 (20.0%) | 2 (8.3%) |
| 75 Years and over | 0 (0.0%) | 1 (8.3%) |
Disability Class: Self-Care Difficulty
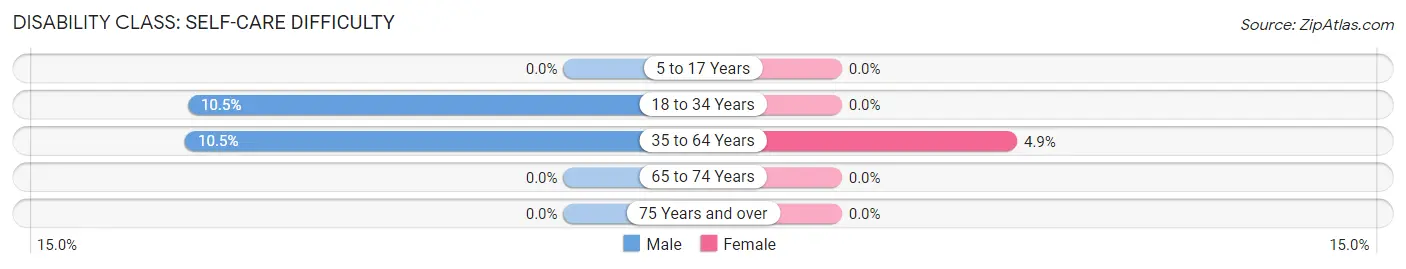
| Age Bracket | Male | Female |
| 5 to 17 Years | 0 (0.0%) | 0 (0.0%) |
| 18 to 34 Years | 7 (10.4%) | 0 (0.0%) |
| 35 to 64 Years | 8 (10.5%) | 4 (4.9%) |
| 65 to 74 Years | 0 (0.0%) | 0 (0.0%) |
| 75 Years and over | 0 (0.0%) | 0 (0.0%) |
Technology Access in Cofield
Computing Device Access in Cofield
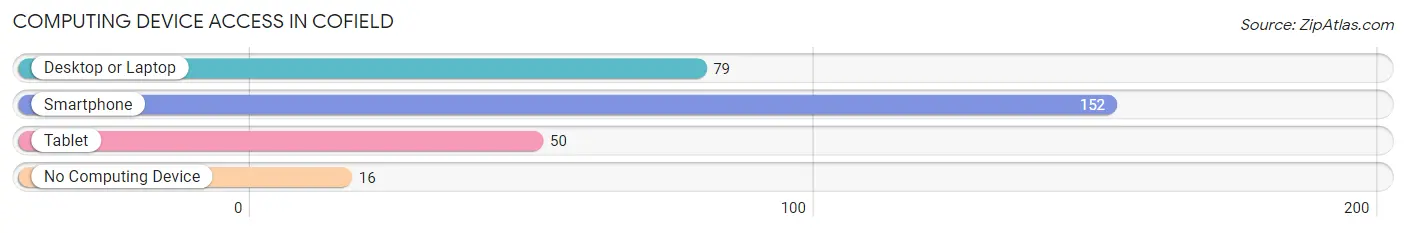
| Device Type | # Households | % Households |
| Desktop or Laptop | 79 | 45.7% |
| Smartphone | 152 | 87.9% |
| Tablet | 50 | 28.9% |
| No Computing Device | 16 | 9.2% |
| Total | 173 | 100.0% |
Internet Access in Cofield
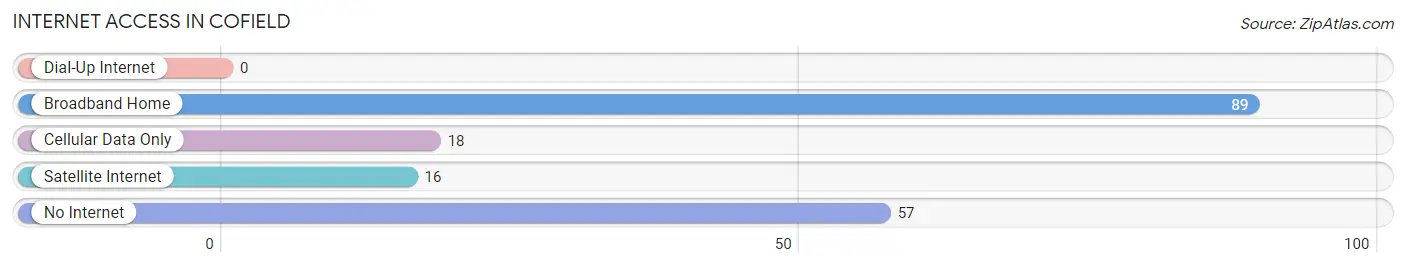
| Internet Type | # Households | % Households |
| Dial-Up Internet | 0 | 0.0% |
| Broadband Home | 89 | 51.4% |
| Cellular Data Only | 18 | 10.4% |
| Satellite Internet | 16 | 9.2% |
| No Internet | 57 | 33.0% |
| Total | 173 | 100.0% |
Cofield Summary
Cofield is a small town located in Northampton County, North Carolina. It is situated on the Roanoke River, approximately 20 miles east of the city of Rocky Mount. The town has a population of approximately 1,000 people and is part of the Roanoke Rapids Micropolitan Statistical Area.
History
Cofield was founded in 1887 by the Cofield family, who had moved to the area from Virginia. The town was named after the family’s patriarch, William Cofield. The town was originally a farming community, but in the early 1900s, the Cofields began to develop the area into a manufacturing center. The first industry to be established in Cofield was a cotton mill, which was built in 1906. This was followed by a furniture factory in 1910 and a brickyard in 1912.
The town continued to grow throughout the 20th century, and by the 1950s, Cofield had become a thriving community with a population of over 1,000 people. The town was home to several businesses, including a grocery store, a bank, a post office, and a movie theater.
Geography
Cofield is located in Northampton County, North Carolina, approximately 20 miles east of the city of Rocky Mount. The town is situated on the Roanoke River, which flows through the area. The town is surrounded by farmland and is located near the Great Dismal Swamp National Wildlife Refuge.
The climate in Cofield is humid subtropical, with hot, humid summers and mild winters. The average annual temperature is around 70 degrees Fahrenheit, and the average annual precipitation is around 45 inches.
Economy
The economy of Cofield is largely based on agriculture and manufacturing. The town is home to several farms, which produce a variety of crops, including corn, soybeans, and cotton. The town is also home to several manufacturing companies, including a furniture factory, a brickyard, and a cotton mill.
In addition to these industries, Cofield is home to several small businesses, including a grocery store, a bank, a post office, and a movie theater. The town is also home to several churches, a library, and a community center.
Demographics
As of the 2010 census, the population of Cofield was 1,039. The racial makeup of the town was 79.3% White, 17.2% African American, 0.7% Native American, 0.3% Asian, 0.1% Pacific Islander, and 2.4% from other races. The median household income was $30,938, and the median family income was $37,813.
Cofield is a small, rural town with a close-knit community. The town is home to several churches, a library, and a community center, and the people of Cofield take pride in their town and its history.
Common Questions
What is Per Capita Income in Cofield?
Per Capita income in Cofield is $40,777.
What is the Median Family Income in Cofield?
Median Family Income in Cofield is $58,750.
What is the Median Household income in Cofield?
Median Household Income in Cofield is $60,417.
What is Income or Wage Gap in Cofield?
Income or Wage Gap in Cofield is 7.5%.
Women in Cofield earn 92.5 cents for every dollar earned by a man.
What is Inequality or Gini Index in Cofield?
Inequality or Gini Index in Cofield is 0.60.
What is the Total Population of Cofield?
Total Population of Cofield is 384.
What is the Total Male Population of Cofield?
Total Male Population of Cofield is 230.
What is the Total Female Population of Cofield?
Total Female Population of Cofield is 154.
What is the Ratio of Males per 100 Females in Cofield?
There are 149.35 Males per 100 Females in Cofield.
What is the Ratio of Females per 100 Males in Cofield?
There are 66.96 Females per 100 Males in Cofield.
What is the Median Population Age in Cofield?
Median Population Age in Cofield is 40.0 Years.
What is the Average Family Size in Cofield
Average Family Size in Cofield is 2.7 People.
What is the Average Household Size in Cofield
Average Household Size in Cofield is 2.2 People.
How Large is the Labor Force in Cofield?
There are 194 People in the Labor Forcein in Cofield.
What is the Percentage of People in the Labor Force in Cofield?
62.0% of People are in the Labor Force in Cofield.
What is the Unemployment Rate in Cofield?
Unemployment Rate in Cofield is 17.5%.