St Pauls, NC Map & Demographics
St Pauls Map
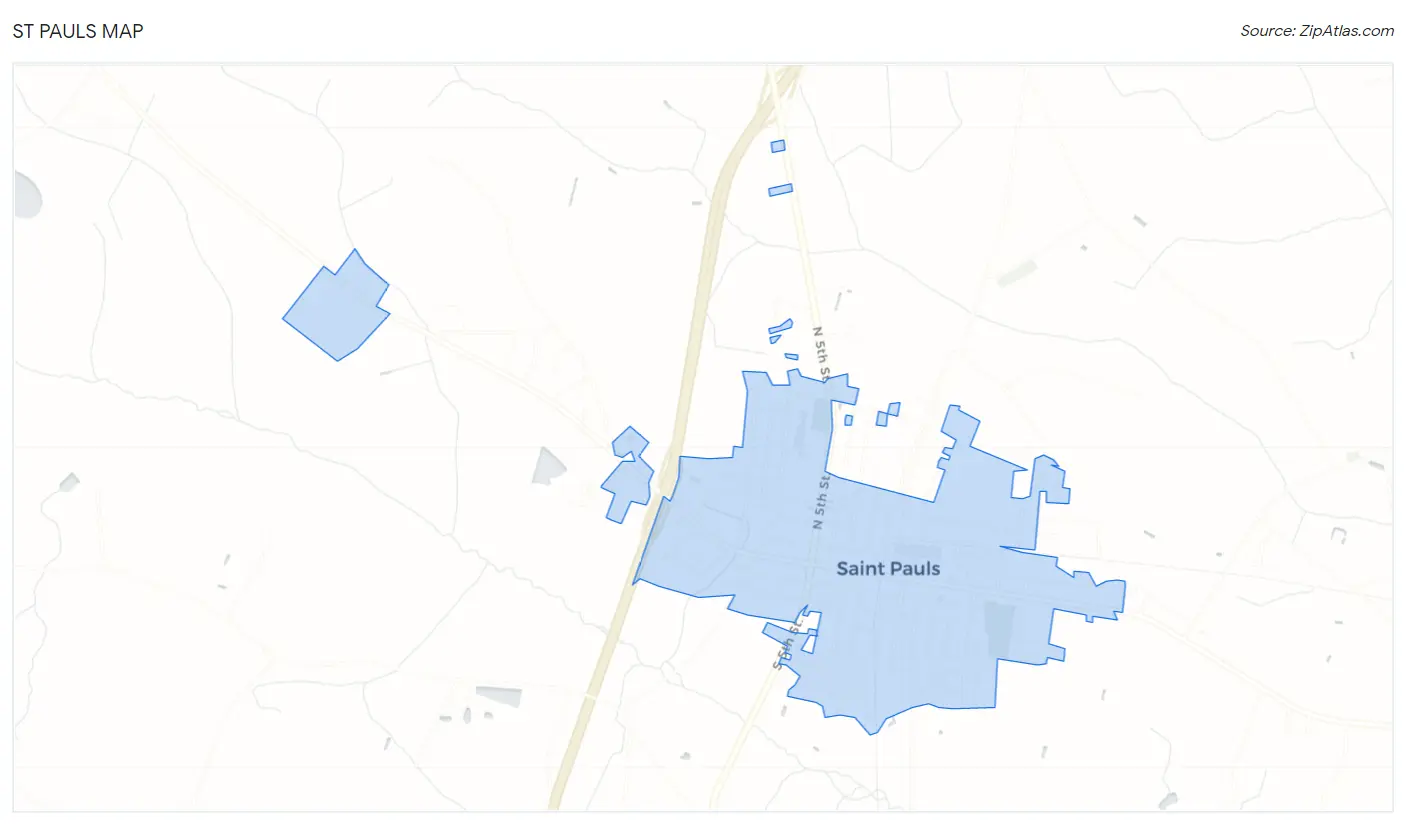
St Pauls Overview
$21,608
PER CAPITA INCOME
$50,125
AVG FAMILY INCOME
$36,490
AVG HOUSEHOLD INCOME
2.9%
WAGE / INCOME GAP [ % ]
97.1¢/ $1
WAGE / INCOME GAP [ $ ]
0.52
INEQUALITY / GINI INDEX
2,261
TOTAL POPULATION
1,064
MALE POPULATION
1,197
FEMALE POPULATION
88.89
MALES / 100 FEMALES
112.50
FEMALES / 100 MALES
42.6
MEDIAN AGE
3.7
AVG FAMILY SIZE
2.6
AVG HOUSEHOLD SIZE
822
LABOR FORCE [ PEOPLE ]
48.4%
PERCENT IN LABOR FORCE
9.9%
UNEMPLOYMENT RATE
Income in St Pauls
Income Overview in St Pauls
Per Capita Income in St Pauls is $21,608, while median incomes of families and households are $50,125 and $36,490 respectively.
| Characteristic | Number | Measure |
| Per Capita Income | 2,261 | $21,608 |
| Median Family Income | 477 | $50,125 |
| Mean Family Income | 477 | $67,991 |
| Median Household Income | 875 | $36,490 |
| Mean Household Income | 875 | $54,168 |
| Income Deficit | 477 | $0 |
| Wage / Income Gap (%) | 2,261 | 2.89% |
| Wage / Income Gap ($) | 2,261 | 97.11¢ per $1 |
| Gini / Inequality Index | 2,261 | 0.52 |
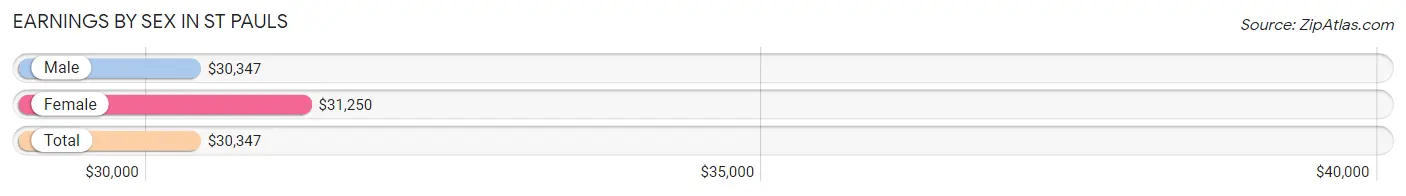
Earnings by Sex in St Pauls
Average Earnings in St Pauls are $30,347, $30,347 for men and $31,250 for women, a difference of 2.9%.
| Sex | Number | Average Earnings |
| Male | 471 (57.4%) | $30,347 |
| Female | 350 (42.6%) | $31,250 |
| Total | 821 (100.0%) | $30,347 |
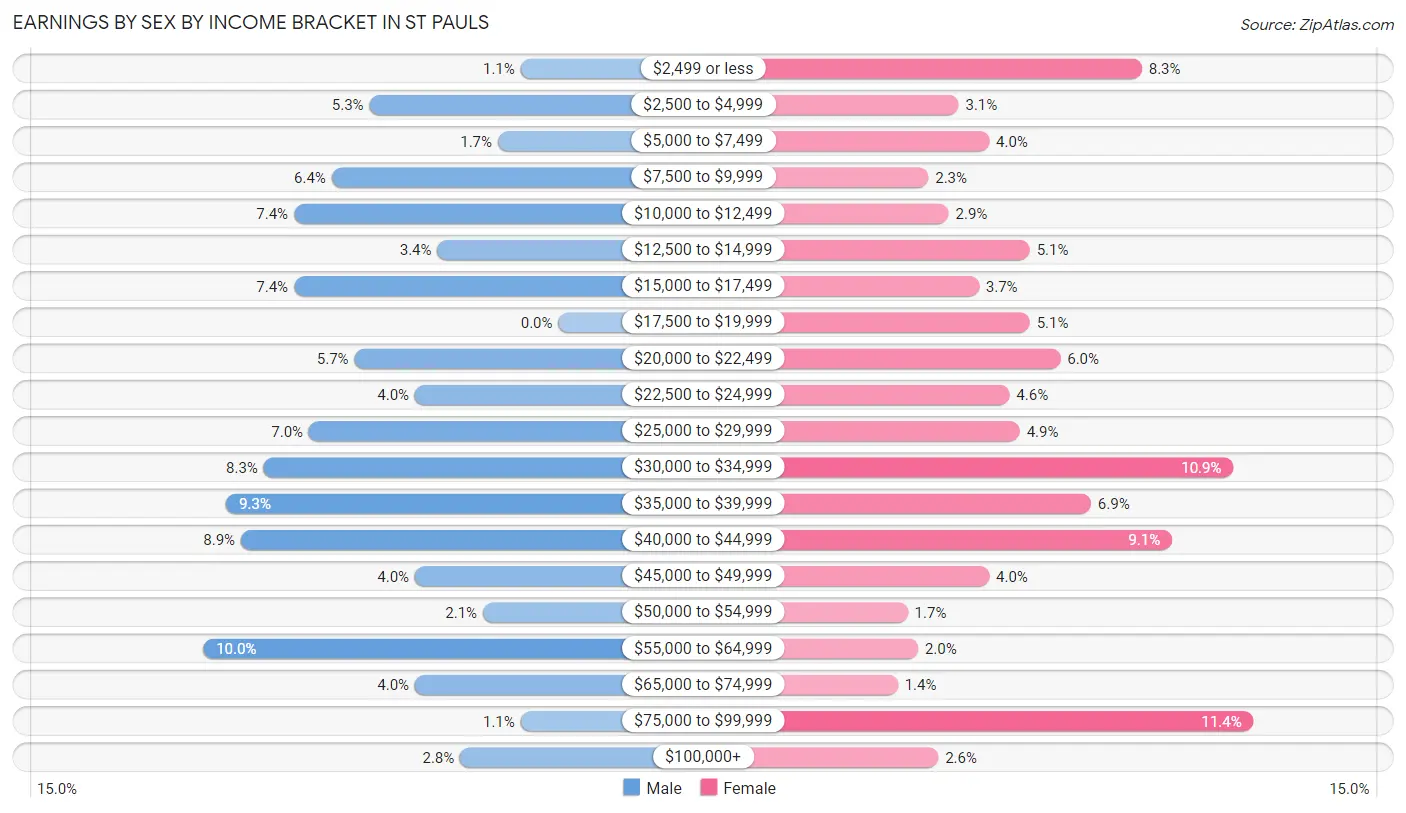
Earnings by Sex by Income Bracket in St Pauls
The most common earnings brackets in St Pauls are $55,000 to $64,999 for men (47 | 10.0%) and $75,000 to $99,999 for women (40 | 11.4%).
| Income | Male | Female |
| $2,499 or less | 5 (1.1%) | 29 (8.3%) |
| $2,500 to $4,999 | 25 (5.3%) | 11 (3.1%) |
| $5,000 to $7,499 | 8 (1.7%) | 14 (4.0%) |
| $7,500 to $9,999 | 30 (6.4%) | 8 (2.3%) |
| $10,000 to $12,499 | 35 (7.4%) | 10 (2.9%) |
| $12,500 to $14,999 | 16 (3.4%) | 18 (5.1%) |
| $15,000 to $17,499 | 35 (7.4%) | 13 (3.7%) |
| $17,500 to $19,999 | 0 (0.0%) | 18 (5.1%) |
| $20,000 to $22,499 | 27 (5.7%) | 21 (6.0%) |
| $22,500 to $24,999 | 19 (4.0%) | 16 (4.6%) |
| $25,000 to $29,999 | 33 (7.0%) | 17 (4.9%) |
| $30,000 to $34,999 | 39 (8.3%) | 38 (10.9%) |
| $35,000 to $39,999 | 44 (9.3%) | 24 (6.9%) |
| $40,000 to $44,999 | 42 (8.9%) | 32 (9.1%) |
| $45,000 to $49,999 | 19 (4.0%) | 14 (4.0%) |
| $50,000 to $54,999 | 10 (2.1%) | 6 (1.7%) |
| $55,000 to $64,999 | 47 (10.0%) | 7 (2.0%) |
| $65,000 to $74,999 | 19 (4.0%) | 5 (1.4%) |
| $75,000 to $99,999 | 5 (1.1%) | 40 (11.4%) |
| $100,000+ | 13 (2.8%) | 9 (2.6%) |
| Total | 471 (100.0%) | 350 (100.0%) |
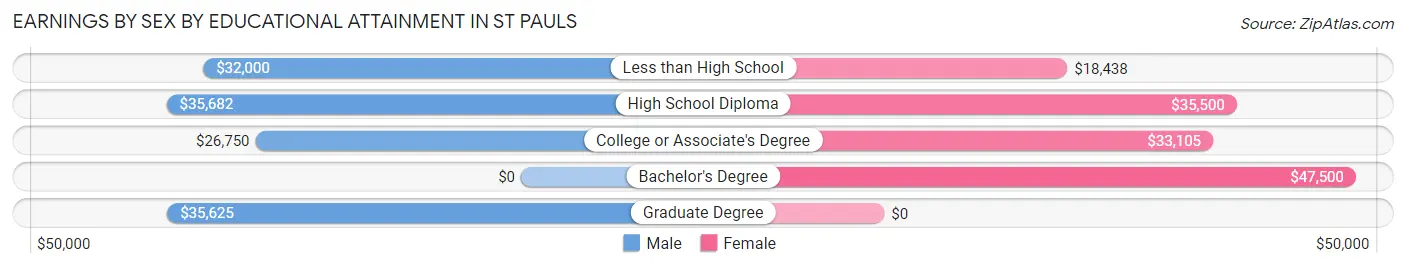
Earnings by Sex by Educational Attainment in St Pauls
Average earnings in St Pauls are $31,806 for men and $33,191 for women, a difference of 4.2%. Men with an educational attainment of high school diploma enjoy the highest average annual earnings of $35,682, while those with college or associate's degree education earn the least with $26,750. Women with an educational attainment of bachelor's degree earn the most with the average annual earnings of $47,500, while those with less than high school education have the smallest earnings of $18,438.
| Educational Attainment | Male Income | Female Income |
| Less than High School | $32,000 | $18,438 |
| High School Diploma | $35,682 | $35,500 |
| College or Associate's Degree | $26,750 | $33,105 |
| Bachelor's Degree | - | - |
| Graduate Degree | $35,625 | $0 |
| Total | $31,806 | $33,191 |
Family Income in St Pauls
Family Income Brackets in St Pauls
According to the St Pauls family income data, there are 113 families falling into the $50,000 to $74,999 income range, which is the most common income bracket and makes up 23.7% of all families. Conversely, the $200,000+ income bracket is the least frequent group with only 11 families (2.3%) belonging to this category.
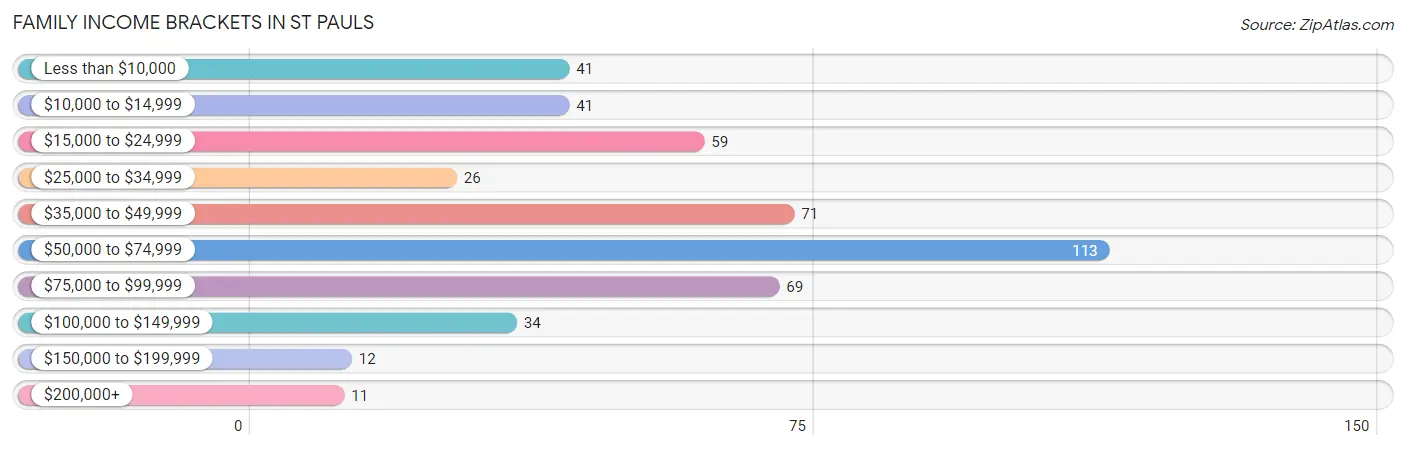
| Income Bracket | # Families | % Families |
| Less than $10,000 | 41 | 8.6% |
| $10,000 to $14,999 | 41 | 8.6% |
| $15,000 to $24,999 | 59 | 12.4% |
| $25,000 to $34,999 | 26 | 5.5% |
| $35,000 to $49,999 | 71 | 14.9% |
| $50,000 to $74,999 | 113 | 23.7% |
| $75,000 to $99,999 | 69 | 14.5% |
| $100,000 to $149,999 | 34 | 7.1% |
| $150,000 to $199,999 | 12 | 2.5% |
| $200,000+ | 11 | 2.3% |
Family Income by Famaliy Size in St Pauls
5-person families (50 | 10.5%) account for the highest median family income in St Pauls with $64,091 per family, while 2-person families (254 | 53.2%) have the highest median income of $25,500 per family member.
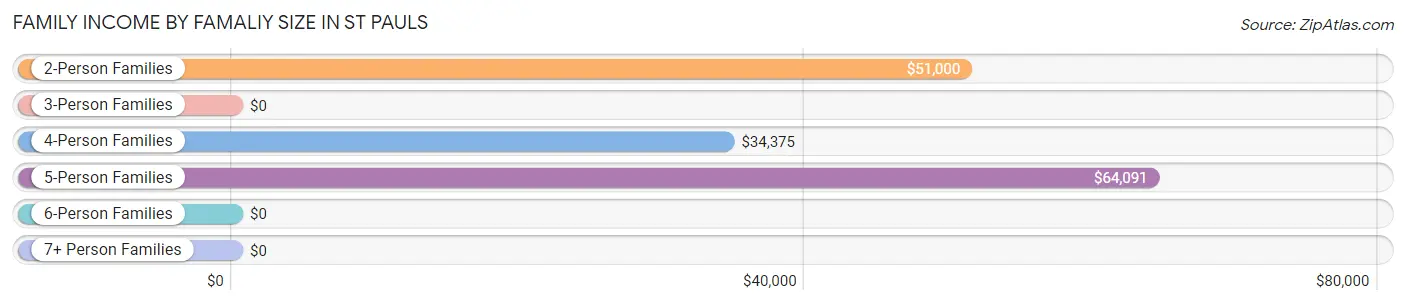
| Income Bracket | # Families | Median Income |
| 2-Person Families | 254 (53.2%) | $51,000 |
| 3-Person Families | 66 (13.8%) | $0 |
| 4-Person Families | 67 (14.1%) | $34,375 |
| 5-Person Families | 50 (10.5%) | $64,091 |
| 6-Person Families | 31 (6.5%) | $0 |
| 7+ Person Families | 9 (1.9%) | $0 |
| Total | 477 (100.0%) | $50,125 |
Family Income by Number of Earners in St Pauls
The median family income in St Pauls is $50,125, with families comprising 3+ earners (31) having the highest median family income of $83,438, while families with no earners (142) have the lowest median family income of $31,250, accounting for 6.5% and 29.8% of families, respectively.
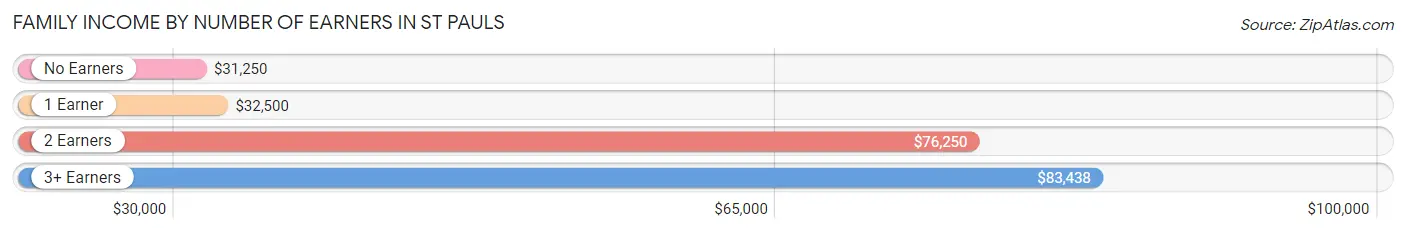
| Number of Earners | # Families | Median Income |
| No Earners | 142 (29.8%) | $31,250 |
| 1 Earner | 160 (33.5%) | $32,500 |
| 2 Earners | 144 (30.2%) | $76,250 |
| 3+ Earners | 31 (6.5%) | $83,438 |
| Total | 477 (100.0%) | $50,125 |
Household Income in St Pauls
Household Income Brackets in St Pauls
With 167 households falling in the category, the $15,000 to $24,999 income range is the most frequent in St Pauls, accounting for 19.1% of all households. In contrast, only 12 households (1.4%) fall into the $150,000 to $199,999 income bracket, making it the least populous group.
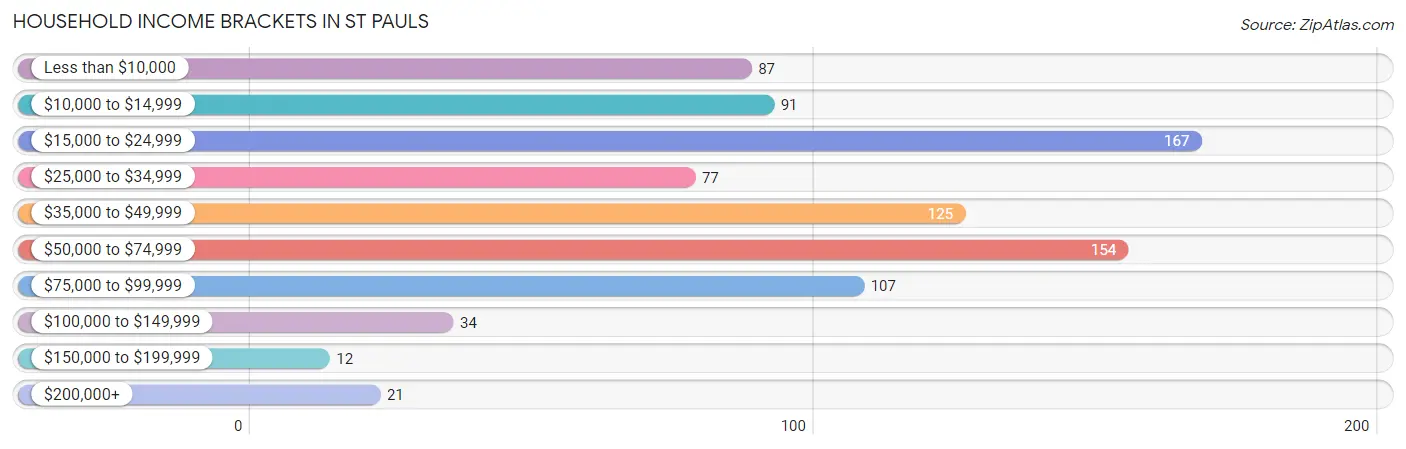
| Income Bracket | # Households | % Households |
| Less than $10,000 | 87 | 9.9% |
| $10,000 to $14,999 | 91 | 10.4% |
| $15,000 to $24,999 | 167 | 19.1% |
| $25,000 to $34,999 | 77 | 8.8% |
| $35,000 to $49,999 | 125 | 14.3% |
| $50,000 to $74,999 | 154 | 17.6% |
| $75,000 to $99,999 | 107 | 12.2% |
| $100,000 to $149,999 | 34 | 3.9% |
| $150,000 to $199,999 | 12 | 1.4% |
| $200,000+ | 21 | 2.4% |
Household Income by Householder Age in St Pauls
The median household income in St Pauls is $36,490, with the highest median household income of $39,018 found in the 25 to 44 years age bracket for the primary householder. A total of 223 households (25.5%) fall into this category. Meanwhile, the 15 to 24 years age bracket for the primary householder has the lowest median household income of $0, with 11 households (1.3%) in this group.
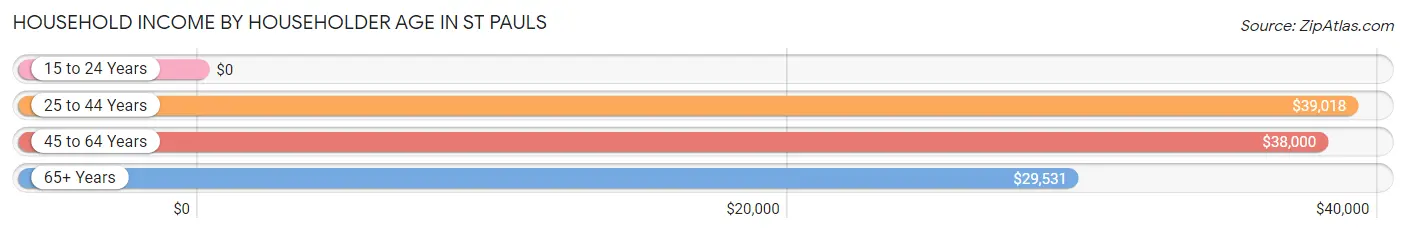
| Income Bracket | # Households | Median Income |
| 15 to 24 Years | 11 (1.3%) | $0 |
| 25 to 44 Years | 223 (25.5%) | $39,018 |
| 45 to 64 Years | 336 (38.4%) | $38,000 |
| 65+ Years | 305 (34.9%) | $29,531 |
| Total | 875 (100.0%) | $36,490 |
Poverty in St Pauls
Income Below Poverty by Sex and Age in St Pauls
With 34.6% poverty level for males and 34.3% for females among the residents of St Pauls, 6 to 11 year old males and under 5 year old females are the most vulnerable to poverty, with 57 males (69.5%) and 77 females (75.5%) in their respective age groups living below the poverty level.
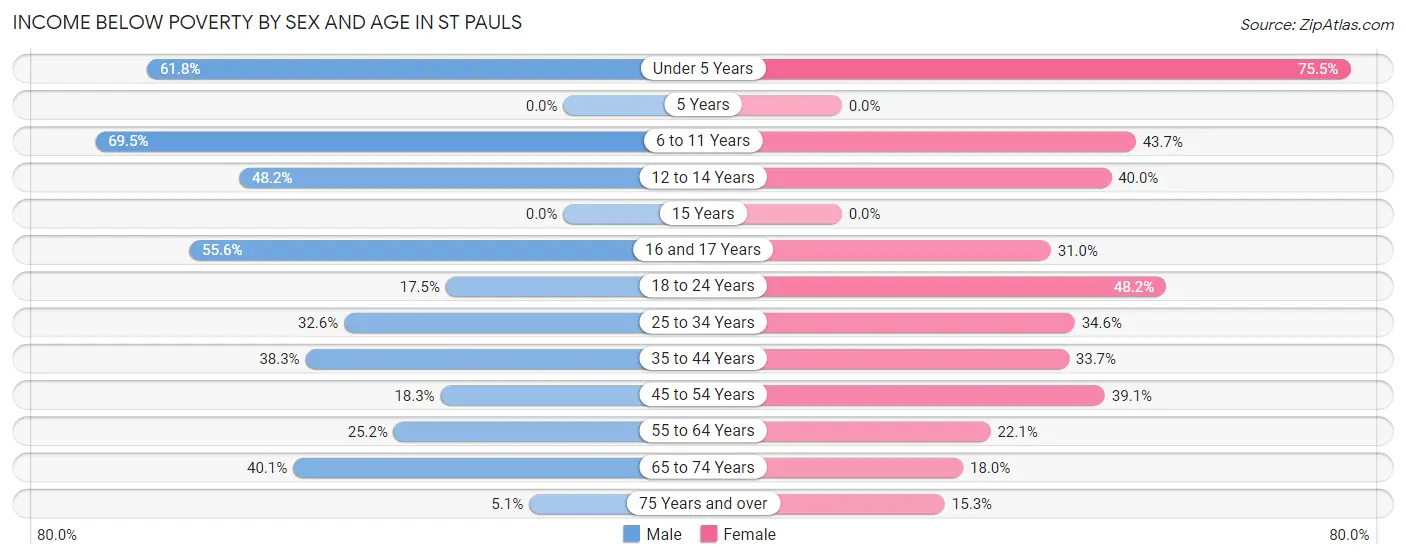
| Age Bracket | Male | Female |
| Under 5 Years | 68 (61.8%) | 77 (75.5%) |
| 5 Years | 0 (0.0%) | 0 (0.0%) |
| 6 to 11 Years | 57 (69.5%) | 55 (43.6%) |
| 12 to 14 Years | 13 (48.1%) | 32 (40.0%) |
| 15 Years | 0 (0.0%) | 0 (0.0%) |
| 16 and 17 Years | 15 (55.6%) | 9 (31.0%) |
| 18 to 24 Years | 11 (17.5%) | 26 (48.1%) |
| 25 to 34 Years | 28 (32.6%) | 46 (34.6%) |
| 35 to 44 Years | 54 (38.3%) | 29 (33.7%) |
| 45 to 54 Years | 25 (18.2%) | 59 (39.1%) |
| 55 to 64 Years | 35 (25.2%) | 34 (22.1%) |
| 65 to 74 Years | 57 (40.1%) | 29 (18.0%) |
| 75 Years and over | 5 (5.1%) | 15 (15.3%) |
| Total | 368 (34.6%) | 411 (34.3%) |
Income Above Poverty by Sex and Age in St Pauls
According to the poverty statistics in St Pauls, males aged 5 years and females aged 5 years are the age groups that are most secure financially, with 100.0% of males and 100.0% of females in these age groups living above the poverty line.
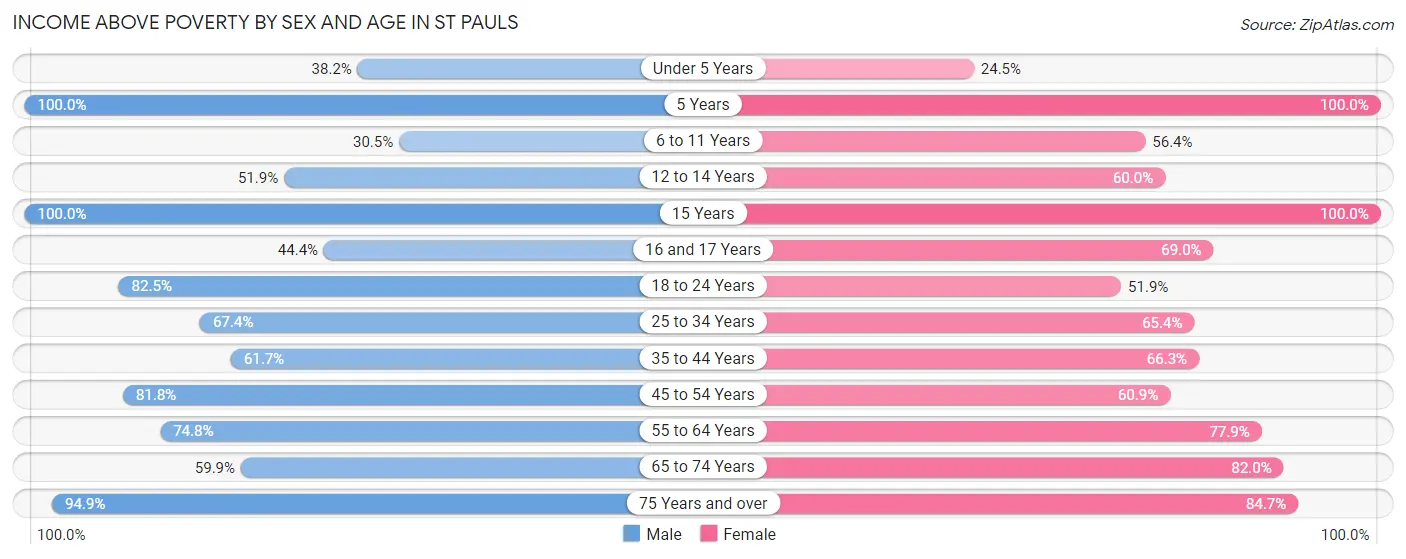
| Age Bracket | Male | Female |
| Under 5 Years | 42 (38.2%) | 25 (24.5%) |
| 5 Years | 5 (100.0%) | 15 (100.0%) |
| 6 to 11 Years | 25 (30.5%) | 71 (56.4%) |
| 12 to 14 Years | 14 (51.8%) | 48 (60.0%) |
| 15 Years | 7 (100.0%) | 8 (100.0%) |
| 16 and 17 Years | 12 (44.4%) | 20 (69.0%) |
| 18 to 24 Years | 52 (82.5%) | 28 (51.8%) |
| 25 to 34 Years | 58 (67.4%) | 87 (65.4%) |
| 35 to 44 Years | 87 (61.7%) | 57 (66.3%) |
| 45 to 54 Years | 112 (81.8%) | 92 (60.9%) |
| 55 to 64 Years | 104 (74.8%) | 120 (77.9%) |
| 65 to 74 Years | 85 (59.9%) | 132 (82.0%) |
| 75 Years and over | 93 (94.9%) | 83 (84.7%) |
| Total | 696 (65.4%) | 786 (65.7%) |
Income Below Poverty Among Married-Couple Families in St Pauls
The poverty statistics for married-couple families in St Pauls show that 13.2% or 40 of the total 303 families live below the poverty line. Families with 1 or 2 children have the highest poverty rate of 32.9%, comprising of 25 families. On the other hand, families with 5 or more children have the lowest poverty rate of 0.0%, which includes 0 families.
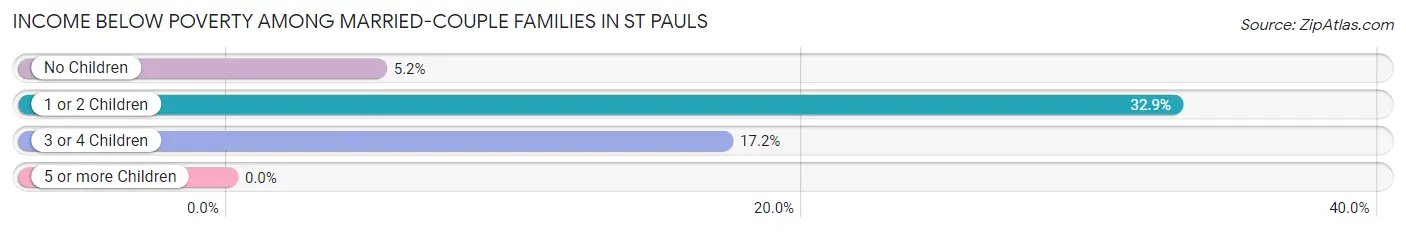
| Children | Above Poverty | Below Poverty |
| No Children | 183 (94.8%) | 10 (5.2%) |
| 1 or 2 Children | 51 (67.1%) | 25 (32.9%) |
| 3 or 4 Children | 24 (82.8%) | 5 (17.2%) |
| 5 or more Children | 5 (100.0%) | 0 (0.0%) |
| Total | 263 (86.8%) | 40 (13.2%) |
Income Below Poverty Among Single-Parent Households in St Pauls
According to the poverty data in St Pauls, 10.0% or 5 single-father households and 61.3% or 76 single-mother households are living below the poverty line. Among single-father households, those with 1 or 2 children have the highest poverty rate, with 5 households (25.0%) experiencing poverty. Likewise, among single-mother households, those with 5 or more children have the highest poverty rate, with 9 households (100.0%) falling below the poverty line.
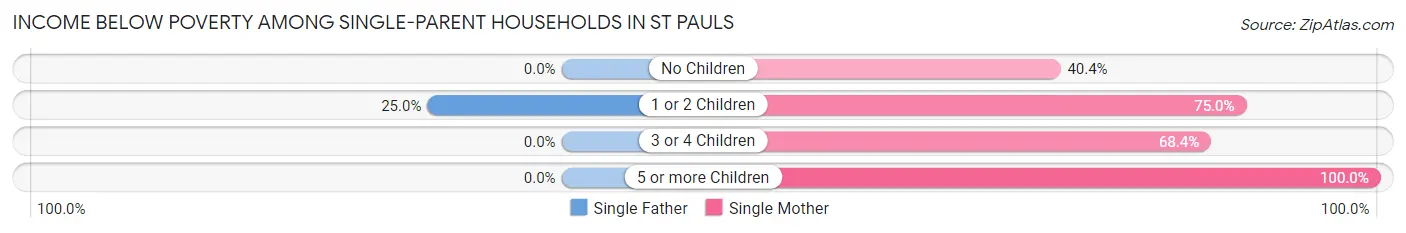
| Children | Single Father | Single Mother |
| No Children | 0 (0.0%) | 21 (40.4%) |
| 1 or 2 Children | 5 (25.0%) | 33 (75.0%) |
| 3 or 4 Children | 0 (0.0%) | 13 (68.4%) |
| 5 or more Children | 0 (0.0%) | 9 (100.0%) |
| Total | 5 (10.0%) | 76 (61.3%) |
Income Below Poverty Among Married-Couple vs Single-Parent Households in St Pauls
The poverty data for St Pauls shows that 40 of the married-couple family households (13.2%) and 81 of the single-parent households (46.6%) are living below the poverty level. Within the married-couple family households, those with 1 or 2 children have the highest poverty rate, with 25 households (32.9%) falling below the poverty line. Among the single-parent households, those with 5 or more children have the highest poverty rate, with 9 household (100.0%) living below poverty.
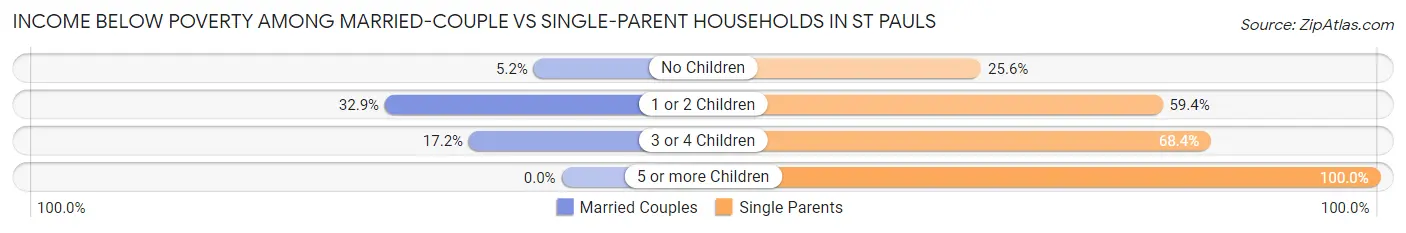
| Children | Married-Couple Families | Single-Parent Households |
| No Children | 10 (5.2%) | 21 (25.6%) |
| 1 or 2 Children | 25 (32.9%) | 38 (59.4%) |
| 3 or 4 Children | 5 (17.2%) | 13 (68.4%) |
| 5 or more Children | 0 (0.0%) | 9 (100.0%) |
| Total | 40 (13.2%) | 81 (46.6%) |
Race in St Pauls
The most populous races in St Pauls are White / Caucasian (949 | 42.0%), Hispanic or Latino (735 | 32.5%), and Black / African American (585 | 25.9%).
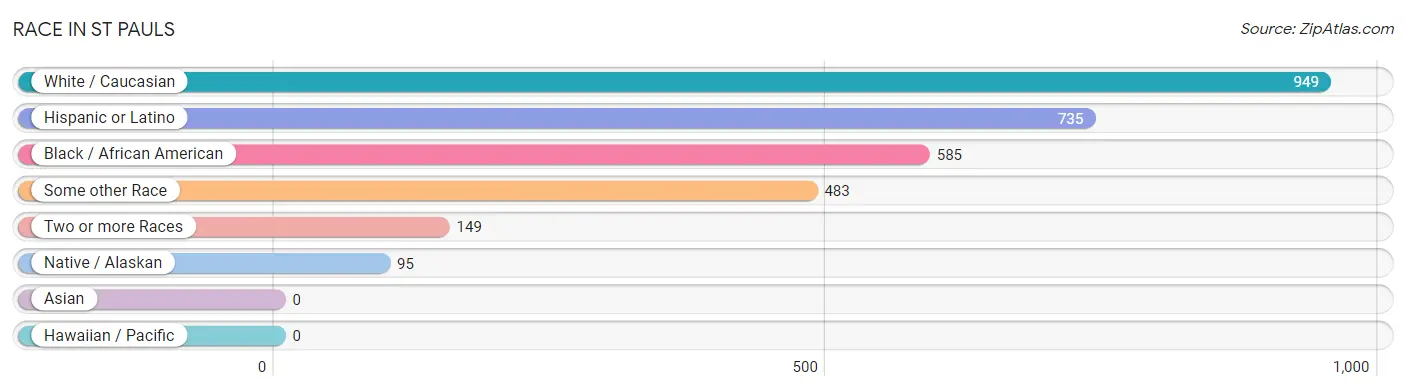
| Race | # Population | % Population |
| Asian | 0 | 0.0% |
| Black / African American | 585 | 25.9% |
| Hawaiian / Pacific | 0 | 0.0% |
| Hispanic or Latino | 735 | 32.5% |
| Native / Alaskan | 95 | 4.2% |
| White / Caucasian | 949 | 42.0% |
| Two or more Races | 149 | 6.6% |
| Some other Race | 483 | 21.4% |
| Total | 2,261 | 100.0% |
Ancestry in St Pauls
The most populous ancestries reported in St Pauls are Mexican (630 | 27.9%), English (157 | 6.9%), American (153 | 6.8%), Lumbee (103 | 4.6%), and Irish (78 | 3.5%), together accounting for 49.6% of all St Pauls residents.
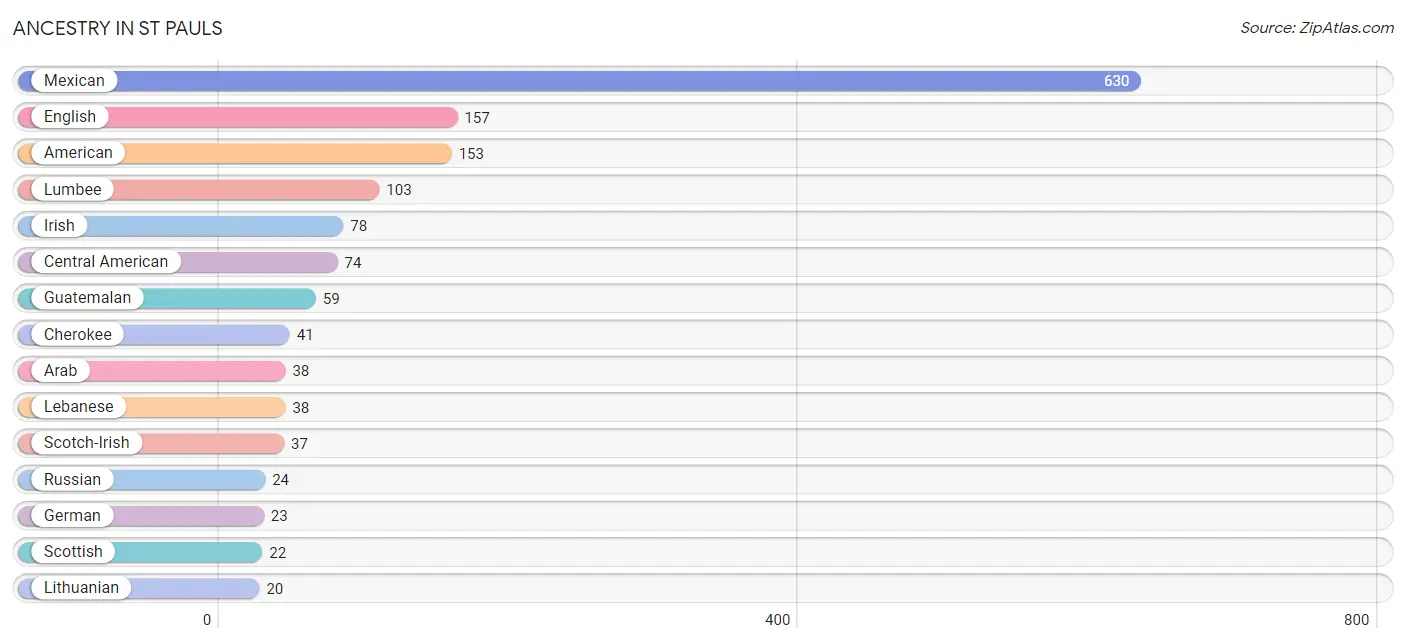
| Ancestry | # Population | % Population |
| American | 153 | 6.8% |
| Arab | 38 | 1.7% |
| Central American | 74 | 3.3% |
| Cherokee | 41 | 1.8% |
| Cuban | 16 | 0.7% |
| Dutch | 3 | 0.1% |
| English | 157 | 6.9% |
| European | 10 | 0.4% |
| French | 13 | 0.6% |
| French Canadian | 7 | 0.3% |
| German | 23 | 1.0% |
| Greek | 4 | 0.2% |
| Guatemalan | 59 | 2.6% |
| Irish | 78 | 3.5% |
| Italian | 14 | 0.6% |
| Lebanese | 38 | 1.7% |
| Lithuanian | 20 | 0.9% |
| Lumbee | 103 | 4.6% |
| Mexican | 630 | 27.9% |
| Puerto Rican | 8 | 0.4% |
| Russian | 24 | 1.1% |
| Salvadoran | 15 | 0.7% |
| Scotch-Irish | 37 | 1.6% |
| Scottish | 22 | 1.0% |
| Swedish | 4 | 0.2% | View All 25 Rows |
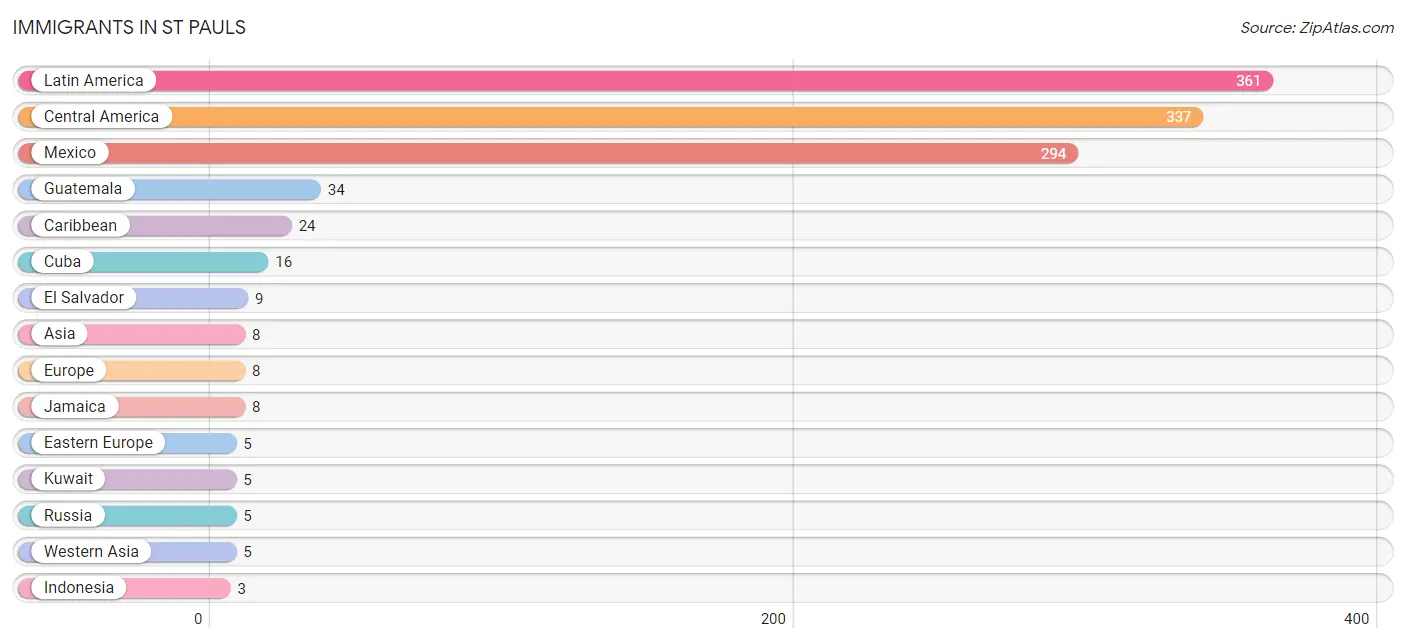
Immigrants in St Pauls
The most numerous immigrant groups reported in St Pauls came from Latin America (361 | 16.0%), Central America (337 | 14.9%), Mexico (294 | 13.0%), Guatemala (34 | 1.5%), and Caribbean (24 | 1.1%), together accounting for 46.4% of all St Pauls residents.
| Immigration Origin | # Population | % Population |
| Asia | 8 | 0.4% |
| Caribbean | 24 | 1.1% |
| Central America | 337 | 14.9% |
| Cuba | 16 | 0.7% |
| Eastern Europe | 5 | 0.2% |
| El Salvador | 9 | 0.4% |
| Europe | 8 | 0.4% |
| Guatemala | 34 | 1.5% |
| Indonesia | 3 | 0.1% |
| Ireland | 3 | 0.1% |
| Jamaica | 8 | 0.4% |
| Kuwait | 5 | 0.2% |
| Latin America | 361 | 16.0% |
| Mexico | 294 | 13.0% |
| Northern Europe | 3 | 0.1% |
| Russia | 5 | 0.2% |
| South Eastern Asia | 3 | 0.1% |
| Western Asia | 5 | 0.2% | View All 18 Rows |
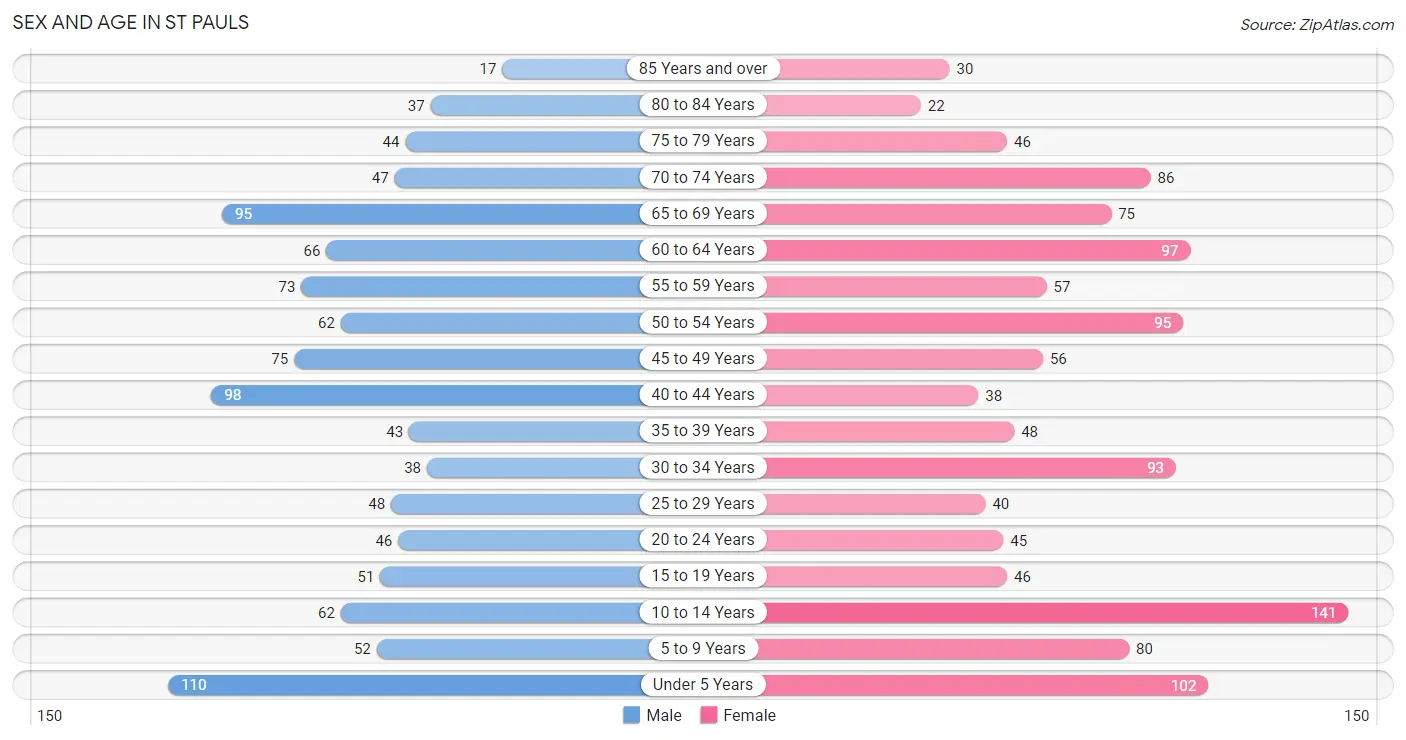
Sex and Age in St Pauls
Sex and Age in St Pauls
The most populous age groups in St Pauls are Under 5 Years (110 | 10.3%) for men and 10 to 14 Years (141 | 11.8%) for women.
| Age Bracket | Male | Female |
| Under 5 Years | 110 (10.3%) | 102 (8.5%) |
| 5 to 9 Years | 52 (4.9%) | 80 (6.7%) |
| 10 to 14 Years | 62 (5.8%) | 141 (11.8%) |
| 15 to 19 Years | 51 (4.8%) | 46 (3.8%) |
| 20 to 24 Years | 46 (4.3%) | 45 (3.8%) |
| 25 to 29 Years | 48 (4.5%) | 40 (3.3%) |
| 30 to 34 Years | 38 (3.6%) | 93 (7.8%) |
| 35 to 39 Years | 43 (4.0%) | 48 (4.0%) |
| 40 to 44 Years | 98 (9.2%) | 38 (3.2%) |
| 45 to 49 Years | 75 (7.0%) | 56 (4.7%) |
| 50 to 54 Years | 62 (5.8%) | 95 (7.9%) |
| 55 to 59 Years | 73 (6.9%) | 57 (4.8%) |
| 60 to 64 Years | 66 (6.2%) | 97 (8.1%) |
| 65 to 69 Years | 95 (8.9%) | 75 (6.3%) |
| 70 to 74 Years | 47 (4.4%) | 86 (7.2%) |
| 75 to 79 Years | 44 (4.1%) | 46 (3.8%) |
| 80 to 84 Years | 37 (3.5%) | 22 (1.8%) |
| 85 Years and over | 17 (1.6%) | 30 (2.5%) |
| Total | 1,064 (100.0%) | 1,197 (100.0%) |
Families and Households in St Pauls
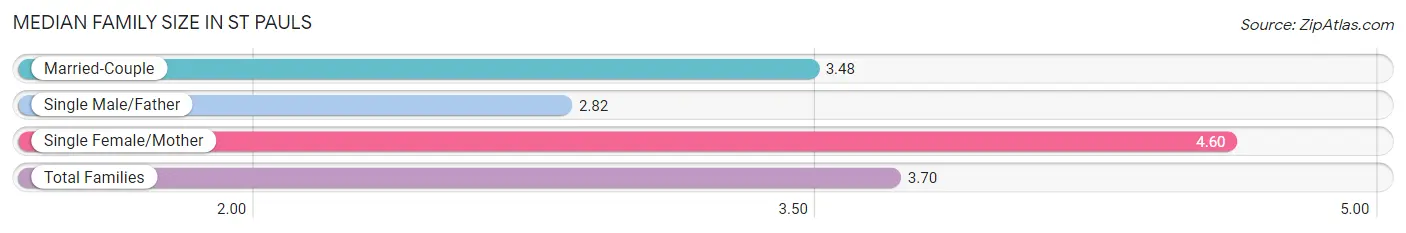
Median Family Size in St Pauls
The median family size in St Pauls is 3.70 persons per family, with single female/mother families (124 | 26.0%) accounting for the largest median family size of 4.6 persons per family. On the other hand, single male/father families (50 | 10.5%) represent the smallest median family size with 2.82 persons per family.
| Family Type | # Families | Family Size |
| Married-Couple | 303 (63.5%) | 3.48 |
| Single Male/Father | 50 (10.5%) | 2.82 |
| Single Female/Mother | 124 (26.0%) | 4.60 |
| Total Families | 477 (100.0%) | 3.70 |
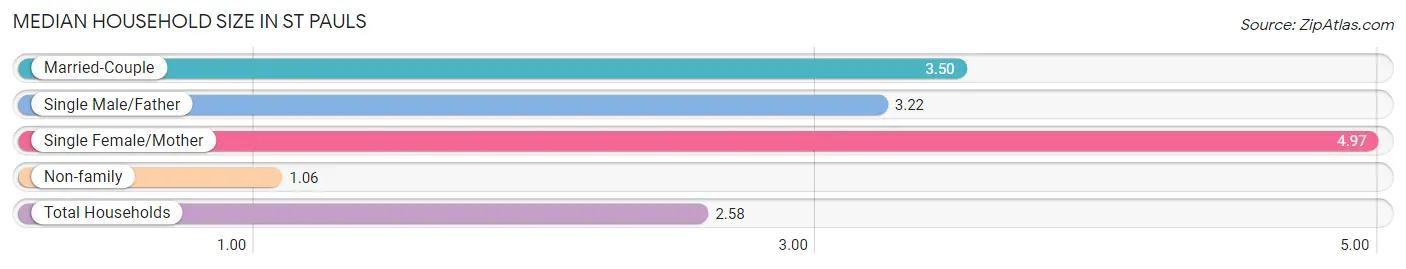
Median Household Size in St Pauls
The median household size in St Pauls is 2.58 persons per household, with single female/mother households (124 | 14.2%) accounting for the largest median household size of 4.97 persons per household. non-family households (398 | 45.5%) represent the smallest median household size with 1.06 persons per household.
| Household Type | # Households | Household Size |
| Married-Couple | 303 (34.6%) | 3.50 |
| Single Male/Father | 50 (5.7%) | 3.22 |
| Single Female/Mother | 124 (14.2%) | 4.97 |
| Non-family | 398 (45.5%) | 1.06 |
| Total Households | 875 (100.0%) | 2.58 |
Household Size by Marriage Status in St Pauls
Out of a total of 875 households in St Pauls, 477 (54.5%) are family households, while 398 (45.5%) are nonfamily households. The most numerous type of family households are 2-person households, comprising 232, and the most common type of nonfamily households are 1-person households, comprising 384.
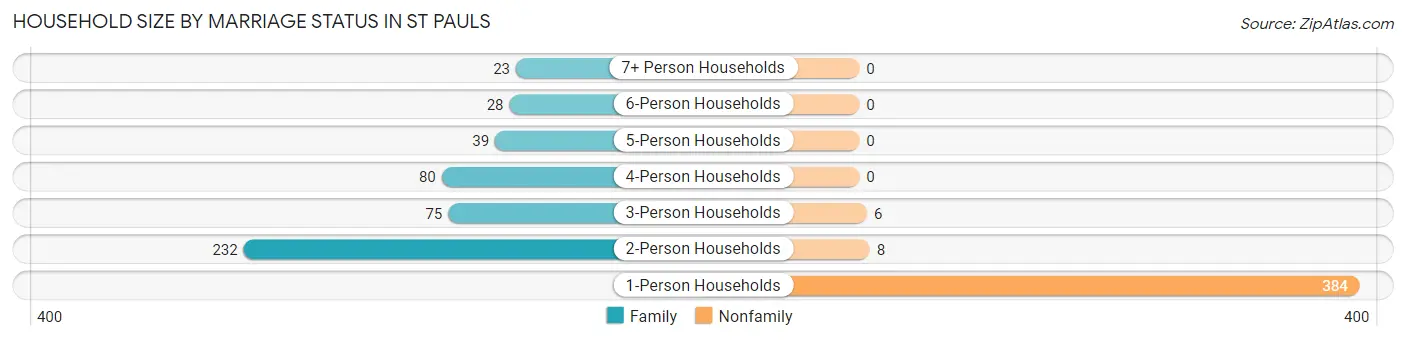
| Household Size | Family Households | Nonfamily Households |
| 1-Person Households | - | 384 (43.9%) |
| 2-Person Households | 232 (26.5%) | 8 (0.9%) |
| 3-Person Households | 75 (8.6%) | 6 (0.7%) |
| 4-Person Households | 80 (9.1%) | 0 (0.0%) |
| 5-Person Households | 39 (4.5%) | 0 (0.0%) |
| 6-Person Households | 28 (3.2%) | 0 (0.0%) |
| 7+ Person Households | 23 (2.6%) | 0 (0.0%) |
| Total | 477 (54.5%) | 398 (45.5%) |
Female Fertility in St Pauls
Fertility by Age in St Pauls
Average fertility rate in St Pauls is 30.0 births per 1,000 women. Women in the age bracket of 20 to 34 years have the highest fertility rate with 56.0 births per 1,000 women. Women in the age bracket of 20 to 34 years acount for 83.3% of all women with births.
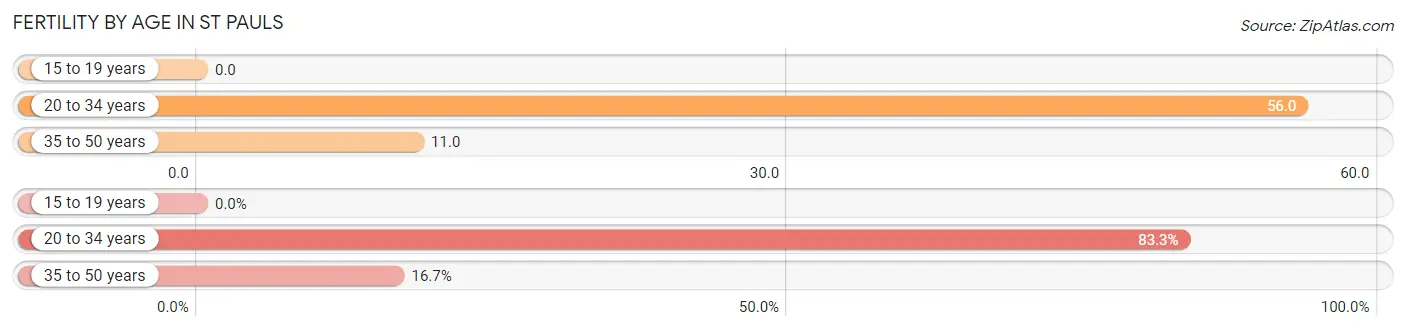
| Age Bracket | Women with Births | Births / 1,000 Women |
| 15 to 19 years | 0 (0.0%) | 0.0 |
| 20 to 34 years | 10 (83.3%) | 56.0 |
| 35 to 50 years | 2 (16.7%) | 11.0 |
| Total | 12 (100.0%) | 30.0 |
Fertility by Age by Marriage Status in St Pauls
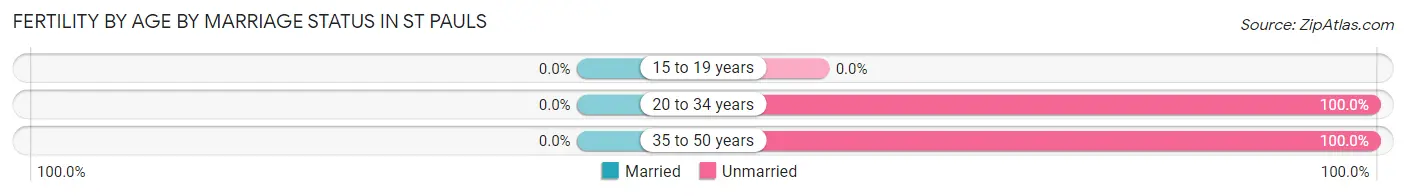
| Age Bracket | Married | Unmarried |
| 15 to 19 years | 0 (0.0%) | 0 (0.0%) |
| 20 to 34 years | 0 (0.0%) | 10 (100.0%) |
| 35 to 50 years | 0 (0.0%) | 2 (100.0%) |
| Total | 0 (0.0%) | 12 (100.0%) |
Fertility by Education in St Pauls
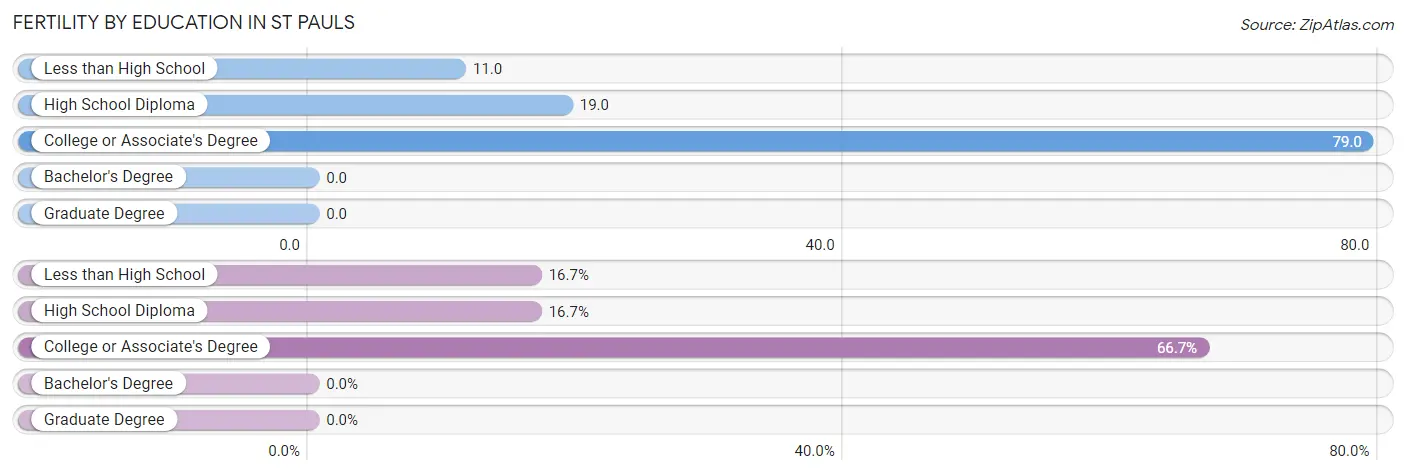
| Educational Attainment | Women with Births | Births / 1,000 Women |
| Less than High School | 2 (16.7%) | 11.0 |
| High School Diploma | 2 (16.7%) | 19.0 |
| College or Associate's Degree | 8 (66.7%) | 79.0 |
| Bachelor's Degree | 0 (0.0%) | 0.0 |
| Graduate Degree | 0 (0.0%) | 0.0 |
| Total | 12 (100.0%) | 30.0 |
Fertility by Education by Marriage Status in St Pauls
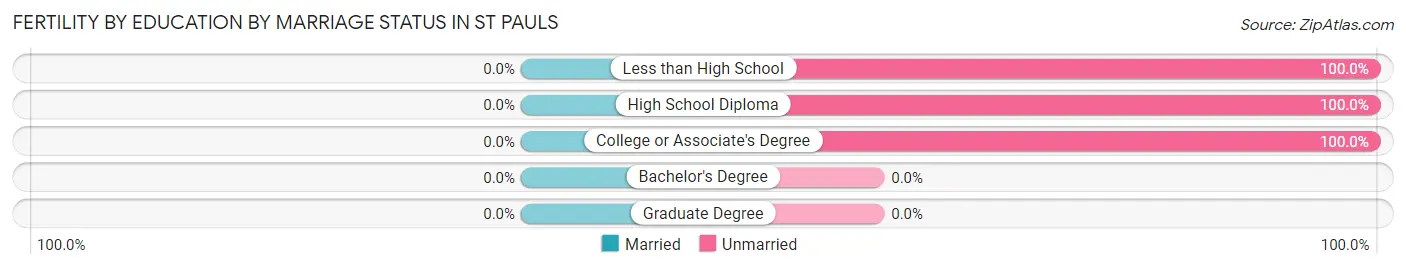
| Educational Attainment | Married | Unmarried |
| Less than High School | 0 (0.0%) | 2 (100.0%) |
| High School Diploma | 0 (0.0%) | 2 (100.0%) |
| College or Associate's Degree | 0 (0.0%) | 8 (100.0%) |
| Bachelor's Degree | 0 (0.0%) | 0 (0.0%) |
| Graduate Degree | 0 (0.0%) | 0 (0.0%) |
| Total | 0 (0.0%) | 12 (100.0%) |
Employment Characteristics in St Pauls
Employment by Class of Employer in St Pauls
Among the 718 employed individuals in St Pauls, private company employees (516 | 71.9%), self-employed (not incorporated) (68 | 9.5%), and local government employees (53 | 7.4%) make up the most common classes of employment.
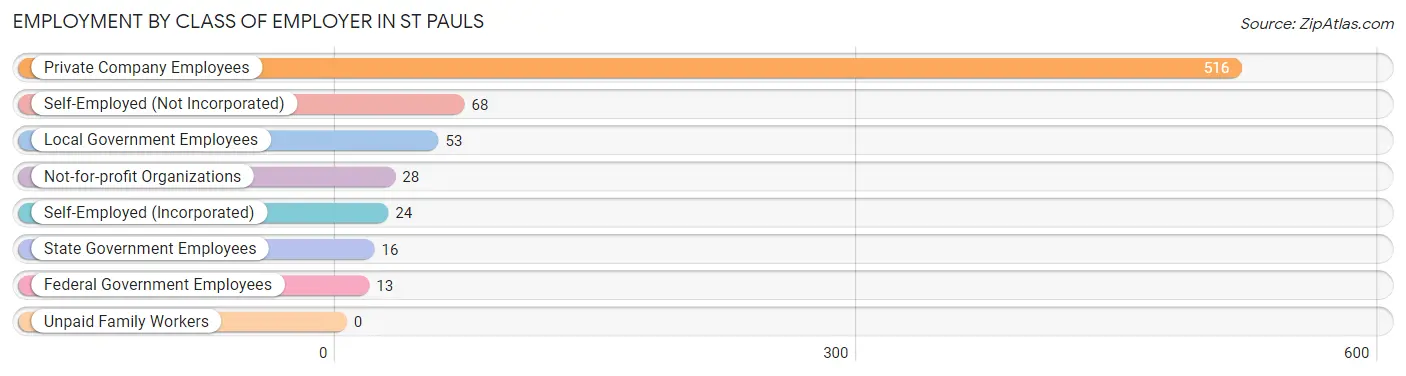
| Employer Class | # Employees | % Employees |
| Private Company Employees | 516 | 71.9% |
| Self-Employed (Incorporated) | 24 | 3.3% |
| Self-Employed (Not Incorporated) | 68 | 9.5% |
| Not-for-profit Organizations | 28 | 3.9% |
| Local Government Employees | 53 | 7.4% |
| State Government Employees | 16 | 2.2% |
| Federal Government Employees | 13 | 1.8% |
| Unpaid Family Workers | 0 | 0.0% |
| Total | 718 | 100.0% |
Employment Status by Age in St Pauls
According to the labor force statistics for St Pauls, out of the total population over 16 years of age (1,699), 48.4% or 822 individuals are in the labor force, with 9.9% or 81 of them unemployed. The age group with the highest labor force participation rate is 20 to 24 years, with 76.9% or 70 individuals in the labor force. Within the labor force, the 25 to 29 years age range has the highest percentage of unemployed individuals, with 47.2% or 25 of them being unemployed.
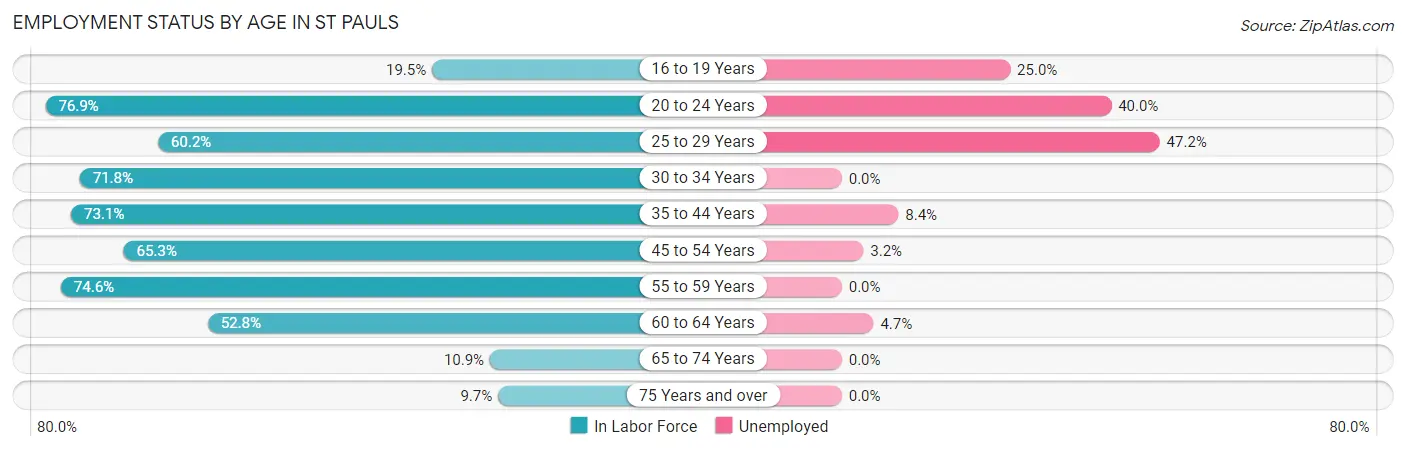
| Age Bracket | In Labor Force | Unemployed |
| 16 to 19 Years | 16 (19.5%) | 4 (25.0%) |
| 20 to 24 Years | 70 (76.9%) | 28 (40.0%) |
| 25 to 29 Years | 53 (60.2%) | 25 (47.2%) |
| 30 to 34 Years | 94 (71.8%) | 0 (0.0%) |
| 35 to 44 Years | 166 (73.1%) | 14 (8.4%) |
| 45 to 54 Years | 188 (65.3%) | 6 (3.2%) |
| 55 to 59 Years | 97 (74.6%) | 0 (0.0%) |
| 60 to 64 Years | 86 (52.8%) | 4 (4.7%) |
| 65 to 74 Years | 33 (10.9%) | 0 (0.0%) |
| 75 Years and over | 19 (9.7%) | 0 (0.0%) |
| Total | 822 (48.4%) | 81 (9.9%) |
Employment Status by Educational Attainment in St Pauls
According to labor force statistics for St Pauls, 66.6% of individuals (684) out of the total population between 25 and 64 years of age (1,027) are in the labor force, with 7.2% or 49 of them being unemployed. The group with the highest labor force participation rate are those with the educational attainment of college / associate degree, with 82.9% or 180 individuals in the labor force. Within the labor force, individuals with high school diploma education have the highest percentage of unemployment, with 15.4% or 40 of them being unemployed.
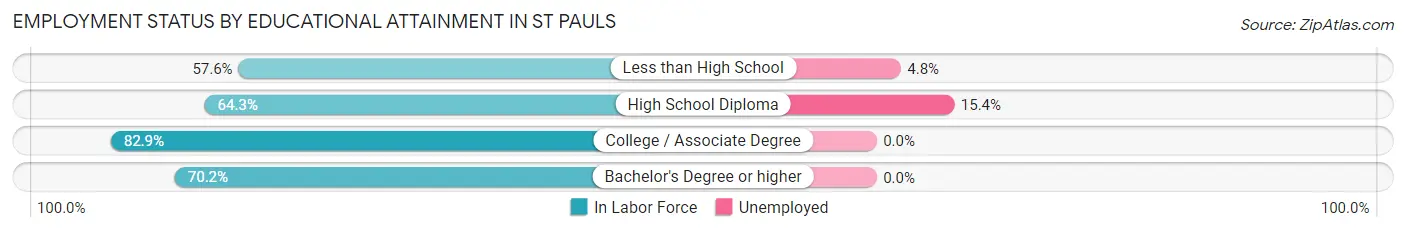
| Educational Attainment | In Labor Force | Unemployed |
| Less than High School | 186 (57.6%) | 16 (4.8%) |
| High School Diploma | 259 (64.3%) | 62 (15.4%) |
| College / Associate Degree | 180 (82.9%) | 0 (0.0%) |
| Bachelor's Degree or higher | 59 (70.2%) | 0 (0.0%) |
| Total | 684 (66.6%) | 74 (7.2%) |
Employment Occupations by Sex in St Pauls
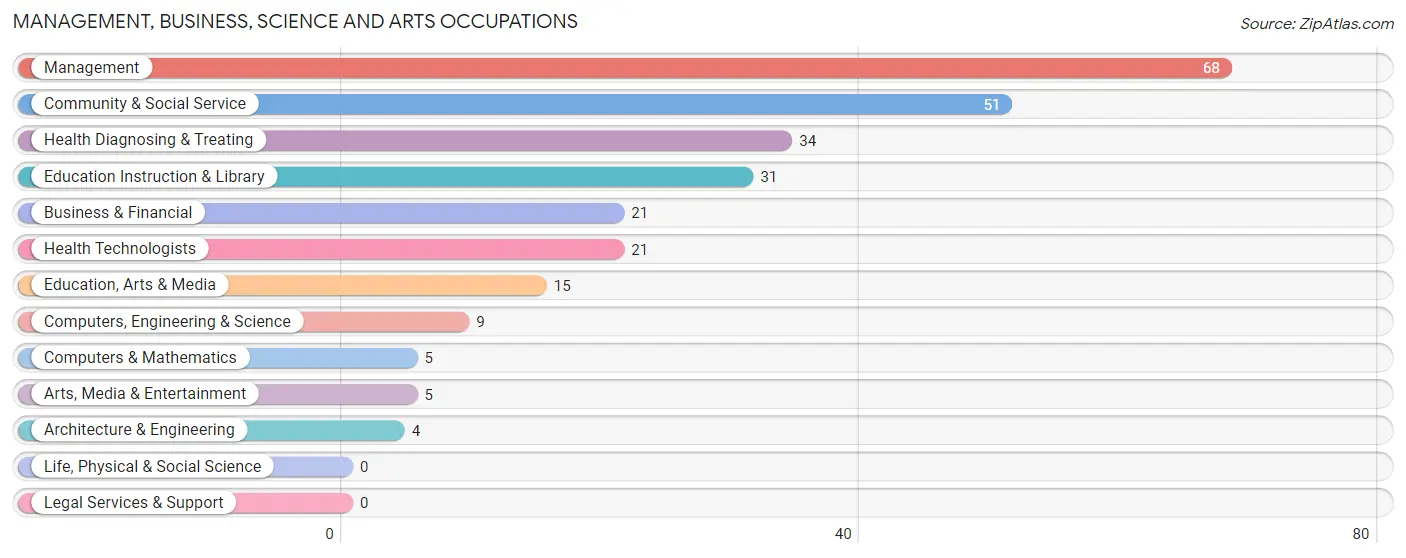
Management, Business, Science and Arts Occupations
The most common Management, Business, Science and Arts occupations in St Pauls are Management (68 | 9.2%), Community & Social Service (51 | 6.9%), Health Diagnosing & Treating (34 | 4.6%), Education Instruction & Library (31 | 4.2%), and Business & Financial (21 | 2.8%).
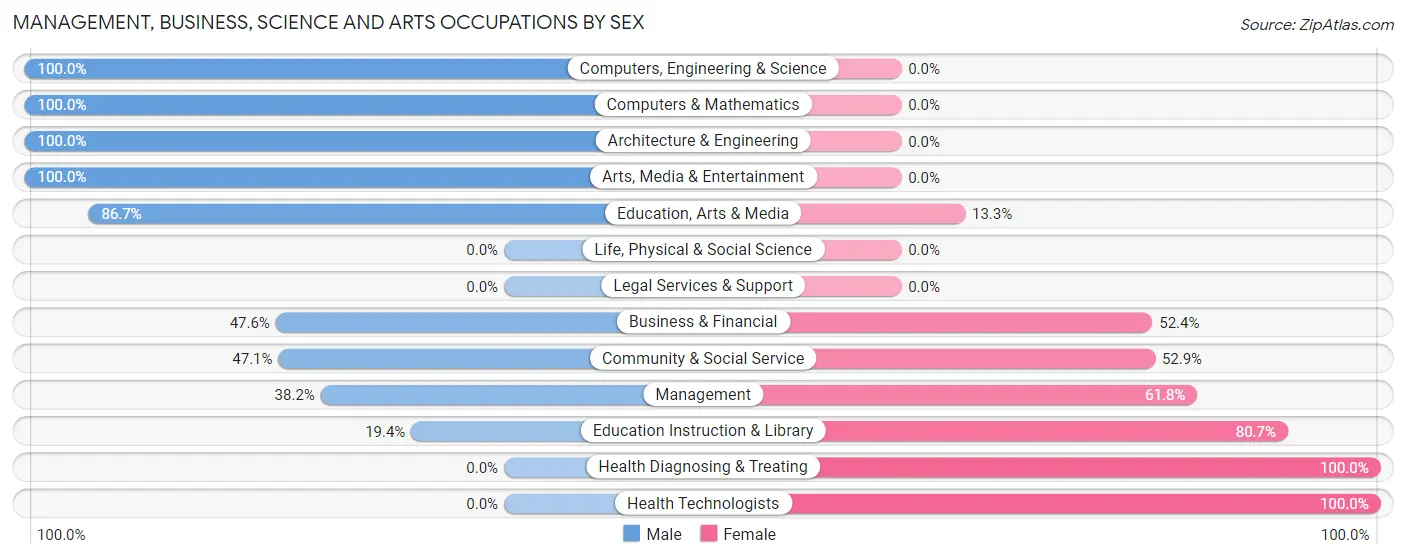
Management, Business, Science and Arts Occupations by Sex
Within the Management, Business, Science and Arts occupations in St Pauls, the most male-oriented occupations are Computers, Engineering & Science (100.0%), Computers & Mathematics (100.0%), and Architecture & Engineering (100.0%), while the most female-oriented occupations are Health Diagnosing & Treating (100.0%), Health Technologists (100.0%), and Education Instruction & Library (80.6%).
| Occupation | Male | Female |
| Management | 26 (38.2%) | 42 (61.8%) |
| Business & Financial | 10 (47.6%) | 11 (52.4%) |
| Computers, Engineering & Science | 9 (100.0%) | 0 (0.0%) |
| Computers & Mathematics | 5 (100.0%) | 0 (0.0%) |
| Architecture & Engineering | 4 (100.0%) | 0 (0.0%) |
| Life, Physical & Social Science | 0 (0.0%) | 0 (0.0%) |
| Community & Social Service | 24 (47.1%) | 27 (52.9%) |
| Education, Arts & Media | 13 (86.7%) | 2 (13.3%) |
| Legal Services & Support | 0 (0.0%) | 0 (0.0%) |
| Education Instruction & Library | 6 (19.4%) | 25 (80.6%) |
| Arts, Media & Entertainment | 5 (100.0%) | 0 (0.0%) |
| Health Diagnosing & Treating | 0 (0.0%) | 34 (100.0%) |
| Health Technologists | 0 (0.0%) | 21 (100.0%) |
| Total (Category) | 69 (37.7%) | 114 (62.3%) |
| Total (Overall) | 427 (57.6%) | 314 (42.4%) |
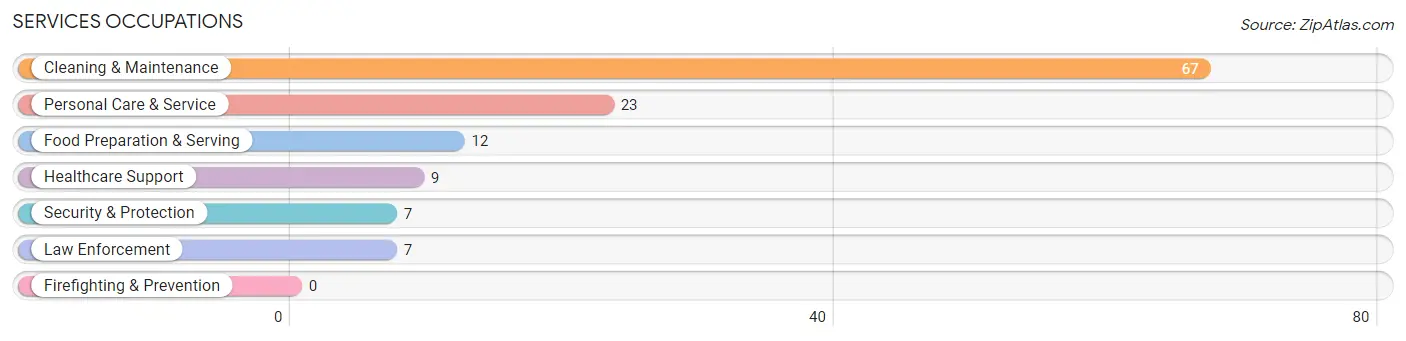
Services Occupations
The most common Services occupations in St Pauls are Cleaning & Maintenance (67 | 9.0%), Personal Care & Service (23 | 3.1%), Food Preparation & Serving (12 | 1.6%), Healthcare Support (9 | 1.2%), and Security & Protection (7 | 0.9%).
Services Occupations by Sex

| Occupation | Male | Female |
| Healthcare Support | 0 (0.0%) | 9 (100.0%) |
| Security & Protection | 0 (0.0%) | 7 (100.0%) |
| Firefighting & Prevention | 0 (0.0%) | 0 (0.0%) |
| Law Enforcement | 0 (0.0%) | 7 (100.0%) |
| Food Preparation & Serving | 0 (0.0%) | 12 (100.0%) |
| Cleaning & Maintenance | 50 (74.6%) | 17 (25.4%) |
| Personal Care & Service | 0 (0.0%) | 23 (100.0%) |
| Total (Category) | 50 (42.4%) | 68 (57.6%) |
| Total (Overall) | 427 (57.6%) | 314 (42.4%) |
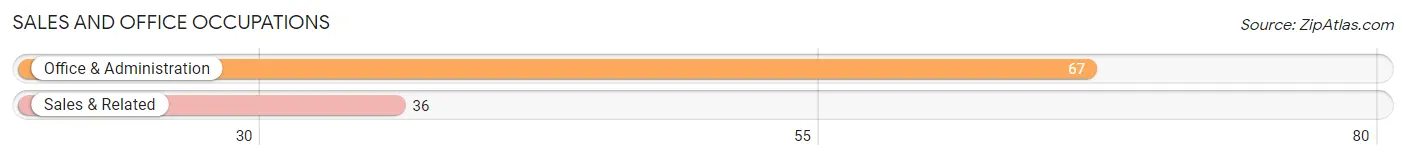
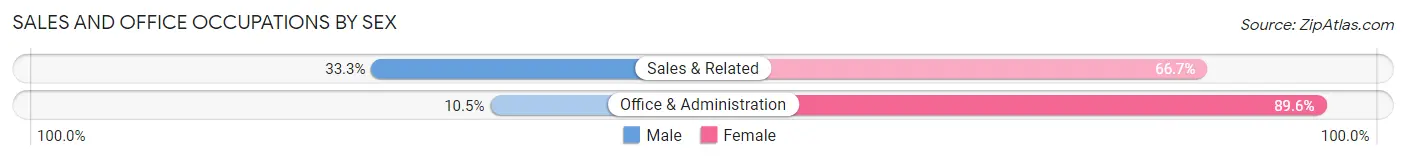
Sales and Office Occupations
The most common Sales and Office occupations in St Pauls are Office & Administration (67 | 9.0%), and Sales & Related (36 | 4.9%).
Sales and Office Occupations by Sex
| Occupation | Male | Female |
| Sales & Related | 12 (33.3%) | 24 (66.7%) |
| Office & Administration | 7 (10.4%) | 60 (89.5%) |
| Total (Category) | 19 (18.4%) | 84 (81.6%) |
| Total (Overall) | 427 (57.6%) | 314 (42.4%) |
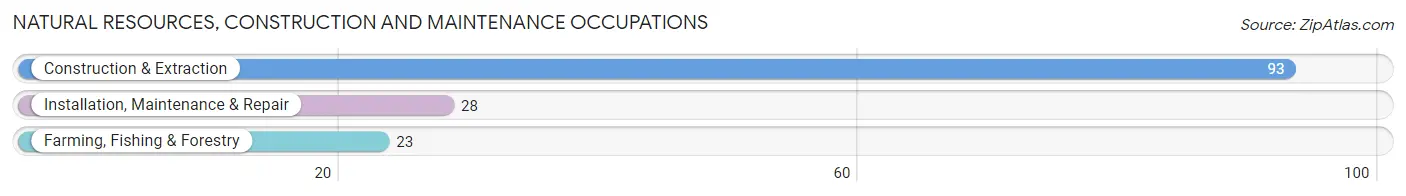
Natural Resources, Construction and Maintenance Occupations
The most common Natural Resources, Construction and Maintenance occupations in St Pauls are Construction & Extraction (93 | 12.6%), Installation, Maintenance & Repair (28 | 3.8%), and Farming, Fishing & Forestry (23 | 3.1%).
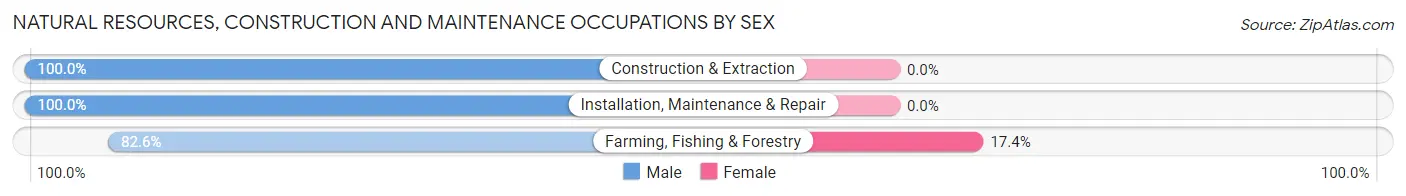
Natural Resources, Construction and Maintenance Occupations by Sex
| Occupation | Male | Female |
| Farming, Fishing & Forestry | 19 (82.6%) | 4 (17.4%) |
| Construction & Extraction | 93 (100.0%) | 0 (0.0%) |
| Installation, Maintenance & Repair | 28 (100.0%) | 0 (0.0%) |
| Total (Category) | 140 (97.2%) | 4 (2.8%) |
| Total (Overall) | 427 (57.6%) | 314 (42.4%) |
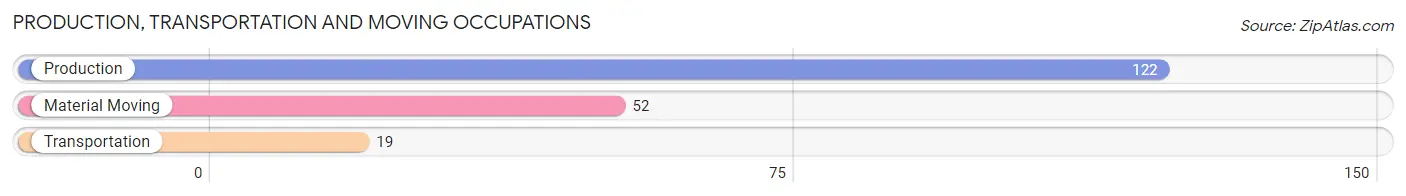
Production, Transportation and Moving Occupations
The most common Production, Transportation and Moving occupations in St Pauls are Production (122 | 16.5%), Material Moving (52 | 7.0%), and Transportation (19 | 2.6%).
Production, Transportation and Moving Occupations by Sex
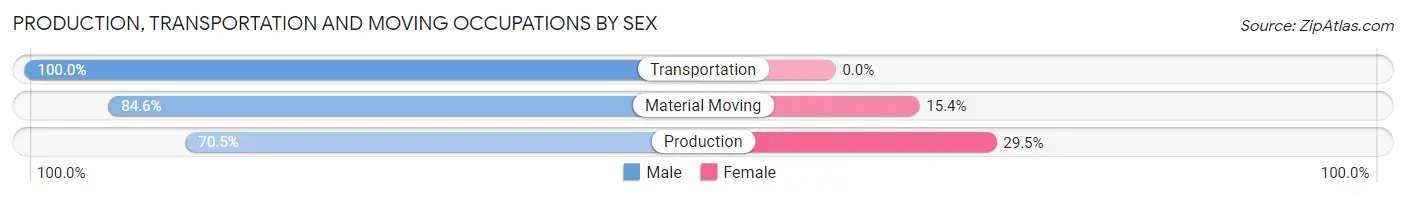
| Occupation | Male | Female |
| Production | 86 (70.5%) | 36 (29.5%) |
| Transportation | 19 (100.0%) | 0 (0.0%) |
| Material Moving | 44 (84.6%) | 8 (15.4%) |
| Total (Category) | 149 (77.2%) | 44 (22.8%) |
| Total (Overall) | 427 (57.6%) | 314 (42.4%) |
Employment Industries by Sex in St Pauls
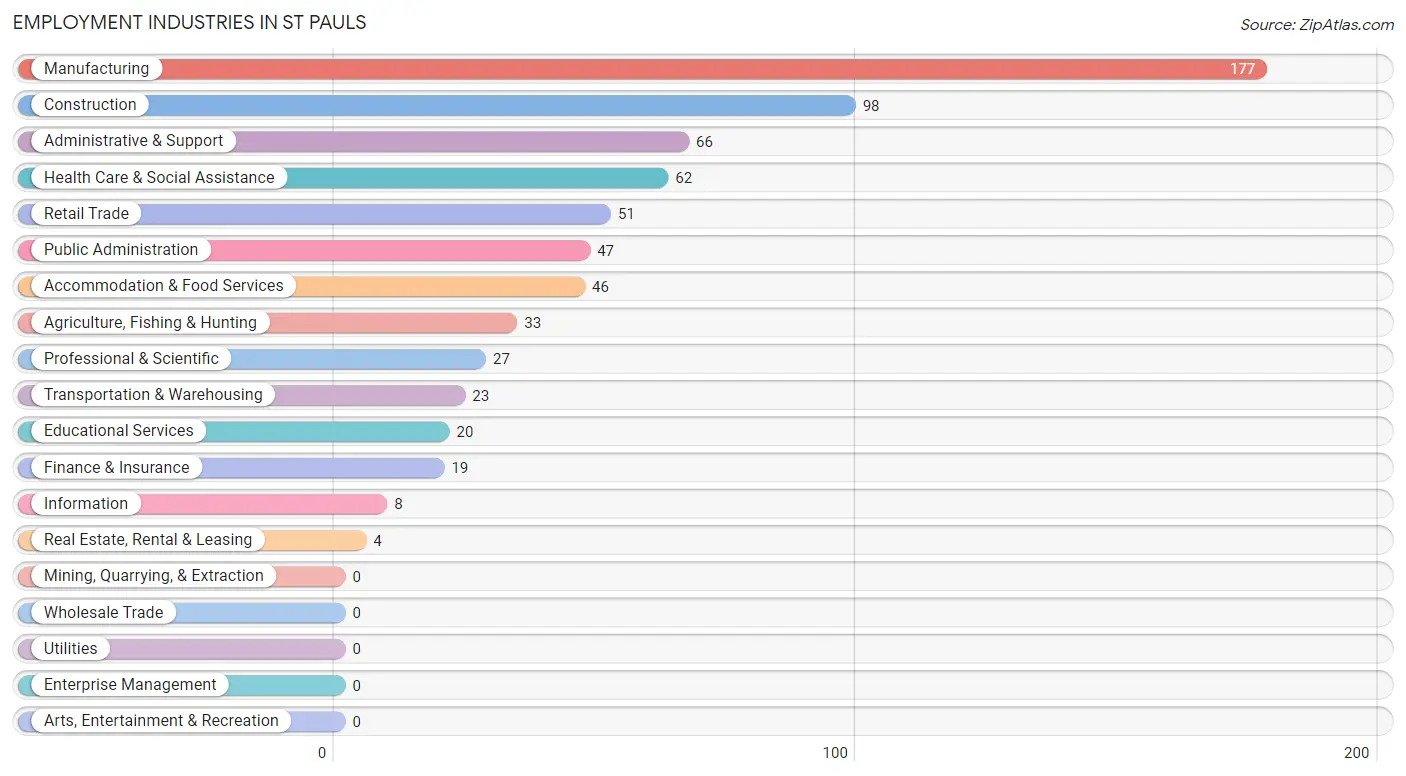
Employment Industries in St Pauls
The major employment industries in St Pauls include Manufacturing (177 | 23.9%), Construction (98 | 13.2%), Administrative & Support (66 | 8.9%), Health Care & Social Assistance (62 | 8.4%), and Retail Trade (51 | 6.9%).
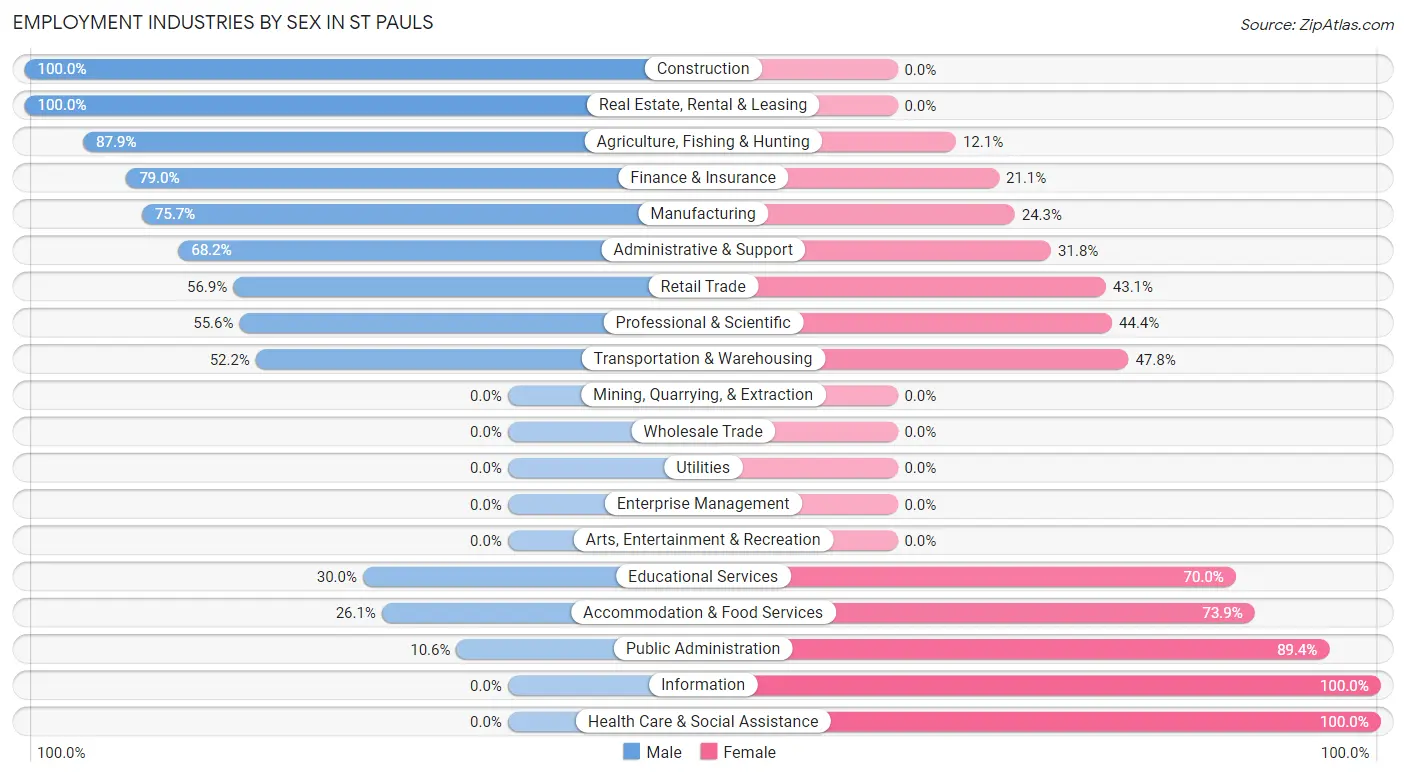
Employment Industries by Sex in St Pauls
The St Pauls industries that see more men than women are Construction (100.0%), Real Estate, Rental & Leasing (100.0%), and Agriculture, Fishing & Hunting (87.9%), whereas the industries that tend to have a higher number of women are Information (100.0%), Health Care & Social Assistance (100.0%), and Public Administration (89.4%).
| Industry | Male | Female |
| Agriculture, Fishing & Hunting | 29 (87.9%) | 4 (12.1%) |
| Mining, Quarrying, & Extraction | 0 (0.0%) | 0 (0.0%) |
| Construction | 98 (100.0%) | 0 (0.0%) |
| Manufacturing | 134 (75.7%) | 43 (24.3%) |
| Wholesale Trade | 0 (0.0%) | 0 (0.0%) |
| Retail Trade | 29 (56.9%) | 22 (43.1%) |
| Transportation & Warehousing | 12 (52.2%) | 11 (47.8%) |
| Utilities | 0 (0.0%) | 0 (0.0%) |
| Information | 0 (0.0%) | 8 (100.0%) |
| Finance & Insurance | 15 (78.9%) | 4 (21.0%) |
| Real Estate, Rental & Leasing | 4 (100.0%) | 0 (0.0%) |
| Professional & Scientific | 15 (55.6%) | 12 (44.4%) |
| Enterprise Management | 0 (0.0%) | 0 (0.0%) |
| Administrative & Support | 45 (68.2%) | 21 (31.8%) |
| Educational Services | 6 (30.0%) | 14 (70.0%) |
| Health Care & Social Assistance | 0 (0.0%) | 62 (100.0%) |
| Arts, Entertainment & Recreation | 0 (0.0%) | 0 (0.0%) |
| Accommodation & Food Services | 12 (26.1%) | 34 (73.9%) |
| Public Administration | 5 (10.6%) | 42 (89.4%) |
| Total | 427 (57.6%) | 314 (42.4%) |
Education in St Pauls
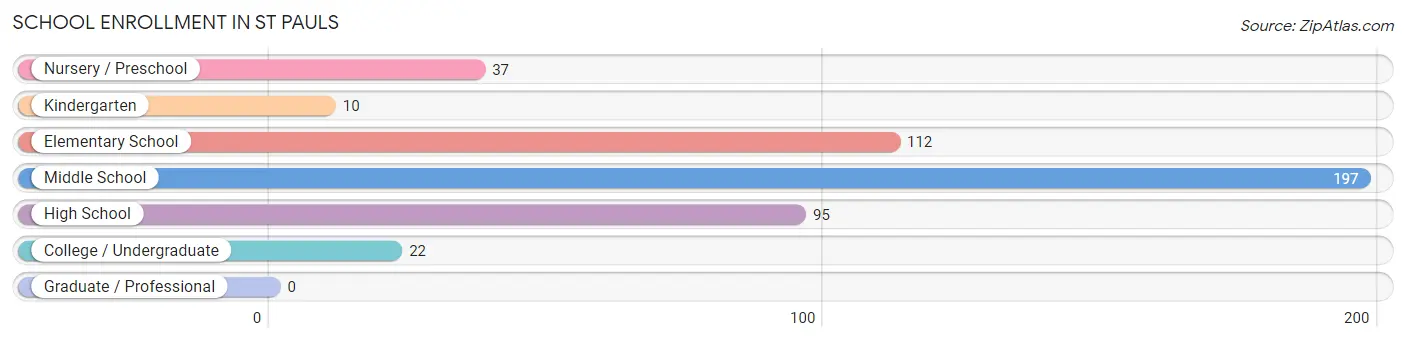
School Enrollment in St Pauls
The most common levels of schooling among the 473 students in St Pauls are middle school (197 | 41.6%), elementary school (112 | 23.7%), and high school (95 | 20.1%).
| School Level | # Students | % Students |
| Nursery / Preschool | 37 | 7.8% |
| Kindergarten | 10 | 2.1% |
| Elementary School | 112 | 23.7% |
| Middle School | 197 | 41.6% |
| High School | 95 | 20.1% |
| College / Undergraduate | 22 | 4.6% |
| Graduate / Professional | 0 | 0.0% |
| Total | 473 | 100.0% |
School Enrollment by Age by Funding Source in St Pauls
Out of a total of 473 students who are enrolled in schools in St Pauls, 56 (11.8%) attend a private institution, while the remaining 417 (88.2%) are enrolled in public schools. The age group of 35 years and over has the highest likelihood of being enrolled in private schools, with 25 (100.0% in the age bracket) enrolled. Conversely, the age group of 15 to 17 year olds has the lowest likelihood of being enrolled in a private school, with 71 (100.0% in the age bracket) attending a public institution.
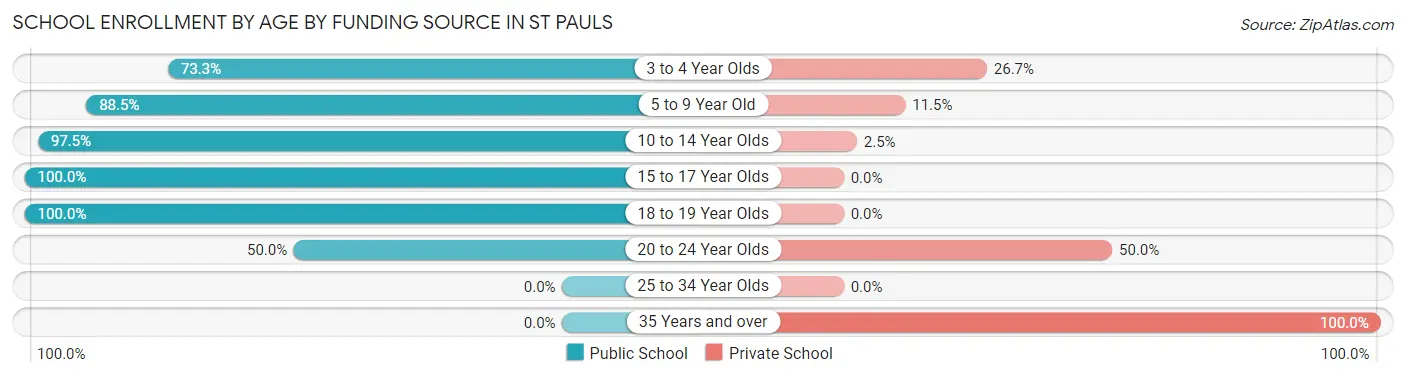
| Age Bracket | Public School | Private School |
| 3 to 4 Year Olds | 22 (73.3%) | 8 (26.7%) |
| 5 to 9 Year Old | 108 (88.5%) | 14 (11.5%) |
| 10 to 14 Year Olds | 198 (97.5%) | 5 (2.5%) |
| 15 to 17 Year Olds | 71 (100.0%) | 0 (0.0%) |
| 18 to 19 Year Olds | 14 (100.0%) | 0 (0.0%) |
| 20 to 24 Year Olds | 4 (50.0%) | 4 (50.0%) |
| 25 to 34 Year Olds | 0 (0.0%) | 0 (0.0%) |
| 35 Years and over | 0 (0.0%) | 25 (100.0%) |
| Total | 417 (88.2%) | 56 (11.8%) |
Educational Attainment by Field of Study in St Pauls
Education (33 | 25.4%), arts & humanities (26 | 20.0%), business (25 | 19.2%), psychology (11 | 8.5%), and bio, nature & agricultural (10 | 7.7%) are the most common fields of study among 130 individuals in St Pauls who have obtained a bachelor's degree or higher.
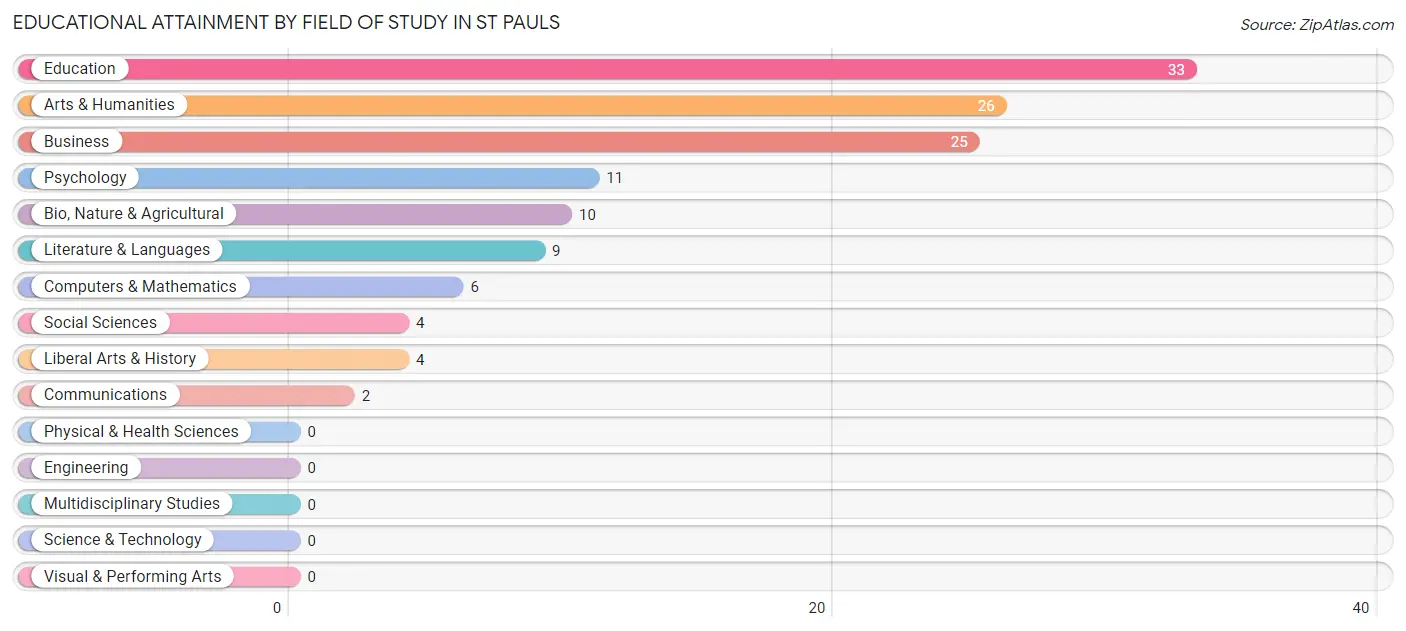
| Field of Study | # Graduates | % Graduates |
| Computers & Mathematics | 6 | 4.6% |
| Bio, Nature & Agricultural | 10 | 7.7% |
| Physical & Health Sciences | 0 | 0.0% |
| Psychology | 11 | 8.5% |
| Social Sciences | 4 | 3.1% |
| Engineering | 0 | 0.0% |
| Multidisciplinary Studies | 0 | 0.0% |
| Science & Technology | 0 | 0.0% |
| Business | 25 | 19.2% |
| Education | 33 | 25.4% |
| Literature & Languages | 9 | 6.9% |
| Liberal Arts & History | 4 | 3.1% |
| Visual & Performing Arts | 0 | 0.0% |
| Communications | 2 | 1.5% |
| Arts & Humanities | 26 | 20.0% |
| Total | 130 | 100.0% |
Transportation & Commute in St Pauls
Vehicle Availability by Sex in St Pauls
The most prevalent vehicle ownership categories in St Pauls are males with 2 vehicles (153, accounting for 37.9%) and females with 2 vehicles (75, making up 48.7%).
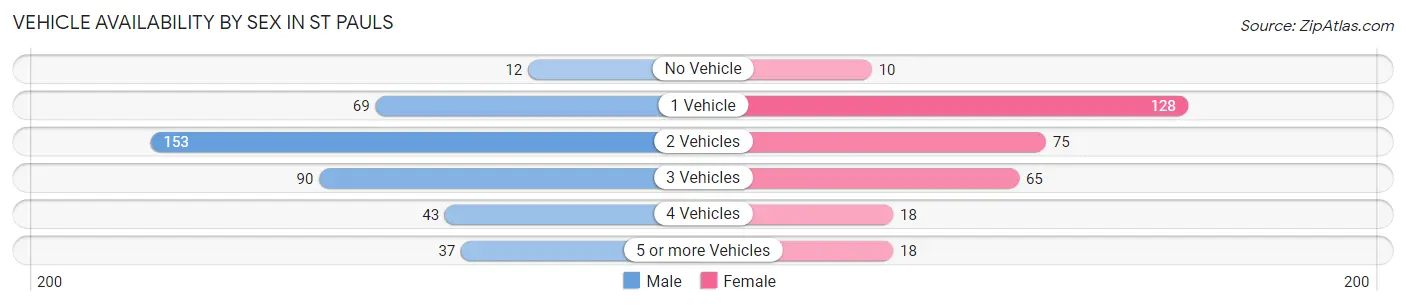
| Vehicles Available | Male | Female |
| No Vehicle | 12 (3.0%) | 10 (3.2%) |
| 1 Vehicle | 69 (17.1%) | 128 (40.8%) |
| 2 Vehicles | 153 (37.9%) | 75 (23.9%) |
| 3 Vehicles | 90 (22.3%) | 65 (20.7%) |
| 4 Vehicles | 43 (10.6%) | 18 (5.7%) |
| 5 or more Vehicles | 37 (9.2%) | 18 (5.7%) |
| Total | 404 (100.0%) | 314 (100.0%) |
Commute Time in St Pauls
The most frequently occuring commute durations in St Pauls are 15 to 19 minutes (124 commuters, 18.6%), 20 to 24 minutes (111 commuters, 16.6%), and 10 to 14 minutes (100 commuters, 15.0%).
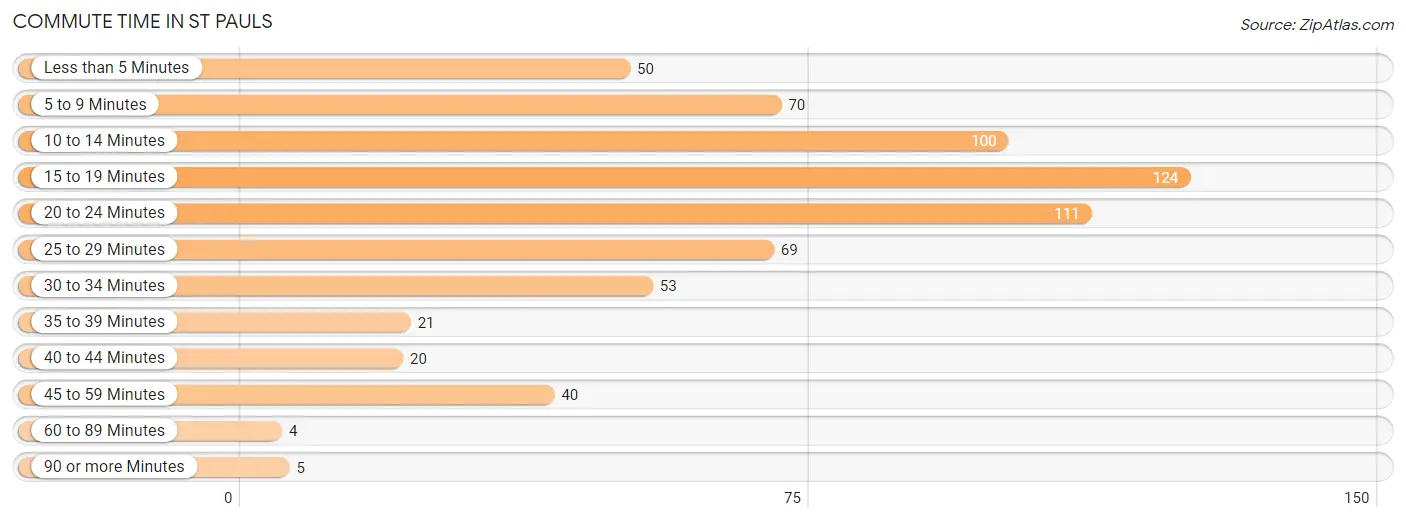
| Commute Time | # Commuters | % Commuters |
| Less than 5 Minutes | 50 | 7.5% |
| 5 to 9 Minutes | 70 | 10.5% |
| 10 to 14 Minutes | 100 | 15.0% |
| 15 to 19 Minutes | 124 | 18.6% |
| 20 to 24 Minutes | 111 | 16.6% |
| 25 to 29 Minutes | 69 | 10.3% |
| 30 to 34 Minutes | 53 | 8.0% |
| 35 to 39 Minutes | 21 | 3.2% |
| 40 to 44 Minutes | 20 | 3.0% |
| 45 to 59 Minutes | 40 | 6.0% |
| 60 to 89 Minutes | 4 | 0.6% |
| 90 or more Minutes | 5 | 0.7% |
Commute Time by Sex in St Pauls
The most common commute times in St Pauls are 15 to 19 minutes (74 commuters, 20.0%) for males and 20 to 24 minutes (54 commuters, 18.2%) for females.
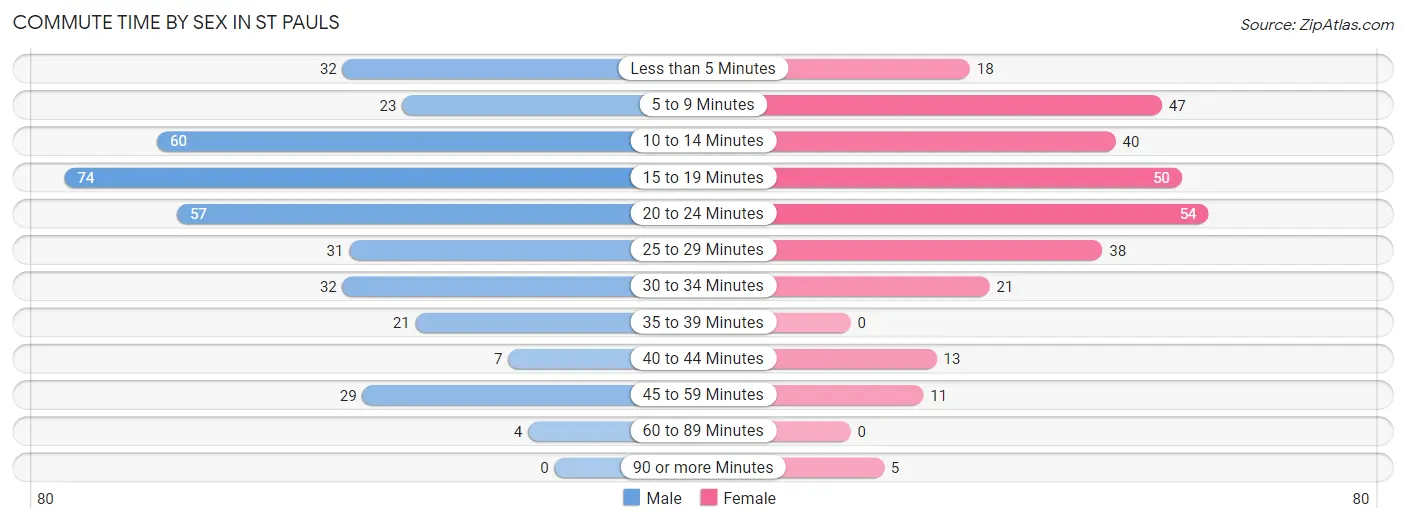
| Commute Time | Male | Female |
| Less than 5 Minutes | 32 (8.6%) | 18 (6.1%) |
| 5 to 9 Minutes | 23 (6.2%) | 47 (15.8%) |
| 10 to 14 Minutes | 60 (16.2%) | 40 (13.5%) |
| 15 to 19 Minutes | 74 (20.0%) | 50 (16.8%) |
| 20 to 24 Minutes | 57 (15.4%) | 54 (18.2%) |
| 25 to 29 Minutes | 31 (8.4%) | 38 (12.8%) |
| 30 to 34 Minutes | 32 (8.6%) | 21 (7.1%) |
| 35 to 39 Minutes | 21 (5.7%) | 0 (0.0%) |
| 40 to 44 Minutes | 7 (1.9%) | 13 (4.4%) |
| 45 to 59 Minutes | 29 (7.8%) | 11 (3.7%) |
| 60 to 89 Minutes | 4 (1.1%) | 0 (0.0%) |
| 90 or more Minutes | 0 (0.0%) | 5 (1.7%) |
Time of Departure to Work by Sex in St Pauls
The most frequent times of departure to work in St Pauls are 8:00 AM to 8:29 AM (83, 22.4%) for males and 8:00 AM to 8:29 AM (85, 28.6%) for females.
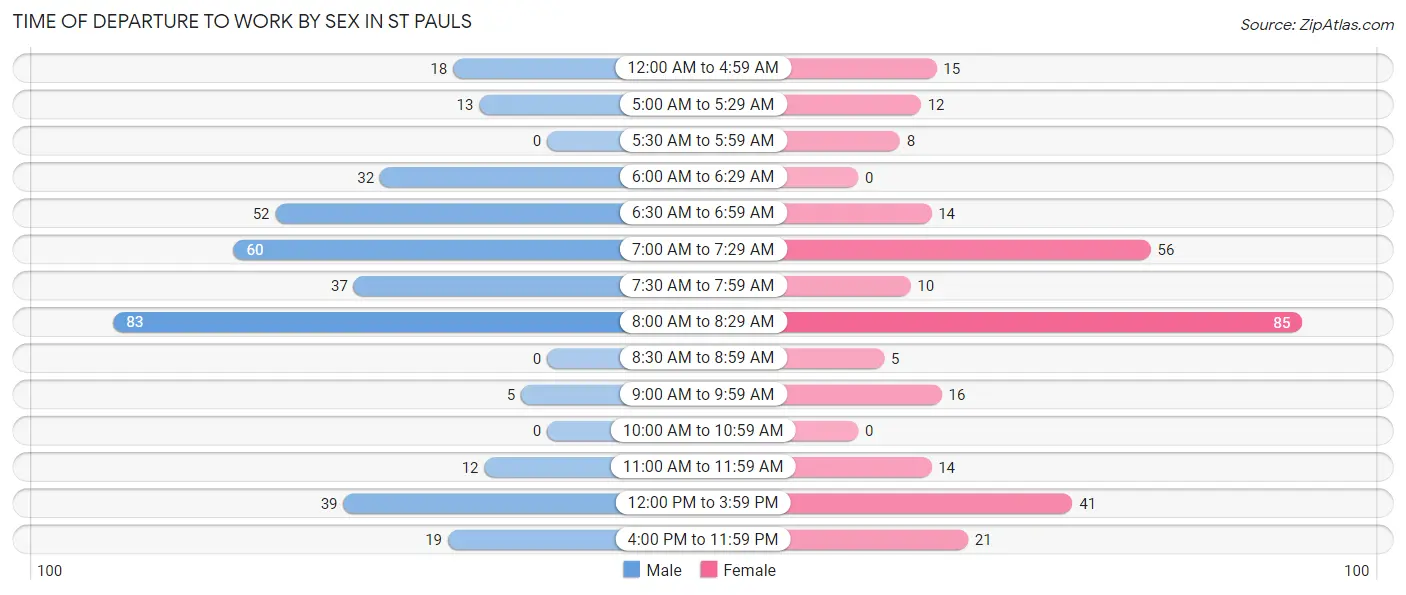
| Time of Departure | Male | Female |
| 12:00 AM to 4:59 AM | 18 (4.9%) | 15 (5.1%) |
| 5:00 AM to 5:29 AM | 13 (3.5%) | 12 (4.0%) |
| 5:30 AM to 5:59 AM | 0 (0.0%) | 8 (2.7%) |
| 6:00 AM to 6:29 AM | 32 (8.6%) | 0 (0.0%) |
| 6:30 AM to 6:59 AM | 52 (14.1%) | 14 (4.7%) |
| 7:00 AM to 7:29 AM | 60 (16.2%) | 56 (18.9%) |
| 7:30 AM to 7:59 AM | 37 (10.0%) | 10 (3.4%) |
| 8:00 AM to 8:29 AM | 83 (22.4%) | 85 (28.6%) |
| 8:30 AM to 8:59 AM | 0 (0.0%) | 5 (1.7%) |
| 9:00 AM to 9:59 AM | 5 (1.3%) | 16 (5.4%) |
| 10:00 AM to 10:59 AM | 0 (0.0%) | 0 (0.0%) |
| 11:00 AM to 11:59 AM | 12 (3.2%) | 14 (4.7%) |
| 12:00 PM to 3:59 PM | 39 (10.5%) | 41 (13.8%) |
| 4:00 PM to 11:59 PM | 19 (5.1%) | 21 (7.1%) |
| Total | 370 (100.0%) | 297 (100.0%) |
Housing Occupancy in St Pauls
Occupancy by Ownership in St Pauls
Of the total 875 dwellings in St Pauls, owner-occupied units account for 484 (55.3%), while renter-occupied units make up 391 (44.7%).
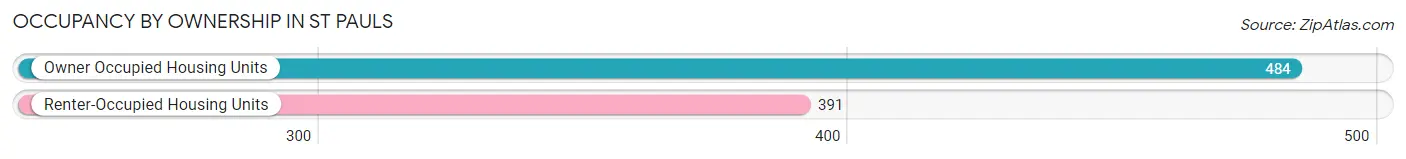
| Occupancy | # Housing Units | % Housing Units |
| Owner Occupied Housing Units | 484 | 55.3% |
| Renter-Occupied Housing Units | 391 | 44.7% |
| Total Occupied Housing Units | 875 | 100.0% |
Occupancy by Household Size in St Pauls
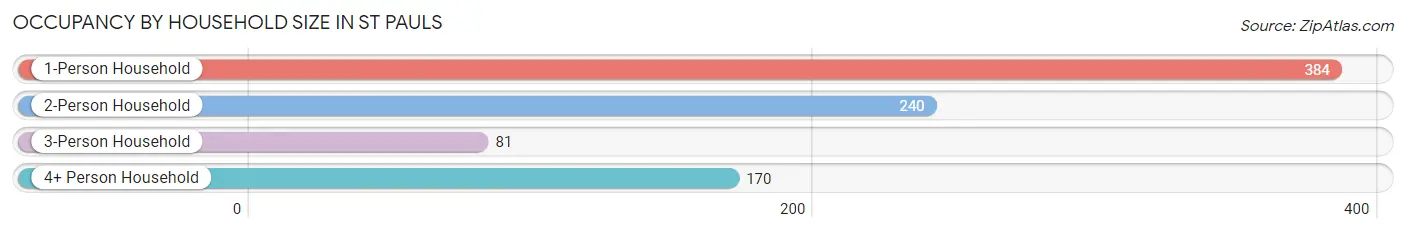
| Household Size | # Housing Units | % Housing Units |
| 1-Person Household | 384 | 43.9% |
| 2-Person Household | 240 | 27.4% |
| 3-Person Household | 81 | 9.3% |
| 4+ Person Household | 170 | 19.4% |
| Total Housing Units | 875 | 100.0% |
Occupancy by Ownership by Household Size in St Pauls
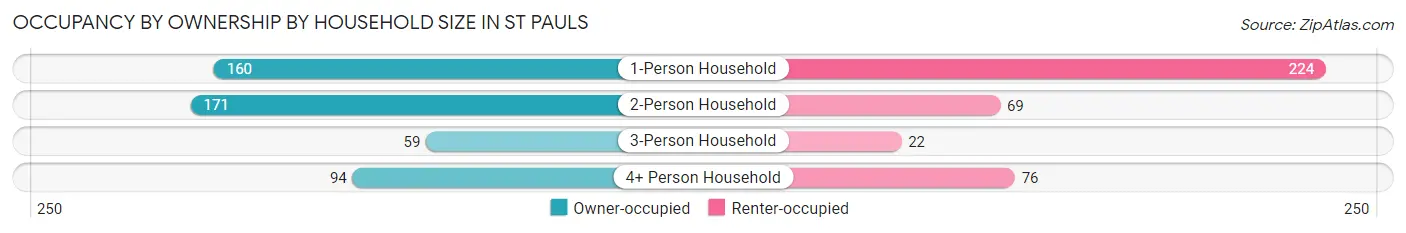
| Household Size | Owner-occupied | Renter-occupied |
| 1-Person Household | 160 (41.7%) | 224 (58.3%) |
| 2-Person Household | 171 (71.3%) | 69 (28.7%) |
| 3-Person Household | 59 (72.8%) | 22 (27.2%) |
| 4+ Person Household | 94 (55.3%) | 76 (44.7%) |
| Total Housing Units | 484 (55.3%) | 391 (44.7%) |
Occupancy by Educational Attainment in St Pauls
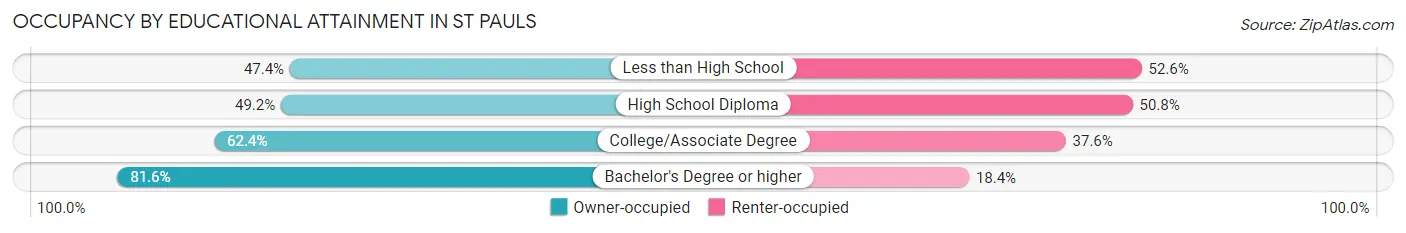
| Household Size | Owner-occupied | Renter-occupied |
| Less than High School | 100 (47.4%) | 111 (52.6%) |
| High School Diploma | 175 (49.2%) | 181 (50.8%) |
| College/Associate Degree | 138 (62.4%) | 83 (37.6%) |
| Bachelor's Degree or higher | 71 (81.6%) | 16 (18.4%) |
Occupancy by Age of Householder in St Pauls
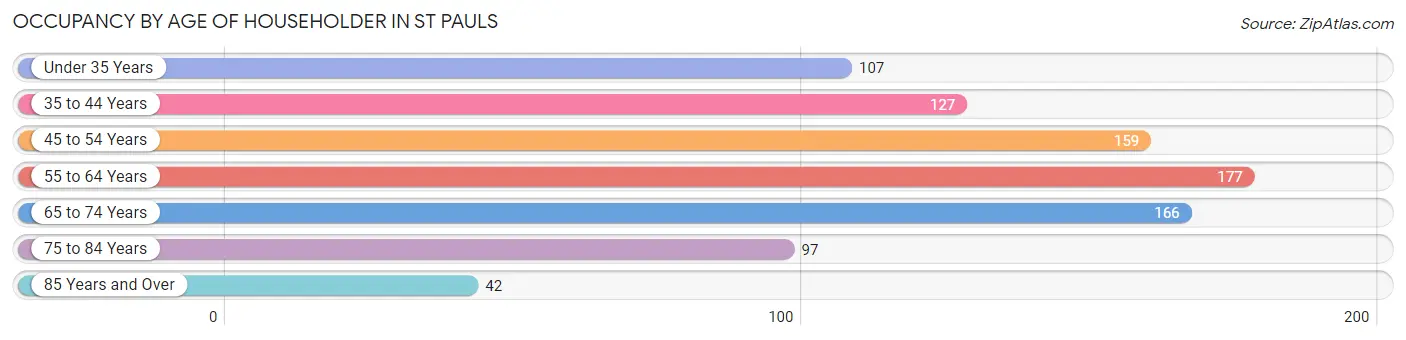
| Age Bracket | # Households | % Households |
| Under 35 Years | 107 | 12.2% |
| 35 to 44 Years | 127 | 14.5% |
| 45 to 54 Years | 159 | 18.2% |
| 55 to 64 Years | 177 | 20.2% |
| 65 to 74 Years | 166 | 19.0% |
| 75 to 84 Years | 97 | 11.1% |
| 85 Years and Over | 42 | 4.8% |
| Total | 875 | 100.0% |
Housing Finances in St Pauls
Median Income by Occupancy in St Pauls
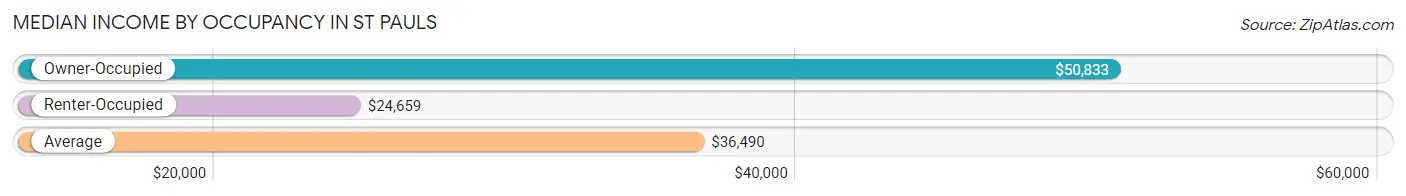
| Occupancy Type | # Households | Median Income |
| Owner-Occupied | 484 (55.3%) | $50,833 |
| Renter-Occupied | 391 (44.7%) | $24,659 |
| Average | 875 (100.0%) | $36,490 |
Occupancy by Householder Income Bracket in St Pauls
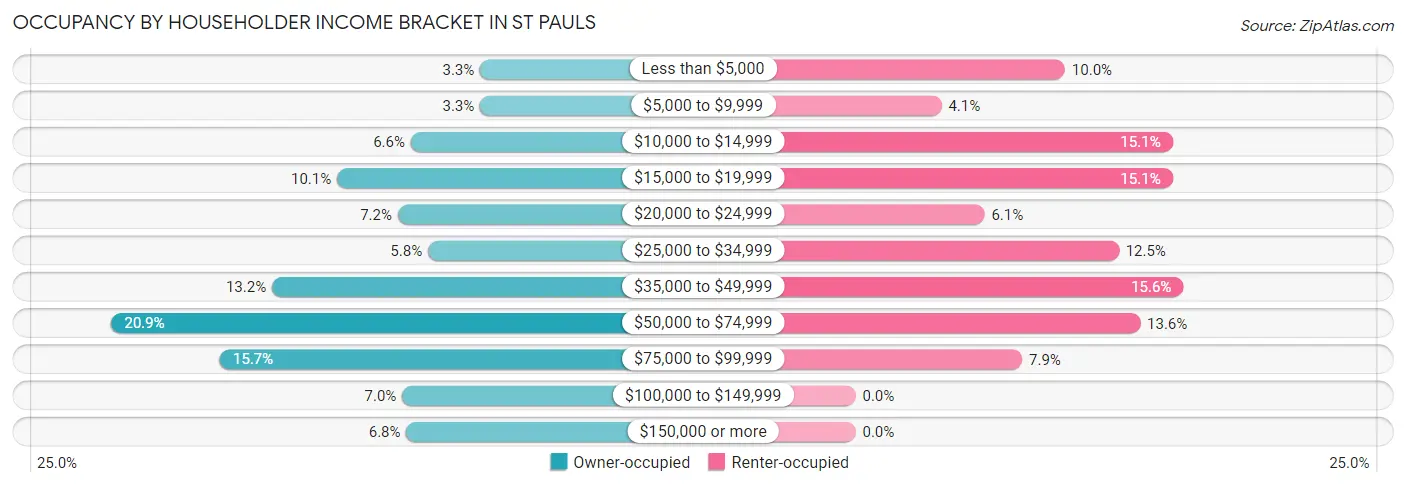
| Income Bracket | Owner-occupied | Renter-occupied |
| Less than $5,000 | 16 (3.3%) | 39 (10.0%) |
| $5,000 to $9,999 | 16 (3.3%) | 16 (4.1%) |
| $10,000 to $14,999 | 32 (6.6%) | 59 (15.1%) |
| $15,000 to $19,999 | 49 (10.1%) | 59 (15.1%) |
| $20,000 to $24,999 | 35 (7.2%) | 24 (6.1%) |
| $25,000 to $34,999 | 28 (5.8%) | 49 (12.5%) |
| $35,000 to $49,999 | 64 (13.2%) | 61 (15.6%) |
| $50,000 to $74,999 | 101 (20.9%) | 53 (13.6%) |
| $75,000 to $99,999 | 76 (15.7%) | 31 (7.9%) |
| $100,000 to $149,999 | 34 (7.0%) | 0 (0.0%) |
| $150,000 or more | 33 (6.8%) | 0 (0.0%) |
| Total | 484 (100.0%) | 391 (100.0%) |
Monthly Housing Cost Tiers in St Pauls
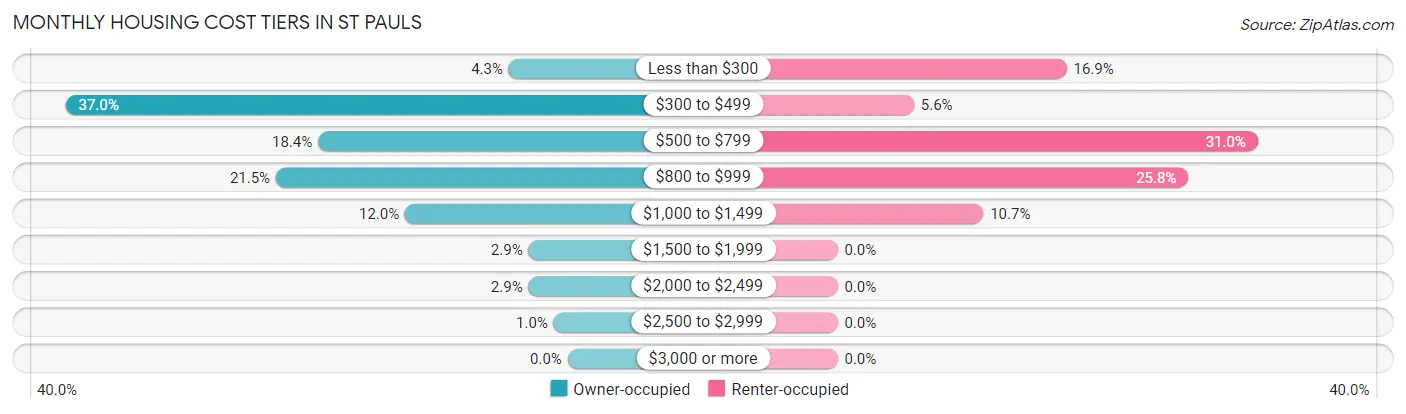
| Monthly Cost | Owner-occupied | Renter-occupied |
| Less than $300 | 21 (4.3%) | 66 (16.9%) |
| $300 to $499 | 179 (37.0%) | 22 (5.6%) |
| $500 to $799 | 89 (18.4%) | 121 (30.9%) |
| $800 to $999 | 104 (21.5%) | 101 (25.8%) |
| $1,000 to $1,499 | 58 (12.0%) | 42 (10.7%) |
| $1,500 to $1,999 | 14 (2.9%) | 0 (0.0%) |
| $2,000 to $2,499 | 14 (2.9%) | 0 (0.0%) |
| $2,500 to $2,999 | 5 (1.0%) | 0 (0.0%) |
| $3,000 or more | 0 (0.0%) | 0 (0.0%) |
| Total | 484 (100.0%) | 391 (100.0%) |
Physical Housing Characteristics in St Pauls
Housing Structures in St Pauls
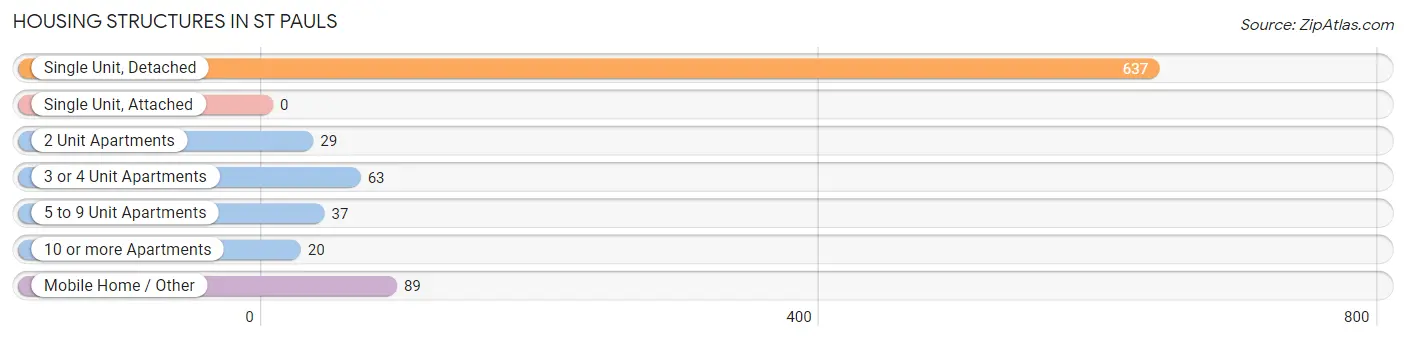
| Structure Type | # Housing Units | % Housing Units |
| Single Unit, Detached | 637 | 72.8% |
| Single Unit, Attached | 0 | 0.0% |
| 2 Unit Apartments | 29 | 3.3% |
| 3 or 4 Unit Apartments | 63 | 7.2% |
| 5 to 9 Unit Apartments | 37 | 4.2% |
| 10 or more Apartments | 20 | 2.3% |
| Mobile Home / Other | 89 | 10.2% |
| Total | 875 | 100.0% |
Housing Structures by Occupancy in St Pauls
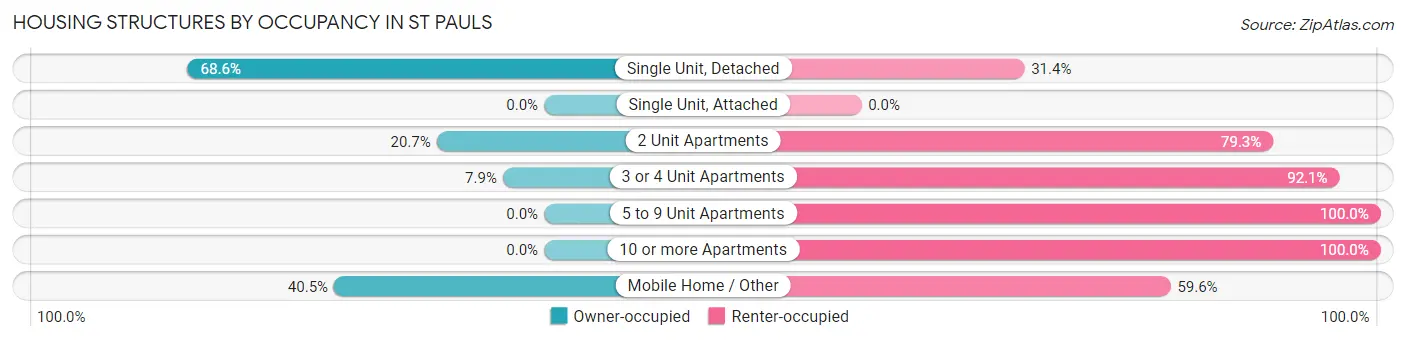
| Structure Type | Owner-occupied | Renter-occupied |
| Single Unit, Detached | 437 (68.6%) | 200 (31.4%) |
| Single Unit, Attached | 0 (0.0%) | 0 (0.0%) |
| 2 Unit Apartments | 6 (20.7%) | 23 (79.3%) |
| 3 or 4 Unit Apartments | 5 (7.9%) | 58 (92.1%) |
| 5 to 9 Unit Apartments | 0 (0.0%) | 37 (100.0%) |
| 10 or more Apartments | 0 (0.0%) | 20 (100.0%) |
| Mobile Home / Other | 36 (40.5%) | 53 (59.6%) |
| Total | 484 (55.3%) | 391 (44.7%) |
Housing Structures by Number of Rooms in St Pauls
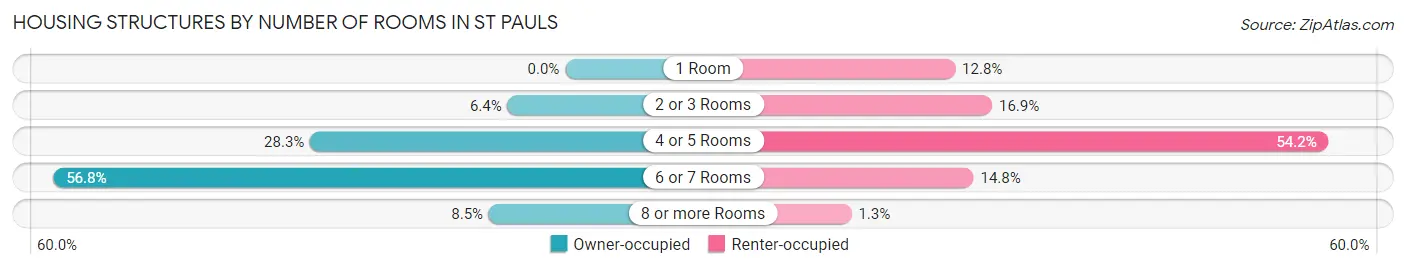
| Number of Rooms | Owner-occupied | Renter-occupied |
| 1 Room | 0 (0.0%) | 50 (12.8%) |
| 2 or 3 Rooms | 31 (6.4%) | 66 (16.9%) |
| 4 or 5 Rooms | 137 (28.3%) | 212 (54.2%) |
| 6 or 7 Rooms | 275 (56.8%) | 58 (14.8%) |
| 8 or more Rooms | 41 (8.5%) | 5 (1.3%) |
| Total | 484 (100.0%) | 391 (100.0%) |
Housing Structure by Heating Type in St Pauls
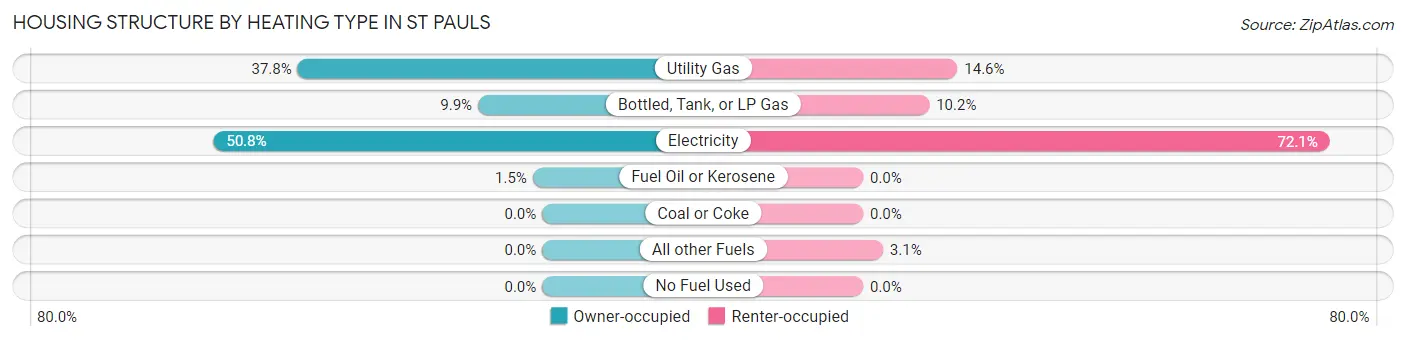
| Heating Type | Owner-occupied | Renter-occupied |
| Utility Gas | 183 (37.8%) | 57 (14.6%) |
| Bottled, Tank, or LP Gas | 48 (9.9%) | 40 (10.2%) |
| Electricity | 246 (50.8%) | 282 (72.1%) |
| Fuel Oil or Kerosene | 7 (1.5%) | 0 (0.0%) |
| Coal or Coke | 0 (0.0%) | 0 (0.0%) |
| All other Fuels | 0 (0.0%) | 12 (3.1%) |
| No Fuel Used | 0 (0.0%) | 0 (0.0%) |
| Total | 484 (100.0%) | 391 (100.0%) |
Household Vehicle Usage in St Pauls
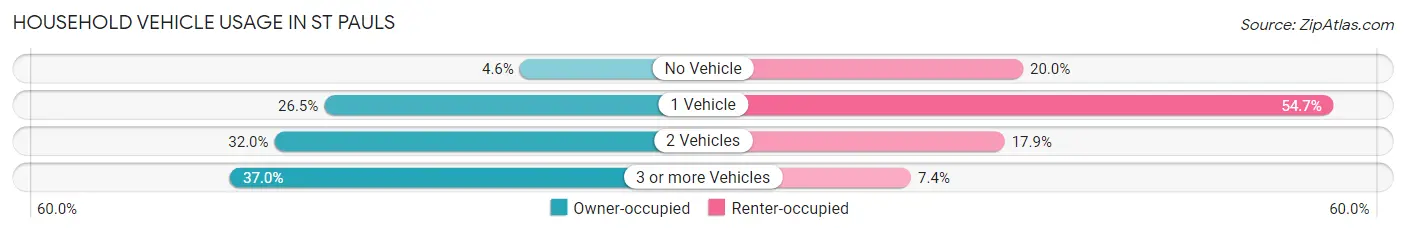
| Vehicles per Household | Owner-occupied | Renter-occupied |
| No Vehicle | 22 (4.5%) | 78 (20.0%) |
| 1 Vehicle | 128 (26.5%) | 214 (54.7%) |
| 2 Vehicles | 155 (32.0%) | 70 (17.9%) |
| 3 or more Vehicles | 179 (37.0%) | 29 (7.4%) |
| Total | 484 (100.0%) | 391 (100.0%) |
Real Estate & Mortgages in St Pauls
Real Estate and Mortgage Overview in St Pauls
| Characteristic | Without Mortgage | With Mortgage |
| Housing Units | 287 | 197 |
| Median Property Value | $101,000 | $100,500 |
| Median Household Income | $40,781 | $16 |
| Monthly Housing Costs | $441 | $0 |
| Real Estate Taxes | $940 | $0 |
Property Value by Mortgage Status in St Pauls
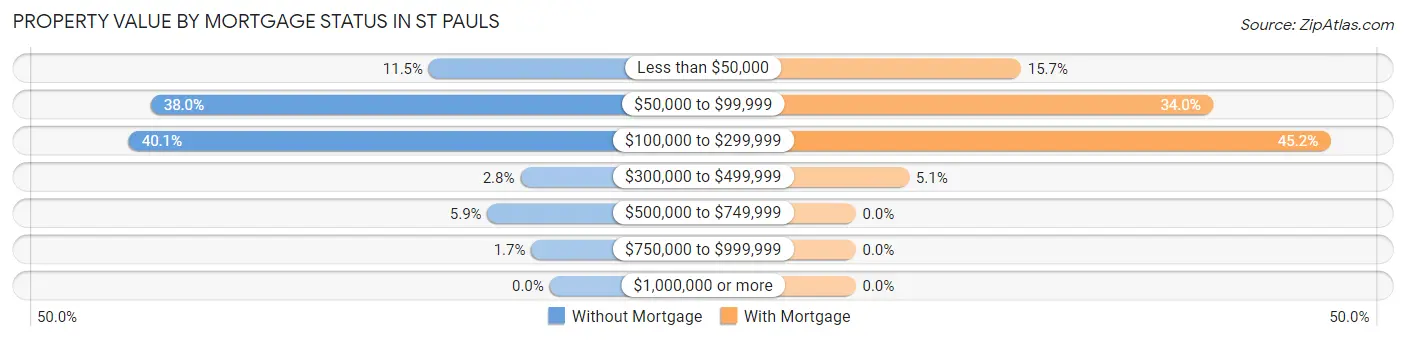
| Property Value | Without Mortgage | With Mortgage |
| Less than $50,000 | 33 (11.5%) | 31 (15.7%) |
| $50,000 to $99,999 | 109 (38.0%) | 67 (34.0%) |
| $100,000 to $299,999 | 115 (40.1%) | 89 (45.2%) |
| $300,000 to $499,999 | 8 (2.8%) | 10 (5.1%) |
| $500,000 to $749,999 | 17 (5.9%) | 0 (0.0%) |
| $750,000 to $999,999 | 5 (1.7%) | 0 (0.0%) |
| $1,000,000 or more | 0 (0.0%) | 0 (0.0%) |
| Total | 287 (100.0%) | 197 (100.0%) |
Household Income by Mortgage Status in St Pauls
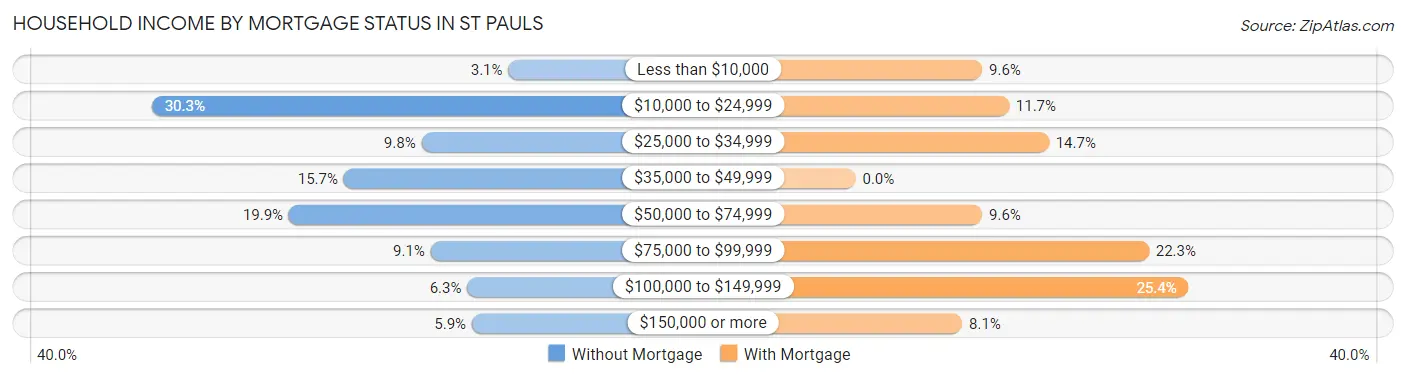
| Household Income | Without Mortgage | With Mortgage |
| Less than $10,000 | 9 (3.1%) | 19 (9.6%) |
| $10,000 to $24,999 | 87 (30.3%) | 23 (11.7%) |
| $25,000 to $34,999 | 28 (9.8%) | 29 (14.7%) |
| $35,000 to $49,999 | 45 (15.7%) | 0 (0.0%) |
| $50,000 to $74,999 | 57 (19.9%) | 19 (9.6%) |
| $75,000 to $99,999 | 26 (9.1%) | 44 (22.3%) |
| $100,000 to $149,999 | 18 (6.3%) | 50 (25.4%) |
| $150,000 or more | 17 (5.9%) | 16 (8.1%) |
| Total | 287 (100.0%) | 197 (100.0%) |
Property Value to Household Income Ratio in St Pauls
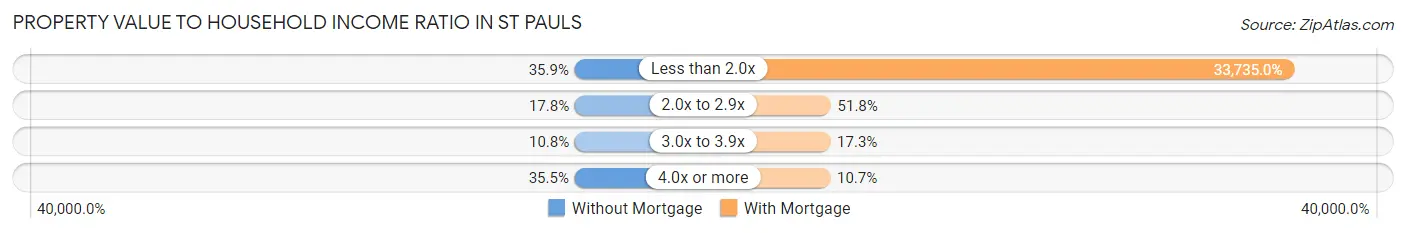
| Value-to-Income Ratio | Without Mortgage | With Mortgage |
| Less than 2.0x | 103 (35.9%) | 66,458 (33,735.0%) |
| 2.0x to 2.9x | 51 (17.8%) | 102 (51.8%) |
| 3.0x to 3.9x | 31 (10.8%) | 34 (17.3%) |
| 4.0x or more | 102 (35.5%) | 21 (10.7%) |
| Total | 287 (100.0%) | 197 (100.0%) |
Real Estate Taxes by Mortgage Status in St Pauls
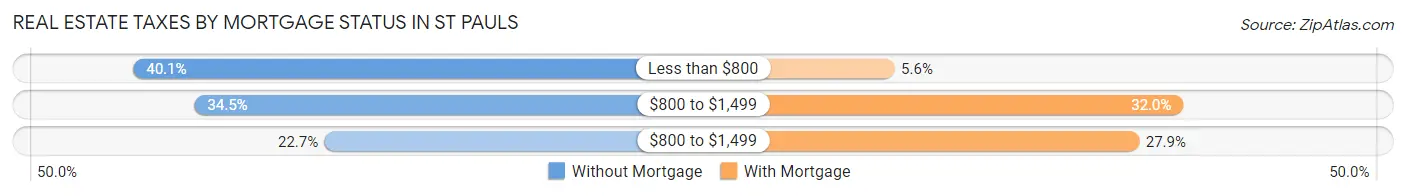
| Property Taxes | Without Mortgage | With Mortgage |
| Less than $800 | 115 (40.1%) | 11 (5.6%) |
| $800 to $1,499 | 99 (34.5%) | 63 (32.0%) |
| $800 to $1,499 | 65 (22.7%) | 55 (27.9%) |
| Total | 287 (100.0%) | 197 (100.0%) |
Health & Disability in St Pauls
Health Insurance Coverage by Age in St Pauls
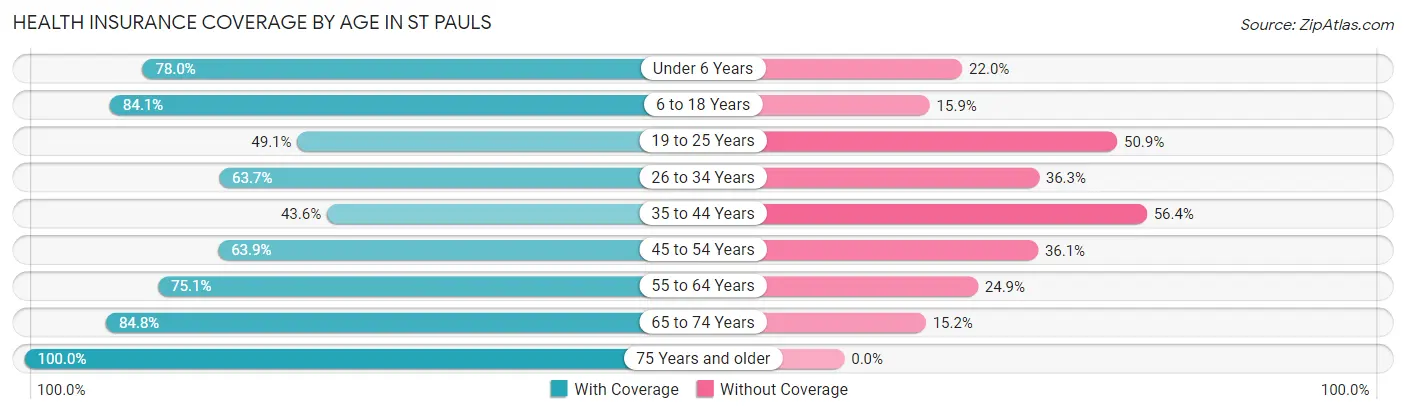
| Age Bracket | With Coverage | Without Coverage |
| Under 6 Years | 181 (78.0%) | 51 (22.0%) |
| 6 to 18 Years | 338 (84.1%) | 64 (15.9%) |
| 19 to 25 Years | 57 (49.1%) | 59 (50.9%) |
| 26 to 34 Years | 130 (63.7%) | 74 (36.3%) |
| 35 to 44 Years | 99 (43.6%) | 128 (56.4%) |
| 45 to 54 Years | 184 (63.9%) | 104 (36.1%) |
| 55 to 64 Years | 220 (75.1%) | 73 (24.9%) |
| 65 to 74 Years | 257 (84.8%) | 46 (15.2%) |
| 75 Years and older | 196 (100.0%) | 0 (0.0%) |
| Total | 1,662 (73.5%) | 599 (26.5%) |
Health Insurance Coverage by Citizenship Status in St Pauls
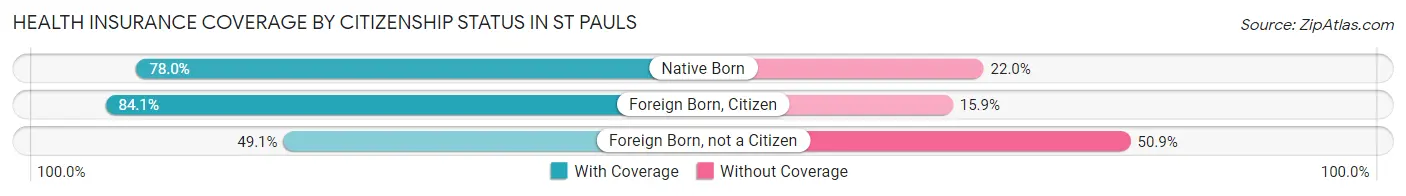
| Citizenship Status | With Coverage | Without Coverage |
| Native Born | 181 (78.0%) | 51 (22.0%) |
| Foreign Born, Citizen | 338 (84.1%) | 64 (15.9%) |
| Foreign Born, not a Citizen | 57 (49.1%) | 59 (50.9%) |
Health Insurance Coverage by Household Income in St Pauls
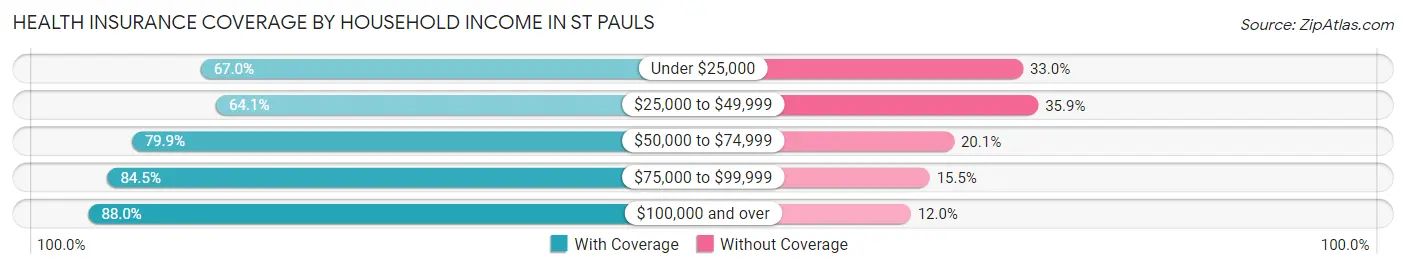
| Household Income | With Coverage | Without Coverage |
| Under $25,000 | 485 (67.0%) | 239 (33.0%) |
| $25,000 to $49,999 | 345 (64.1%) | 193 (35.9%) |
| $50,000 to $74,999 | 394 (79.9%) | 99 (20.1%) |
| $75,000 to $99,999 | 185 (84.5%) | 34 (15.5%) |
| $100,000 and over | 250 (88.0%) | 34 (12.0%) |
Public vs Private Health Insurance Coverage by Age in St Pauls
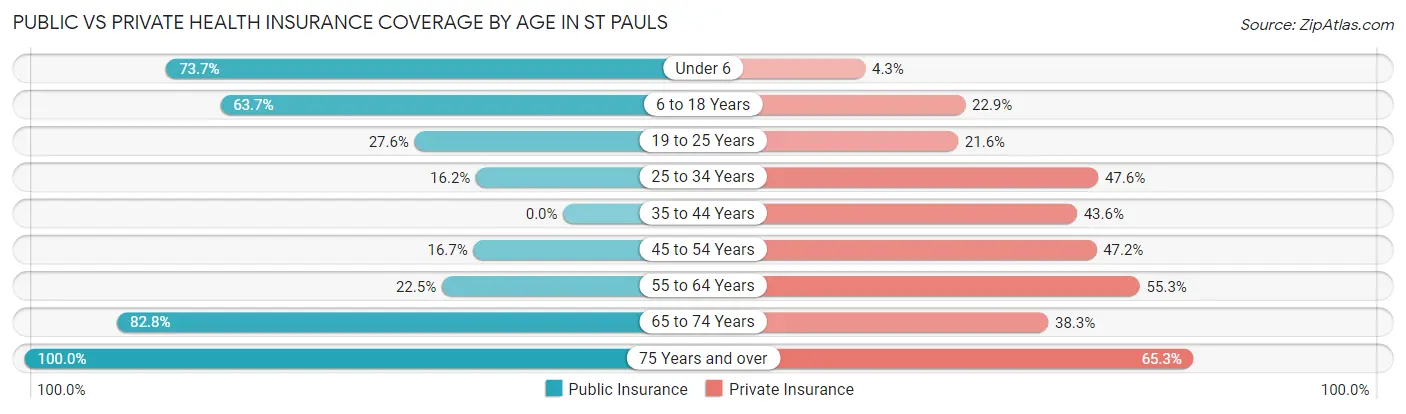
| Age Bracket | Public Insurance | Private Insurance |
| Under 6 | 171 (73.7%) | 10 (4.3%) |
| 6 to 18 Years | 256 (63.7%) | 92 (22.9%) |
| 19 to 25 Years | 32 (27.6%) | 25 (21.5%) |
| 25 to 34 Years | 33 (16.2%) | 97 (47.5%) |
| 35 to 44 Years | 0 (0.0%) | 99 (43.6%) |
| 45 to 54 Years | 48 (16.7%) | 136 (47.2%) |
| 55 to 64 Years | 66 (22.5%) | 162 (55.3%) |
| 65 to 74 Years | 251 (82.8%) | 116 (38.3%) |
| 75 Years and over | 196 (100.0%) | 128 (65.3%) |
| Total | 1,053 (46.6%) | 865 (38.3%) |
Disability Status by Sex by Age in St Pauls
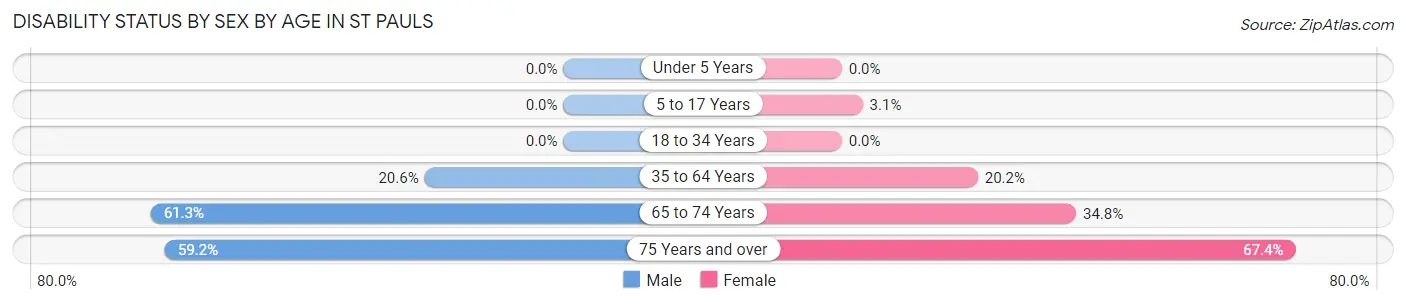
| Age Bracket | Male | Female |
| Under 5 Years | 0 (0.0%) | 0 (0.0%) |
| 5 to 17 Years | 0 (0.0%) | 8 (3.1%) |
| 18 to 34 Years | 0 (0.0%) | 0 (0.0%) |
| 35 to 64 Years | 86 (20.6%) | 79 (20.2%) |
| 65 to 74 Years | 87 (61.3%) | 56 (34.8%) |
| 75 Years and over | 58 (59.2%) | 66 (67.3%) |
Disability Class by Sex by Age in St Pauls
Disability Class: Hearing Difficulty
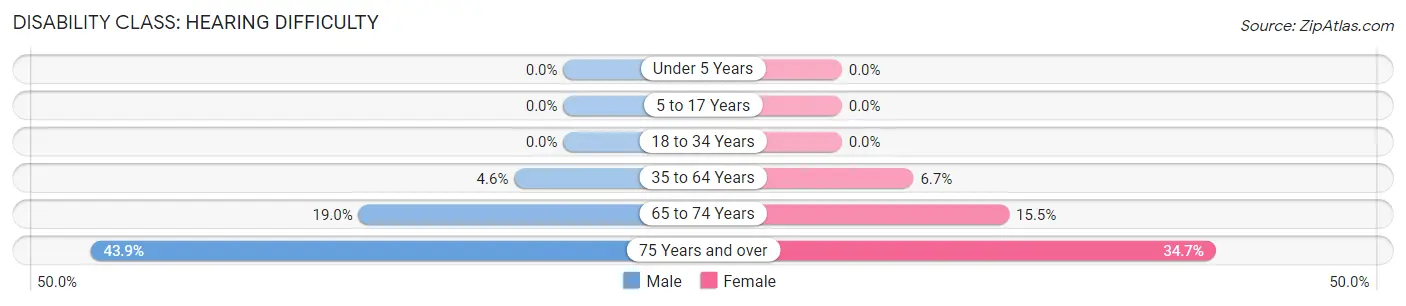
| Age Bracket | Male | Female |
| Under 5 Years | 0 (0.0%) | 0 (0.0%) |
| 5 to 17 Years | 0 (0.0%) | 0 (0.0%) |
| 18 to 34 Years | 0 (0.0%) | 0 (0.0%) |
| 35 to 64 Years | 19 (4.6%) | 26 (6.7%) |
| 65 to 74 Years | 27 (19.0%) | 25 (15.5%) |
| 75 Years and over | 43 (43.9%) | 34 (34.7%) |
Disability Class: Vision Difficulty
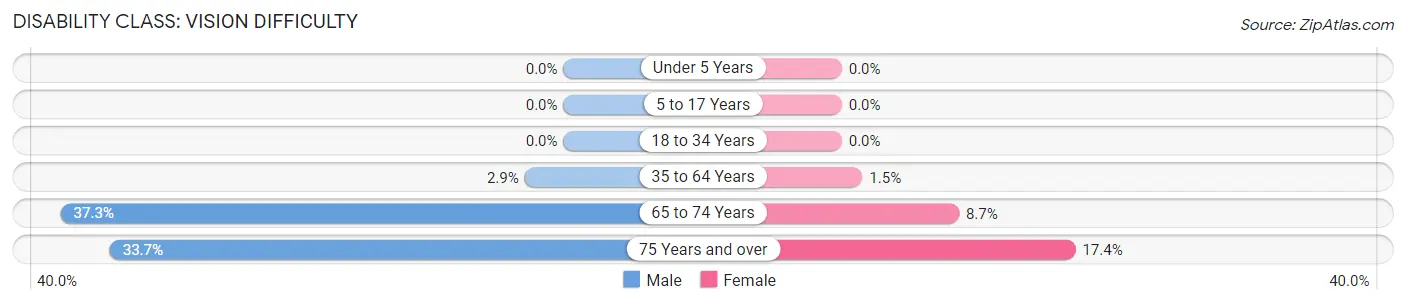
| Age Bracket | Male | Female |
| Under 5 Years | 0 (0.0%) | 0 (0.0%) |
| 5 to 17 Years | 0 (0.0%) | 0 (0.0%) |
| 18 to 34 Years | 0 (0.0%) | 0 (0.0%) |
| 35 to 64 Years | 12 (2.9%) | 6 (1.5%) |
| 65 to 74 Years | 53 (37.3%) | 14 (8.7%) |
| 75 Years and over | 33 (33.7%) | 17 (17.3%) |
Disability Class: Cognitive Difficulty
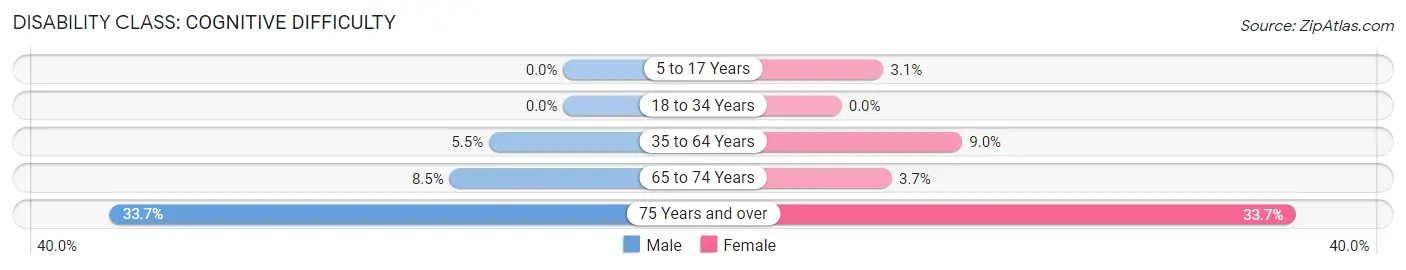
| Age Bracket | Male | Female |
| 5 to 17 Years | 0 (0.0%) | 8 (3.1%) |
| 18 to 34 Years | 0 (0.0%) | 0 (0.0%) |
| 35 to 64 Years | 23 (5.5%) | 35 (8.9%) |
| 65 to 74 Years | 12 (8.5%) | 6 (3.7%) |
| 75 Years and over | 33 (33.7%) | 33 (33.7%) |
Disability Class: Ambulatory Difficulty
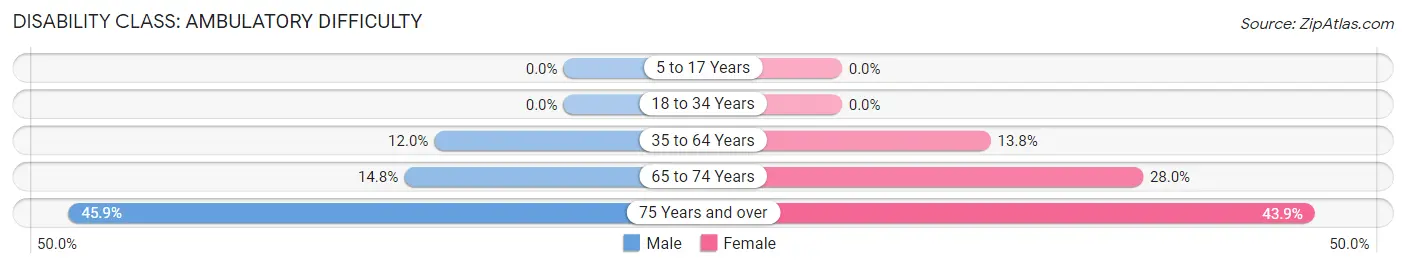
| Age Bracket | Male | Female |
| 5 to 17 Years | 0 (0.0%) | 0 (0.0%) |
| 18 to 34 Years | 0 (0.0%) | 0 (0.0%) |
| 35 to 64 Years | 50 (12.0%) | 54 (13.8%) |
| 65 to 74 Years | 21 (14.8%) | 45 (28.0%) |
| 75 Years and over | 45 (45.9%) | 43 (43.9%) |
Disability Class: Self-Care Difficulty
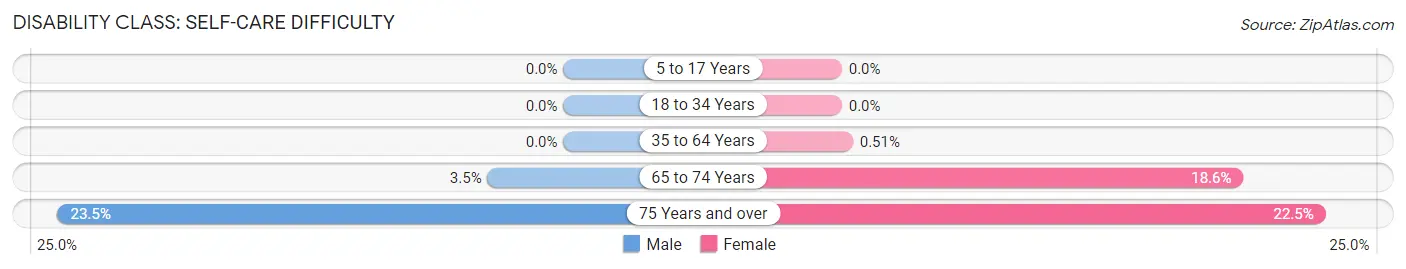
| Age Bracket | Male | Female |
| 5 to 17 Years | 0 (0.0%) | 0 (0.0%) |
| 18 to 34 Years | 0 (0.0%) | 0 (0.0%) |
| 35 to 64 Years | 0 (0.0%) | 2 (0.5%) |
| 65 to 74 Years | 5 (3.5%) | 30 (18.6%) |
| 75 Years and over | 23 (23.5%) | 22 (22.5%) |
Technology Access in St Pauls
Computing Device Access in St Pauls
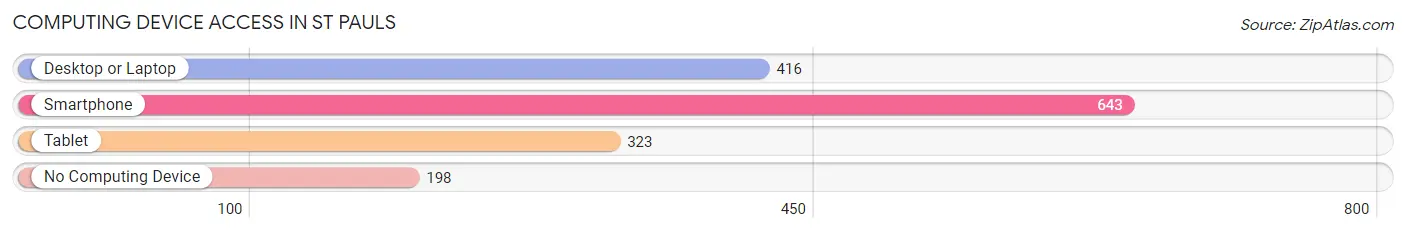
| Device Type | # Households | % Households |
| Desktop or Laptop | 416 | 47.5% |
| Smartphone | 643 | 73.5% |
| Tablet | 323 | 36.9% |
| No Computing Device | 198 | 22.6% |
| Total | 875 | 100.0% |
Internet Access in St Pauls
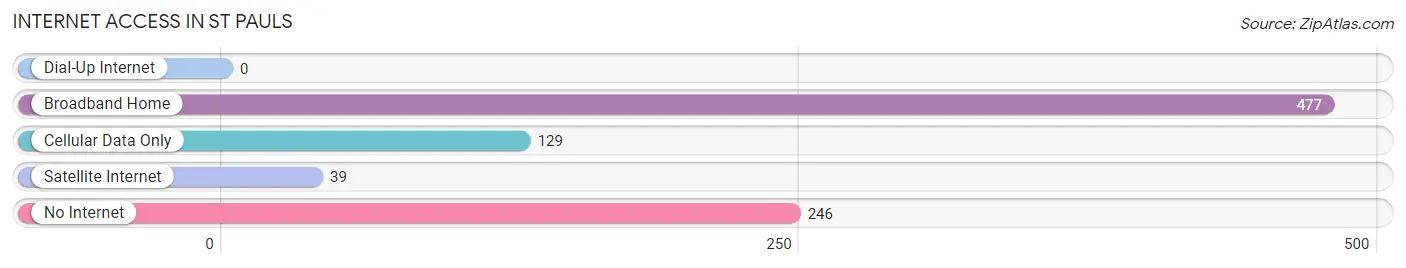
| Internet Type | # Households | % Households |
| Dial-Up Internet | 0 | 0.0% |
| Broadband Home | 477 | 54.5% |
| Cellular Data Only | 129 | 14.7% |
| Satellite Internet | 39 | 4.5% |
| No Internet | 246 | 28.1% |
| Total | 875 | 100.0% |
St Pauls Summary
St Pauls is a small town located in Robeson County, North Carolina. It is situated in the southeastern part of the state, approximately 30 miles from the city of Fayetteville. The town has a population of approximately 2,500 people and is part of the Fayetteville Metropolitan Statistical Area.
Geography
St Pauls is located in the southeastern part of Robeson County, North Carolina. It is situated in the Coastal Plain region of the state, which is characterized by flat terrain and sandy soils. The town is located near the Lumber River, which is a tributary of the Cape Fear River. The town is also located near the intersection of Interstate 95 and US Highway 301.
The climate in St Pauls is humid subtropical, with hot, humid summers and mild winters. The average annual temperature is around 70 degrees Fahrenheit, with an average high of around 90 degrees in the summer and an average low of around 50 degrees in the winter. The average annual precipitation is around 50 inches.
Demographics
As of the 2010 census, the population of St Pauls was 2,521. The racial makeup of the town was 57.3% White, 37.2% African American, 0.3% Native American, 0.7% Asian, 0.1% Pacific Islander, and 4.4% from other races. Hispanic or Latino of any race were 2.2% of the population.
The median household income in St Pauls was $30,938, and the median family income was $37,917. The per capita income was $15,945. About 22.2% of families and 25.3% of the population were below the poverty line, including 36.2% of those under age 18 and 16.2% of those age 65 or over.
Economy
The economy of St Pauls is largely based on agriculture and manufacturing. The town is home to several large poultry farms, as well as a number of smaller farms that produce vegetables, fruits, and other crops. The town is also home to several manufacturing plants, including a paper mill and a furniture factory.
The town is also home to several retail stores, restaurants, and other businesses. The town is served by the Robeson County Airport, which is located just outside of town.
History
St Pauls was founded in 1887 by a group of settlers from Scotland. The town was named after the town of St. Pauls in Scotland. The town grew rapidly in the early 20th century, and by the 1950s it had become a major center for the poultry industry.
In the late 20th century, St Pauls experienced a period of economic decline, as many of the town's manufacturing plants closed or moved away. However, the town has since experienced a resurgence, with new businesses and industries moving into the area.
Conclusion
St Pauls is a small town located in Robeson County, North Carolina. It is situated in the southeastern part of the state, approximately 30 miles from the city of Fayetteville. The town has a population of approximately 2,500 people and is part of the Fayetteville Metropolitan Statistical Area. The economy of St Pauls is largely based on agriculture and manufacturing, and the town is home to several retail stores, restaurants, and other businesses. St Pauls was founded in 1887 by a group of settlers from Scotland, and the town has experienced a period of economic decline and resurgence in the late 20th century.
Common Questions
What is Per Capita Income in St Pauls?
Per Capita income in St Pauls is $21,608.
What is the Median Family Income in St Pauls?
Median Family Income in St Pauls is $50,125.
What is the Median Household income in St Pauls?
Median Household Income in St Pauls is $36,490.
What is Income or Wage Gap in St Pauls?
Income or Wage Gap in St Pauls is 2.9%.
Women in St Pauls earn 97.1 cents for every dollar earned by a man.
What is Inequality or Gini Index in St Pauls?
Inequality or Gini Index in St Pauls is 0.52.
What is the Total Population of St Pauls?
Total Population of St Pauls is 2,261.
What is the Total Male Population of St Pauls?
Total Male Population of St Pauls is 1,064.
What is the Total Female Population of St Pauls?
Total Female Population of St Pauls is 1,197.
What is the Ratio of Males per 100 Females in St Pauls?
There are 88.89 Males per 100 Females in St Pauls.
What is the Ratio of Females per 100 Males in St Pauls?
There are 112.50 Females per 100 Males in St Pauls.
What is the Median Population Age in St Pauls?
Median Population Age in St Pauls is 42.6 Years.
What is the Average Family Size in St Pauls
Average Family Size in St Pauls is 3.7 People.
What is the Average Household Size in St Pauls
Average Household Size in St Pauls is 2.6 People.
How Large is the Labor Force in St Pauls?
There are 822 People in the Labor Forcein in St Pauls.
What is the Percentage of People in the Labor Force in St Pauls?
48.4% of People are in the Labor Force in St Pauls.
What is the Unemployment Rate in St Pauls?
Unemployment Rate in St Pauls is 9.9%.