Mar Mac, NC Map & Demographics
Mar Mac Map
Mar Mac Overview
$27,286
PER CAPITA INCOME
$58,964
AVG FAMILY INCOME
$50,286
AVG HOUSEHOLD INCOME
45.2%
WAGE / INCOME GAP [ % ]
54.8¢/ $1
WAGE / INCOME GAP [ $ ]
0.37
INEQUALITY / GINI INDEX
2,485
TOTAL POPULATION
1,295
MALE POPULATION
1,190
FEMALE POPULATION
108.82
MALES / 100 FEMALES
91.89
FEMALES / 100 MALES
37.0
MEDIAN AGE
3.1
AVG FAMILY SIZE
2.1
AVG HOUSEHOLD SIZE
940
LABOR FORCE [ PEOPLE ]
51.5%
PERCENT IN LABOR FORCE
Income in Mar Mac
Income Overview in Mar Mac
Per Capita Income in Mar Mac is $27,286, while median incomes of families and households are $58,964 and $50,286 respectively.
| Characteristic | Number | Measure |
| Per Capita Income | 2,485 | $27,286 |
| Median Family Income | 549 | $58,964 |
| Mean Family Income | 549 | $77,608 |
| Median Household Income | 1,181 | $50,286 |
| Mean Household Income | 1,181 | $58,688 |
| Income Deficit | 549 | $0 |
| Wage / Income Gap (%) | 2,485 | 45.18% |
| Wage / Income Gap ($) | 2,485 | 54.82¢ per $1 |
| Gini / Inequality Index | 2,485 | 0.37 |
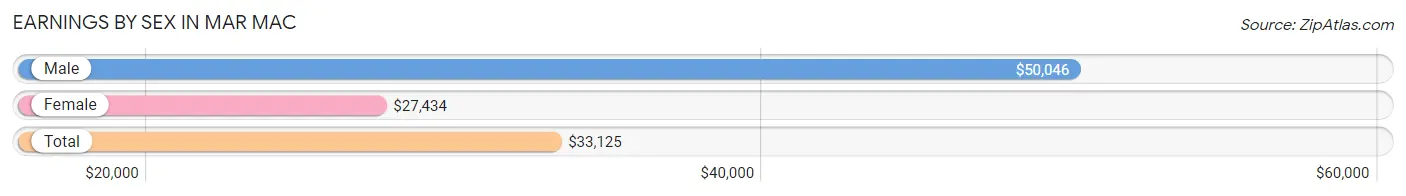
Earnings by Sex in Mar Mac
Average Earnings in Mar Mac are $33,125, $50,046 for men and $27,434 for women, a difference of 45.2%.
| Sex | Number | Average Earnings |
| Male | 508 (47.0%) | $50,046 |
| Female | 573 (53.0%) | $27,434 |
| Total | 1,081 (100.0%) | $33,125 |
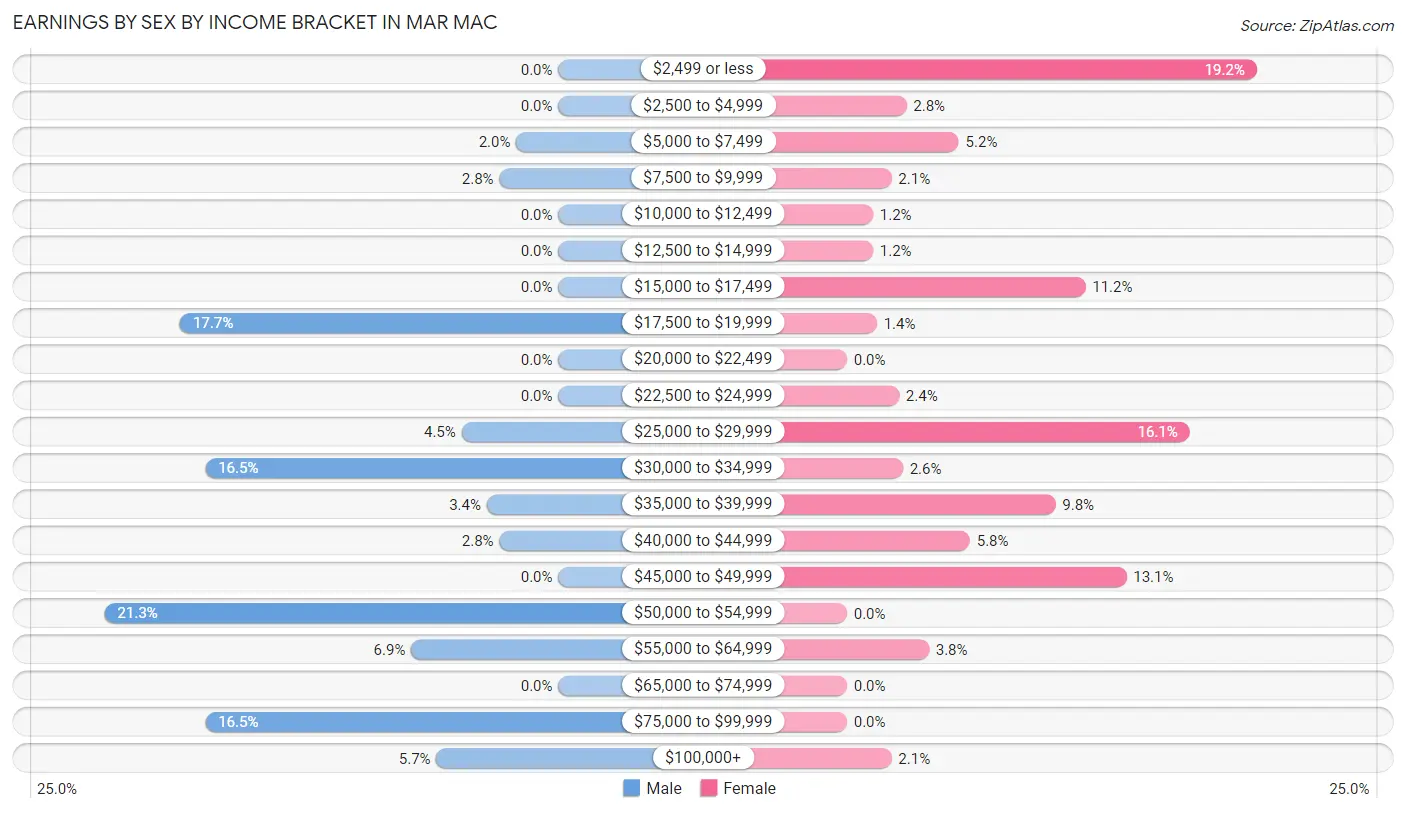
Earnings by Sex by Income Bracket in Mar Mac
The most common earnings brackets in Mar Mac are $50,000 to $54,999 for men (108 | 21.3%) and $2,499 or less for women (110 | 19.2%).
| Income | Male | Female |
| $2,499 or less | 0 (0.0%) | 110 (19.2%) |
| $2,500 to $4,999 | 0 (0.0%) | 16 (2.8%) |
| $5,000 to $7,499 | 10 (2.0%) | 30 (5.2%) |
| $7,500 to $9,999 | 14 (2.8%) | 12 (2.1%) |
| $10,000 to $12,499 | 0 (0.0%) | 7 (1.2%) |
| $12,500 to $14,999 | 0 (0.0%) | 7 (1.2%) |
| $15,000 to $17,499 | 0 (0.0%) | 64 (11.2%) |
| $17,500 to $19,999 | 90 (17.7%) | 8 (1.4%) |
| $20,000 to $22,499 | 0 (0.0%) | 0 (0.0%) |
| $22,500 to $24,999 | 0 (0.0%) | 14 (2.4%) |
| $25,000 to $29,999 | 23 (4.5%) | 92 (16.1%) |
| $30,000 to $34,999 | 84 (16.5%) | 15 (2.6%) |
| $35,000 to $39,999 | 17 (3.4%) | 56 (9.8%) |
| $40,000 to $44,999 | 14 (2.8%) | 33 (5.8%) |
| $45,000 to $49,999 | 0 (0.0%) | 75 (13.1%) |
| $50,000 to $54,999 | 108 (21.3%) | 0 (0.0%) |
| $55,000 to $64,999 | 35 (6.9%) | 22 (3.8%) |
| $65,000 to $74,999 | 0 (0.0%) | 0 (0.0%) |
| $75,000 to $99,999 | 84 (16.5%) | 0 (0.0%) |
| $100,000+ | 29 (5.7%) | 12 (2.1%) |
| Total | 508 (100.0%) | 573 (100.0%) |
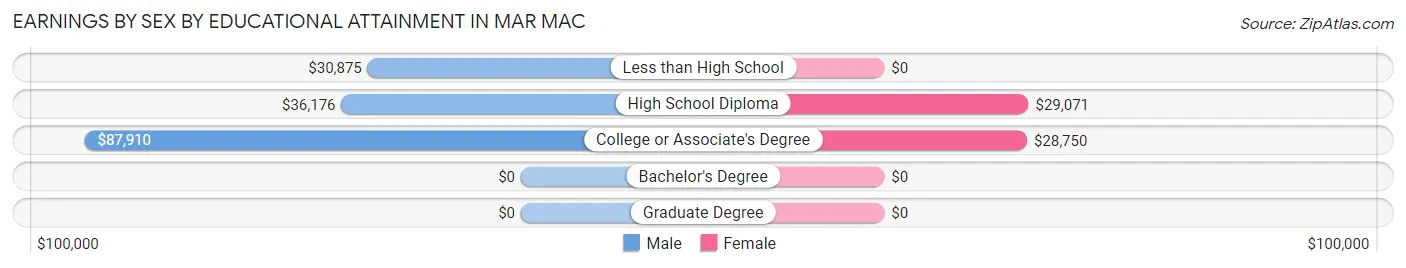
Earnings by Sex by Educational Attainment in Mar Mac
Average earnings in Mar Mac are $34,322 for men and $28,887 for women, a difference of 15.8%. Men with an educational attainment of college or associate's degree enjoy the highest average annual earnings of $87,910, while those with less than high school education earn the least with $30,875. Women with an educational attainment of high school diploma earn the most with the average annual earnings of $29,071, while those with college or associate's degree education have the smallest earnings of $28,750.
| Educational Attainment | Male Income | Female Income |
| Less than High School | $30,875 | $0 |
| High School Diploma | $36,176 | $29,071 |
| College or Associate's Degree | $87,910 | $28,750 |
| Bachelor's Degree | - | - |
| Graduate Degree | - | - |
| Total | $34,322 | $28,887 |
Family Income in Mar Mac
Family Income Brackets in Mar Mac
According to the Mar Mac family income data, there are 188 families falling into the $100,000 to $149,999 income range, which is the most common income bracket and makes up 34.2% of all families.
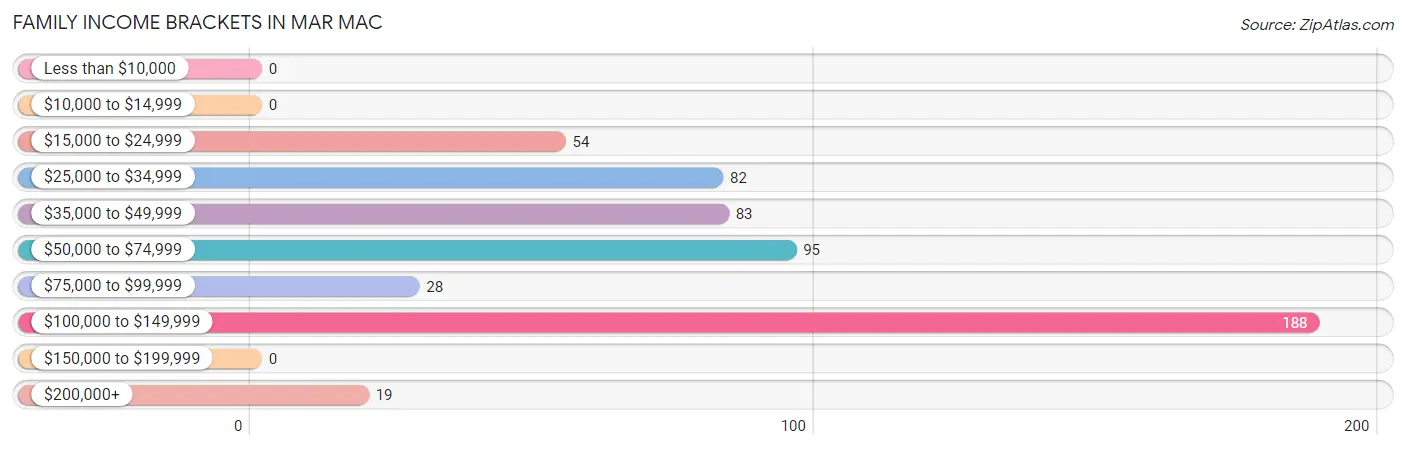
| Income Bracket | # Families | % Families |
| Less than $10,000 | 0 | 0.0% |
| $10,000 to $14,999 | 0 | 0.0% |
| $15,000 to $24,999 | 54 | 9.8% |
| $25,000 to $34,999 | 82 | 14.9% |
| $35,000 to $49,999 | 83 | 15.1% |
| $50,000 to $74,999 | 95 | 17.3% |
| $75,000 to $99,999 | 28 | 5.1% |
| $100,000 to $149,999 | 188 | 34.2% |
| $150,000 to $199,999 | 0 | 0.0% |
| $200,000+ | 19 | 3.5% |
Family Income by Famaliy Size in Mar Mac
4-person families (111 | 20.2%) account for the highest median family income in Mar Mac with $132,929 per family, while 3-person families (48 | 8.7%) have the highest median income of $37,014 per family member.
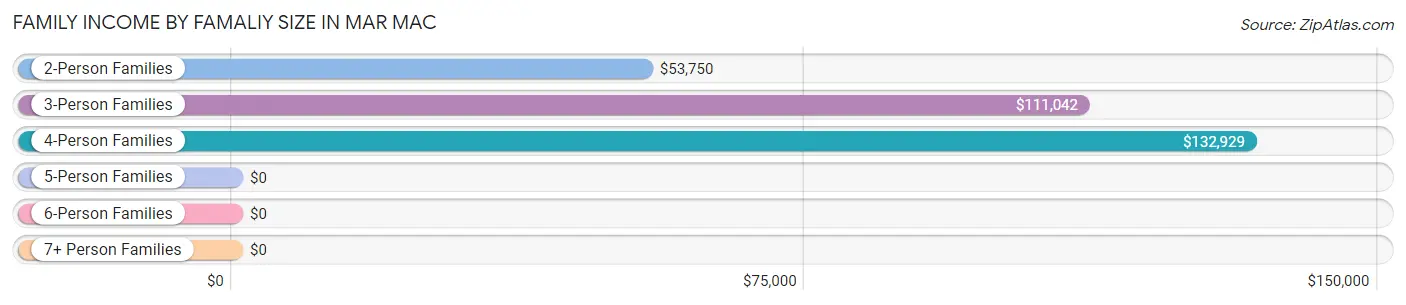
| Income Bracket | # Families | Median Income |
| 2-Person Families | 304 (55.4%) | $53,750 |
| 3-Person Families | 48 (8.7%) | $111,042 |
| 4-Person Families | 111 (20.2%) | $132,929 |
| 5-Person Families | 0 (0.0%) | $0 |
| 6-Person Families | 75 (13.7%) | $0 |
| 7+ Person Families | 11 (2.0%) | $0 |
| Total | 549 (100.0%) | $58,964 |
Family Income by Number of Earners in Mar Mac
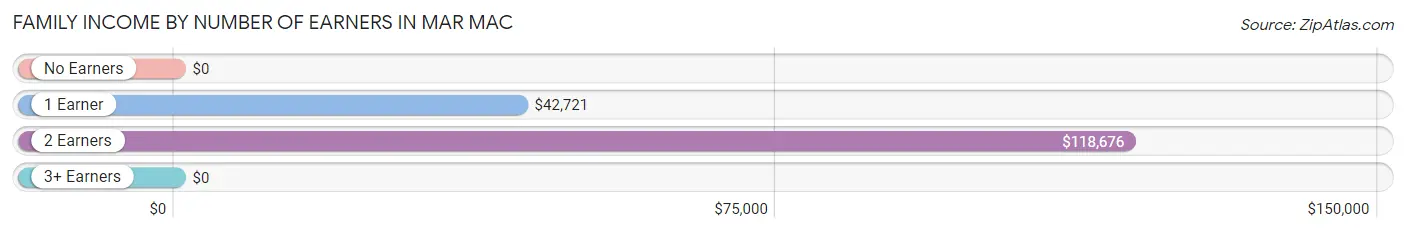
| Number of Earners | # Families | Median Income |
| No Earners | 119 (21.7%) | $0 |
| 1 Earner | 263 (47.9%) | $42,721 |
| 2 Earners | 152 (27.7%) | $118,676 |
| 3+ Earners | 15 (2.7%) | $0 |
| Total | 549 (100.0%) | $58,964 |
Household Income in Mar Mac
Household Income Brackets in Mar Mac
With 314 households falling in the category, the $50,000 to $74,999 income range is the most frequent in Mar Mac, accounting for 26.6% of all households.
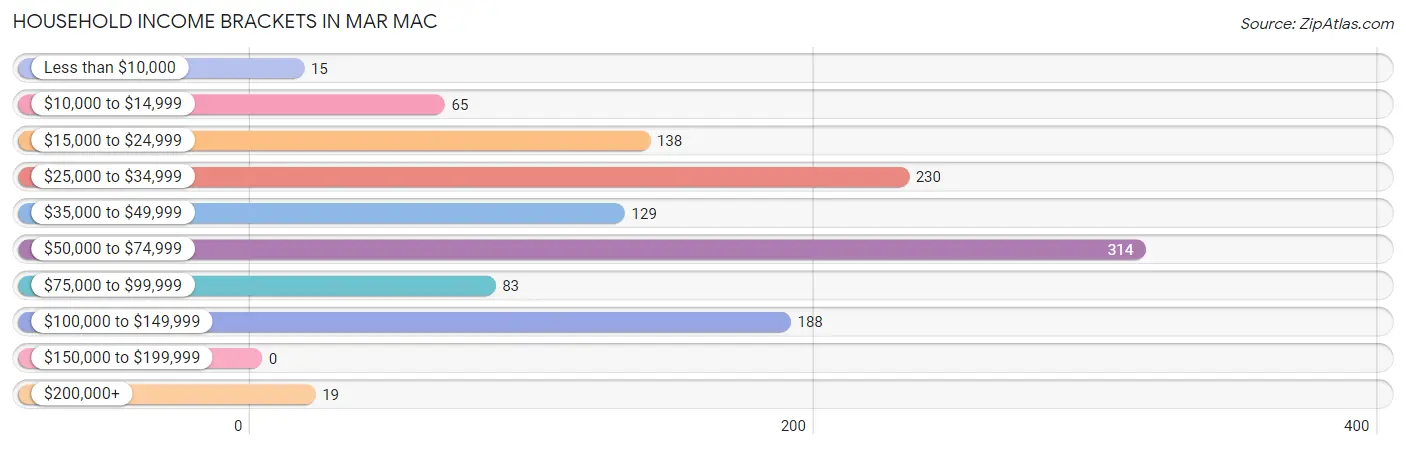
| Income Bracket | # Households | % Households |
| Less than $10,000 | 15 | 1.3% |
| $10,000 to $14,999 | 65 | 5.5% |
| $15,000 to $24,999 | 138 | 11.7% |
| $25,000 to $34,999 | 230 | 19.5% |
| $35,000 to $49,999 | 129 | 10.9% |
| $50,000 to $74,999 | 314 | 26.6% |
| $75,000 to $99,999 | 83 | 7.0% |
| $100,000 to $149,999 | 188 | 15.9% |
| $150,000 to $199,999 | 0 | 0.0% |
| $200,000+ | 19 | 1.6% |
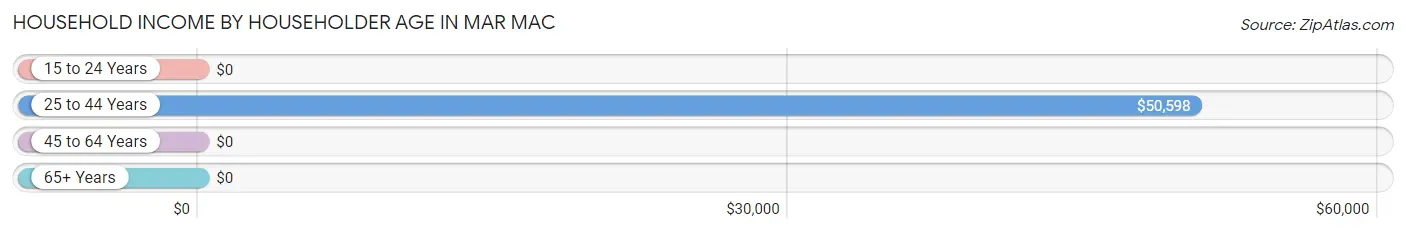
Household Income by Householder Age in Mar Mac
The median household income in Mar Mac is $50,286, with the highest median household income of $50,598 found in the 25 to 44 years age bracket for the primary householder. A total of 395 households (33.5%) fall into this category. Meanwhile, the 15 to 24 years age bracket for the primary householder has the lowest median household income of $0, with 95 households (8.0%) in this group.
| Income Bracket | # Households | Median Income |
| 15 to 24 Years | 95 (8.0%) | $0 |
| 25 to 44 Years | 395 (33.5%) | $50,598 |
| 45 to 64 Years | 300 (25.4%) | $0 |
| 65+ Years | 391 (33.1%) | $0 |
| Total | 1,181 (100.0%) | $50,286 |
Poverty in Mar Mac
Income Below Poverty by Sex and Age in Mar Mac
With 26.0% poverty level for males and 21.2% for females among the residents of Mar Mac, under 5 year old males and 45 to 54 year old females are the most vulnerable to poverty, with 59 males (100.0%) and 80 females (63.5%) in their respective age groups living below the poverty level.
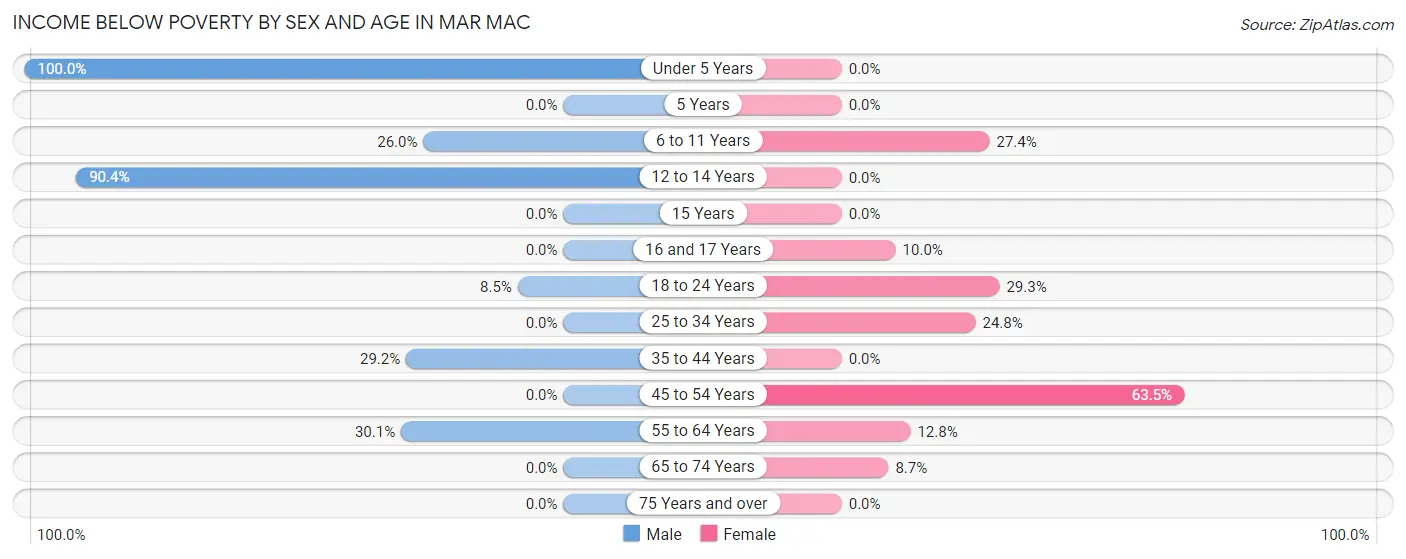
| Age Bracket | Male | Female |
| Under 5 Years | 59 (100.0%) | 0 (0.0%) |
| 5 Years | 0 (0.0%) | 0 (0.0%) |
| 6 to 11 Years | 72 (26.0%) | 48 (27.4%) |
| 12 to 14 Years | 66 (90.4%) | 0 (0.0%) |
| 15 Years | 0 (0.0%) | 0 (0.0%) |
| 16 and 17 Years | 0 (0.0%) | 1 (10.0%) |
| 18 to 24 Years | 10 (8.5%) | 24 (29.3%) |
| 25 to 34 Years | 0 (0.0%) | 68 (24.8%) |
| 35 to 44 Years | 66 (29.2%) | 0 (0.0%) |
| 45 to 54 Years | 0 (0.0%) | 80 (63.5%) |
| 55 to 64 Years | 63 (30.1%) | 13 (12.8%) |
| 65 to 74 Years | 0 (0.0%) | 15 (8.7%) |
| 75 Years and over | 0 (0.0%) | 0 (0.0%) |
| Total | 336 (26.0%) | 249 (21.2%) |
Income Above Poverty by Sex and Age in Mar Mac
According to the poverty statistics in Mar Mac, males aged 25 to 34 years and females aged under 5 years are the age groups that are most secure financially, with 100.0% of males and 100.0% of females in these age groups living above the poverty line.
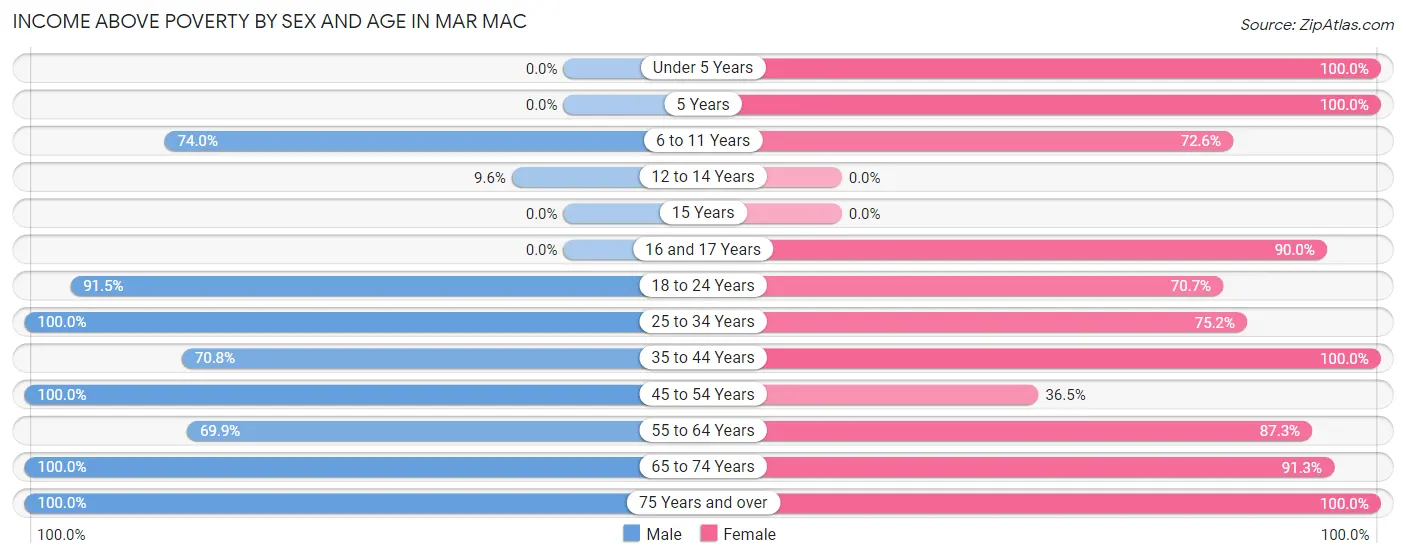
| Age Bracket | Male | Female |
| Under 5 Years | 0 (0.0%) | 46 (100.0%) |
| 5 Years | 0 (0.0%) | 16 (100.0%) |
| 6 to 11 Years | 205 (74.0%) | 127 (72.6%) |
| 12 to 14 Years | 7 (9.6%) | 0 (0.0%) |
| 15 Years | 0 (0.0%) | 0 (0.0%) |
| 16 and 17 Years | 0 (0.0%) | 9 (90.0%) |
| 18 to 24 Years | 108 (91.5%) | 58 (70.7%) |
| 25 to 34 Years | 76 (100.0%) | 206 (75.2%) |
| 35 to 44 Years | 160 (70.8%) | 63 (100.0%) |
| 45 to 54 Years | 88 (100.0%) | 46 (36.5%) |
| 55 to 64 Years | 146 (69.9%) | 89 (87.3%) |
| 65 to 74 Years | 95 (100.0%) | 158 (91.3%) |
| 75 Years and over | 74 (100.0%) | 110 (100.0%) |
| Total | 959 (74.1%) | 928 (78.8%) |
Income Below Poverty Among Married-Couple Families in Mar Mac
The poverty statistics for married-couple families in Mar Mac show that 18.1% or 64 of the total 354 families live below the poverty line. Families with 3 or 4 children have the highest poverty rate of 60.5%, comprising of 52 families. On the other hand, families with 1 or 2 children have the lowest poverty rate of 0.0%, which includes 0 families.

| Children | Above Poverty | Below Poverty |
| No Children | 153 (92.7%) | 12 (7.3%) |
| 1 or 2 Children | 103 (100.0%) | 0 (0.0%) |
| 3 or 4 Children | 34 (39.5%) | 52 (60.5%) |
| 5 or more Children | 0 (0.0%) | 0 (0.0%) |
| Total | 290 (81.9%) | 64 (18.1%) |
Income Below Poverty Among Single-Parent Households in Mar Mac
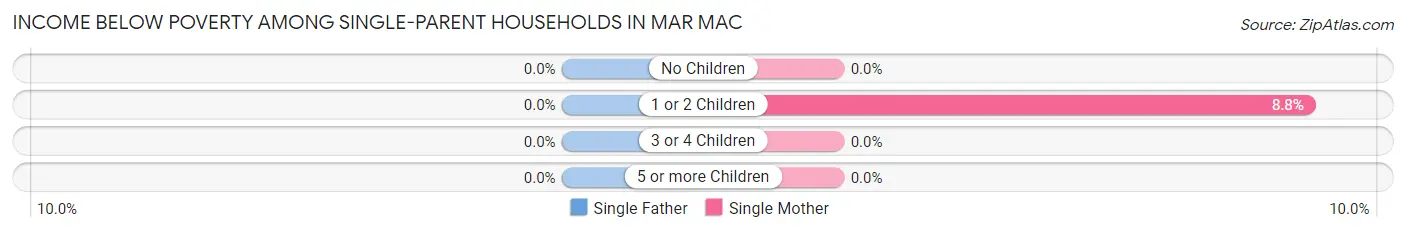
| Children | Single Father | Single Mother |
| No Children | 0 (0.0%) | 0 (0.0%) |
| 1 or 2 Children | 0 (0.0%) | 8 (8.8%) |
| 3 or 4 Children | 0 (0.0%) | 0 (0.0%) |
| 5 or more Children | 0 (0.0%) | 0 (0.0%) |
| Total | 0 (0.0%) | 8 (5.6%) |
Income Below Poverty Among Married-Couple vs Single-Parent Households in Mar Mac
The poverty data for Mar Mac shows that 64 of the married-couple family households (18.1%) and 8 of the single-parent households (4.1%) are living below the poverty level. Within the married-couple family households, those with 3 or 4 children have the highest poverty rate, with 52 households (60.5%) falling below the poverty line. Among the single-parent households, those with 1 or 2 children have the highest poverty rate, with 8 household (7.0%) living below poverty.
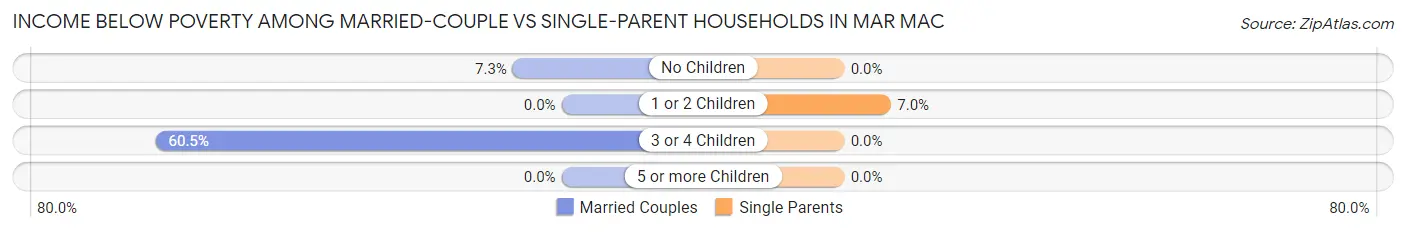
| Children | Married-Couple Families | Single-Parent Households |
| No Children | 12 (7.3%) | 0 (0.0%) |
| 1 or 2 Children | 0 (0.0%) | 8 (7.0%) |
| 3 or 4 Children | 52 (60.5%) | 0 (0.0%) |
| 5 or more Children | 0 (0.0%) | 0 (0.0%) |
| Total | 64 (18.1%) | 8 (4.1%) |
Race in Mar Mac
The most populous races in Mar Mac are White / Caucasian (1,684 | 67.8%), Black / African American (628 | 25.3%), and Hispanic or Latino (539 | 21.7%).
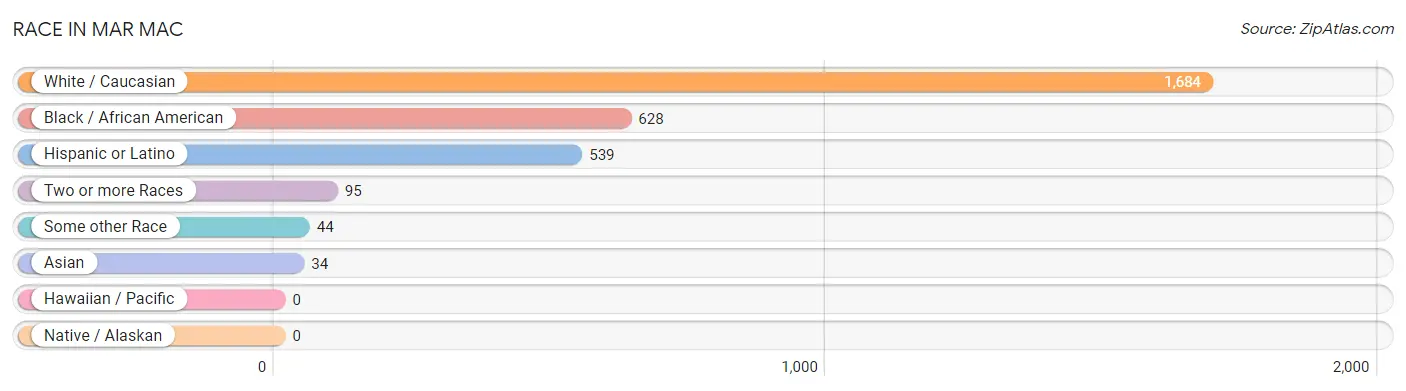
| Race | # Population | % Population |
| Asian | 34 | 1.4% |
| Black / African American | 628 | 25.3% |
| Hawaiian / Pacific | 0 | 0.0% |
| Hispanic or Latino | 539 | 21.7% |
| Native / Alaskan | 0 | 0.0% |
| White / Caucasian | 1,684 | 67.8% |
| Two or more Races | 95 | 3.8% |
| Some other Race | 44 | 1.8% |
| Total | 2,485 | 100.0% |
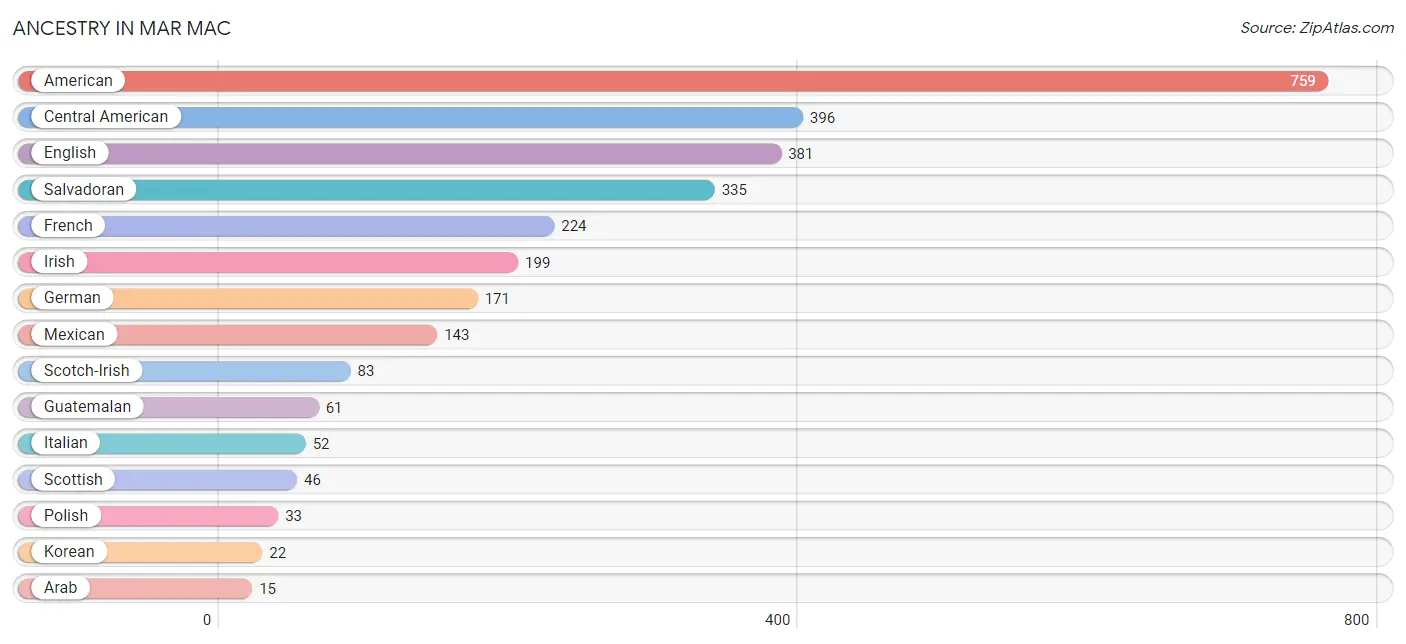
Ancestry in Mar Mac
The most populous ancestries reported in Mar Mac are American (759 | 30.5%), Central American (396 | 15.9%), English (381 | 15.3%), Salvadoran (335 | 13.5%), and French (224 | 9.0%), together accounting for 84.3% of all Mar Mac residents.
| Ancestry | # Population | % Population |
| American | 759 | 30.5% |
| Arab | 15 | 0.6% |
| British | 12 | 0.5% |
| Burmese | 12 | 0.5% |
| Canadian | 14 | 0.6% |
| Central American | 396 | 15.9% |
| Egyptian | 15 | 0.6% |
| English | 381 | 15.3% |
| French | 224 | 9.0% |
| French Canadian | 10 | 0.4% |
| German | 171 | 6.9% |
| Guatemalan | 61 | 2.5% |
| Irish | 199 | 8.0% |
| Italian | 52 | 2.1% |
| Korean | 22 | 0.9% |
| Lithuanian | 11 | 0.4% |
| Mexican | 143 | 5.8% |
| Polish | 33 | 1.3% |
| Salvadoran | 335 | 13.5% |
| Scotch-Irish | 83 | 3.3% |
| Scottish | 46 | 1.8% |
| Yugoslavian | 15 | 0.6% | View All 22 Rows |
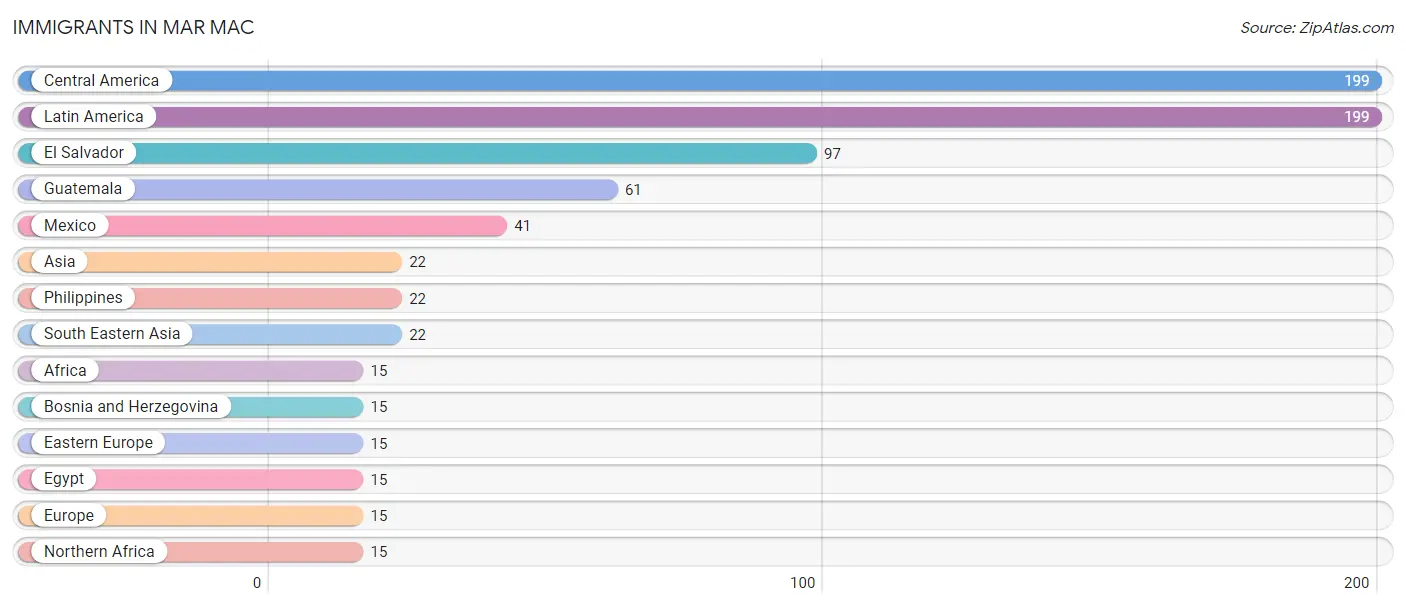
Immigrants in Mar Mac
The most numerous immigrant groups reported in Mar Mac came from Central America (199 | 8.0%), Latin America (199 | 8.0%), El Salvador (97 | 3.9%), Guatemala (61 | 2.5%), and Mexico (41 | 1.7%), together accounting for 24.0% of all Mar Mac residents.
| Immigration Origin | # Population | % Population |
| Africa | 15 | 0.6% |
| Asia | 22 | 0.9% |
| Bosnia and Herzegovina | 15 | 0.6% |
| Central America | 199 | 8.0% |
| Eastern Europe | 15 | 0.6% |
| Egypt | 15 | 0.6% |
| El Salvador | 97 | 3.9% |
| Europe | 15 | 0.6% |
| Guatemala | 61 | 2.5% |
| Latin America | 199 | 8.0% |
| Mexico | 41 | 1.7% |
| Northern Africa | 15 | 0.6% |
| Philippines | 22 | 0.9% |
| South Eastern Asia | 22 | 0.9% | View All 14 Rows |
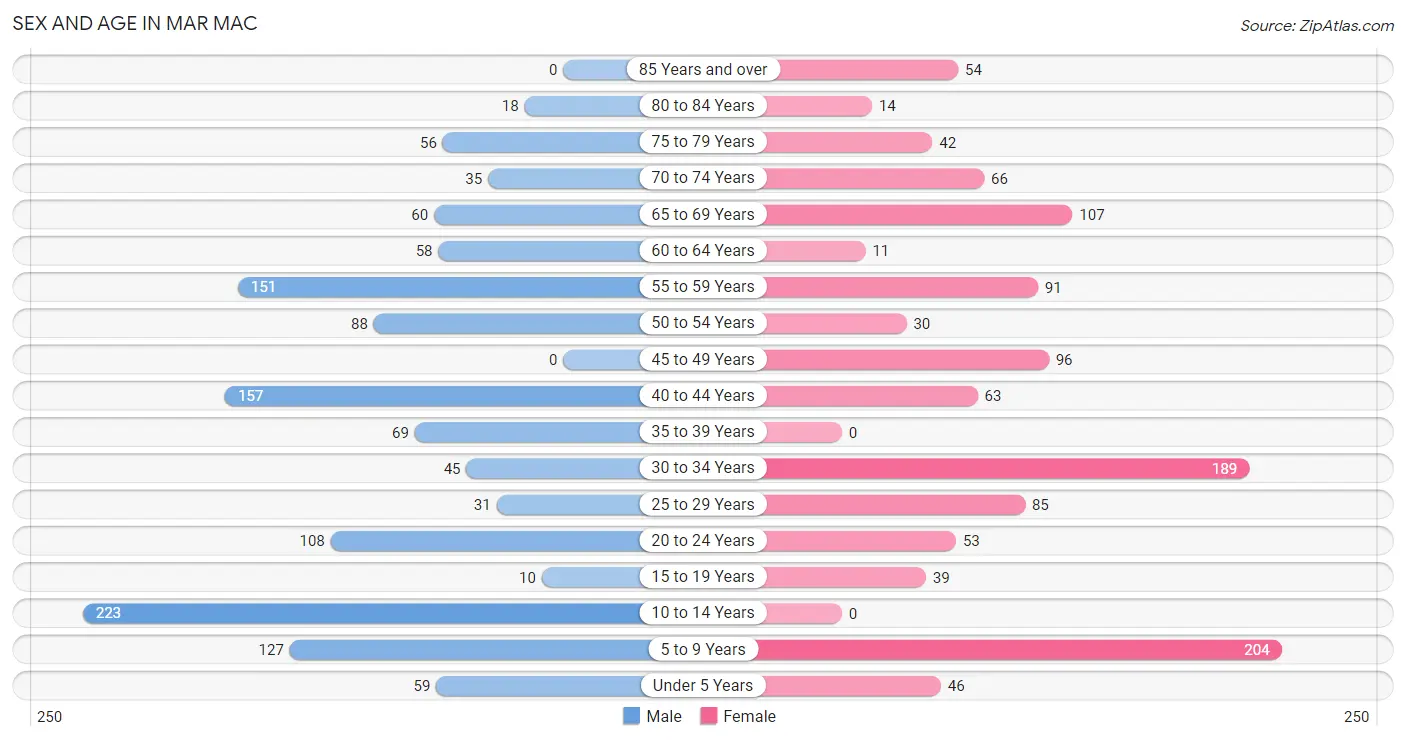
Sex and Age in Mar Mac
Sex and Age in Mar Mac
The most populous age groups in Mar Mac are 10 to 14 Years (223 | 17.2%) for men and 5 to 9 Years (204 | 17.1%) for women.
| Age Bracket | Male | Female |
| Under 5 Years | 59 (4.6%) | 46 (3.9%) |
| 5 to 9 Years | 127 (9.8%) | 204 (17.1%) |
| 10 to 14 Years | 223 (17.2%) | 0 (0.0%) |
| 15 to 19 Years | 10 (0.8%) | 39 (3.3%) |
| 20 to 24 Years | 108 (8.3%) | 53 (4.4%) |
| 25 to 29 Years | 31 (2.4%) | 85 (7.1%) |
| 30 to 34 Years | 45 (3.5%) | 189 (15.9%) |
| 35 to 39 Years | 69 (5.3%) | 0 (0.0%) |
| 40 to 44 Years | 157 (12.1%) | 63 (5.3%) |
| 45 to 49 Years | 0 (0.0%) | 96 (8.1%) |
| 50 to 54 Years | 88 (6.8%) | 30 (2.5%) |
| 55 to 59 Years | 151 (11.7%) | 91 (7.6%) |
| 60 to 64 Years | 58 (4.5%) | 11 (0.9%) |
| 65 to 69 Years | 60 (4.6%) | 107 (9.0%) |
| 70 to 74 Years | 35 (2.7%) | 66 (5.6%) |
| 75 to 79 Years | 56 (4.3%) | 42 (3.5%) |
| 80 to 84 Years | 18 (1.4%) | 14 (1.2%) |
| 85 Years and over | 0 (0.0%) | 54 (4.5%) |
| Total | 1,295 (100.0%) | 1,190 (100.0%) |
Families and Households in Mar Mac
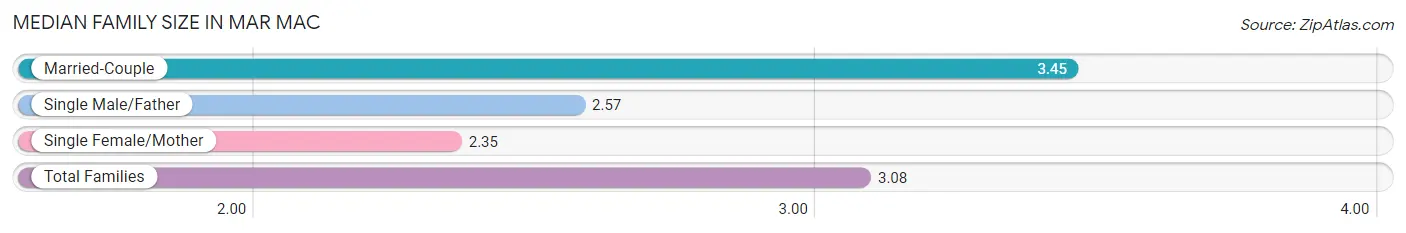
Median Family Size in Mar Mac
The median family size in Mar Mac is 3.08 persons per family, with married-couple families (354 | 64.5%) accounting for the largest median family size of 3.45 persons per family. On the other hand, single female/mother families (144 | 26.2%) represent the smallest median family size with 2.35 persons per family.
| Family Type | # Families | Family Size |
| Married-Couple | 354 (64.5%) | 3.45 |
| Single Male/Father | 51 (9.3%) | 2.57 |
| Single Female/Mother | 144 (26.2%) | 2.35 |
| Total Families | 549 (100.0%) | 3.08 |
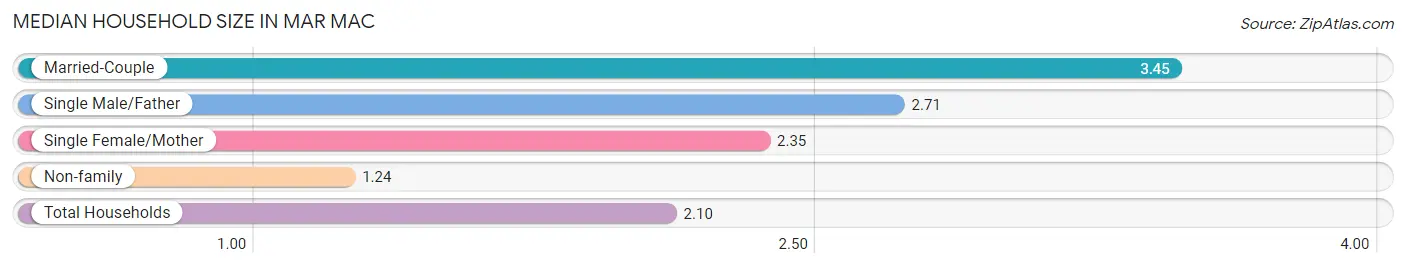
Median Household Size in Mar Mac
The median household size in Mar Mac is 2.10 persons per household, with married-couple households (354 | 30.0%) accounting for the largest median household size of 3.45 persons per household. non-family households (632 | 53.5%) represent the smallest median household size with 1.24 persons per household.
| Household Type | # Households | Household Size |
| Married-Couple | 354 (30.0%) | 3.45 |
| Single Male/Father | 51 (4.3%) | 2.71 |
| Single Female/Mother | 144 (12.2%) | 2.35 |
| Non-family | 632 (53.5%) | 1.24 |
| Total Households | 1,181 (100.0%) | 2.10 |
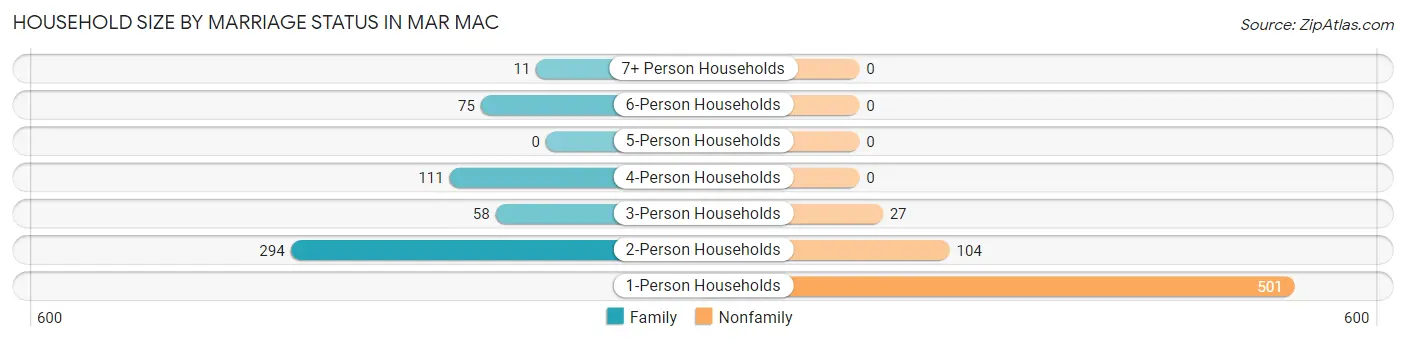
Household Size by Marriage Status in Mar Mac
Out of a total of 1,181 households in Mar Mac, 549 (46.5%) are family households, while 632 (53.5%) are nonfamily households. The most numerous type of family households are 2-person households, comprising 294, and the most common type of nonfamily households are 1-person households, comprising 501.
| Household Size | Family Households | Nonfamily Households |
| 1-Person Households | - | 501 (42.4%) |
| 2-Person Households | 294 (24.9%) | 104 (8.8%) |
| 3-Person Households | 58 (4.9%) | 27 (2.3%) |
| 4-Person Households | 111 (9.4%) | 0 (0.0%) |
| 5-Person Households | 0 (0.0%) | 0 (0.0%) |
| 6-Person Households | 75 (6.4%) | 0 (0.0%) |
| 7+ Person Households | 11 (0.9%) | 0 (0.0%) |
| Total | 549 (46.5%) | 632 (53.5%) |
Female Fertility in Mar Mac
Fertility by Age in Mar Mac
Average fertility rate in Mar Mac is 11.0 births per 1,000 women. Women in the age bracket of 20 to 34 years have the highest fertility rate with 18.0 births per 1,000 women. Women in the age bracket of 20 to 34 years acount for 100.0% of all women with births.
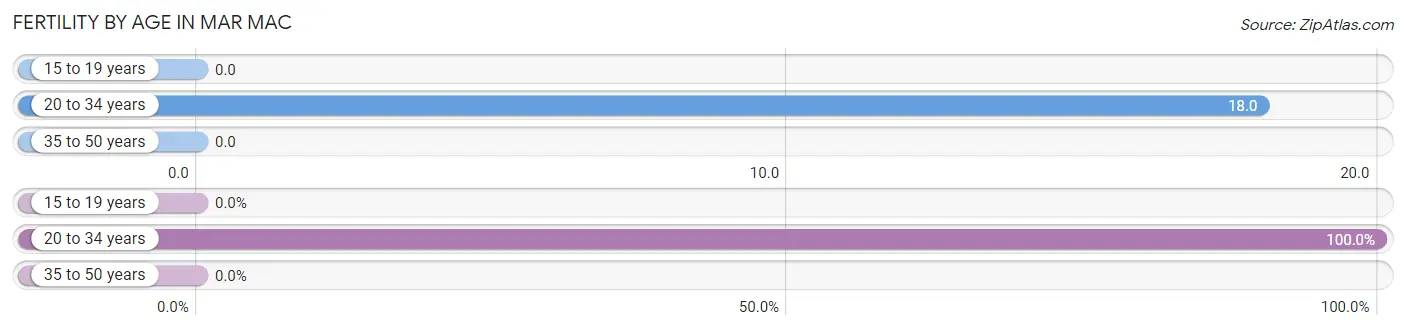
| Age Bracket | Women with Births | Births / 1,000 Women |
| 15 to 19 years | 0 (0.0%) | 0.0 |
| 20 to 34 years | 6 (100.0%) | 18.0 |
| 35 to 50 years | 0 (0.0%) | 0.0 |
| Total | 6 (100.0%) | 11.0 |
Fertility by Age by Marriage Status in Mar Mac
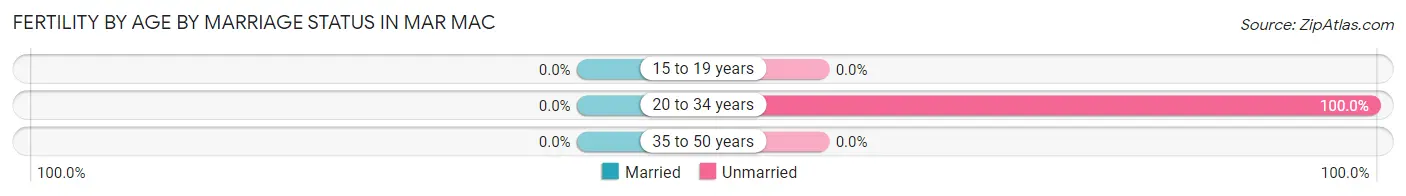
| Age Bracket | Married | Unmarried |
| 15 to 19 years | 0 (0.0%) | 0 (0.0%) |
| 20 to 34 years | 0 (0.0%) | 6 (100.0%) |
| 35 to 50 years | 0 (0.0%) | 0 (0.0%) |
| Total | 0 (0.0%) | 6 (100.0%) |
Fertility by Education in Mar Mac
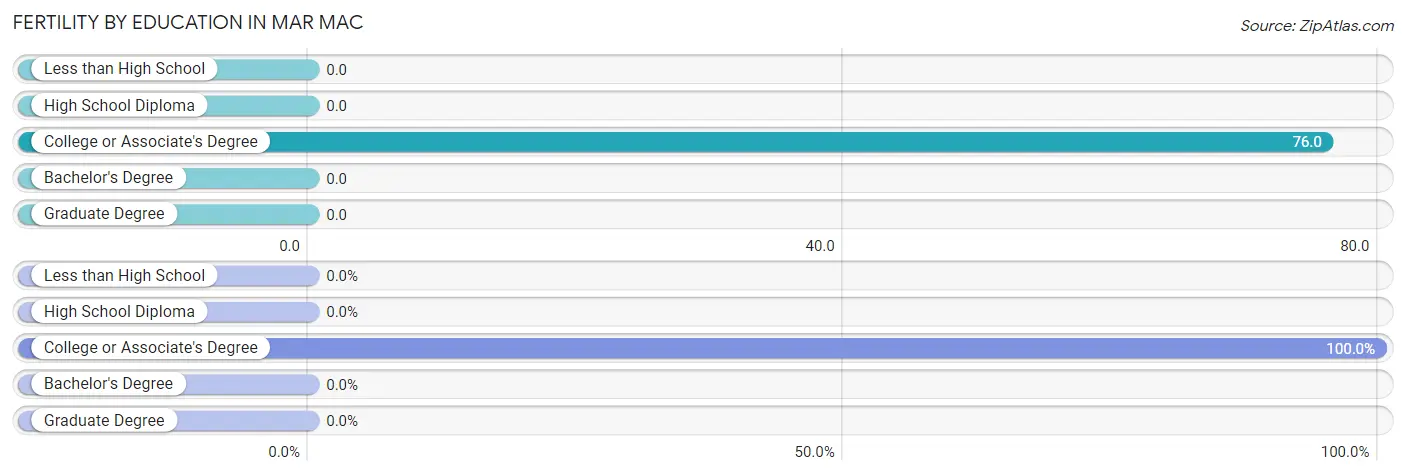
| Educational Attainment | Women with Births | Births / 1,000 Women |
| Less than High School | 0 (0.0%) | 0.0 |
| High School Diploma | 0 (0.0%) | 0.0 |
| College or Associate's Degree | 6 (100.0%) | 76.0 |
| Bachelor's Degree | 0 (0.0%) | 0.0 |
| Graduate Degree | 0 (0.0%) | 0.0 |
| Total | 6 (100.0%) | 11.0 |
Fertility by Education by Marriage Status in Mar Mac
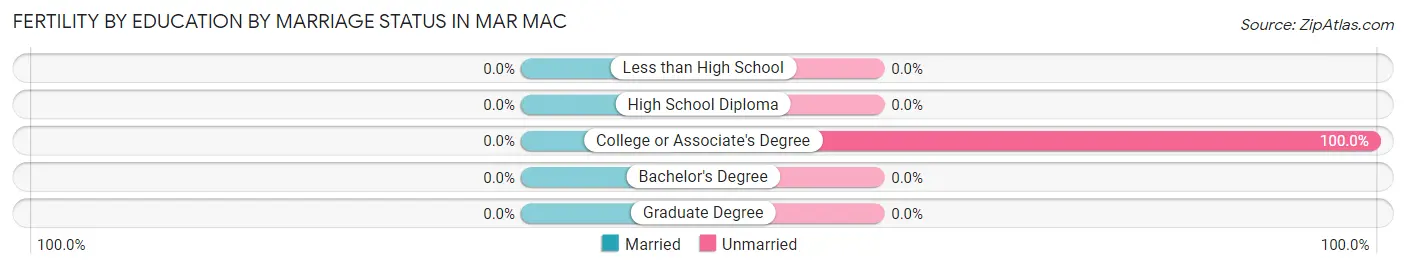
| Educational Attainment | Married | Unmarried |
| Less than High School | 0 (0.0%) | 0 (0.0%) |
| High School Diploma | 0 (0.0%) | 0 (0.0%) |
| College or Associate's Degree | 0 (0.0%) | 6 (100.0%) |
| Bachelor's Degree | 0 (0.0%) | 0 (0.0%) |
| Graduate Degree | 0 (0.0%) | 0 (0.0%) |
| Total | 0 (0.0%) | 6 (100.0%) |
Employment Characteristics in Mar Mac
Employment by Class of Employer in Mar Mac
Among the 918 employed individuals in Mar Mac, private company employees (761 | 82.9%), federal government employees (95 | 10.3%), and state government employees (29 | 3.2%) make up the most common classes of employment.
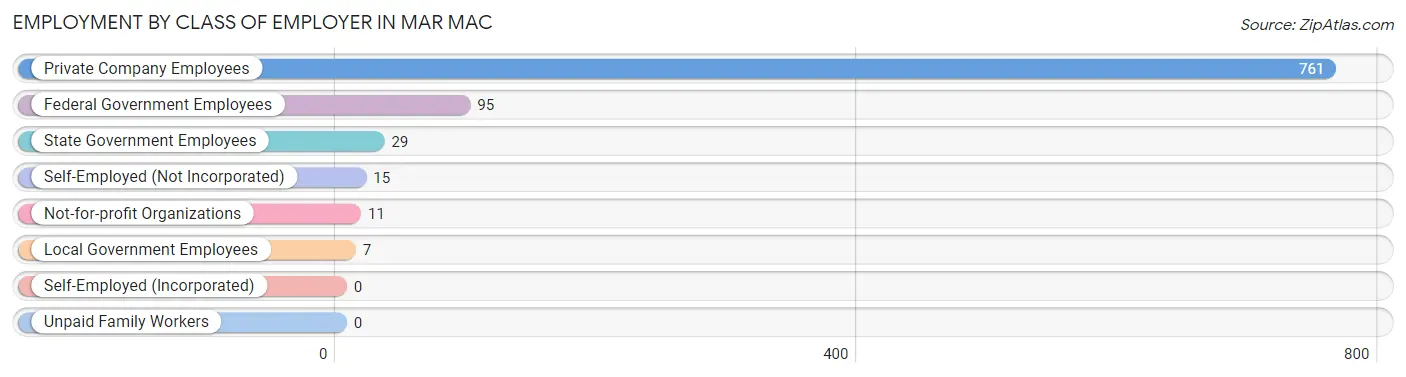
| Employer Class | # Employees | % Employees |
| Private Company Employees | 761 | 82.9% |
| Self-Employed (Incorporated) | 0 | 0.0% |
| Self-Employed (Not Incorporated) | 15 | 1.6% |
| Not-for-profit Organizations | 11 | 1.2% |
| Local Government Employees | 7 | 0.8% |
| State Government Employees | 29 | 3.2% |
| Federal Government Employees | 95 | 10.3% |
| Unpaid Family Workers | 0 | 0.0% |
| Total | 918 | 100.0% |
Employment Status by Age in Mar Mac
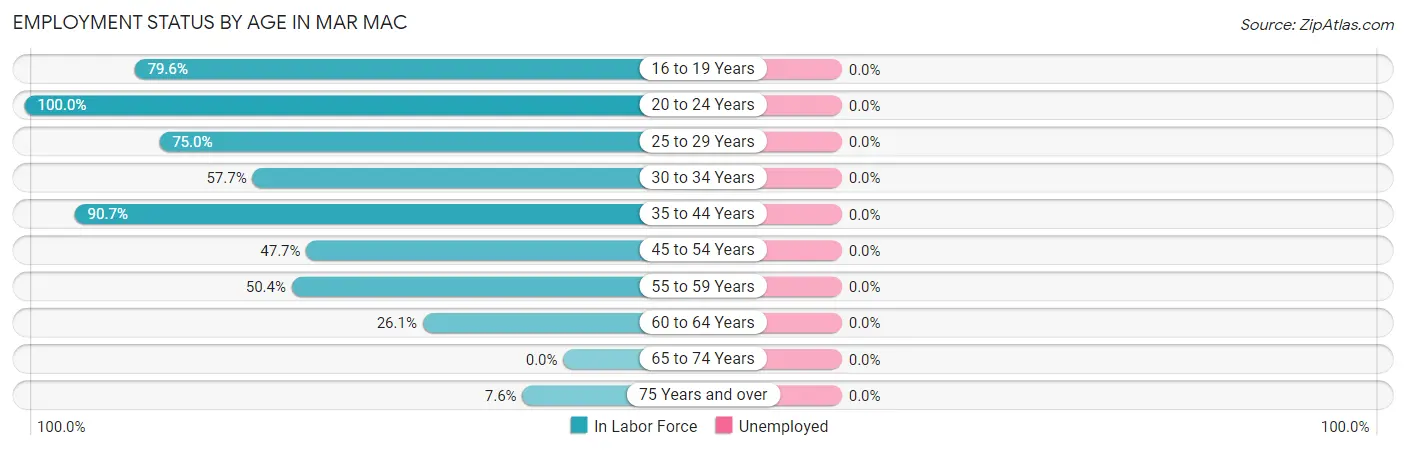
| Age Bracket | In Labor Force | Unemployed |
| 16 to 19 Years | 39 (79.6%) | 0 (0.0%) |
| 20 to 24 Years | 161 (100.0%) | 0 (0.0%) |
| 25 to 29 Years | 87 (75.0%) | 0 (0.0%) |
| 30 to 34 Years | 135 (57.7%) | 0 (0.0%) |
| 35 to 44 Years | 262 (90.7%) | 0 (0.0%) |
| 45 to 54 Years | 102 (47.7%) | 0 (0.0%) |
| 55 to 59 Years | 122 (50.4%) | 0 (0.0%) |
| 60 to 64 Years | 18 (26.1%) | 0 (0.0%) |
| 65 to 74 Years | 0 (0.0%) | 0 (0.0%) |
| 75 Years and over | 14 (7.6%) | 0 (0.0%) |
| Total | 940 (51.5%) | 0 (0.0%) |
Employment Status by Educational Attainment in Mar Mac
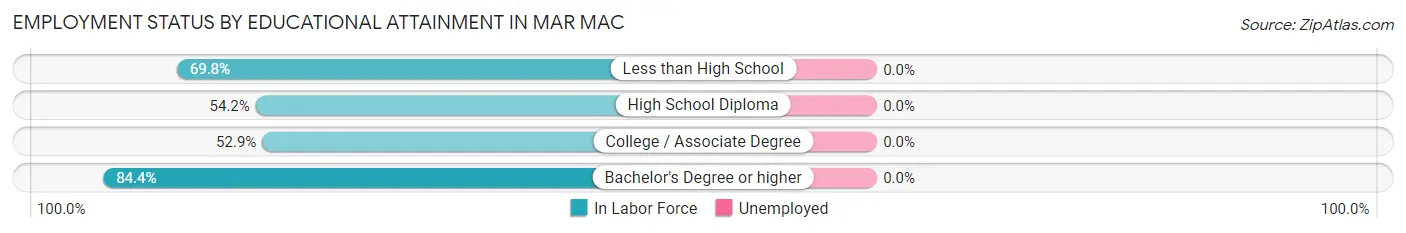
| Educational Attainment | In Labor Force | Unemployed |
| Less than High School | 194 (69.8%) | 0 (0.0%) |
| High School Diploma | 195 (54.2%) | 0 (0.0%) |
| College / Associate Degree | 180 (52.9%) | 0 (0.0%) |
| Bachelor's Degree or higher | 157 (84.4%) | 0 (0.0%) |
| Total | 726 (62.4%) | 0 (0.0%) |
Employment Occupations by Sex in Mar Mac
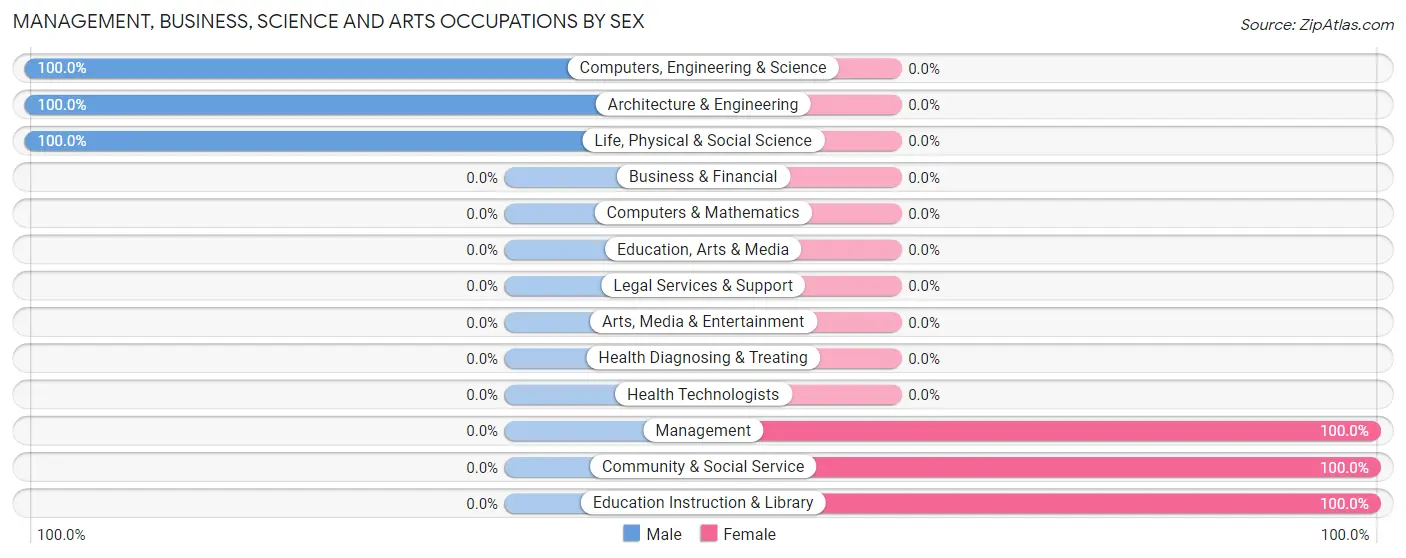
Management, Business, Science and Arts Occupations
The most common Management, Business, Science and Arts occupations in Mar Mac are Management (64 | 7.6%), Computers, Engineering & Science (42 | 5.0%), Life, Physical & Social Science (29 | 3.4%), Architecture & Engineering (13 | 1.5%), and Community & Social Service (11 | 1.3%).
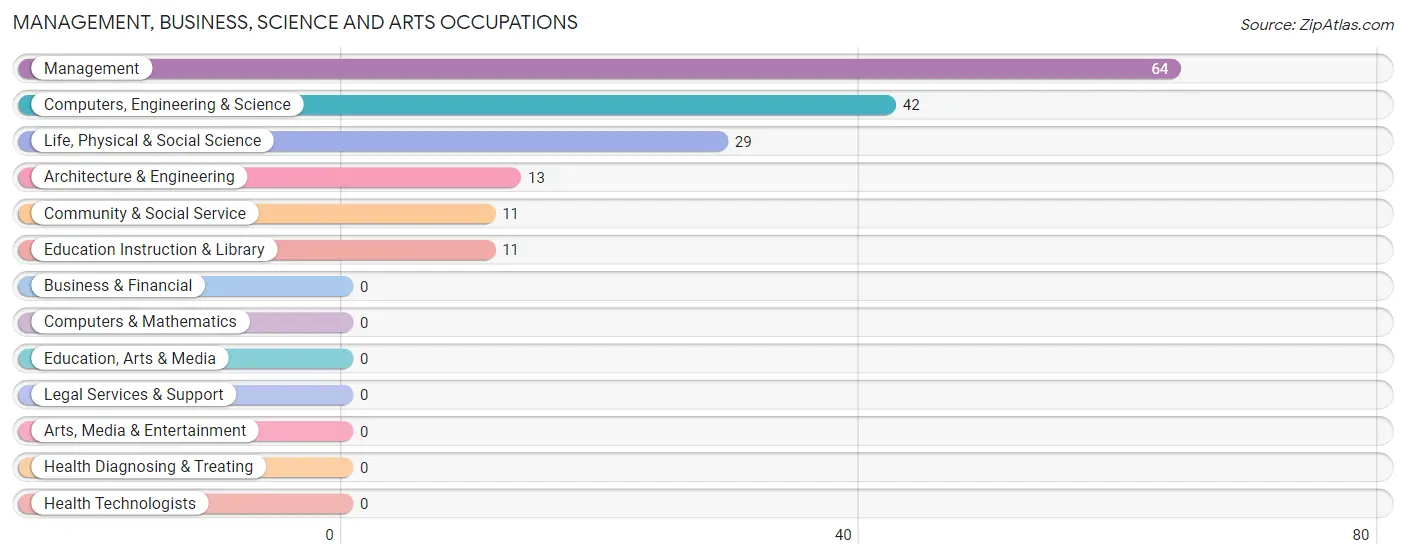
Management, Business, Science and Arts Occupations by Sex
Within the Management, Business, Science and Arts occupations in Mar Mac, the most male-oriented occupations are Computers, Engineering & Science (100.0%), Architecture & Engineering (100.0%), and Life, Physical & Social Science (100.0%), while the most female-oriented occupations are Management (100.0%), Community & Social Service (100.0%), and Education Instruction & Library (100.0%).
| Occupation | Male | Female |
| Management | 0 (0.0%) | 64 (100.0%) |
| Business & Financial | 0 (0.0%) | 0 (0.0%) |
| Computers, Engineering & Science | 42 (100.0%) | 0 (0.0%) |
| Computers & Mathematics | 0 (0.0%) | 0 (0.0%) |
| Architecture & Engineering | 13 (100.0%) | 0 (0.0%) |
| Life, Physical & Social Science | 29 (100.0%) | 0 (0.0%) |
| Community & Social Service | 0 (0.0%) | 11 (100.0%) |
| Education, Arts & Media | 0 (0.0%) | 0 (0.0%) |
| Legal Services & Support | 0 (0.0%) | 0 (0.0%) |
| Education Instruction & Library | 0 (0.0%) | 11 (100.0%) |
| Arts, Media & Entertainment | 0 (0.0%) | 0 (0.0%) |
| Health Diagnosing & Treating | 0 (0.0%) | 0 (0.0%) |
| Health Technologists | 0 (0.0%) | 0 (0.0%) |
| Total (Category) | 42 (35.9%) | 75 (64.1%) |
| Total (Overall) | 413 (48.9%) | 432 (51.1%) |
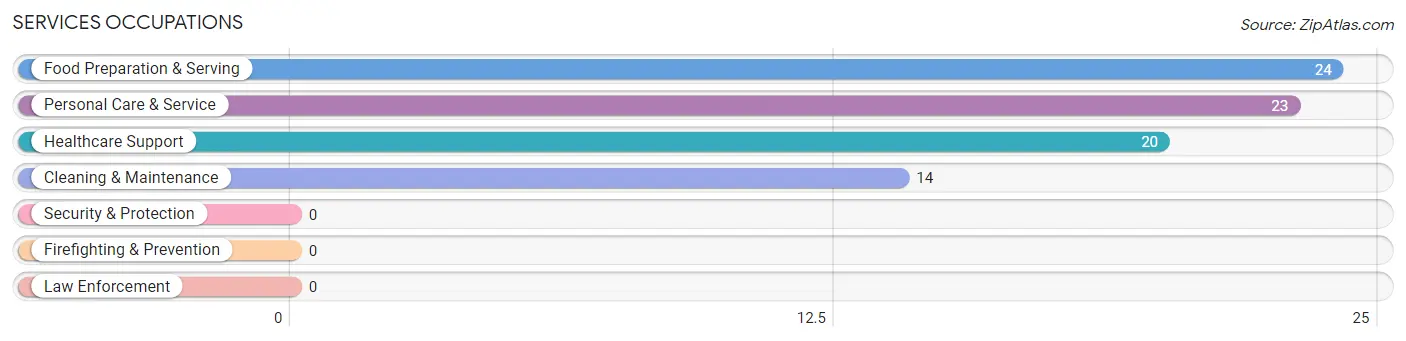
Services Occupations
The most common Services occupations in Mar Mac are Food Preparation & Serving (24 | 2.8%), Personal Care & Service (23 | 2.7%), Healthcare Support (20 | 2.4%), and Cleaning & Maintenance (14 | 1.7%).
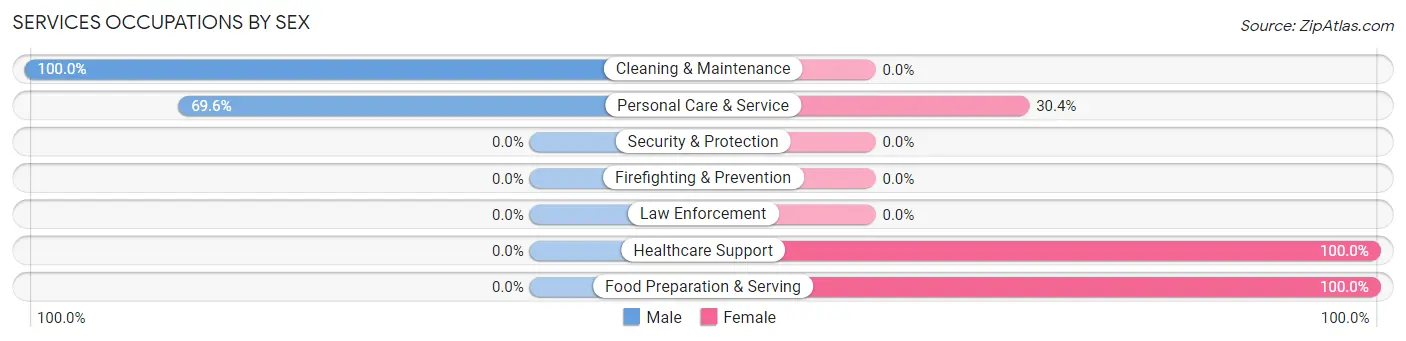
Services Occupations by Sex
Within the Services occupations in Mar Mac, the most male-oriented occupations are Cleaning & Maintenance (100.0%), and Personal Care & Service (69.6%), while the most female-oriented occupations are Healthcare Support (100.0%), Food Preparation & Serving (100.0%), and Personal Care & Service (30.4%).
| Occupation | Male | Female |
| Healthcare Support | 0 (0.0%) | 20 (100.0%) |
| Security & Protection | 0 (0.0%) | 0 (0.0%) |
| Firefighting & Prevention | 0 (0.0%) | 0 (0.0%) |
| Law Enforcement | 0 (0.0%) | 0 (0.0%) |
| Food Preparation & Serving | 0 (0.0%) | 24 (100.0%) |
| Cleaning & Maintenance | 14 (100.0%) | 0 (0.0%) |
| Personal Care & Service | 16 (69.6%) | 7 (30.4%) |
| Total (Category) | 30 (37.0%) | 51 (63.0%) |
| Total (Overall) | 413 (48.9%) | 432 (51.1%) |
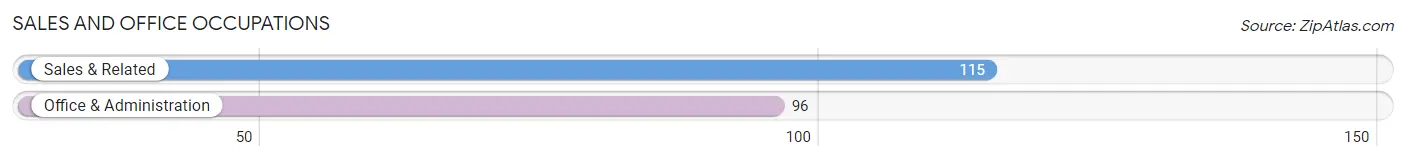
Sales and Office Occupations
The most common Sales and Office occupations in Mar Mac are Sales & Related (115 | 13.6%), and Office & Administration (96 | 11.4%).
Sales and Office Occupations by Sex
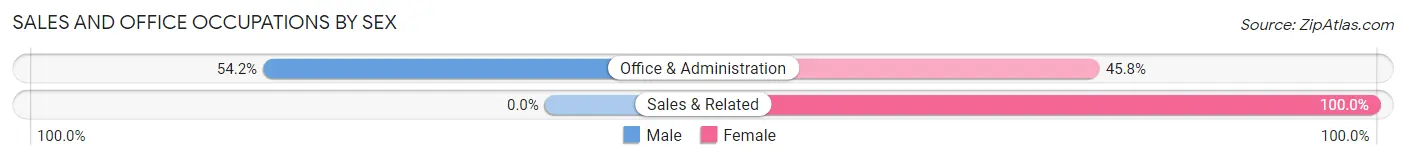
| Occupation | Male | Female |
| Sales & Related | 0 (0.0%) | 115 (100.0%) |
| Office & Administration | 52 (54.2%) | 44 (45.8%) |
| Total (Category) | 52 (24.6%) | 159 (75.4%) |
| Total (Overall) | 413 (48.9%) | 432 (51.1%) |
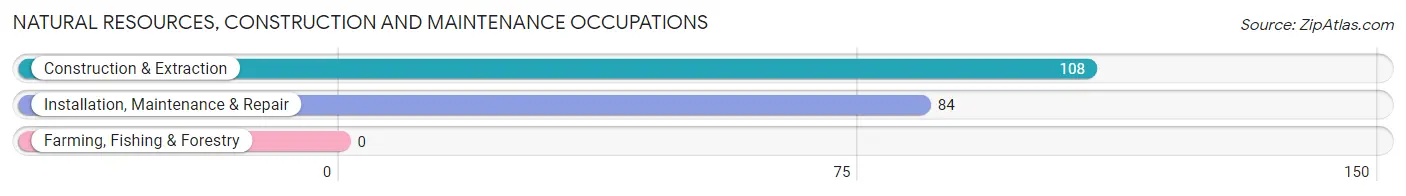
Natural Resources, Construction and Maintenance Occupations
The most common Natural Resources, Construction and Maintenance occupations in Mar Mac are Construction & Extraction (108 | 12.8%), and Installation, Maintenance & Repair (84 | 9.9%).
Natural Resources, Construction and Maintenance Occupations by Sex
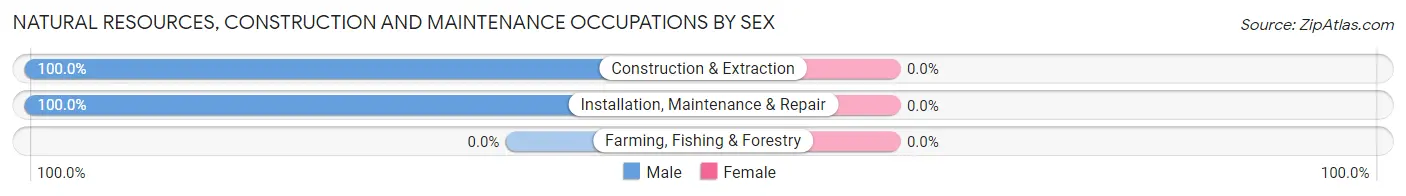
| Occupation | Male | Female |
| Farming, Fishing & Forestry | 0 (0.0%) | 0 (0.0%) |
| Construction & Extraction | 108 (100.0%) | 0 (0.0%) |
| Installation, Maintenance & Repair | 84 (100.0%) | 0 (0.0%) |
| Total (Category) | 192 (100.0%) | 0 (0.0%) |
| Total (Overall) | 413 (48.9%) | 432 (51.1%) |
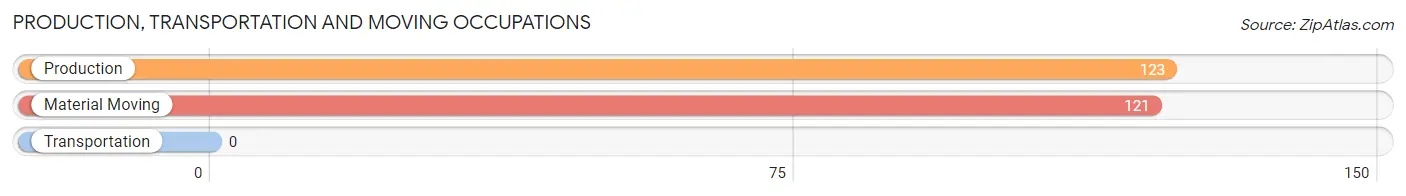
Production, Transportation and Moving Occupations
The most common Production, Transportation and Moving occupations in Mar Mac are Production (123 | 14.6%), and Material Moving (121 | 14.3%).
Production, Transportation and Moving Occupations by Sex
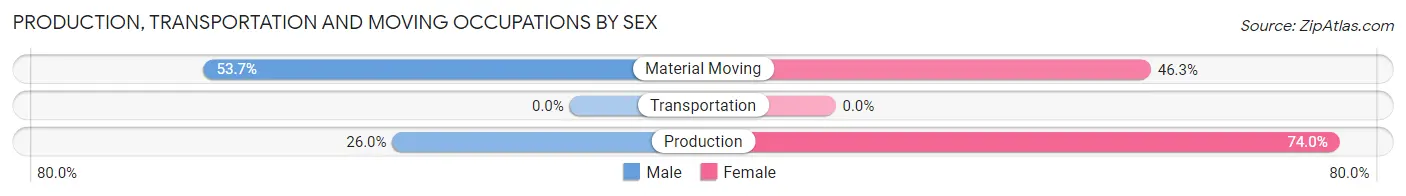
| Occupation | Male | Female |
| Production | 32 (26.0%) | 91 (74.0%) |
| Transportation | 0 (0.0%) | 0 (0.0%) |
| Material Moving | 65 (53.7%) | 56 (46.3%) |
| Total (Category) | 97 (39.8%) | 147 (60.3%) |
| Total (Overall) | 413 (48.9%) | 432 (51.1%) |
Employment Industries by Sex in Mar Mac
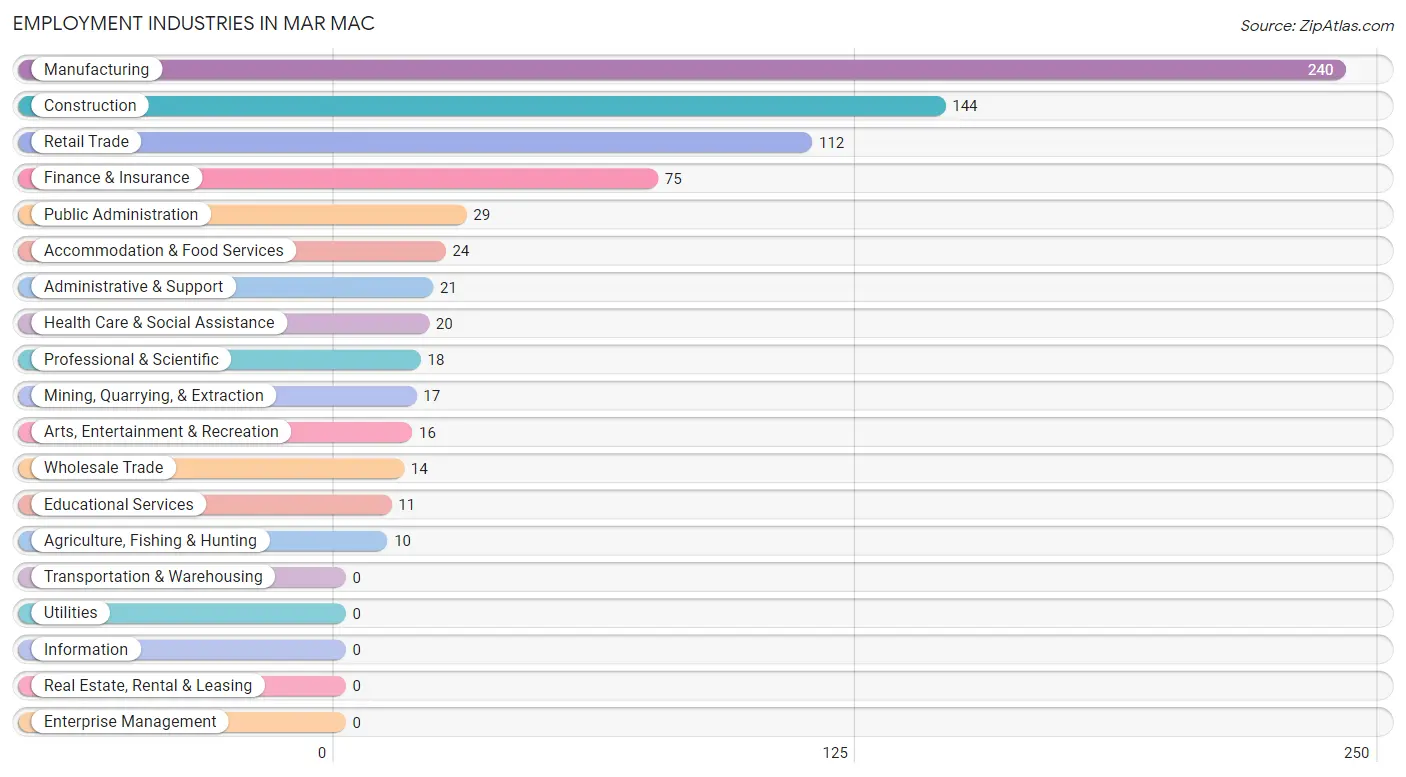
Employment Industries in Mar Mac
The major employment industries in Mar Mac include Manufacturing (240 | 28.4%), Construction (144 | 17.0%), Retail Trade (112 | 13.3%), Finance & Insurance (75 | 8.9%), and Public Administration (29 | 3.4%).
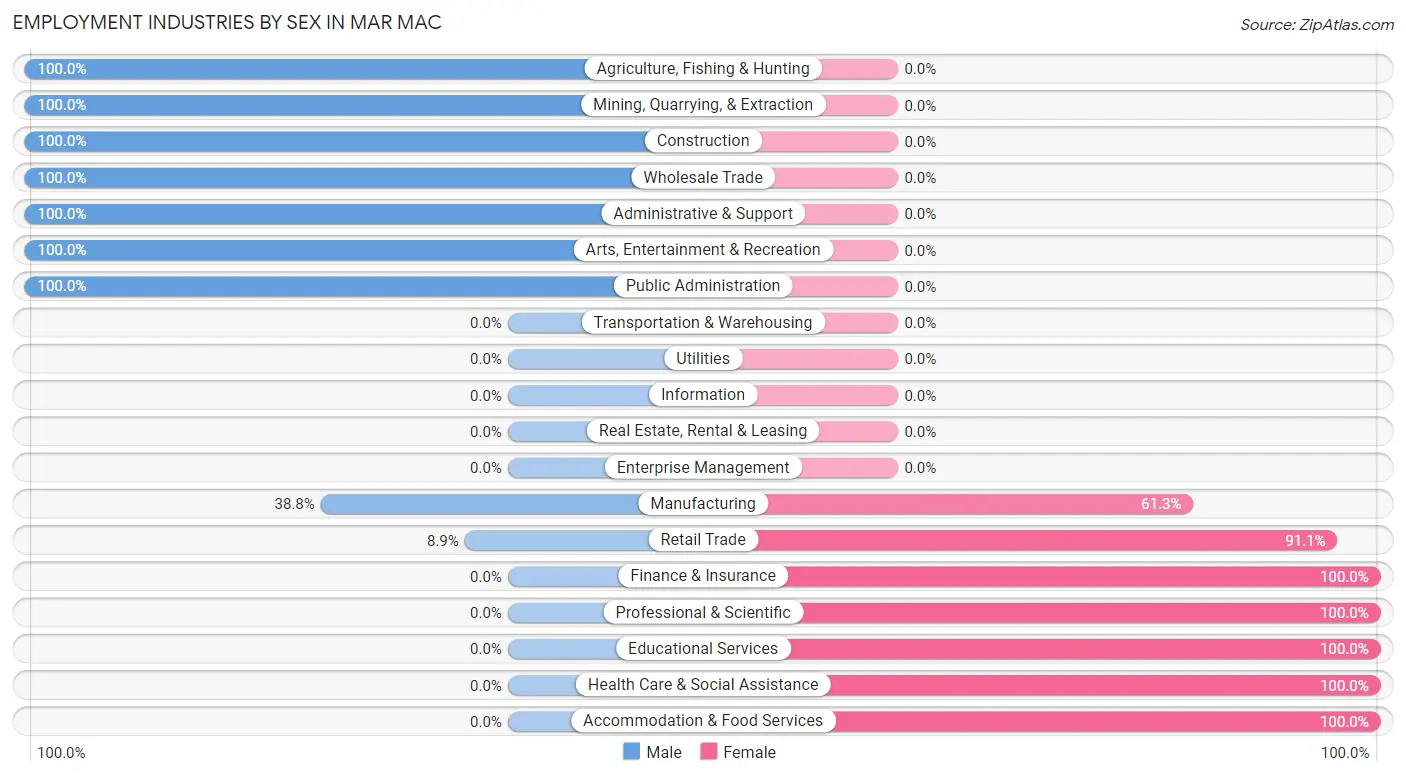
Employment Industries by Sex in Mar Mac
The Mar Mac industries that see more men than women are Agriculture, Fishing & Hunting (100.0%), Mining, Quarrying, & Extraction (100.0%), and Construction (100.0%), whereas the industries that tend to have a higher number of women are Finance & Insurance (100.0%), Professional & Scientific (100.0%), and Educational Services (100.0%).
| Industry | Male | Female |
| Agriculture, Fishing & Hunting | 10 (100.0%) | 0 (0.0%) |
| Mining, Quarrying, & Extraction | 17 (100.0%) | 0 (0.0%) |
| Construction | 144 (100.0%) | 0 (0.0%) |
| Manufacturing | 93 (38.8%) | 147 (61.3%) |
| Wholesale Trade | 14 (100.0%) | 0 (0.0%) |
| Retail Trade | 10 (8.9%) | 102 (91.1%) |
| Transportation & Warehousing | 0 (0.0%) | 0 (0.0%) |
| Utilities | 0 (0.0%) | 0 (0.0%) |
| Information | 0 (0.0%) | 0 (0.0%) |
| Finance & Insurance | 0 (0.0%) | 75 (100.0%) |
| Real Estate, Rental & Leasing | 0 (0.0%) | 0 (0.0%) |
| Professional & Scientific | 0 (0.0%) | 18 (100.0%) |
| Enterprise Management | 0 (0.0%) | 0 (0.0%) |
| Administrative & Support | 21 (100.0%) | 0 (0.0%) |
| Educational Services | 0 (0.0%) | 11 (100.0%) |
| Health Care & Social Assistance | 0 (0.0%) | 20 (100.0%) |
| Arts, Entertainment & Recreation | 16 (100.0%) | 0 (0.0%) |
| Accommodation & Food Services | 0 (0.0%) | 24 (100.0%) |
| Public Administration | 29 (100.0%) | 0 (0.0%) |
| Total | 413 (48.9%) | 432 (51.1%) |
Education in Mar Mac
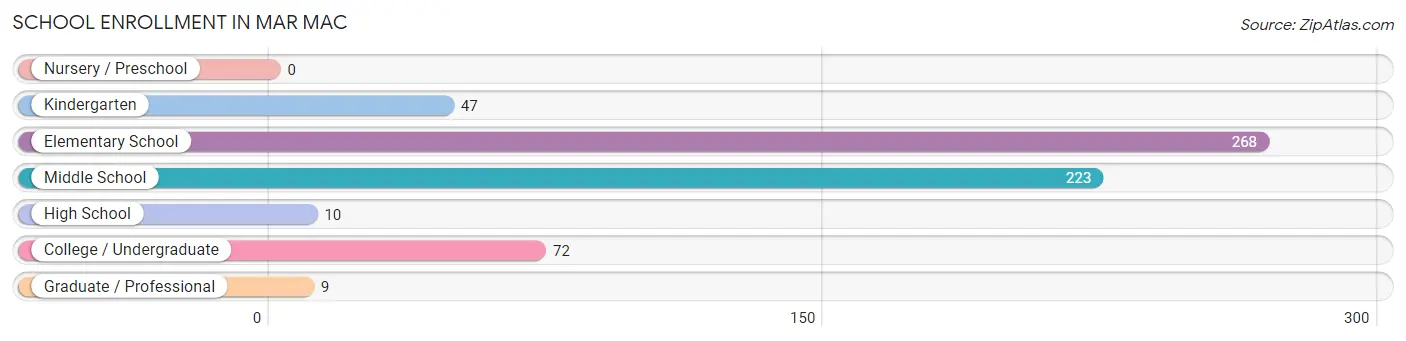
School Enrollment in Mar Mac
The most common levels of schooling among the 629 students in Mar Mac are elementary school (268 | 42.6%), middle school (223 | 35.4%), and college / undergraduate (72 | 11.5%).
| School Level | # Students | % Students |
| Nursery / Preschool | 0 | 0.0% |
| Kindergarten | 47 | 7.5% |
| Elementary School | 268 | 42.6% |
| Middle School | 223 | 35.4% |
| High School | 10 | 1.6% |
| College / Undergraduate | 72 | 11.5% |
| Graduate / Professional | 9 | 1.4% |
| Total | 629 | 100.0% |
School Enrollment by Age by Funding Source in Mar Mac
Out of a total of 629 students who are enrolled in schools in Mar Mac, 231 (36.7%) attend a private institution, while the remaining 398 (63.3%) are enrolled in public schools. The age group of 20 to 24 year olds has the highest likelihood of being enrolled in private schools, with 46 (100.0% in the age bracket) enrolled. Conversely, the age group of 15 to 17 year olds has the lowest likelihood of being enrolled in a private school, with 10 (100.0% in the age bracket) attending a public institution.
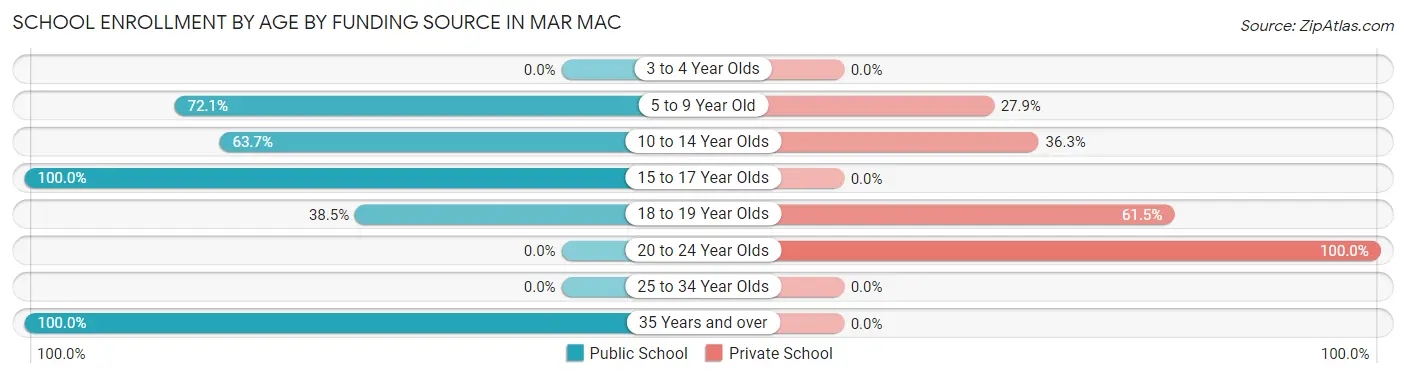
| Age Bracket | Public School | Private School |
| 3 to 4 Year Olds | 0 (0.0%) | 0 (0.0%) |
| 5 to 9 Year Old | 227 (72.1%) | 88 (27.9%) |
| 10 to 14 Year Olds | 142 (63.7%) | 81 (36.3%) |
| 15 to 17 Year Olds | 10 (100.0%) | 0 (0.0%) |
| 18 to 19 Year Olds | 10 (38.5%) | 16 (61.5%) |
| 20 to 24 Year Olds | 0 (0.0%) | 46 (100.0%) |
| 25 to 34 Year Olds | 0 (0.0%) | 0 (0.0%) |
| 35 Years and over | 9 (100.0%) | 0 (0.0%) |
| Total | 398 (63.3%) | 231 (36.7%) |
Educational Attainment by Field of Study in Mar Mac
Business (146 | 39.9%), arts & humanities (75 | 20.5%), computers & mathematics (29 | 7.9%), psychology (27 | 7.4%), and social sciences (26 | 7.1%) are the most common fields of study among 366 individuals in Mar Mac who have obtained a bachelor's degree or higher.
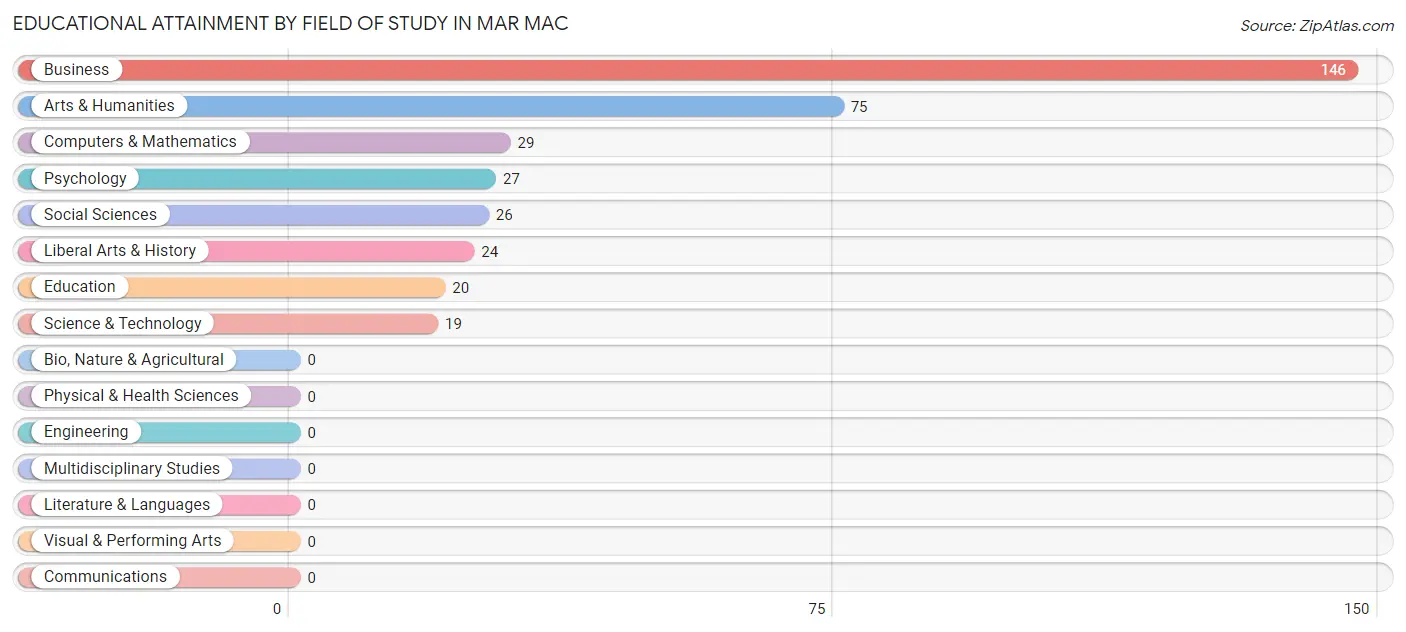
| Field of Study | # Graduates | % Graduates |
| Computers & Mathematics | 29 | 7.9% |
| Bio, Nature & Agricultural | 0 | 0.0% |
| Physical & Health Sciences | 0 | 0.0% |
| Psychology | 27 | 7.4% |
| Social Sciences | 26 | 7.1% |
| Engineering | 0 | 0.0% |
| Multidisciplinary Studies | 0 | 0.0% |
| Science & Technology | 19 | 5.2% |
| Business | 146 | 39.9% |
| Education | 20 | 5.5% |
| Literature & Languages | 0 | 0.0% |
| Liberal Arts & History | 24 | 6.6% |
| Visual & Performing Arts | 0 | 0.0% |
| Communications | 0 | 0.0% |
| Arts & Humanities | 75 | 20.5% |
| Total | 366 | 100.0% |
Transportation & Commute in Mar Mac
Vehicle Availability by Sex in Mar Mac
The most prevalent vehicle ownership categories in Mar Mac are males with 3 vehicles (158, accounting for 31.1%) and females with 3 vehicles (54, making up 38.5%).
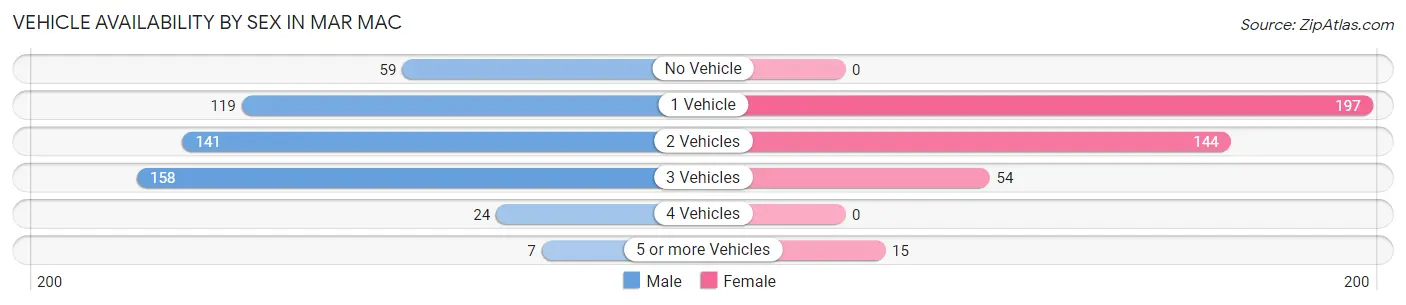
| Vehicles Available | Male | Female |
| No Vehicle | 59 (11.6%) | 0 (0.0%) |
| 1 Vehicle | 119 (23.4%) | 197 (48.0%) |
| 2 Vehicles | 141 (27.8%) | 144 (35.1%) |
| 3 Vehicles | 158 (31.1%) | 54 (13.2%) |
| 4 Vehicles | 24 (4.7%) | 0 (0.0%) |
| 5 or more Vehicles | 7 (1.4%) | 15 (3.7%) |
| Total | 508 (100.0%) | 410 (100.0%) |
Commute Time in Mar Mac
The most frequently occuring commute durations in Mar Mac are 15 to 19 minutes (196 commuters, 21.6%), 20 to 24 minutes (158 commuters, 17.4%), and 10 to 14 minutes (146 commuters, 16.1%).
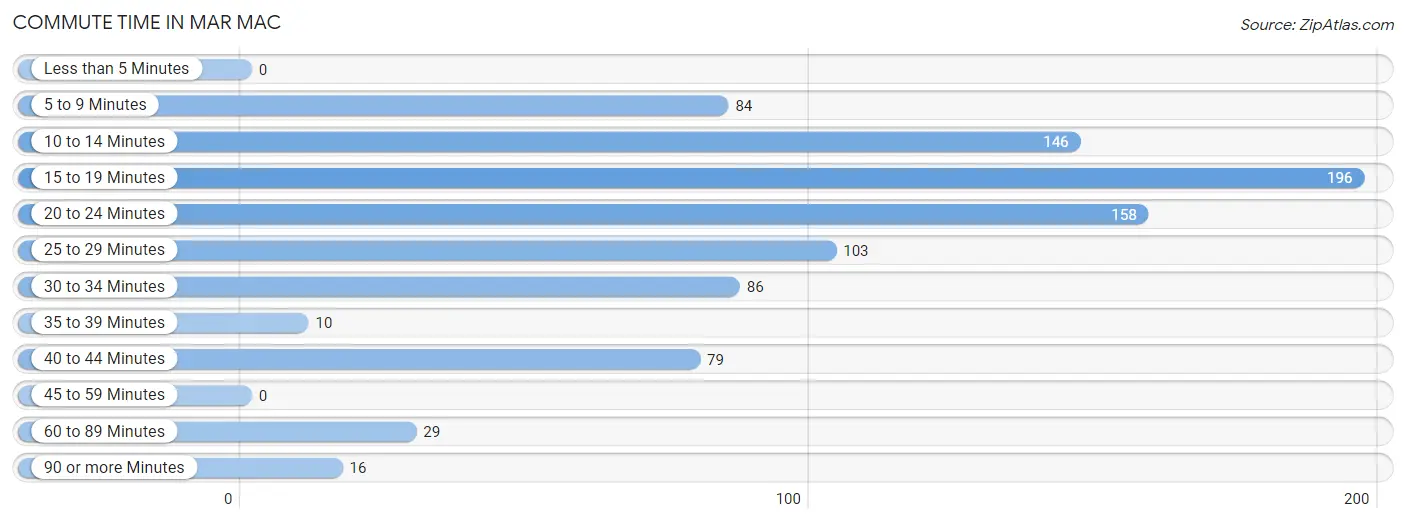
| Commute Time | # Commuters | % Commuters |
| Less than 5 Minutes | 0 | 0.0% |
| 5 to 9 Minutes | 84 | 9.3% |
| 10 to 14 Minutes | 146 | 16.1% |
| 15 to 19 Minutes | 196 | 21.6% |
| 20 to 24 Minutes | 158 | 17.4% |
| 25 to 29 Minutes | 103 | 11.4% |
| 30 to 34 Minutes | 86 | 9.5% |
| 35 to 39 Minutes | 10 | 1.1% |
| 40 to 44 Minutes | 79 | 8.7% |
| 45 to 59 Minutes | 0 | 0.0% |
| 60 to 89 Minutes | 29 | 3.2% |
| 90 or more Minutes | 16 | 1.8% |
Commute Time by Sex in Mar Mac
The most common commute times in Mar Mac are 15 to 19 minutes (144 commuters, 28.3%) for males and 25 to 29 minutes (103 commuters, 25.8%) for females.
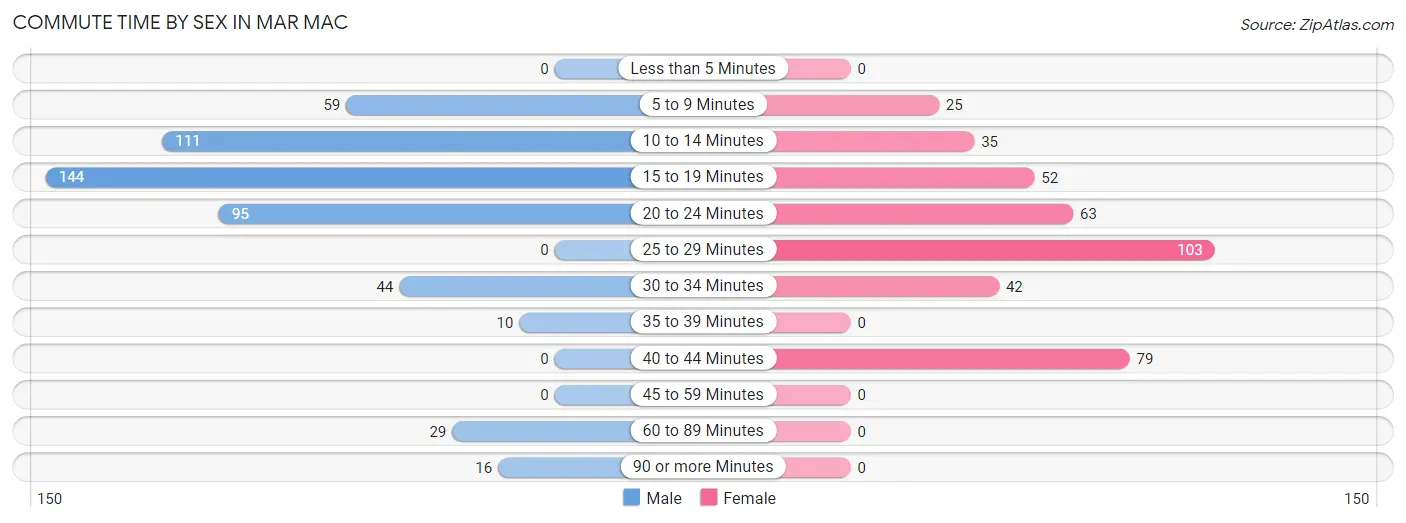
| Commute Time | Male | Female |
| Less than 5 Minutes | 0 (0.0%) | 0 (0.0%) |
| 5 to 9 Minutes | 59 (11.6%) | 25 (6.3%) |
| 10 to 14 Minutes | 111 (21.8%) | 35 (8.8%) |
| 15 to 19 Minutes | 144 (28.3%) | 52 (13.0%) |
| 20 to 24 Minutes | 95 (18.7%) | 63 (15.8%) |
| 25 to 29 Minutes | 0 (0.0%) | 103 (25.8%) |
| 30 to 34 Minutes | 44 (8.7%) | 42 (10.5%) |
| 35 to 39 Minutes | 10 (2.0%) | 0 (0.0%) |
| 40 to 44 Minutes | 0 (0.0%) | 79 (19.8%) |
| 45 to 59 Minutes | 0 (0.0%) | 0 (0.0%) |
| 60 to 89 Minutes | 29 (5.7%) | 0 (0.0%) |
| 90 or more Minutes | 16 (3.2%) | 0 (0.0%) |
Time of Departure to Work by Sex in Mar Mac
The most frequent times of departure to work in Mar Mac are 6:00 AM to 6:29 AM (154, 30.3%) for males and 7:30 AM to 7:59 AM (158, 39.6%) for females.
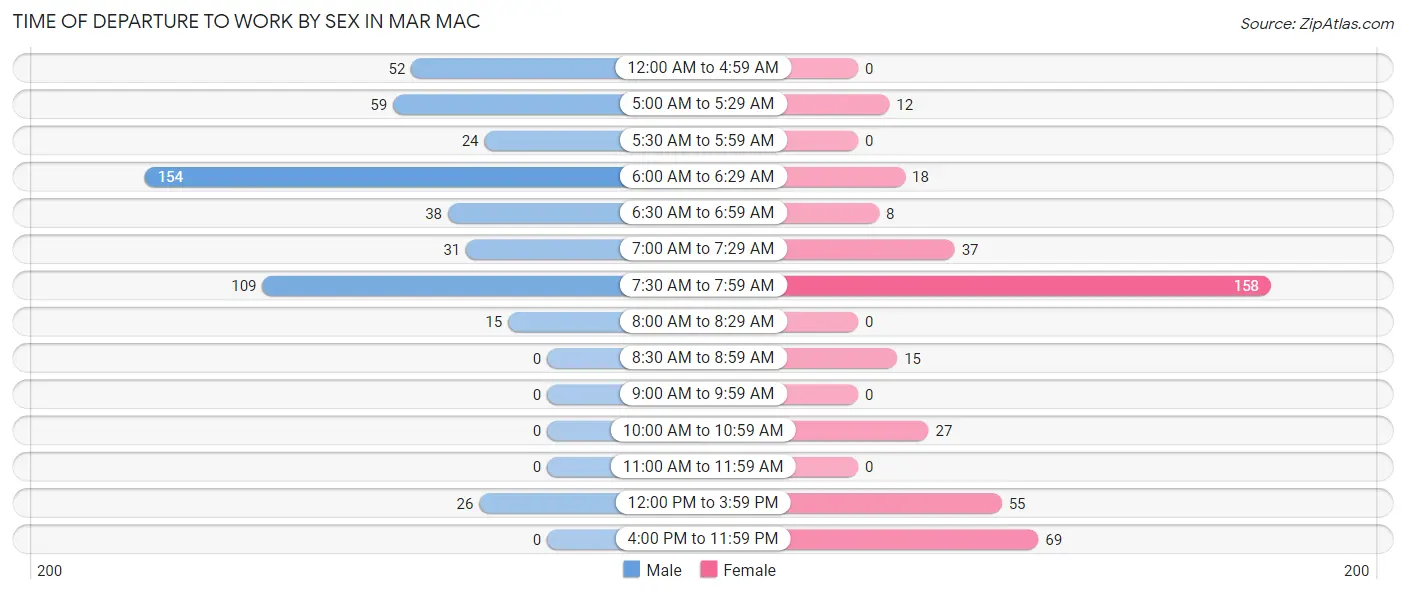
| Time of Departure | Male | Female |
| 12:00 AM to 4:59 AM | 52 (10.2%) | 0 (0.0%) |
| 5:00 AM to 5:29 AM | 59 (11.6%) | 12 (3.0%) |
| 5:30 AM to 5:59 AM | 24 (4.7%) | 0 (0.0%) |
| 6:00 AM to 6:29 AM | 154 (30.3%) | 18 (4.5%) |
| 6:30 AM to 6:59 AM | 38 (7.5%) | 8 (2.0%) |
| 7:00 AM to 7:29 AM | 31 (6.1%) | 37 (9.3%) |
| 7:30 AM to 7:59 AM | 109 (21.5%) | 158 (39.6%) |
| 8:00 AM to 8:29 AM | 15 (2.9%) | 0 (0.0%) |
| 8:30 AM to 8:59 AM | 0 (0.0%) | 15 (3.8%) |
| 9:00 AM to 9:59 AM | 0 (0.0%) | 0 (0.0%) |
| 10:00 AM to 10:59 AM | 0 (0.0%) | 27 (6.8%) |
| 11:00 AM to 11:59 AM | 0 (0.0%) | 0 (0.0%) |
| 12:00 PM to 3:59 PM | 26 (5.1%) | 55 (13.8%) |
| 4:00 PM to 11:59 PM | 0 (0.0%) | 69 (17.3%) |
| Total | 508 (100.0%) | 399 (100.0%) |
Housing Occupancy in Mar Mac
Occupancy by Ownership in Mar Mac
Of the total 1,181 dwellings in Mar Mac, owner-occupied units account for 674 (57.1%), while renter-occupied units make up 507 (42.9%).
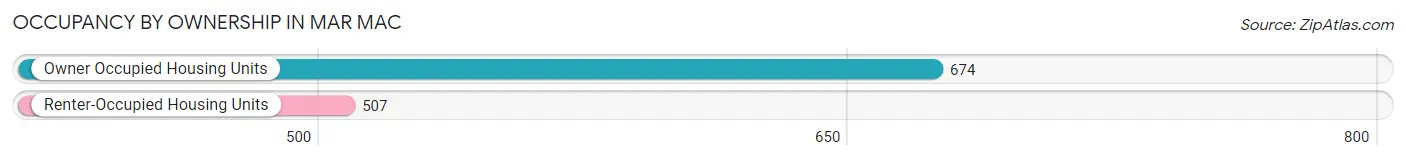
| Occupancy | # Housing Units | % Housing Units |
| Owner Occupied Housing Units | 674 | 57.1% |
| Renter-Occupied Housing Units | 507 | 42.9% |
| Total Occupied Housing Units | 1,181 | 100.0% |
Occupancy by Household Size in Mar Mac
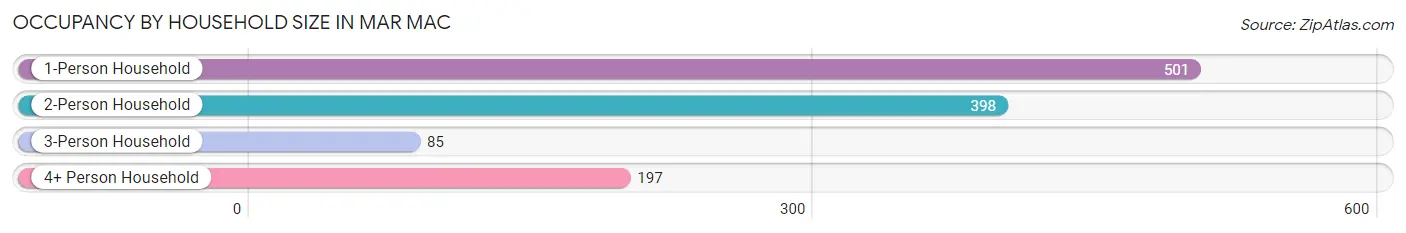
| Household Size | # Housing Units | % Housing Units |
| 1-Person Household | 501 | 42.4% |
| 2-Person Household | 398 | 33.7% |
| 3-Person Household | 85 | 7.2% |
| 4+ Person Household | 197 | 16.7% |
| Total Housing Units | 1,181 | 100.0% |
Occupancy by Ownership by Household Size in Mar Mac
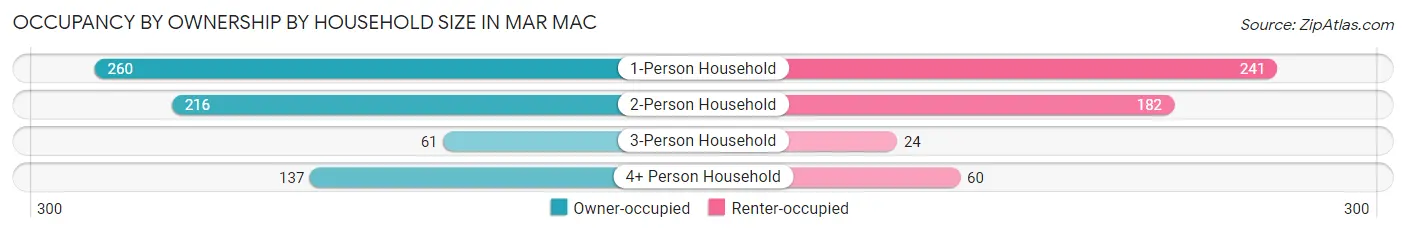
| Household Size | Owner-occupied | Renter-occupied |
| 1-Person Household | 260 (51.9%) | 241 (48.1%) |
| 2-Person Household | 216 (54.3%) | 182 (45.7%) |
| 3-Person Household | 61 (71.8%) | 24 (28.2%) |
| 4+ Person Household | 137 (69.5%) | 60 (30.5%) |
| Total Housing Units | 674 (57.1%) | 507 (42.9%) |
Occupancy by Educational Attainment in Mar Mac
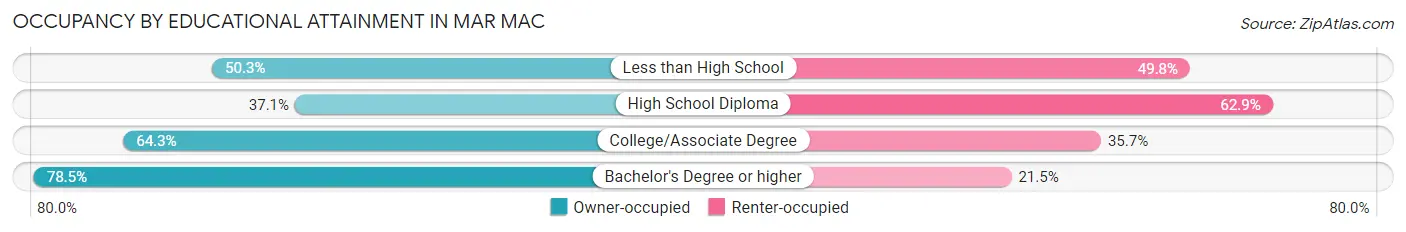
| Household Size | Owner-occupied | Renter-occupied |
| Less than High School | 100 (50.2%) | 99 (49.7%) |
| High School Diploma | 124 (37.1%) | 210 (62.9%) |
| College/Associate Degree | 267 (64.3%) | 148 (35.7%) |
| Bachelor's Degree or higher | 183 (78.5%) | 50 (21.5%) |
Occupancy by Age of Householder in Mar Mac
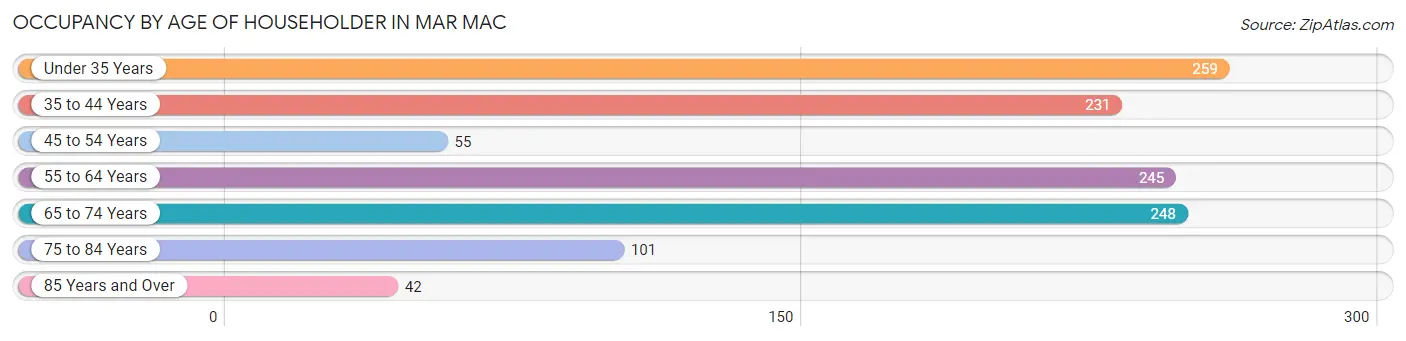
| Age Bracket | # Households | % Households |
| Under 35 Years | 259 | 21.9% |
| 35 to 44 Years | 231 | 19.6% |
| 45 to 54 Years | 55 | 4.7% |
| 55 to 64 Years | 245 | 20.7% |
| 65 to 74 Years | 248 | 21.0% |
| 75 to 84 Years | 101 | 8.6% |
| 85 Years and Over | 42 | 3.6% |
| Total | 1,181 | 100.0% |
Housing Finances in Mar Mac
Median Income by Occupancy in Mar Mac
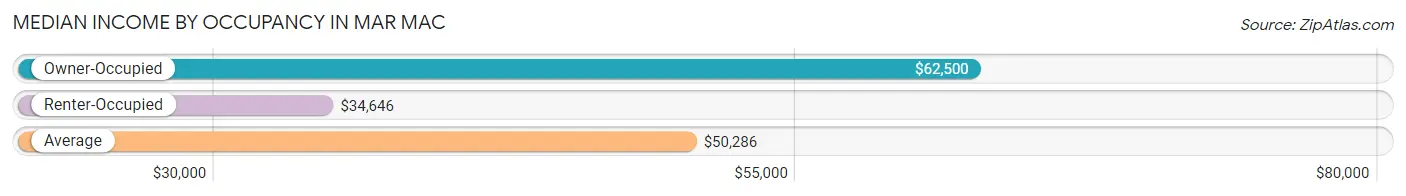
| Occupancy Type | # Households | Median Income |
| Owner-Occupied | 674 (57.1%) | $62,500 |
| Renter-Occupied | 507 (42.9%) | $34,646 |
| Average | 1,181 (100.0%) | $50,286 |
Occupancy by Householder Income Bracket in Mar Mac
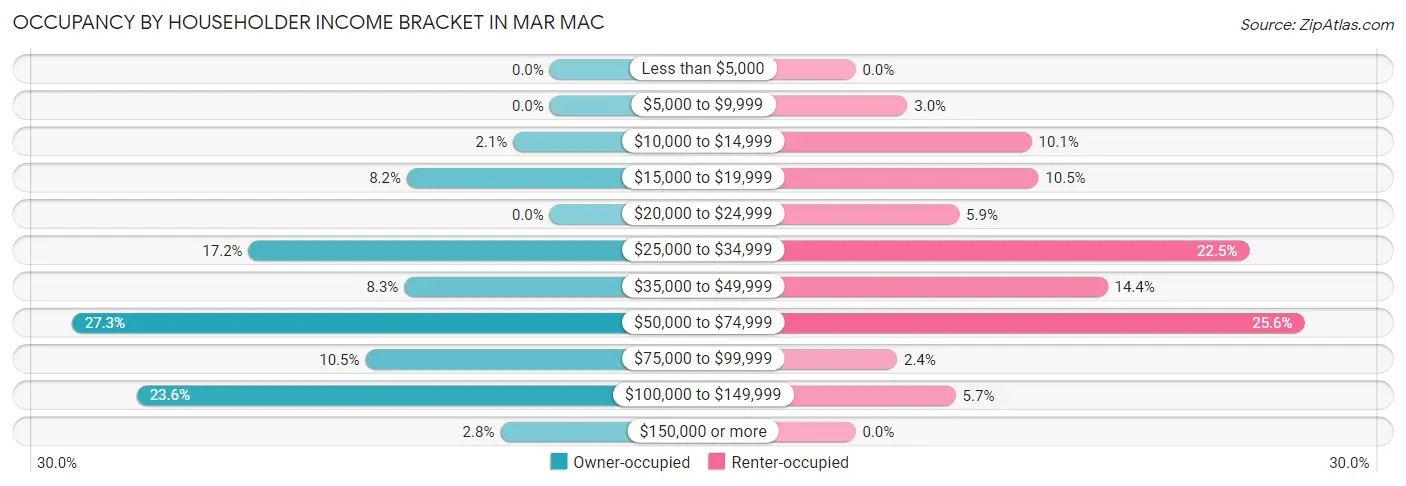
| Income Bracket | Owner-occupied | Renter-occupied |
| Less than $5,000 | 0 (0.0%) | 0 (0.0%) |
| $5,000 to $9,999 | 0 (0.0%) | 15 (3.0%) |
| $10,000 to $14,999 | 14 (2.1%) | 51 (10.1%) |
| $15,000 to $19,999 | 55 (8.2%) | 53 (10.4%) |
| $20,000 to $24,999 | 0 (0.0%) | 30 (5.9%) |
| $25,000 to $34,999 | 116 (17.2%) | 114 (22.5%) |
| $35,000 to $49,999 | 56 (8.3%) | 73 (14.4%) |
| $50,000 to $74,999 | 184 (27.3%) | 130 (25.6%) |
| $75,000 to $99,999 | 71 (10.5%) | 12 (2.4%) |
| $100,000 to $149,999 | 159 (23.6%) | 29 (5.7%) |
| $150,000 or more | 19 (2.8%) | 0 (0.0%) |
| Total | 674 (100.0%) | 507 (100.0%) |
Monthly Housing Cost Tiers in Mar Mac
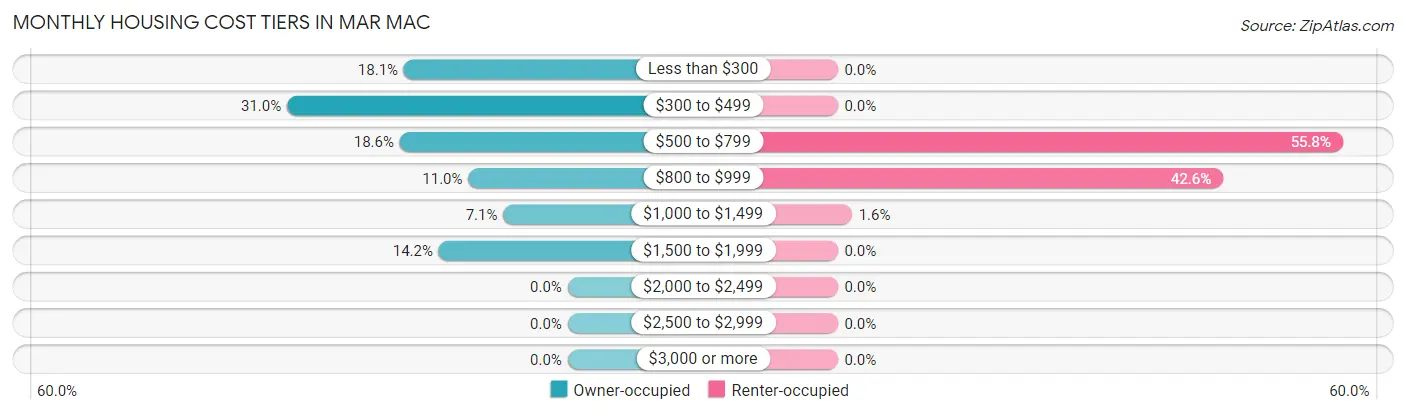
| Monthly Cost | Owner-occupied | Renter-occupied |
| Less than $300 | 122 (18.1%) | 0 (0.0%) |
| $300 to $499 | 209 (31.0%) | 0 (0.0%) |
| $500 to $799 | 125 (18.5%) | 283 (55.8%) |
| $800 to $999 | 74 (11.0%) | 216 (42.6%) |
| $1,000 to $1,499 | 48 (7.1%) | 8 (1.6%) |
| $1,500 to $1,999 | 96 (14.2%) | 0 (0.0%) |
| $2,000 to $2,499 | 0 (0.0%) | 0 (0.0%) |
| $2,500 to $2,999 | 0 (0.0%) | 0 (0.0%) |
| $3,000 or more | 0 (0.0%) | 0 (0.0%) |
| Total | 674 (100.0%) | 507 (100.0%) |
Physical Housing Characteristics in Mar Mac
Housing Structures in Mar Mac
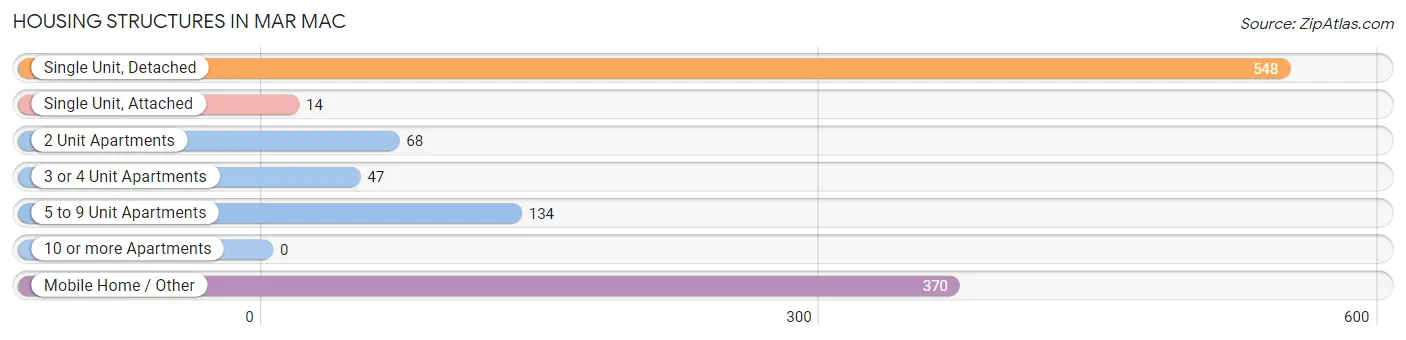
| Structure Type | # Housing Units | % Housing Units |
| Single Unit, Detached | 548 | 46.4% |
| Single Unit, Attached | 14 | 1.2% |
| 2 Unit Apartments | 68 | 5.8% |
| 3 or 4 Unit Apartments | 47 | 4.0% |
| 5 to 9 Unit Apartments | 134 | 11.4% |
| 10 or more Apartments | 0 | 0.0% |
| Mobile Home / Other | 370 | 31.3% |
| Total | 1,181 | 100.0% |
Housing Structures by Occupancy in Mar Mac
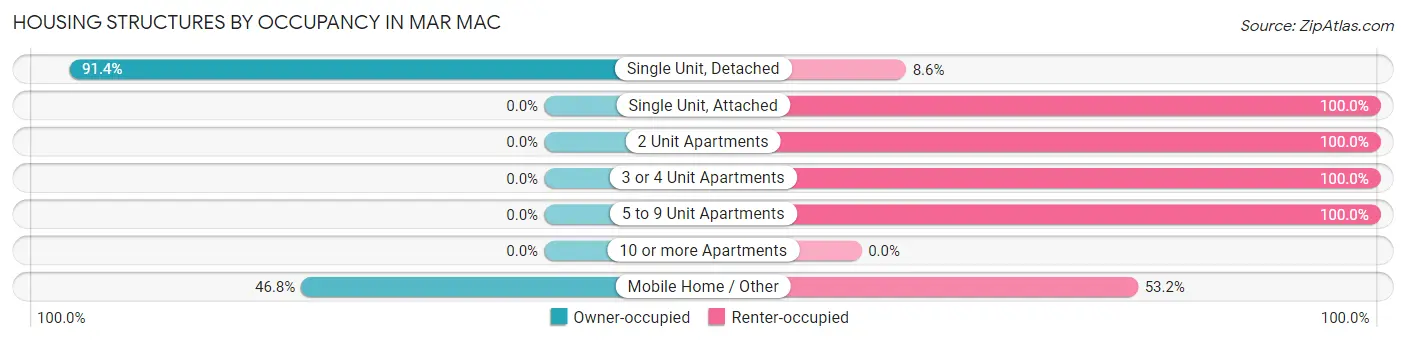
| Structure Type | Owner-occupied | Renter-occupied |
| Single Unit, Detached | 501 (91.4%) | 47 (8.6%) |
| Single Unit, Attached | 0 (0.0%) | 14 (100.0%) |
| 2 Unit Apartments | 0 (0.0%) | 68 (100.0%) |
| 3 or 4 Unit Apartments | 0 (0.0%) | 47 (100.0%) |
| 5 to 9 Unit Apartments | 0 (0.0%) | 134 (100.0%) |
| 10 or more Apartments | 0 (0.0%) | 0 (0.0%) |
| Mobile Home / Other | 173 (46.8%) | 197 (53.2%) |
| Total | 674 (57.1%) | 507 (42.9%) |
Housing Structures by Number of Rooms in Mar Mac
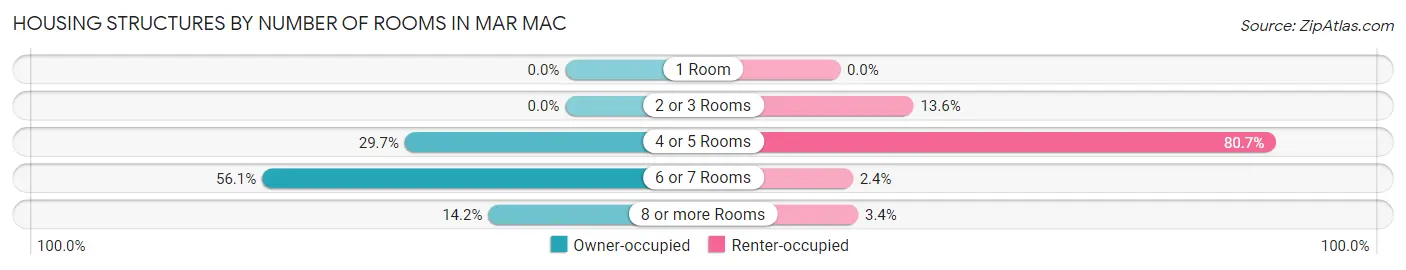
| Number of Rooms | Owner-occupied | Renter-occupied |
| 1 Room | 0 (0.0%) | 0 (0.0%) |
| 2 or 3 Rooms | 0 (0.0%) | 69 (13.6%) |
| 4 or 5 Rooms | 200 (29.7%) | 409 (80.7%) |
| 6 or 7 Rooms | 378 (56.1%) | 12 (2.4%) |
| 8 or more Rooms | 96 (14.2%) | 17 (3.4%) |
| Total | 674 (100.0%) | 507 (100.0%) |
Housing Structure by Heating Type in Mar Mac
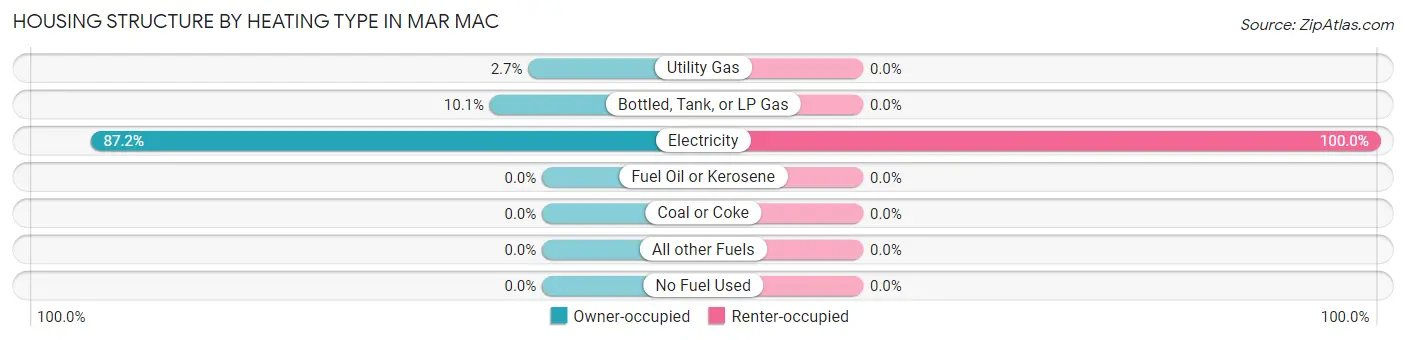
| Heating Type | Owner-occupied | Renter-occupied |
| Utility Gas | 18 (2.7%) | 0 (0.0%) |
| Bottled, Tank, or LP Gas | 68 (10.1%) | 0 (0.0%) |
| Electricity | 588 (87.2%) | 507 (100.0%) |
| Fuel Oil or Kerosene | 0 (0.0%) | 0 (0.0%) |
| Coal or Coke | 0 (0.0%) | 0 (0.0%) |
| All other Fuels | 0 (0.0%) | 0 (0.0%) |
| No Fuel Used | 0 (0.0%) | 0 (0.0%) |
| Total | 674 (100.0%) | 507 (100.0%) |
Household Vehicle Usage in Mar Mac
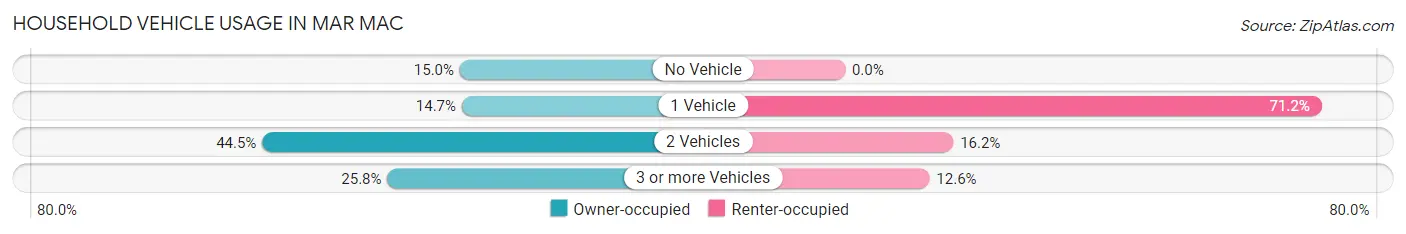
| Vehicles per Household | Owner-occupied | Renter-occupied |
| No Vehicle | 101 (15.0%) | 0 (0.0%) |
| 1 Vehicle | 99 (14.7%) | 361 (71.2%) |
| 2 Vehicles | 300 (44.5%) | 82 (16.2%) |
| 3 or more Vehicles | 174 (25.8%) | 64 (12.6%) |
| Total | 674 (100.0%) | 507 (100.0%) |
Real Estate & Mortgages in Mar Mac
Real Estate and Mortgage Overview in Mar Mac
| Characteristic | Without Mortgage | With Mortgage |
| Housing Units | 367 | 307 |
| Median Property Value | $128,000 | $154,400 |
| Median Household Income | $59,712 | $0 |
| Monthly Housing Costs | $414 | $0 |
| Real Estate Taxes | $723 | $0 |
Property Value by Mortgage Status in Mar Mac
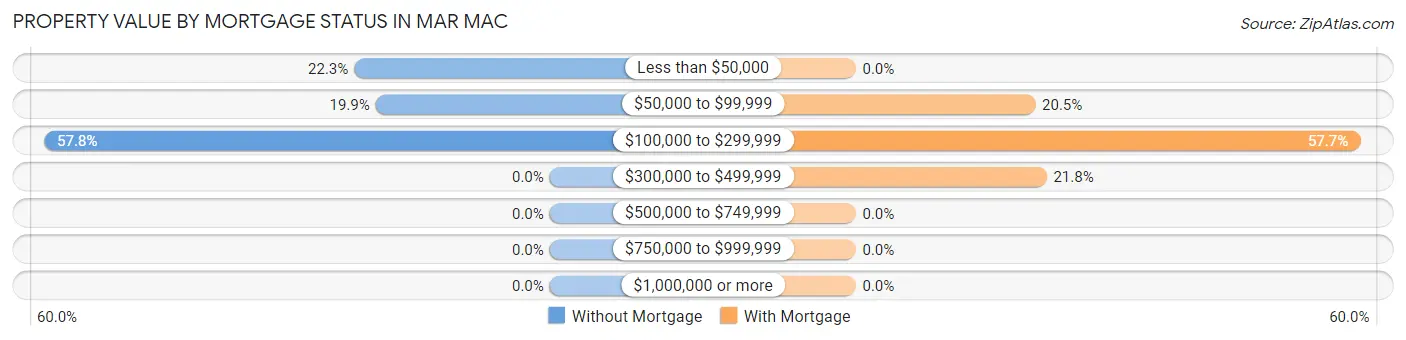
| Property Value | Without Mortgage | With Mortgage |
| Less than $50,000 | 82 (22.3%) | 0 (0.0%) |
| $50,000 to $99,999 | 73 (19.9%) | 63 (20.5%) |
| $100,000 to $299,999 | 212 (57.8%) | 177 (57.7%) |
| $300,000 to $499,999 | 0 (0.0%) | 67 (21.8%) |
| $500,000 to $749,999 | 0 (0.0%) | 0 (0.0%) |
| $750,000 to $999,999 | 0 (0.0%) | 0 (0.0%) |
| $1,000,000 or more | 0 (0.0%) | 0 (0.0%) |
| Total | 367 (100.0%) | 307 (100.0%) |
Household Income by Mortgage Status in Mar Mac
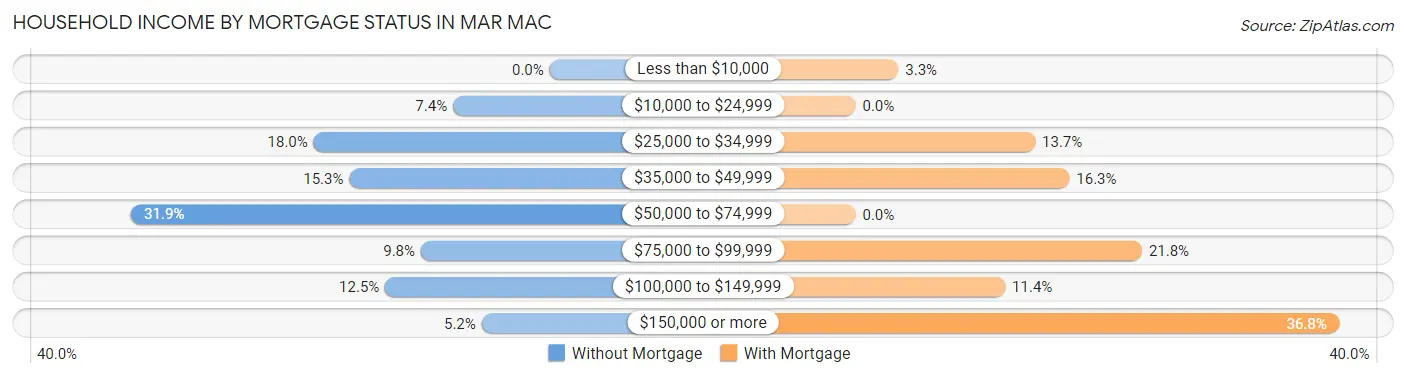
| Household Income | Without Mortgage | With Mortgage |
| Less than $10,000 | 0 (0.0%) | 10 (3.3%) |
| $10,000 to $24,999 | 27 (7.4%) | 0 (0.0%) |
| $25,000 to $34,999 | 66 (18.0%) | 42 (13.7%) |
| $35,000 to $49,999 | 56 (15.3%) | 50 (16.3%) |
| $50,000 to $74,999 | 117 (31.9%) | 0 (0.0%) |
| $75,000 to $99,999 | 36 (9.8%) | 67 (21.8%) |
| $100,000 to $149,999 | 46 (12.5%) | 35 (11.4%) |
| $150,000 or more | 19 (5.2%) | 113 (36.8%) |
| Total | 367 (100.0%) | 307 (100.0%) |
Property Value to Household Income Ratio in Mar Mac
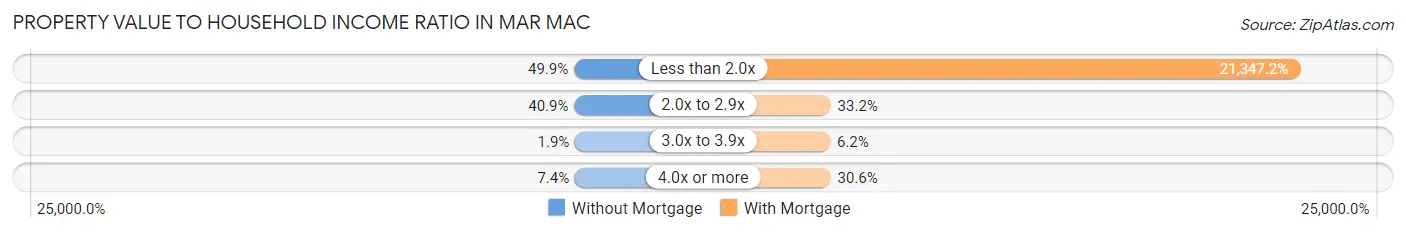
| Value-to-Income Ratio | Without Mortgage | With Mortgage |
| Less than 2.0x | 183 (49.9%) | 65,536 (21,347.2%) |
| 2.0x to 2.9x | 150 (40.9%) | 102 (33.2%) |
| 3.0x to 3.9x | 7 (1.9%) | 19 (6.2%) |
| 4.0x or more | 27 (7.4%) | 94 (30.6%) |
| Total | 367 (100.0%) | 307 (100.0%) |
Real Estate Taxes by Mortgage Status in Mar Mac
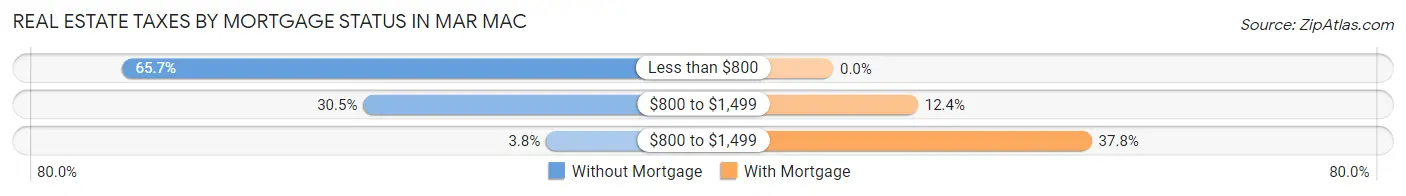
| Property Taxes | Without Mortgage | With Mortgage |
| Less than $800 | 241 (65.7%) | 0 (0.0%) |
| $800 to $1,499 | 112 (30.5%) | 38 (12.4%) |
| $800 to $1,499 | 14 (3.8%) | 116 (37.8%) |
| Total | 367 (100.0%) | 307 (100.0%) |
Health & Disability in Mar Mac
Health Insurance Coverage by Age in Mar Mac
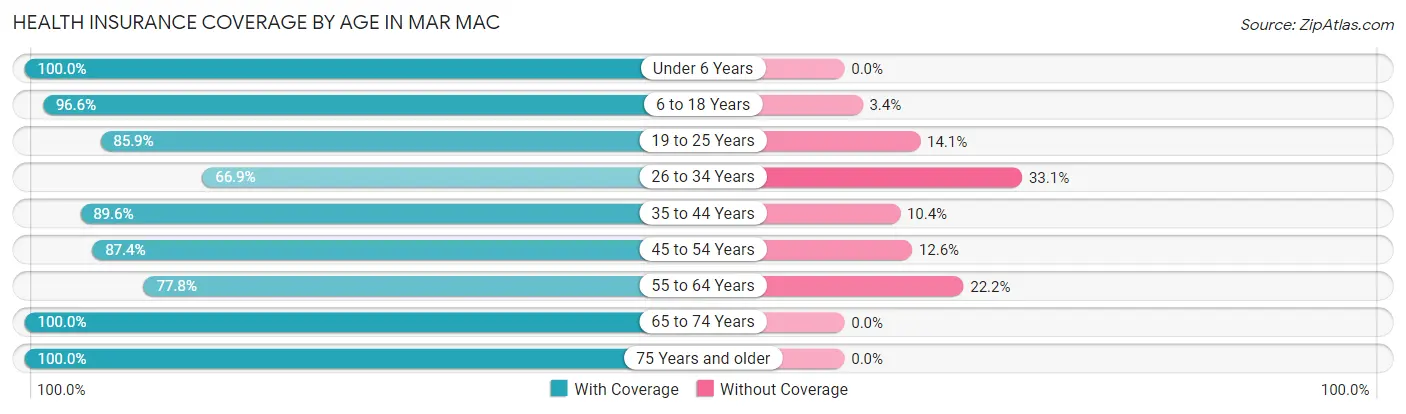
| Age Bracket | With Coverage | Without Coverage |
| Under 6 Years | 121 (100.0%) | 0 (0.0%) |
| 6 to 18 Years | 542 (96.6%) | 19 (3.4%) |
| 19 to 25 Years | 79 (85.9%) | 13 (14.1%) |
| 26 to 34 Years | 234 (66.9%) | 116 (33.1%) |
| 35 to 44 Years | 259 (89.6%) | 30 (10.4%) |
| 45 to 54 Years | 187 (87.4%) | 27 (12.6%) |
| 55 to 64 Years | 242 (77.8%) | 69 (22.2%) |
| 65 to 74 Years | 268 (100.0%) | 0 (0.0%) |
| 75 Years and older | 184 (100.0%) | 0 (0.0%) |
| Total | 2,116 (88.5%) | 274 (11.5%) |
Health Insurance Coverage by Citizenship Status in Mar Mac
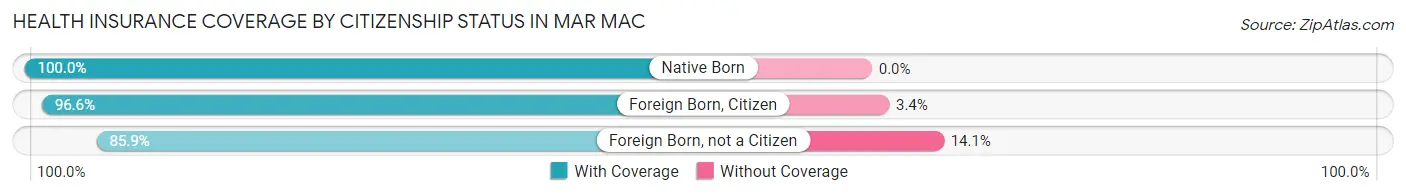
| Citizenship Status | With Coverage | Without Coverage |
| Native Born | 121 (100.0%) | 0 (0.0%) |
| Foreign Born, Citizen | 542 (96.6%) | 19 (3.4%) |
| Foreign Born, not a Citizen | 79 (85.9%) | 13 (14.1%) |
Health Insurance Coverage by Household Income in Mar Mac
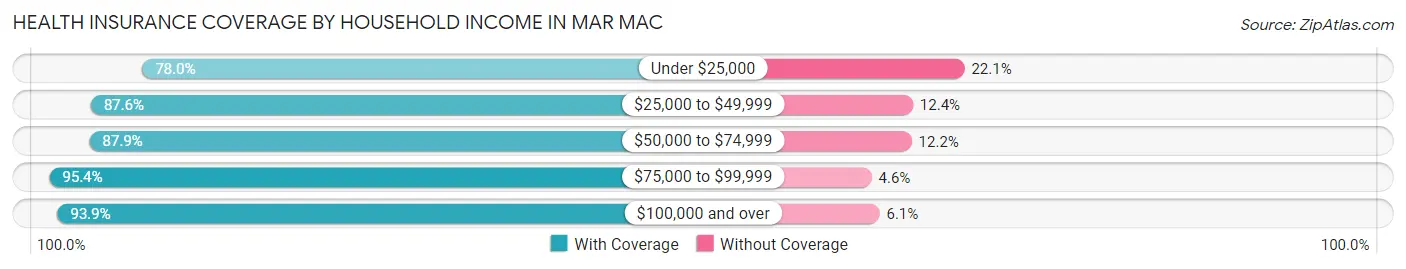
| Household Income | With Coverage | Without Coverage |
| Under $25,000 | 251 (77.9%) | 71 (22.1%) |
| $25,000 to $49,999 | 686 (87.6%) | 97 (12.4%) |
| $50,000 to $74,999 | 434 (87.8%) | 60 (12.1%) |
| $75,000 to $99,999 | 144 (95.4%) | 7 (4.6%) |
| $100,000 and over | 597 (93.9%) | 39 (6.1%) |
Public vs Private Health Insurance Coverage by Age in Mar Mac
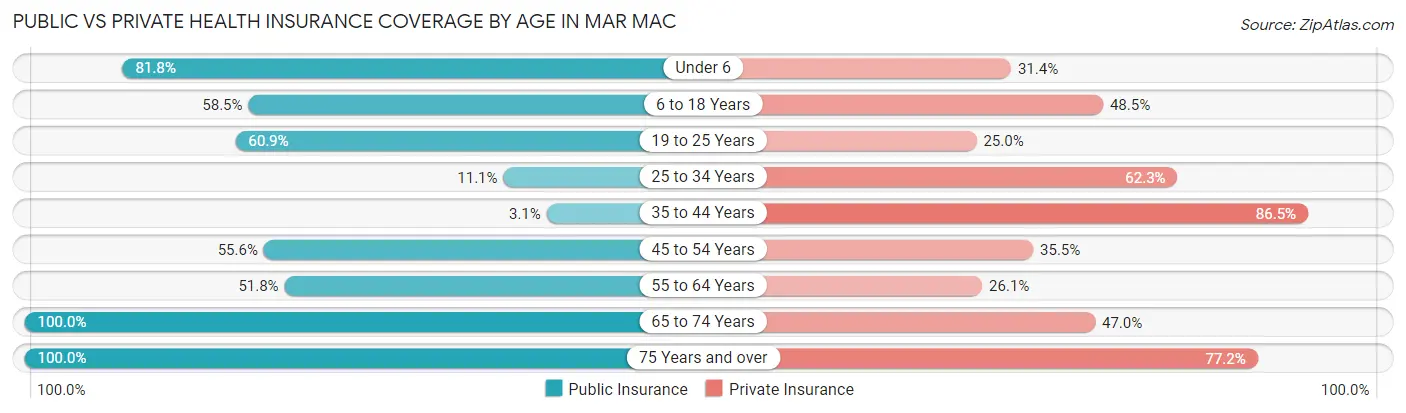
| Age Bracket | Public Insurance | Private Insurance |
| Under 6 | 99 (81.8%) | 38 (31.4%) |
| 6 to 18 Years | 328 (58.5%) | 272 (48.5%) |
| 19 to 25 Years | 56 (60.9%) | 23 (25.0%) |
| 25 to 34 Years | 39 (11.1%) | 218 (62.3%) |
| 35 to 44 Years | 9 (3.1%) | 250 (86.5%) |
| 45 to 54 Years | 119 (55.6%) | 76 (35.5%) |
| 55 to 64 Years | 161 (51.8%) | 81 (26.1%) |
| 65 to 74 Years | 268 (100.0%) | 126 (47.0%) |
| 75 Years and over | 184 (100.0%) | 142 (77.2%) |
| Total | 1,263 (52.8%) | 1,226 (51.3%) |
Disability Status by Sex by Age in Mar Mac
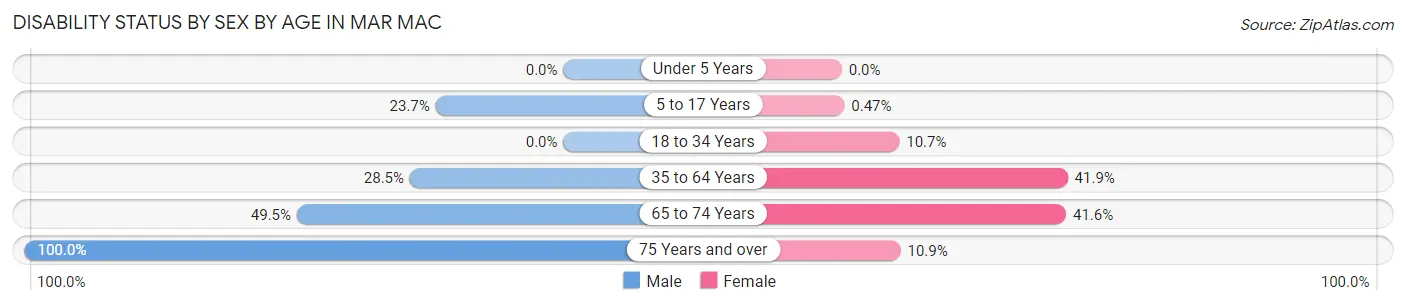
| Age Bracket | Male | Female |
| Under 5 Years | 0 (0.0%) | 0 (0.0%) |
| 5 to 17 Years | 83 (23.7%) | 1 (0.5%) |
| 18 to 34 Years | 0 (0.0%) | 38 (10.7%) |
| 35 to 64 Years | 149 (28.5%) | 122 (41.9%) |
| 65 to 74 Years | 47 (49.5%) | 72 (41.6%) |
| 75 Years and over | 74 (100.0%) | 12 (10.9%) |
Disability Class by Sex by Age in Mar Mac
Disability Class: Hearing Difficulty
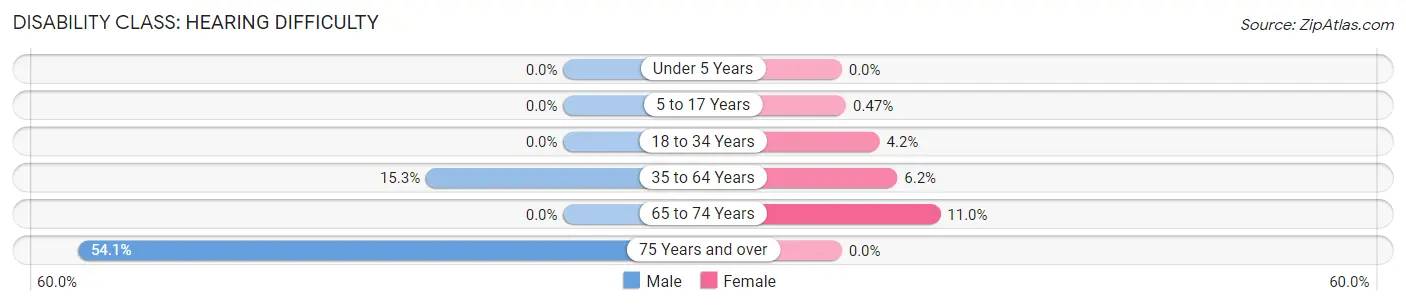
| Age Bracket | Male | Female |
| Under 5 Years | 0 (0.0%) | 0 (0.0%) |
| 5 to 17 Years | 0 (0.0%) | 1 (0.5%) |
| 18 to 34 Years | 0 (0.0%) | 15 (4.2%) |
| 35 to 64 Years | 80 (15.3%) | 18 (6.2%) |
| 65 to 74 Years | 0 (0.0%) | 19 (11.0%) |
| 75 Years and over | 40 (54.0%) | 0 (0.0%) |
Disability Class: Vision Difficulty
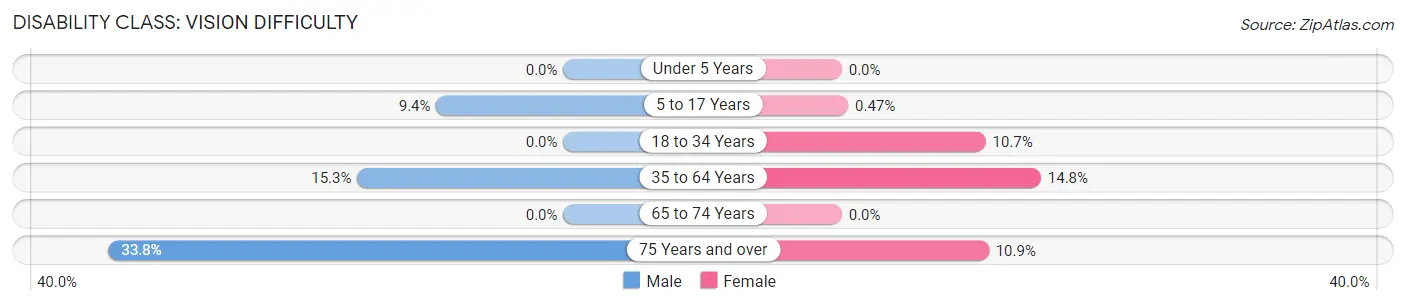
| Age Bracket | Male | Female |
| Under 5 Years | 0 (0.0%) | 0 (0.0%) |
| 5 to 17 Years | 33 (9.4%) | 1 (0.5%) |
| 18 to 34 Years | 0 (0.0%) | 38 (10.7%) |
| 35 to 64 Years | 80 (15.3%) | 43 (14.8%) |
| 65 to 74 Years | 0 (0.0%) | 0 (0.0%) |
| 75 Years and over | 25 (33.8%) | 12 (10.9%) |
Disability Class: Cognitive Difficulty
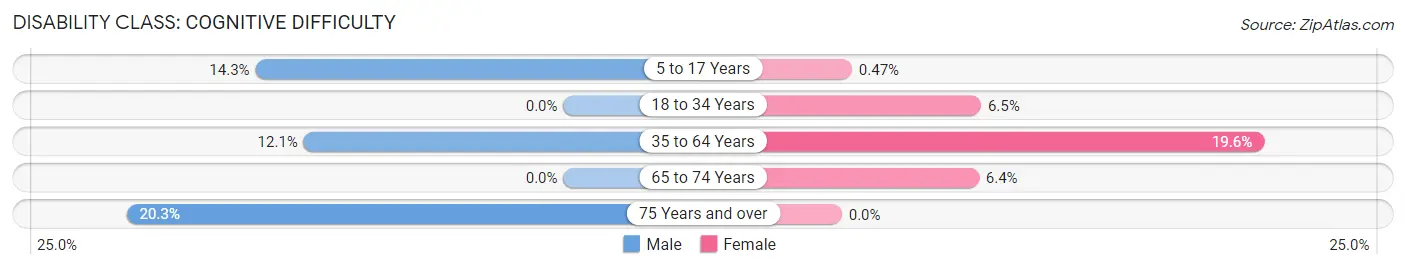
| Age Bracket | Male | Female |
| 5 to 17 Years | 50 (14.3%) | 1 (0.5%) |
| 18 to 34 Years | 0 (0.0%) | 23 (6.5%) |
| 35 to 64 Years | 63 (12.0%) | 57 (19.6%) |
| 65 to 74 Years | 0 (0.0%) | 11 (6.4%) |
| 75 Years and over | 15 (20.3%) | 0 (0.0%) |
Disability Class: Ambulatory Difficulty
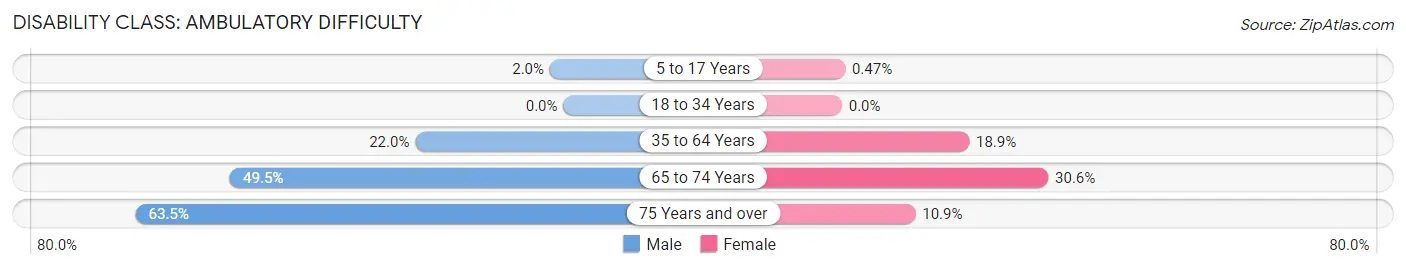
| Age Bracket | Male | Female |
| 5 to 17 Years | 7 (2.0%) | 1 (0.5%) |
| 18 to 34 Years | 0 (0.0%) | 0 (0.0%) |
| 35 to 64 Years | 115 (22.0%) | 55 (18.9%) |
| 65 to 74 Years | 47 (49.5%) | 53 (30.6%) |
| 75 Years and over | 47 (63.5%) | 12 (10.9%) |
Disability Class: Self-Care Difficulty
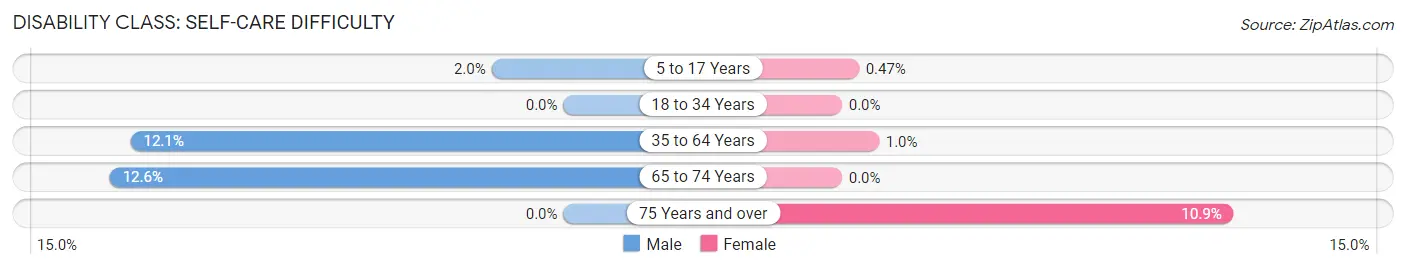
| Age Bracket | Male | Female |
| 5 to 17 Years | 7 (2.0%) | 1 (0.5%) |
| 18 to 34 Years | 0 (0.0%) | 0 (0.0%) |
| 35 to 64 Years | 63 (12.0%) | 3 (1.0%) |
| 65 to 74 Years | 12 (12.6%) | 0 (0.0%) |
| 75 Years and over | 0 (0.0%) | 12 (10.9%) |
Technology Access in Mar Mac
Computing Device Access in Mar Mac
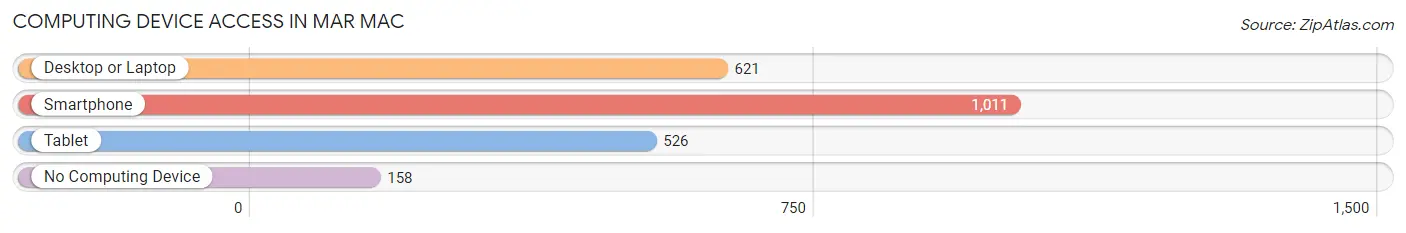
| Device Type | # Households | % Households |
| Desktop or Laptop | 621 | 52.6% |
| Smartphone | 1,011 | 85.6% |
| Tablet | 526 | 44.5% |
| No Computing Device | 158 | 13.4% |
| Total | 1,181 | 100.0% |
Internet Access in Mar Mac
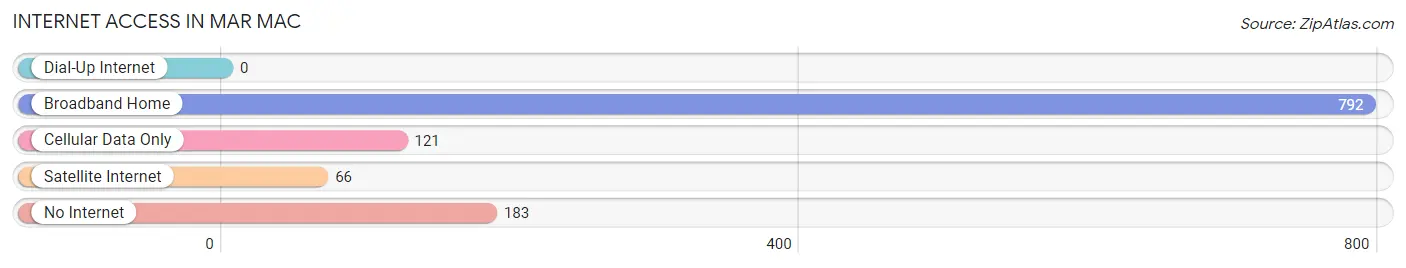
| Internet Type | # Households | % Households |
| Dial-Up Internet | 0 | 0.0% |
| Broadband Home | 792 | 67.1% |
| Cellular Data Only | 121 | 10.2% |
| Satellite Internet | 66 | 5.6% |
| No Internet | 183 | 15.5% |
| Total | 1,181 | 100.0% |
Mar Mac Summary
Mac, North Carolina is a small town located in the southeastern corner of the state, near the border with South Carolina. It is part of the Wilmington Metropolitan Statistical Area and is located in Brunswick County. The town has a population of approximately 1,500 people and is known for its rural charm and small-town atmosphere.
Geography
Mac is located in the southeastern corner of North Carolina, near the border with South Carolina. It is situated on the banks of the Cape Fear River, which provides a natural boundary between the two states. The town is located in the coastal plain region of the state, and is surrounded by a mix of forests, wetlands, and agricultural land. The climate in Mac is humid subtropical, with hot, humid summers and mild winters.
Economy
The economy of Mac is largely based on agriculture and tourism. The town is home to several farms, which produce a variety of crops, including corn, soybeans, and cotton. The town also has a thriving tourism industry, with visitors coming to enjoy the area’s natural beauty and outdoor activities. There are several restaurants, shops, and other businesses in the town, as well as a few small manufacturing companies.
Demographics
As of the 2010 census, the population of Mac was 1,500 people. The racial makeup of the town was 79.2% White, 16.2% African American, 0.7% Native American, 0.7% Asian, and 3.2% from other races. The median household income was $37,500, and the median family income was $45,000. The per capita income was $19,000.
History
Mac was first settled in the late 1700s by a group of settlers from Scotland. The town was originally known as Mac’s Landing, and was named after the Mac family, who were among the first settlers. The town was incorporated in 1883, and the name was changed to Mac. The town grew slowly over the years, and by the early 1900s, it had become a popular destination for tourists. The town was also home to several large farms, which produced a variety of crops.
In the late 20th century, Mac began to experience a decline in population as people moved away to larger cities. However, the town has seen a resurgence in recent years, with an influx of new businesses and residents. Today, Mac is a thriving small town with a strong sense of community and a vibrant economy.
Common Questions
What is Per Capita Income in Mar Mac?
Per Capita income in Mar Mac is $27,286.
What is the Median Family Income in Mar Mac?
Median Family Income in Mar Mac is $58,964.
What is the Median Household income in Mar Mac?
Median Household Income in Mar Mac is $50,286.
What is Income or Wage Gap in Mar Mac?
Income or Wage Gap in Mar Mac is 45.2%.
Women in Mar Mac earn 54.8 cents for every dollar earned by a man.
What is Inequality or Gini Index in Mar Mac?
Inequality or Gini Index in Mar Mac is 0.37.
What is the Total Population of Mar Mac?
Total Population of Mar Mac is 2,485.
What is the Total Male Population of Mar Mac?
Total Male Population of Mar Mac is 1,295.
What is the Total Female Population of Mar Mac?
Total Female Population of Mar Mac is 1,190.
What is the Ratio of Males per 100 Females in Mar Mac?
There are 108.82 Males per 100 Females in Mar Mac.
What is the Ratio of Females per 100 Males in Mar Mac?
There are 91.89 Females per 100 Males in Mar Mac.
What is the Median Population Age in Mar Mac?
Median Population Age in Mar Mac is 37.0 Years.
What is the Average Family Size in Mar Mac
Average Family Size in Mar Mac is 3.1 People.
What is the Average Household Size in Mar Mac
Average Household Size in Mar Mac is 2.1 People.
How Large is the Labor Force in Mar Mac?
There are 940 People in the Labor Forcein in Mar Mac.
What is the Percentage of People in the Labor Force in Mar Mac?
51.5% of People are in the Labor Force in Mar Mac.