Magnolia, NC Map & Demographics
Magnolia Map
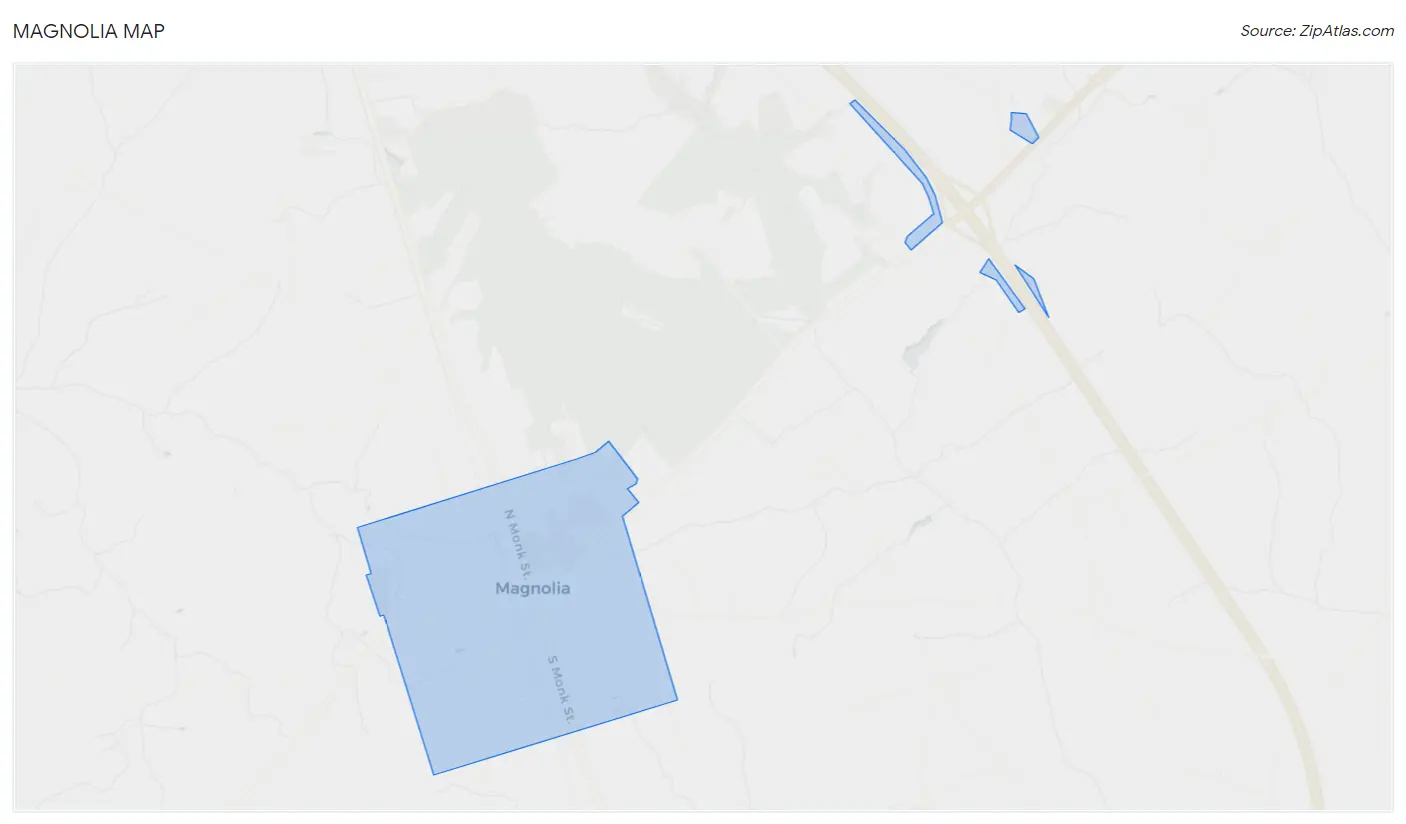
Magnolia Overview
$18,276
PER CAPITA INCOME
$35,357
AVG HOUSEHOLD INCOME
24.8%
WAGE / INCOME GAP [ % ]
75.2¢/ $1
WAGE / INCOME GAP [ $ ]
0.48
INEQUALITY / GINI INDEX
944
TOTAL POPULATION
458
MALE POPULATION
486
FEMALE POPULATION
94.24
MALES / 100 FEMALES
106.11
FEMALES / 100 MALES
34.5
MEDIAN AGE
2.9
AVG FAMILY SIZE
2.3
AVG HOUSEHOLD SIZE
465
LABOR FORCE [ PEOPLE ]
66.4%
PERCENT IN LABOR FORCE
4.3%
UNEMPLOYMENT RATE
Magnolia Zip Codes
Income in Magnolia
Income Overview in Magnolia
| Characteristic | Number | Measure |
| Per Capita Income | 944 | $18,276 |
| Median Family Income | 257 | $0 |
| Mean Family Income | 257 | $57,906 |
| Median Household Income | 400 | $35,357 |
| Mean Household Income | 400 | $50,381 |
| Income Deficit | 257 | $0 |
| Wage / Income Gap (%) | 944 | 24.83% |
| Wage / Income Gap ($) | 944 | 75.17¢ per $1 |
| Gini / Inequality Index | 944 | 0.48 |
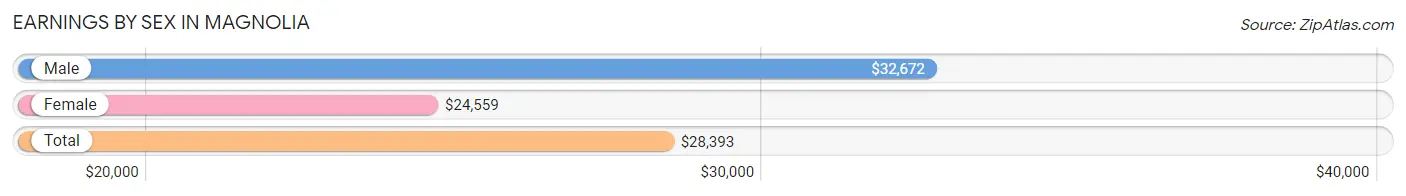
Earnings by Sex in Magnolia
Average Earnings in Magnolia are $28,393, $32,672 for men and $24,559 for women, a difference of 24.8%.
| Sex | Number | Average Earnings |
| Male | 265 (55.8%) | $32,672 |
| Female | 210 (44.2%) | $24,559 |
| Total | 475 (100.0%) | $28,393 |
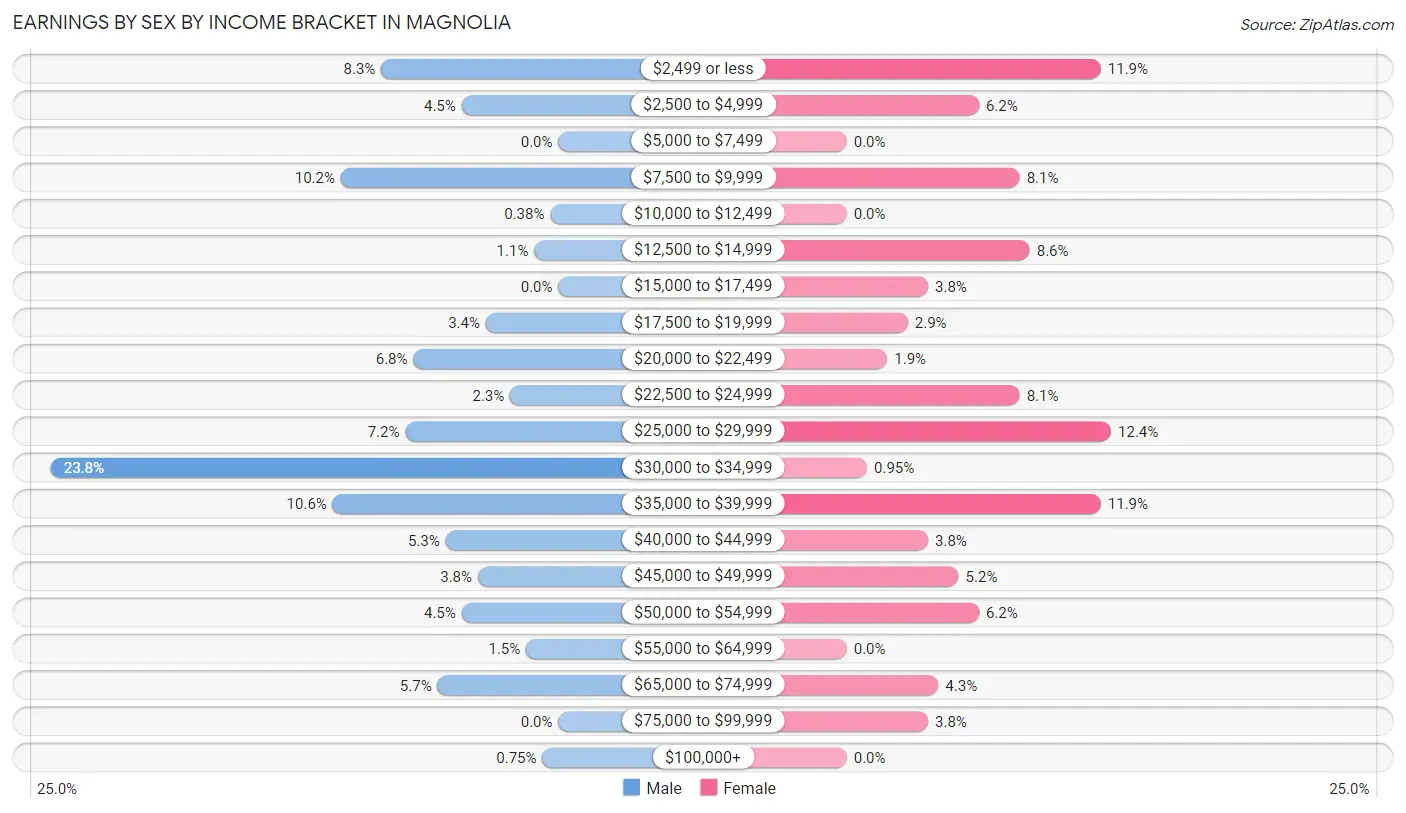
Earnings by Sex by Income Bracket in Magnolia
The most common earnings brackets in Magnolia are $30,000 to $34,999 for men (63 | 23.8%) and $25,000 to $29,999 for women (26 | 12.4%).
| Income | Male | Female |
| $2,499 or less | 22 (8.3%) | 25 (11.9%) |
| $2,500 to $4,999 | 12 (4.5%) | 13 (6.2%) |
| $5,000 to $7,499 | 0 (0.0%) | 0 (0.0%) |
| $7,500 to $9,999 | 27 (10.2%) | 17 (8.1%) |
| $10,000 to $12,499 | 1 (0.4%) | 0 (0.0%) |
| $12,500 to $14,999 | 3 (1.1%) | 18 (8.6%) |
| $15,000 to $17,499 | 0 (0.0%) | 8 (3.8%) |
| $17,500 to $19,999 | 9 (3.4%) | 6 (2.9%) |
| $20,000 to $22,499 | 18 (6.8%) | 4 (1.9%) |
| $22,500 to $24,999 | 6 (2.3%) | 17 (8.1%) |
| $25,000 to $29,999 | 19 (7.2%) | 26 (12.4%) |
| $30,000 to $34,999 | 63 (23.8%) | 2 (0.9%) |
| $35,000 to $39,999 | 28 (10.6%) | 25 (11.9%) |
| $40,000 to $44,999 | 14 (5.3%) | 8 (3.8%) |
| $45,000 to $49,999 | 10 (3.8%) | 11 (5.2%) |
| $50,000 to $54,999 | 12 (4.5%) | 13 (6.2%) |
| $55,000 to $64,999 | 4 (1.5%) | 0 (0.0%) |
| $65,000 to $74,999 | 15 (5.7%) | 9 (4.3%) |
| $75,000 to $99,999 | 0 (0.0%) | 8 (3.8%) |
| $100,000+ | 2 (0.7%) | 0 (0.0%) |
| Total | 265 (100.0%) | 210 (100.0%) |
Earnings by Sex by Educational Attainment in Magnolia
Average earnings in Magnolia are $33,015 for men and $24,559 for women, a difference of 25.6%. Men with an educational attainment of less than high school enjoy the highest average annual earnings of $33,529, while those with high school diploma education earn the least with $30,417. Women with an educational attainment of bachelor's degree earn the most with the average annual earnings of $50,313, while those with less than high school education have the smallest earnings of $21,563.

| Educational Attainment | Male Income | Female Income |
| Less than High School | $33,529 | $21,563 |
| High School Diploma | $30,417 | $28,214 |
| College or Associate's Degree | - | - |
| Bachelor's Degree | - | - |
| Graduate Degree | - | - |
| Total | $33,015 | $24,559 |
Family Income in Magnolia
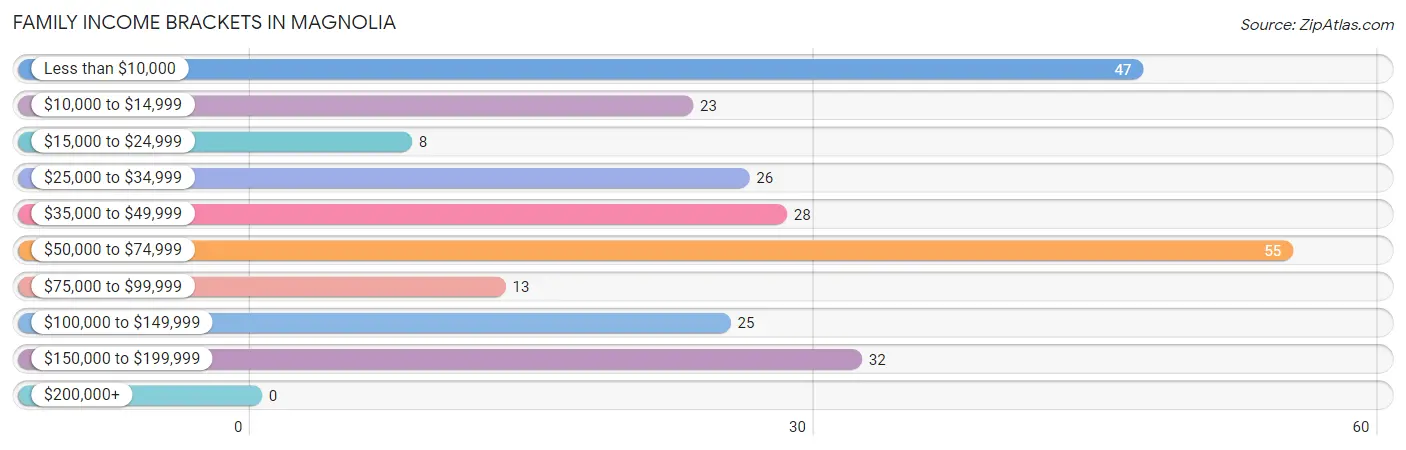
Family Income Brackets in Magnolia
According to the Magnolia family income data, there are 55 families falling into the $50,000 to $74,999 income range, which is the most common income bracket and makes up 21.4% of all families.
| Income Bracket | # Families | % Families |
| Less than $10,000 | 47 | 18.3% |
| $10,000 to $14,999 | 23 | 8.9% |
| $15,000 to $24,999 | 8 | 3.1% |
| $25,000 to $34,999 | 26 | 10.1% |
| $35,000 to $49,999 | 28 | 10.9% |
| $50,000 to $74,999 | 55 | 21.4% |
| $75,000 to $99,999 | 13 | 5.1% |
| $100,000 to $149,999 | 25 | 9.7% |
| $150,000 to $199,999 | 32 | 12.5% |
| $200,000+ | 0 | 0.0% |
Family Income by Famaliy Size in Magnolia
4-person families (32 | 12.4%) account for the highest median family income in Magnolia with $8,529 per family, while 4-person families (32 | 12.4%) have the highest median income of $2,132 per family member.
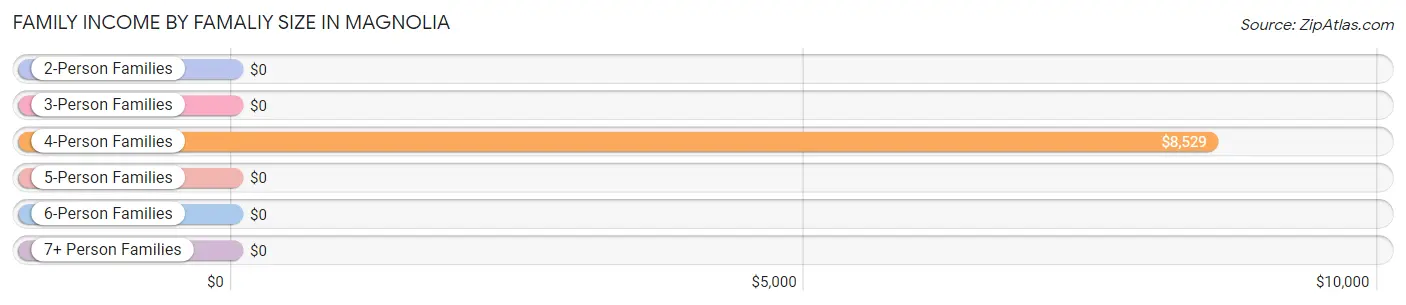
| Income Bracket | # Families | Median Income |
| 2-Person Families | 97 (37.7%) | $0 |
| 3-Person Families | 88 (34.2%) | $0 |
| 4-Person Families | 32 (12.4%) | $8,529 |
| 5-Person Families | 0 (0.0%) | $0 |
| 6-Person Families | 37 (14.4%) | $0 |
| 7+ Person Families | 3 (1.2%) | $0 |
| Total | 257 (100.0%) | $0 |
Family Income by Number of Earners in Magnolia
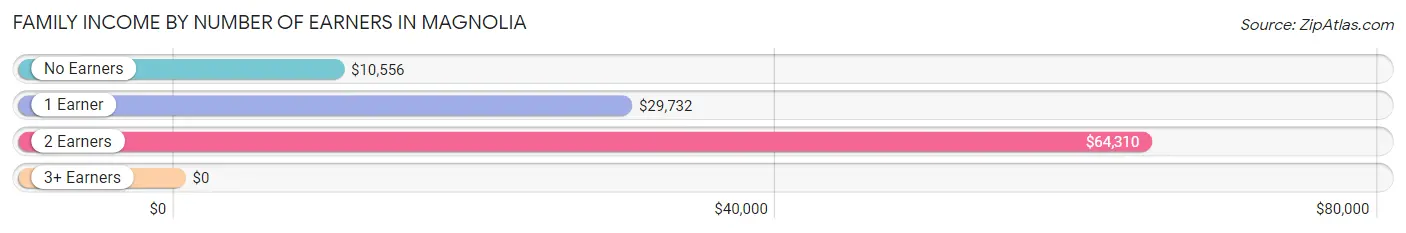
| Number of Earners | # Families | Median Income |
| No Earners | 36 (14.0%) | $10,556 |
| 1 Earner | 113 (44.0%) | $29,732 |
| 2 Earners | 70 (27.2%) | $64,310 |
| 3+ Earners | 38 (14.8%) | $0 |
| Total | 257 (100.0%) | $0 |
Household Income in Magnolia
Household Income Brackets in Magnolia
With 68 households falling in the category, the less than $10,000 income range is the most frequent in Magnolia, accounting for 17.0% of all households. In contrast, only 2 households (0.5%) fall into the $200,000+ income bracket, making it the least populous group.
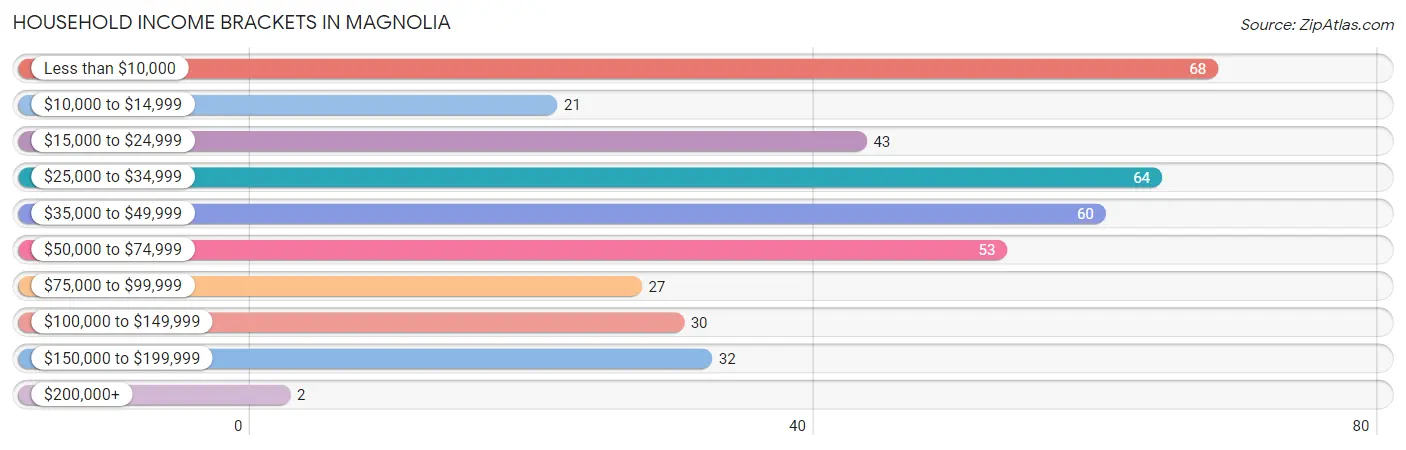
| Income Bracket | # Households | % Households |
| Less than $10,000 | 68 | 17.0% |
| $10,000 to $14,999 | 21 | 5.3% |
| $15,000 to $24,999 | 43 | 10.8% |
| $25,000 to $34,999 | 64 | 16.0% |
| $35,000 to $49,999 | 60 | 15.0% |
| $50,000 to $74,999 | 53 | 13.3% |
| $75,000 to $99,999 | 27 | 6.8% |
| $100,000 to $149,999 | 30 | 7.5% |
| $150,000 to $199,999 | 32 | 8.0% |
| $200,000+ | 2 | 0.5% |
Household Income by Householder Age in Magnolia
The median household income in Magnolia is $35,357, with the highest median household income of $102,857 found in the 45 to 64 years age bracket for the primary householder. A total of 110 households (27.5%) fall into this category. Meanwhile, the 15 to 24 years age bracket for the primary householder has the lowest median household income of $0, with 23 households (5.8%) in this group.
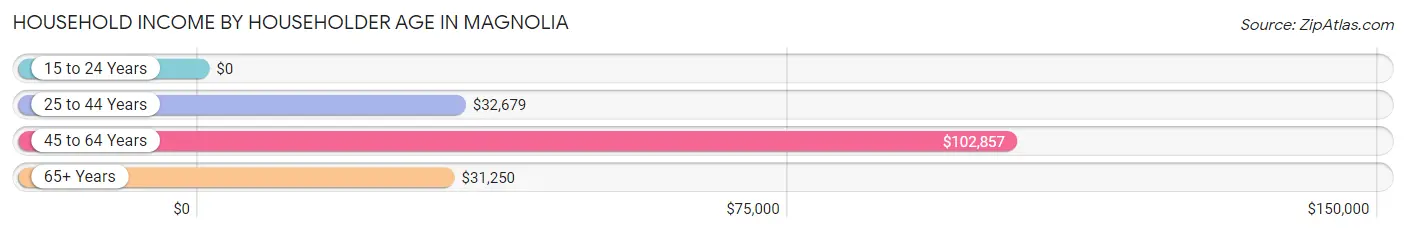
| Income Bracket | # Households | Median Income |
| 15 to 24 Years | 23 (5.8%) | $0 |
| 25 to 44 Years | 167 (41.7%) | $32,679 |
| 45 to 64 Years | 110 (27.5%) | $102,857 |
| 65+ Years | 100 (25.0%) | $31,250 |
| Total | 400 (100.0%) | $35,357 |
Poverty in Magnolia
Income Below Poverty by Sex and Age in Magnolia
With 37.3% poverty level for males and 38.9% for females among the residents of Magnolia, 12 to 14 year old males and 35 to 44 year old females are the most vulnerable to poverty, with 40 males (100.0%) and 45 females (69.2%) in their respective age groups living below the poverty level.
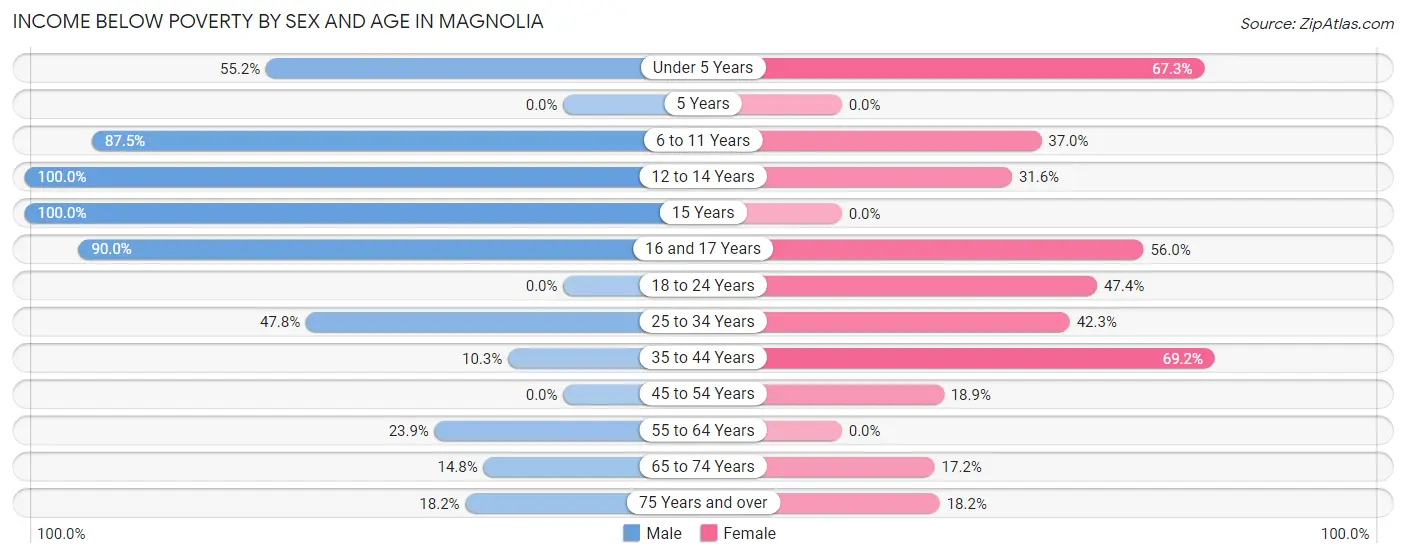
| Age Bracket | Male | Female |
| Under 5 Years | 16 (55.2%) | 37 (67.3%) |
| 5 Years | 0 (0.0%) | 0 (0.0%) |
| 6 to 11 Years | 28 (87.5%) | 10 (37.0%) |
| 12 to 14 Years | 40 (100.0%) | 12 (31.6%) |
| 15 Years | 16 (100.0%) | 0 (0.0%) |
| 16 and 17 Years | 9 (90.0%) | 14 (56.0%) |
| 18 to 24 Years | 0 (0.0%) | 18 (47.4%) |
| 25 to 34 Years | 32 (47.8%) | 33 (42.3%) |
| 35 to 44 Years | 8 (10.3%) | 45 (69.2%) |
| 45 to 54 Years | 0 (0.0%) | 7 (18.9%) |
| 55 to 64 Years | 16 (23.9%) | 0 (0.0%) |
| 65 to 74 Years | 4 (14.8%) | 5 (17.2%) |
| 75 Years and over | 2 (18.2%) | 8 (18.2%) |
| Total | 171 (37.3%) | 189 (38.9%) |
Income Above Poverty by Sex and Age in Magnolia
According to the poverty statistics in Magnolia, males aged 18 to 24 years and females aged 5 years are the age groups that are most secure financially, with 100.0% of males and 100.0% of females in these age groups living above the poverty line.
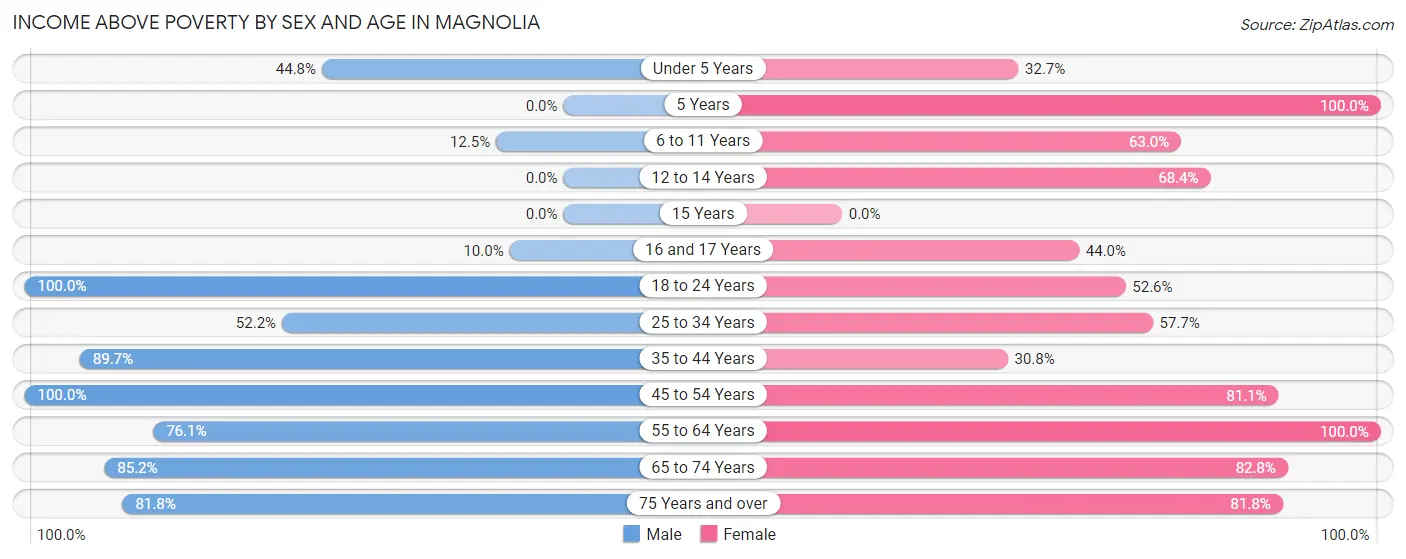
| Age Bracket | Male | Female |
| Under 5 Years | 13 (44.8%) | 18 (32.7%) |
| 5 Years | 0 (0.0%) | 7 (100.0%) |
| 6 to 11 Years | 4 (12.5%) | 17 (63.0%) |
| 12 to 14 Years | 0 (0.0%) | 26 (68.4%) |
| 15 Years | 0 (0.0%) | 0 (0.0%) |
| 16 and 17 Years | 1 (10.0%) | 11 (44.0%) |
| 18 to 24 Years | 32 (100.0%) | 20 (52.6%) |
| 25 to 34 Years | 35 (52.2%) | 45 (57.7%) |
| 35 to 44 Years | 70 (89.7%) | 20 (30.8%) |
| 45 to 54 Years | 49 (100.0%) | 30 (81.1%) |
| 55 to 64 Years | 51 (76.1%) | 43 (100.0%) |
| 65 to 74 Years | 23 (85.2%) | 24 (82.8%) |
| 75 Years and over | 9 (81.8%) | 36 (81.8%) |
| Total | 287 (62.7%) | 297 (61.1%) |
Income Below Poverty Among Married-Couple Families in Magnolia
The poverty statistics for married-couple families in Magnolia show that 2.5% or 3 of the total 121 families live below the poverty line. Families with 3 or 4 children have the highest poverty rate of 100.0%, comprising of 3 families. On the other hand, families with no children have the lowest poverty rate of 0.0%, which includes 0 families.
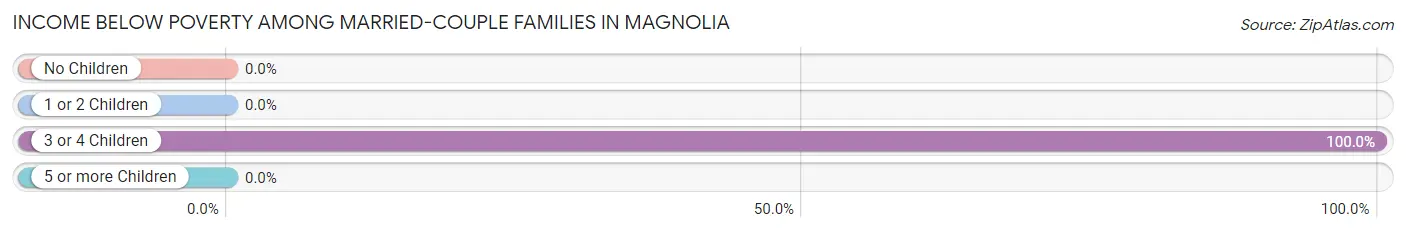
| Children | Above Poverty | Below Poverty |
| No Children | 85 (100.0%) | 0 (0.0%) |
| 1 or 2 Children | 33 (100.0%) | 0 (0.0%) |
| 3 or 4 Children | 0 (0.0%) | 3 (100.0%) |
| 5 or more Children | 0 (0.0%) | 0 (0.0%) |
| Total | 118 (97.5%) | 3 (2.5%) |
Income Below Poverty Among Single-Parent Households in Magnolia
According to the poverty data in Magnolia, 4.5% or 1 single-father households and 65.8% or 75 single-mother households are living below the poverty line. Among single-father households, those with no children have the highest poverty rate, with 1 households (6.7%) experiencing poverty. Likewise, among single-mother households, those with 3 or 4 children have the highest poverty rate, with 26 households (100.0%) falling below the poverty line.
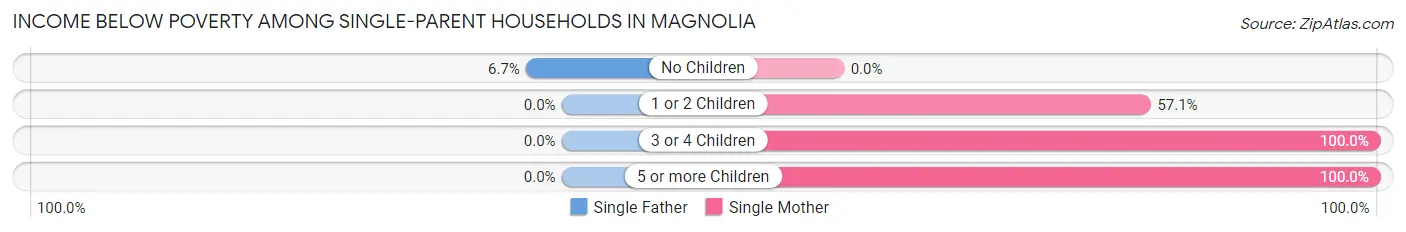
| Children | Single Father | Single Mother |
| No Children | 1 (6.7%) | 0 (0.0%) |
| 1 or 2 Children | 0 (0.0%) | 44 (57.1%) |
| 3 or 4 Children | 0 (0.0%) | 26 (100.0%) |
| 5 or more Children | 0 (0.0%) | 5 (100.0%) |
| Total | 1 (4.5%) | 75 (65.8%) |
Income Below Poverty Among Married-Couple vs Single-Parent Households in Magnolia
The poverty data for Magnolia shows that 3 of the married-couple family households (2.5%) and 76 of the single-parent households (55.9%) are living below the poverty level. Within the married-couple family households, those with 3 or 4 children have the highest poverty rate, with 3 households (100.0%) falling below the poverty line. Among the single-parent households, those with 3 or 4 children have the highest poverty rate, with 26 household (100.0%) living below poverty.
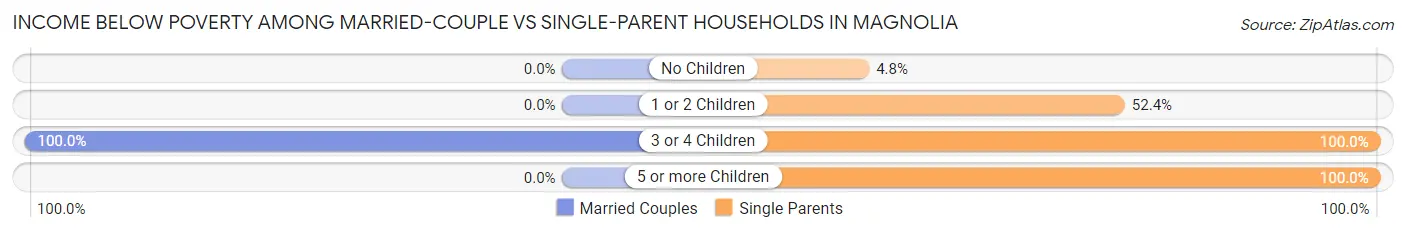
| Children | Married-Couple Families | Single-Parent Households |
| No Children | 0 (0.0%) | 1 (4.8%) |
| 1 or 2 Children | 0 (0.0%) | 44 (52.4%) |
| 3 or 4 Children | 3 (100.0%) | 26 (100.0%) |
| 5 or more Children | 0 (0.0%) | 5 (100.0%) |
| Total | 3 (2.5%) | 76 (55.9%) |
Race in Magnolia
The most populous races in Magnolia are White / Caucasian (411 | 43.5%), Hispanic or Latino (346 | 36.6%), and Black / African American (336 | 35.6%).
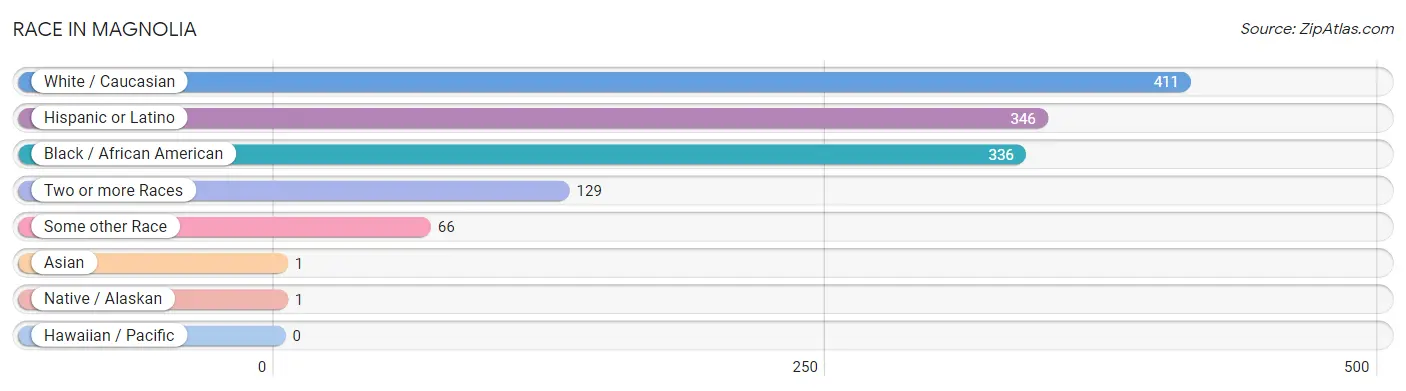
| Race | # Population | % Population |
| Asian | 1 | 0.1% |
| Black / African American | 336 | 35.6% |
| Hawaiian / Pacific | 0 | 0.0% |
| Hispanic or Latino | 346 | 36.6% |
| Native / Alaskan | 1 | 0.1% |
| White / Caucasian | 411 | 43.5% |
| Two or more Races | 129 | 13.7% |
| Some other Race | 66 | 7.0% |
| Total | 944 | 100.0% |
Ancestry in Magnolia
The most populous ancestries reported in Magnolia are Central American (197 | 20.9%), Honduran (167 | 17.7%), Mexican (96 | 10.2%), American (57 | 6.0%), and Irish (35 | 3.7%), together accounting for 58.5% of all Magnolia residents.
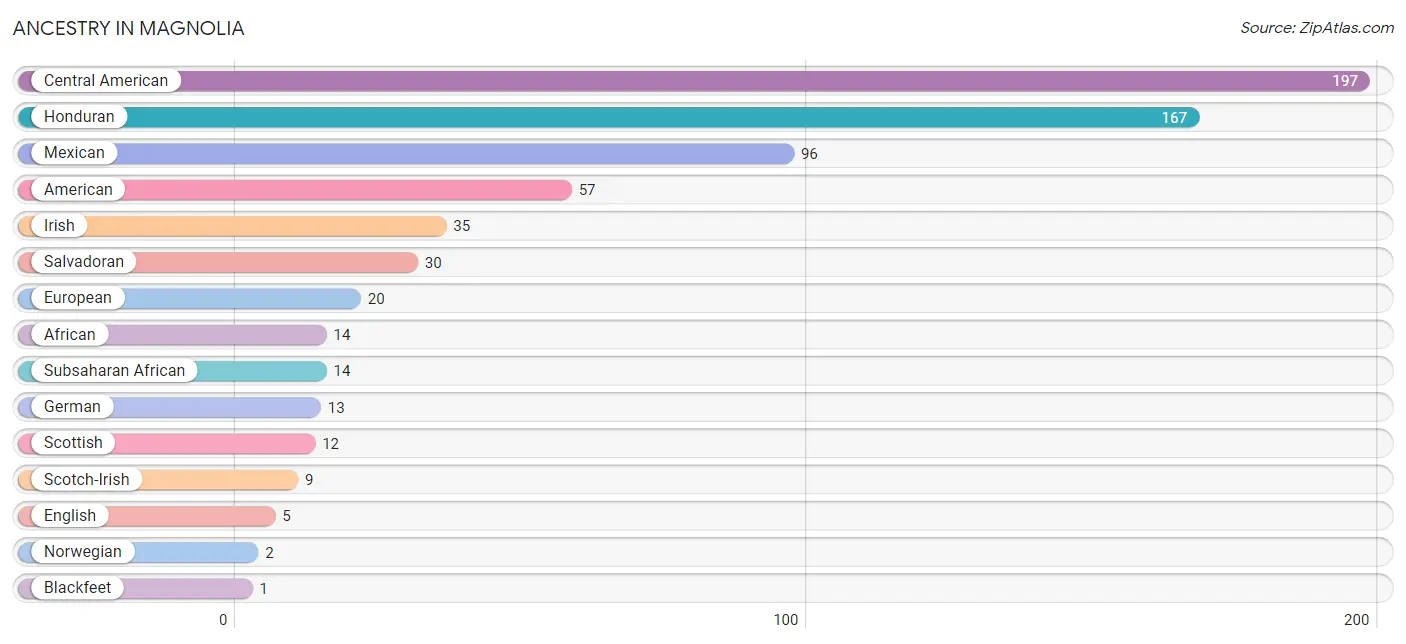
| Ancestry | # Population | % Population |
| African | 14 | 1.5% |
| American | 57 | 6.0% |
| Blackfeet | 1 | 0.1% |
| Bulgarian | 1 | 0.1% |
| Burmese | 1 | 0.1% |
| Central American | 197 | 20.9% |
| English | 5 | 0.5% |
| European | 20 | 2.1% |
| German | 13 | 1.4% |
| Honduran | 167 | 17.7% |
| Irish | 35 | 3.7% |
| Mexican | 96 | 10.2% |
| Norwegian | 2 | 0.2% |
| Salvadoran | 30 | 3.2% |
| Scotch-Irish | 9 | 0.9% |
| Scottish | 12 | 1.3% |
| Subsaharan African | 14 | 1.5% |
| Welsh | 1 | 0.1% | View All 18 Rows |
Immigrants in Magnolia
The most numerous immigrant groups reported in Magnolia came from Central America (201 | 21.3%), Latin America (201 | 21.3%), Honduras (137 | 14.5%), Mexico (45 | 4.8%), and El Salvador (19 | 2.0%), together accounting for 63.9% of all Magnolia residents.
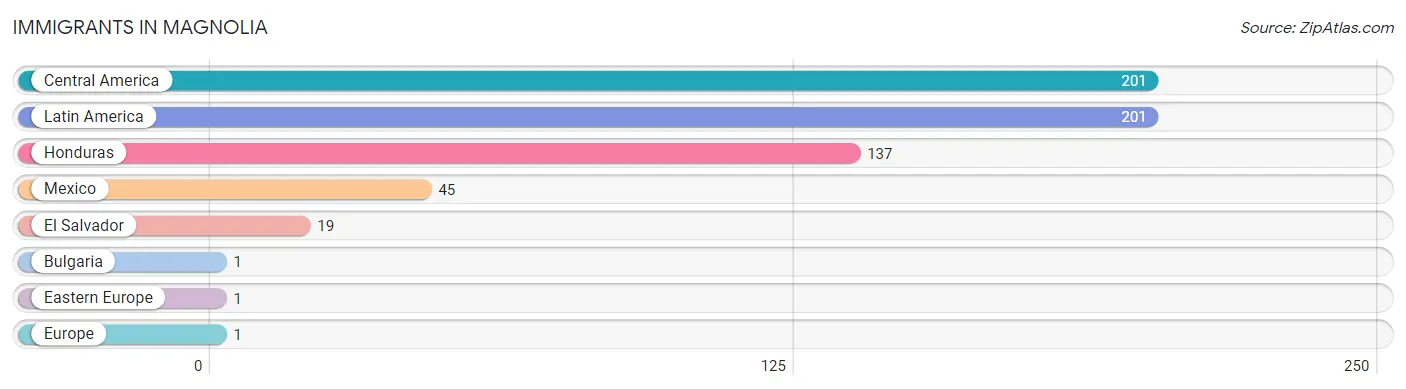
| Immigration Origin | # Population | % Population |
| Bulgaria | 1 | 0.1% |
| Central America | 201 | 21.3% |
| Eastern Europe | 1 | 0.1% |
| El Salvador | 19 | 2.0% |
| Europe | 1 | 0.1% |
| Honduras | 137 | 14.5% |
| Latin America | 201 | 21.3% |
| Mexico | 45 | 4.8% | View All 8 Rows |
Sex and Age in Magnolia
Sex and Age in Magnolia
The most populous age groups in Magnolia are 10 to 14 Years (72 | 15.7%) for men and 30 to 34 Years (72 | 14.8%) for women.
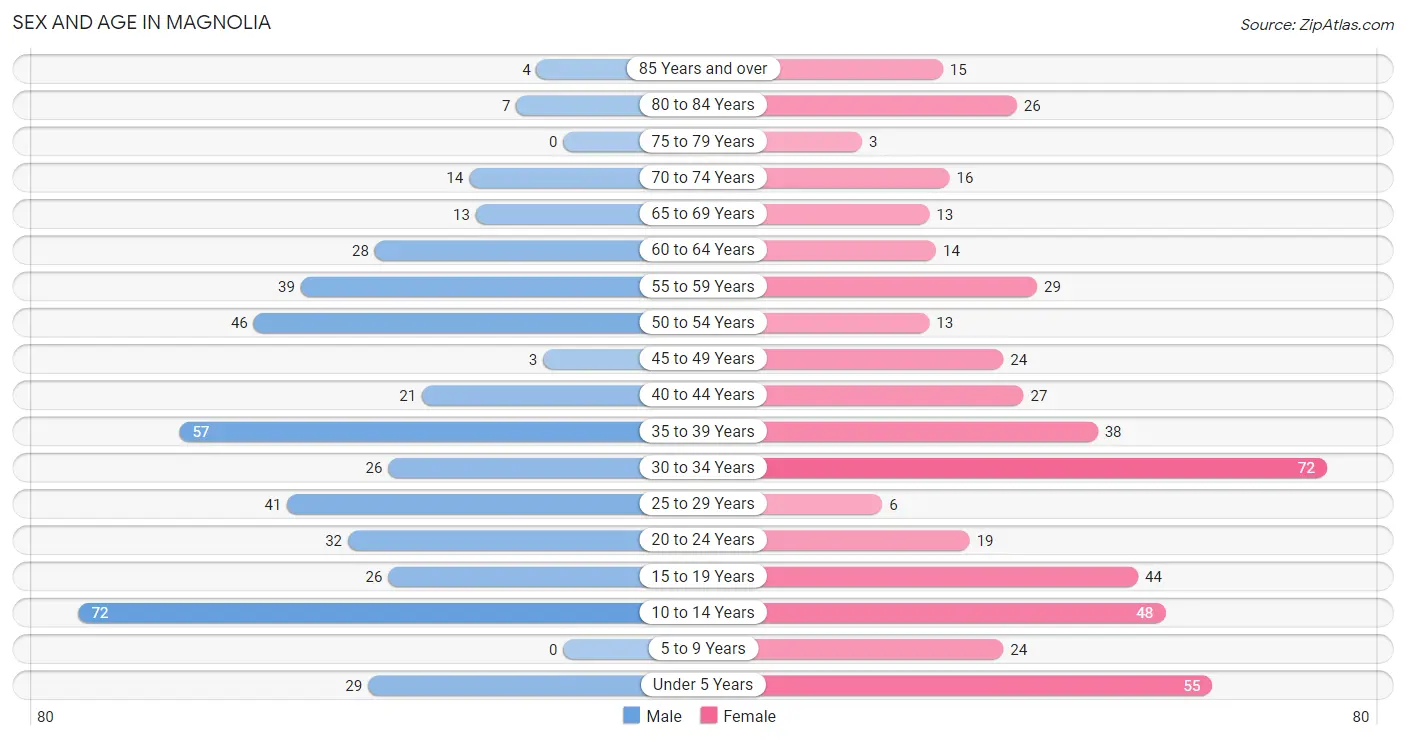
| Age Bracket | Male | Female |
| Under 5 Years | 29 (6.3%) | 55 (11.3%) |
| 5 to 9 Years | 0 (0.0%) | 24 (4.9%) |
| 10 to 14 Years | 72 (15.7%) | 48 (9.9%) |
| 15 to 19 Years | 26 (5.7%) | 44 (9.0%) |
| 20 to 24 Years | 32 (7.0%) | 19 (3.9%) |
| 25 to 29 Years | 41 (8.9%) | 6 (1.2%) |
| 30 to 34 Years | 26 (5.7%) | 72 (14.8%) |
| 35 to 39 Years | 57 (12.4%) | 38 (7.8%) |
| 40 to 44 Years | 21 (4.6%) | 27 (5.6%) |
| 45 to 49 Years | 3 (0.7%) | 24 (4.9%) |
| 50 to 54 Years | 46 (10.0%) | 13 (2.7%) |
| 55 to 59 Years | 39 (8.5%) | 29 (6.0%) |
| 60 to 64 Years | 28 (6.1%) | 14 (2.9%) |
| 65 to 69 Years | 13 (2.8%) | 13 (2.7%) |
| 70 to 74 Years | 14 (3.1%) | 16 (3.3%) |
| 75 to 79 Years | 0 (0.0%) | 3 (0.6%) |
| 80 to 84 Years | 7 (1.5%) | 26 (5.3%) |
| 85 Years and over | 4 (0.9%) | 15 (3.1%) |
| Total | 458 (100.0%) | 486 (100.0%) |
Families and Households in Magnolia
Median Family Size in Magnolia
The median family size in Magnolia is 2.86 persons per family, with single female/mother families (114 | 44.4%) accounting for the largest median family size of 3.07 persons per family. On the other hand, single male/father families (22 | 8.6%) represent the smallest median family size with 2.09 persons per family.
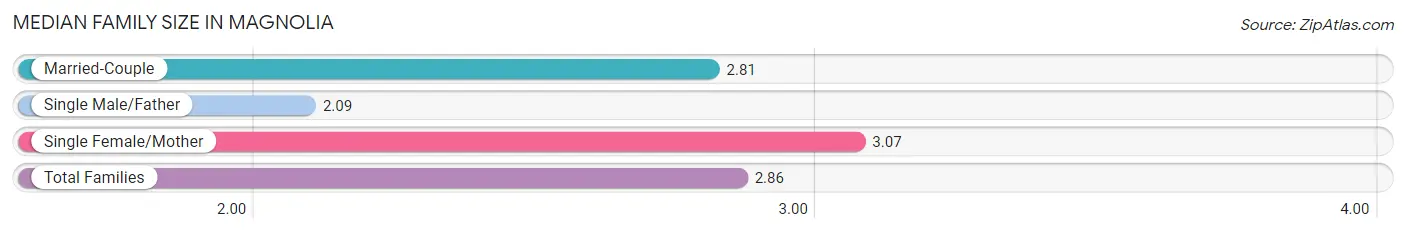
| Family Type | # Families | Family Size |
| Married-Couple | 121 (47.1%) | 2.81 |
| Single Male/Father | 22 (8.6%) | 2.09 |
| Single Female/Mother | 114 (44.4%) | 3.07 |
| Total Families | 257 (100.0%) | 2.86 |
Median Household Size in Magnolia
The median household size in Magnolia is 2.34 persons per household, with single female/mother households (114 | 28.5%) accounting for the largest median household size of 3.28 persons per household. non-family households (143 | 35.7%) represent the smallest median household size with 1.14 persons per household.
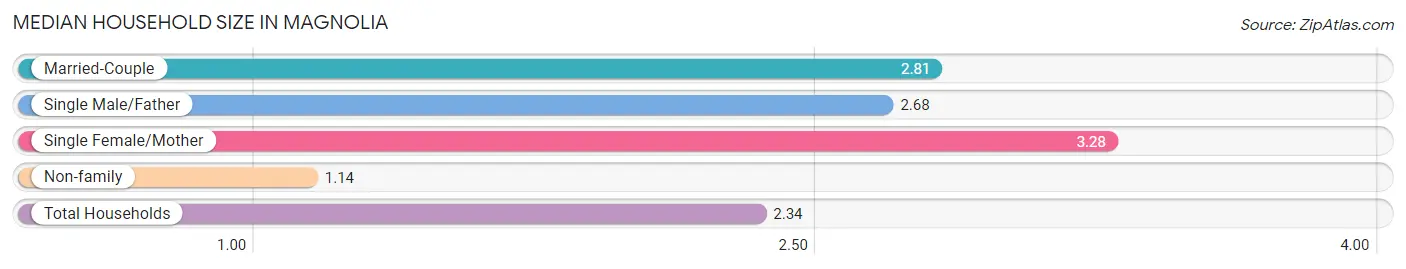
| Household Type | # Households | Household Size |
| Married-Couple | 121 (30.2%) | 2.81 |
| Single Male/Father | 22 (5.5%) | 2.68 |
| Single Female/Mother | 114 (28.5%) | 3.28 |
| Non-family | 143 (35.7%) | 1.14 |
| Total Households | 400 (100.0%) | 2.34 |
Household Size by Marriage Status in Magnolia
Out of a total of 400 households in Magnolia, 257 (64.2%) are family households, while 143 (35.7%) are nonfamily households. The most numerous type of family households are 3-person households, comprising 102, and the most common type of nonfamily households are 1-person households, comprising 118.
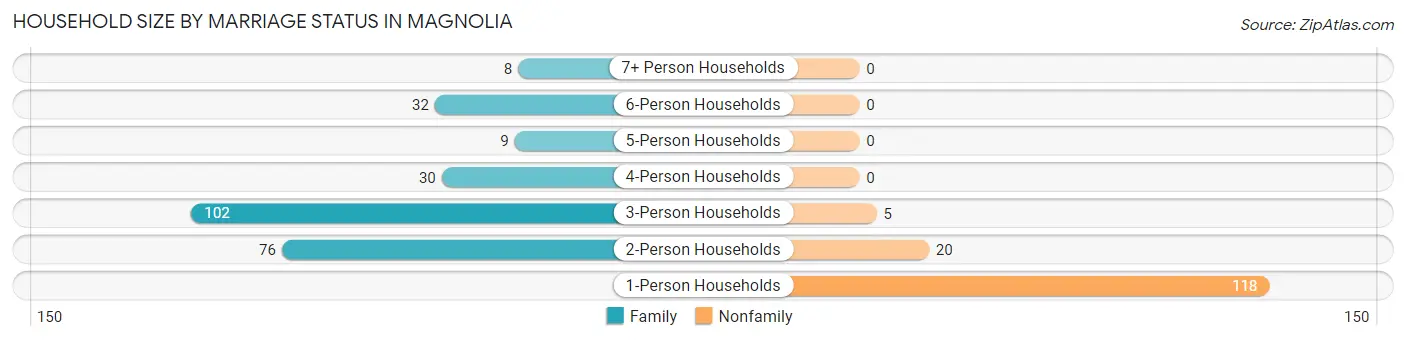
| Household Size | Family Households | Nonfamily Households |
| 1-Person Households | - | 118 (29.5%) |
| 2-Person Households | 76 (19.0%) | 20 (5.0%) |
| 3-Person Households | 102 (25.5%) | 5 (1.3%) |
| 4-Person Households | 30 (7.5%) | 0 (0.0%) |
| 5-Person Households | 9 (2.2%) | 0 (0.0%) |
| 6-Person Households | 32 (8.0%) | 0 (0.0%) |
| 7+ Person Households | 8 (2.0%) | 0 (0.0%) |
| Total | 257 (64.2%) | 143 (35.7%) |
Female Fertility in Magnolia
Fertility by Age in Magnolia
Average fertility rate in Magnolia is 43.0 births per 1,000 women. Women in the age bracket of 35 to 50 years have the highest fertility rate with 67.0 births per 1,000 women. Women in the age bracket of 35 to 50 years acount for 60.0% of all women with births.
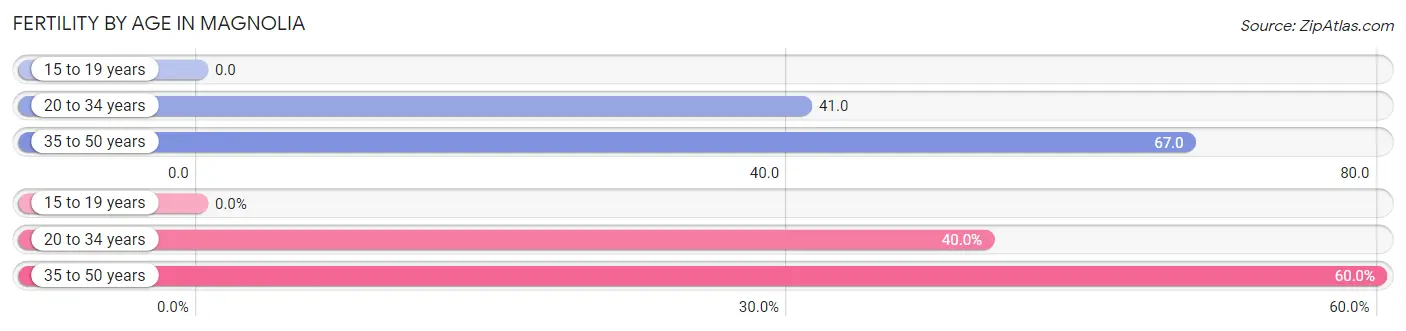
| Age Bracket | Women with Births | Births / 1,000 Women |
| 15 to 19 years | 0 (0.0%) | 0.0 |
| 20 to 34 years | 4 (40.0%) | 41.0 |
| 35 to 50 years | 6 (60.0%) | 67.0 |
| Total | 10 (100.0%) | 43.0 |
Fertility by Age by Marriage Status in Magnolia
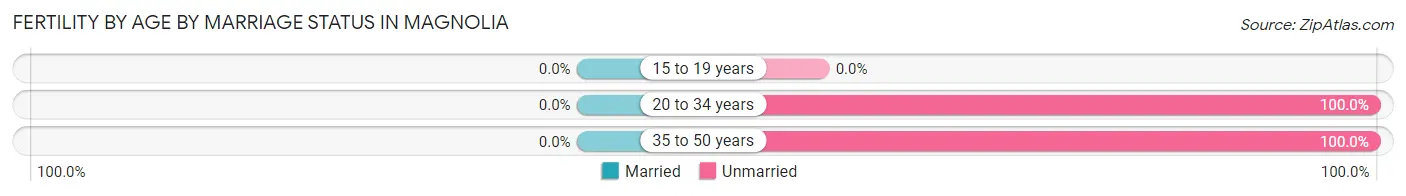
| Age Bracket | Married | Unmarried |
| 15 to 19 years | 0 (0.0%) | 0 (0.0%) |
| 20 to 34 years | 0 (0.0%) | 4 (100.0%) |
| 35 to 50 years | 0 (0.0%) | 6 (100.0%) |
| Total | 0 (0.0%) | 10 (100.0%) |
Fertility by Education in Magnolia
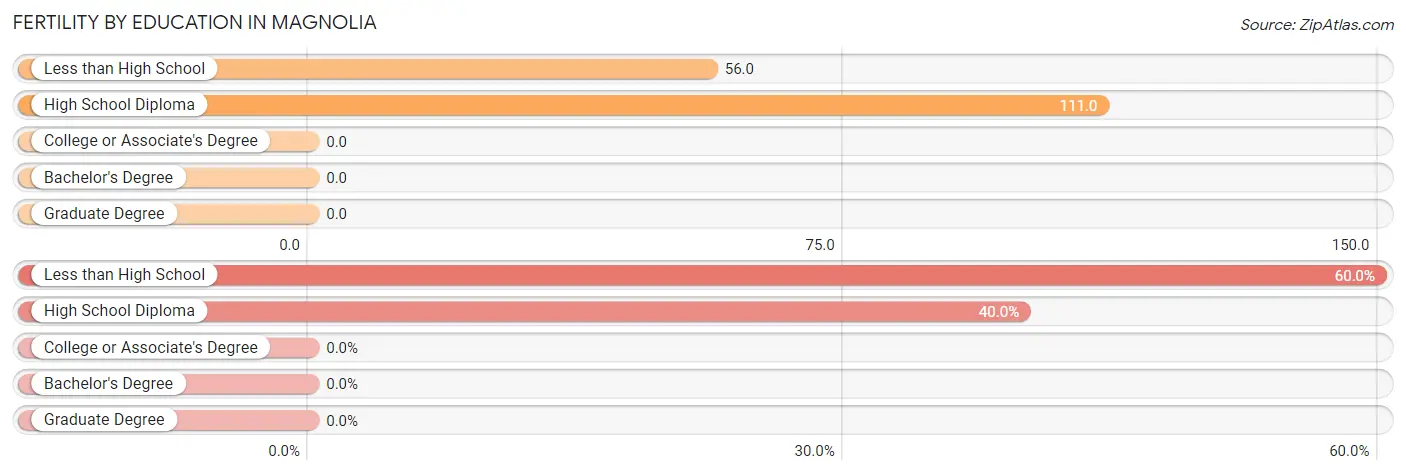
| Educational Attainment | Women with Births | Births / 1,000 Women |
| Less than High School | 6 (60.0%) | 56.0 |
| High School Diploma | 4 (40.0%) | 111.0 |
| College or Associate's Degree | 0 (0.0%) | 0.0 |
| Bachelor's Degree | 0 (0.0%) | 0.0 |
| Graduate Degree | 0 (0.0%) | 0.0 |
| Total | 10 (100.0%) | 43.0 |
Fertility by Education by Marriage Status in Magnolia
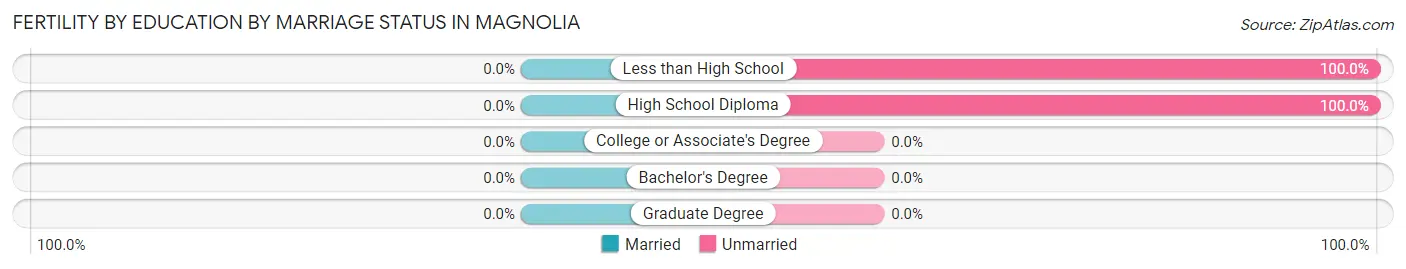
| Educational Attainment | Married | Unmarried |
| Less than High School | 0 (0.0%) | 6 (100.0%) |
| High School Diploma | 0 (0.0%) | 4 (100.0%) |
| College or Associate's Degree | 0 (0.0%) | 0 (0.0%) |
| Bachelor's Degree | 0 (0.0%) | 0 (0.0%) |
| Graduate Degree | 0 (0.0%) | 0 (0.0%) |
| Total | 0 (0.0%) | 10 (100.0%) |
Employment Characteristics in Magnolia
Employment by Class of Employer in Magnolia
Among the 444 employed individuals in Magnolia, private company employees (342 | 77.0%), self-employed (not incorporated) (30 | 6.8%), and local government employees (30 | 6.8%) make up the most common classes of employment.
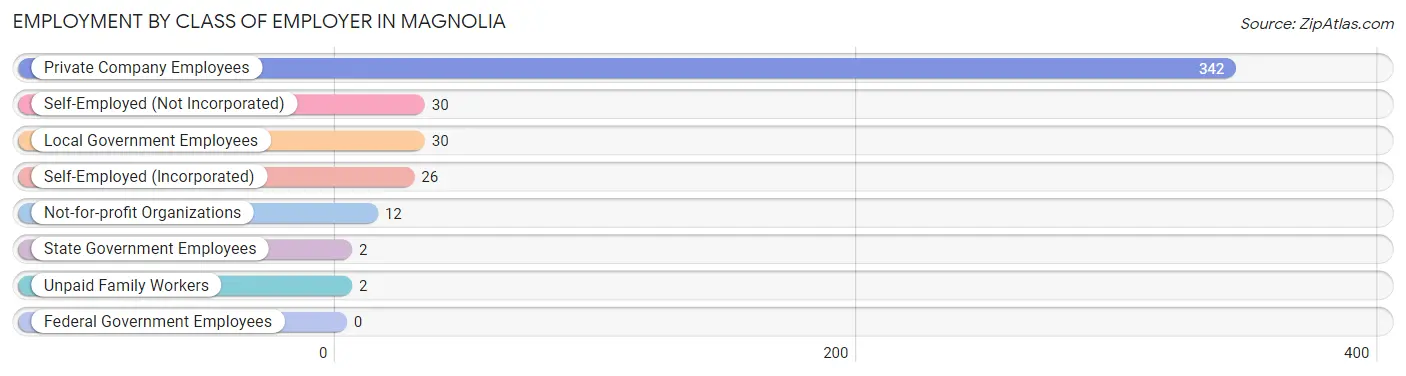
| Employer Class | # Employees | % Employees |
| Private Company Employees | 342 | 77.0% |
| Self-Employed (Incorporated) | 26 | 5.9% |
| Self-Employed (Not Incorporated) | 30 | 6.8% |
| Not-for-profit Organizations | 12 | 2.7% |
| Local Government Employees | 30 | 6.8% |
| State Government Employees | 2 | 0.4% |
| Federal Government Employees | 0 | 0.0% |
| Unpaid Family Workers | 2 | 0.4% |
| Total | 444 | 100.0% |
Employment Status by Age in Magnolia
According to the labor force statistics for Magnolia, out of the total population over 16 years of age (700), 66.4% or 465 individuals are in the labor force, with 4.3% or 20 of them unemployed. The age group with the highest labor force participation rate is 20 to 24 years, with 92.2% or 47 individuals in the labor force. Within the labor force, the 16 to 19 years age range has the highest percentage of unemployed individuals, with 66.7% or 10 of them being unemployed.
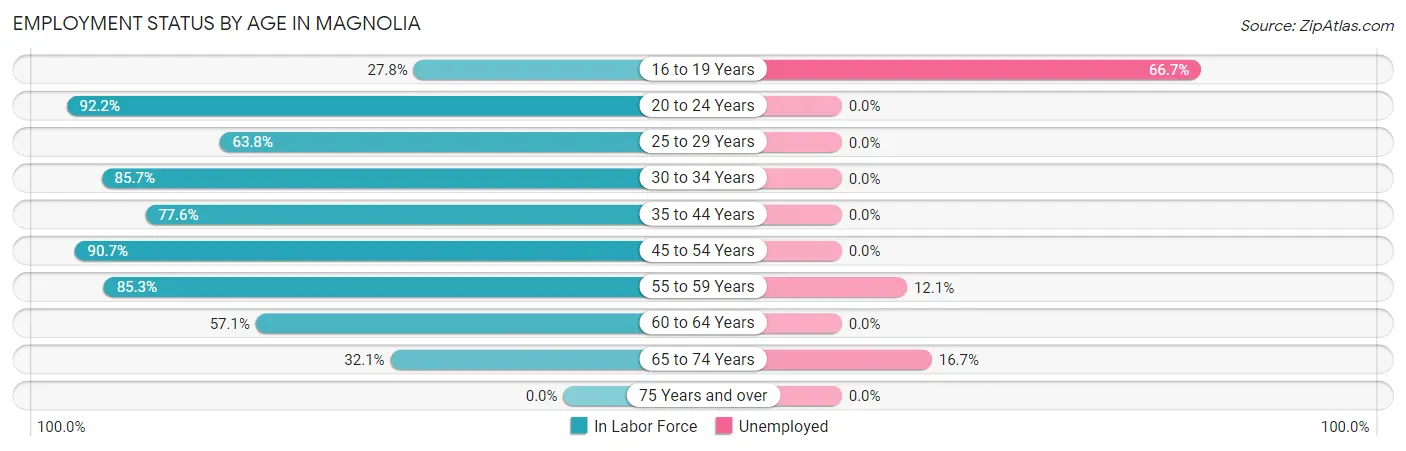
| Age Bracket | In Labor Force | Unemployed |
| 16 to 19 Years | 15 (27.8%) | 10 (66.7%) |
| 20 to 24 Years | 47 (92.2%) | 0 (0.0%) |
| 25 to 29 Years | 30 (63.8%) | 0 (0.0%) |
| 30 to 34 Years | 84 (85.7%) | 0 (0.0%) |
| 35 to 44 Years | 111 (77.6%) | 0 (0.0%) |
| 45 to 54 Years | 78 (90.7%) | 0 (0.0%) |
| 55 to 59 Years | 58 (85.3%) | 7 (12.1%) |
| 60 to 64 Years | 24 (57.1%) | 0 (0.0%) |
| 65 to 74 Years | 18 (32.1%) | 3 (16.7%) |
| 75 Years and over | 0 (0.0%) | 0 (0.0%) |
| Total | 465 (66.4%) | 20 (4.3%) |
Employment Status by Educational Attainment in Magnolia
According to labor force statistics for Magnolia, 79.5% of individuals (385) out of the total population between 25 and 64 years of age (484) are in the labor force, with 1.8% or 7 of them being unemployed. The group with the highest labor force participation rate are those with the educational attainment of college / associate degree, with 94.4% or 102 individuals in the labor force. Within the labor force, individuals with high school diploma education have the highest percentage of unemployment, with 7.1% or 7 of them being unemployed.
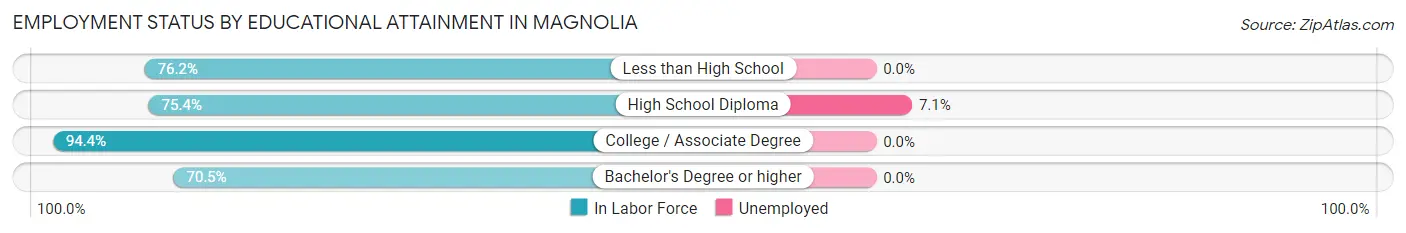
| Educational Attainment | In Labor Force | Unemployed |
| Less than High School | 154 (76.2%) | 0 (0.0%) |
| High School Diploma | 98 (75.4%) | 9 (7.1%) |
| College / Associate Degree | 102 (94.4%) | 0 (0.0%) |
| Bachelor's Degree or higher | 31 (70.5%) | 0 (0.0%) |
| Total | 385 (79.5%) | 9 (1.8%) |
Employment Occupations by Sex in Magnolia
Management, Business, Science and Arts Occupations
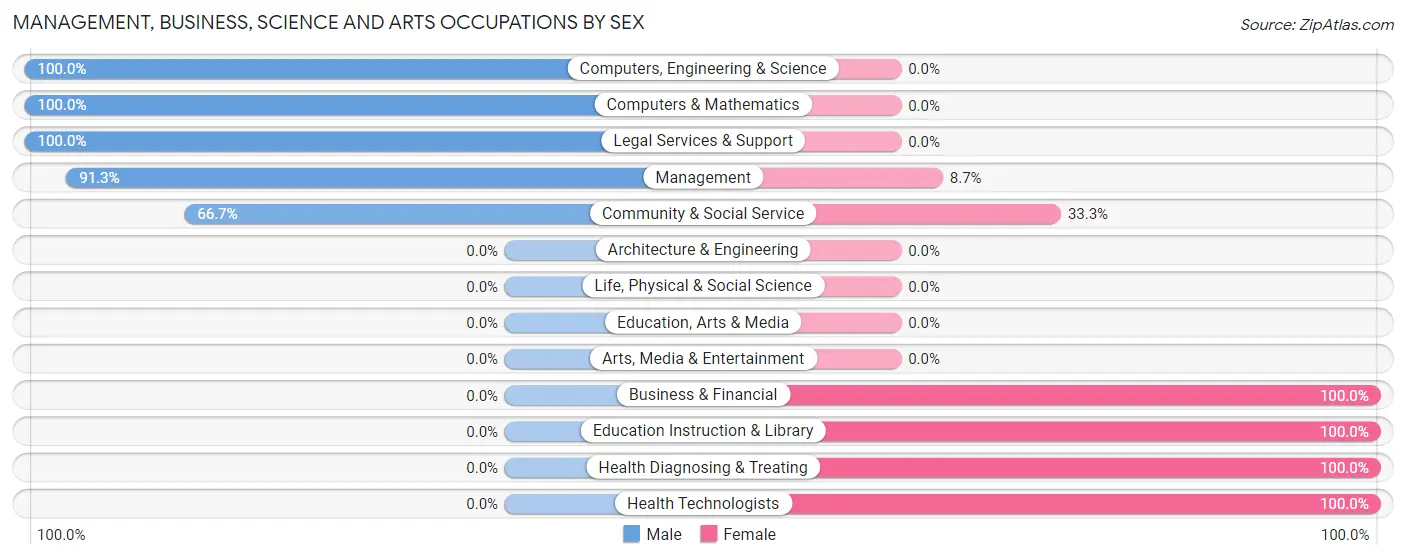
The most common Management, Business, Science and Arts occupations in Magnolia are Community & Social Service (24 | 5.4%), Management (23 | 5.2%), Legal Services & Support (16 | 3.6%), Health Diagnosing & Treating (16 | 3.6%), and Health Technologists (16 | 3.6%).
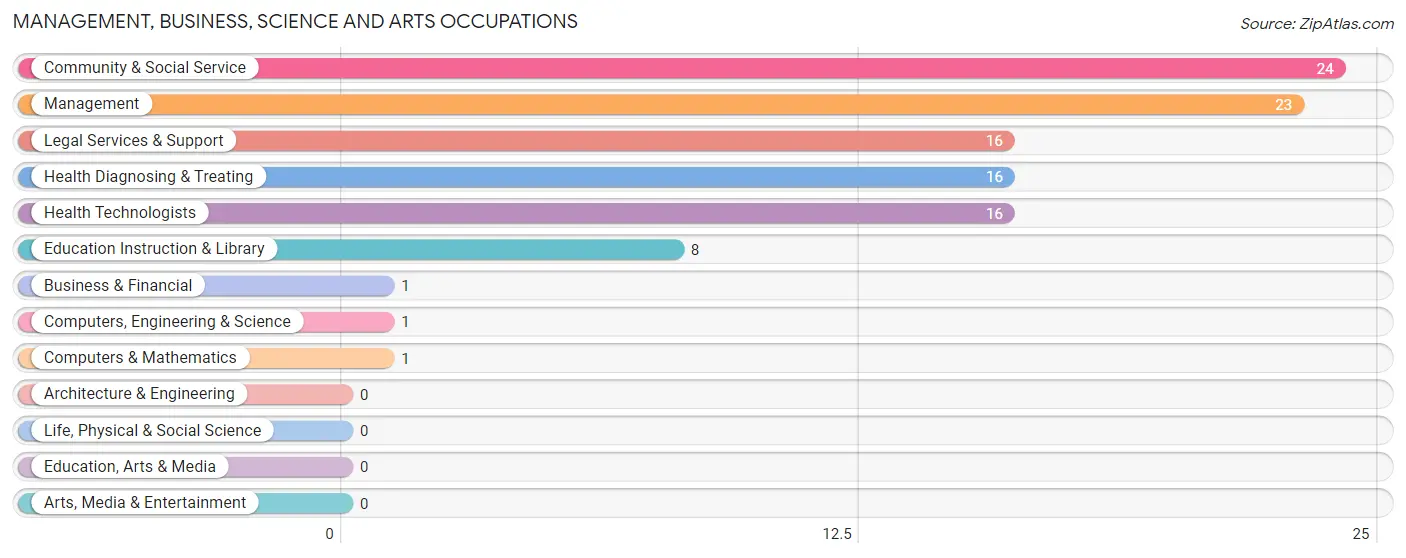
Management, Business, Science and Arts Occupations by Sex
Within the Management, Business, Science and Arts occupations in Magnolia, the most male-oriented occupations are Computers, Engineering & Science (100.0%), Computers & Mathematics (100.0%), and Legal Services & Support (100.0%), while the most female-oriented occupations are Business & Financial (100.0%), Education Instruction & Library (100.0%), and Health Diagnosing & Treating (100.0%).
| Occupation | Male | Female |
| Management | 21 (91.3%) | 2 (8.7%) |
| Business & Financial | 0 (0.0%) | 1 (100.0%) |
| Computers, Engineering & Science | 1 (100.0%) | 0 (0.0%) |
| Computers & Mathematics | 1 (100.0%) | 0 (0.0%) |
| Architecture & Engineering | 0 (0.0%) | 0 (0.0%) |
| Life, Physical & Social Science | 0 (0.0%) | 0 (0.0%) |
| Community & Social Service | 16 (66.7%) | 8 (33.3%) |
| Education, Arts & Media | 0 (0.0%) | 0 (0.0%) |
| Legal Services & Support | 16 (100.0%) | 0 (0.0%) |
| Education Instruction & Library | 0 (0.0%) | 8 (100.0%) |
| Arts, Media & Entertainment | 0 (0.0%) | 0 (0.0%) |
| Health Diagnosing & Treating | 0 (0.0%) | 16 (100.0%) |
| Health Technologists | 0 (0.0%) | 16 (100.0%) |
| Total (Category) | 38 (58.5%) | 27 (41.5%) |
| Total (Overall) | 262 (58.9%) | 183 (41.1%) |
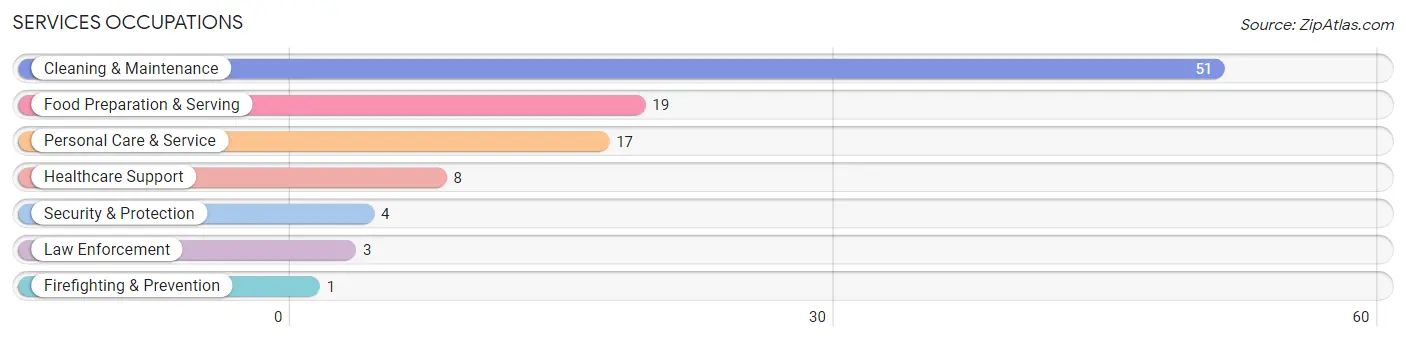
Services Occupations
The most common Services occupations in Magnolia are Cleaning & Maintenance (51 | 11.5%), Food Preparation & Serving (19 | 4.3%), Personal Care & Service (17 | 3.8%), Healthcare Support (8 | 1.8%), and Security & Protection (4 | 0.9%).
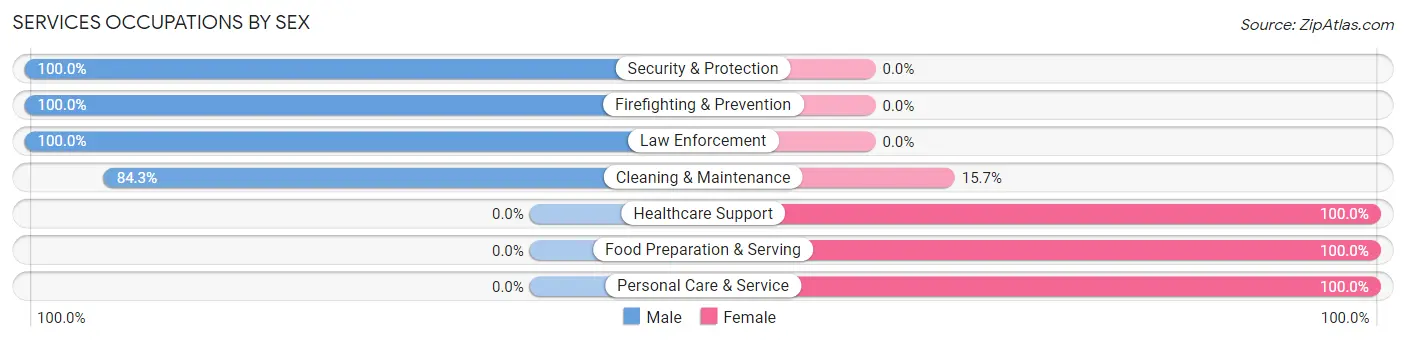
Services Occupations by Sex
Within the Services occupations in Magnolia, the most male-oriented occupations are Security & Protection (100.0%), Firefighting & Prevention (100.0%), and Law Enforcement (100.0%), while the most female-oriented occupations are Healthcare Support (100.0%), Food Preparation & Serving (100.0%), and Personal Care & Service (100.0%).
| Occupation | Male | Female |
| Healthcare Support | 0 (0.0%) | 8 (100.0%) |
| Security & Protection | 4 (100.0%) | 0 (0.0%) |
| Firefighting & Prevention | 1 (100.0%) | 0 (0.0%) |
| Law Enforcement | 3 (100.0%) | 0 (0.0%) |
| Food Preparation & Serving | 0 (0.0%) | 19 (100.0%) |
| Cleaning & Maintenance | 43 (84.3%) | 8 (15.7%) |
| Personal Care & Service | 0 (0.0%) | 17 (100.0%) |
| Total (Category) | 47 (47.5%) | 52 (52.5%) |
| Total (Overall) | 262 (58.9%) | 183 (41.1%) |
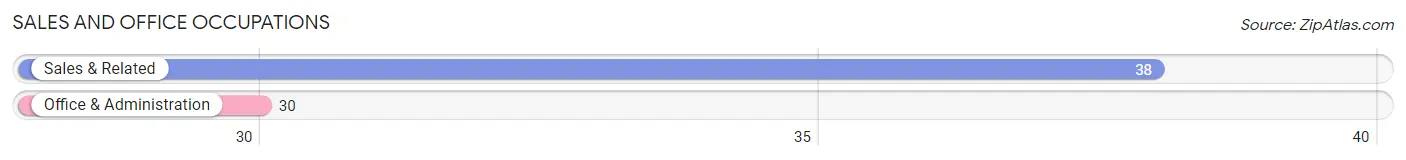
Sales and Office Occupations
The most common Sales and Office occupations in Magnolia are Sales & Related (38 | 8.5%), and Office & Administration (30 | 6.7%).
Sales and Office Occupations by Sex
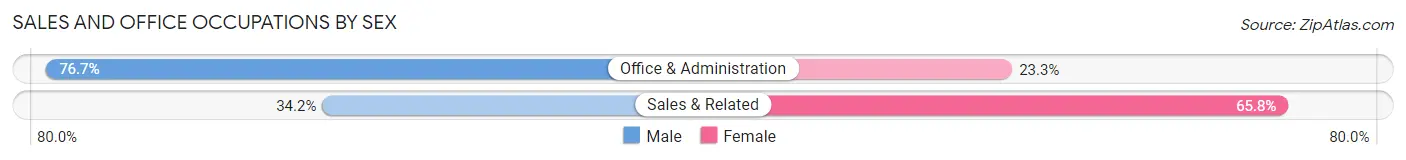
| Occupation | Male | Female |
| Sales & Related | 13 (34.2%) | 25 (65.8%) |
| Office & Administration | 23 (76.7%) | 7 (23.3%) |
| Total (Category) | 36 (52.9%) | 32 (47.1%) |
| Total (Overall) | 262 (58.9%) | 183 (41.1%) |
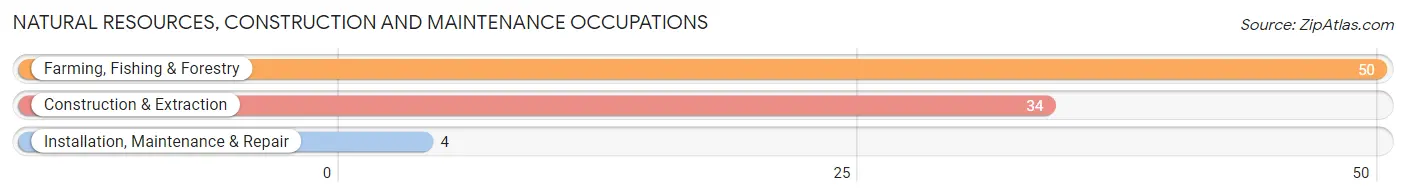
Natural Resources, Construction and Maintenance Occupations
The most common Natural Resources, Construction and Maintenance occupations in Magnolia are Farming, Fishing & Forestry (50 | 11.2%), Construction & Extraction (34 | 7.6%), and Installation, Maintenance & Repair (4 | 0.9%).
Natural Resources, Construction and Maintenance Occupations by Sex
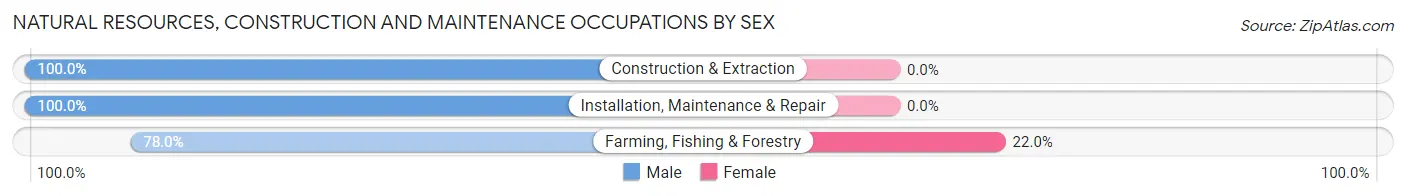
| Occupation | Male | Female |
| Farming, Fishing & Forestry | 39 (78.0%) | 11 (22.0%) |
| Construction & Extraction | 34 (100.0%) | 0 (0.0%) |
| Installation, Maintenance & Repair | 4 (100.0%) | 0 (0.0%) |
| Total (Category) | 77 (87.5%) | 11 (12.5%) |
| Total (Overall) | 262 (58.9%) | 183 (41.1%) |
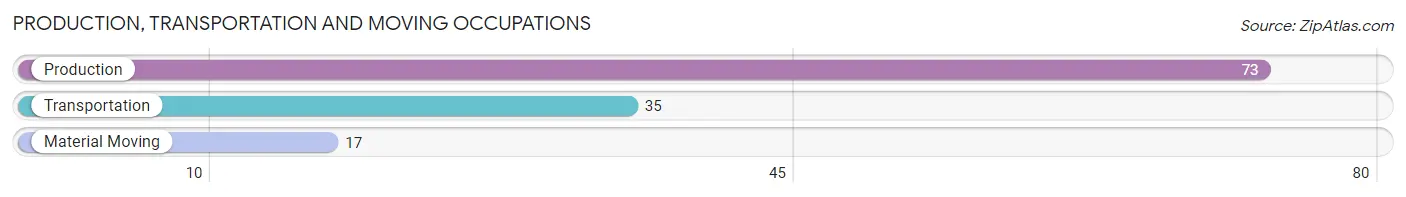
Production, Transportation and Moving Occupations
The most common Production, Transportation and Moving occupations in Magnolia are Production (73 | 16.4%), Transportation (35 | 7.9%), and Material Moving (17 | 3.8%).
Production, Transportation and Moving Occupations by Sex
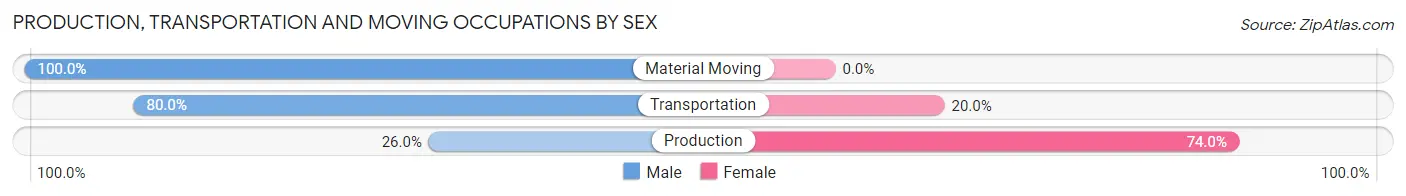
| Occupation | Male | Female |
| Production | 19 (26.0%) | 54 (74.0%) |
| Transportation | 28 (80.0%) | 7 (20.0%) |
| Material Moving | 17 (100.0%) | 0 (0.0%) |
| Total (Category) | 64 (51.2%) | 61 (48.8%) |
| Total (Overall) | 262 (58.9%) | 183 (41.1%) |
Employment Industries by Sex in Magnolia
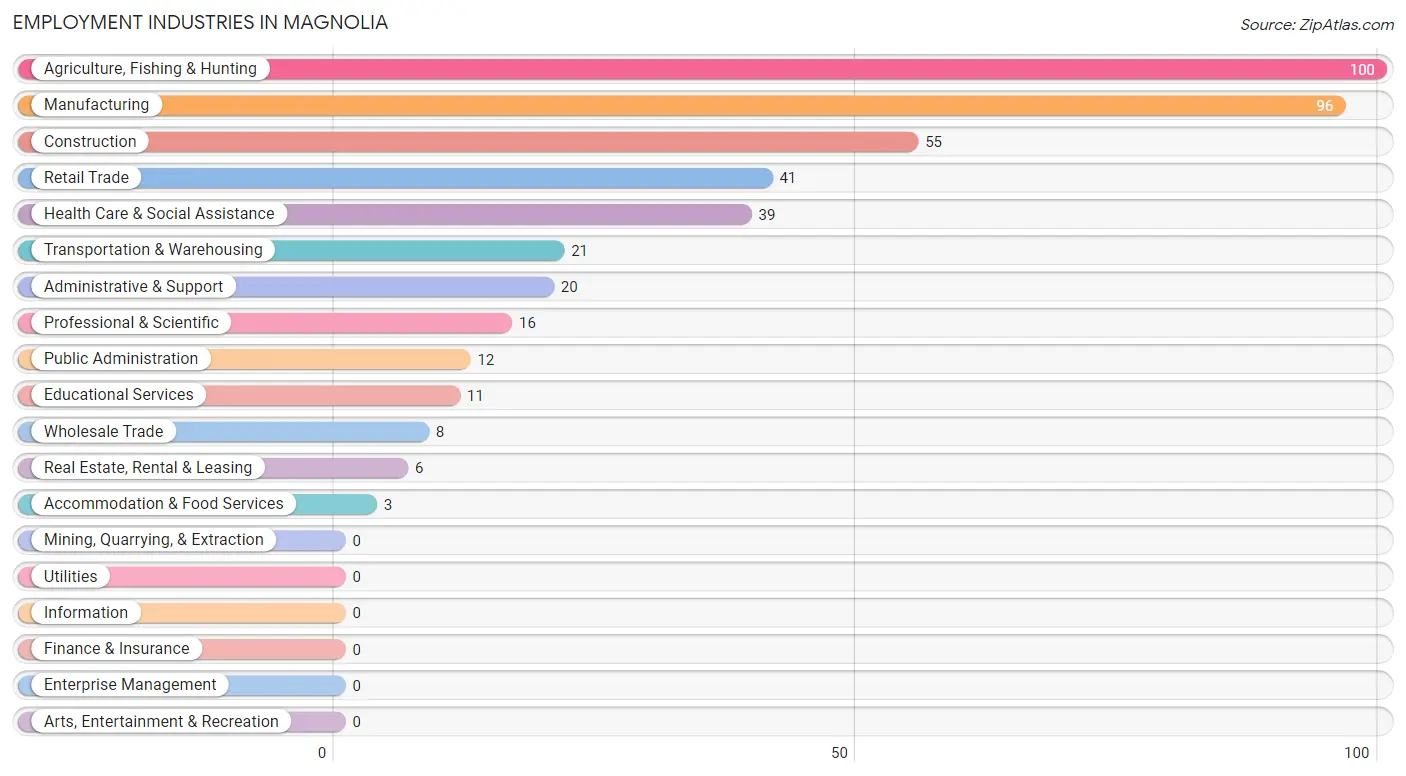
Employment Industries in Magnolia
The major employment industries in Magnolia include Agriculture, Fishing & Hunting (100 | 22.5%), Manufacturing (96 | 21.6%), Construction (55 | 12.4%), Retail Trade (41 | 9.2%), and Health Care & Social Assistance (39 | 8.8%).
Employment Industries by Sex in Magnolia
The Magnolia industries that see more men than women are Construction (100.0%), Real Estate, Rental & Leasing (100.0%), and Professional & Scientific (100.0%), whereas the industries that tend to have a higher number of women are Wholesale Trade (100.0%), Educational Services (100.0%), and Health Care & Social Assistance (100.0%).
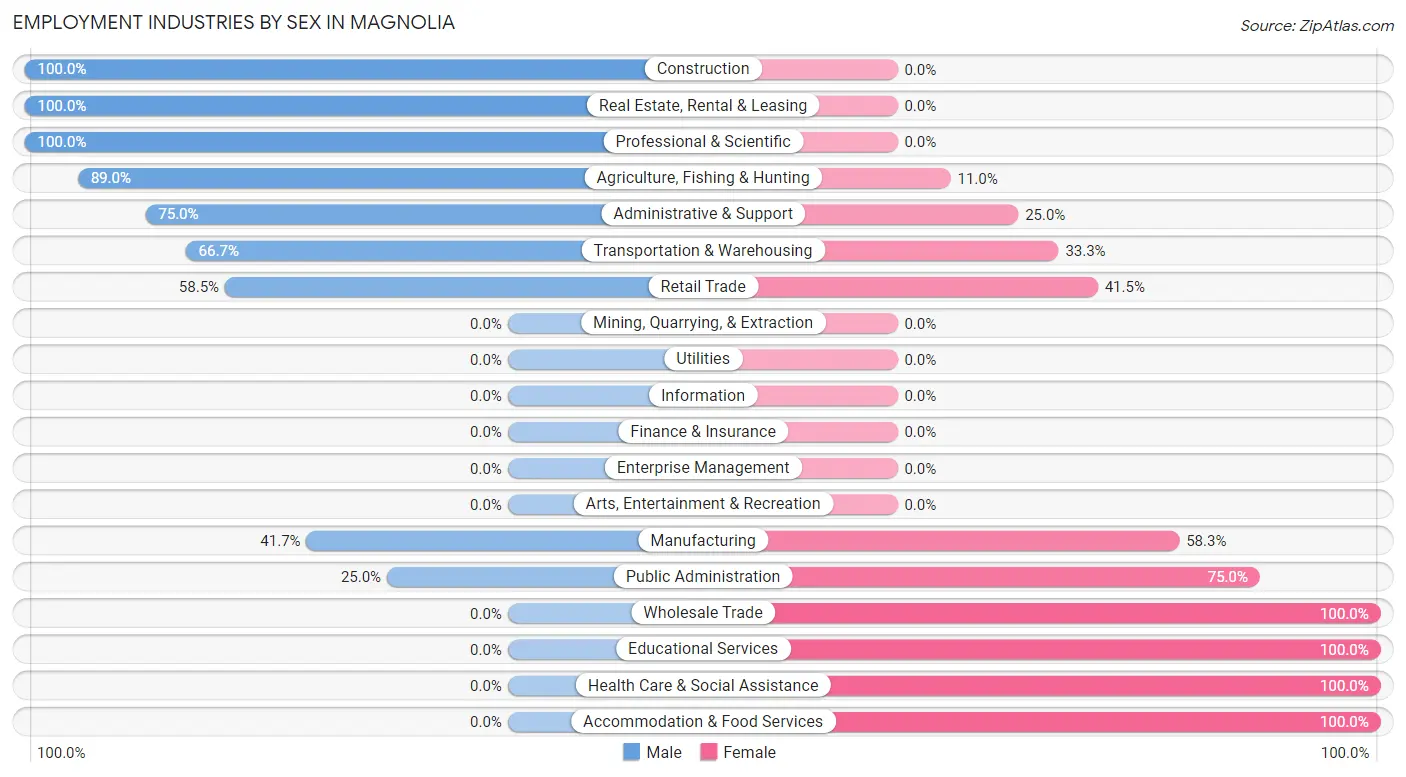
| Industry | Male | Female |
| Agriculture, Fishing & Hunting | 89 (89.0%) | 11 (11.0%) |
| Mining, Quarrying, & Extraction | 0 (0.0%) | 0 (0.0%) |
| Construction | 55 (100.0%) | 0 (0.0%) |
| Manufacturing | 40 (41.7%) | 56 (58.3%) |
| Wholesale Trade | 0 (0.0%) | 8 (100.0%) |
| Retail Trade | 24 (58.5%) | 17 (41.5%) |
| Transportation & Warehousing | 14 (66.7%) | 7 (33.3%) |
| Utilities | 0 (0.0%) | 0 (0.0%) |
| Information | 0 (0.0%) | 0 (0.0%) |
| Finance & Insurance | 0 (0.0%) | 0 (0.0%) |
| Real Estate, Rental & Leasing | 6 (100.0%) | 0 (0.0%) |
| Professional & Scientific | 16 (100.0%) | 0 (0.0%) |
| Enterprise Management | 0 (0.0%) | 0 (0.0%) |
| Administrative & Support | 15 (75.0%) | 5 (25.0%) |
| Educational Services | 0 (0.0%) | 11 (100.0%) |
| Health Care & Social Assistance | 0 (0.0%) | 39 (100.0%) |
| Arts, Entertainment & Recreation | 0 (0.0%) | 0 (0.0%) |
| Accommodation & Food Services | 0 (0.0%) | 3 (100.0%) |
| Public Administration | 3 (25.0%) | 9 (75.0%) |
| Total | 262 (58.9%) | 183 (41.1%) |
Education in Magnolia
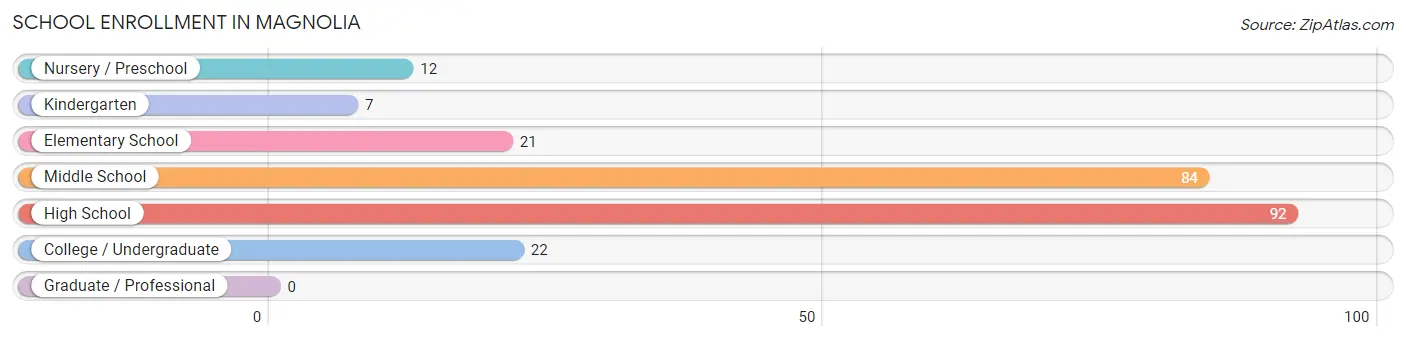
School Enrollment in Magnolia
The most common levels of schooling among the 238 students in Magnolia are high school (92 | 38.7%), middle school (84 | 35.3%), and college / undergraduate (22 | 9.2%).
| School Level | # Students | % Students |
| Nursery / Preschool | 12 | 5.0% |
| Kindergarten | 7 | 2.9% |
| Elementary School | 21 | 8.8% |
| Middle School | 84 | 35.3% |
| High School | 92 | 38.7% |
| College / Undergraduate | 22 | 9.2% |
| Graduate / Professional | 0 | 0.0% |
| Total | 238 | 100.0% |
School Enrollment by Age by Funding Source in Magnolia
Out of a total of 238 students who are enrolled in schools in Magnolia, 2 (0.8%) attend a private institution, while the remaining 236 (99.2%) are enrolled in public schools. The age group of 35 years and over has the highest likelihood of being enrolled in private schools, with 2 (14.3% in the age bracket) enrolled. Conversely, the age group of 3 to 4 year olds has the lowest likelihood of being enrolled in a private school, with 12 (100.0% in the age bracket) attending a public institution.
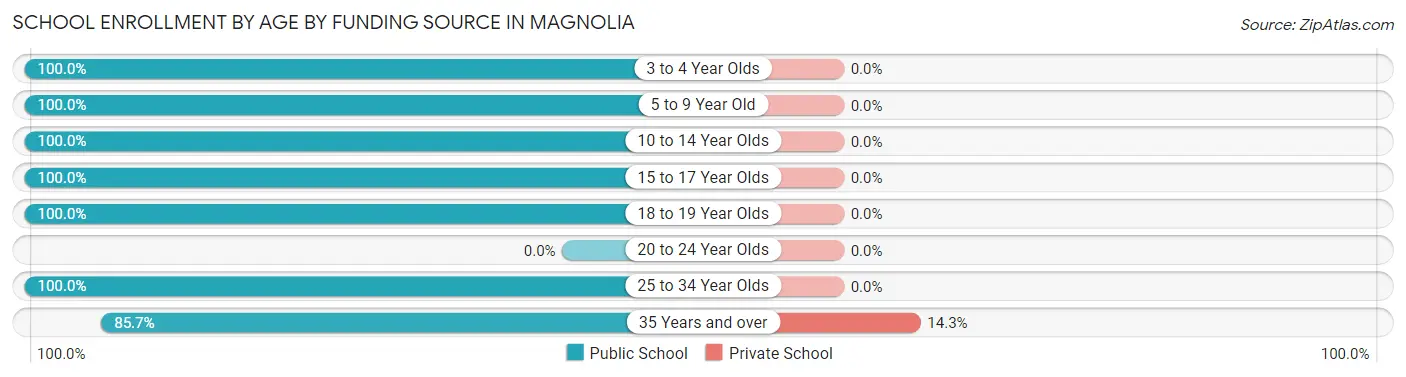
| Age Bracket | Public School | Private School |
| 3 to 4 Year Olds | 12 (100.0%) | 0 (0.0%) |
| 5 to 9 Year Old | 24 (100.0%) | 0 (0.0%) |
| 10 to 14 Year Olds | 120 (100.0%) | 0 (0.0%) |
| 15 to 17 Year Olds | 46 (100.0%) | 0 (0.0%) |
| 18 to 19 Year Olds | 9 (100.0%) | 0 (0.0%) |
| 20 to 24 Year Olds | 0 (0.0%) | 0 (0.0%) |
| 25 to 34 Year Olds | 13 (100.0%) | 0 (0.0%) |
| 35 Years and over | 12 (85.7%) | 2 (14.3%) |
| Total | 236 (99.2%) | 2 (0.8%) |
Educational Attainment by Field of Study in Magnolia
Education (35 | 53.0%), liberal arts & history (9 | 13.6%), social sciences (7 | 10.6%), science & technology (7 | 10.6%), and business (5 | 7.6%) are the most common fields of study among 66 individuals in Magnolia who have obtained a bachelor's degree or higher.
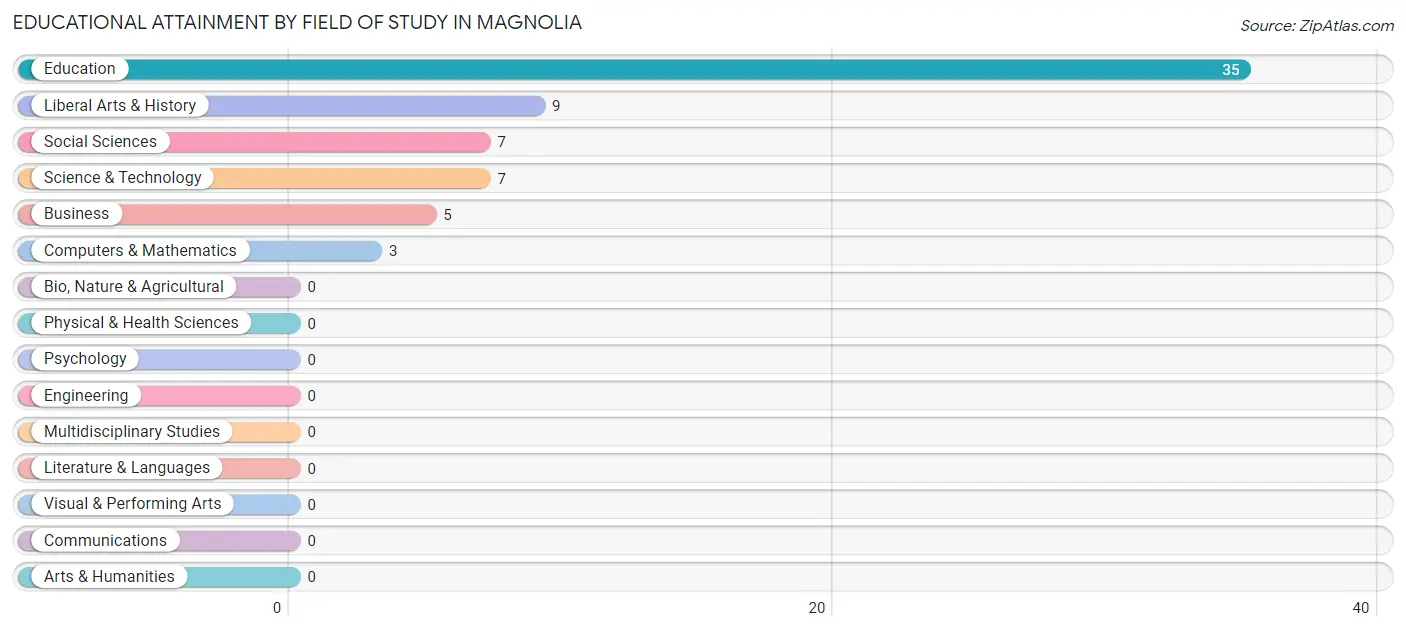
| Field of Study | # Graduates | % Graduates |
| Computers & Mathematics | 3 | 4.5% |
| Bio, Nature & Agricultural | 0 | 0.0% |
| Physical & Health Sciences | 0 | 0.0% |
| Psychology | 0 | 0.0% |
| Social Sciences | 7 | 10.6% |
| Engineering | 0 | 0.0% |
| Multidisciplinary Studies | 0 | 0.0% |
| Science & Technology | 7 | 10.6% |
| Business | 5 | 7.6% |
| Education | 35 | 53.0% |
| Literature & Languages | 0 | 0.0% |
| Liberal Arts & History | 9 | 13.6% |
| Visual & Performing Arts | 0 | 0.0% |
| Communications | 0 | 0.0% |
| Arts & Humanities | 0 | 0.0% |
| Total | 66 | 100.0% |
Transportation & Commute in Magnolia
Vehicle Availability by Sex in Magnolia
The most prevalent vehicle ownership categories in Magnolia are males with 4 vehicles (99, accounting for 37.9%) and females with 4 vehicles (40, making up 54.1%).
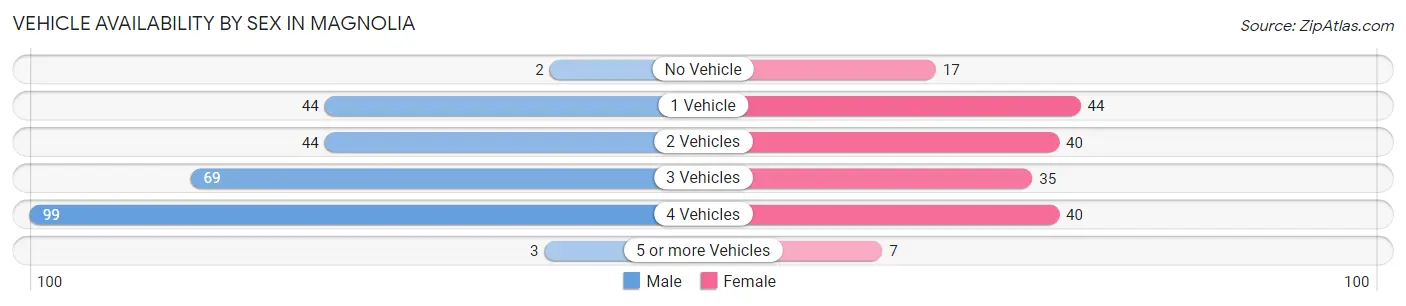
| Vehicles Available | Male | Female |
| No Vehicle | 2 (0.8%) | 17 (9.3%) |
| 1 Vehicle | 44 (16.9%) | 44 (24.0%) |
| 2 Vehicles | 44 (16.9%) | 40 (21.9%) |
| 3 Vehicles | 69 (26.4%) | 35 (19.1%) |
| 4 Vehicles | 99 (37.9%) | 40 (21.9%) |
| 5 or more Vehicles | 3 (1.1%) | 7 (3.8%) |
| Total | 261 (100.0%) | 183 (100.0%) |
Commute Time in Magnolia
The most frequently occuring commute durations in Magnolia are 20 to 24 minutes (93 commuters, 22.6%), 10 to 14 minutes (58 commuters, 14.1%), and 25 to 29 minutes (56 commuters, 13.6%).
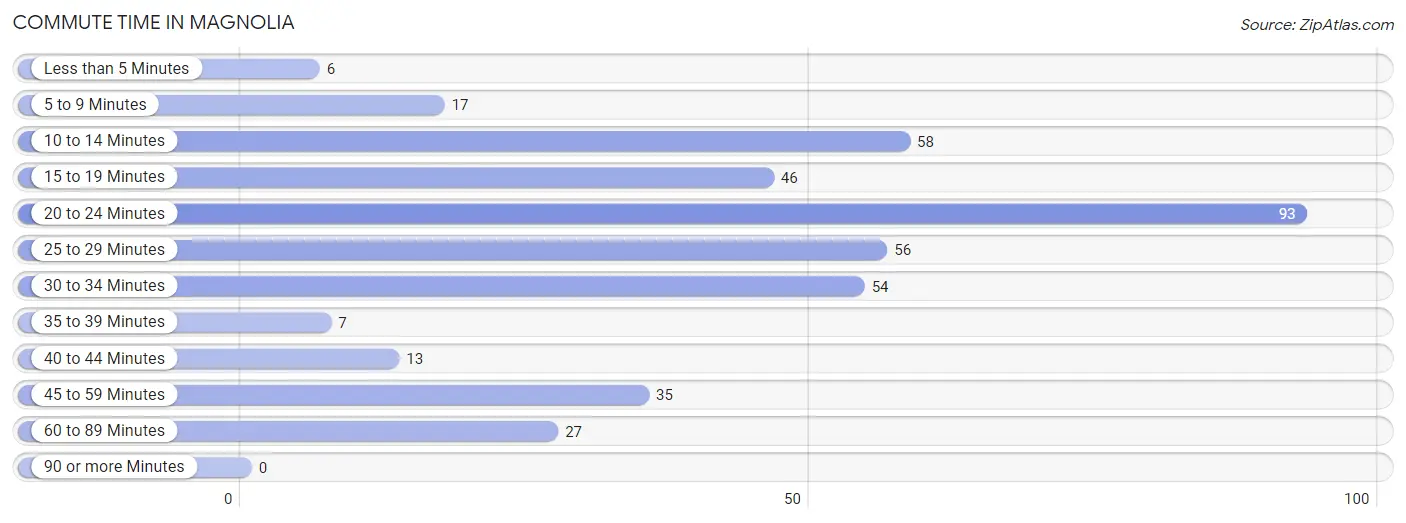
| Commute Time | # Commuters | % Commuters |
| Less than 5 Minutes | 6 | 1.5% |
| 5 to 9 Minutes | 17 | 4.1% |
| 10 to 14 Minutes | 58 | 14.1% |
| 15 to 19 Minutes | 46 | 11.2% |
| 20 to 24 Minutes | 93 | 22.6% |
| 25 to 29 Minutes | 56 | 13.6% |
| 30 to 34 Minutes | 54 | 13.1% |
| 35 to 39 Minutes | 7 | 1.7% |
| 40 to 44 Minutes | 13 | 3.2% |
| 45 to 59 Minutes | 35 | 8.5% |
| 60 to 89 Minutes | 27 | 6.6% |
| 90 or more Minutes | 0 | 0.0% |
Commute Time by Sex in Magnolia
The most common commute times in Magnolia are 10 to 14 minutes (48 commuters, 18.4%) for males and 20 to 24 minutes (48 commuters, 31.8%) for females.
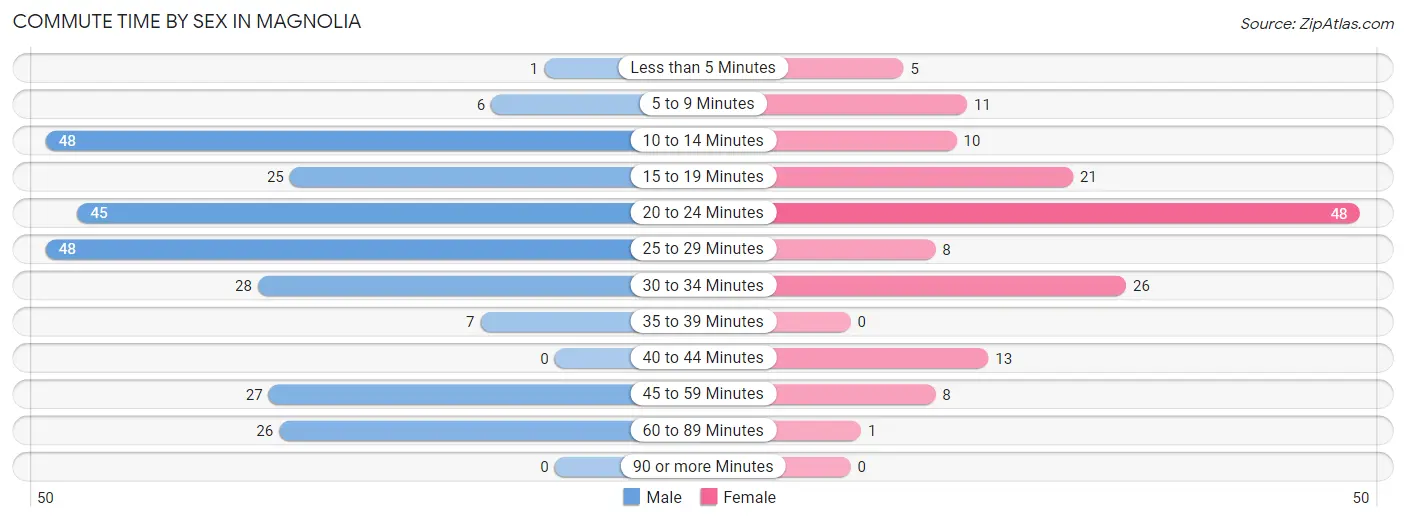
| Commute Time | Male | Female |
| Less than 5 Minutes | 1 (0.4%) | 5 (3.3%) |
| 5 to 9 Minutes | 6 (2.3%) | 11 (7.3%) |
| 10 to 14 Minutes | 48 (18.4%) | 10 (6.6%) |
| 15 to 19 Minutes | 25 (9.6%) | 21 (13.9%) |
| 20 to 24 Minutes | 45 (17.2%) | 48 (31.8%) |
| 25 to 29 Minutes | 48 (18.4%) | 8 (5.3%) |
| 30 to 34 Minutes | 28 (10.7%) | 26 (17.2%) |
| 35 to 39 Minutes | 7 (2.7%) | 0 (0.0%) |
| 40 to 44 Minutes | 0 (0.0%) | 13 (8.6%) |
| 45 to 59 Minutes | 27 (10.3%) | 8 (5.3%) |
| 60 to 89 Minutes | 26 (10.0%) | 1 (0.7%) |
| 90 or more Minutes | 0 (0.0%) | 0 (0.0%) |
Time of Departure to Work by Sex in Magnolia
The most frequent times of departure to work in Magnolia are 5:30 AM to 5:59 AM (44, 16.9%) for males and 6:00 AM to 6:29 AM (22, 14.6%) for females.
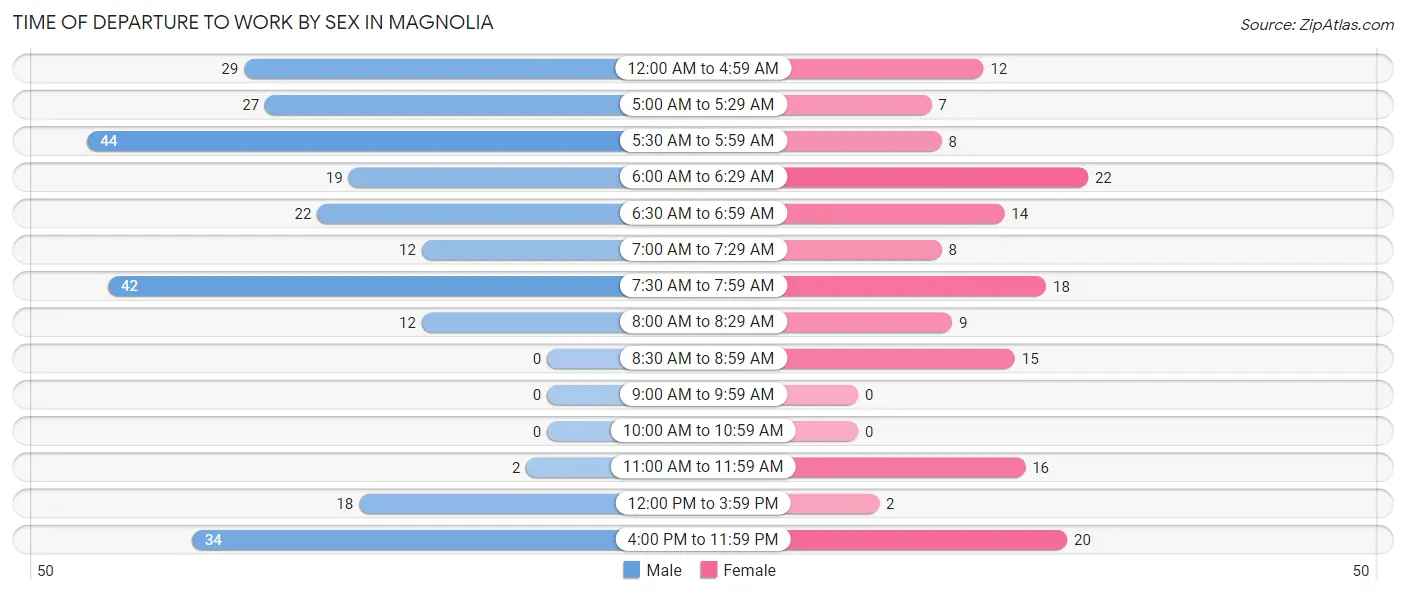
| Time of Departure | Male | Female |
| 12:00 AM to 4:59 AM | 29 (11.1%) | 12 (8.0%) |
| 5:00 AM to 5:29 AM | 27 (10.3%) | 7 (4.6%) |
| 5:30 AM to 5:59 AM | 44 (16.9%) | 8 (5.3%) |
| 6:00 AM to 6:29 AM | 19 (7.3%) | 22 (14.6%) |
| 6:30 AM to 6:59 AM | 22 (8.4%) | 14 (9.3%) |
| 7:00 AM to 7:29 AM | 12 (4.6%) | 8 (5.3%) |
| 7:30 AM to 7:59 AM | 42 (16.1%) | 18 (11.9%) |
| 8:00 AM to 8:29 AM | 12 (4.6%) | 9 (6.0%) |
| 8:30 AM to 8:59 AM | 0 (0.0%) | 15 (9.9%) |
| 9:00 AM to 9:59 AM | 0 (0.0%) | 0 (0.0%) |
| 10:00 AM to 10:59 AM | 0 (0.0%) | 0 (0.0%) |
| 11:00 AM to 11:59 AM | 2 (0.8%) | 16 (10.6%) |
| 12:00 PM to 3:59 PM | 18 (6.9%) | 2 (1.3%) |
| 4:00 PM to 11:59 PM | 34 (13.0%) | 20 (13.3%) |
| Total | 261 (100.0%) | 151 (100.0%) |
Housing Occupancy in Magnolia
Occupancy by Ownership in Magnolia
Of the total 400 dwellings in Magnolia, owner-occupied units account for 212 (53.0%), while renter-occupied units make up 188 (47.0%).
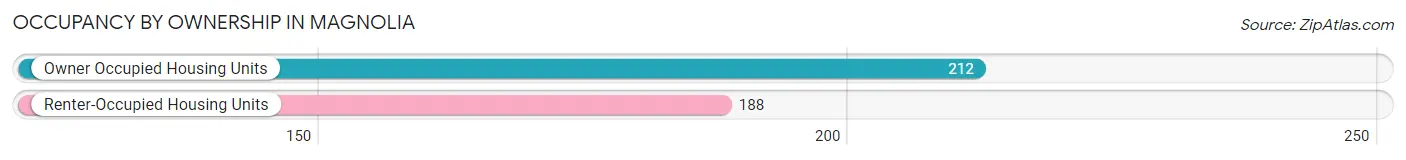
| Occupancy | # Housing Units | % Housing Units |
| Owner Occupied Housing Units | 212 | 53.0% |
| Renter-Occupied Housing Units | 188 | 47.0% |
| Total Occupied Housing Units | 400 | 100.0% |
Occupancy by Household Size in Magnolia
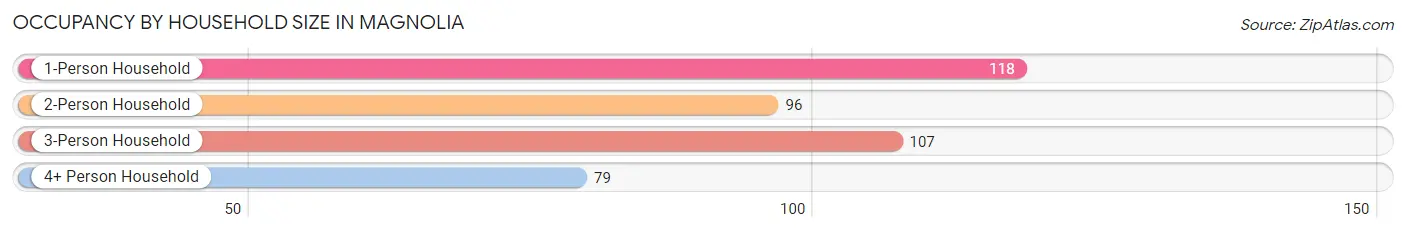
| Household Size | # Housing Units | % Housing Units |
| 1-Person Household | 118 | 29.5% |
| 2-Person Household | 96 | 24.0% |
| 3-Person Household | 107 | 26.8% |
| 4+ Person Household | 79 | 19.8% |
| Total Housing Units | 400 | 100.0% |
Occupancy by Ownership by Household Size in Magnolia
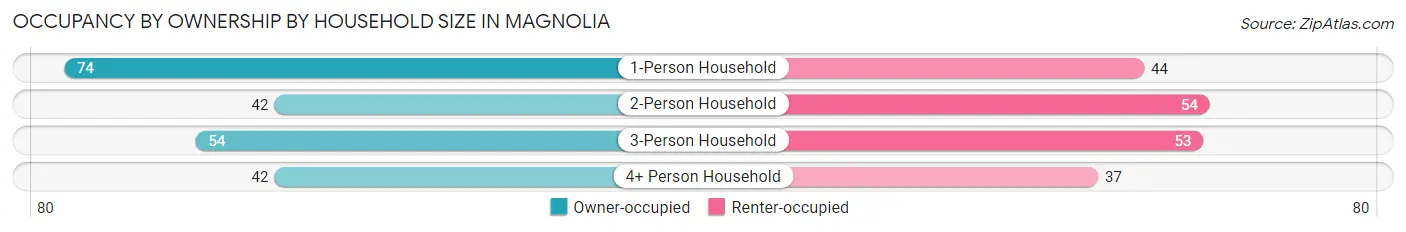
| Household Size | Owner-occupied | Renter-occupied |
| 1-Person Household | 74 (62.7%) | 44 (37.3%) |
| 2-Person Household | 42 (43.8%) | 54 (56.2%) |
| 3-Person Household | 54 (50.5%) | 53 (49.5%) |
| 4+ Person Household | 42 (53.2%) | 37 (46.8%) |
| Total Housing Units | 212 (53.0%) | 188 (47.0%) |
Occupancy by Educational Attainment in Magnolia
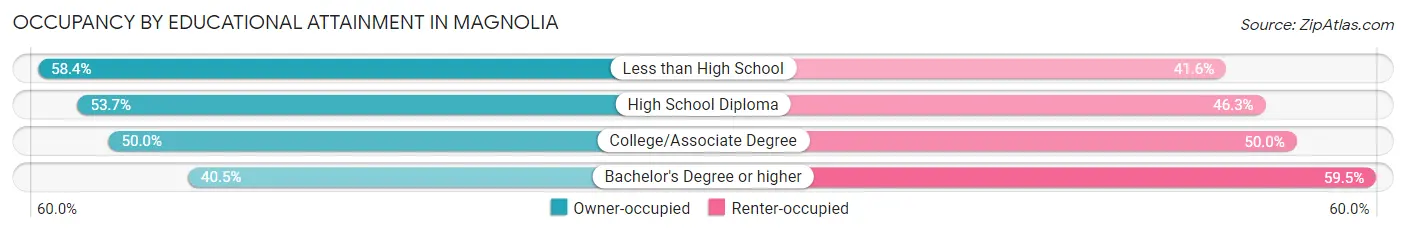
| Household Size | Owner-occupied | Renter-occupied |
| Less than High School | 80 (58.4%) | 57 (41.6%) |
| High School Diploma | 58 (53.7%) | 50 (46.3%) |
| College/Associate Degree | 59 (50.0%) | 59 (50.0%) |
| Bachelor's Degree or higher | 15 (40.5%) | 22 (59.5%) |
Occupancy by Age of Householder in Magnolia
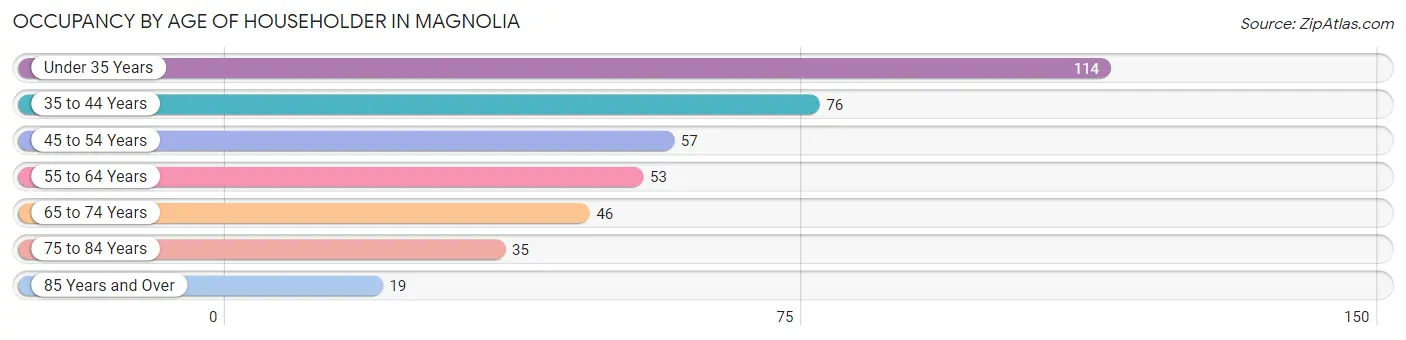
| Age Bracket | # Households | % Households |
| Under 35 Years | 114 | 28.5% |
| 35 to 44 Years | 76 | 19.0% |
| 45 to 54 Years | 57 | 14.2% |
| 55 to 64 Years | 53 | 13.3% |
| 65 to 74 Years | 46 | 11.5% |
| 75 to 84 Years | 35 | 8.7% |
| 85 Years and Over | 19 | 4.8% |
| Total | 400 | 100.0% |
Housing Finances in Magnolia
Median Income by Occupancy in Magnolia
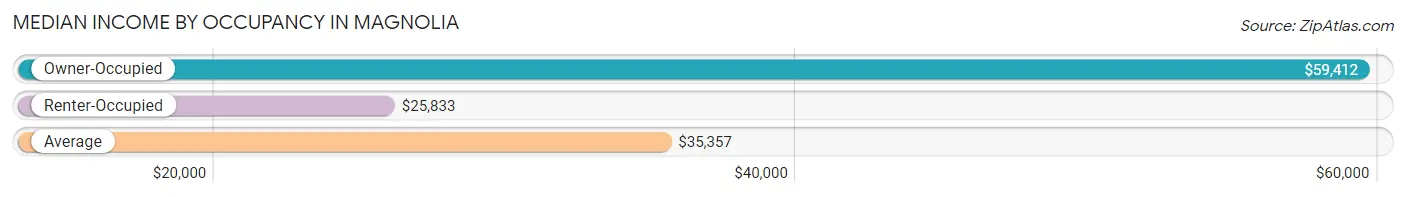
| Occupancy Type | # Households | Median Income |
| Owner-Occupied | 212 (53.0%) | $59,412 |
| Renter-Occupied | 188 (47.0%) | $25,833 |
| Average | 400 (100.0%) | $35,357 |
Occupancy by Householder Income Bracket in Magnolia
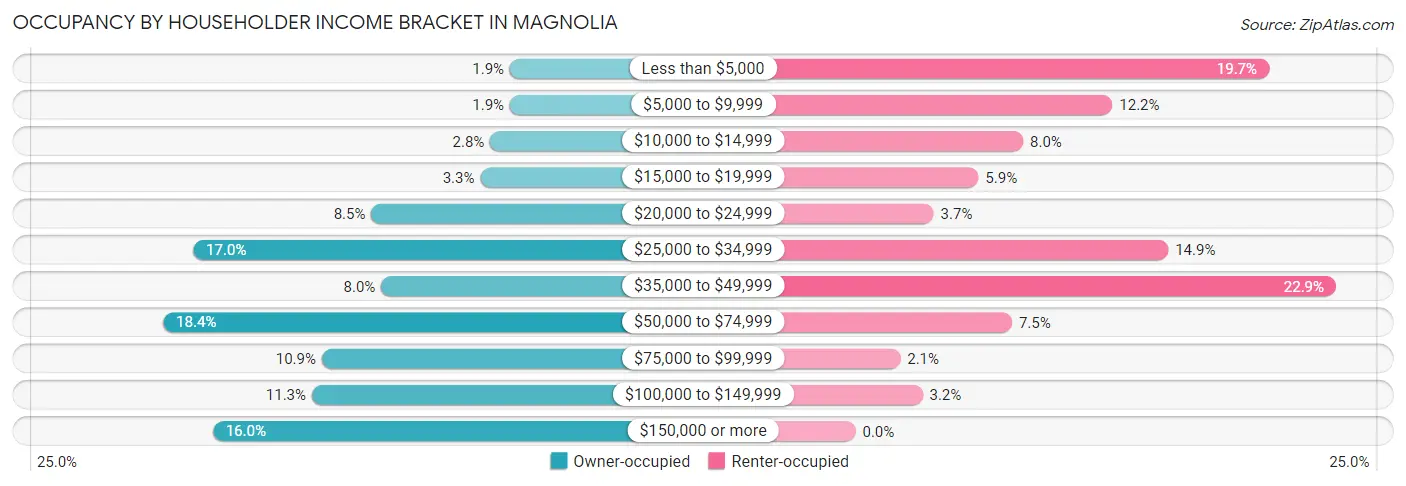
| Income Bracket | Owner-occupied | Renter-occupied |
| Less than $5,000 | 4 (1.9%) | 37 (19.7%) |
| $5,000 to $9,999 | 4 (1.9%) | 23 (12.2%) |
| $10,000 to $14,999 | 6 (2.8%) | 15 (8.0%) |
| $15,000 to $19,999 | 7 (3.3%) | 11 (5.9%) |
| $20,000 to $24,999 | 18 (8.5%) | 7 (3.7%) |
| $25,000 to $34,999 | 36 (17.0%) | 28 (14.9%) |
| $35,000 to $49,999 | 17 (8.0%) | 43 (22.9%) |
| $50,000 to $74,999 | 39 (18.4%) | 14 (7.4%) |
| $75,000 to $99,999 | 23 (10.8%) | 4 (2.1%) |
| $100,000 to $149,999 | 24 (11.3%) | 6 (3.2%) |
| $150,000 or more | 34 (16.0%) | 0 (0.0%) |
| Total | 212 (100.0%) | 188 (100.0%) |
Monthly Housing Cost Tiers in Magnolia
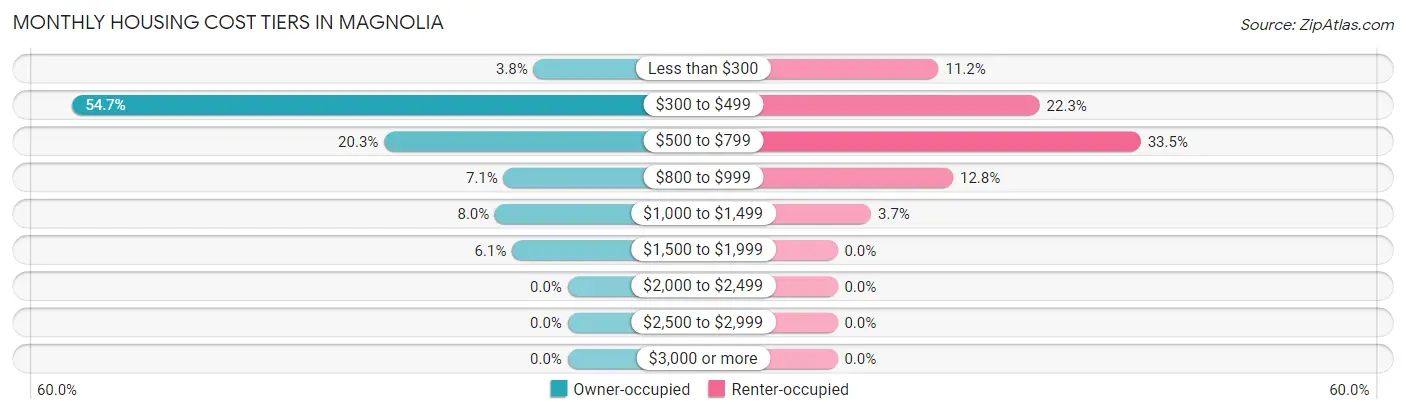
| Monthly Cost | Owner-occupied | Renter-occupied |
| Less than $300 | 8 (3.8%) | 21 (11.2%) |
| $300 to $499 | 116 (54.7%) | 42 (22.3%) |
| $500 to $799 | 43 (20.3%) | 63 (33.5%) |
| $800 to $999 | 15 (7.1%) | 24 (12.8%) |
| $1,000 to $1,499 | 17 (8.0%) | 7 (3.7%) |
| $1,500 to $1,999 | 13 (6.1%) | 0 (0.0%) |
| $2,000 to $2,499 | 0 (0.0%) | 0 (0.0%) |
| $2,500 to $2,999 | 0 (0.0%) | 0 (0.0%) |
| $3,000 or more | 0 (0.0%) | 0 (0.0%) |
| Total | 212 (100.0%) | 188 (100.0%) |
Physical Housing Characteristics in Magnolia
Housing Structures in Magnolia
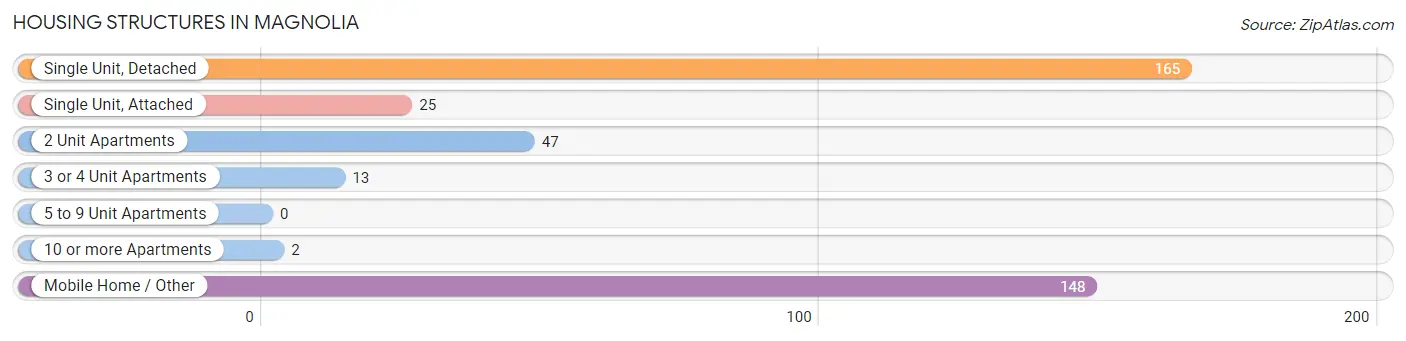
| Structure Type | # Housing Units | % Housing Units |
| Single Unit, Detached | 165 | 41.2% |
| Single Unit, Attached | 25 | 6.2% |
| 2 Unit Apartments | 47 | 11.7% |
| 3 or 4 Unit Apartments | 13 | 3.3% |
| 5 to 9 Unit Apartments | 0 | 0.0% |
| 10 or more Apartments | 2 | 0.5% |
| Mobile Home / Other | 148 | 37.0% |
| Total | 400 | 100.0% |
Housing Structures by Occupancy in Magnolia
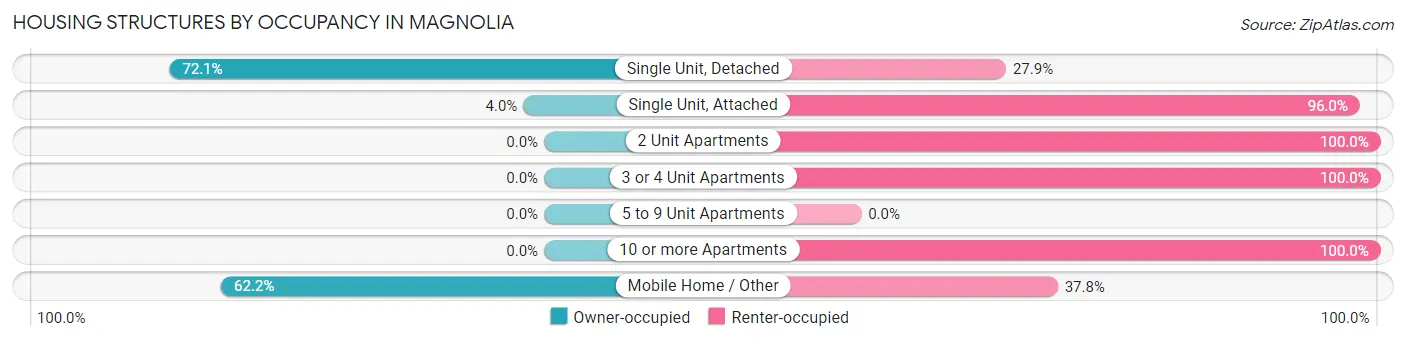
| Structure Type | Owner-occupied | Renter-occupied |
| Single Unit, Detached | 119 (72.1%) | 46 (27.9%) |
| Single Unit, Attached | 1 (4.0%) | 24 (96.0%) |
| 2 Unit Apartments | 0 (0.0%) | 47 (100.0%) |
| 3 or 4 Unit Apartments | 0 (0.0%) | 13 (100.0%) |
| 5 to 9 Unit Apartments | 0 (0.0%) | 0 (0.0%) |
| 10 or more Apartments | 0 (0.0%) | 2 (100.0%) |
| Mobile Home / Other | 92 (62.2%) | 56 (37.8%) |
| Total | 212 (53.0%) | 188 (47.0%) |
Housing Structures by Number of Rooms in Magnolia
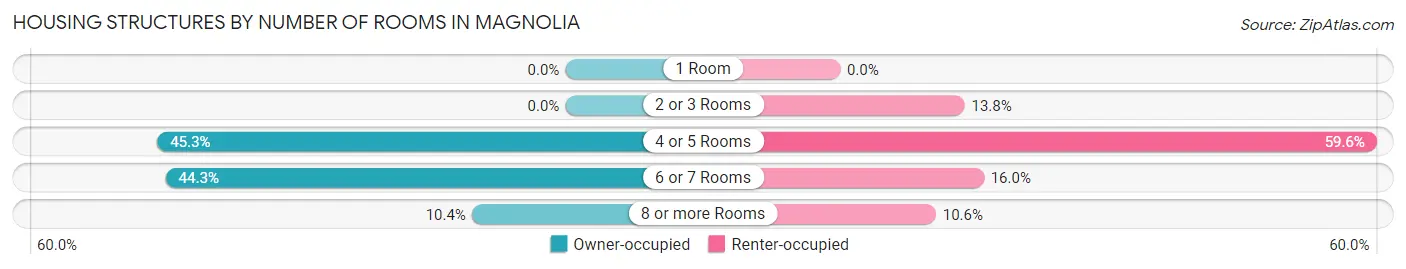
| Number of Rooms | Owner-occupied | Renter-occupied |
| 1 Room | 0 (0.0%) | 0 (0.0%) |
| 2 or 3 Rooms | 0 (0.0%) | 26 (13.8%) |
| 4 or 5 Rooms | 96 (45.3%) | 112 (59.6%) |
| 6 or 7 Rooms | 94 (44.3%) | 30 (16.0%) |
| 8 or more Rooms | 22 (10.4%) | 20 (10.6%) |
| Total | 212 (100.0%) | 188 (100.0%) |
Housing Structure by Heating Type in Magnolia
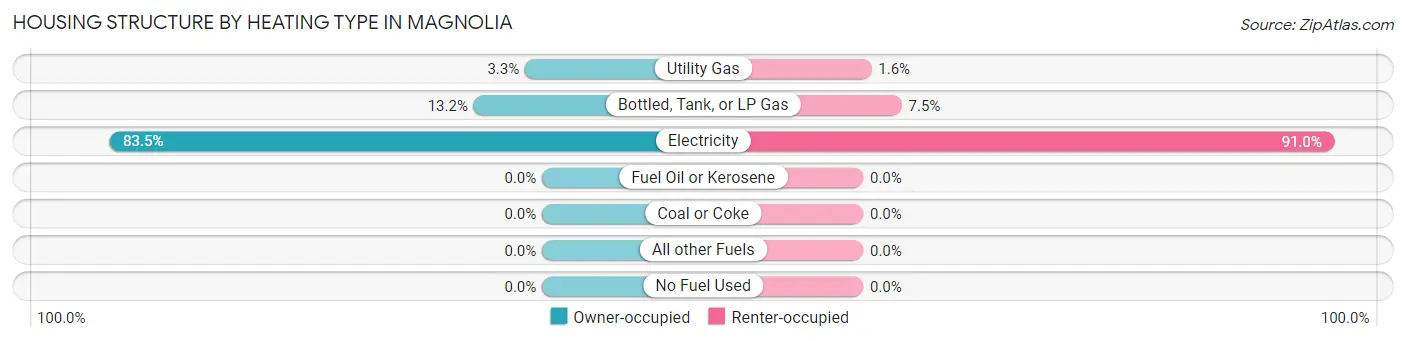
| Heating Type | Owner-occupied | Renter-occupied |
| Utility Gas | 7 (3.3%) | 3 (1.6%) |
| Bottled, Tank, or LP Gas | 28 (13.2%) | 14 (7.4%) |
| Electricity | 177 (83.5%) | 171 (91.0%) |
| Fuel Oil or Kerosene | 0 (0.0%) | 0 (0.0%) |
| Coal or Coke | 0 (0.0%) | 0 (0.0%) |
| All other Fuels | 0 (0.0%) | 0 (0.0%) |
| No Fuel Used | 0 (0.0%) | 0 (0.0%) |
| Total | 212 (100.0%) | 188 (100.0%) |
Household Vehicle Usage in Magnolia
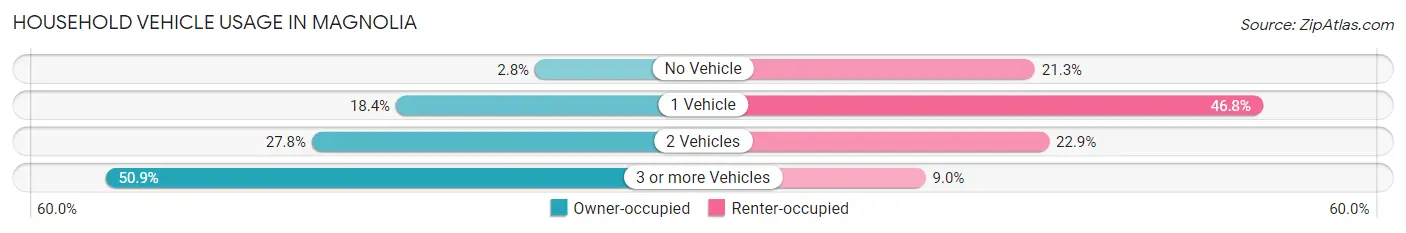
| Vehicles per Household | Owner-occupied | Renter-occupied |
| No Vehicle | 6 (2.8%) | 40 (21.3%) |
| 1 Vehicle | 39 (18.4%) | 88 (46.8%) |
| 2 Vehicles | 59 (27.8%) | 43 (22.9%) |
| 3 or more Vehicles | 108 (50.9%) | 17 (9.0%) |
| Total | 212 (100.0%) | 188 (100.0%) |
Real Estate & Mortgages in Magnolia
Real Estate and Mortgage Overview in Magnolia
| Characteristic | Without Mortgage | With Mortgage |
| Housing Units | 165 | 47 |
| Median Property Value | $63,100 | $122,500 |
| Median Household Income | $58,162 | $2 |
| Monthly Housing Costs | $401 | $0 |
| Real Estate Taxes | $498 | $0 |
Property Value by Mortgage Status in Magnolia
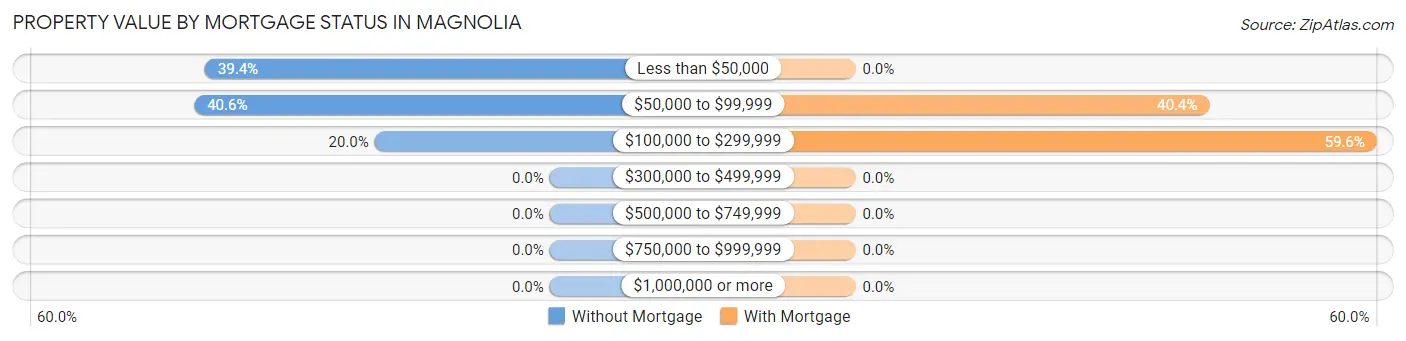
| Property Value | Without Mortgage | With Mortgage |
| Less than $50,000 | 65 (39.4%) | 0 (0.0%) |
| $50,000 to $99,999 | 67 (40.6%) | 19 (40.4%) |
| $100,000 to $299,999 | 33 (20.0%) | 28 (59.6%) |
| $300,000 to $499,999 | 0 (0.0%) | 0 (0.0%) |
| $500,000 to $749,999 | 0 (0.0%) | 0 (0.0%) |
| $750,000 to $999,999 | 0 (0.0%) | 0 (0.0%) |
| $1,000,000 or more | 0 (0.0%) | 0 (0.0%) |
| Total | 165 (100.0%) | 47 (100.0%) |
Household Income by Mortgage Status in Magnolia
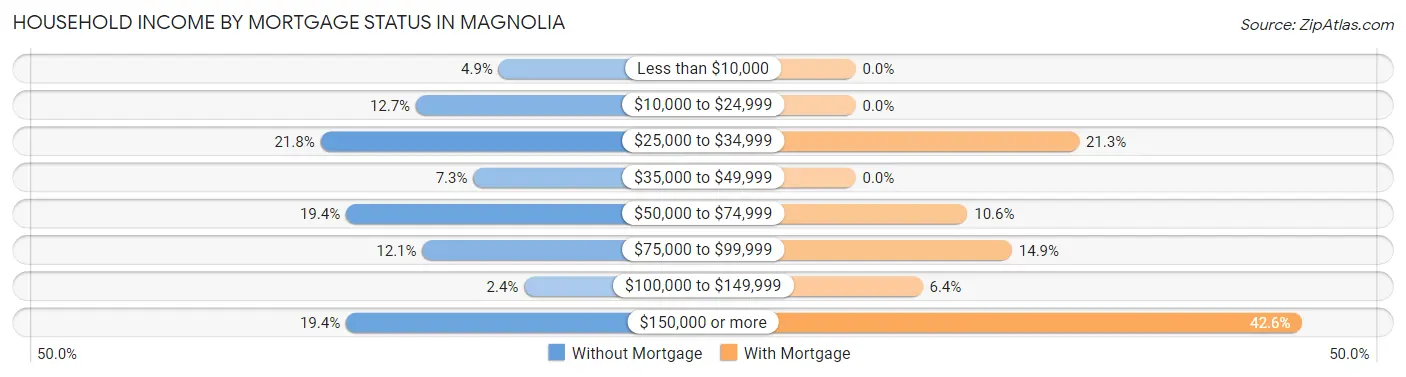
| Household Income | Without Mortgage | With Mortgage |
| Less than $10,000 | 8 (4.9%) | 0 (0.0%) |
| $10,000 to $24,999 | 21 (12.7%) | 0 (0.0%) |
| $25,000 to $34,999 | 36 (21.8%) | 10 (21.3%) |
| $35,000 to $49,999 | 12 (7.3%) | 0 (0.0%) |
| $50,000 to $74,999 | 32 (19.4%) | 5 (10.6%) |
| $75,000 to $99,999 | 20 (12.1%) | 7 (14.9%) |
| $100,000 to $149,999 | 4 (2.4%) | 3 (6.4%) |
| $150,000 or more | 32 (19.4%) | 20 (42.5%) |
| Total | 165 (100.0%) | 47 (100.0%) |
Property Value to Household Income Ratio in Magnolia
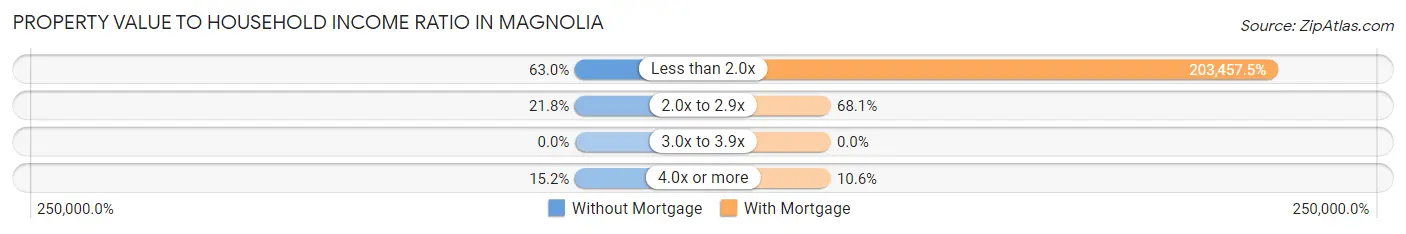
| Value-to-Income Ratio | Without Mortgage | With Mortgage |
| Less than 2.0x | 104 (63.0%) | 95,625 (203,457.4%) |
| 2.0x to 2.9x | 36 (21.8%) | 32 (68.1%) |
| 3.0x to 3.9x | 0 (0.0%) | 0 (0.0%) |
| 4.0x or more | 25 (15.1%) | 5 (10.6%) |
| Total | 165 (100.0%) | 47 (100.0%) |
Real Estate Taxes by Mortgage Status in Magnolia
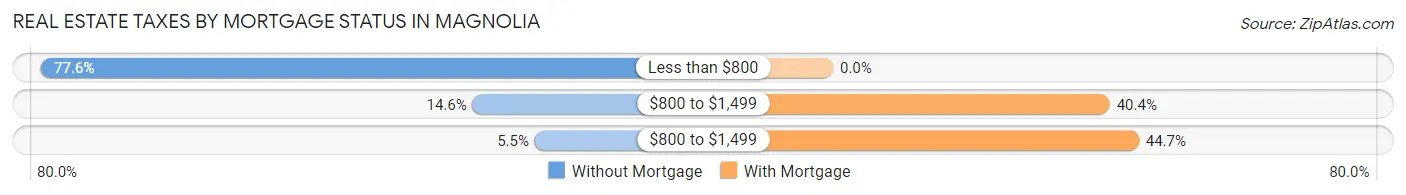
| Property Taxes | Without Mortgage | With Mortgage |
| Less than $800 | 128 (77.6%) | 0 (0.0%) |
| $800 to $1,499 | 24 (14.5%) | 19 (40.4%) |
| $800 to $1,499 | 9 (5.4%) | 21 (44.7%) |
| Total | 165 (100.0%) | 47 (100.0%) |
Health & Disability in Magnolia
Health Insurance Coverage by Age in Magnolia
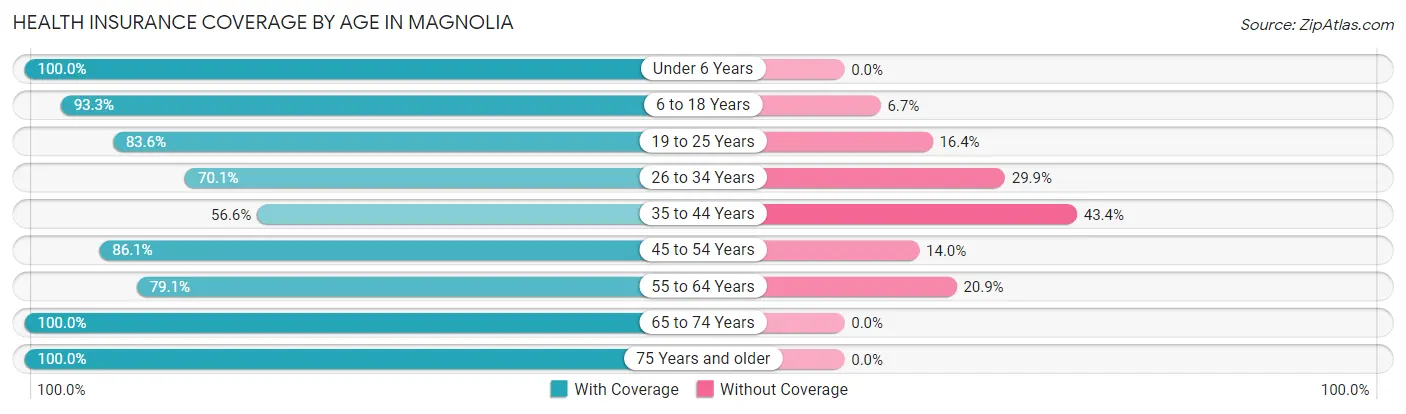
| Age Bracket | With Coverage | Without Coverage |
| Under 6 Years | 91 (100.0%) | 0 (0.0%) |
| 6 to 18 Years | 180 (93.3%) | 13 (6.7%) |
| 19 to 25 Years | 61 (83.6%) | 12 (16.4%) |
| 26 to 34 Years | 96 (70.1%) | 41 (29.9%) |
| 35 to 44 Years | 81 (56.6%) | 62 (43.4%) |
| 45 to 54 Years | 74 (86.1%) | 12 (14.0%) |
| 55 to 64 Years | 87 (79.1%) | 23 (20.9%) |
| 65 to 74 Years | 56 (100.0%) | 0 (0.0%) |
| 75 Years and older | 55 (100.0%) | 0 (0.0%) |
| Total | 781 (82.7%) | 163 (17.3%) |
Health Insurance Coverage by Citizenship Status in Magnolia
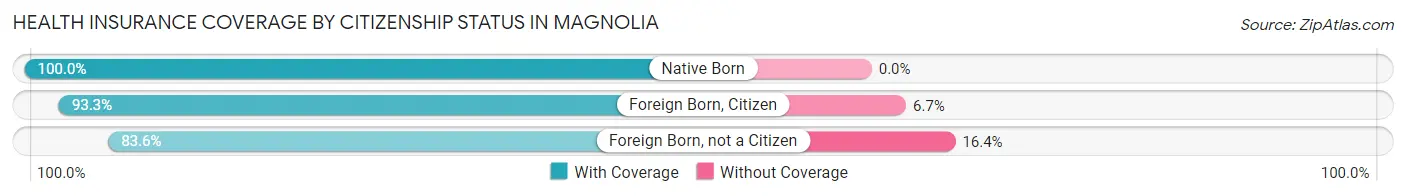
| Citizenship Status | With Coverage | Without Coverage |
| Native Born | 91 (100.0%) | 0 (0.0%) |
| Foreign Born, Citizen | 180 (93.3%) | 13 (6.7%) |
| Foreign Born, not a Citizen | 61 (83.6%) | 12 (16.4%) |
Health Insurance Coverage by Household Income in Magnolia
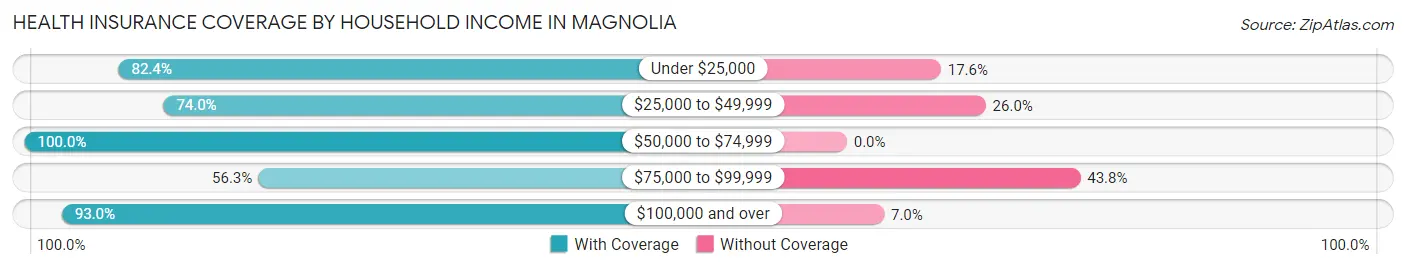
| Household Income | With Coverage | Without Coverage |
| Under $25,000 | 248 (82.4%) | 53 (17.6%) |
| $25,000 to $49,999 | 199 (74.0%) | 70 (26.0%) |
| $50,000 to $74,999 | 130 (100.0%) | 0 (0.0%) |
| $75,000 to $99,999 | 36 (56.2%) | 28 (43.8%) |
| $100,000 and over | 160 (93.0%) | 12 (7.0%) |
Public vs Private Health Insurance Coverage by Age in Magnolia
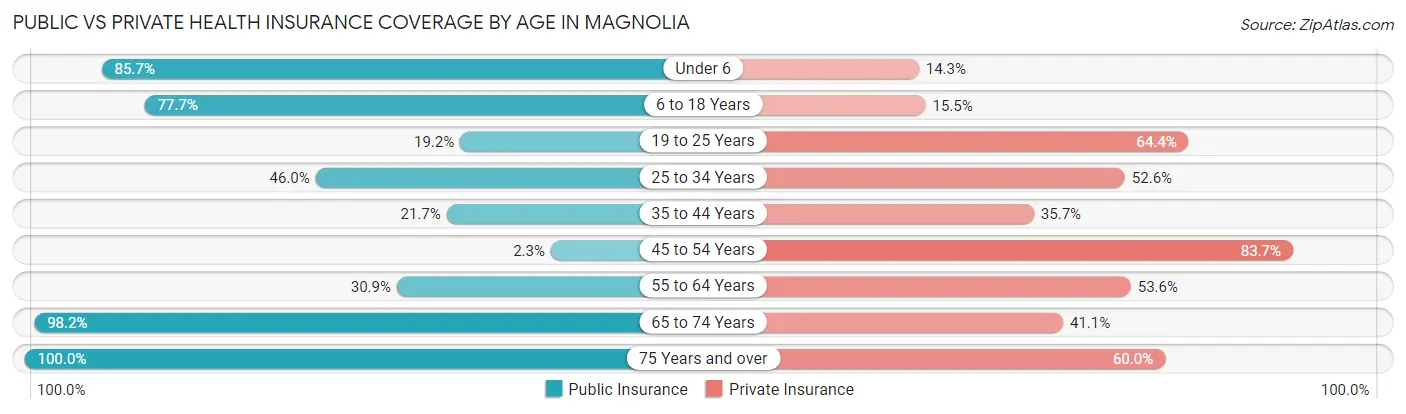
| Age Bracket | Public Insurance | Private Insurance |
| Under 6 | 78 (85.7%) | 13 (14.3%) |
| 6 to 18 Years | 150 (77.7%) | 30 (15.5%) |
| 19 to 25 Years | 14 (19.2%) | 47 (64.4%) |
| 25 to 34 Years | 63 (46.0%) | 72 (52.5%) |
| 35 to 44 Years | 31 (21.7%) | 51 (35.7%) |
| 45 to 54 Years | 2 (2.3%) | 72 (83.7%) |
| 55 to 64 Years | 34 (30.9%) | 59 (53.6%) |
| 65 to 74 Years | 55 (98.2%) | 23 (41.1%) |
| 75 Years and over | 55 (100.0%) | 33 (60.0%) |
| Total | 482 (51.1%) | 400 (42.4%) |
Disability Status by Sex by Age in Magnolia
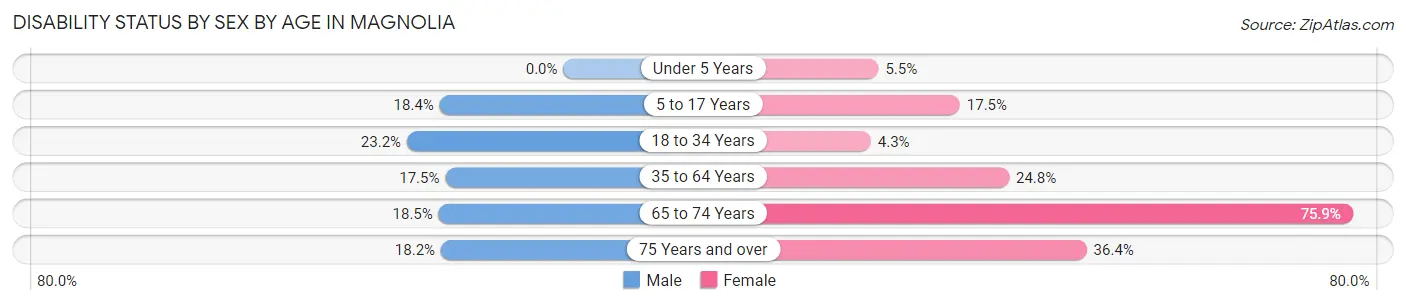
| Age Bracket | Male | Female |
| Under 5 Years | 0 (0.0%) | 3 (5.4%) |
| 5 to 17 Years | 18 (18.4%) | 17 (17.5%) |
| 18 to 34 Years | 23 (23.2%) | 5 (4.3%) |
| 35 to 64 Years | 34 (17.5%) | 36 (24.8%) |
| 65 to 74 Years | 5 (18.5%) | 22 (75.9%) |
| 75 Years and over | 2 (18.2%) | 16 (36.4%) |
Disability Class by Sex by Age in Magnolia
Disability Class: Hearing Difficulty
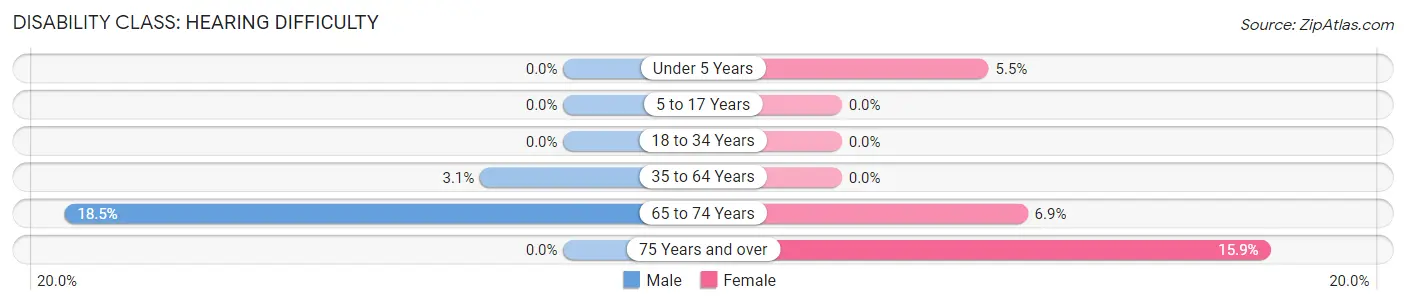
| Age Bracket | Male | Female |
| Under 5 Years | 0 (0.0%) | 3 (5.4%) |
| 5 to 17 Years | 0 (0.0%) | 0 (0.0%) |
| 18 to 34 Years | 0 (0.0%) | 0 (0.0%) |
| 35 to 64 Years | 6 (3.1%) | 0 (0.0%) |
| 65 to 74 Years | 5 (18.5%) | 2 (6.9%) |
| 75 Years and over | 0 (0.0%) | 7 (15.9%) |
Disability Class: Vision Difficulty
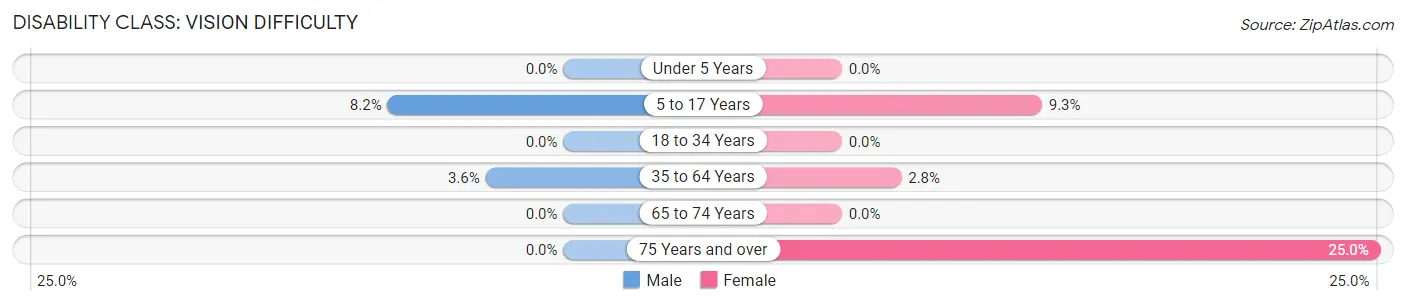
| Age Bracket | Male | Female |
| Under 5 Years | 0 (0.0%) | 0 (0.0%) |
| 5 to 17 Years | 8 (8.2%) | 9 (9.3%) |
| 18 to 34 Years | 0 (0.0%) | 0 (0.0%) |
| 35 to 64 Years | 7 (3.6%) | 4 (2.8%) |
| 65 to 74 Years | 0 (0.0%) | 0 (0.0%) |
| 75 Years and over | 0 (0.0%) | 11 (25.0%) |
Disability Class: Cognitive Difficulty
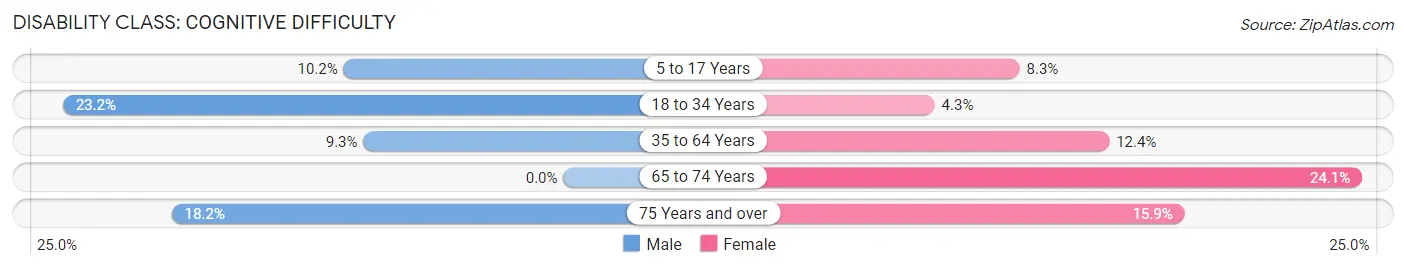
| Age Bracket | Male | Female |
| 5 to 17 Years | 10 (10.2%) | 8 (8.3%) |
| 18 to 34 Years | 23 (23.2%) | 5 (4.3%) |
| 35 to 64 Years | 18 (9.3%) | 18 (12.4%) |
| 65 to 74 Years | 0 (0.0%) | 7 (24.1%) |
| 75 Years and over | 2 (18.2%) | 7 (15.9%) |
Disability Class: Ambulatory Difficulty
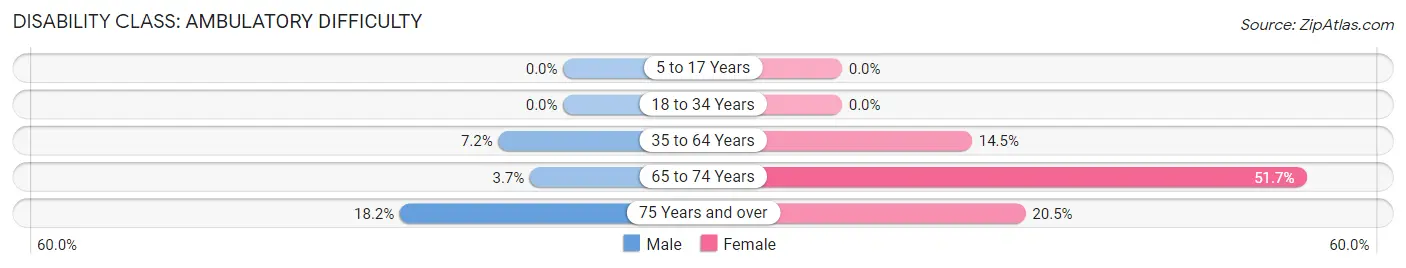
| Age Bracket | Male | Female |
| 5 to 17 Years | 0 (0.0%) | 0 (0.0%) |
| 18 to 34 Years | 0 (0.0%) | 0 (0.0%) |
| 35 to 64 Years | 14 (7.2%) | 21 (14.5%) |
| 65 to 74 Years | 1 (3.7%) | 15 (51.7%) |
| 75 Years and over | 2 (18.2%) | 9 (20.4%) |
Disability Class: Self-Care Difficulty
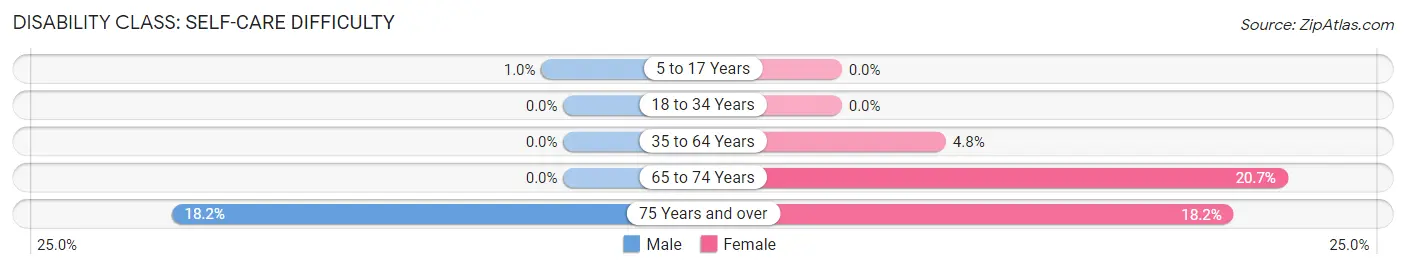
| Age Bracket | Male | Female |
| 5 to 17 Years | 1 (1.0%) | 0 (0.0%) |
| 18 to 34 Years | 0 (0.0%) | 0 (0.0%) |
| 35 to 64 Years | 0 (0.0%) | 7 (4.8%) |
| 65 to 74 Years | 0 (0.0%) | 6 (20.7%) |
| 75 Years and over | 2 (18.2%) | 8 (18.2%) |
Technology Access in Magnolia
Computing Device Access in Magnolia
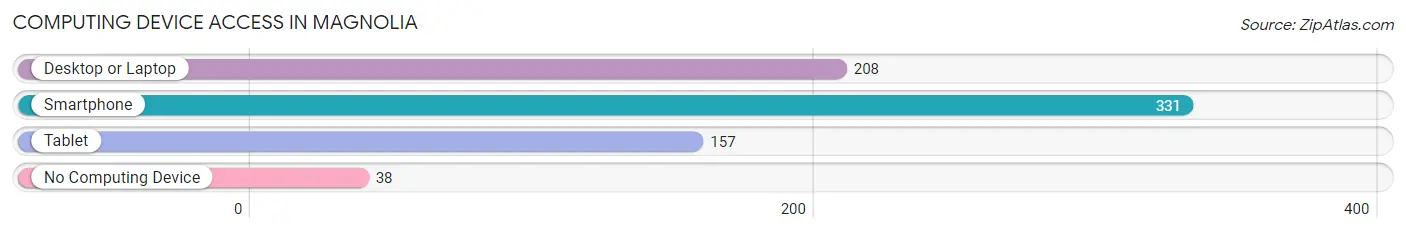
| Device Type | # Households | % Households |
| Desktop or Laptop | 208 | 52.0% |
| Smartphone | 331 | 82.8% |
| Tablet | 157 | 39.3% |
| No Computing Device | 38 | 9.5% |
| Total | 400 | 100.0% |
Internet Access in Magnolia
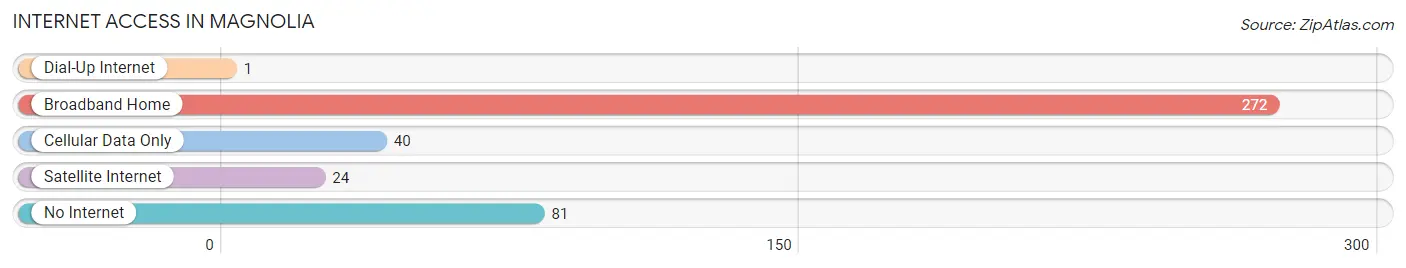
| Internet Type | # Households | % Households |
| Dial-Up Internet | 1 | 0.3% |
| Broadband Home | 272 | 68.0% |
| Cellular Data Only | 40 | 10.0% |
| Satellite Internet | 24 | 6.0% |
| No Internet | 81 | 20.3% |
| Total | 400 | 100.0% |
Magnolia Summary
Magnolia, North Carolina is a small town located in the southeastern corner of the state, in the county of Columbus. It is situated on the banks of the Lumber River, and is home to a population of just over 1,000 people. The town was founded in 1887, and has a rich history of farming, timber, and manufacturing.
Geography
Magnolia is located in the southeastern corner of North Carolina, in the county of Columbus. It is situated on the banks of the Lumber River, and is surrounded by the towns of Whiteville, Chadbourn, and Tabor City. The town is located at an elevation of approximately 100 feet above sea level, and has a total area of 1.2 square miles. The climate in Magnolia is humid subtropical, with hot, humid summers and mild winters.
Economy
The economy of Magnolia is largely based on agriculture and manufacturing. The town is home to several farms, which produce a variety of crops, including corn, soybeans, cotton, and tobacco. The town is also home to several timber companies, which harvest and process timber for use in furniture and other wood products. In addition, Magnolia is home to several manufacturing companies, which produce a variety of products, including textiles, paper products, and plastics.
Demographics
As of the 2010 census, the population of Magnolia was 1,072. The racial makeup of the town was 79.3% White, 17.2% African American, 0.3% Native American, 0.3% Asian, 0.1% Pacific Islander, and 2.8% from other races. The median household income in Magnolia was $25,938, and the median family income was $31,250. The per capita income in Magnolia was $14,945.
Conclusion
Magnolia, North Carolina is a small town located in the southeastern corner of the state, in the county of Columbus. It is situated on the banks of the Lumber River, and is home to a population of just over 1,000 people. The town was founded in 1887, and has a rich history of farming, timber, and manufacturing. The economy of Magnolia is largely based on agriculture and manufacturing, and the town is home to several farms, timber companies, and manufacturing companies. As of the 2010 census, the population of Magnolia was 1,072, and the median household income was $25,938. Magnolia is a small town with a rich history and a diverse economy, and is a great place to live and work.
Common Questions
What is Per Capita Income in Magnolia?
Per Capita income in Magnolia is $18,276.
What is the Median Household income in Magnolia?
Median Household Income in Magnolia is $35,357.
What is Income or Wage Gap in Magnolia?
Income or Wage Gap in Magnolia is 24.8%.
Women in Magnolia earn 75.2 cents for every dollar earned by a man.
What is Inequality or Gini Index in Magnolia?
Inequality or Gini Index in Magnolia is 0.48.
What is the Total Population of Magnolia?
Total Population of Magnolia is 944.
What is the Total Male Population of Magnolia?
Total Male Population of Magnolia is 458.
What is the Total Female Population of Magnolia?
Total Female Population of Magnolia is 486.
What is the Ratio of Males per 100 Females in Magnolia?
There are 94.24 Males per 100 Females in Magnolia.
What is the Ratio of Females per 100 Males in Magnolia?
There are 106.11 Females per 100 Males in Magnolia.
What is the Median Population Age in Magnolia?
Median Population Age in Magnolia is 34.5 Years.
What is the Average Family Size in Magnolia
Average Family Size in Magnolia is 2.9 People.
What is the Average Household Size in Magnolia
Average Household Size in Magnolia is 2.3 People.
How Large is the Labor Force in Magnolia?
There are 465 People in the Labor Forcein in Magnolia.
What is the Percentage of People in the Labor Force in Magnolia?
66.4% of People are in the Labor Force in Magnolia.
What is the Unemployment Rate in Magnolia?
Unemployment Rate in Magnolia is 4.3%.