Wentworth, NC Map & Demographics
Wentworth Map
Wentworth Overview
$29,529
PER CAPITA INCOME
$80,647
AVG FAMILY INCOME
$71,806
AVG HOUSEHOLD INCOME
13.7%
WAGE / INCOME GAP [ % ]
86.3¢/ $1
WAGE / INCOME GAP [ $ ]
$12,204
FAMILY INCOME DEFICIT
0.37
INEQUALITY / GINI INDEX
2,664
TOTAL POPULATION
1,330
MALE POPULATION
1,334
FEMALE POPULATION
99.70
MALES / 100 FEMALES
100.30
FEMALES / 100 MALES
41.8
MEDIAN AGE
3.0
AVG FAMILY SIZE
2.5
AVG HOUSEHOLD SIZE
1,076
LABOR FORCE [ PEOPLE ]
48.3%
PERCENT IN LABOR FORCE
5.2%
UNEMPLOYMENT RATE
Wentworth Area Codes
Income in Wentworth
Income Overview in Wentworth
Per Capita Income in Wentworth is $29,529, while median incomes of families and households are $80,647 and $71,806 respectively.
| Characteristic | Number | Measure |
| Per Capita Income | 2,664 | $29,529 |
| Median Family Income | 697 | $80,647 |
| Mean Family Income | 697 | $87,042 |
| Median Household Income | 942 | $71,806 |
| Mean Household Income | 942 | $79,407 |
| Income Deficit | 697 | $12,204 |
| Wage / Income Gap (%) | 2,664 | 13.70% |
| Wage / Income Gap ($) | 2,664 | 86.30¢ per $1 |
| Gini / Inequality Index | 2,664 | 0.37 |
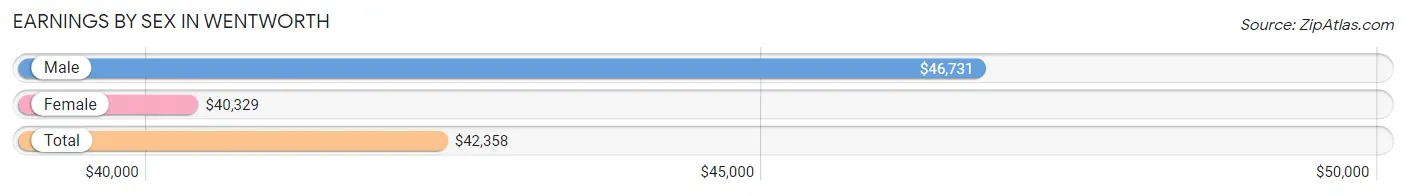
Earnings by Sex in Wentworth
Average Earnings in Wentworth are $42,358, $46,731 for men and $40,329 for women, a difference of 13.7%.
| Sex | Number | Average Earnings |
| Male | 660 (57.1%) | $46,731 |
| Female | 496 (42.9%) | $40,329 |
| Total | 1,156 (100.0%) | $42,358 |
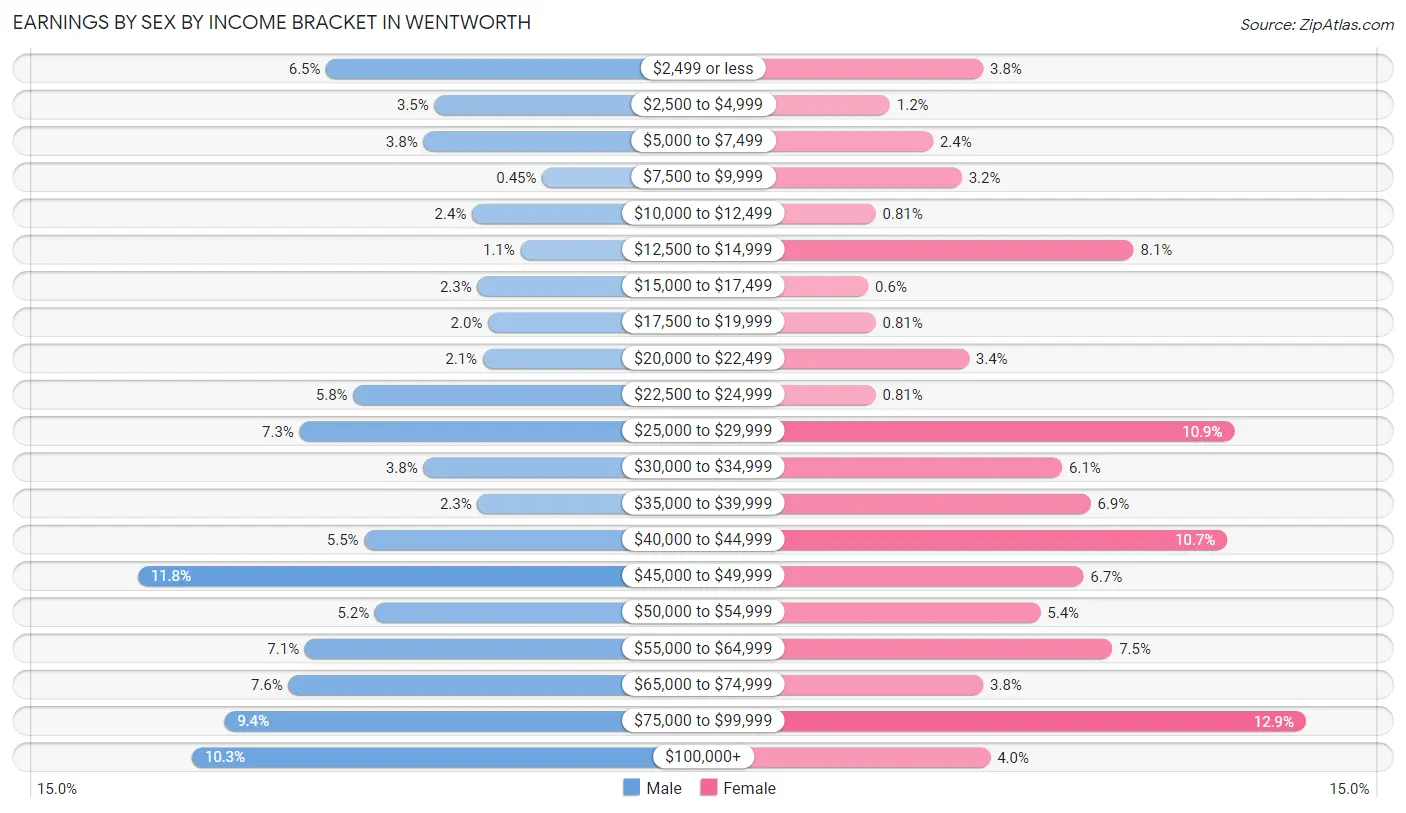
Earnings by Sex by Income Bracket in Wentworth
The most common earnings brackets in Wentworth are $45,000 to $49,999 for men (78 | 11.8%) and $75,000 to $99,999 for women (64 | 12.9%).
| Income | Male | Female |
| $2,499 or less | 43 (6.5%) | 19 (3.8%) |
| $2,500 to $4,999 | 23 (3.5%) | 6 (1.2%) |
| $5,000 to $7,499 | 25 (3.8%) | 12 (2.4%) |
| $7,500 to $9,999 | 3 (0.4%) | 16 (3.2%) |
| $10,000 to $12,499 | 16 (2.4%) | 4 (0.8%) |
| $12,500 to $14,999 | 7 (1.1%) | 40 (8.1%) |
| $15,000 to $17,499 | 15 (2.3%) | 3 (0.6%) |
| $17,500 to $19,999 | 13 (2.0%) | 4 (0.8%) |
| $20,000 to $22,499 | 14 (2.1%) | 17 (3.4%) |
| $22,500 to $24,999 | 38 (5.8%) | 4 (0.8%) |
| $25,000 to $29,999 | 48 (7.3%) | 54 (10.9%) |
| $30,000 to $34,999 | 25 (3.8%) | 30 (6.0%) |
| $35,000 to $39,999 | 15 (2.3%) | 34 (6.9%) |
| $40,000 to $44,999 | 36 (5.4%) | 53 (10.7%) |
| $45,000 to $49,999 | 78 (11.8%) | 33 (6.7%) |
| $50,000 to $54,999 | 34 (5.1%) | 27 (5.4%) |
| $55,000 to $64,999 | 47 (7.1%) | 37 (7.5%) |
| $65,000 to $74,999 | 50 (7.6%) | 19 (3.8%) |
| $75,000 to $99,999 | 62 (9.4%) | 64 (12.9%) |
| $100,000+ | 68 (10.3%) | 20 (4.0%) |
| Total | 660 (100.0%) | 496 (100.0%) |
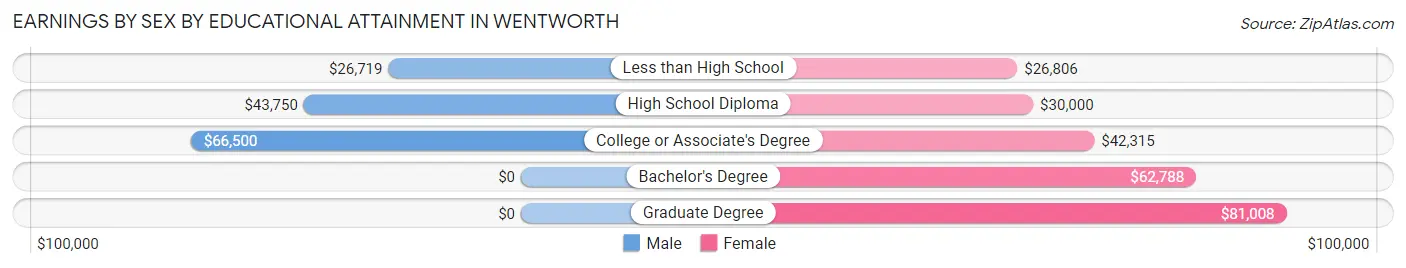
Earnings by Sex by Educational Attainment in Wentworth
Average earnings in Wentworth are $48,470 for men and $41,842 for women, a difference of 13.7%. Men with an educational attainment of college or associate's degree enjoy the highest average annual earnings of $66,500, while those with less than high school education earn the least with $26,719. Women with an educational attainment of graduate degree earn the most with the average annual earnings of $81,008, while those with less than high school education have the smallest earnings of $26,806.
| Educational Attainment | Male Income | Female Income |
| Less than High School | $26,719 | $26,806 |
| High School Diploma | $43,750 | $30,000 |
| College or Associate's Degree | $66,500 | $42,315 |
| Bachelor's Degree | - | - |
| Graduate Degree | - | - |
| Total | $48,470 | $41,842 |
Family Income in Wentworth
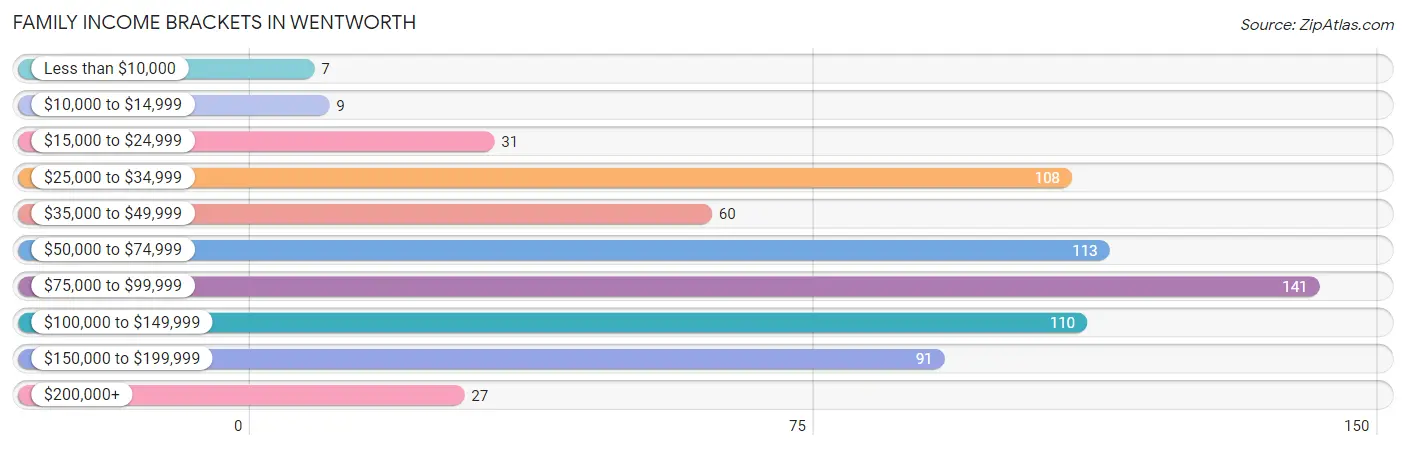
Family Income Brackets in Wentworth
According to the Wentworth family income data, there are 141 families falling into the $75,000 to $99,999 income range, which is the most common income bracket and makes up 20.2% of all families. Conversely, the less than $10,000 income bracket is the least frequent group with only 7 families (1.0%) belonging to this category.
| Income Bracket | # Families | % Families |
| Less than $10,000 | 7 | 1.0% |
| $10,000 to $14,999 | 9 | 1.3% |
| $15,000 to $24,999 | 31 | 4.4% |
| $25,000 to $34,999 | 108 | 15.5% |
| $35,000 to $49,999 | 60 | 8.6% |
| $50,000 to $74,999 | 113 | 16.2% |
| $75,000 to $99,999 | 141 | 20.2% |
| $100,000 to $149,999 | 110 | 15.8% |
| $150,000 to $199,999 | 91 | 13.1% |
| $200,000+ | 27 | 3.9% |
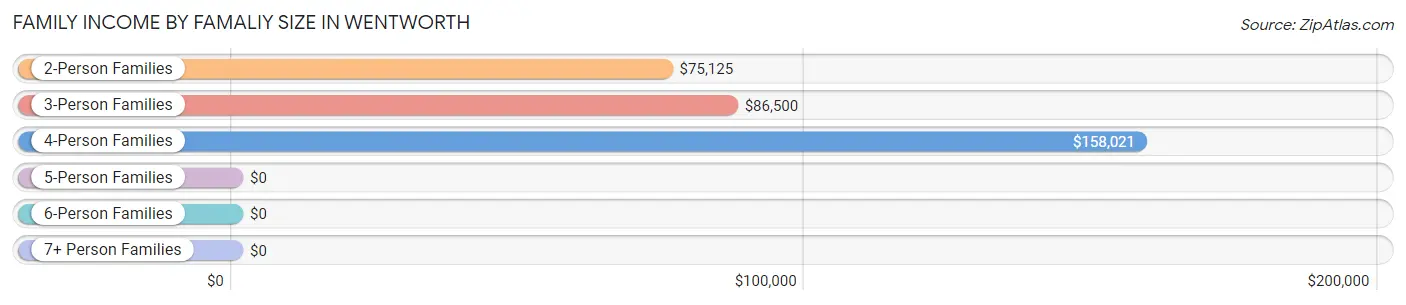
Family Income by Famaliy Size in Wentworth
4-person families (90 | 12.9%) account for the highest median family income in Wentworth with $158,021 per family, while 4-person families (90 | 12.9%) have the highest median income of $39,505 per family member.
| Income Bracket | # Families | Median Income |
| 2-Person Families | 303 (43.5%) | $75,125 |
| 3-Person Families | 192 (27.6%) | $86,500 |
| 4-Person Families | 90 (12.9%) | $158,021 |
| 5-Person Families | 37 (5.3%) | $0 |
| 6-Person Families | 75 (10.8%) | $0 |
| 7+ Person Families | 0 (0.0%) | $0 |
| Total | 697 (100.0%) | $80,647 |
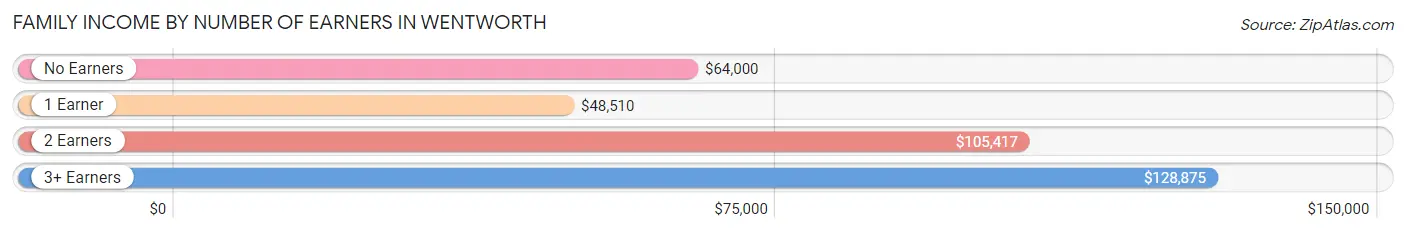
Family Income by Number of Earners in Wentworth
The median family income in Wentworth is $80,647, with families comprising 3+ earners (79) having the highest median family income of $128,875, while families with 1 earner (267) have the lowest median family income of $48,510, accounting for 11.3% and 38.3% of families, respectively.
| Number of Earners | # Families | Median Income |
| No Earners | 120 (17.2%) | $64,000 |
| 1 Earner | 267 (38.3%) | $48,510 |
| 2 Earners | 231 (33.1%) | $105,417 |
| 3+ Earners | 79 (11.3%) | $128,875 |
| Total | 697 (100.0%) | $80,647 |
Household Income in Wentworth
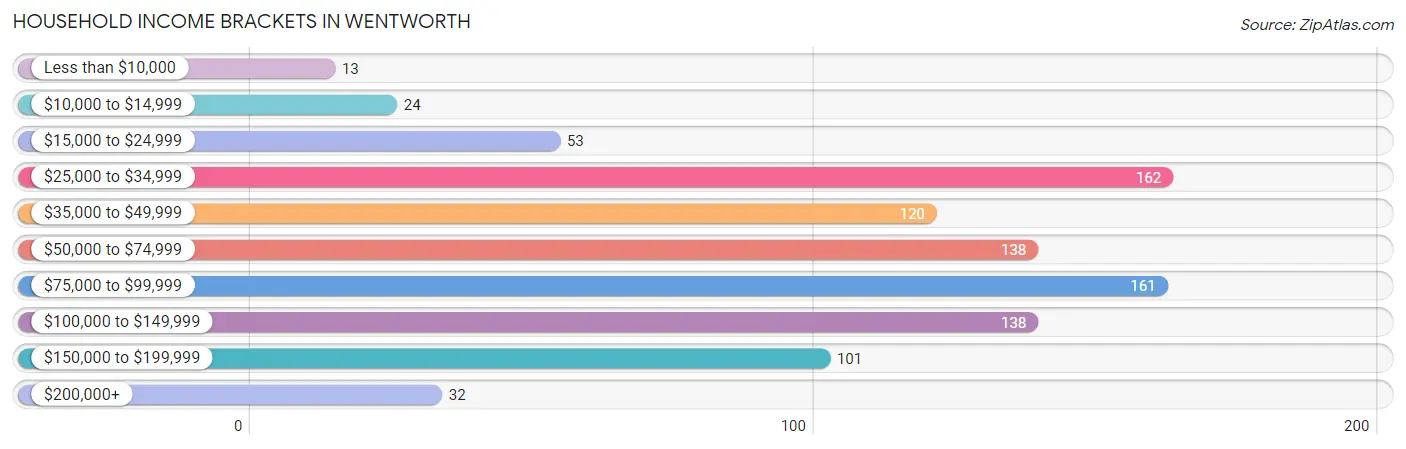
Household Income Brackets in Wentworth
With 162 households falling in the category, the $25,000 to $34,999 income range is the most frequent in Wentworth, accounting for 17.2% of all households. In contrast, only 13 households (1.4%) fall into the less than $10,000 income bracket, making it the least populous group.
| Income Bracket | # Households | % Households |
| Less than $10,000 | 13 | 1.4% |
| $10,000 to $14,999 | 24 | 2.5% |
| $15,000 to $24,999 | 53 | 5.6% |
| $25,000 to $34,999 | 162 | 17.2% |
| $35,000 to $49,999 | 120 | 12.7% |
| $50,000 to $74,999 | 138 | 14.6% |
| $75,000 to $99,999 | 161 | 17.1% |
| $100,000 to $149,999 | 138 | 14.6% |
| $150,000 to $199,999 | 101 | 10.7% |
| $200,000+ | 32 | 3.4% |
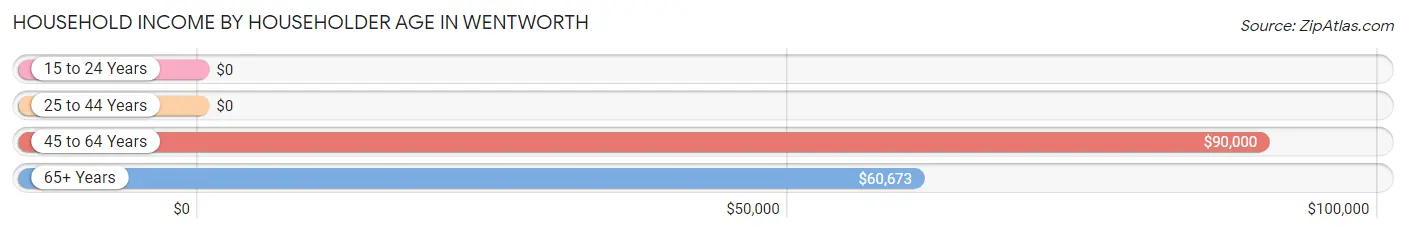
Household Income by Householder Age in Wentworth
The median household income in Wentworth is $71,806, with the highest median household income of $90,000 found in the 45 to 64 years age bracket for the primary householder. A total of 382 households (40.6%) fall into this category.
| Income Bracket | # Households | Median Income |
| 15 to 24 Years | 0 (0.0%) | $0 |
| 25 to 44 Years | 218 (23.1%) | $0 |
| 45 to 64 Years | 382 (40.6%) | $90,000 |
| 65+ Years | 342 (36.3%) | $60,673 |
| Total | 942 (100.0%) | $71,806 |
Poverty in Wentworth
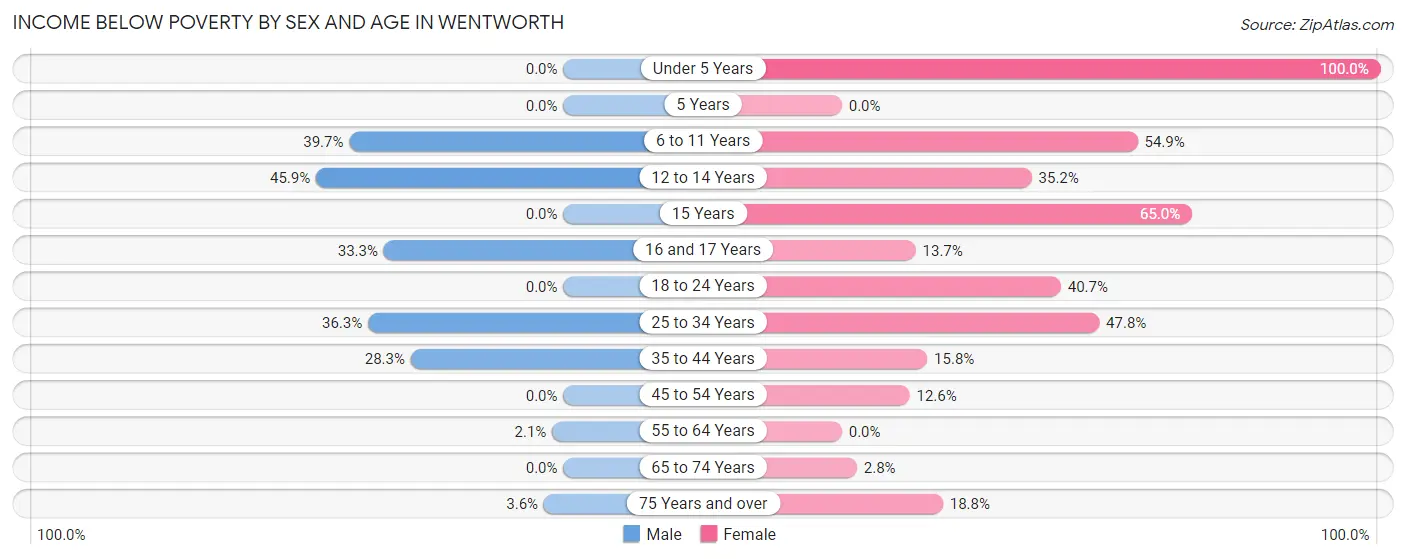
Income Below Poverty by Sex and Age in Wentworth
With 12.2% poverty level for males and 26.2% for females among the residents of Wentworth, 12 to 14 year old males and under 5 year old females are the most vulnerable to poverty, with 28 males (45.9%) and 14 females (100.0%) in their respective age groups living below the poverty level.
| Age Bracket | Male | Female |
| Under 5 Years | 0 (0.0%) | 14 (100.0%) |
| 5 Years | 0 (0.0%) | 0 (0.0%) |
| 6 to 11 Years | 31 (39.7%) | 73 (54.9%) |
| 12 to 14 Years | 28 (45.9%) | 31 (35.2%) |
| 15 Years | 0 (0.0%) | 26 (65.0%) |
| 16 and 17 Years | 6 (33.3%) | 10 (13.7%) |
| 18 to 24 Years | 0 (0.0%) | 50 (40.6%) |
| 25 to 34 Years | 29 (36.2%) | 75 (47.8%) |
| 35 to 44 Years | 32 (28.3%) | 16 (15.8%) |
| 45 to 54 Years | 0 (0.0%) | 22 (12.6%) |
| 55 to 64 Years | 3 (2.1%) | 0 (0.0%) |
| 65 to 74 Years | 0 (0.0%) | 4 (2.8%) |
| 75 Years and over | 3 (3.6%) | 18 (18.8%) |
| Total | 132 (12.2%) | 339 (26.2%) |
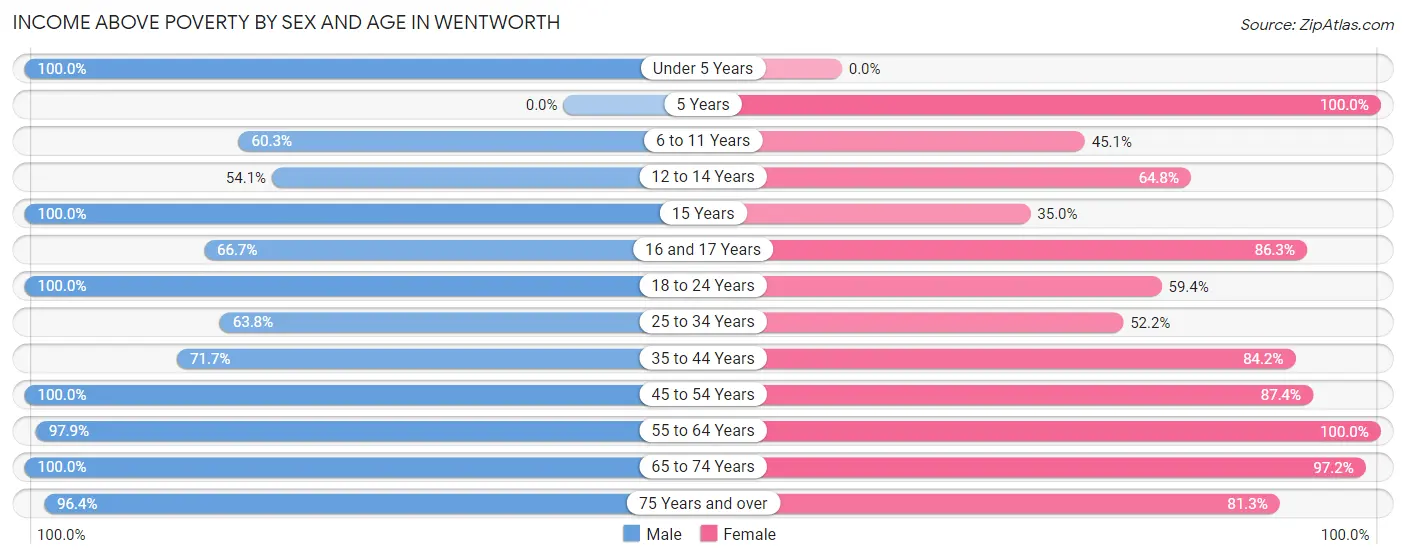
Income Above Poverty by Sex and Age in Wentworth
According to the poverty statistics in Wentworth, males aged under 5 years and females aged 5 years are the age groups that are most secure financially, with 100.0% of males and 100.0% of females in these age groups living above the poverty line.
| Age Bracket | Male | Female |
| Under 5 Years | 7 (100.0%) | 0 (0.0%) |
| 5 Years | 0 (0.0%) | 8 (100.0%) |
| 6 to 11 Years | 47 (60.3%) | 60 (45.1%) |
| 12 to 14 Years | 33 (54.1%) | 57 (64.8%) |
| 15 Years | 5 (100.0%) | 14 (35.0%) |
| 16 and 17 Years | 12 (66.7%) | 63 (86.3%) |
| 18 to 24 Years | 82 (100.0%) | 73 (59.4%) |
| 25 to 34 Years | 51 (63.7%) | 82 (52.2%) |
| 35 to 44 Years | 81 (71.7%) | 85 (84.2%) |
| 45 to 54 Years | 209 (100.0%) | 153 (87.4%) |
| 55 to 64 Years | 141 (97.9%) | 141 (100.0%) |
| 65 to 74 Years | 205 (100.0%) | 139 (97.2%) |
| 75 Years and over | 80 (96.4%) | 78 (81.2%) |
| Total | 953 (87.8%) | 953 (73.8%) |
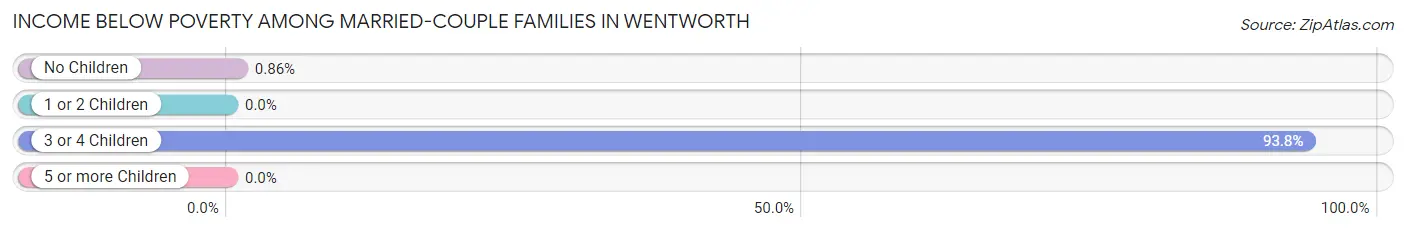
Income Below Poverty Among Married-Couple Families in Wentworth
The poverty statistics for married-couple families in Wentworth show that 13.8% or 78 of the total 564 families live below the poverty line. Families with 3 or 4 children have the highest poverty rate of 93.8%, comprising of 75 families. On the other hand, families with 1 or 2 children have the lowest poverty rate of 0.0%, which includes 0 families.
| Children | Above Poverty | Below Poverty |
| No Children | 344 (99.1%) | 3 (0.9%) |
| 1 or 2 Children | 137 (100.0%) | 0 (0.0%) |
| 3 or 4 Children | 5 (6.2%) | 75 (93.8%) |
| 5 or more Children | 0 (0.0%) | 0 (0.0%) |
| Total | 486 (86.2%) | 78 (13.8%) |
Income Below Poverty Among Single-Parent Households in Wentworth
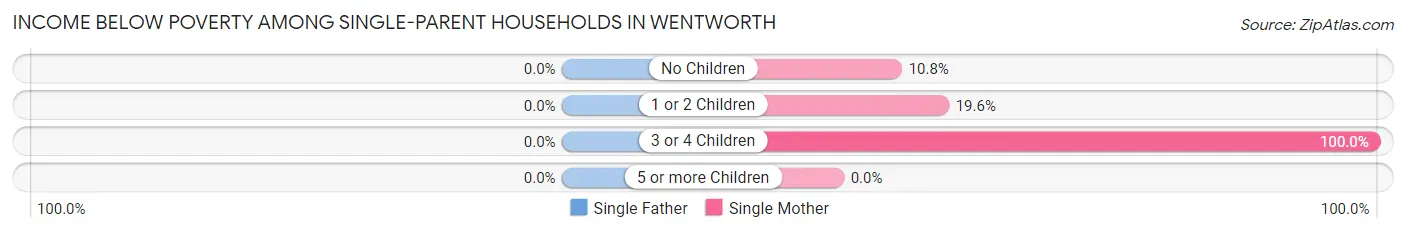
| Children | Single Father | Single Mother |
| No Children | 0 (0.0%) | 4 (10.8%) |
| 1 or 2 Children | 0 (0.0%) | 9 (19.6%) |
| 3 or 4 Children | 0 (0.0%) | 16 (100.0%) |
| 5 or more Children | 0 (0.0%) | 0 (0.0%) |
| Total | 0 (0.0%) | 29 (29.3%) |
Income Below Poverty Among Married-Couple vs Single-Parent Households in Wentworth
The poverty data for Wentworth shows that 78 of the married-couple family households (13.8%) and 29 of the single-parent households (21.8%) are living below the poverty level. Within the married-couple family households, those with 3 or 4 children have the highest poverty rate, with 75 households (93.8%) falling below the poverty line. Among the single-parent households, those with 3 or 4 children have the highest poverty rate, with 16 household (100.0%) living below poverty.
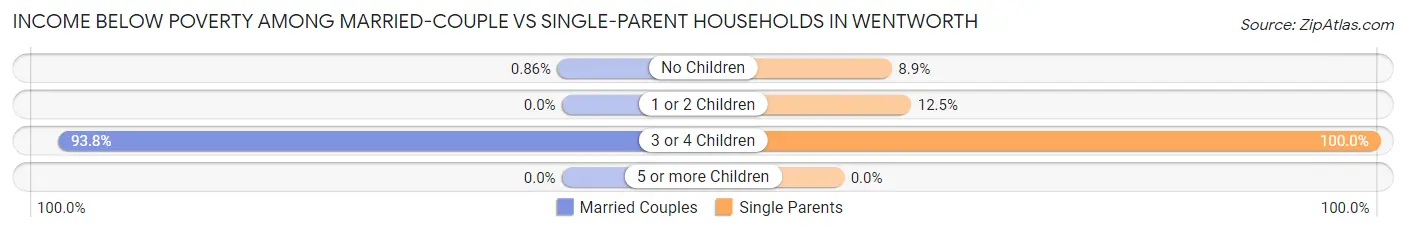
| Children | Married-Couple Families | Single-Parent Households |
| No Children | 3 (0.9%) | 4 (8.9%) |
| 1 or 2 Children | 0 (0.0%) | 9 (12.5%) |
| 3 or 4 Children | 75 (93.8%) | 16 (100.0%) |
| 5 or more Children | 0 (0.0%) | 0 (0.0%) |
| Total | 78 (13.8%) | 29 (21.8%) |
Race in Wentworth
The most populous races in Wentworth are White / Caucasian (1,913 | 71.8%), Black / African American (496 | 18.6%), and Hispanic or Latino (220 | 8.3%).
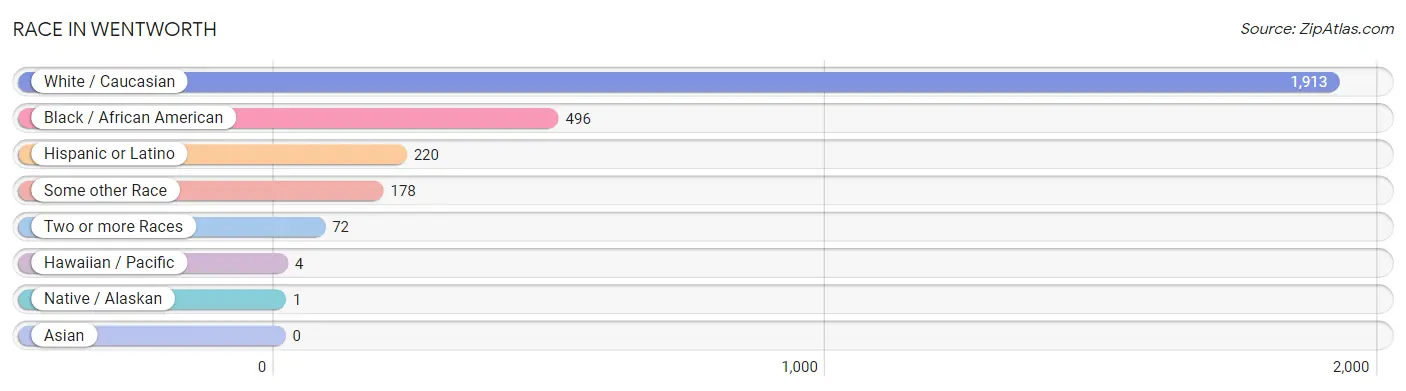
| Race | # Population | % Population |
| Asian | 0 | 0.0% |
| Black / African American | 496 | 18.6% |
| Hawaiian / Pacific | 4 | 0.2% |
| Hispanic or Latino | 220 | 8.3% |
| Native / Alaskan | 1 | 0.0% |
| White / Caucasian | 1,913 | 71.8% |
| Two or more Races | 72 | 2.7% |
| Some other Race | 178 | 6.7% |
| Total | 2,664 | 100.0% |
Ancestry in Wentworth
The most populous ancestries reported in Wentworth are English (397 | 14.9%), American (344 | 12.9%), Irish (280 | 10.5%), German (240 | 9.0%), and Mexican (199 | 7.5%), together accounting for 54.8% of all Wentworth residents.

| Ancestry | # Population | % Population |
| African | 40 | 1.5% |
| American | 344 | 12.9% |
| Argentinean | 4 | 0.2% |
| British | 15 | 0.6% |
| Celtic | 7 | 0.3% |
| Central American | 4 | 0.2% |
| Cherokee | 2 | 0.1% |
| Colombian | 8 | 0.3% |
| Costa Rican | 4 | 0.2% |
| Czech | 3 | 0.1% |
| Danish | 8 | 0.3% |
| Dutch | 53 | 2.0% |
| English | 397 | 14.9% |
| European | 36 | 1.3% |
| French | 34 | 1.3% |
| French Canadian | 35 | 1.3% |
| German | 240 | 9.0% |
| Guamanian / Chamorro | 4 | 0.2% |
| Irish | 280 | 10.5% |
| Italian | 10 | 0.4% |
| Mexican | 199 | 7.5% |
| Polish | 23 | 0.9% |
| Scotch-Irish | 67 | 2.5% |
| Scottish | 70 | 2.6% |
| Slovak | 5 | 0.2% |
| South American | 12 | 0.4% |
| Subsaharan African | 40 | 1.5% |
| Welsh | 8 | 0.3% | View All 28 Rows |
Immigrants in Wentworth
The most numerous immigrant groups reported in Wentworth came from Central America (36 | 1.3%), Latin America (36 | 1.3%), Mexico (32 | 1.2%), Asia (4 | 0.2%), and Costa Rica (4 | 0.2%), together accounting for 4.2% of all Wentworth residents.
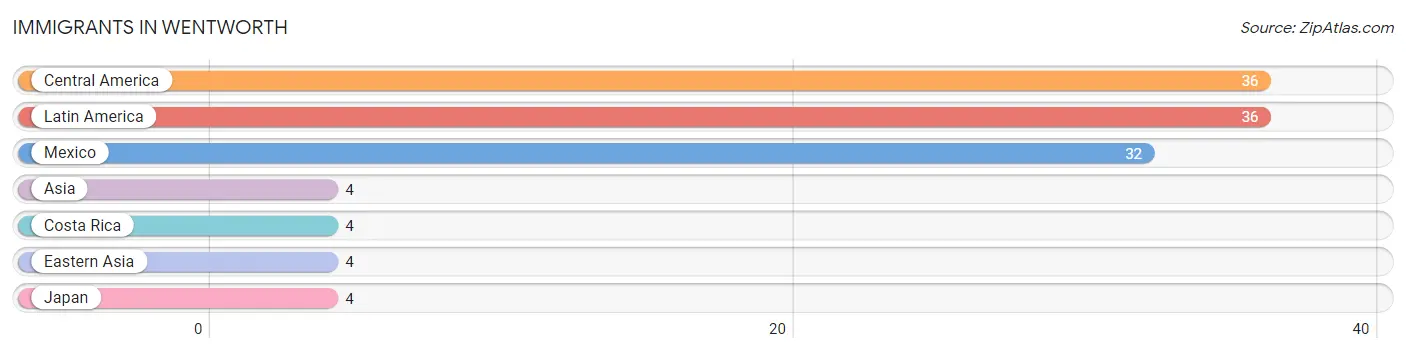
| Immigration Origin | # Population | % Population |
| Asia | 4 | 0.2% |
| Central America | 36 | 1.3% |
| Costa Rica | 4 | 0.2% |
| Eastern Asia | 4 | 0.2% |
| Japan | 4 | 0.2% |
| Latin America | 36 | 1.3% |
| Mexico | 32 | 1.2% | View All 7 Rows |
Sex and Age in Wentworth
Sex and Age in Wentworth
The most populous age groups in Wentworth are 10 to 14 Years (133 | 10.0%) for men and 15 to 19 Years (190 | 14.2%) for women.
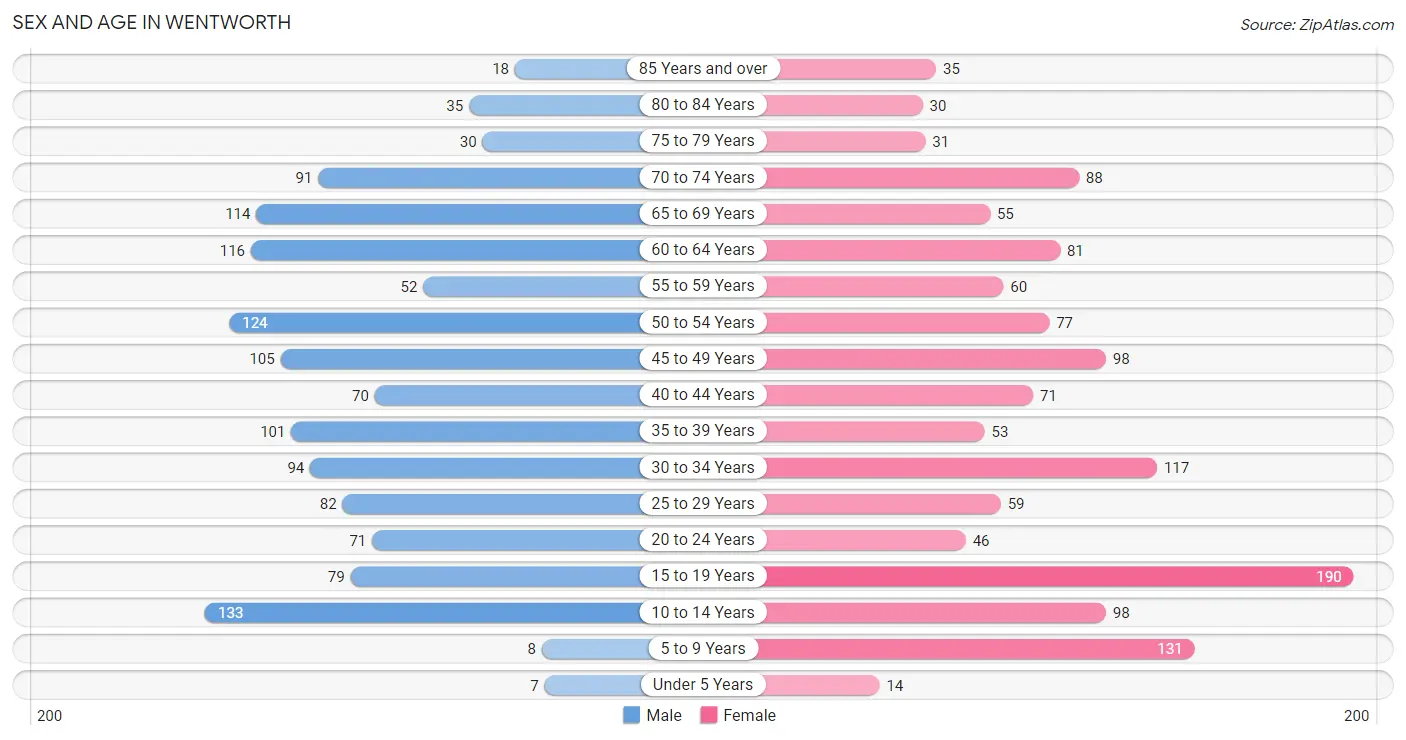
| Age Bracket | Male | Female |
| Under 5 Years | 7 (0.5%) | 14 (1.1%) |
| 5 to 9 Years | 8 (0.6%) | 131 (9.8%) |
| 10 to 14 Years | 133 (10.0%) | 98 (7.3%) |
| 15 to 19 Years | 79 (5.9%) | 190 (14.2%) |
| 20 to 24 Years | 71 (5.3%) | 46 (3.5%) |
| 25 to 29 Years | 82 (6.2%) | 59 (4.4%) |
| 30 to 34 Years | 94 (7.1%) | 117 (8.8%) |
| 35 to 39 Years | 101 (7.6%) | 53 (4.0%) |
| 40 to 44 Years | 70 (5.3%) | 71 (5.3%) |
| 45 to 49 Years | 105 (7.9%) | 98 (7.3%) |
| 50 to 54 Years | 124 (9.3%) | 77 (5.8%) |
| 55 to 59 Years | 52 (3.9%) | 60 (4.5%) |
| 60 to 64 Years | 116 (8.7%) | 81 (6.1%) |
| 65 to 69 Years | 114 (8.6%) | 55 (4.1%) |
| 70 to 74 Years | 91 (6.8%) | 88 (6.6%) |
| 75 to 79 Years | 30 (2.3%) | 31 (2.3%) |
| 80 to 84 Years | 35 (2.6%) | 30 (2.2%) |
| 85 Years and over | 18 (1.3%) | 35 (2.6%) |
| Total | 1,330 (100.0%) | 1,334 (100.0%) |
Families and Households in Wentworth
Median Family Size in Wentworth
The median family size in Wentworth is 2.99 persons per family, with single female/mother families (99 | 14.2%) accounting for the largest median family size of 3.21 persons per family. On the other hand, single male/father families (34 | 4.9%) represent the smallest median family size with 2.24 persons per family.
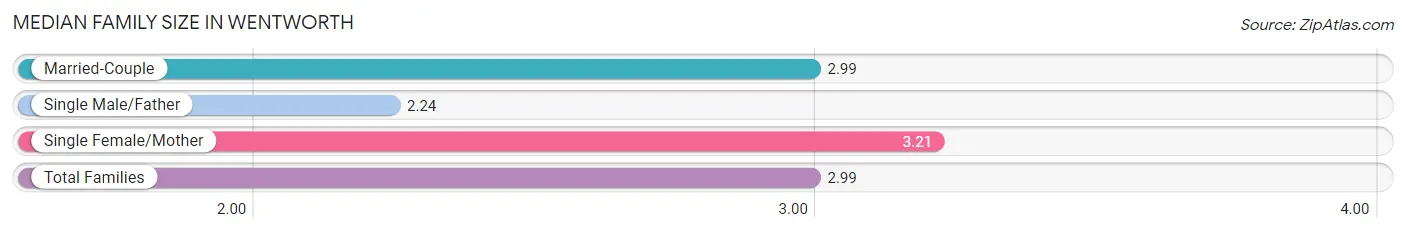
| Family Type | # Families | Family Size |
| Married-Couple | 564 (80.9%) | 2.99 |
| Single Male/Father | 34 (4.9%) | 2.24 |
| Single Female/Mother | 99 (14.2%) | 3.21 |
| Total Families | 697 (100.0%) | 2.99 |
Median Household Size in Wentworth
The median household size in Wentworth is 2.51 persons per household, with single female/mother households (99 | 10.5%) accounting for the largest median household size of 3.41 persons per household. non-family households (245 | 26.0%) represent the smallest median household size with 1.06 persons per household.
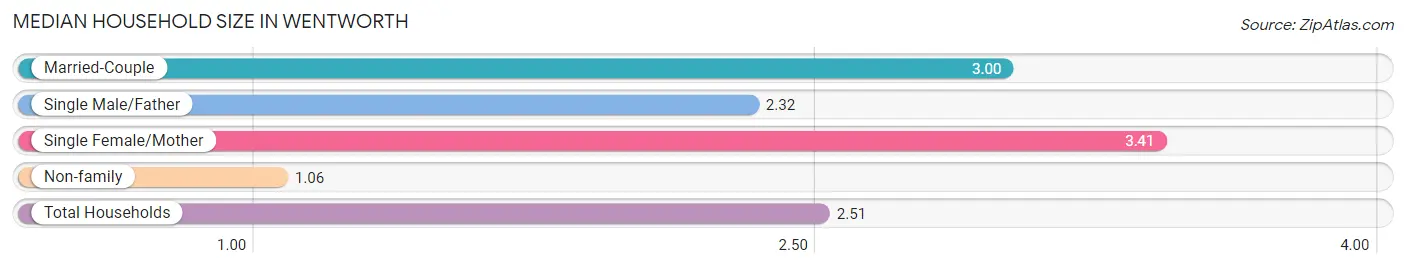
| Household Type | # Households | Household Size |
| Married-Couple | 564 (59.9%) | 3.00 |
| Single Male/Father | 34 (3.6%) | 2.32 |
| Single Female/Mother | 99 (10.5%) | 3.41 |
| Non-family | 245 (26.0%) | 1.06 |
| Total Households | 942 (100.0%) | 2.51 |
Household Size by Marriage Status in Wentworth
Out of a total of 942 households in Wentworth, 697 (74.0%) are family households, while 245 (26.0%) are nonfamily households. The most numerous type of family households are 2-person households, comprising 297, and the most common type of nonfamily households are 1-person households, comprising 229.
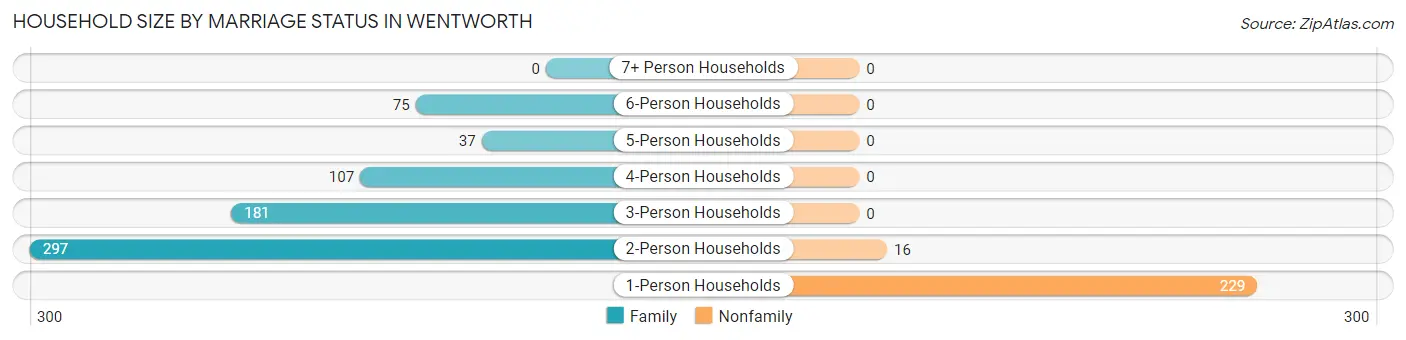
| Household Size | Family Households | Nonfamily Households |
| 1-Person Households | - | 229 (24.3%) |
| 2-Person Households | 297 (31.5%) | 16 (1.7%) |
| 3-Person Households | 181 (19.2%) | 0 (0.0%) |
| 4-Person Households | 107 (11.4%) | 0 (0.0%) |
| 5-Person Households | 37 (3.9%) | 0 (0.0%) |
| 6-Person Households | 75 (8.0%) | 0 (0.0%) |
| 7+ Person Households | 0 (0.0%) | 0 (0.0%) |
| Total | 697 (74.0%) | 245 (26.0%) |
Female Fertility in Wentworth
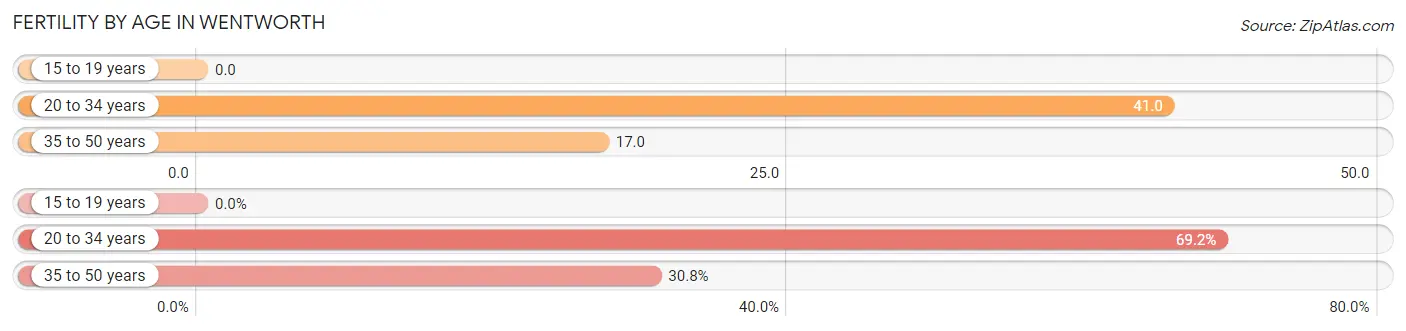
Fertility by Age in Wentworth
Average fertility rate in Wentworth is 20.0 births per 1,000 women. Women in the age bracket of 20 to 34 years have the highest fertility rate with 41.0 births per 1,000 women. Women in the age bracket of 20 to 34 years acount for 69.2% of all women with births.
| Age Bracket | Women with Births | Births / 1,000 Women |
| 15 to 19 years | 0 (0.0%) | 0.0 |
| 20 to 34 years | 9 (69.2%) | 41.0 |
| 35 to 50 years | 4 (30.8%) | 17.0 |
| Total | 13 (100.0%) | 20.0 |
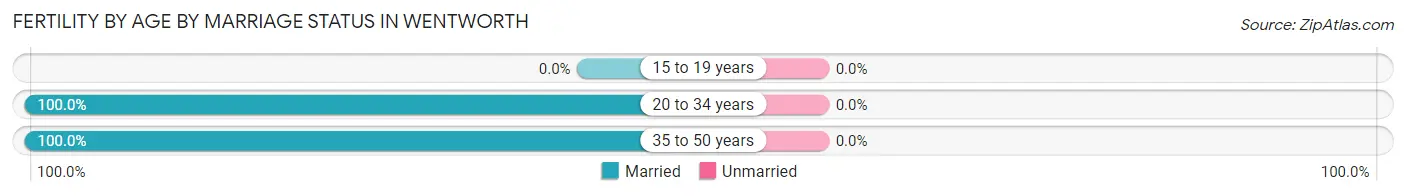
Fertility by Age by Marriage Status in Wentworth
| Age Bracket | Married | Unmarried |
| 15 to 19 years | 0 (0.0%) | 0 (0.0%) |
| 20 to 34 years | 9 (100.0%) | 0 (0.0%) |
| 35 to 50 years | 4 (100.0%) | 0 (0.0%) |
| Total | 13 (100.0%) | 0 (0.0%) |
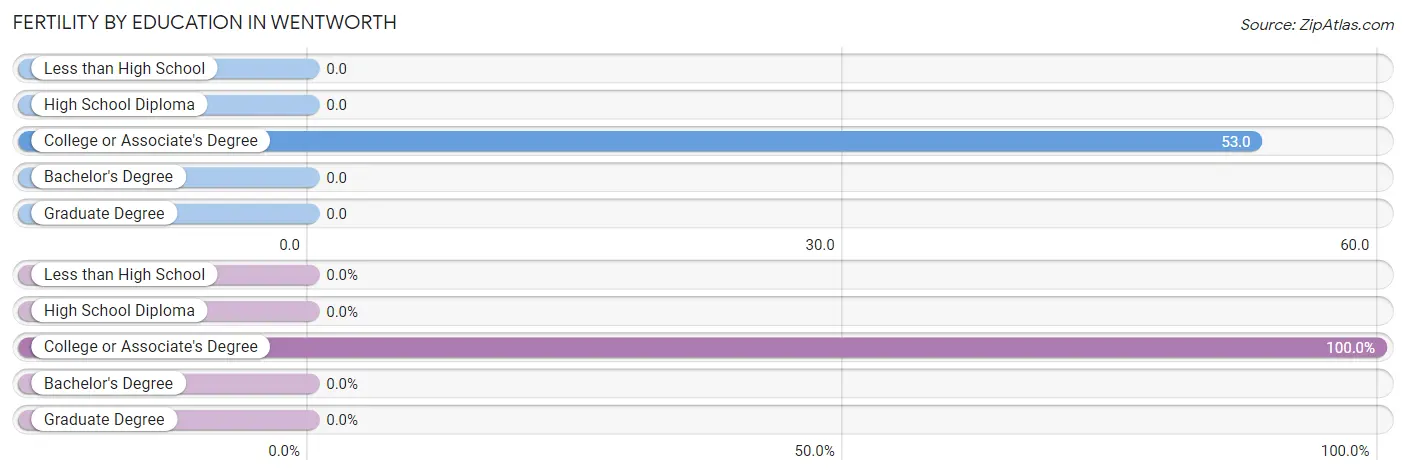
Fertility by Education in Wentworth
| Educational Attainment | Women with Births | Births / 1,000 Women |
| Less than High School | 0 (0.0%) | 0.0 |
| High School Diploma | 0 (0.0%) | 0.0 |
| College or Associate's Degree | 13 (100.0%) | 53.0 |
| Bachelor's Degree | 0 (0.0%) | 0.0 |
| Graduate Degree | 0 (0.0%) | 0.0 |
| Total | 13 (100.0%) | 20.0 |
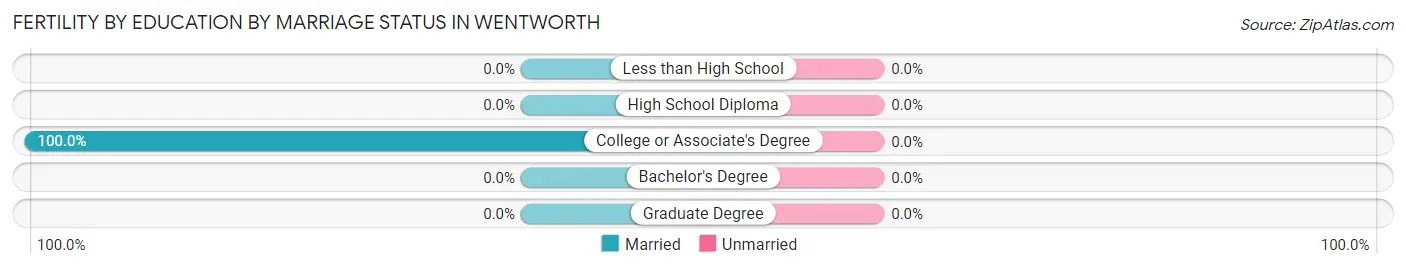
Fertility by Education by Marriage Status in Wentworth
| Educational Attainment | Married | Unmarried |
| Less than High School | 0 (0.0%) | 0 (0.0%) |
| High School Diploma | 0 (0.0%) | 0 (0.0%) |
| College or Associate's Degree | 13 (100.0%) | 0 (0.0%) |
| Bachelor's Degree | 0 (0.0%) | 0 (0.0%) |
| Graduate Degree | 0 (0.0%) | 0 (0.0%) |
| Total | 13 (100.0%) | 0 (0.0%) |
Employment Characteristics in Wentworth
Employment by Class of Employer in Wentworth
Among the 990 employed individuals in Wentworth, private company employees (722 | 72.9%), local government employees (95 | 9.6%), and state government employees (87 | 8.8%) make up the most common classes of employment.
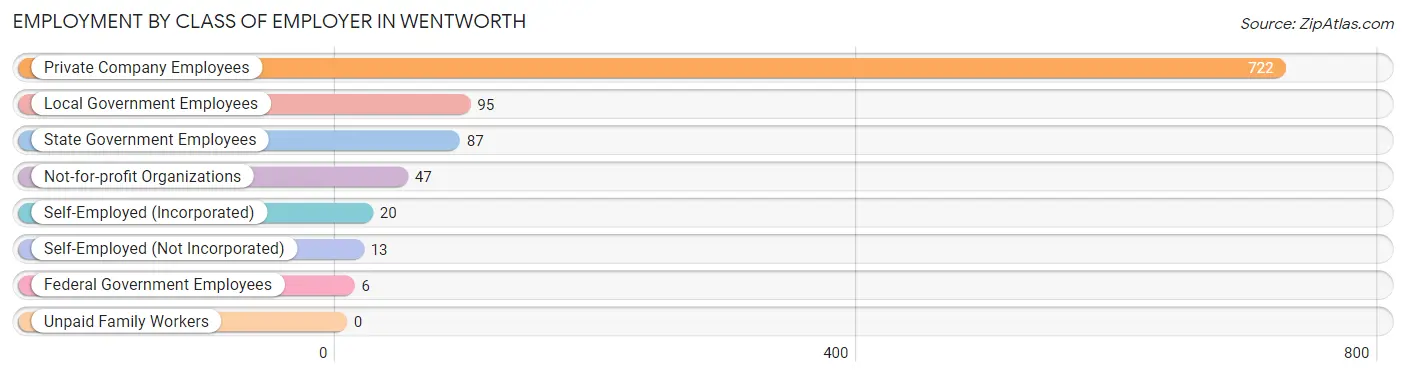
| Employer Class | # Employees | % Employees |
| Private Company Employees | 722 | 72.9% |
| Self-Employed (Incorporated) | 20 | 2.0% |
| Self-Employed (Not Incorporated) | 13 | 1.3% |
| Not-for-profit Organizations | 47 | 4.8% |
| Local Government Employees | 95 | 9.6% |
| State Government Employees | 87 | 8.8% |
| Federal Government Employees | 6 | 0.6% |
| Unpaid Family Workers | 0 | 0.0% |
| Total | 990 | 100.0% |
Employment Status by Age in Wentworth
According to the labor force statistics for Wentworth, out of the total population over 16 years of age (2,228), 48.3% or 1,076 individuals are in the labor force, with 5.2% or 56 of them unemployed. The age group with the highest labor force participation rate is 45 to 54 years, with 88.6% or 358 individuals in the labor force. Within the labor force, the 16 to 19 years age range has the highest percentage of unemployed individuals, with 31.7% or 19 of them being unemployed.
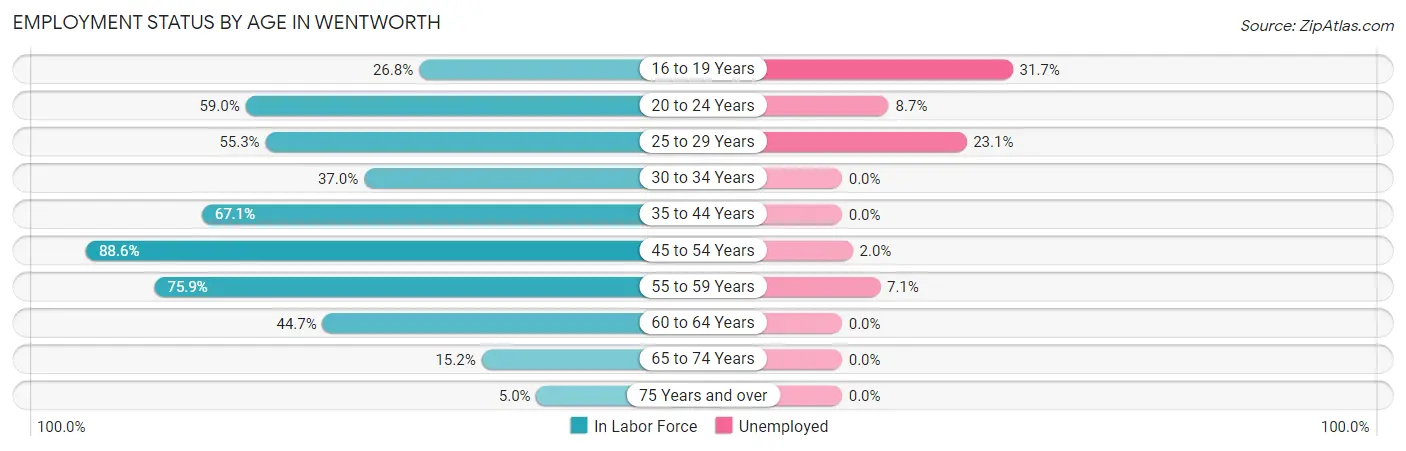
| Age Bracket | In Labor Force | Unemployed |
| 16 to 19 Years | 60 (26.8%) | 19 (31.7%) |
| 20 to 24 Years | 69 (59.0%) | 6 (8.7%) |
| 25 to 29 Years | 78 (55.3%) | 18 (23.1%) |
| 30 to 34 Years | 78 (37.0%) | 0 (0.0%) |
| 35 to 44 Years | 198 (67.1%) | 0 (0.0%) |
| 45 to 54 Years | 358 (88.6%) | 7 (2.0%) |
| 55 to 59 Years | 85 (75.9%) | 6 (7.1%) |
| 60 to 64 Years | 88 (44.7%) | 0 (0.0%) |
| 65 to 74 Years | 53 (15.2%) | 0 (0.0%) |
| 75 Years and over | 9 (5.0%) | 0 (0.0%) |
| Total | 1,076 (48.3%) | 56 (5.2%) |
Employment Status by Educational Attainment in Wentworth
According to labor force statistics for Wentworth, 65.1% of individuals (885) out of the total population between 25 and 64 years of age (1,360) are in the labor force, with 3.5% or 31 of them being unemployed. The group with the highest labor force participation rate are those with the educational attainment of bachelor's degree or higher, with 79.5% or 198 individuals in the labor force. Within the labor force, individuals with high school diploma education have the highest percentage of unemployment, with 7.1% or 18 of them being unemployed.
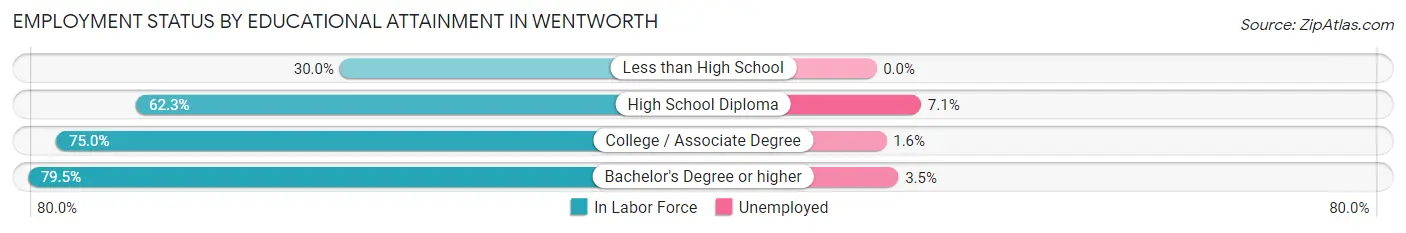
| Educational Attainment | In Labor Force | Unemployed |
| Less than High School | 63 (30.0%) | 0 (0.0%) |
| High School Diploma | 255 (62.3%) | 29 (7.1%) |
| College / Associate Degree | 369 (75.0%) | 8 (1.6%) |
| Bachelor's Degree or higher | 198 (79.5%) | 9 (3.5%) |
| Total | 885 (65.1%) | 48 (3.5%) |
Employment Occupations by Sex in Wentworth
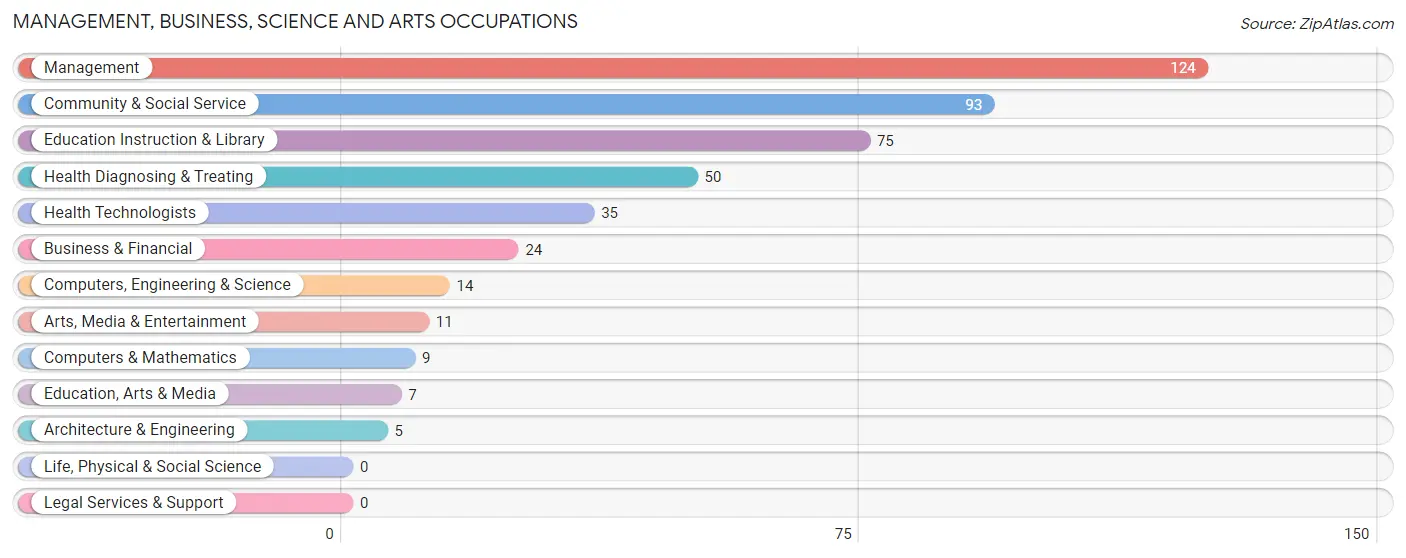
Management, Business, Science and Arts Occupations
The most common Management, Business, Science and Arts occupations in Wentworth are Management (124 | 12.2%), Community & Social Service (93 | 9.1%), Education Instruction & Library (75 | 7.3%), Health Diagnosing & Treating (50 | 4.9%), and Health Technologists (35 | 3.4%).
Management, Business, Science and Arts Occupations by Sex
Within the Management, Business, Science and Arts occupations in Wentworth, the most male-oriented occupations are Architecture & Engineering (100.0%), Arts, Media & Entertainment (63.6%), and Business & Financial (54.2%), while the most female-oriented occupations are Computers & Mathematics (100.0%), Health Diagnosing & Treating (100.0%), and Health Technologists (100.0%).
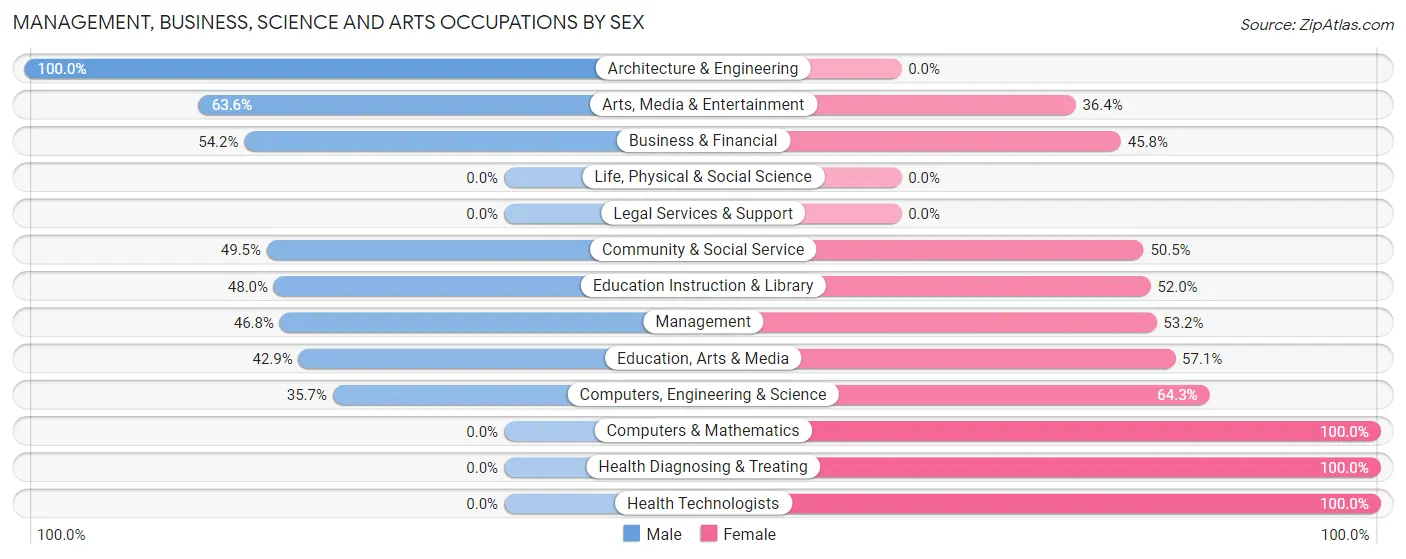
| Occupation | Male | Female |
| Management | 58 (46.8%) | 66 (53.2%) |
| Business & Financial | 13 (54.2%) | 11 (45.8%) |
| Computers, Engineering & Science | 5 (35.7%) | 9 (64.3%) |
| Computers & Mathematics | 0 (0.0%) | 9 (100.0%) |
| Architecture & Engineering | 5 (100.0%) | 0 (0.0%) |
| Life, Physical & Social Science | 0 (0.0%) | 0 (0.0%) |
| Community & Social Service | 46 (49.5%) | 47 (50.5%) |
| Education, Arts & Media | 3 (42.9%) | 4 (57.1%) |
| Legal Services & Support | 0 (0.0%) | 0 (0.0%) |
| Education Instruction & Library | 36 (48.0%) | 39 (52.0%) |
| Arts, Media & Entertainment | 7 (63.6%) | 4 (36.4%) |
| Health Diagnosing & Treating | 0 (0.0%) | 50 (100.0%) |
| Health Technologists | 0 (0.0%) | 35 (100.0%) |
| Total (Category) | 122 (40.0%) | 183 (60.0%) |
| Total (Overall) | 548 (53.7%) | 472 (46.3%) |
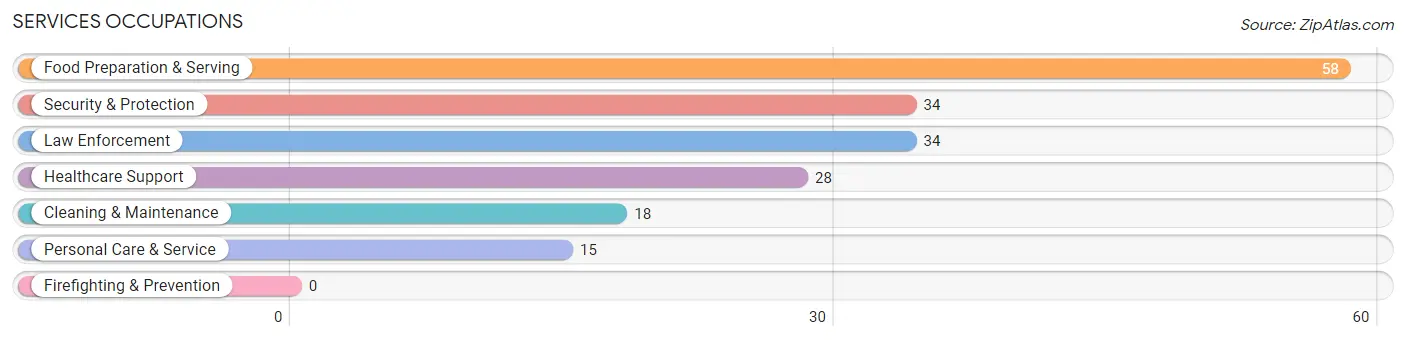
Services Occupations
The most common Services occupations in Wentworth are Food Preparation & Serving (58 | 5.7%), Security & Protection (34 | 3.3%), Law Enforcement (34 | 3.3%), Healthcare Support (28 | 2.8%), and Cleaning & Maintenance (18 | 1.8%).
Services Occupations by Sex
Within the Services occupations in Wentworth, the most male-oriented occupations are Cleaning & Maintenance (72.2%), Security & Protection (50.0%), and Law Enforcement (50.0%), while the most female-oriented occupations are Healthcare Support (100.0%), Personal Care & Service (80.0%), and Food Preparation & Serving (79.3%).
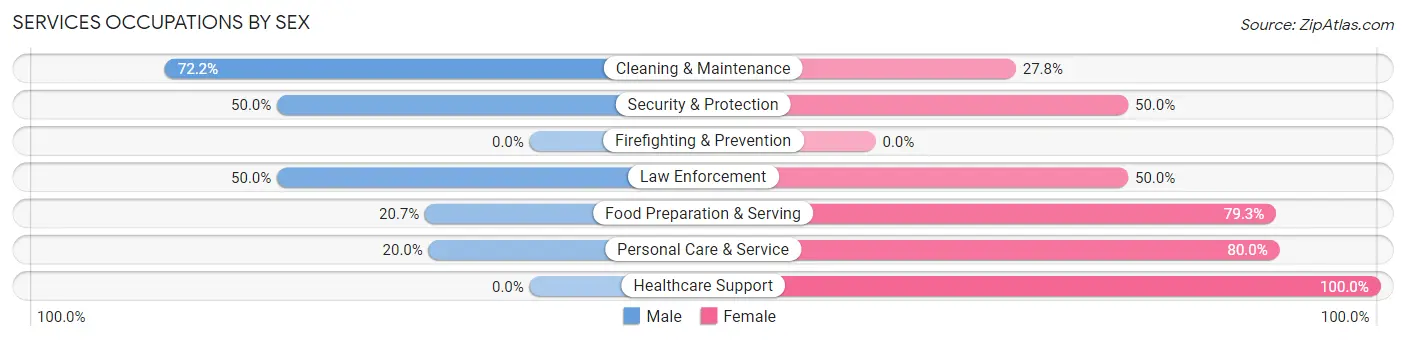
| Occupation | Male | Female |
| Healthcare Support | 0 (0.0%) | 28 (100.0%) |
| Security & Protection | 17 (50.0%) | 17 (50.0%) |
| Firefighting & Prevention | 0 (0.0%) | 0 (0.0%) |
| Law Enforcement | 17 (50.0%) | 17 (50.0%) |
| Food Preparation & Serving | 12 (20.7%) | 46 (79.3%) |
| Cleaning & Maintenance | 13 (72.2%) | 5 (27.8%) |
| Personal Care & Service | 3 (20.0%) | 12 (80.0%) |
| Total (Category) | 45 (29.4%) | 108 (70.6%) |
| Total (Overall) | 548 (53.7%) | 472 (46.3%) |
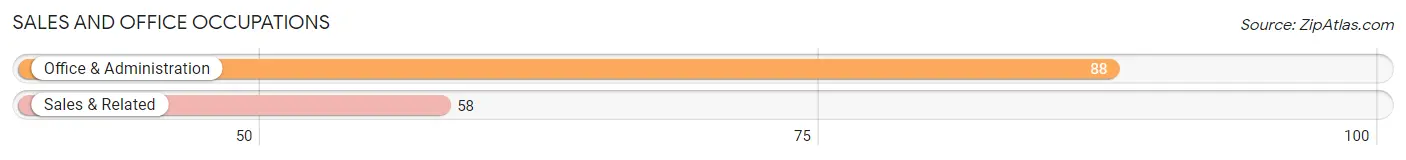
Sales and Office Occupations
The most common Sales and Office occupations in Wentworth are Office & Administration (88 | 8.6%), and Sales & Related (58 | 5.7%).
Sales and Office Occupations by Sex
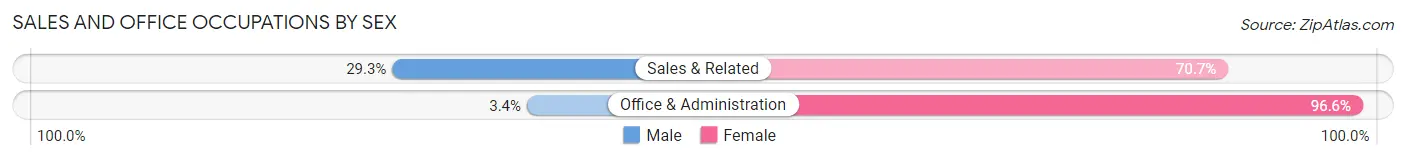
| Occupation | Male | Female |
| Sales & Related | 17 (29.3%) | 41 (70.7%) |
| Office & Administration | 3 (3.4%) | 85 (96.6%) |
| Total (Category) | 20 (13.7%) | 126 (86.3%) |
| Total (Overall) | 548 (53.7%) | 472 (46.3%) |
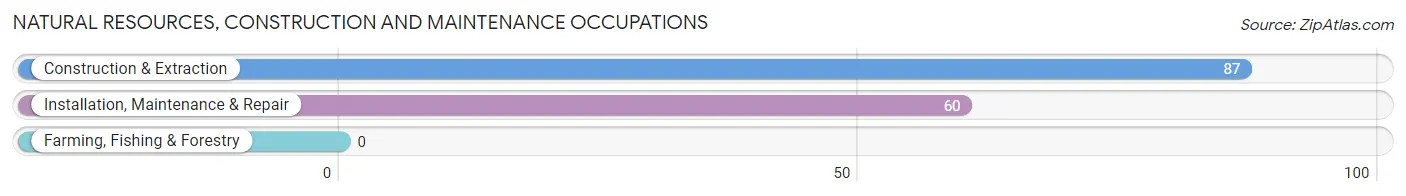
Natural Resources, Construction and Maintenance Occupations
The most common Natural Resources, Construction and Maintenance occupations in Wentworth are Construction & Extraction (87 | 8.5%), and Installation, Maintenance & Repair (60 | 5.9%).
Natural Resources, Construction and Maintenance Occupations by Sex
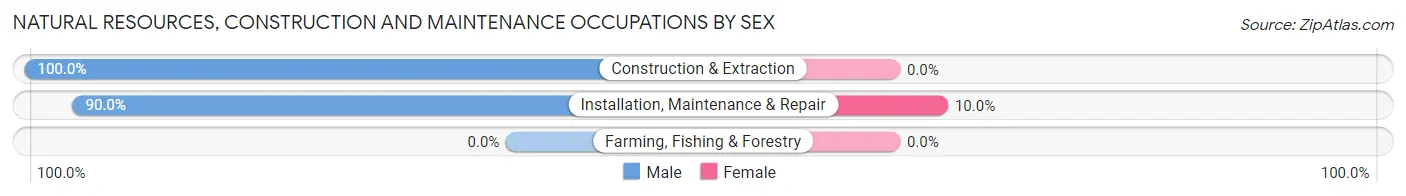
| Occupation | Male | Female |
| Farming, Fishing & Forestry | 0 (0.0%) | 0 (0.0%) |
| Construction & Extraction | 87 (100.0%) | 0 (0.0%) |
| Installation, Maintenance & Repair | 54 (90.0%) | 6 (10.0%) |
| Total (Category) | 141 (95.9%) | 6 (4.1%) |
| Total (Overall) | 548 (53.7%) | 472 (46.3%) |
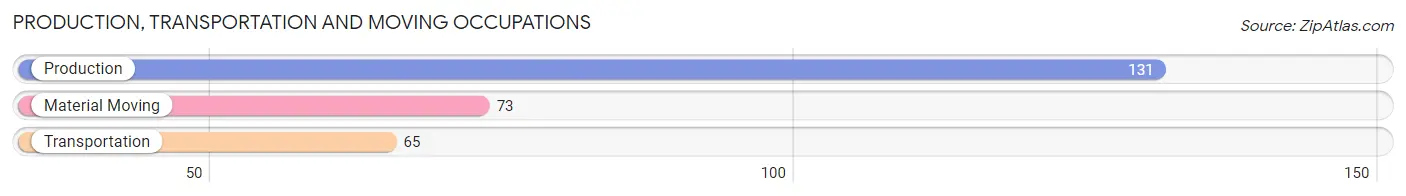
Production, Transportation and Moving Occupations
The most common Production, Transportation and Moving occupations in Wentworth are Production (131 | 12.8%), Material Moving (73 | 7.2%), and Transportation (65 | 6.4%).
Production, Transportation and Moving Occupations by Sex
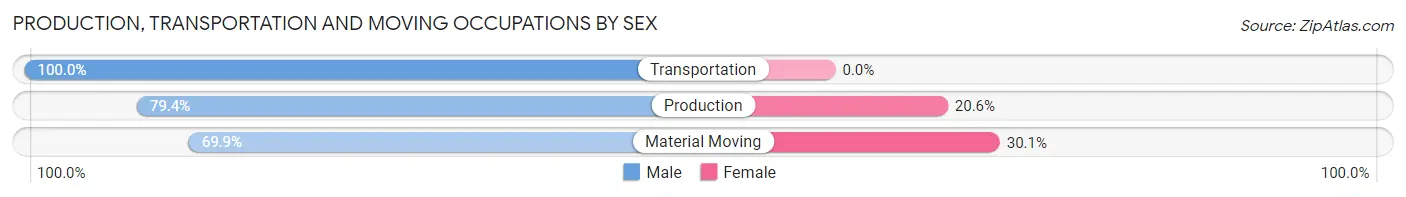
| Occupation | Male | Female |
| Production | 104 (79.4%) | 27 (20.6%) |
| Transportation | 65 (100.0%) | 0 (0.0%) |
| Material Moving | 51 (69.9%) | 22 (30.1%) |
| Total (Category) | 220 (81.8%) | 49 (18.2%) |
| Total (Overall) | 548 (53.7%) | 472 (46.3%) |
Employment Industries by Sex in Wentworth
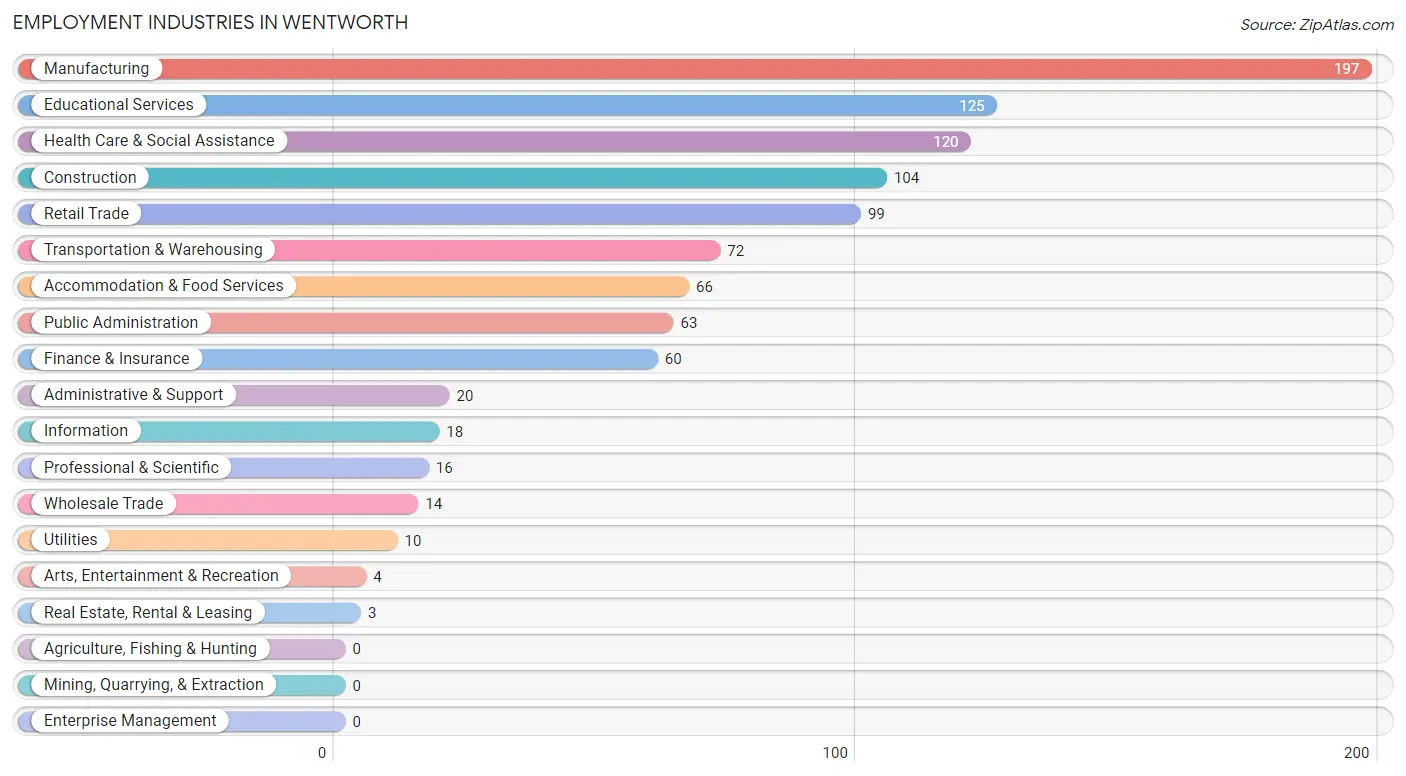
Employment Industries in Wentworth
The major employment industries in Wentworth include Manufacturing (197 | 19.3%), Educational Services (125 | 12.2%), Health Care & Social Assistance (120 | 11.8%), Construction (104 | 10.2%), and Retail Trade (99 | 9.7%).
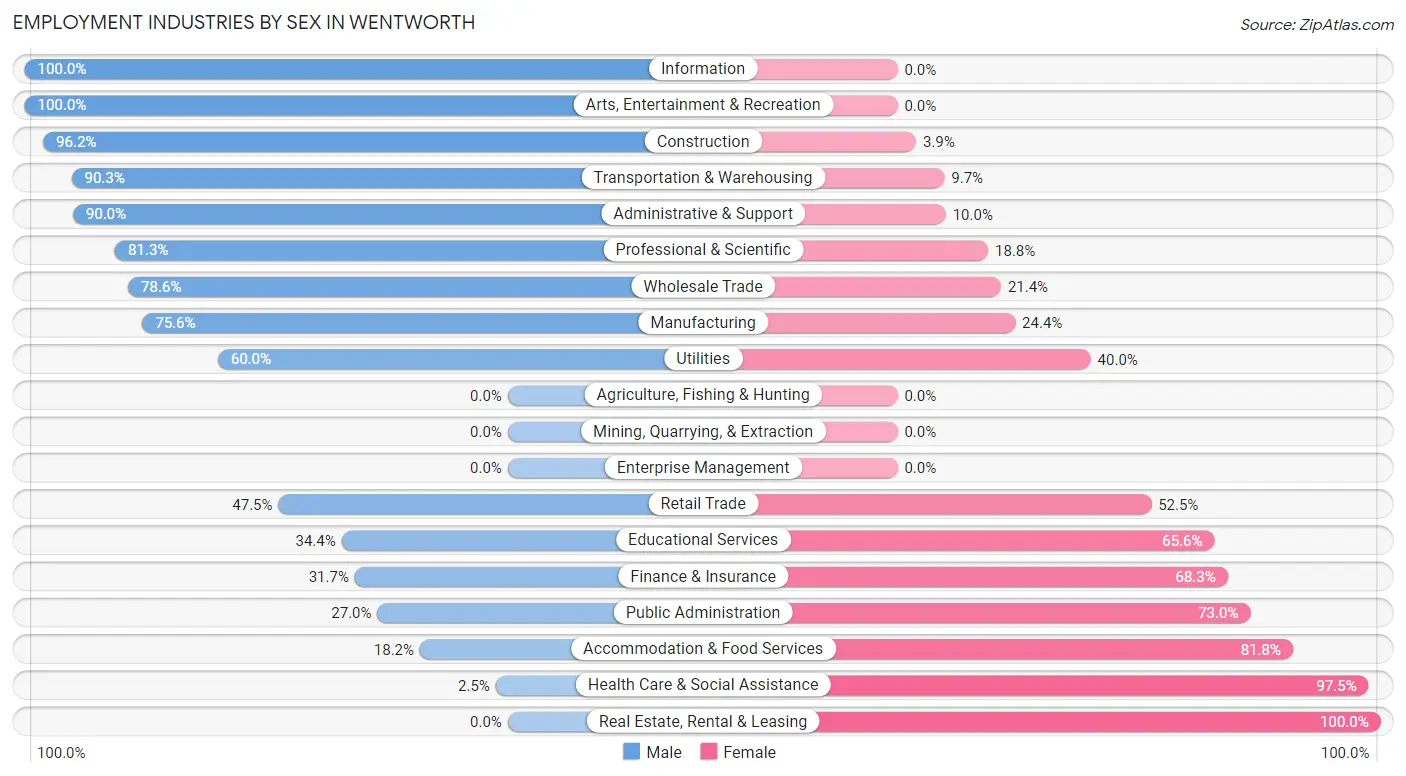
Employment Industries by Sex in Wentworth
The Wentworth industries that see more men than women are Information (100.0%), Arts, Entertainment & Recreation (100.0%), and Construction (96.2%), whereas the industries that tend to have a higher number of women are Real Estate, Rental & Leasing (100.0%), Health Care & Social Assistance (97.5%), and Accommodation & Food Services (81.8%).
| Industry | Male | Female |
| Agriculture, Fishing & Hunting | 0 (0.0%) | 0 (0.0%) |
| Mining, Quarrying, & Extraction | 0 (0.0%) | 0 (0.0%) |
| Construction | 100 (96.2%) | 4 (3.8%) |
| Manufacturing | 149 (75.6%) | 48 (24.4%) |
| Wholesale Trade | 11 (78.6%) | 3 (21.4%) |
| Retail Trade | 47 (47.5%) | 52 (52.5%) |
| Transportation & Warehousing | 65 (90.3%) | 7 (9.7%) |
| Utilities | 6 (60.0%) | 4 (40.0%) |
| Information | 18 (100.0%) | 0 (0.0%) |
| Finance & Insurance | 19 (31.7%) | 41 (68.3%) |
| Real Estate, Rental & Leasing | 0 (0.0%) | 3 (100.0%) |
| Professional & Scientific | 13 (81.2%) | 3 (18.8%) |
| Enterprise Management | 0 (0.0%) | 0 (0.0%) |
| Administrative & Support | 18 (90.0%) | 2 (10.0%) |
| Educational Services | 43 (34.4%) | 82 (65.6%) |
| Health Care & Social Assistance | 3 (2.5%) | 117 (97.5%) |
| Arts, Entertainment & Recreation | 4 (100.0%) | 0 (0.0%) |
| Accommodation & Food Services | 12 (18.2%) | 54 (81.8%) |
| Public Administration | 17 (27.0%) | 46 (73.0%) |
| Total | 548 (53.7%) | 472 (46.3%) |
Education in Wentworth
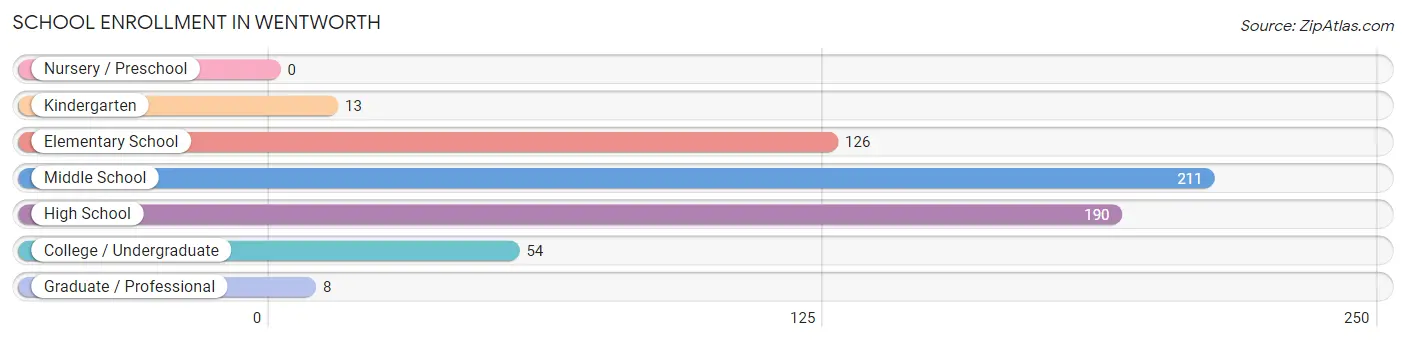
School Enrollment in Wentworth
The most common levels of schooling among the 602 students in Wentworth are middle school (211 | 35.0%), high school (190 | 31.6%), and elementary school (126 | 20.9%).
| School Level | # Students | % Students |
| Nursery / Preschool | 0 | 0.0% |
| Kindergarten | 13 | 2.2% |
| Elementary School | 126 | 20.9% |
| Middle School | 211 | 35.0% |
| High School | 190 | 31.6% |
| College / Undergraduate | 54 | 9.0% |
| Graduate / Professional | 8 | 1.3% |
| Total | 602 | 100.0% |
School Enrollment by Age by Funding Source in Wentworth
Out of a total of 602 students who are enrolled in schools in Wentworth, 78 (13.0%) attend a private institution, while the remaining 524 (87.0%) are enrolled in public schools. The age group of 25 to 34 year olds has the highest likelihood of being enrolled in private schools, with 8 (57.1% in the age bracket) enrolled. Conversely, the age group of 18 to 19 year olds has the lowest likelihood of being enrolled in a private school, with 56 (100.0% in the age bracket) attending a public institution.
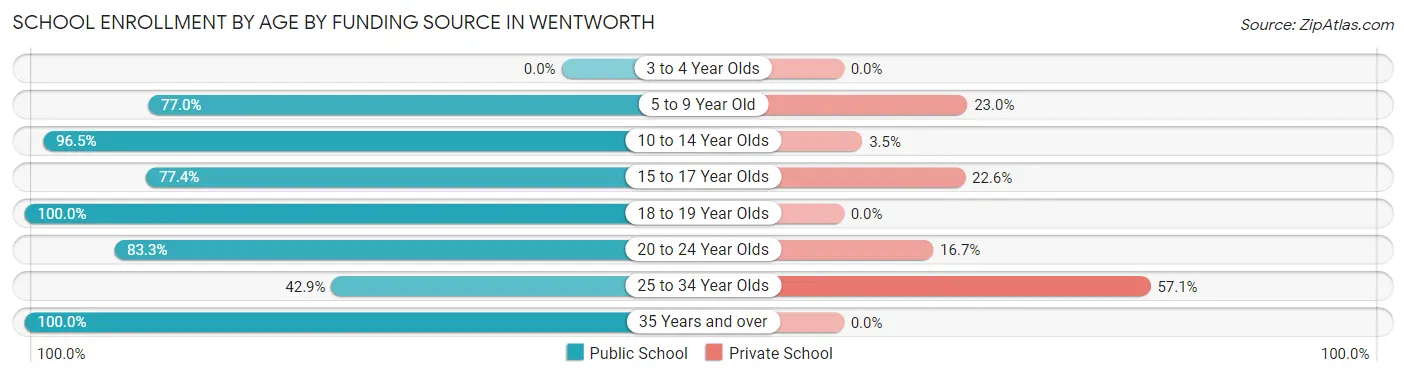
| Age Bracket | Public School | Private School |
| 3 to 4 Year Olds | 0 (0.0%) | 0 (0.0%) |
| 5 to 9 Year Old | 107 (77.0%) | 32 (23.0%) |
| 10 to 14 Year Olds | 223 (96.5%) | 8 (3.5%) |
| 15 to 17 Year Olds | 89 (77.4%) | 26 (22.6%) |
| 18 to 19 Year Olds | 56 (100.0%) | 0 (0.0%) |
| 20 to 24 Year Olds | 20 (83.3%) | 4 (16.7%) |
| 25 to 34 Year Olds | 6 (42.9%) | 8 (57.1%) |
| 35 Years and over | 23 (100.0%) | 0 (0.0%) |
| Total | 524 (87.0%) | 78 (13.0%) |
Educational Attainment by Field of Study in Wentworth
Education (114 | 31.9%), business (80 | 22.4%), social sciences (30 | 8.4%), science & technology (28 | 7.8%), and engineering (24 | 6.7%) are the most common fields of study among 357 individuals in Wentworth who have obtained a bachelor's degree or higher.
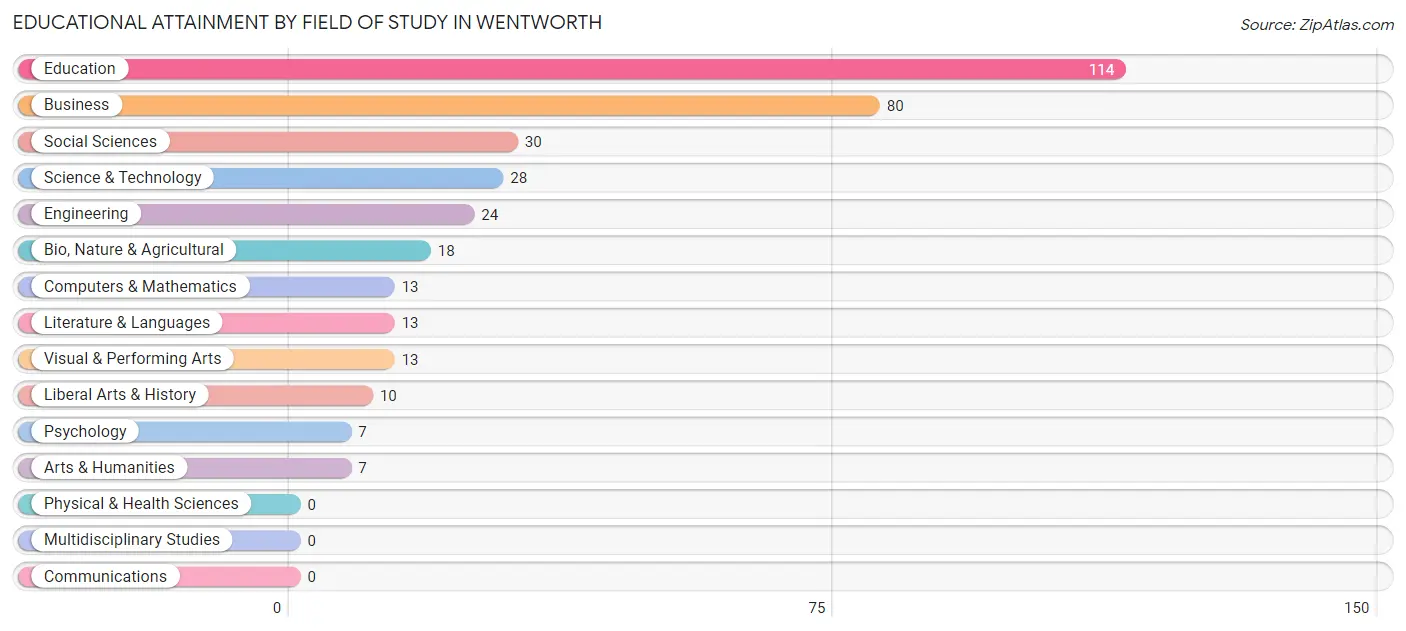
| Field of Study | # Graduates | % Graduates |
| Computers & Mathematics | 13 | 3.6% |
| Bio, Nature & Agricultural | 18 | 5.0% |
| Physical & Health Sciences | 0 | 0.0% |
| Psychology | 7 | 2.0% |
| Social Sciences | 30 | 8.4% |
| Engineering | 24 | 6.7% |
| Multidisciplinary Studies | 0 | 0.0% |
| Science & Technology | 28 | 7.8% |
| Business | 80 | 22.4% |
| Education | 114 | 31.9% |
| Literature & Languages | 13 | 3.6% |
| Liberal Arts & History | 10 | 2.8% |
| Visual & Performing Arts | 13 | 3.6% |
| Communications | 0 | 0.0% |
| Arts & Humanities | 7 | 2.0% |
| Total | 357 | 100.0% |
Transportation & Commute in Wentworth
Vehicle Availability by Sex in Wentworth
The most prevalent vehicle ownership categories in Wentworth are males with 3 vehicles (207, accounting for 39.9%) and females with 3 vehicles (210, making up 44.5%).
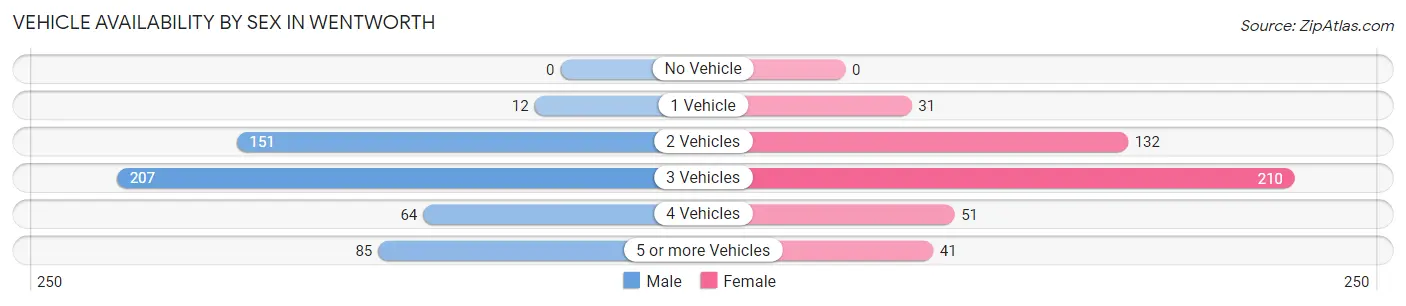
| Vehicles Available | Male | Female |
| No Vehicle | 0 (0.0%) | 0 (0.0%) |
| 1 Vehicle | 12 (2.3%) | 31 (6.7%) |
| 2 Vehicles | 151 (29.1%) | 132 (28.4%) |
| 3 Vehicles | 207 (39.9%) | 210 (45.2%) |
| 4 Vehicles | 64 (12.3%) | 51 (11.0%) |
| 5 or more Vehicles | 85 (16.4%) | 41 (8.8%) |
| Total | 519 (100.0%) | 465 (100.0%) |
Commute Time in Wentworth
The most frequently occuring commute durations in Wentworth are 10 to 14 minutes (232 commuters, 24.2%), 45 to 59 minutes (130 commuters, 13.6%), and 30 to 34 minutes (117 commuters, 12.2%).
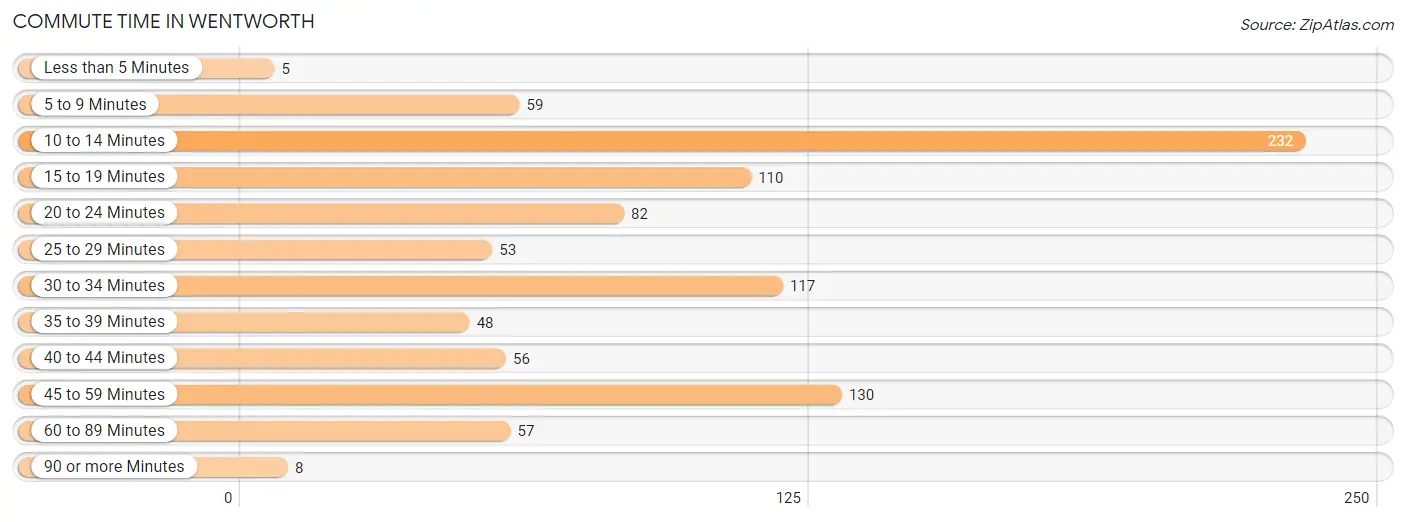
| Commute Time | # Commuters | % Commuters |
| Less than 5 Minutes | 5 | 0.5% |
| 5 to 9 Minutes | 59 | 6.2% |
| 10 to 14 Minutes | 232 | 24.2% |
| 15 to 19 Minutes | 110 | 11.5% |
| 20 to 24 Minutes | 82 | 8.6% |
| 25 to 29 Minutes | 53 | 5.5% |
| 30 to 34 Minutes | 117 | 12.2% |
| 35 to 39 Minutes | 48 | 5.0% |
| 40 to 44 Minutes | 56 | 5.9% |
| 45 to 59 Minutes | 130 | 13.6% |
| 60 to 89 Minutes | 57 | 6.0% |
| 90 or more Minutes | 8 | 0.8% |
Commute Time by Sex in Wentworth
The most common commute times in Wentworth are 10 to 14 minutes (90 commuters, 17.7%) for males and 10 to 14 minutes (142 commuters, 31.6%) for females.
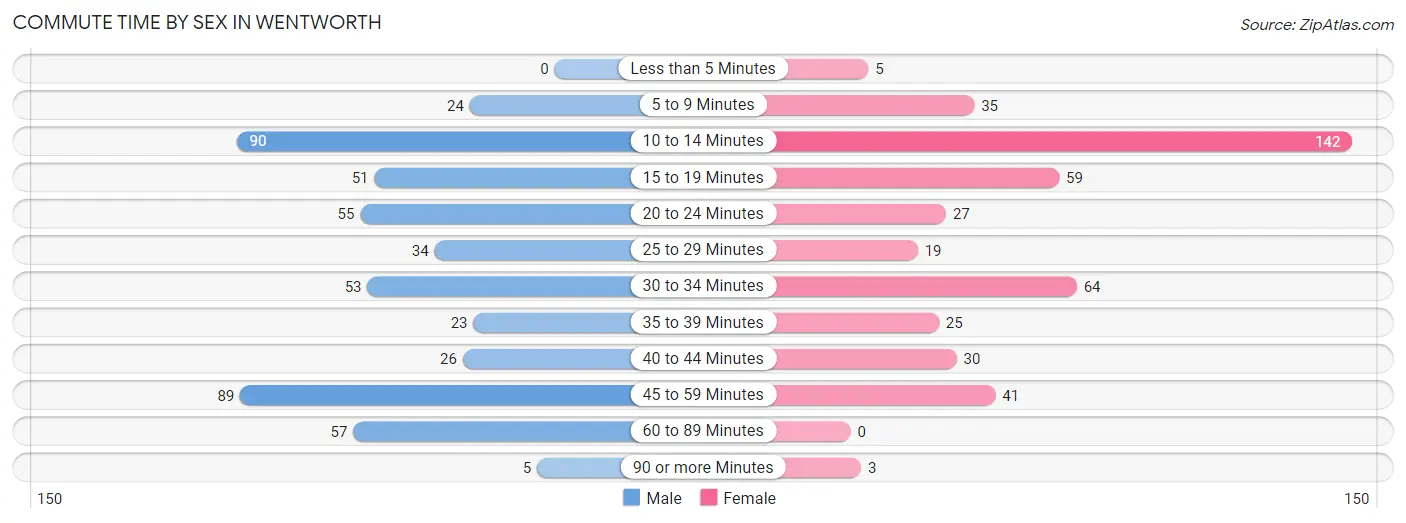
| Commute Time | Male | Female |
| Less than 5 Minutes | 0 (0.0%) | 5 (1.1%) |
| 5 to 9 Minutes | 24 (4.7%) | 35 (7.8%) |
| 10 to 14 Minutes | 90 (17.7%) | 142 (31.6%) |
| 15 to 19 Minutes | 51 (10.1%) | 59 (13.1%) |
| 20 to 24 Minutes | 55 (10.8%) | 27 (6.0%) |
| 25 to 29 Minutes | 34 (6.7%) | 19 (4.2%) |
| 30 to 34 Minutes | 53 (10.4%) | 64 (14.2%) |
| 35 to 39 Minutes | 23 (4.5%) | 25 (5.6%) |
| 40 to 44 Minutes | 26 (5.1%) | 30 (6.7%) |
| 45 to 59 Minutes | 89 (17.5%) | 41 (9.1%) |
| 60 to 89 Minutes | 57 (11.2%) | 0 (0.0%) |
| 90 or more Minutes | 5 (1.0%) | 3 (0.7%) |
Time of Departure to Work by Sex in Wentworth
The most frequent times of departure to work in Wentworth are 5:00 AM to 5:29 AM (77, 15.2%) for males and 7:00 AM to 7:29 AM (129, 28.7%) for females.
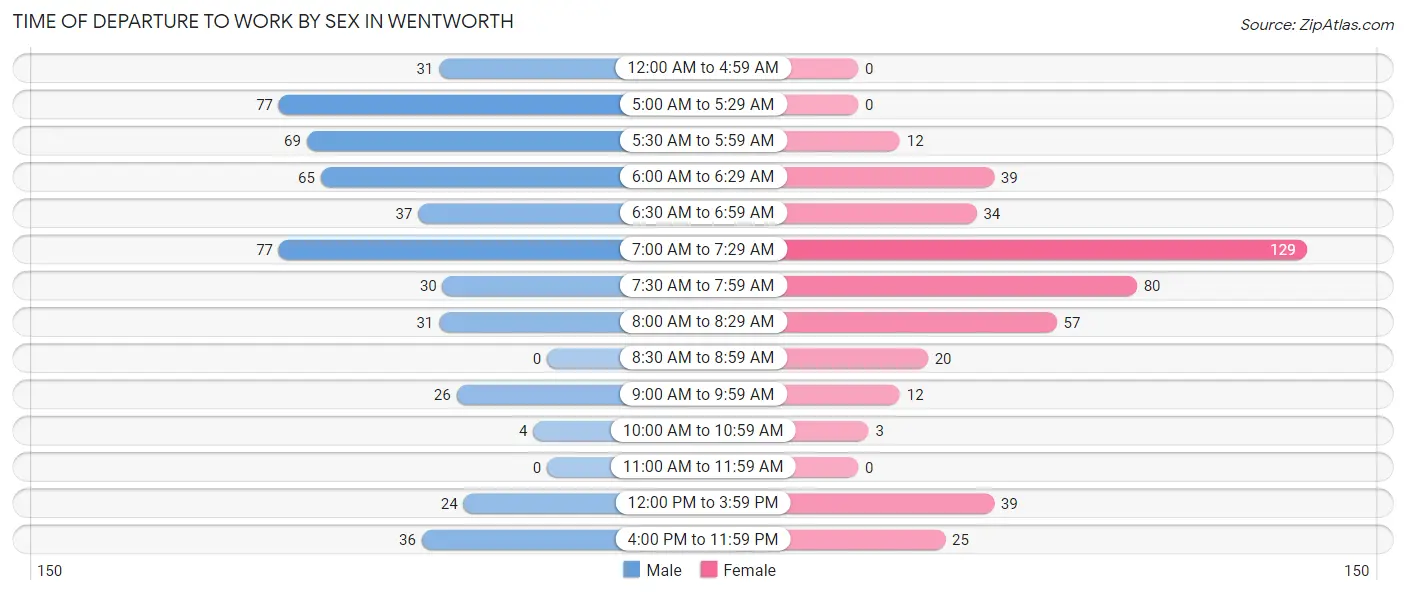
| Time of Departure | Male | Female |
| 12:00 AM to 4:59 AM | 31 (6.1%) | 0 (0.0%) |
| 5:00 AM to 5:29 AM | 77 (15.2%) | 0 (0.0%) |
| 5:30 AM to 5:59 AM | 69 (13.6%) | 12 (2.7%) |
| 6:00 AM to 6:29 AM | 65 (12.8%) | 39 (8.7%) |
| 6:30 AM to 6:59 AM | 37 (7.3%) | 34 (7.6%) |
| 7:00 AM to 7:29 AM | 77 (15.2%) | 129 (28.7%) |
| 7:30 AM to 7:59 AM | 30 (5.9%) | 80 (17.8%) |
| 8:00 AM to 8:29 AM | 31 (6.1%) | 57 (12.7%) |
| 8:30 AM to 8:59 AM | 0 (0.0%) | 20 (4.4%) |
| 9:00 AM to 9:59 AM | 26 (5.1%) | 12 (2.7%) |
| 10:00 AM to 10:59 AM | 4 (0.8%) | 3 (0.7%) |
| 11:00 AM to 11:59 AM | 0 (0.0%) | 0 (0.0%) |
| 12:00 PM to 3:59 PM | 24 (4.7%) | 39 (8.7%) |
| 4:00 PM to 11:59 PM | 36 (7.1%) | 25 (5.6%) |
| Total | 507 (100.0%) | 450 (100.0%) |
Housing Occupancy in Wentworth
Occupancy by Ownership in Wentworth
Of the total 942 dwellings in Wentworth, owner-occupied units account for 853 (90.5%), while renter-occupied units make up 89 (9.5%).
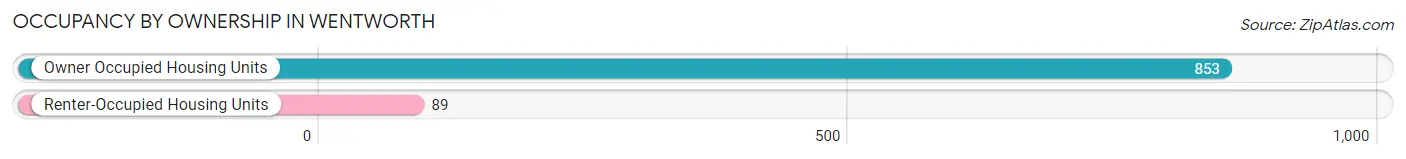
| Occupancy | # Housing Units | % Housing Units |
| Owner Occupied Housing Units | 853 | 90.5% |
| Renter-Occupied Housing Units | 89 | 9.5% |
| Total Occupied Housing Units | 942 | 100.0% |
Occupancy by Household Size in Wentworth
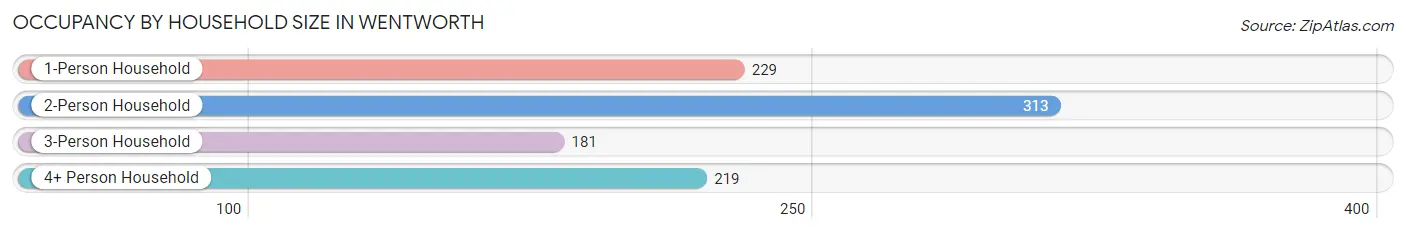
| Household Size | # Housing Units | % Housing Units |
| 1-Person Household | 229 | 24.3% |
| 2-Person Household | 313 | 33.2% |
| 3-Person Household | 181 | 19.2% |
| 4+ Person Household | 219 | 23.3% |
| Total Housing Units | 942 | 100.0% |
Occupancy by Ownership by Household Size in Wentworth
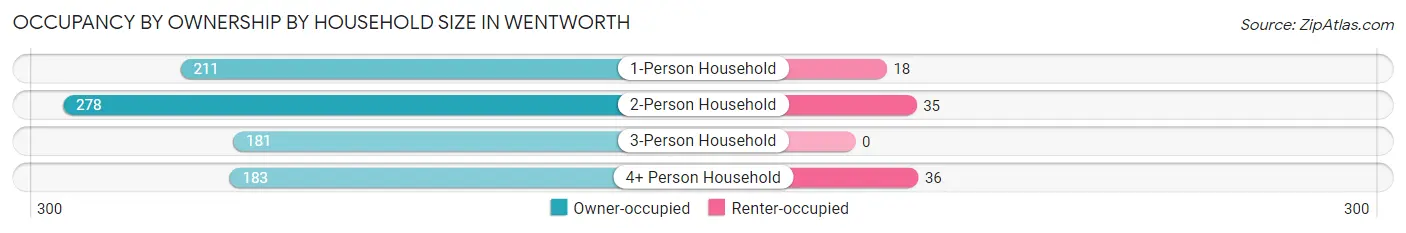
| Household Size | Owner-occupied | Renter-occupied |
| 1-Person Household | 211 (92.1%) | 18 (7.9%) |
| 2-Person Household | 278 (88.8%) | 35 (11.2%) |
| 3-Person Household | 181 (100.0%) | 0 (0.0%) |
| 4+ Person Household | 183 (83.6%) | 36 (16.4%) |
| Total Housing Units | 853 (90.5%) | 89 (9.5%) |
Occupancy by Educational Attainment in Wentworth
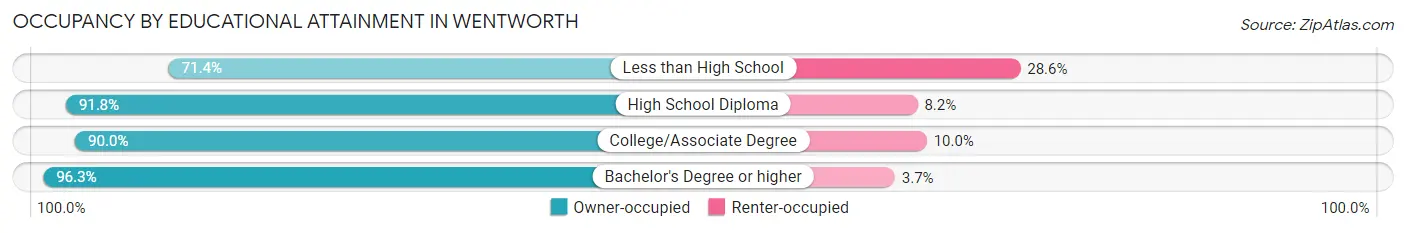
| Household Size | Owner-occupied | Renter-occupied |
| Less than High School | 45 (71.4%) | 18 (28.6%) |
| High School Diploma | 258 (91.8%) | 23 (8.2%) |
| College/Associate Degree | 368 (90.0%) | 41 (10.0%) |
| Bachelor's Degree or higher | 182 (96.3%) | 7 (3.7%) |
Occupancy by Age of Householder in Wentworth
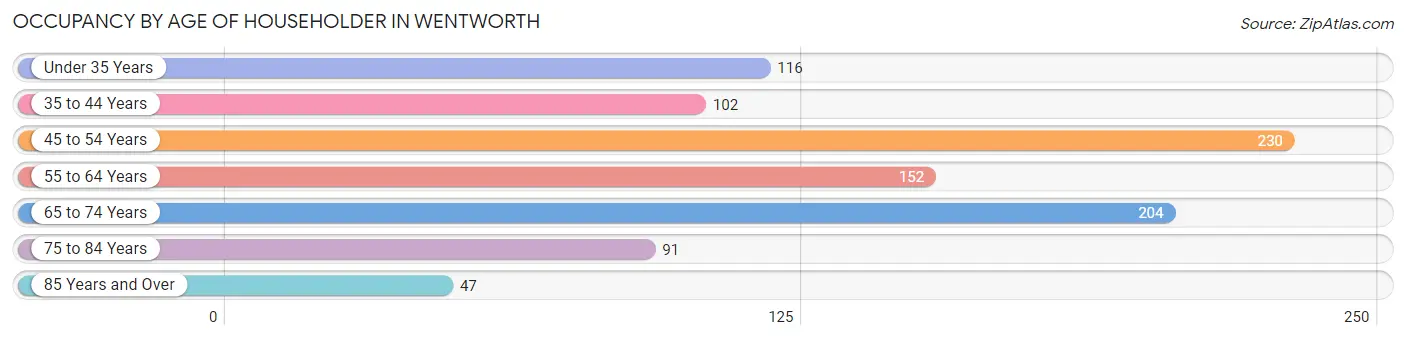
| Age Bracket | # Households | % Households |
| Under 35 Years | 116 | 12.3% |
| 35 to 44 Years | 102 | 10.8% |
| 45 to 54 Years | 230 | 24.4% |
| 55 to 64 Years | 152 | 16.1% |
| 65 to 74 Years | 204 | 21.7% |
| 75 to 84 Years | 91 | 9.7% |
| 85 Years and Over | 47 | 5.0% |
| Total | 942 | 100.0% |
Housing Finances in Wentworth
Median Income by Occupancy in Wentworth
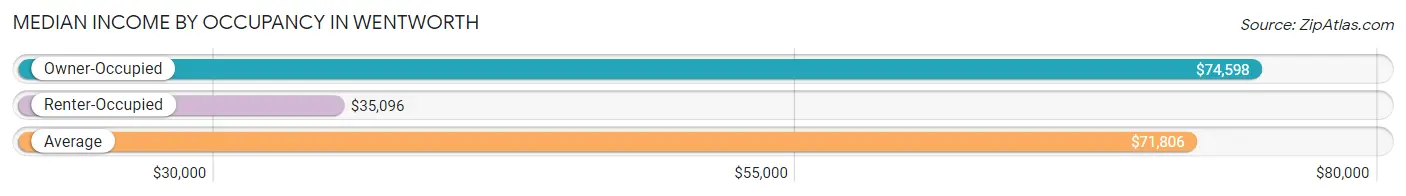
| Occupancy Type | # Households | Median Income |
| Owner-Occupied | 853 (90.5%) | $74,598 |
| Renter-Occupied | 89 (9.5%) | $35,096 |
| Average | 942 (100.0%) | $71,806 |
Occupancy by Householder Income Bracket in Wentworth
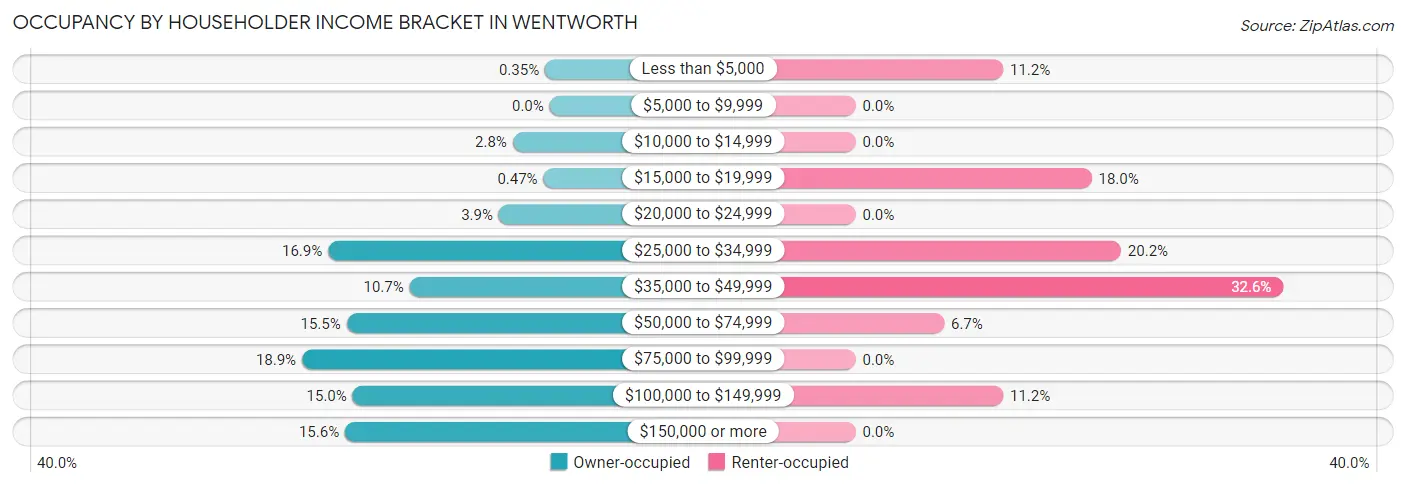
| Income Bracket | Owner-occupied | Renter-occupied |
| Less than $5,000 | 3 (0.4%) | 10 (11.2%) |
| $5,000 to $9,999 | 0 (0.0%) | 0 (0.0%) |
| $10,000 to $14,999 | 24 (2.8%) | 0 (0.0%) |
| $15,000 to $19,999 | 4 (0.5%) | 16 (18.0%) |
| $20,000 to $24,999 | 33 (3.9%) | 0 (0.0%) |
| $25,000 to $34,999 | 144 (16.9%) | 18 (20.2%) |
| $35,000 to $49,999 | 91 (10.7%) | 29 (32.6%) |
| $50,000 to $74,999 | 132 (15.5%) | 6 (6.7%) |
| $75,000 to $99,999 | 161 (18.9%) | 0 (0.0%) |
| $100,000 to $149,999 | 128 (15.0%) | 10 (11.2%) |
| $150,000 or more | 133 (15.6%) | 0 (0.0%) |
| Total | 853 (100.0%) | 89 (100.0%) |
Monthly Housing Cost Tiers in Wentworth
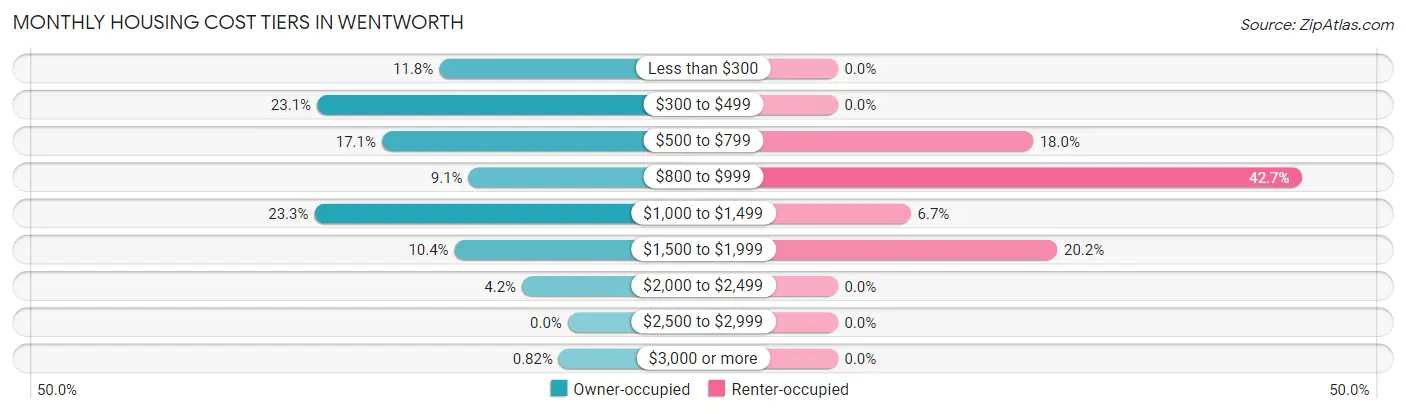
| Monthly Cost | Owner-occupied | Renter-occupied |
| Less than $300 | 101 (11.8%) | 0 (0.0%) |
| $300 to $499 | 197 (23.1%) | 0 (0.0%) |
| $500 to $799 | 146 (17.1%) | 16 (18.0%) |
| $800 to $999 | 78 (9.1%) | 38 (42.7%) |
| $1,000 to $1,499 | 199 (23.3%) | 6 (6.7%) |
| $1,500 to $1,999 | 89 (10.4%) | 18 (20.2%) |
| $2,000 to $2,499 | 36 (4.2%) | 0 (0.0%) |
| $2,500 to $2,999 | 0 (0.0%) | 0 (0.0%) |
| $3,000 or more | 7 (0.8%) | 0 (0.0%) |
| Total | 853 (100.0%) | 89 (100.0%) |
Physical Housing Characteristics in Wentworth
Housing Structures in Wentworth
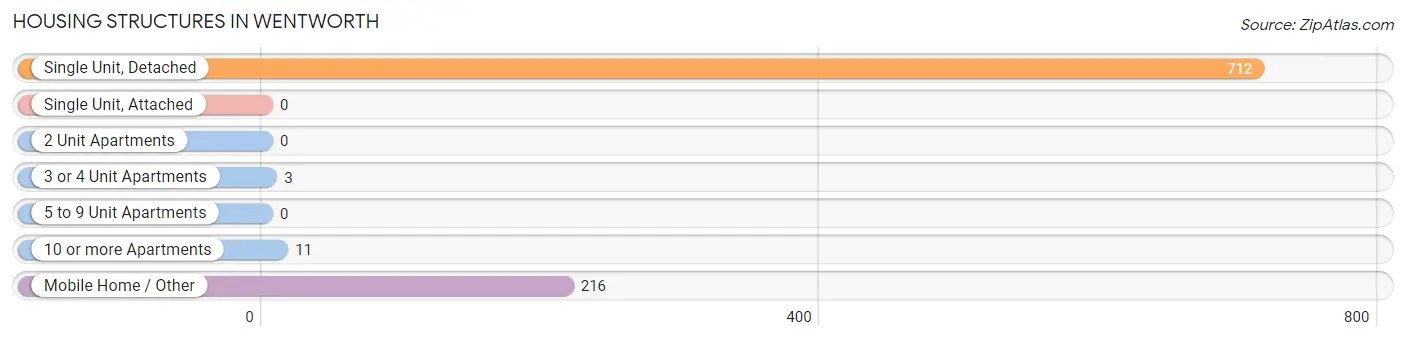
| Structure Type | # Housing Units | % Housing Units |
| Single Unit, Detached | 712 | 75.6% |
| Single Unit, Attached | 0 | 0.0% |
| 2 Unit Apartments | 0 | 0.0% |
| 3 or 4 Unit Apartments | 3 | 0.3% |
| 5 to 9 Unit Apartments | 0 | 0.0% |
| 10 or more Apartments | 11 | 1.2% |
| Mobile Home / Other | 216 | 22.9% |
| Total | 942 | 100.0% |
Housing Structures by Occupancy in Wentworth
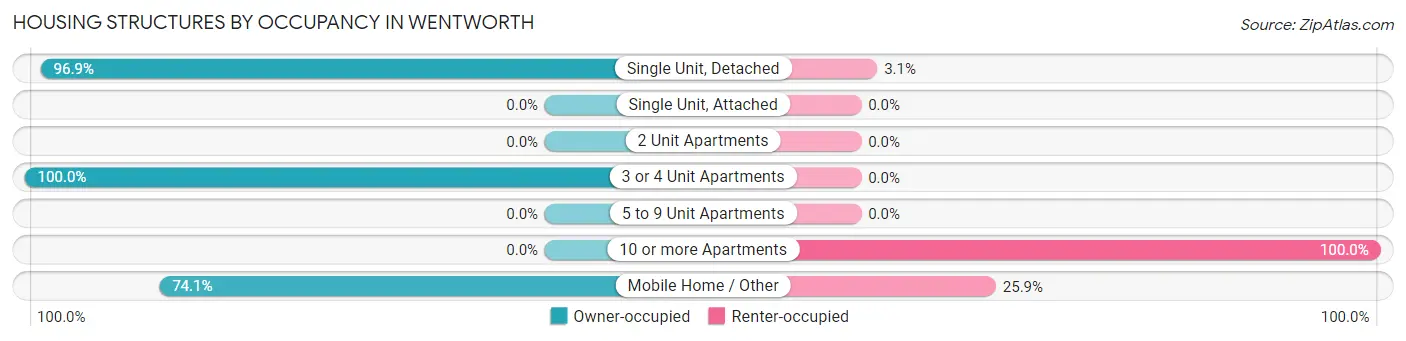
| Structure Type | Owner-occupied | Renter-occupied |
| Single Unit, Detached | 690 (96.9%) | 22 (3.1%) |
| Single Unit, Attached | 0 (0.0%) | 0 (0.0%) |
| 2 Unit Apartments | 0 (0.0%) | 0 (0.0%) |
| 3 or 4 Unit Apartments | 3 (100.0%) | 0 (0.0%) |
| 5 to 9 Unit Apartments | 0 (0.0%) | 0 (0.0%) |
| 10 or more Apartments | 0 (0.0%) | 11 (100.0%) |
| Mobile Home / Other | 160 (74.1%) | 56 (25.9%) |
| Total | 853 (90.5%) | 89 (9.5%) |
Housing Structures by Number of Rooms in Wentworth
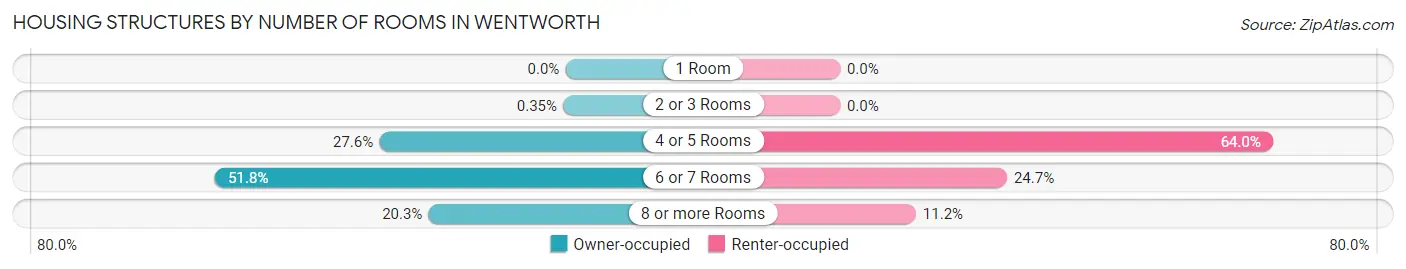
| Number of Rooms | Owner-occupied | Renter-occupied |
| 1 Room | 0 (0.0%) | 0 (0.0%) |
| 2 or 3 Rooms | 3 (0.4%) | 0 (0.0%) |
| 4 or 5 Rooms | 235 (27.6%) | 57 (64.0%) |
| 6 or 7 Rooms | 442 (51.8%) | 22 (24.7%) |
| 8 or more Rooms | 173 (20.3%) | 10 (11.2%) |
| Total | 853 (100.0%) | 89 (100.0%) |
Housing Structure by Heating Type in Wentworth
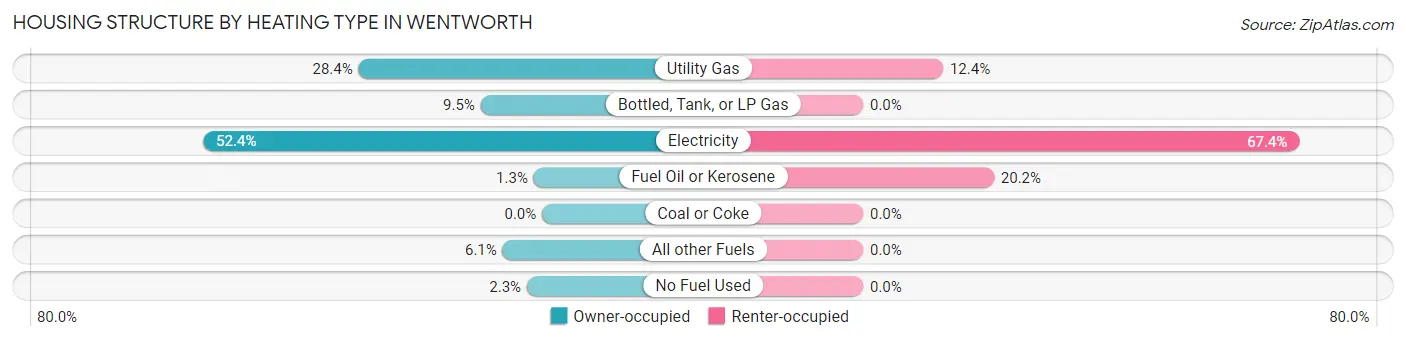
| Heating Type | Owner-occupied | Renter-occupied |
| Utility Gas | 242 (28.4%) | 11 (12.4%) |
| Bottled, Tank, or LP Gas | 81 (9.5%) | 0 (0.0%) |
| Electricity | 447 (52.4%) | 60 (67.4%) |
| Fuel Oil or Kerosene | 11 (1.3%) | 18 (20.2%) |
| Coal or Coke | 0 (0.0%) | 0 (0.0%) |
| All other Fuels | 52 (6.1%) | 0 (0.0%) |
| No Fuel Used | 20 (2.3%) | 0 (0.0%) |
| Total | 853 (100.0%) | 89 (100.0%) |
Household Vehicle Usage in Wentworth
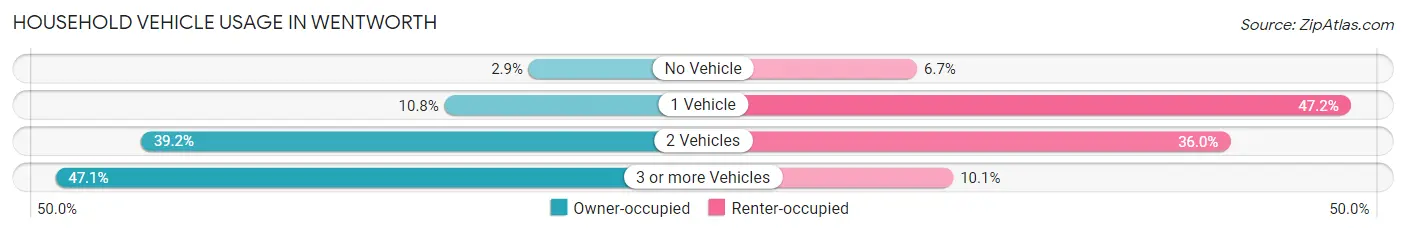
| Vehicles per Household | Owner-occupied | Renter-occupied |
| No Vehicle | 25 (2.9%) | 6 (6.7%) |
| 1 Vehicle | 92 (10.8%) | 42 (47.2%) |
| 2 Vehicles | 334 (39.2%) | 32 (36.0%) |
| 3 or more Vehicles | 402 (47.1%) | 9 (10.1%) |
| Total | 853 (100.0%) | 89 (100.0%) |
Real Estate & Mortgages in Wentworth
Real Estate and Mortgage Overview in Wentworth
| Characteristic | Without Mortgage | With Mortgage |
| Housing Units | 337 | 516 |
| Median Property Value | $136,300 | $172,200 |
| Median Household Income | $52,188 | $94 |
| Monthly Housing Costs | $383 | $7 |
| Real Estate Taxes | $1,012 | $0 |
Property Value by Mortgage Status in Wentworth
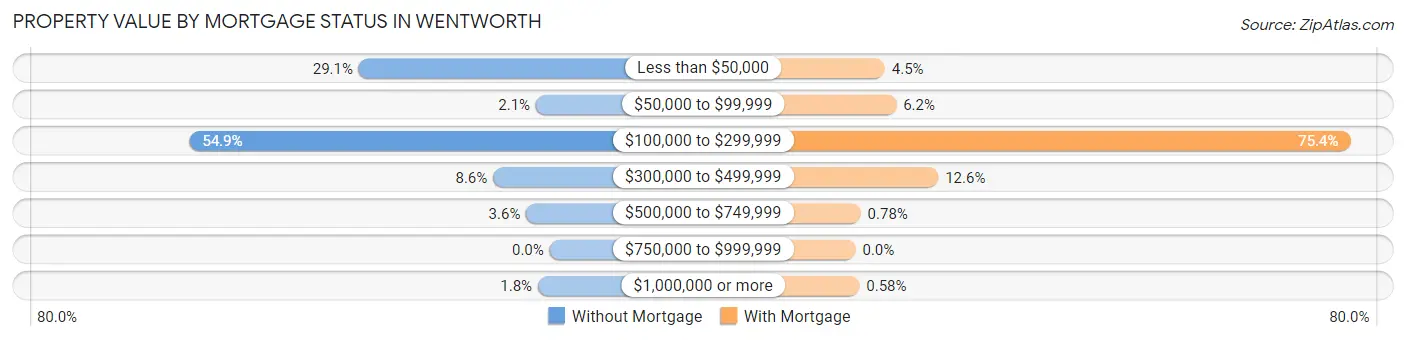
| Property Value | Without Mortgage | With Mortgage |
| Less than $50,000 | 98 (29.1%) | 23 (4.5%) |
| $50,000 to $99,999 | 7 (2.1%) | 32 (6.2%) |
| $100,000 to $299,999 | 185 (54.9%) | 389 (75.4%) |
| $300,000 to $499,999 | 29 (8.6%) | 65 (12.6%) |
| $500,000 to $749,999 | 12 (3.6%) | 4 (0.8%) |
| $750,000 to $999,999 | 0 (0.0%) | 0 (0.0%) |
| $1,000,000 or more | 6 (1.8%) | 3 (0.6%) |
| Total | 337 (100.0%) | 516 (100.0%) |
Household Income by Mortgage Status in Wentworth
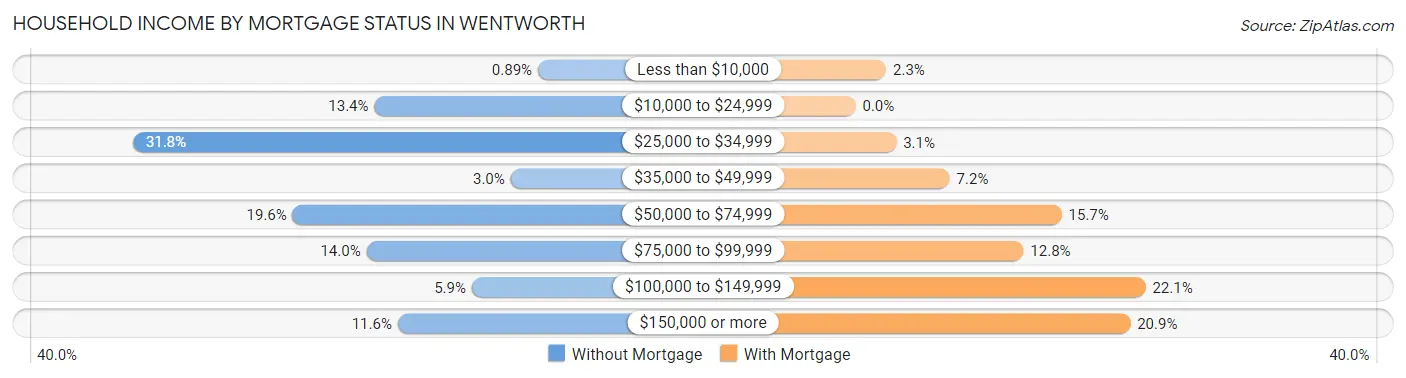
| Household Income | Without Mortgage | With Mortgage |
| Less than $10,000 | 3 (0.9%) | 12 (2.3%) |
| $10,000 to $24,999 | 45 (13.4%) | 0 (0.0%) |
| $25,000 to $34,999 | 107 (31.8%) | 16 (3.1%) |
| $35,000 to $49,999 | 10 (3.0%) | 37 (7.2%) |
| $50,000 to $74,999 | 66 (19.6%) | 81 (15.7%) |
| $75,000 to $99,999 | 47 (14.0%) | 66 (12.8%) |
| $100,000 to $149,999 | 20 (5.9%) | 114 (22.1%) |
| $150,000 or more | 39 (11.6%) | 108 (20.9%) |
| Total | 337 (100.0%) | 516 (100.0%) |
Property Value to Household Income Ratio in Wentworth
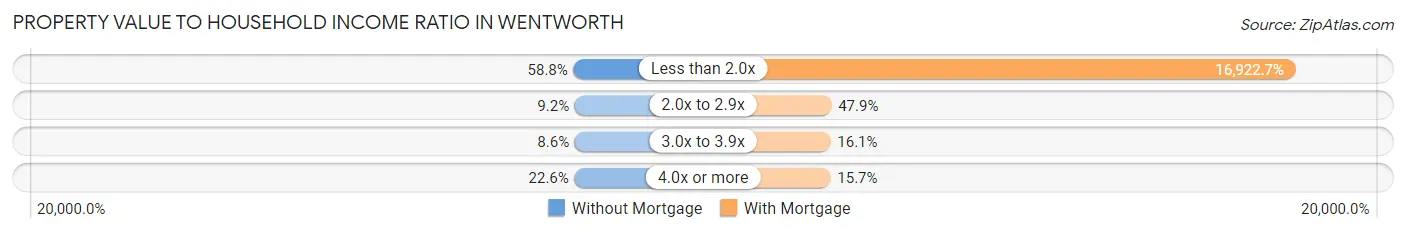
| Value-to-Income Ratio | Without Mortgage | With Mortgage |
| Less than 2.0x | 198 (58.8%) | 87,321 (16,922.7%) |
| 2.0x to 2.9x | 31 (9.2%) | 247 (47.9%) |
| 3.0x to 3.9x | 29 (8.6%) | 83 (16.1%) |
| 4.0x or more | 76 (22.6%) | 81 (15.7%) |
| Total | 337 (100.0%) | 516 (100.0%) |
Real Estate Taxes by Mortgage Status in Wentworth
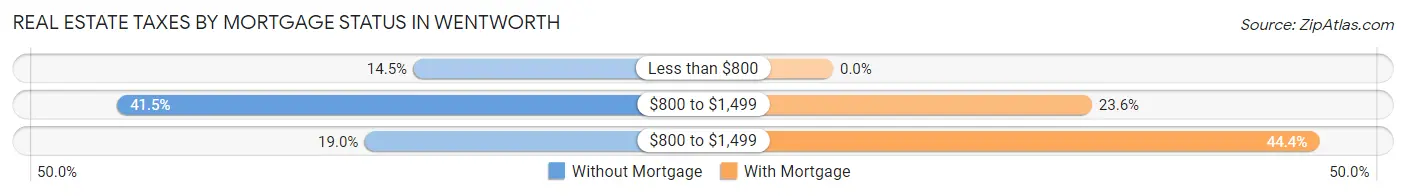
| Property Taxes | Without Mortgage | With Mortgage |
| Less than $800 | 49 (14.5%) | 0 (0.0%) |
| $800 to $1,499 | 140 (41.5%) | 122 (23.6%) |
| $800 to $1,499 | 64 (19.0%) | 229 (44.4%) |
| Total | 337 (100.0%) | 516 (100.0%) |
Health & Disability in Wentworth
Health Insurance Coverage by Age in Wentworth
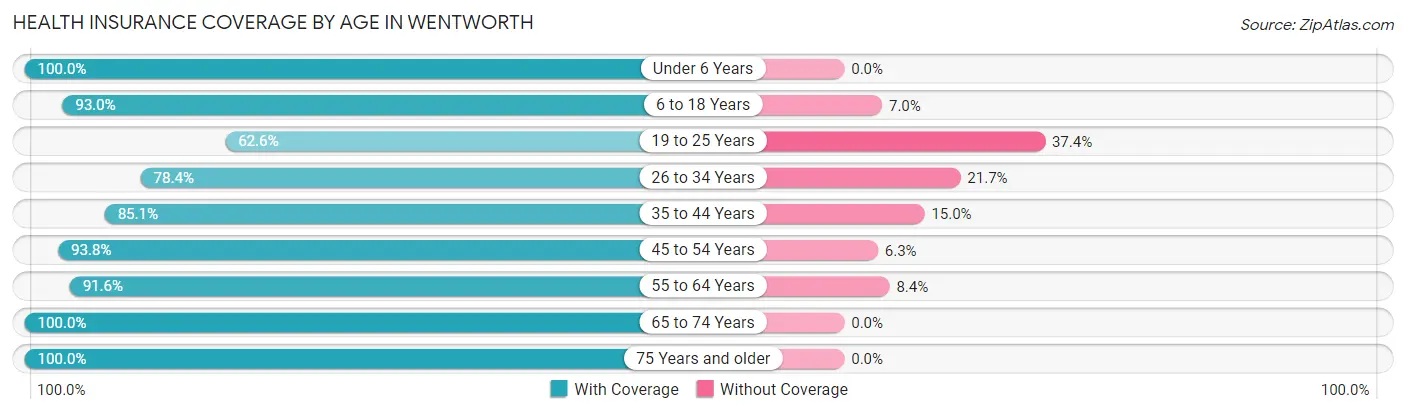
| Age Bracket | With Coverage | Without Coverage |
| Under 6 Years | 29 (100.0%) | 0 (0.0%) |
| 6 to 18 Years | 515 (93.0%) | 39 (7.0%) |
| 19 to 25 Years | 97 (62.6%) | 58 (37.4%) |
| 26 to 34 Years | 181 (78.3%) | 50 (21.6%) |
| 35 to 44 Years | 182 (85.1%) | 32 (14.9%) |
| 45 to 54 Years | 360 (93.8%) | 24 (6.2%) |
| 55 to 64 Years | 261 (91.6%) | 24 (8.4%) |
| 65 to 74 Years | 348 (100.0%) | 0 (0.0%) |
| 75 Years and older | 179 (100.0%) | 0 (0.0%) |
| Total | 2,152 (90.5%) | 227 (9.5%) |
Health Insurance Coverage by Citizenship Status in Wentworth
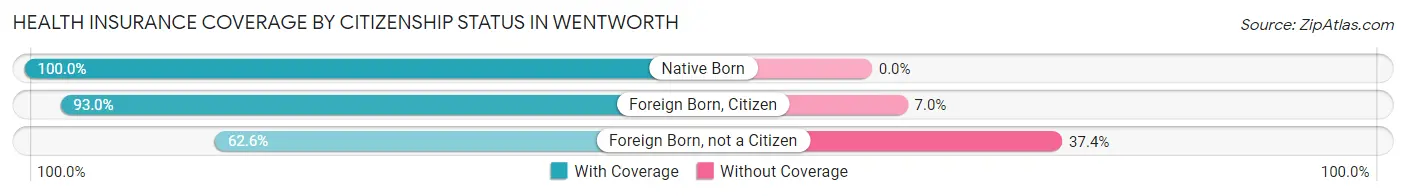
| Citizenship Status | With Coverage | Without Coverage |
| Native Born | 29 (100.0%) | 0 (0.0%) |
| Foreign Born, Citizen | 515 (93.0%) | 39 (7.0%) |
| Foreign Born, not a Citizen | 97 (62.6%) | 58 (37.4%) |
Health Insurance Coverage by Household Income in Wentworth
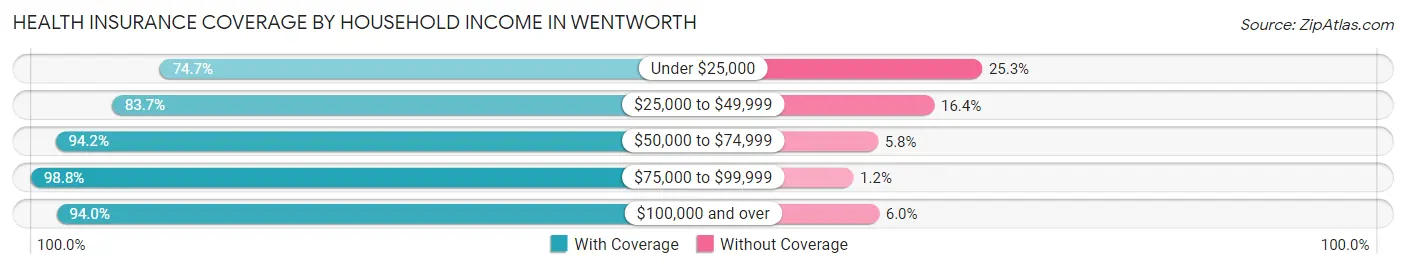
| Household Income | With Coverage | Without Coverage |
| Under $25,000 | 174 (74.7%) | 59 (25.3%) |
| $25,000 to $49,999 | 491 (83.7%) | 96 (16.4%) |
| $50,000 to $74,999 | 276 (94.2%) | 17 (5.8%) |
| $75,000 to $99,999 | 415 (98.8%) | 5 (1.2%) |
| $100,000 and over | 785 (94.0%) | 50 (6.0%) |
Public vs Private Health Insurance Coverage by Age in Wentworth
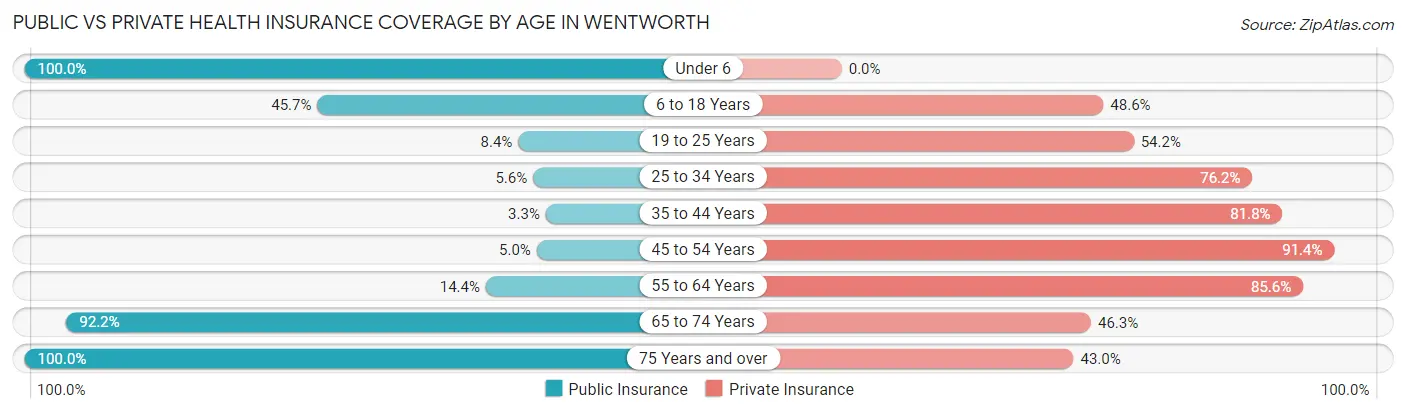
| Age Bracket | Public Insurance | Private Insurance |
| Under 6 | 29 (100.0%) | 0 (0.0%) |
| 6 to 18 Years | 253 (45.7%) | 269 (48.6%) |
| 19 to 25 Years | 13 (8.4%) | 84 (54.2%) |
| 25 to 34 Years | 13 (5.6%) | 176 (76.2%) |
| 35 to 44 Years | 7 (3.3%) | 175 (81.8%) |
| 45 to 54 Years | 19 (5.0%) | 351 (91.4%) |
| 55 to 64 Years | 41 (14.4%) | 244 (85.6%) |
| 65 to 74 Years | 321 (92.2%) | 161 (46.3%) |
| 75 Years and over | 179 (100.0%) | 77 (43.0%) |
| Total | 875 (36.8%) | 1,537 (64.6%) |
Disability Status by Sex by Age in Wentworth
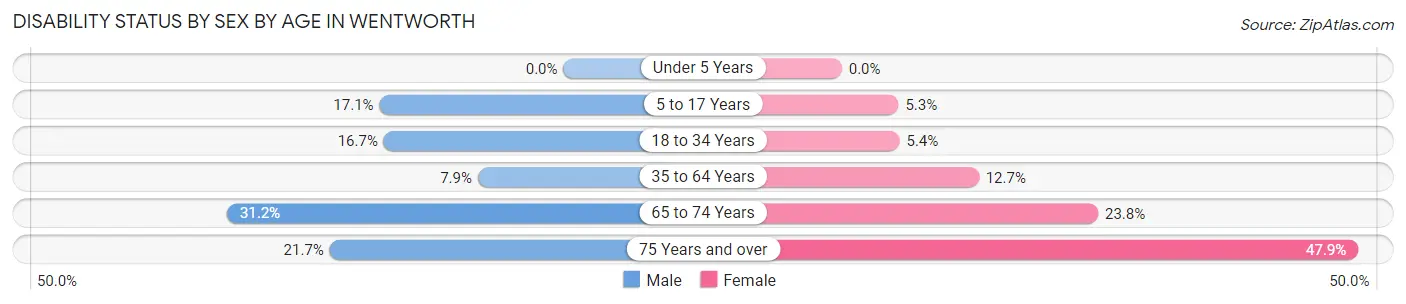
| Age Bracket | Male | Female |
| Under 5 Years | 0 (0.0%) | 0 (0.0%) |
| 5 to 17 Years | 28 (17.1%) | 18 (5.3%) |
| 18 to 34 Years | 27 (16.7%) | 15 (5.4%) |
| 35 to 64 Years | 37 (7.9%) | 53 (12.7%) |
| 65 to 74 Years | 64 (31.2%) | 34 (23.8%) |
| 75 Years and over | 18 (21.7%) | 46 (47.9%) |
Disability Class by Sex by Age in Wentworth
Disability Class: Hearing Difficulty
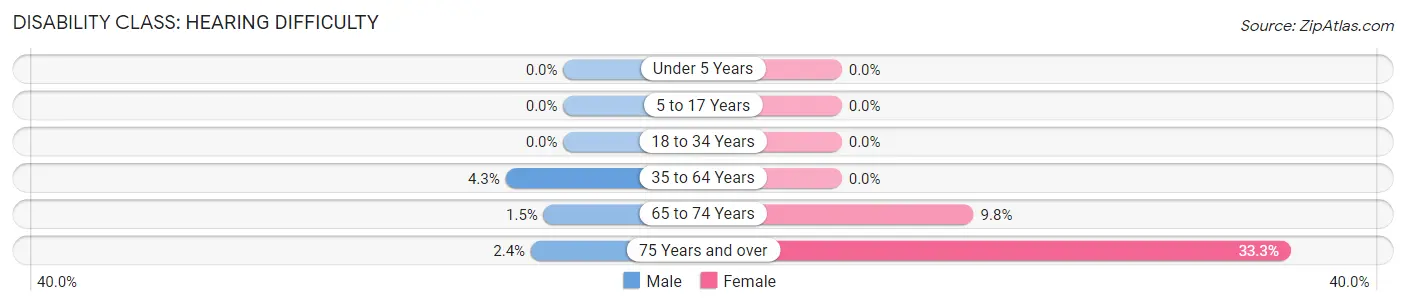
| Age Bracket | Male | Female |
| Under 5 Years | 0 (0.0%) | 0 (0.0%) |
| 5 to 17 Years | 0 (0.0%) | 0 (0.0%) |
| 18 to 34 Years | 0 (0.0%) | 0 (0.0%) |
| 35 to 64 Years | 20 (4.3%) | 0 (0.0%) |
| 65 to 74 Years | 3 (1.5%) | 14 (9.8%) |
| 75 Years and over | 2 (2.4%) | 32 (33.3%) |
Disability Class: Vision Difficulty
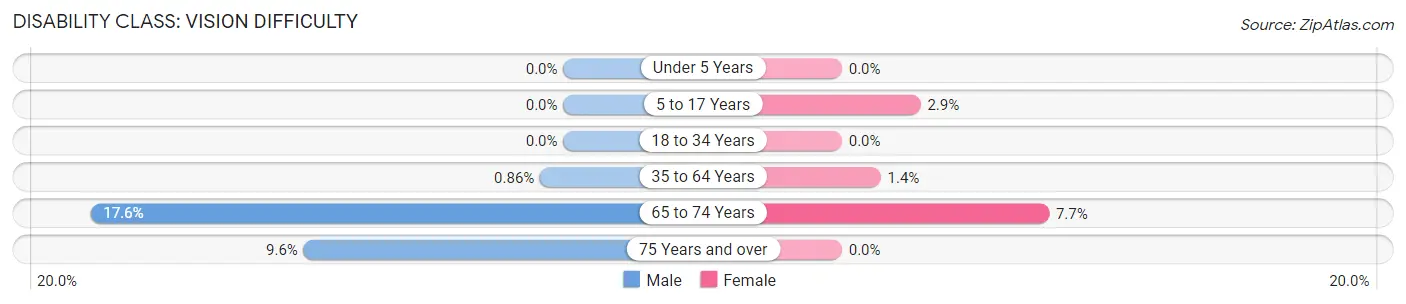
| Age Bracket | Male | Female |
| Under 5 Years | 0 (0.0%) | 0 (0.0%) |
| 5 to 17 Years | 0 (0.0%) | 10 (2.9%) |
| 18 to 34 Years | 0 (0.0%) | 0 (0.0%) |
| 35 to 64 Years | 4 (0.9%) | 6 (1.4%) |
| 65 to 74 Years | 36 (17.6%) | 11 (7.7%) |
| 75 Years and over | 8 (9.6%) | 0 (0.0%) |
Disability Class: Cognitive Difficulty
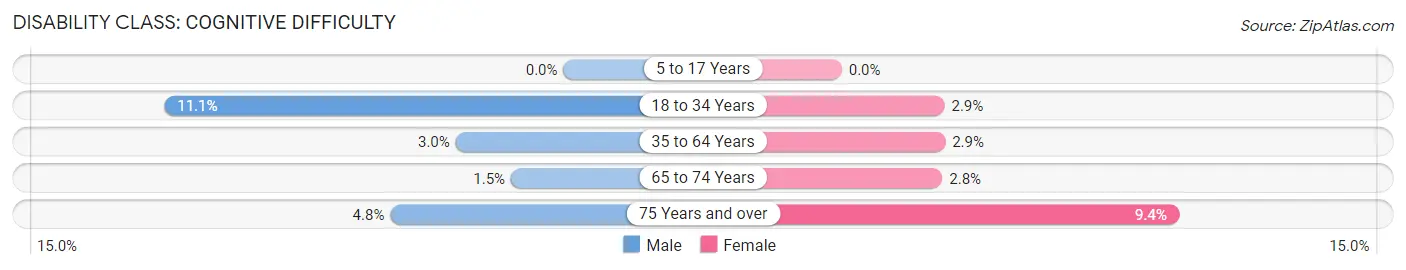
| Age Bracket | Male | Female |
| 5 to 17 Years | 0 (0.0%) | 0 (0.0%) |
| 18 to 34 Years | 18 (11.1%) | 8 (2.9%) |
| 35 to 64 Years | 14 (3.0%) | 12 (2.9%) |
| 65 to 74 Years | 3 (1.5%) | 4 (2.8%) |
| 75 Years and over | 4 (4.8%) | 9 (9.4%) |
Disability Class: Ambulatory Difficulty
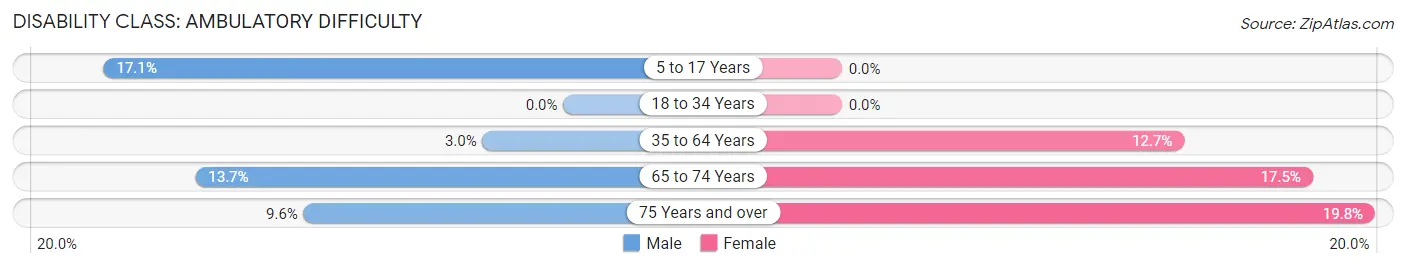
| Age Bracket | Male | Female |
| 5 to 17 Years | 28 (17.1%) | 0 (0.0%) |
| 18 to 34 Years | 0 (0.0%) | 0 (0.0%) |
| 35 to 64 Years | 14 (3.0%) | 53 (12.7%) |
| 65 to 74 Years | 28 (13.7%) | 25 (17.5%) |
| 75 Years and over | 8 (9.6%) | 19 (19.8%) |
Disability Class: Self-Care Difficulty
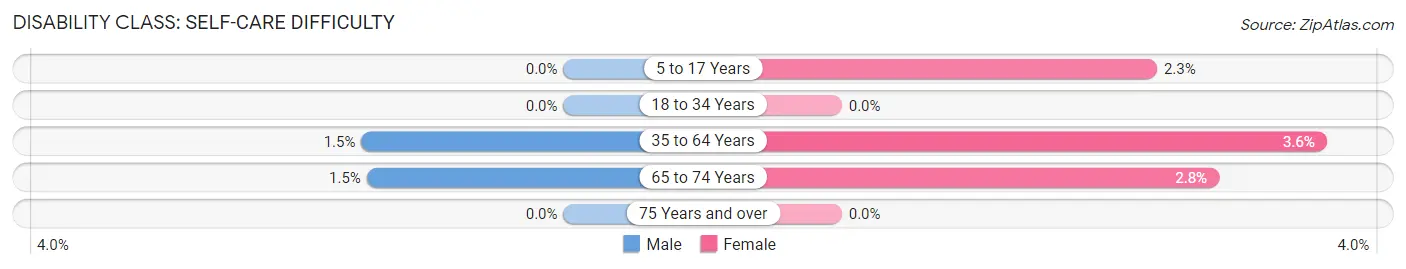
| Age Bracket | Male | Female |
| 5 to 17 Years | 0 (0.0%) | 8 (2.3%) |
| 18 to 34 Years | 0 (0.0%) | 0 (0.0%) |
| 35 to 64 Years | 7 (1.5%) | 15 (3.6%) |
| 65 to 74 Years | 3 (1.5%) | 4 (2.8%) |
| 75 Years and over | 0 (0.0%) | 0 (0.0%) |
Technology Access in Wentworth
Computing Device Access in Wentworth
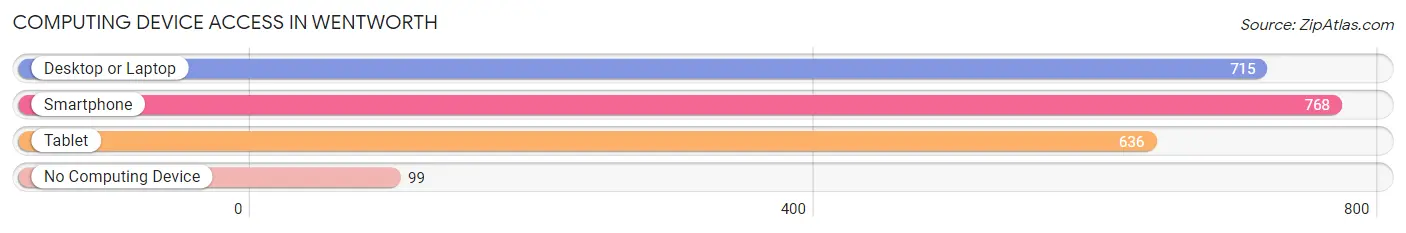
| Device Type | # Households | % Households |
| Desktop or Laptop | 715 | 75.9% |
| Smartphone | 768 | 81.5% |
| Tablet | 636 | 67.5% |
| No Computing Device | 99 | 10.5% |
| Total | 942 | 100.0% |
Internet Access in Wentworth
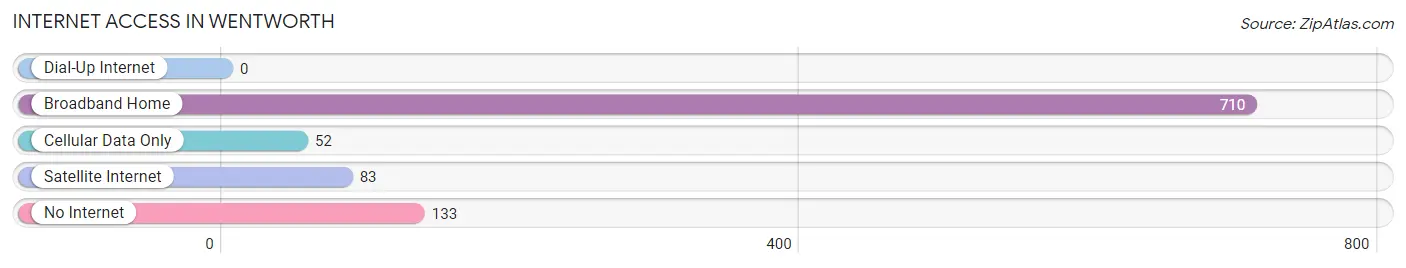
| Internet Type | # Households | % Households |
| Dial-Up Internet | 0 | 0.0% |
| Broadband Home | 710 | 75.4% |
| Cellular Data Only | 52 | 5.5% |
| Satellite Internet | 83 | 8.8% |
| No Internet | 133 | 14.1% |
| Total | 942 | 100.0% |
Wentworth Summary
Wentworth is a small town located in Rockingham County, North Carolina. It is situated in the Piedmont region of the state, approximately 25 miles north of Greensboro. The town has a population of approximately 2,000 people and is part of the Greensboro-High Point Metropolitan Statistical Area.
Geography
Wentworth is located in the Piedmont region of North Carolina, which is characterized by rolling hills and valleys. The town is situated in the Dan River Valley, which is a tributary of the Roanoke River. The town is located at an elevation of 830 feet above sea level. The climate in Wentworth is mild, with temperatures ranging from the mid-30s in the winter to the mid-80s in the summer.
The town is located near the intersection of Interstate 85 and US Highway 158. The nearest major airport is Piedmont Triad International Airport, located approximately 40 miles away in Greensboro.
History
Wentworth was founded in 1790 by William Wentworth, a Revolutionary War veteran. The town was originally known as Wentworth’s Crossroads, and was a stop on the stagecoach route between Greensboro and Danville, Virginia. The town was incorporated in 1891 and was named after William Wentworth.
In the late 19th century, Wentworth was a thriving agricultural community. The town was home to several cotton mills, which provided employment for many of the town’s residents. The town also had a thriving furniture industry, which was centered around the Wentworth Furniture Company.
Economy
Today, Wentworth’s economy is largely based on agriculture and manufacturing. The town is home to several large farms, which produce a variety of crops, including corn, soybeans, and tobacco. The town is also home to several manufacturing companies, including a furniture factory and a textile mill.
The town is also home to several small businesses, including restaurants, retail stores, and service providers. The town is also home to several medical facilities, including a hospital and several clinics.
Demographics
As of the 2010 census, Wentworth had a population of 2,000 people. The racial makeup of the town was 94.2% White, 2.7% African American, 0.7% Native American, 0.3% Asian, and 2.1% from other races. The median household income was $35,000, and the median family income was $41,000.
Conclusion
Wentworth is a small town located in Rockingham County, North Carolina. It is situated in the Piedmont region of the state, approximately 25 miles north of Greensboro. The town has a population of approximately 2,000 people and is part of the Greensboro-High Point Metropolitan Statistical Area. The town’s economy is largely based on agriculture and manufacturing, and the town is home to several small businesses. The racial makeup of the town is 94.2% White, 2.7% African American, 0.7% Native American, 0.3% Asian, and 2.1% from other races. The median household income was $35,000, and the median family income was $41,000.
Common Questions
What is Per Capita Income in Wentworth?
Per Capita income in Wentworth is $29,529.
What is the Median Family Income in Wentworth?
Median Family Income in Wentworth is $80,647.
What is the Median Household income in Wentworth?
Median Household Income in Wentworth is $71,806.
What is Income or Wage Gap in Wentworth?
Income or Wage Gap in Wentworth is 13.7%.
Women in Wentworth earn 86.3 cents for every dollar earned by a man.
What is Family Income Deficit in Wentworth?
Family Income Deficit in Wentworth is $12,204.
Families that are below poverty line in Wentworth earn $12,204 less on average than the poverty threshold level.
What is Inequality or Gini Index in Wentworth?
Inequality or Gini Index in Wentworth is 0.37.
What is the Total Population of Wentworth?
Total Population of Wentworth is 2,664.
What is the Total Male Population of Wentworth?
Total Male Population of Wentworth is 1,330.
What is the Total Female Population of Wentworth?
Total Female Population of Wentworth is 1,334.
What is the Ratio of Males per 100 Females in Wentworth?
There are 99.70 Males per 100 Females in Wentworth.
What is the Ratio of Females per 100 Males in Wentworth?
There are 100.30 Females per 100 Males in Wentworth.
What is the Median Population Age in Wentworth?
Median Population Age in Wentworth is 41.8 Years.
What is the Average Family Size in Wentworth
Average Family Size in Wentworth is 3.0 People.
What is the Average Household Size in Wentworth
Average Household Size in Wentworth is 2.5 People.
How Large is the Labor Force in Wentworth?
There are 1,076 People in the Labor Forcein in Wentworth.
What is the Percentage of People in the Labor Force in Wentworth?
48.3% of People are in the Labor Force in Wentworth.
What is the Unemployment Rate in Wentworth?
Unemployment Rate in Wentworth is 5.2%.