Dana, NC Map & Demographics
Dana Map
Dana Overview
$23,524
PER CAPITA INCOME
$67,584
AVG FAMILY INCOME
$53,256
AVG HOUSEHOLD INCOME
41.6%
WAGE / INCOME GAP [ % ]
58.4¢/ $1
WAGE / INCOME GAP [ $ ]
$14,664
FAMILY INCOME DEFICIT
0.41
INEQUALITY / GINI INDEX
3,629
TOTAL POPULATION
1,737
MALE POPULATION
1,892
FEMALE POPULATION
91.81
MALES / 100 FEMALES
108.92
FEMALES / 100 MALES
40.2
MEDIAN AGE
3.0
AVG FAMILY SIZE
2.8
AVG HOUSEHOLD SIZE
1,592
LABOR FORCE [ PEOPLE ]
58.9%
PERCENT IN LABOR FORCE
6.5%
UNEMPLOYMENT RATE
Dana Area Codes
Income in Dana
Income Overview in Dana
Per Capita Income in Dana is $23,524, while median incomes of families and households are $67,584 and $53,256 respectively.
| Characteristic | Number | Measure |
| Per Capita Income | 3,629 | $23,524 |
| Median Family Income | 1,011 | $67,584 |
| Mean Family Income | 1,011 | $67,848 |
| Median Household Income | 1,316 | $53,256 |
| Mean Household Income | 1,316 | $64,037 |
| Income Deficit | 1,011 | $14,664 |
| Wage / Income Gap (%) | 3,629 | 41.58% |
| Wage / Income Gap ($) | 3,629 | 58.42¢ per $1 |
| Gini / Inequality Index | 3,629 | 0.41 |
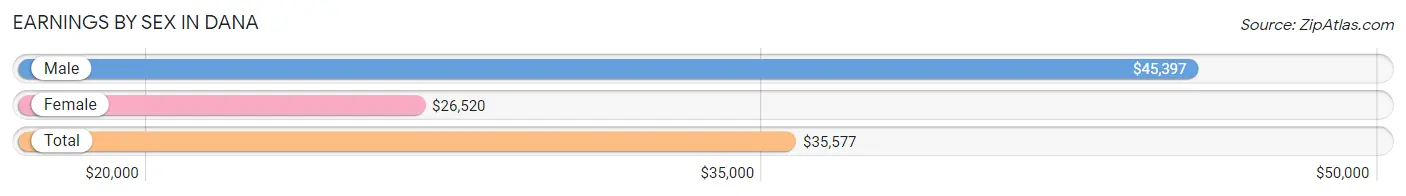
Earnings by Sex in Dana
Average Earnings in Dana are $35,577, $45,397 for men and $26,520 for women, a difference of 41.6%.
| Sex | Number | Average Earnings |
| Male | 850 (53.9%) | $45,397 |
| Female | 726 (46.1%) | $26,520 |
| Total | 1,576 (100.0%) | $35,577 |
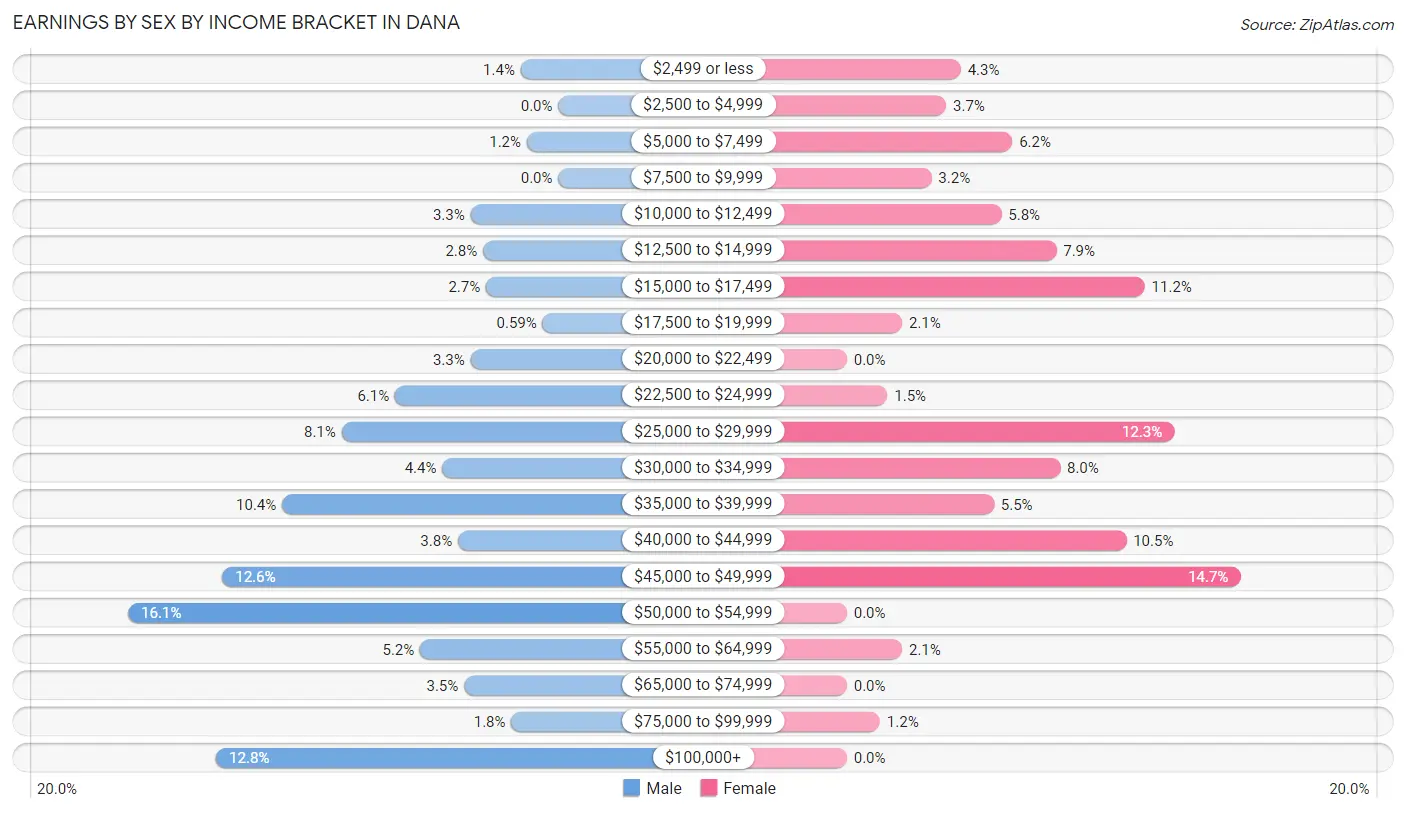
Earnings by Sex by Income Bracket in Dana
The most common earnings brackets in Dana are $50,000 to $54,999 for men (137 | 16.1%) and $45,000 to $49,999 for women (107 | 14.7%).
| Income | Male | Female |
| $2,499 or less | 12 (1.4%) | 31 (4.3%) |
| $2,500 to $4,999 | 0 (0.0%) | 27 (3.7%) |
| $5,000 to $7,499 | 10 (1.2%) | 45 (6.2%) |
| $7,500 to $9,999 | 0 (0.0%) | 23 (3.2%) |
| $10,000 to $12,499 | 28 (3.3%) | 42 (5.8%) |
| $12,500 to $14,999 | 24 (2.8%) | 57 (7.9%) |
| $15,000 to $17,499 | 23 (2.7%) | 81 (11.2%) |
| $17,500 to $19,999 | 5 (0.6%) | 15 (2.1%) |
| $20,000 to $22,499 | 28 (3.3%) | 0 (0.0%) |
| $22,500 to $24,999 | 52 (6.1%) | 11 (1.5%) |
| $25,000 to $29,999 | 69 (8.1%) | 89 (12.3%) |
| $30,000 to $34,999 | 37 (4.3%) | 58 (8.0%) |
| $35,000 to $39,999 | 88 (10.3%) | 40 (5.5%) |
| $40,000 to $44,999 | 32 (3.8%) | 76 (10.5%) |
| $45,000 to $49,999 | 107 (12.6%) | 107 (14.7%) |
| $50,000 to $54,999 | 137 (16.1%) | 0 (0.0%) |
| $55,000 to $64,999 | 44 (5.2%) | 15 (2.1%) |
| $65,000 to $74,999 | 30 (3.5%) | 0 (0.0%) |
| $75,000 to $99,999 | 15 (1.8%) | 9 (1.2%) |
| $100,000+ | 109 (12.8%) | 0 (0.0%) |
| Total | 850 (100.0%) | 726 (100.0%) |
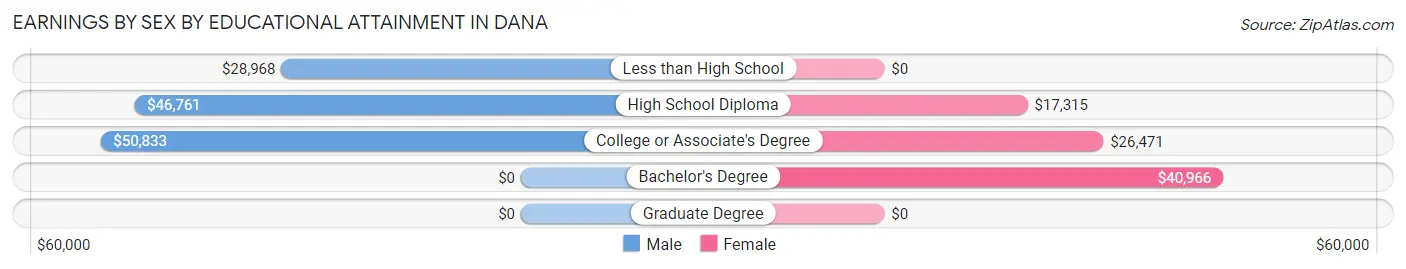
Earnings by Sex by Educational Attainment in Dana
Average earnings in Dana are $45,467 for men and $25,711 for women, a difference of 43.4%. Men with an educational attainment of college or associate's degree enjoy the highest average annual earnings of $50,833, while those with less than high school education earn the least with $28,968. Women with an educational attainment of bachelor's degree earn the most with the average annual earnings of $40,966, while those with high school diploma education have the smallest earnings of $17,315.
| Educational Attainment | Male Income | Female Income |
| Less than High School | $28,968 | $0 |
| High School Diploma | $46,761 | $17,315 |
| College or Associate's Degree | $50,833 | $26,471 |
| Bachelor's Degree | - | - |
| Graduate Degree | - | - |
| Total | $45,467 | $25,711 |
Family Income in Dana
Family Income Brackets in Dana
According to the Dana family income data, there are 257 families falling into the $50,000 to $74,999 income range, which is the most common income bracket and makes up 25.4% of all families. Conversely, the $200,000+ income bracket is the least frequent group with only 5 families (0.5%) belonging to this category.
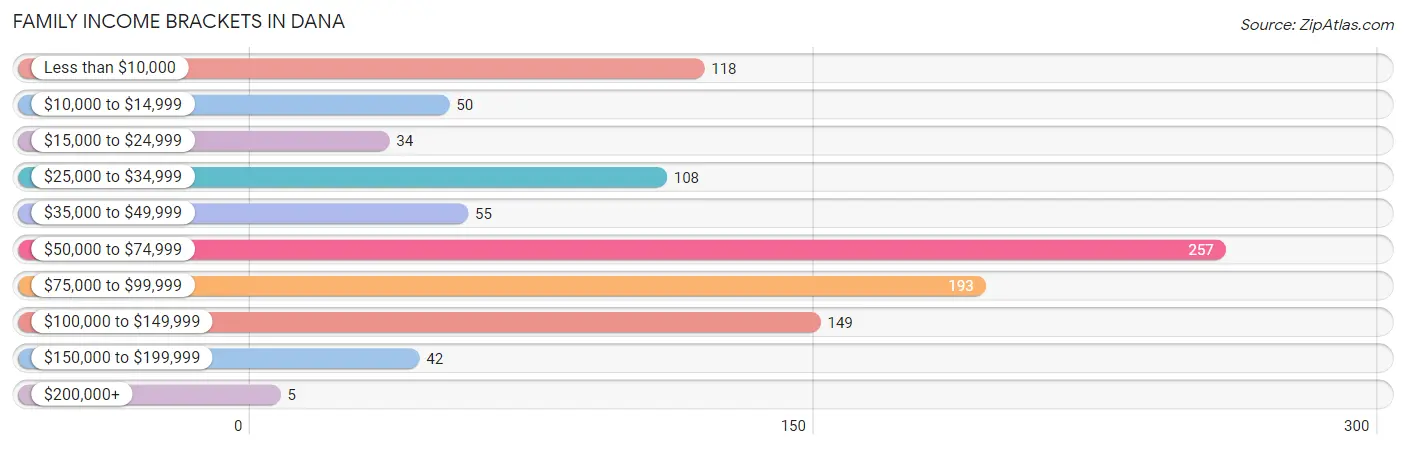
| Income Bracket | # Families | % Families |
| Less than $10,000 | 118 | 11.7% |
| $10,000 to $14,999 | 50 | 4.9% |
| $15,000 to $24,999 | 34 | 3.4% |
| $25,000 to $34,999 | 108 | 10.7% |
| $35,000 to $49,999 | 55 | 5.4% |
| $50,000 to $74,999 | 257 | 25.4% |
| $75,000 to $99,999 | 193 | 19.1% |
| $100,000 to $149,999 | 149 | 14.7% |
| $150,000 to $199,999 | 42 | 4.2% |
| $200,000+ | 5 | 0.5% |
Family Income by Famaliy Size in Dana
2-person families (502 | 49.6%) account for the highest median family income in Dana with $71,935 per family, while 2-person families (502 | 49.6%) have the highest median income of $35,968 per family member.
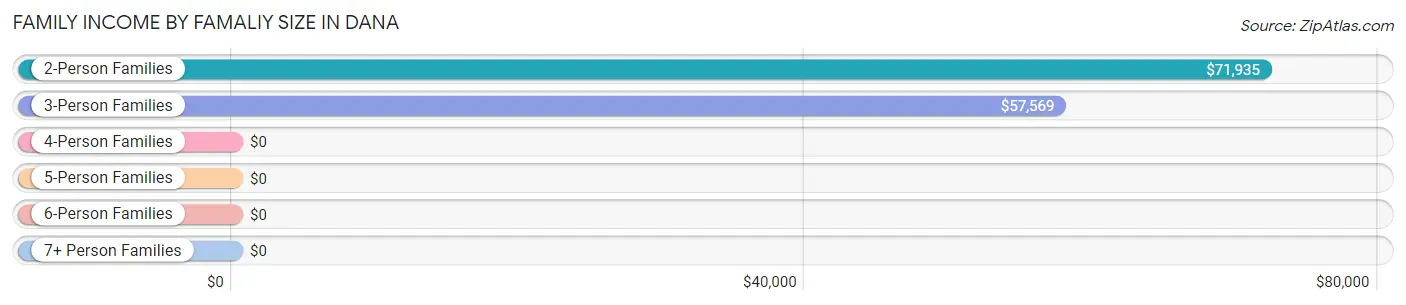
| Income Bracket | # Families | Median Income |
| 2-Person Families | 502 (49.6%) | $71,935 |
| 3-Person Families | 185 (18.3%) | $57,569 |
| 4-Person Families | 193 (19.1%) | $0 |
| 5-Person Families | 92 (9.1%) | $0 |
| 6-Person Families | 28 (2.8%) | $0 |
| 7+ Person Families | 11 (1.1%) | $0 |
| Total | 1,011 (100.0%) | $67,584 |
Family Income by Number of Earners in Dana
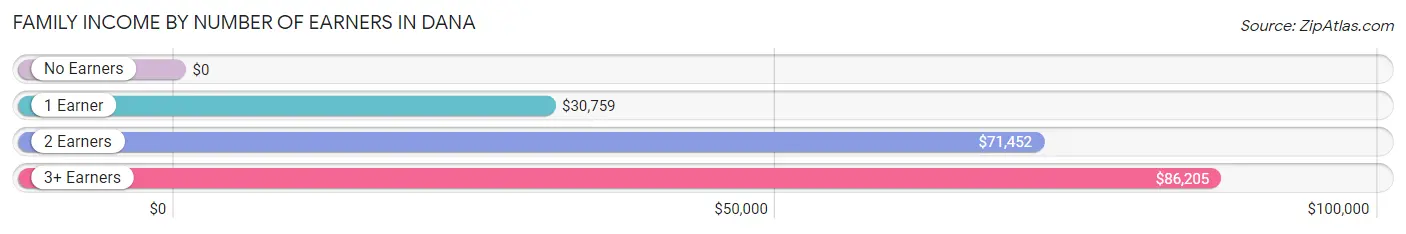
| Number of Earners | # Families | Median Income |
| No Earners | 221 (21.9%) | $0 |
| 1 Earner | 359 (35.5%) | $30,759 |
| 2 Earners | 358 (35.4%) | $71,452 |
| 3+ Earners | 73 (7.2%) | $86,205 |
| Total | 1,011 (100.0%) | $67,584 |
Household Income in Dana
Household Income Brackets in Dana
With 254 households falling in the category, the $50,000 to $74,999 income range is the most frequent in Dana, accounting for 19.3% of all households. In contrast, only 5 households (0.4%) fall into the $200,000+ income bracket, making it the least populous group.
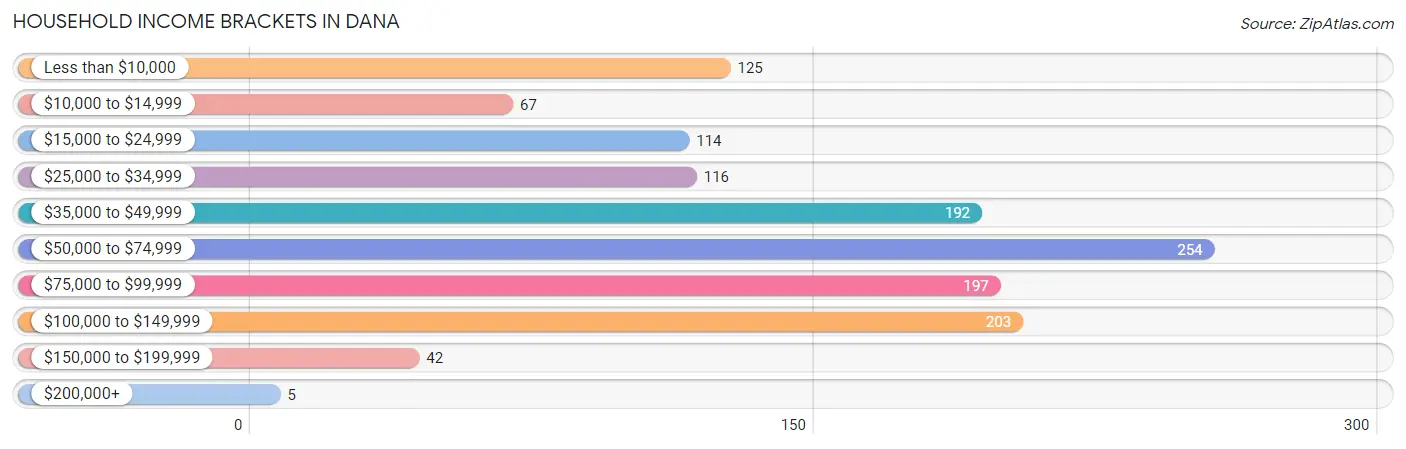
| Income Bracket | # Households | % Households |
| Less than $10,000 | 125 | 9.5% |
| $10,000 to $14,999 | 67 | 5.1% |
| $15,000 to $24,999 | 114 | 8.7% |
| $25,000 to $34,999 | 116 | 8.8% |
| $35,000 to $49,999 | 192 | 14.6% |
| $50,000 to $74,999 | 254 | 19.3% |
| $75,000 to $99,999 | 197 | 15.0% |
| $100,000 to $149,999 | 203 | 15.4% |
| $150,000 to $199,999 | 42 | 3.2% |
| $200,000+ | 5 | 0.4% |
Household Income by Householder Age in Dana
The median household income in Dana is $53,256, with the highest median household income of $61,417 found in the 45 to 64 years age bracket for the primary householder. A total of 443 households (33.7%) fall into this category. Meanwhile, the 15 to 24 years age bracket for the primary householder has the lowest median household income of $0, with 19 households (1.4%) in this group.
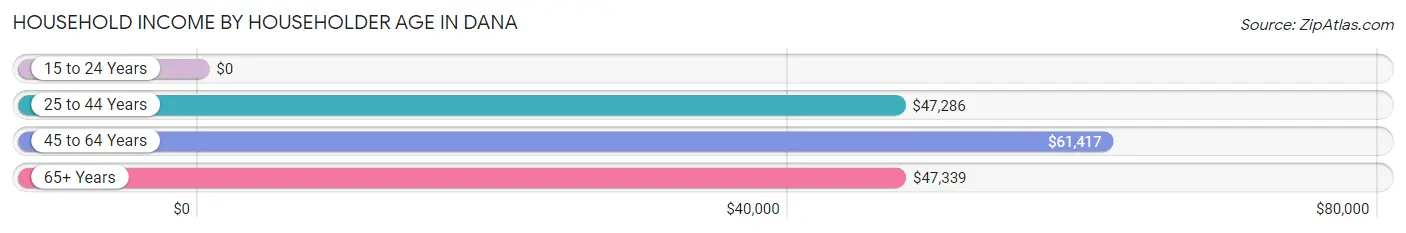
| Income Bracket | # Households | Median Income |
| 15 to 24 Years | 19 (1.4%) | $0 |
| 25 to 44 Years | 392 (29.8%) | $47,286 |
| 45 to 64 Years | 443 (33.7%) | $61,417 |
| 65+ Years | 462 (35.1%) | $47,339 |
| Total | 1,316 (100.0%) | $53,256 |
Poverty in Dana
Income Below Poverty by Sex and Age in Dana
With 22.4% poverty level for males and 34.4% for females among the residents of Dana, 16 and 17 year old males and 15 year old females are the most vulnerable to poverty, with 60 males (100.0%) and 40 females (100.0%) in their respective age groups living below the poverty level.
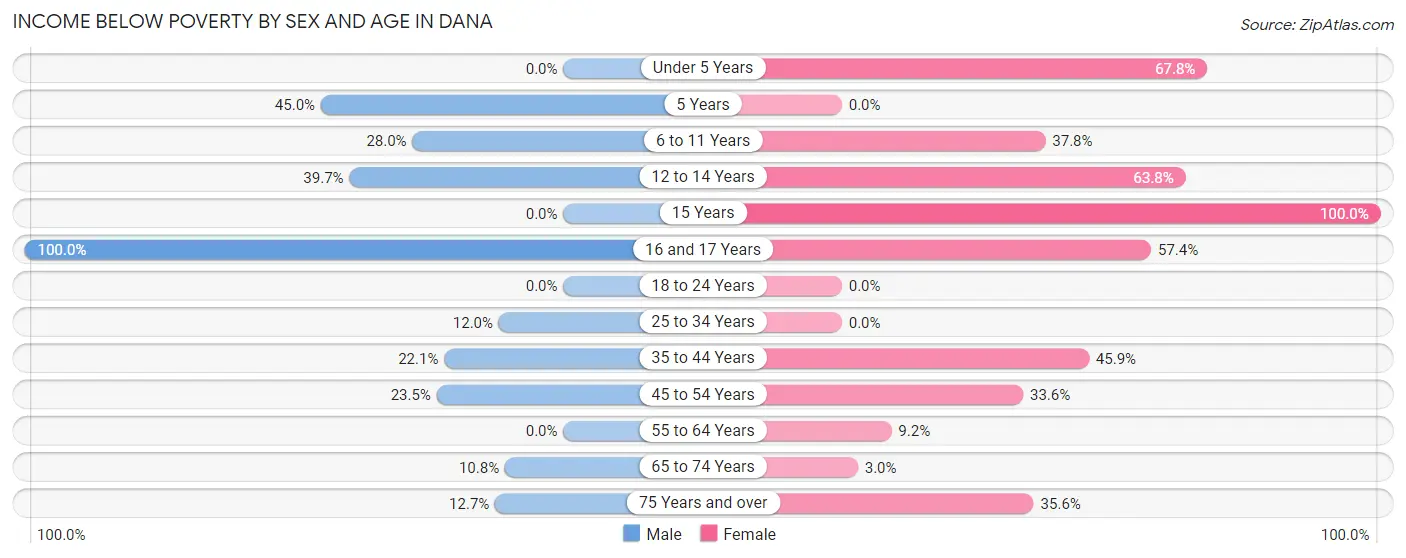
| Age Bracket | Male | Female |
| Under 5 Years | 0 (0.0%) | 118 (67.8%) |
| 5 Years | 27 (45.0%) | 0 (0.0%) |
| 6 to 11 Years | 79 (28.0%) | 51 (37.8%) |
| 12 to 14 Years | 27 (39.7%) | 67 (63.8%) |
| 15 Years | 0 (0.0%) | 40 (100.0%) |
| 16 and 17 Years | 60 (100.0%) | 31 (57.4%) |
| 18 to 24 Years | 0 (0.0%) | 0 (0.0%) |
| 25 to 34 Years | 14 (12.0%) | 0 (0.0%) |
| 35 to 44 Years | 63 (22.1%) | 189 (45.9%) |
| 45 to 54 Years | 83 (23.5%) | 73 (33.6%) |
| 55 to 64 Years | 0 (0.0%) | 14 (9.2%) |
| 65 to 74 Years | 26 (10.8%) | 7 (3.0%) |
| 75 Years and over | 10 (12.7%) | 47 (35.6%) |
| Total | 389 (22.4%) | 637 (34.4%) |
Income Above Poverty by Sex and Age in Dana
According to the poverty statistics in Dana, males aged under 5 years and females aged 18 to 24 years are the age groups that are most secure financially, with 100.0% of males and 100.0% of females in these age groups living above the poverty line.
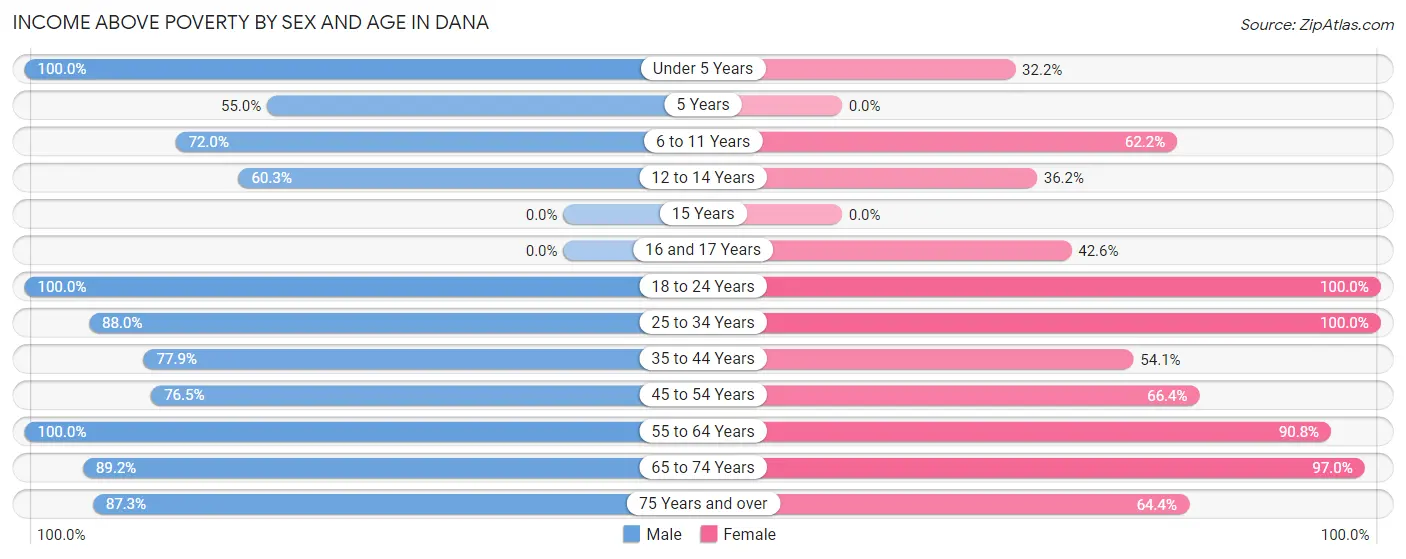
| Age Bracket | Male | Female |
| Under 5 Years | 23 (100.0%) | 56 (32.2%) |
| 5 Years | 33 (55.0%) | 0 (0.0%) |
| 6 to 11 Years | 203 (72.0%) | 84 (62.2%) |
| 12 to 14 Years | 41 (60.3%) | 38 (36.2%) |
| 15 Years | 0 (0.0%) | 0 (0.0%) |
| 16 and 17 Years | 0 (0.0%) | 23 (42.6%) |
| 18 to 24 Years | 54 (100.0%) | 83 (100.0%) |
| 25 to 34 Years | 103 (88.0%) | 113 (100.0%) |
| 35 to 44 Years | 222 (77.9%) | 223 (54.1%) |
| 45 to 54 Years | 270 (76.5%) | 144 (66.4%) |
| 55 to 64 Years | 116 (100.0%) | 138 (90.8%) |
| 65 to 74 Years | 214 (89.2%) | 229 (97.0%) |
| 75 Years and over | 69 (87.3%) | 85 (64.4%) |
| Total | 1,348 (77.6%) | 1,216 (65.6%) |
Income Below Poverty Among Married-Couple Families in Dana
The poverty statistics for married-couple families in Dana show that 13.6% or 109 of the total 803 families live below the poverty line. Families with 3 or 4 children have the highest poverty rate of 70.4%, comprising of 69 families. On the other hand, families with 1 or 2 children have the lowest poverty rate of 0.0%, which includes 0 families.
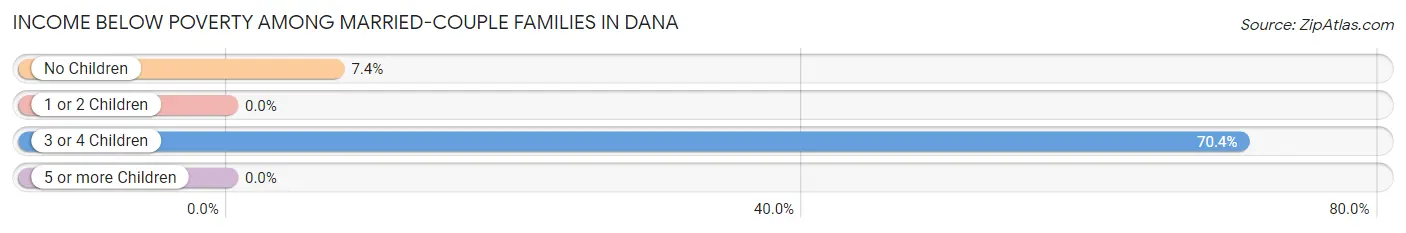
| Children | Above Poverty | Below Poverty |
| No Children | 500 (92.6%) | 40 (7.4%) |
| 1 or 2 Children | 165 (100.0%) | 0 (0.0%) |
| 3 or 4 Children | 29 (29.6%) | 69 (70.4%) |
| 5 or more Children | 0 (0.0%) | 0 (0.0%) |
| Total | 694 (86.4%) | 109 (13.6%) |
Income Below Poverty Among Single-Parent Households in Dana
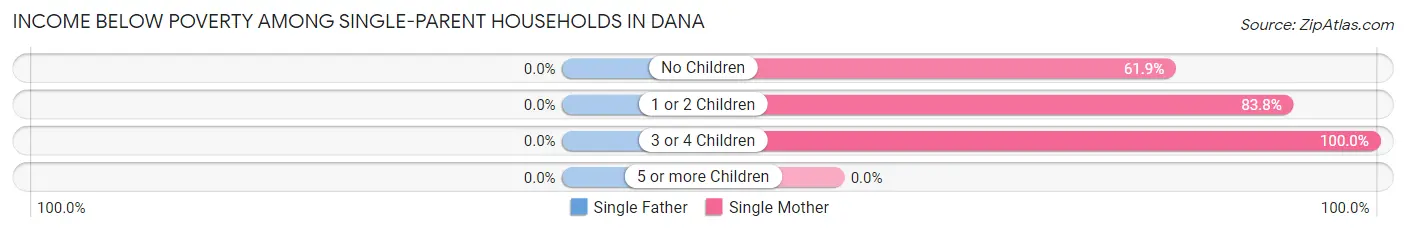
| Children | Single Father | Single Mother |
| No Children | 0 (0.0%) | 13 (61.9%) |
| 1 or 2 Children | 0 (0.0%) | 31 (83.8%) |
| 3 or 4 Children | 0 (0.0%) | 97 (100.0%) |
| 5 or more Children | 0 (0.0%) | 0 (0.0%) |
| Total | 0 (0.0%) | 141 (91.0%) |
Income Below Poverty Among Married-Couple vs Single-Parent Households in Dana
The poverty data for Dana shows that 109 of the married-couple family households (13.6%) and 141 of the single-parent households (67.8%) are living below the poverty level. Within the married-couple family households, those with 3 or 4 children have the highest poverty rate, with 69 households (70.4%) falling below the poverty line. Among the single-parent households, those with 3 or 4 children have the highest poverty rate, with 97 household (100.0%) living below poverty.
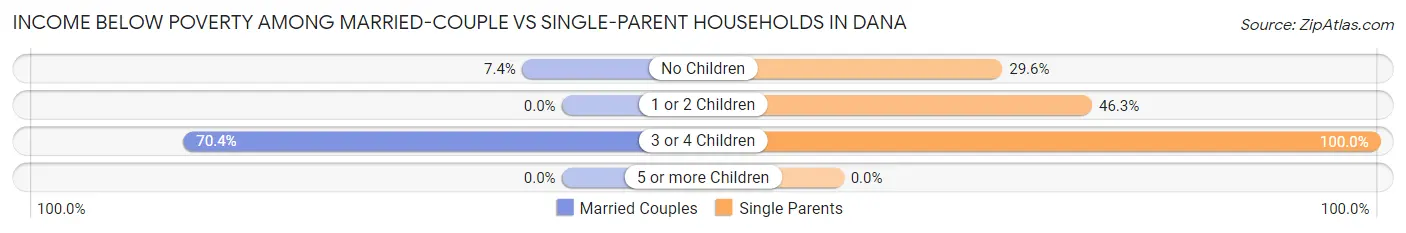
| Children | Married-Couple Families | Single-Parent Households |
| No Children | 40 (7.4%) | 13 (29.5%) |
| 1 or 2 Children | 0 (0.0%) | 31 (46.3%) |
| 3 or 4 Children | 69 (70.4%) | 97 (100.0%) |
| 5 or more Children | 0 (0.0%) | 0 (0.0%) |
| Total | 109 (13.6%) | 141 (67.8%) |
Race in Dana
The most populous races in Dana are White / Caucasian (2,989 | 82.4%), Hispanic or Latino (1,351 | 37.2%), and Two or more Races (569 | 15.7%).
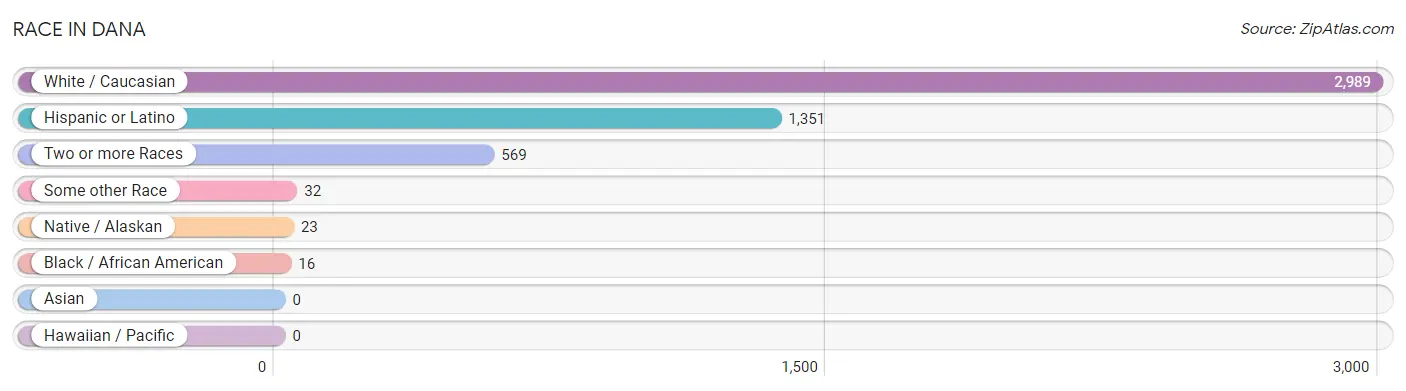
| Race | # Population | % Population |
| Asian | 0 | 0.0% |
| Black / African American | 16 | 0.4% |
| Hawaiian / Pacific | 0 | 0.0% |
| Hispanic or Latino | 1,351 | 37.2% |
| Native / Alaskan | 23 | 0.6% |
| White / Caucasian | 2,989 | 82.4% |
| Two or more Races | 569 | 15.7% |
| Some other Race | 32 | 0.9% |
| Total | 3,629 | 100.0% |
Ancestry in Dana
The most populous ancestries reported in Dana are Mexican (1,267 | 34.9%), Irish (403 | 11.1%), English (370 | 10.2%), German (325 | 9.0%), and American (257 | 7.1%), together accounting for 72.3% of all Dana residents.
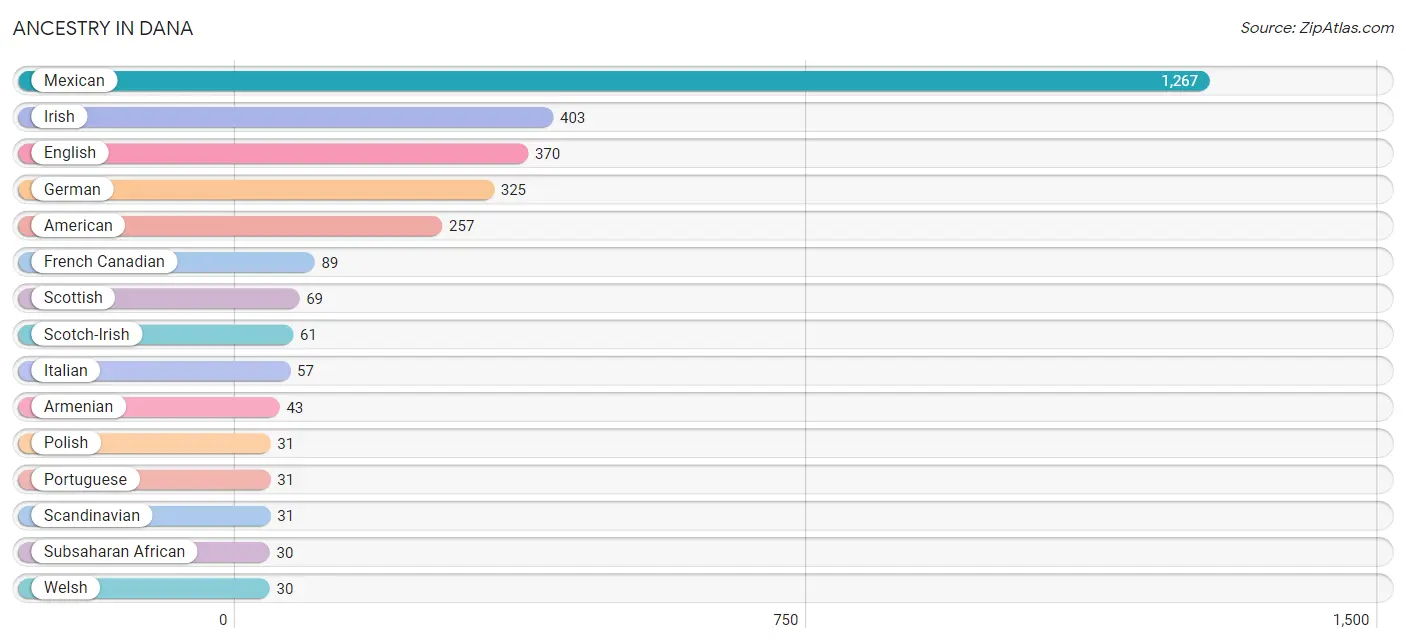
| Ancestry | # Population | % Population |
| African | 14 | 0.4% |
| American | 257 | 7.1% |
| Armenian | 43 | 1.2% |
| Belgian | 22 | 0.6% |
| British | 12 | 0.3% |
| Canadian | 14 | 0.4% |
| Cherokee | 23 | 0.6% |
| Czechoslovakian | 23 | 0.6% |
| English | 370 | 10.2% |
| Ethiopian | 16 | 0.4% |
| European | 27 | 0.7% |
| French | 25 | 0.7% |
| French Canadian | 89 | 2.5% |
| German | 325 | 9.0% |
| Irish | 403 | 11.1% |
| Italian | 57 | 1.6% |
| Mexican | 1,267 | 34.9% |
| Pennsylvania German | 10 | 0.3% |
| Polish | 31 | 0.9% |
| Portuguese | 31 | 0.9% |
| Scandinavian | 31 | 0.9% |
| Scotch-Irish | 61 | 1.7% |
| Scottish | 69 | 1.9% |
| Spaniard | 5 | 0.1% |
| Subsaharan African | 30 | 0.8% |
| Turkish | 16 | 0.4% |
| Welsh | 30 | 0.8% | View All 27 Rows |
Immigrants in Dana
The most numerous immigrant groups reported in Dana came from Central America (453 | 12.5%), Latin America (453 | 12.5%), Mexico (453 | 12.5%), Africa (32 | 0.9%), and Belgium (22 | 0.6%), together accounting for 38.9% of all Dana residents.
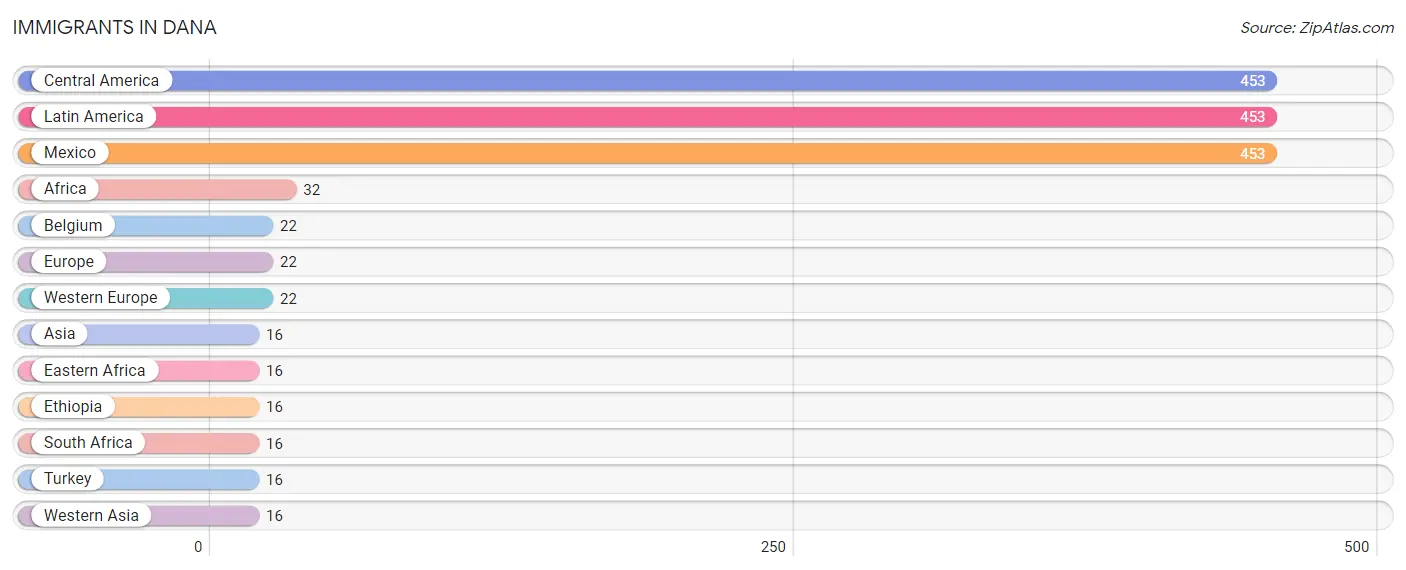
| Immigration Origin | # Population | % Population |
| Africa | 32 | 0.9% |
| Asia | 16 | 0.4% |
| Belgium | 22 | 0.6% |
| Central America | 453 | 12.5% |
| Eastern Africa | 16 | 0.4% |
| Ethiopia | 16 | 0.4% |
| Europe | 22 | 0.6% |
| Latin America | 453 | 12.5% |
| Mexico | 453 | 12.5% |
| South Africa | 16 | 0.4% |
| Turkey | 16 | 0.4% |
| Western Asia | 16 | 0.4% |
| Western Europe | 22 | 0.6% | View All 13 Rows |
Sex and Age in Dana
Sex and Age in Dana
The most populous age groups in Dana are 5 to 9 Years (224 | 12.9%) for men and 35 to 39 Years (225 | 11.9%) for women.
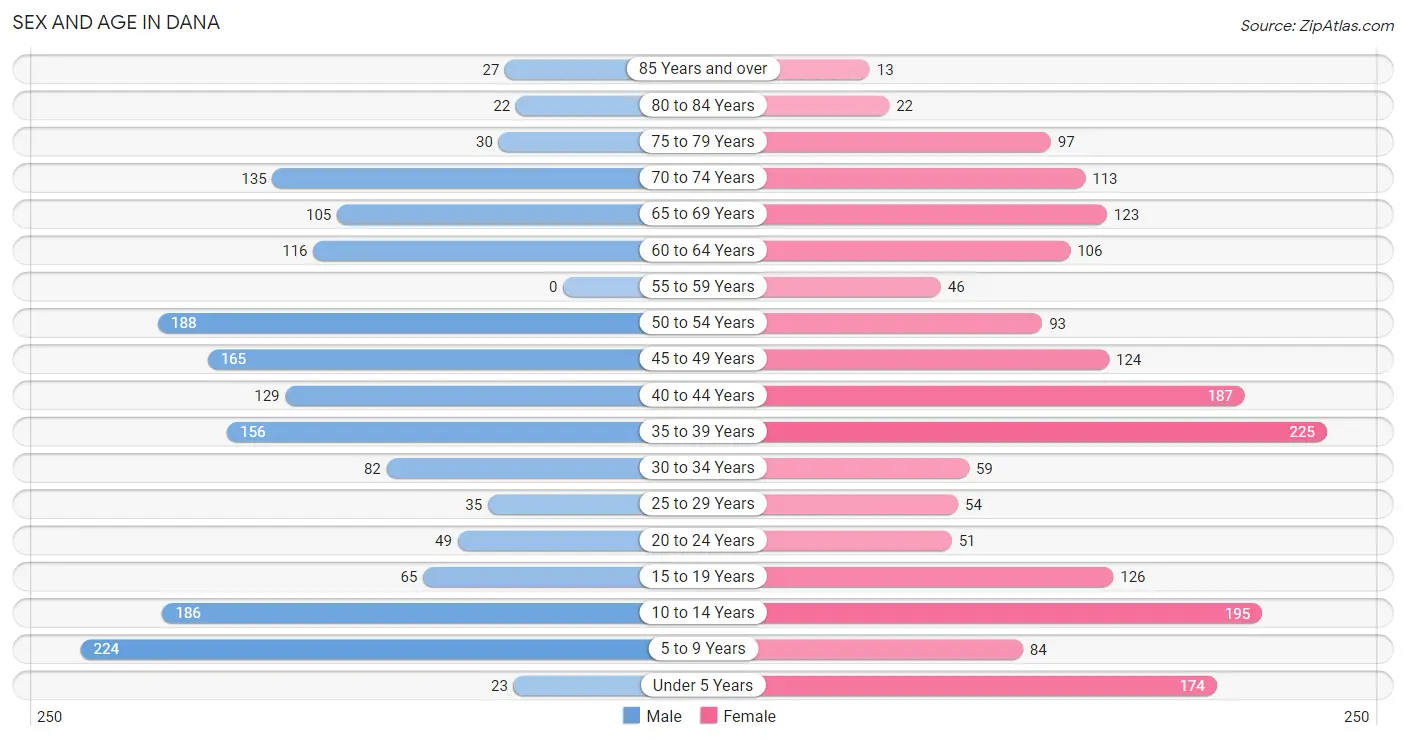
| Age Bracket | Male | Female |
| Under 5 Years | 23 (1.3%) | 174 (9.2%) |
| 5 to 9 Years | 224 (12.9%) | 84 (4.4%) |
| 10 to 14 Years | 186 (10.7%) | 195 (10.3%) |
| 15 to 19 Years | 65 (3.7%) | 126 (6.7%) |
| 20 to 24 Years | 49 (2.8%) | 51 (2.7%) |
| 25 to 29 Years | 35 (2.0%) | 54 (2.9%) |
| 30 to 34 Years | 82 (4.7%) | 59 (3.1%) |
| 35 to 39 Years | 156 (9.0%) | 225 (11.9%) |
| 40 to 44 Years | 129 (7.4%) | 187 (9.9%) |
| 45 to 49 Years | 165 (9.5%) | 124 (6.6%) |
| 50 to 54 Years | 188 (10.8%) | 93 (4.9%) |
| 55 to 59 Years | 0 (0.0%) | 46 (2.4%) |
| 60 to 64 Years | 116 (6.7%) | 106 (5.6%) |
| 65 to 69 Years | 105 (6.0%) | 123 (6.5%) |
| 70 to 74 Years | 135 (7.8%) | 113 (6.0%) |
| 75 to 79 Years | 30 (1.7%) | 97 (5.1%) |
| 80 to 84 Years | 22 (1.3%) | 22 (1.2%) |
| 85 Years and over | 27 (1.5%) | 13 (0.7%) |
| Total | 1,737 (100.0%) | 1,892 (100.0%) |
Families and Households in Dana
Median Family Size in Dana
The median family size in Dana is 3.04 persons per family, with single female/mother families (155 | 15.3%) accounting for the largest median family size of 3.28 persons per family. On the other hand, single male/father families (53 | 5.2%) represent the smallest median family size with 2.70 persons per family.
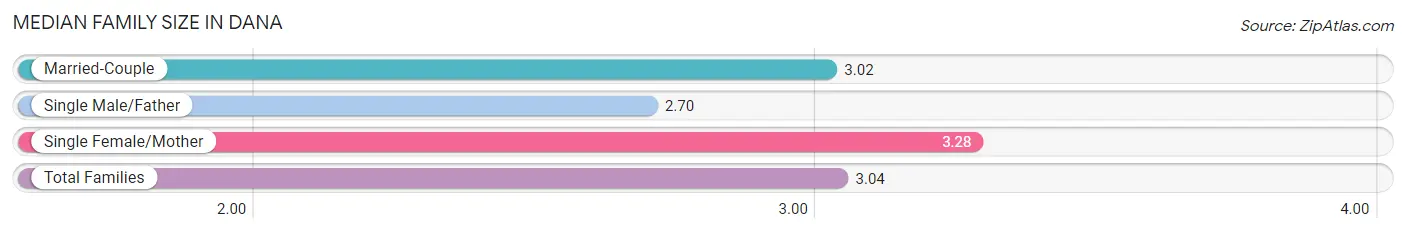
| Family Type | # Families | Family Size |
| Married-Couple | 803 (79.4%) | 3.02 |
| Single Male/Father | 53 (5.2%) | 2.70 |
| Single Female/Mother | 155 (15.3%) | 3.28 |
| Total Families | 1,011 (100.0%) | 3.04 |
Median Household Size in Dana
The median household size in Dana is 2.76 persons per household, with single female/mother households (155 | 11.8%) accounting for the largest median household size of 3.78 persons per household. non-family households (305 | 23.2%) represent the smallest median household size with 1.34 persons per household.
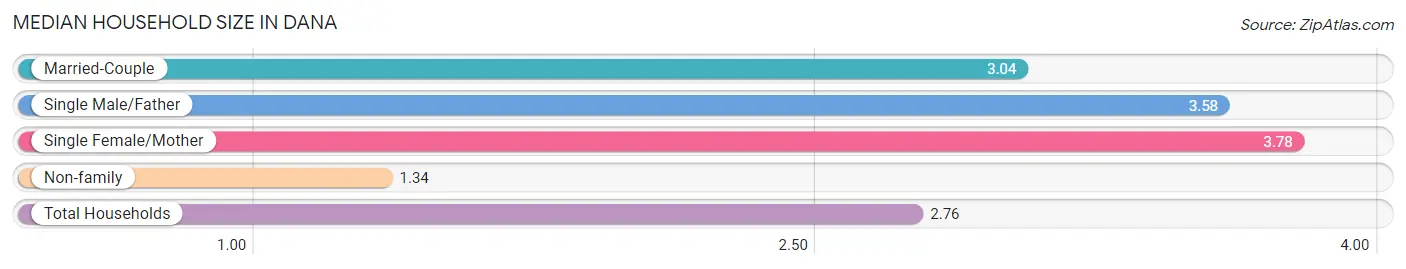
| Household Type | # Households | Household Size |
| Married-Couple | 803 (61.0%) | 3.04 |
| Single Male/Father | 53 (4.0%) | 3.58 |
| Single Female/Mother | 155 (11.8%) | 3.78 |
| Non-family | 305 (23.2%) | 1.34 |
| Total Households | 1,316 (100.0%) | 2.76 |
Household Size by Marriage Status in Dana
Out of a total of 1,316 households in Dana, 1,011 (76.8%) are family households, while 305 (23.2%) are nonfamily households. The most numerous type of family households are 2-person households, comprising 490, and the most common type of nonfamily households are 1-person households, comprising 273.
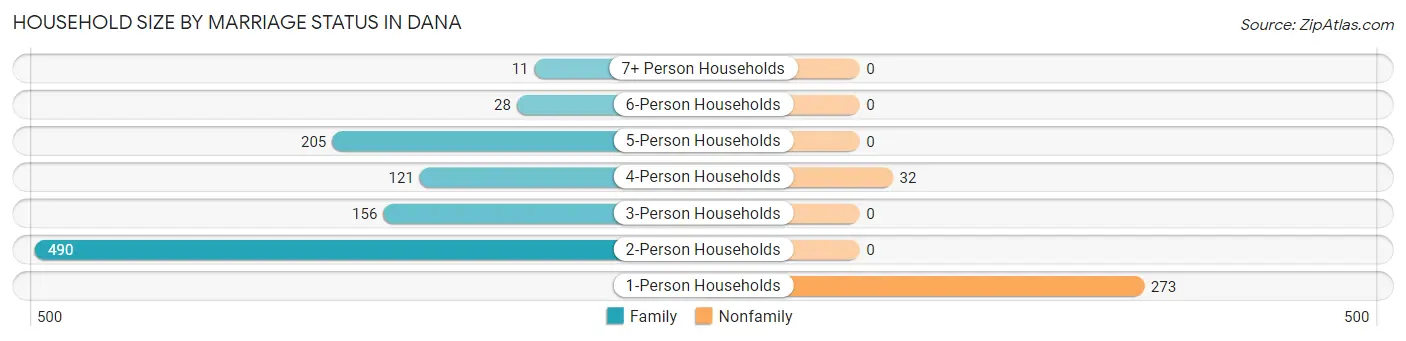
| Household Size | Family Households | Nonfamily Households |
| 1-Person Households | - | 273 (20.7%) |
| 2-Person Households | 490 (37.2%) | 0 (0.0%) |
| 3-Person Households | 156 (11.8%) | 0 (0.0%) |
| 4-Person Households | 121 (9.2%) | 32 (2.4%) |
| 5-Person Households | 205 (15.6%) | 0 (0.0%) |
| 6-Person Households | 28 (2.1%) | 0 (0.0%) |
| 7+ Person Households | 11 (0.8%) | 0 (0.0%) |
| Total | 1,011 (76.8%) | 305 (23.2%) |
Female Fertility in Dana
Fertility by Age in Dana
Average fertility rate in Dana is 143.0 births per 1,000 women. Women in the age bracket of 20 to 34 years have the highest fertility rate with 293.0 births per 1,000 women. Women in the age bracket of 35 to 50 years acount for 59.3% of all women with births.
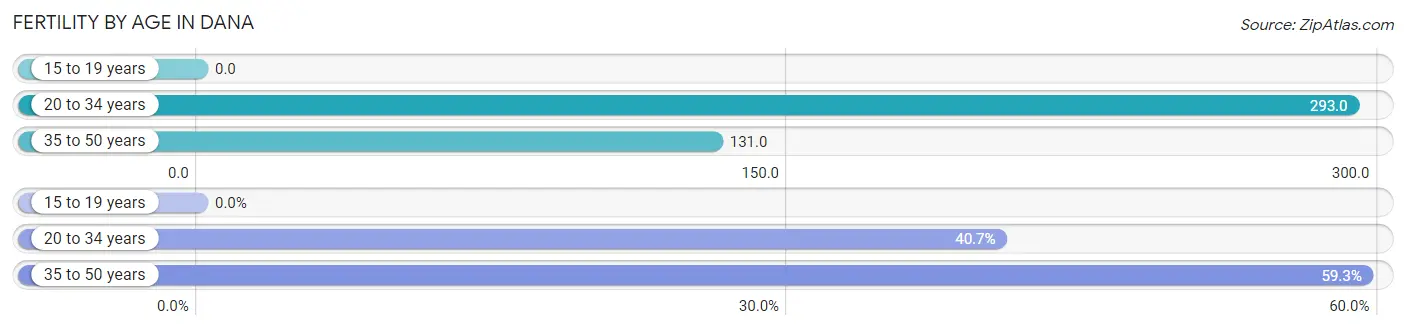
| Age Bracket | Women with Births | Births / 1,000 Women |
| 15 to 19 years | 0 (0.0%) | 0.0 |
| 20 to 34 years | 48 (40.7%) | 293.0 |
| 35 to 50 years | 70 (59.3%) | 131.0 |
| Total | 118 (100.0%) | 143.0 |
Fertility by Age by Marriage Status in Dana
40.7% of women with births (118) in Dana are married. The highest percentage of unmarried women with births falls into 35 to 50 years age bracket with 100.0% of them unmarried at the time of birth, while the lowest percentage of unmarried women with births belong to 20 to 34 years age bracket with 0.0% of them unmarried.
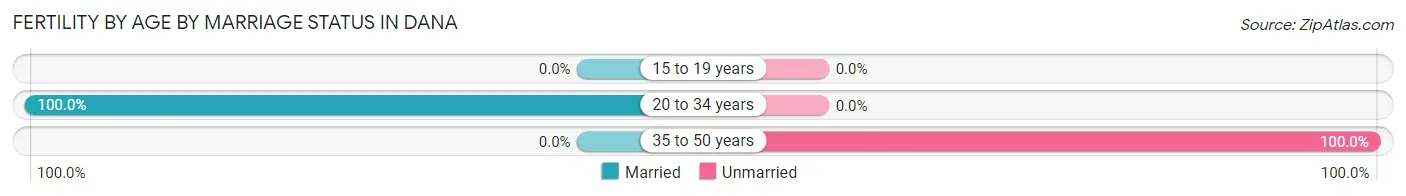
| Age Bracket | Married | Unmarried |
| 15 to 19 years | 0 (0.0%) | 0 (0.0%) |
| 20 to 34 years | 48 (100.0%) | 0 (0.0%) |
| 35 to 50 years | 0 (0.0%) | 70 (100.0%) |
| Total | 48 (40.7%) | 70 (59.3%) |
Fertility by Education in Dana
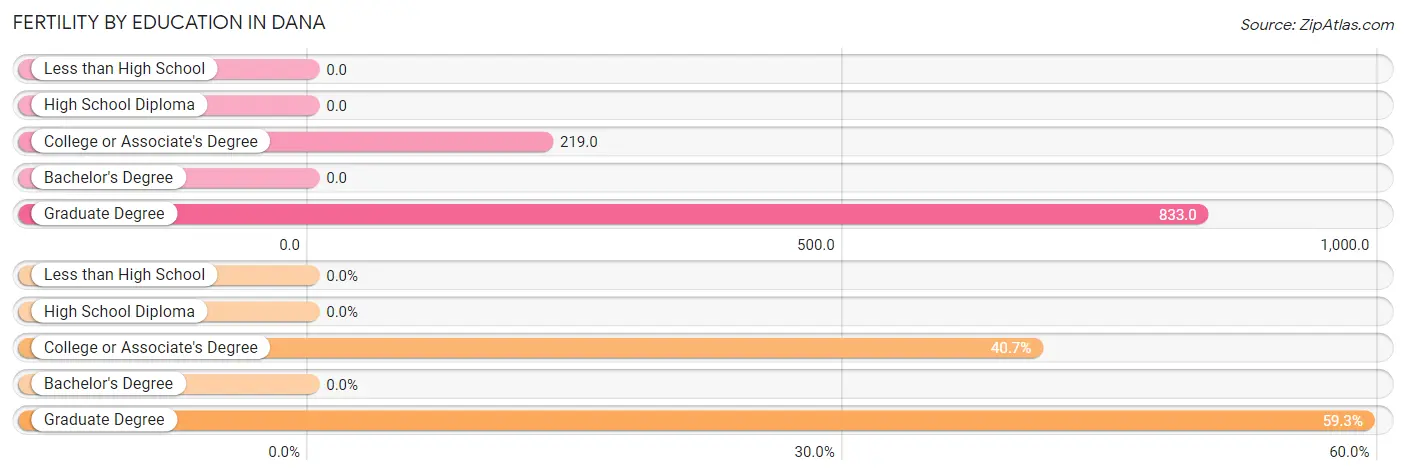
| Educational Attainment | Women with Births | Births / 1,000 Women |
| Less than High School | 0 (0.0%) | 0.0 |
| High School Diploma | 0 (0.0%) | 0.0 |
| College or Associate's Degree | 48 (40.7%) | 219.0 |
| Bachelor's Degree | 0 (0.0%) | 0.0 |
| Graduate Degree | 70 (59.3%) | 833.0 |
| Total | 118 (100.0%) | 143.0 |
Fertility by Education by Marriage Status in Dana
59.3% of women with births in Dana are unmarried. Women with the educational attainment of college or associate's degree are most likely to be married with 100.0% of them married at childbirth, while women with the educational attainment of graduate degree are least likely to be married with 100.0% of them unmarried at childbirth.
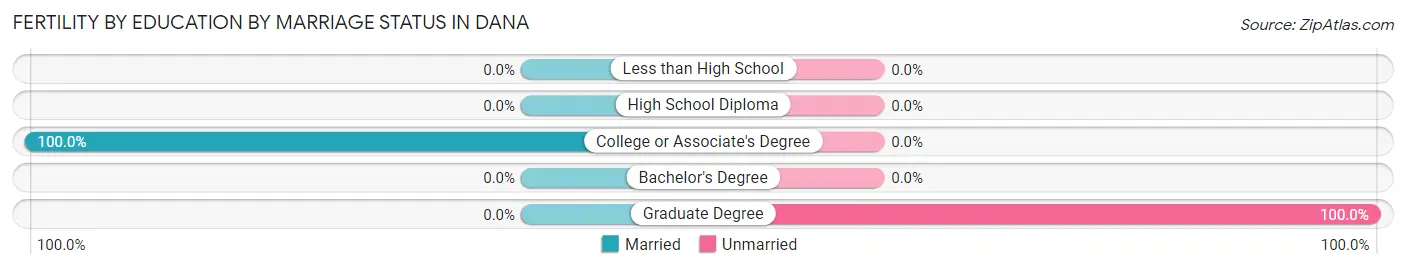
| Educational Attainment | Married | Unmarried |
| Less than High School | 0 (0.0%) | 0 (0.0%) |
| High School Diploma | 0 (0.0%) | 0 (0.0%) |
| College or Associate's Degree | 48 (100.0%) | 0 (0.0%) |
| Bachelor's Degree | 0 (0.0%) | 0 (0.0%) |
| Graduate Degree | 0 (0.0%) | 70 (100.0%) |
| Total | 48 (40.7%) | 70 (59.3%) |
Employment Characteristics in Dana
Employment by Class of Employer in Dana
Among the 1,454 employed individuals in Dana, private company employees (921 | 63.3%), self-employed (not incorporated) (211 | 14.5%), and self-employed (incorporated) (206 | 14.2%) make up the most common classes of employment.
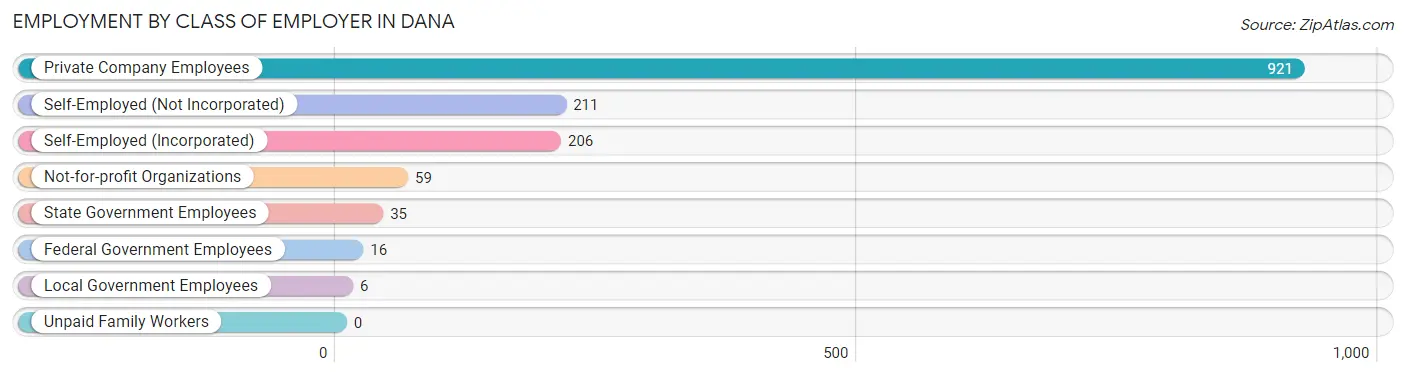
| Employer Class | # Employees | % Employees |
| Private Company Employees | 921 | 63.3% |
| Self-Employed (Incorporated) | 206 | 14.2% |
| Self-Employed (Not Incorporated) | 211 | 14.5% |
| Not-for-profit Organizations | 59 | 4.1% |
| Local Government Employees | 6 | 0.4% |
| State Government Employees | 35 | 2.4% |
| Federal Government Employees | 16 | 1.1% |
| Unpaid Family Workers | 0 | 0.0% |
| Total | 1,454 | 100.0% |
Employment Status by Age in Dana
According to the labor force statistics for Dana, out of the total population over 16 years of age (2,703), 58.9% or 1,592 individuals are in the labor force, with 6.5% or 103 of them unemployed. The age group with the highest labor force participation rate is 55 to 59 years, with 100.0% or 46 individuals in the labor force. Within the labor force, the 45 to 54 years age range has the highest percentage of unemployed individuals, with 15.0% or 60 of them being unemployed.
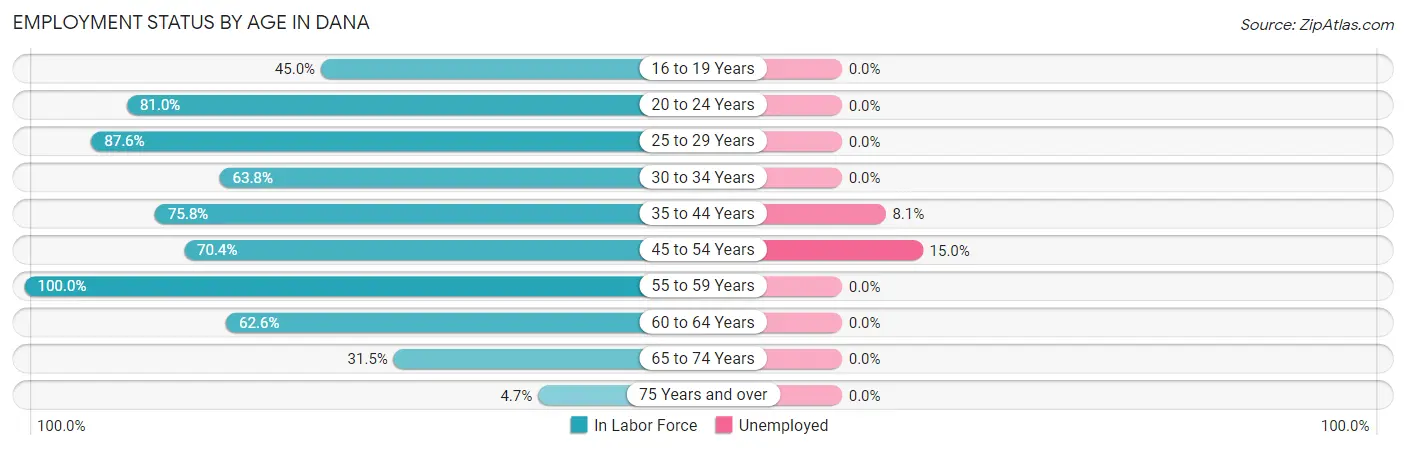
| Age Bracket | In Labor Force | Unemployed |
| 16 to 19 Years | 68 (45.0%) | 0 (0.0%) |
| 20 to 24 Years | 81 (81.0%) | 0 (0.0%) |
| 25 to 29 Years | 78 (87.6%) | 0 (0.0%) |
| 30 to 34 Years | 90 (63.8%) | 0 (0.0%) |
| 35 to 44 Years | 528 (75.8%) | 43 (8.1%) |
| 45 to 54 Years | 401 (70.4%) | 60 (15.0%) |
| 55 to 59 Years | 46 (100.0%) | 0 (0.0%) |
| 60 to 64 Years | 139 (62.6%) | 0 (0.0%) |
| 65 to 74 Years | 150 (31.5%) | 0 (0.0%) |
| 75 Years and over | 10 (4.7%) | 0 (0.0%) |
| Total | 1,592 (58.9%) | 103 (6.5%) |
Employment Status by Educational Attainment in Dana
According to labor force statistics for Dana, 72.6% of individuals (1,281) out of the total population between 25 and 64 years of age (1,765) are in the labor force, with 8.0% or 102 of them being unemployed. The group with the highest labor force participation rate are those with the educational attainment of college / associate degree, with 82.0% or 450 individuals in the labor force. Within the labor force, individuals with college / associate degree education have the highest percentage of unemployment, with 16.9% or 76 of them being unemployed.
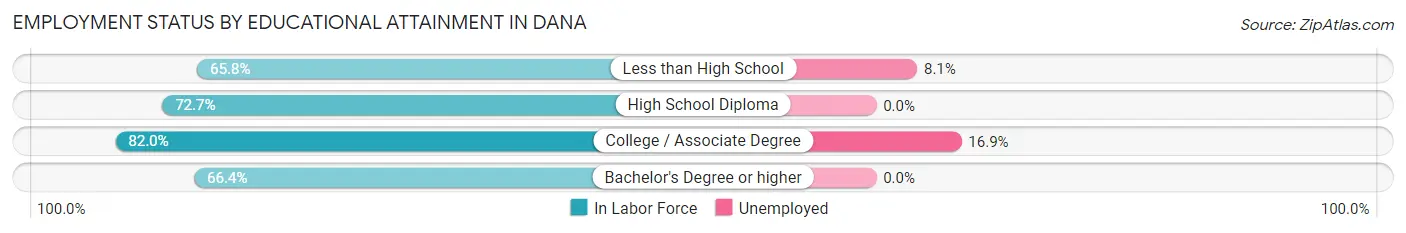
| Educational Attainment | In Labor Force | Unemployed |
| Less than High School | 333 (65.8%) | 41 (8.1%) |
| High School Diploma | 319 (72.7%) | 0 (0.0%) |
| College / Associate Degree | 450 (82.0%) | 93 (16.9%) |
| Bachelor's Degree or higher | 180 (66.4%) | 0 (0.0%) |
| Total | 1,281 (72.6%) | 141 (8.0%) |
Employment Occupations by Sex in Dana
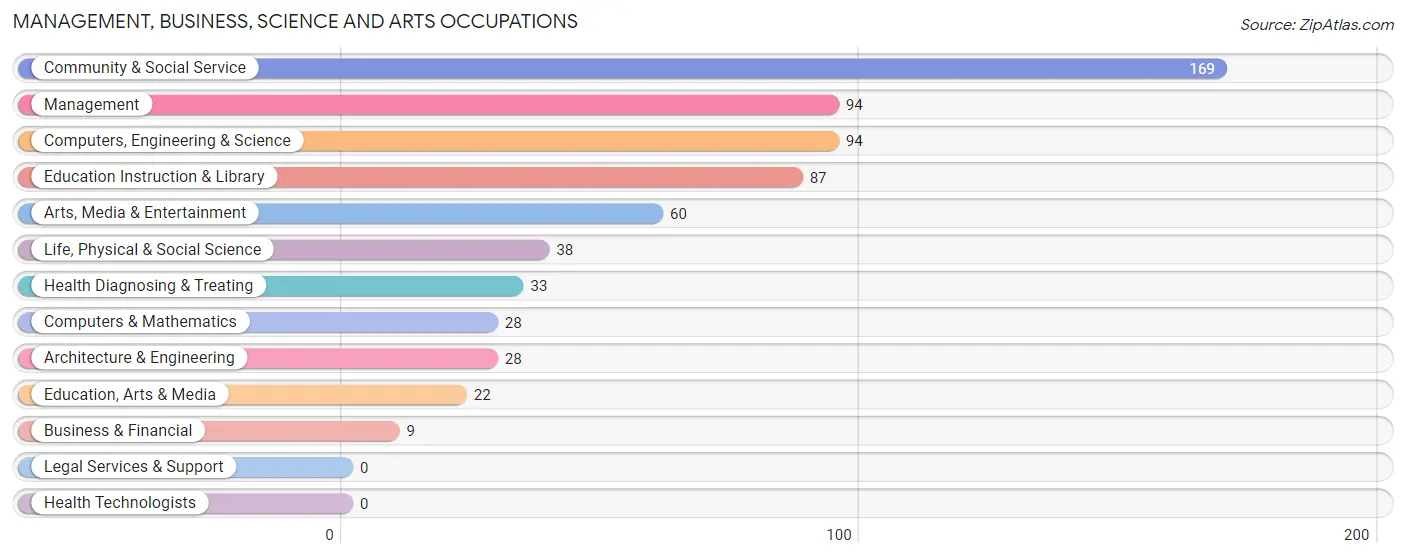
Management, Business, Science and Arts Occupations
The most common Management, Business, Science and Arts occupations in Dana are Community & Social Service (169 | 11.4%), Management (94 | 6.3%), Computers, Engineering & Science (94 | 6.3%), Education Instruction & Library (87 | 5.9%), and Arts, Media & Entertainment (60 | 4.0%).
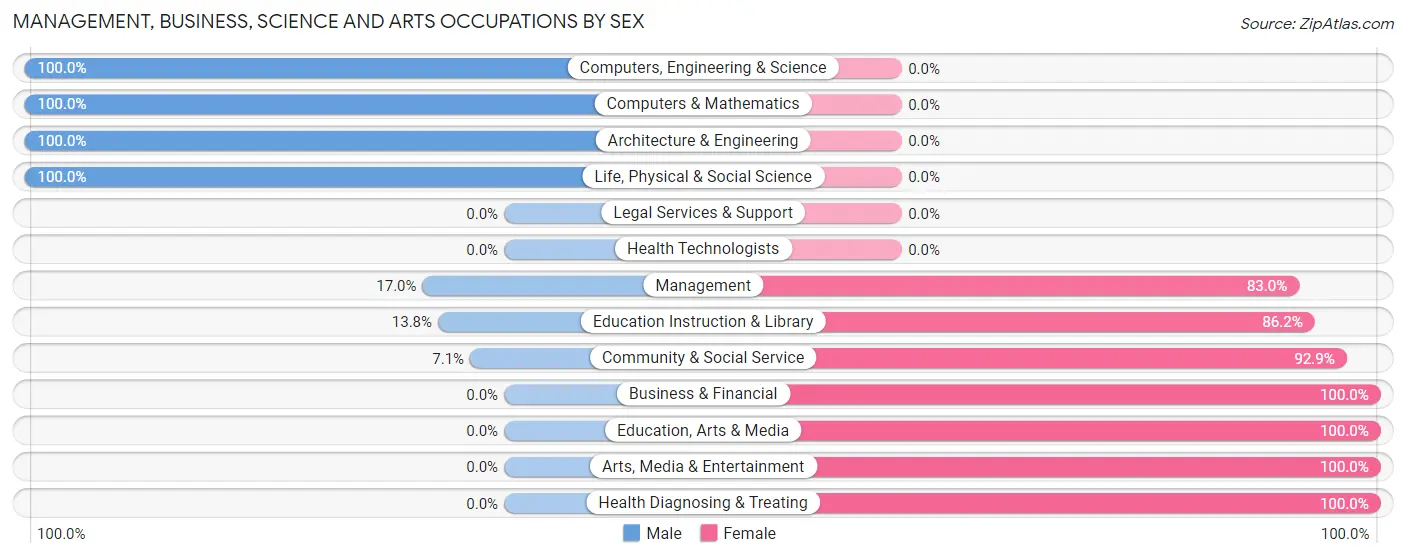
Management, Business, Science and Arts Occupations by Sex
Within the Management, Business, Science and Arts occupations in Dana, the most male-oriented occupations are Computers, Engineering & Science (100.0%), Computers & Mathematics (100.0%), and Architecture & Engineering (100.0%), while the most female-oriented occupations are Business & Financial (100.0%), Education, Arts & Media (100.0%), and Arts, Media & Entertainment (100.0%).
| Occupation | Male | Female |
| Management | 16 (17.0%) | 78 (83.0%) |
| Business & Financial | 0 (0.0%) | 9 (100.0%) |
| Computers, Engineering & Science | 94 (100.0%) | 0 (0.0%) |
| Computers & Mathematics | 28 (100.0%) | 0 (0.0%) |
| Architecture & Engineering | 28 (100.0%) | 0 (0.0%) |
| Life, Physical & Social Science | 38 (100.0%) | 0 (0.0%) |
| Community & Social Service | 12 (7.1%) | 157 (92.9%) |
| Education, Arts & Media | 0 (0.0%) | 22 (100.0%) |
| Legal Services & Support | 0 (0.0%) | 0 (0.0%) |
| Education Instruction & Library | 12 (13.8%) | 75 (86.2%) |
| Arts, Media & Entertainment | 0 (0.0%) | 60 (100.0%) |
| Health Diagnosing & Treating | 0 (0.0%) | 33 (100.0%) |
| Health Technologists | 0 (0.0%) | 0 (0.0%) |
| Total (Category) | 122 (30.6%) | 277 (69.4%) |
| Total (Overall) | 838 (56.3%) | 650 (43.7%) |
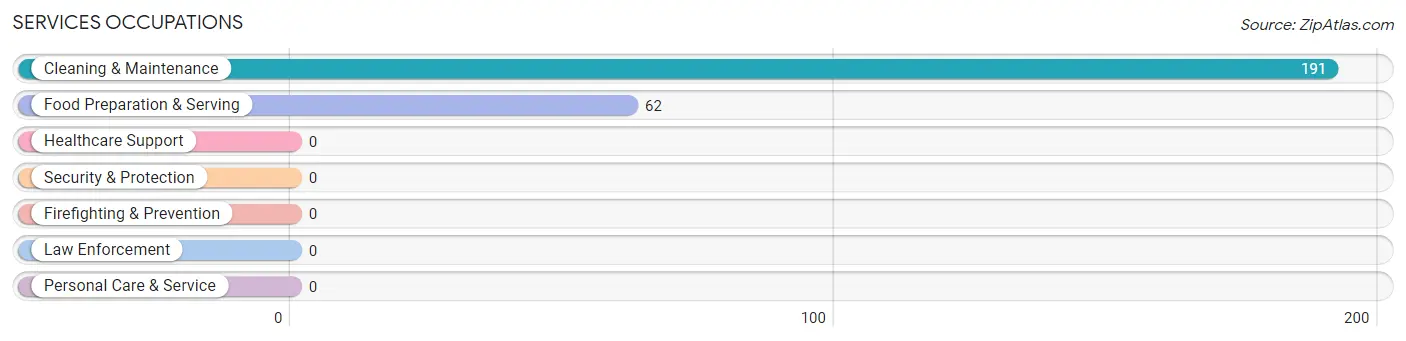
Services Occupations
The most common Services occupations in Dana are Cleaning & Maintenance (191 | 12.8%), and Food Preparation & Serving (62 | 4.2%).
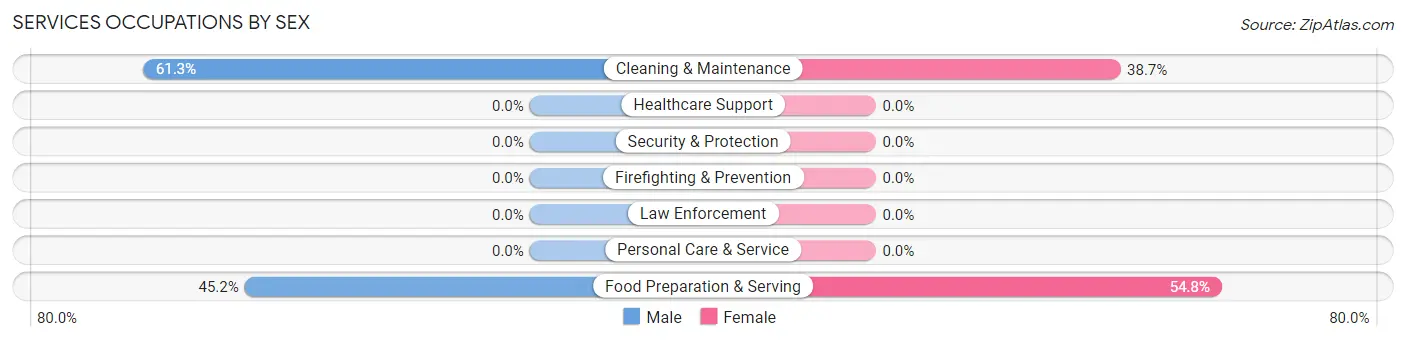
Services Occupations by Sex
Within the Services occupations in Dana, the most male-oriented occupations are Cleaning & Maintenance (61.3%), and Food Preparation & Serving (45.2%), while the most female-oriented occupations are Food Preparation & Serving (54.8%), and Cleaning & Maintenance (38.7%).
| Occupation | Male | Female |
| Healthcare Support | 0 (0.0%) | 0 (0.0%) |
| Security & Protection | 0 (0.0%) | 0 (0.0%) |
| Firefighting & Prevention | 0 (0.0%) | 0 (0.0%) |
| Law Enforcement | 0 (0.0%) | 0 (0.0%) |
| Food Preparation & Serving | 28 (45.2%) | 34 (54.8%) |
| Cleaning & Maintenance | 117 (61.3%) | 74 (38.7%) |
| Personal Care & Service | 0 (0.0%) | 0 (0.0%) |
| Total (Category) | 145 (57.3%) | 108 (42.7%) |
| Total (Overall) | 838 (56.3%) | 650 (43.7%) |
Sales and Office Occupations
The most common Sales and Office occupations in Dana are Office & Administration (137 | 9.2%), and Sales & Related (107 | 7.2%).

Sales and Office Occupations by Sex
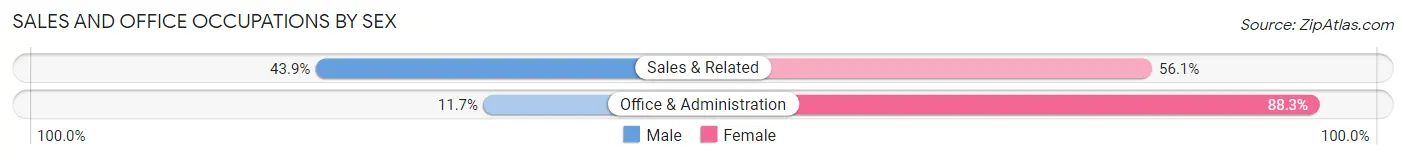
| Occupation | Male | Female |
| Sales & Related | 47 (43.9%) | 60 (56.1%) |
| Office & Administration | 16 (11.7%) | 121 (88.3%) |
| Total (Category) | 63 (25.8%) | 181 (74.2%) |
| Total (Overall) | 838 (56.3%) | 650 (43.7%) |
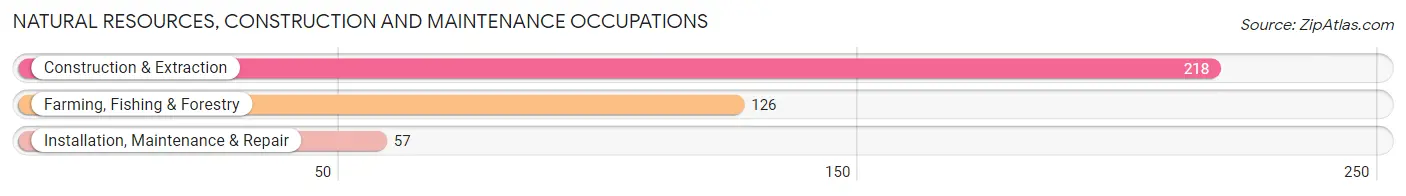
Natural Resources, Construction and Maintenance Occupations
The most common Natural Resources, Construction and Maintenance occupations in Dana are Construction & Extraction (218 | 14.6%), Farming, Fishing & Forestry (126 | 8.5%), and Installation, Maintenance & Repair (57 | 3.8%).
Natural Resources, Construction and Maintenance Occupations by Sex
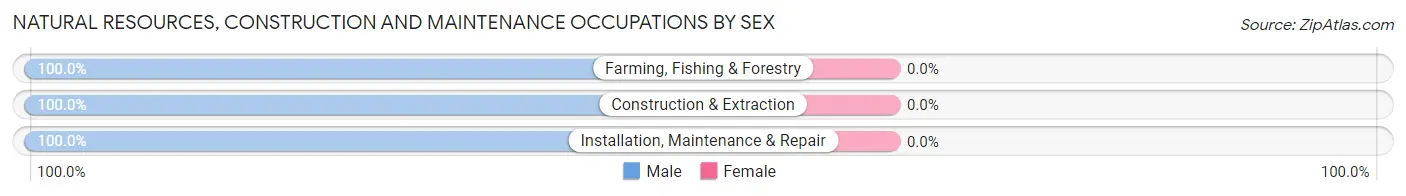
| Occupation | Male | Female |
| Farming, Fishing & Forestry | 126 (100.0%) | 0 (0.0%) |
| Construction & Extraction | 218 (100.0%) | 0 (0.0%) |
| Installation, Maintenance & Repair | 57 (100.0%) | 0 (0.0%) |
| Total (Category) | 401 (100.0%) | 0 (0.0%) |
| Total (Overall) | 838 (56.3%) | 650 (43.7%) |
Production, Transportation and Moving Occupations
The most common Production, Transportation and Moving occupations in Dana are Production (83 | 5.6%), Material Moving (76 | 5.1%), and Transportation (32 | 2.1%).
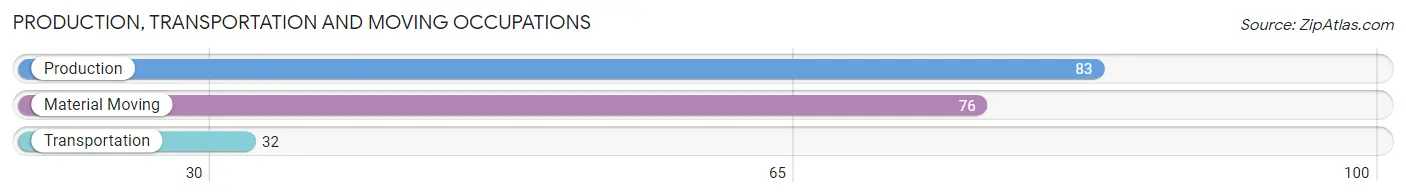
Production, Transportation and Moving Occupations by Sex
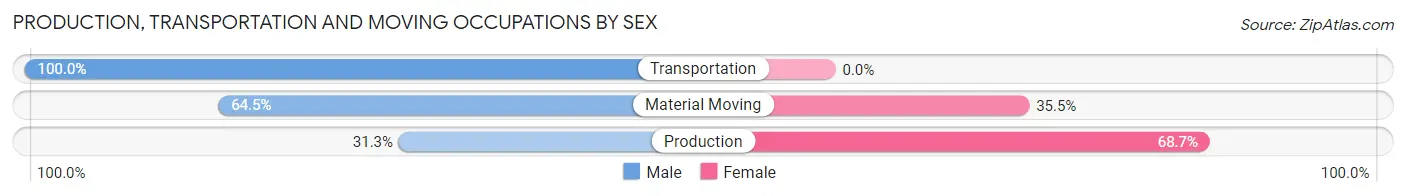
| Occupation | Male | Female |
| Production | 26 (31.3%) | 57 (68.7%) |
| Transportation | 32 (100.0%) | 0 (0.0%) |
| Material Moving | 49 (64.5%) | 27 (35.5%) |
| Total (Category) | 107 (56.0%) | 84 (44.0%) |
| Total (Overall) | 838 (56.3%) | 650 (43.7%) |
Employment Industries by Sex in Dana
Employment Industries in Dana
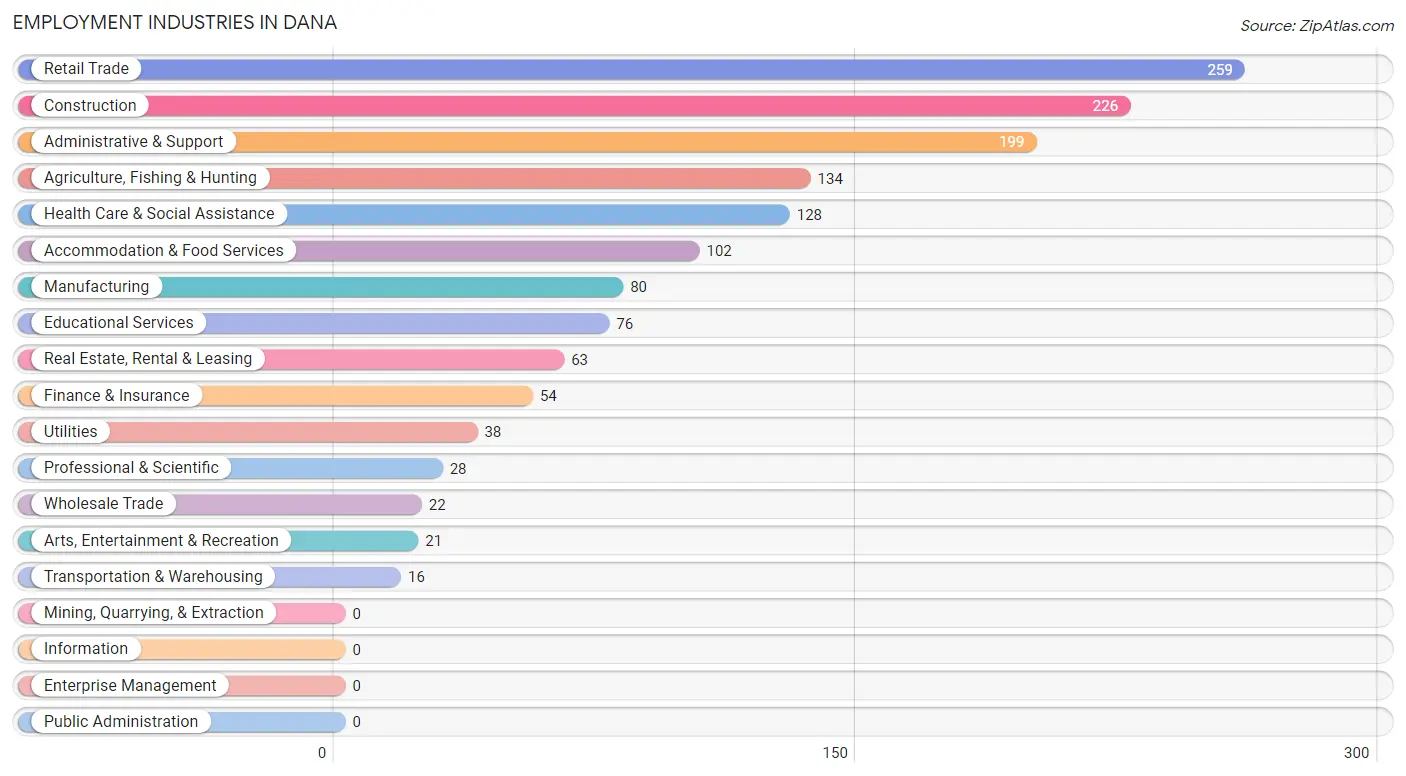
The major employment industries in Dana include Retail Trade (259 | 17.4%), Construction (226 | 15.2%), Administrative & Support (199 | 13.4%), Agriculture, Fishing & Hunting (134 | 9.0%), and Health Care & Social Assistance (128 | 8.6%).
Employment Industries by Sex in Dana
The Dana industries that see more men than women are Wholesale Trade (100.0%), Transportation & Warehousing (100.0%), and Utilities (100.0%), whereas the industries that tend to have a higher number of women are Finance & Insurance (100.0%), Health Care & Social Assistance (100.0%), and Educational Services (84.2%).
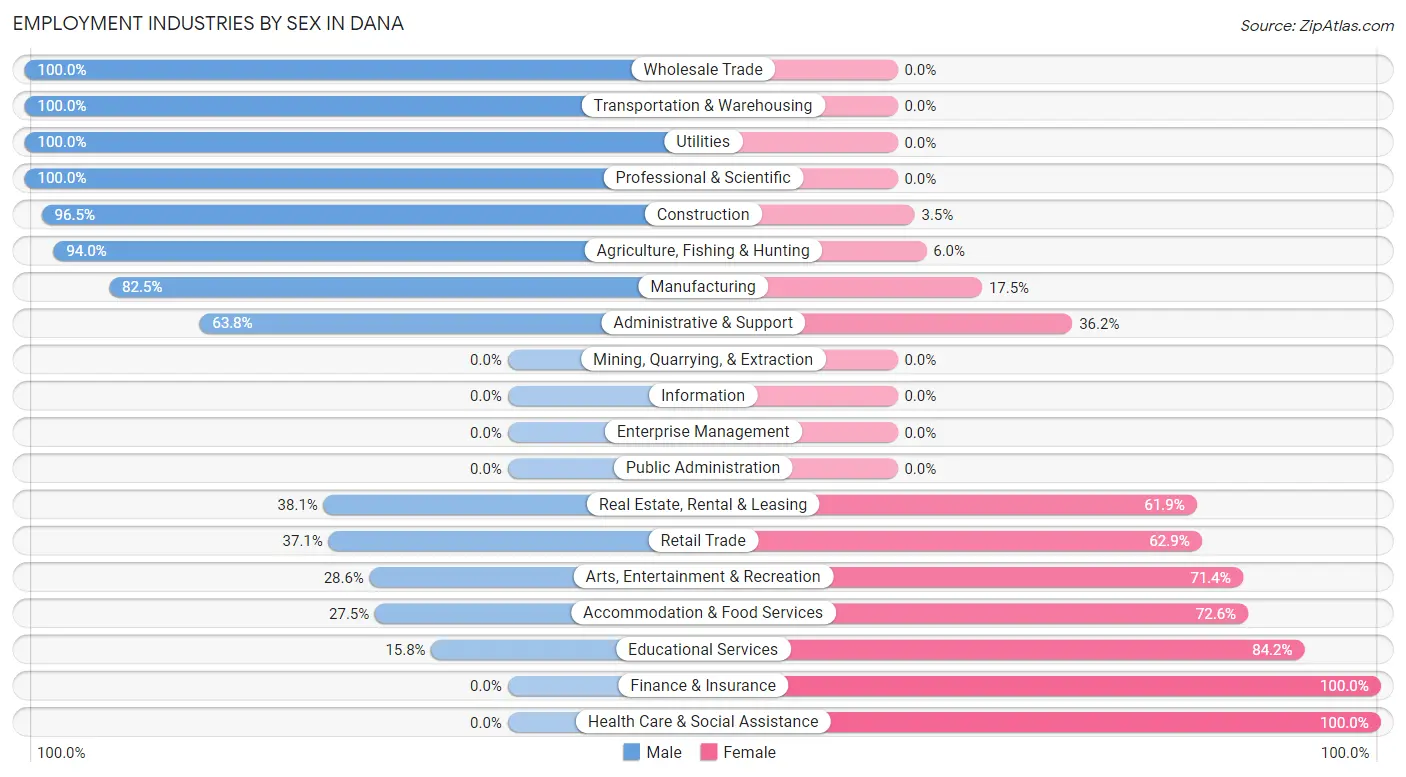
| Industry | Male | Female |
| Agriculture, Fishing & Hunting | 126 (94.0%) | 8 (6.0%) |
| Mining, Quarrying, & Extraction | 0 (0.0%) | 0 (0.0%) |
| Construction | 218 (96.5%) | 8 (3.5%) |
| Manufacturing | 66 (82.5%) | 14 (17.5%) |
| Wholesale Trade | 22 (100.0%) | 0 (0.0%) |
| Retail Trade | 96 (37.1%) | 163 (62.9%) |
| Transportation & Warehousing | 16 (100.0%) | 0 (0.0%) |
| Utilities | 38 (100.0%) | 0 (0.0%) |
| Information | 0 (0.0%) | 0 (0.0%) |
| Finance & Insurance | 0 (0.0%) | 54 (100.0%) |
| Real Estate, Rental & Leasing | 24 (38.1%) | 39 (61.9%) |
| Professional & Scientific | 28 (100.0%) | 0 (0.0%) |
| Enterprise Management | 0 (0.0%) | 0 (0.0%) |
| Administrative & Support | 127 (63.8%) | 72 (36.2%) |
| Educational Services | 12 (15.8%) | 64 (84.2%) |
| Health Care & Social Assistance | 0 (0.0%) | 128 (100.0%) |
| Arts, Entertainment & Recreation | 6 (28.6%) | 15 (71.4%) |
| Accommodation & Food Services | 28 (27.5%) | 74 (72.6%) |
| Public Administration | 0 (0.0%) | 0 (0.0%) |
| Total | 838 (56.3%) | 650 (43.7%) |
Education in Dana
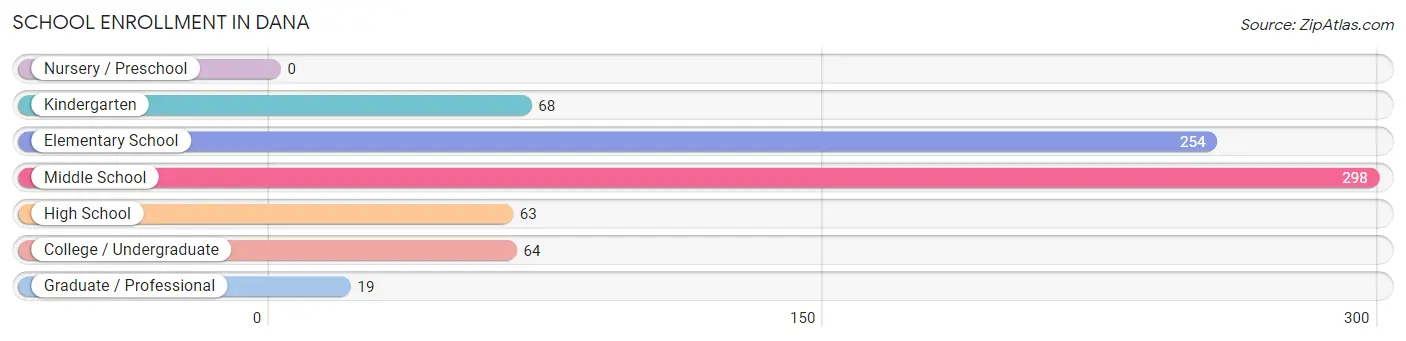
School Enrollment in Dana
The most common levels of schooling among the 766 students in Dana are middle school (298 | 38.9%), elementary school (254 | 33.2%), and kindergarten (68 | 8.9%).
| School Level | # Students | % Students |
| Nursery / Preschool | 0 | 0.0% |
| Kindergarten | 68 | 8.9% |
| Elementary School | 254 | 33.2% |
| Middle School | 298 | 38.9% |
| High School | 63 | 8.2% |
| College / Undergraduate | 64 | 8.4% |
| Graduate / Professional | 19 | 2.5% |
| Total | 766 | 100.0% |
School Enrollment by Age by Funding Source in Dana
Out of a total of 766 students who are enrolled in schools in Dana, 108 (14.1%) attend a private institution, while the remaining 658 (85.9%) are enrolled in public schools. The age group of 35 years and over has the highest likelihood of being enrolled in private schools, with 20 (55.6% in the age bracket) enrolled. Conversely, the age group of 5 to 9 year old has the lowest likelihood of being enrolled in a private school, with 275 (100.0% in the age bracket) attending a public institution.
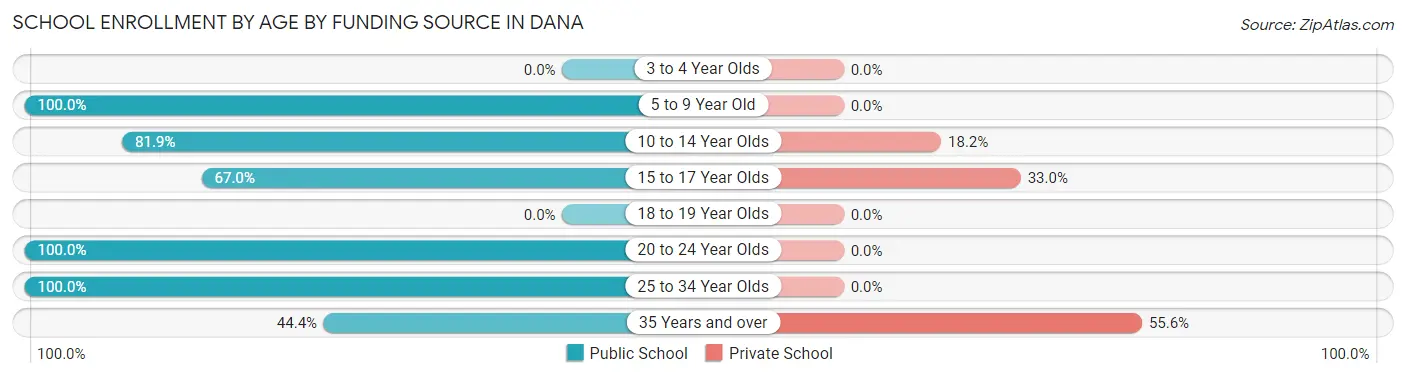
| Age Bracket | Public School | Private School |
| 3 to 4 Year Olds | 0 (0.0%) | 0 (0.0%) |
| 5 to 9 Year Old | 275 (100.0%) | 0 (0.0%) |
| 10 to 14 Year Olds | 257 (81.9%) | 57 (18.1%) |
| 15 to 17 Year Olds | 63 (67.0%) | 31 (33.0%) |
| 18 to 19 Year Olds | 0 (0.0%) | 0 (0.0%) |
| 20 to 24 Year Olds | 19 (100.0%) | 0 (0.0%) |
| 25 to 34 Year Olds | 28 (100.0%) | 0 (0.0%) |
| 35 Years and over | 16 (44.4%) | 20 (55.6%) |
| Total | 658 (85.9%) | 108 (14.1%) |
Educational Attainment by Field of Study in Dana
Business (147 | 32.0%), science & technology (141 | 30.7%), education (51 | 11.1%), physical & health sciences (28 | 6.1%), and social sciences (23 | 5.0%) are the most common fields of study among 459 individuals in Dana who have obtained a bachelor's degree or higher.
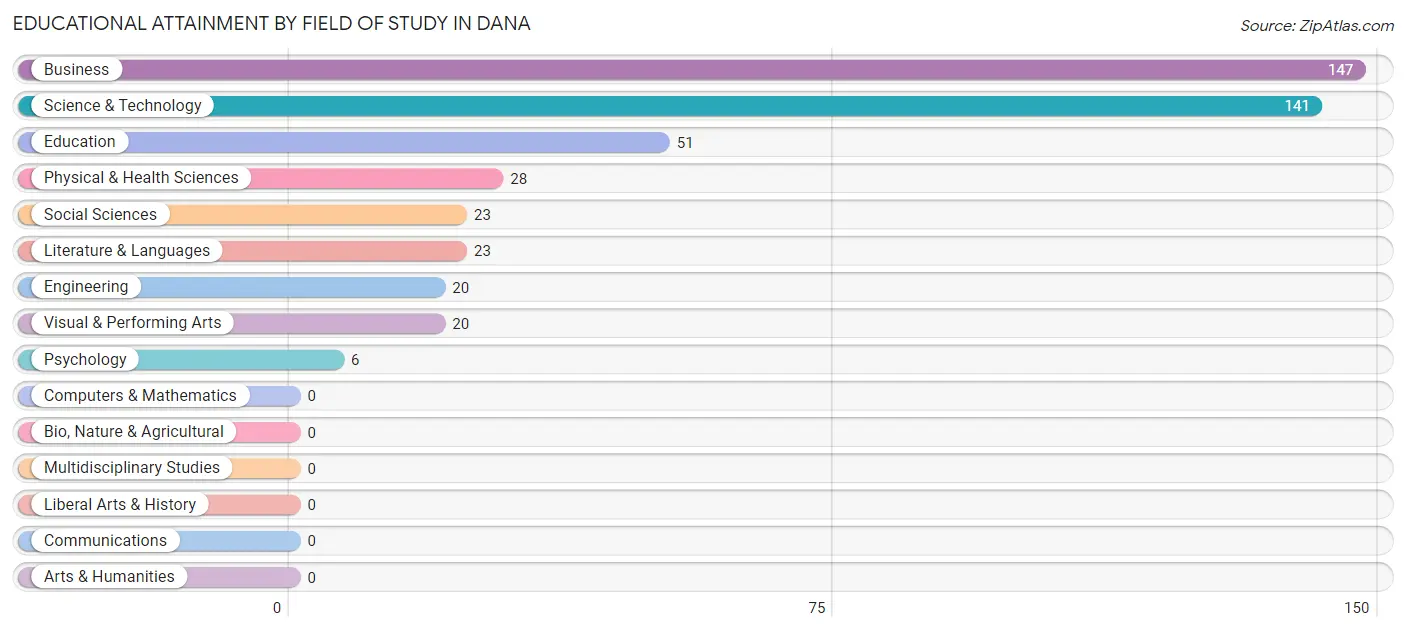
| Field of Study | # Graduates | % Graduates |
| Computers & Mathematics | 0 | 0.0% |
| Bio, Nature & Agricultural | 0 | 0.0% |
| Physical & Health Sciences | 28 | 6.1% |
| Psychology | 6 | 1.3% |
| Social Sciences | 23 | 5.0% |
| Engineering | 20 | 4.4% |
| Multidisciplinary Studies | 0 | 0.0% |
| Science & Technology | 141 | 30.7% |
| Business | 147 | 32.0% |
| Education | 51 | 11.1% |
| Literature & Languages | 23 | 5.0% |
| Liberal Arts & History | 0 | 0.0% |
| Visual & Performing Arts | 20 | 4.4% |
| Communications | 0 | 0.0% |
| Arts & Humanities | 0 | 0.0% |
| Total | 459 | 100.0% |
Transportation & Commute in Dana
Vehicle Availability by Sex in Dana
The most prevalent vehicle ownership categories in Dana are males with 3 vehicles (365, accounting for 44.6%) and females with 3 vehicles (195, making up 57.4%).
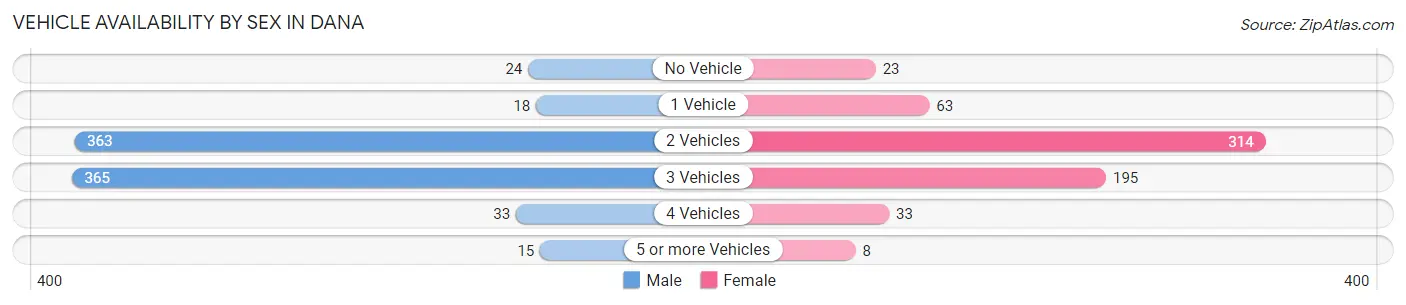
| Vehicles Available | Male | Female |
| No Vehicle | 24 (2.9%) | 23 (3.6%) |
| 1 Vehicle | 18 (2.2%) | 63 (9.9%) |
| 2 Vehicles | 363 (44.4%) | 314 (49.4%) |
| 3 Vehicles | 365 (44.6%) | 195 (30.7%) |
| 4 Vehicles | 33 (4.0%) | 33 (5.2%) |
| 5 or more Vehicles | 15 (1.8%) | 8 (1.3%) |
| Total | 818 (100.0%) | 636 (100.0%) |
Commute Time in Dana
The most frequently occuring commute durations in Dana are 15 to 19 minutes (459 commuters, 34.8%), 20 to 24 minutes (294 commuters, 22.3%), and 10 to 14 minutes (184 commuters, 14.0%).
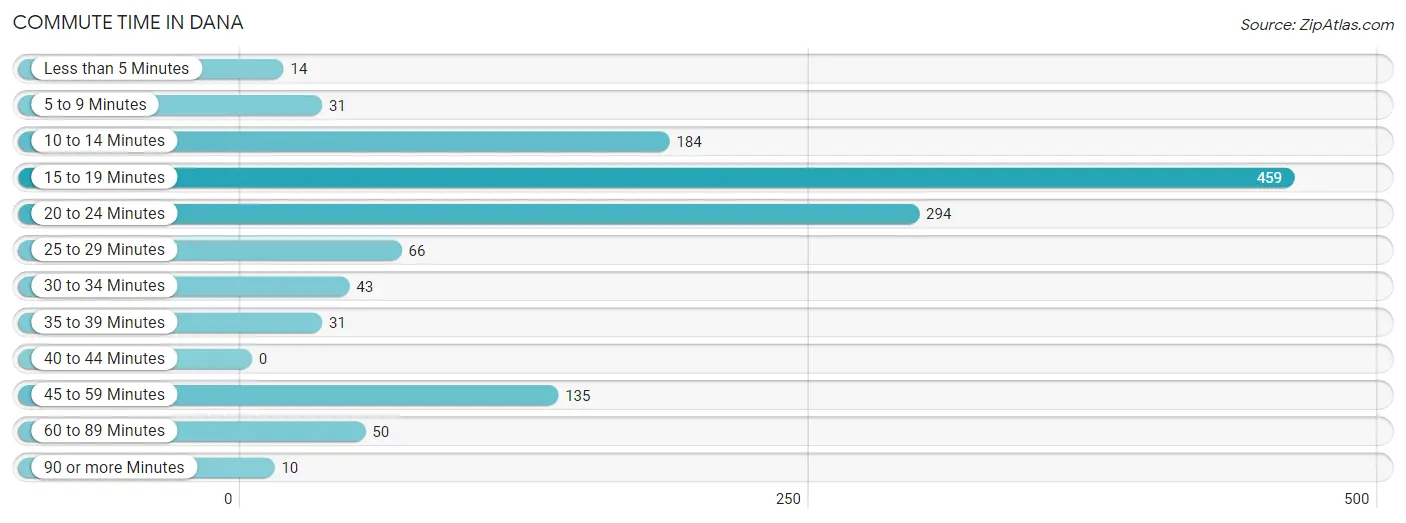
| Commute Time | # Commuters | % Commuters |
| Less than 5 Minutes | 14 | 1.1% |
| 5 to 9 Minutes | 31 | 2.4% |
| 10 to 14 Minutes | 184 | 14.0% |
| 15 to 19 Minutes | 459 | 34.8% |
| 20 to 24 Minutes | 294 | 22.3% |
| 25 to 29 Minutes | 66 | 5.0% |
| 30 to 34 Minutes | 43 | 3.3% |
| 35 to 39 Minutes | 31 | 2.4% |
| 40 to 44 Minutes | 0 | 0.0% |
| 45 to 59 Minutes | 135 | 10.2% |
| 60 to 89 Minutes | 50 | 3.8% |
| 90 or more Minutes | 10 | 0.8% |
Commute Time by Sex in Dana
The most common commute times in Dana are 15 to 19 minutes (185 commuters, 23.7%) for males and 15 to 19 minutes (274 commuters, 51.0%) for females.
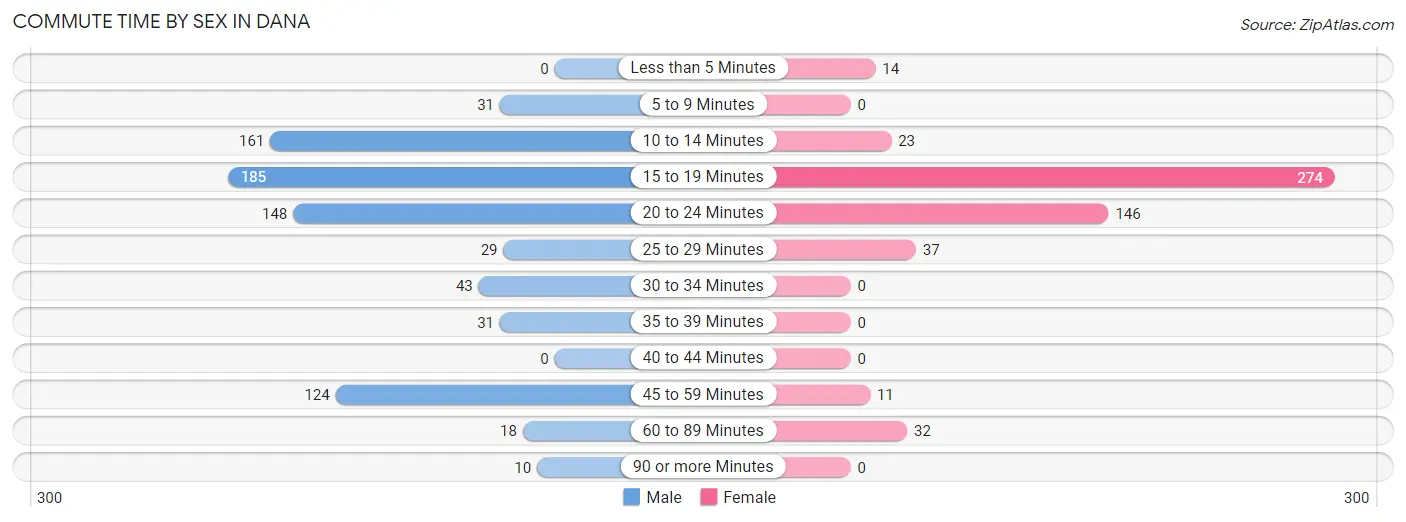
| Commute Time | Male | Female |
| Less than 5 Minutes | 0 (0.0%) | 14 (2.6%) |
| 5 to 9 Minutes | 31 (4.0%) | 0 (0.0%) |
| 10 to 14 Minutes | 161 (20.6%) | 23 (4.3%) |
| 15 to 19 Minutes | 185 (23.7%) | 274 (51.0%) |
| 20 to 24 Minutes | 148 (19.0%) | 146 (27.2%) |
| 25 to 29 Minutes | 29 (3.7%) | 37 (6.9%) |
| 30 to 34 Minutes | 43 (5.5%) | 0 (0.0%) |
| 35 to 39 Minutes | 31 (4.0%) | 0 (0.0%) |
| 40 to 44 Minutes | 0 (0.0%) | 0 (0.0%) |
| 45 to 59 Minutes | 124 (15.9%) | 11 (2.1%) |
| 60 to 89 Minutes | 18 (2.3%) | 32 (6.0%) |
| 90 or more Minutes | 10 (1.3%) | 0 (0.0%) |
Time of Departure to Work by Sex in Dana
The most frequent times of departure to work in Dana are 7:30 AM to 7:59 AM (214, 27.4%) for males and 7:30 AM to 7:59 AM (159, 29.6%) for females.
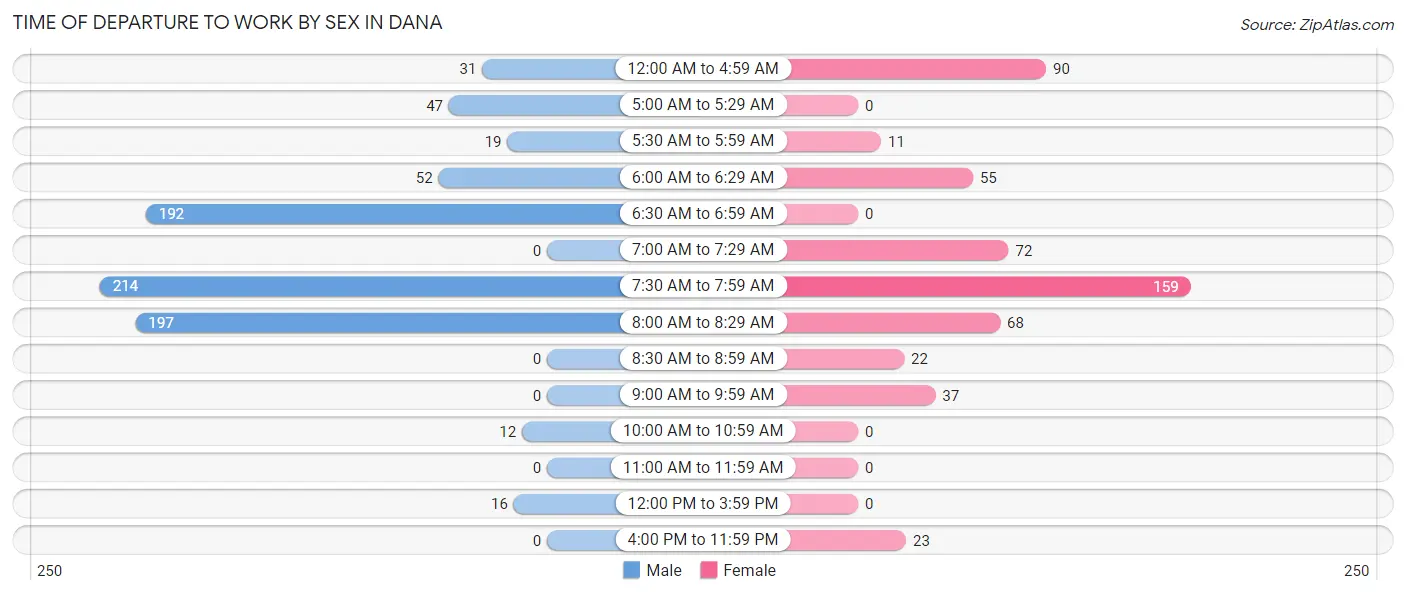
| Time of Departure | Male | Female |
| 12:00 AM to 4:59 AM | 31 (4.0%) | 90 (16.8%) |
| 5:00 AM to 5:29 AM | 47 (6.0%) | 0 (0.0%) |
| 5:30 AM to 5:59 AM | 19 (2.4%) | 11 (2.1%) |
| 6:00 AM to 6:29 AM | 52 (6.7%) | 55 (10.2%) |
| 6:30 AM to 6:59 AM | 192 (24.6%) | 0 (0.0%) |
| 7:00 AM to 7:29 AM | 0 (0.0%) | 72 (13.4%) |
| 7:30 AM to 7:59 AM | 214 (27.4%) | 159 (29.6%) |
| 8:00 AM to 8:29 AM | 197 (25.3%) | 68 (12.7%) |
| 8:30 AM to 8:59 AM | 0 (0.0%) | 22 (4.1%) |
| 9:00 AM to 9:59 AM | 0 (0.0%) | 37 (6.9%) |
| 10:00 AM to 10:59 AM | 12 (1.5%) | 0 (0.0%) |
| 11:00 AM to 11:59 AM | 0 (0.0%) | 0 (0.0%) |
| 12:00 PM to 3:59 PM | 16 (2.1%) | 0 (0.0%) |
| 4:00 PM to 11:59 PM | 0 (0.0%) | 23 (4.3%) |
| Total | 780 (100.0%) | 537 (100.0%) |
Housing Occupancy in Dana
Occupancy by Ownership in Dana
Of the total 1,316 dwellings in Dana, owner-occupied units account for 1,026 (78.0%), while renter-occupied units make up 290 (22.0%).
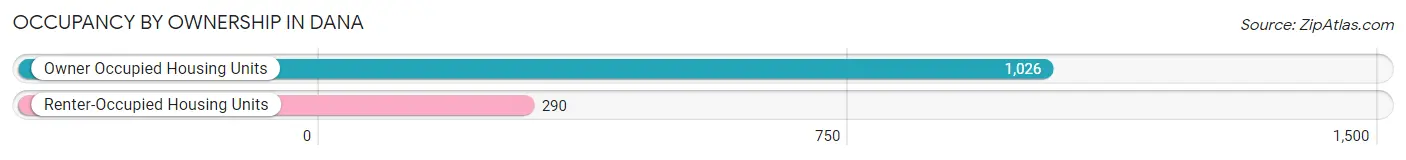
| Occupancy | # Housing Units | % Housing Units |
| Owner Occupied Housing Units | 1,026 | 78.0% |
| Renter-Occupied Housing Units | 290 | 22.0% |
| Total Occupied Housing Units | 1,316 | 100.0% |
Occupancy by Household Size in Dana
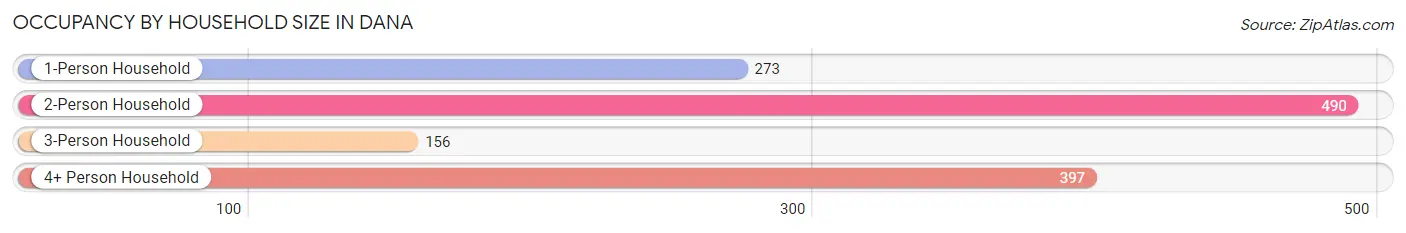
| Household Size | # Housing Units | % Housing Units |
| 1-Person Household | 273 | 20.7% |
| 2-Person Household | 490 | 37.2% |
| 3-Person Household | 156 | 11.8% |
| 4+ Person Household | 397 | 30.2% |
| Total Housing Units | 1,316 | 100.0% |
Occupancy by Ownership by Household Size in Dana
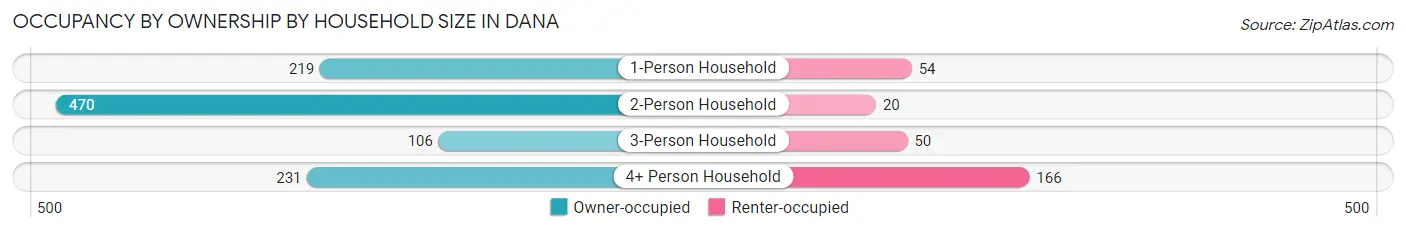
| Household Size | Owner-occupied | Renter-occupied |
| 1-Person Household | 219 (80.2%) | 54 (19.8%) |
| 2-Person Household | 470 (95.9%) | 20 (4.1%) |
| 3-Person Household | 106 (67.9%) | 50 (32.1%) |
| 4+ Person Household | 231 (58.2%) | 166 (41.8%) |
| Total Housing Units | 1,026 (78.0%) | 290 (22.0%) |
Occupancy by Educational Attainment in Dana
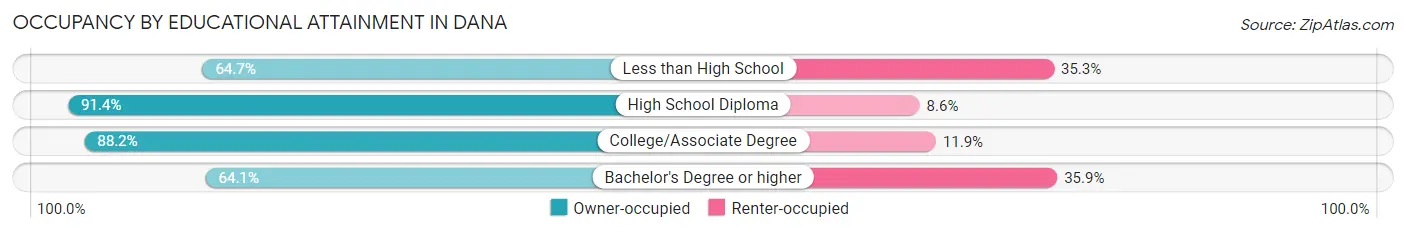
| Household Size | Owner-occupied | Renter-occupied |
| Less than High School | 189 (64.7%) | 103 (35.3%) |
| High School Diploma | 265 (91.4%) | 25 (8.6%) |
| College/Associate Degree | 372 (88.1%) | 50 (11.8%) |
| Bachelor's Degree or higher | 200 (64.1%) | 112 (35.9%) |
Occupancy by Age of Householder in Dana
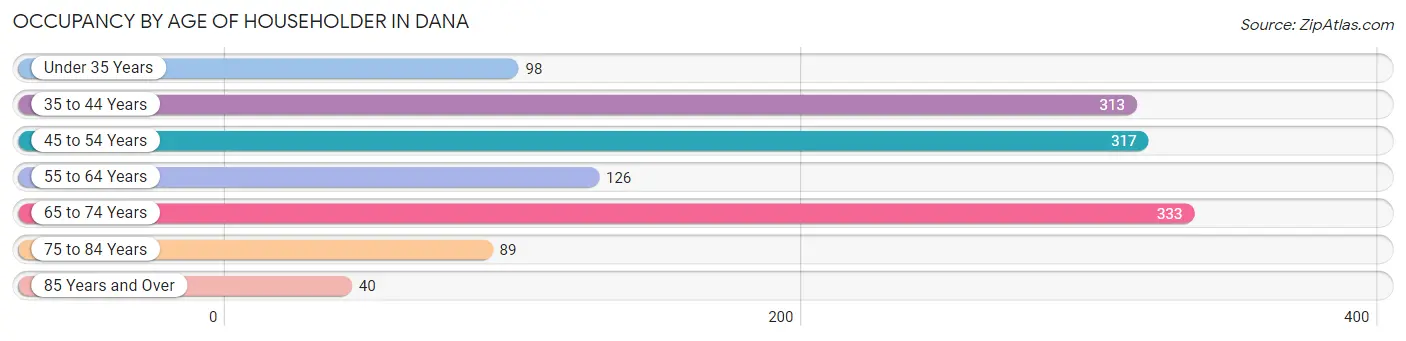
| Age Bracket | # Households | % Households |
| Under 35 Years | 98 | 7.4% |
| 35 to 44 Years | 313 | 23.8% |
| 45 to 54 Years | 317 | 24.1% |
| 55 to 64 Years | 126 | 9.6% |
| 65 to 74 Years | 333 | 25.3% |
| 75 to 84 Years | 89 | 6.8% |
| 85 Years and Over | 40 | 3.0% |
| Total | 1,316 | 100.0% |
Housing Finances in Dana
Median Income by Occupancy in Dana
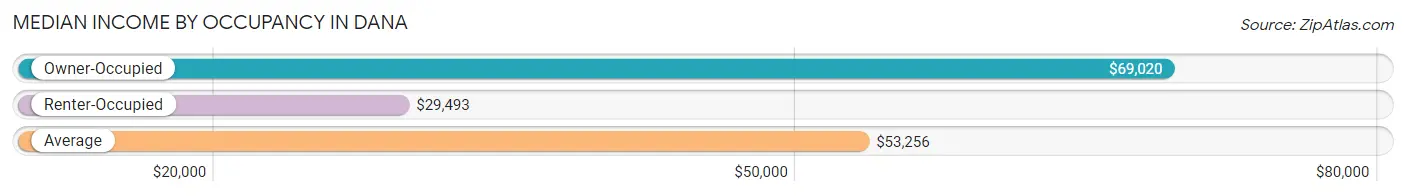
| Occupancy Type | # Households | Median Income |
| Owner-Occupied | 1,026 (78.0%) | $69,020 |
| Renter-Occupied | 290 (22.0%) | $29,493 |
| Average | 1,316 (100.0%) | $53,256 |
Occupancy by Householder Income Bracket in Dana
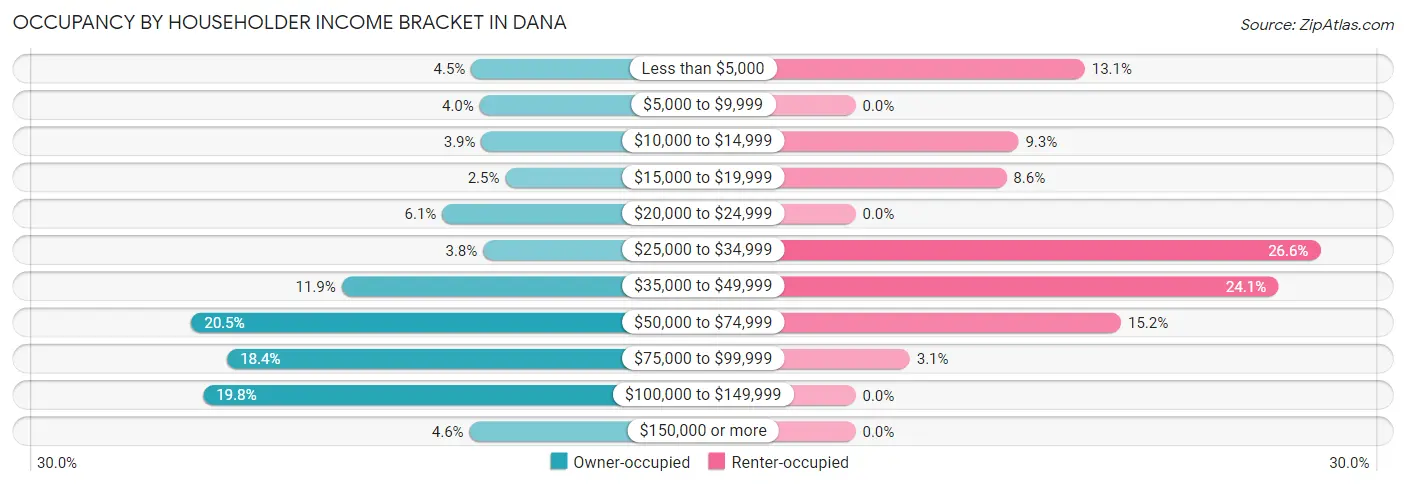
| Income Bracket | Owner-occupied | Renter-occupied |
| Less than $5,000 | 46 (4.5%) | 38 (13.1%) |
| $5,000 to $9,999 | 41 (4.0%) | 0 (0.0%) |
| $10,000 to $14,999 | 40 (3.9%) | 27 (9.3%) |
| $15,000 to $19,999 | 26 (2.5%) | 25 (8.6%) |
| $20,000 to $24,999 | 63 (6.1%) | 0 (0.0%) |
| $25,000 to $34,999 | 39 (3.8%) | 77 (26.6%) |
| $35,000 to $49,999 | 122 (11.9%) | 70 (24.1%) |
| $50,000 to $74,999 | 210 (20.5%) | 44 (15.2%) |
| $75,000 to $99,999 | 189 (18.4%) | 9 (3.1%) |
| $100,000 to $149,999 | 203 (19.8%) | 0 (0.0%) |
| $150,000 or more | 47 (4.6%) | 0 (0.0%) |
| Total | 1,026 (100.0%) | 290 (100.0%) |
Monthly Housing Cost Tiers in Dana
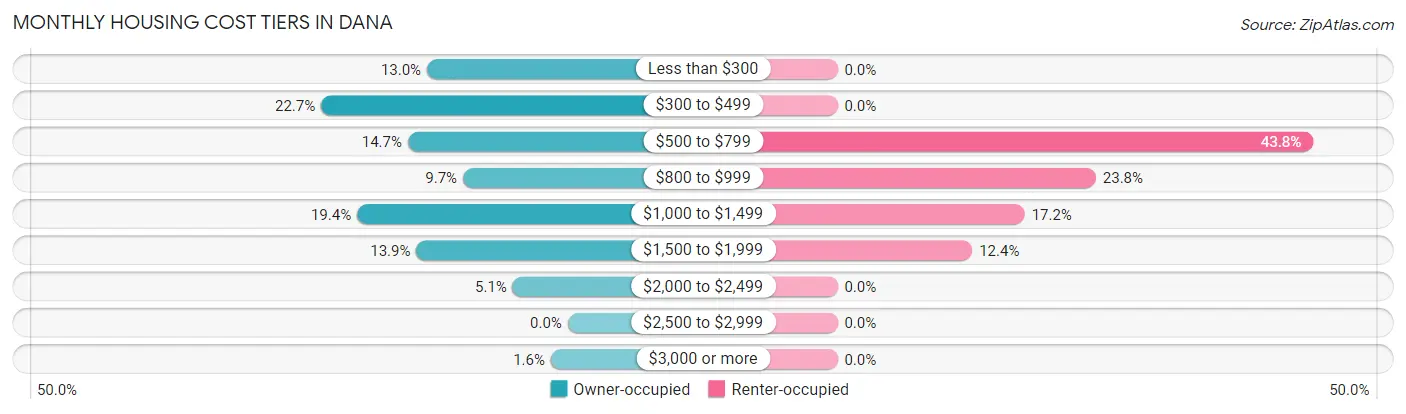
| Monthly Cost | Owner-occupied | Renter-occupied |
| Less than $300 | 133 (13.0%) | 0 (0.0%) |
| $300 to $499 | 233 (22.7%) | 0 (0.0%) |
| $500 to $799 | 151 (14.7%) | 127 (43.8%) |
| $800 to $999 | 99 (9.7%) | 69 (23.8%) |
| $1,000 to $1,499 | 199 (19.4%) | 50 (17.2%) |
| $1,500 to $1,999 | 143 (13.9%) | 36 (12.4%) |
| $2,000 to $2,499 | 52 (5.1%) | 0 (0.0%) |
| $2,500 to $2,999 | 0 (0.0%) | 0 (0.0%) |
| $3,000 or more | 16 (1.6%) | 0 (0.0%) |
| Total | 1,026 (100.0%) | 290 (100.0%) |
Physical Housing Characteristics in Dana
Housing Structures in Dana
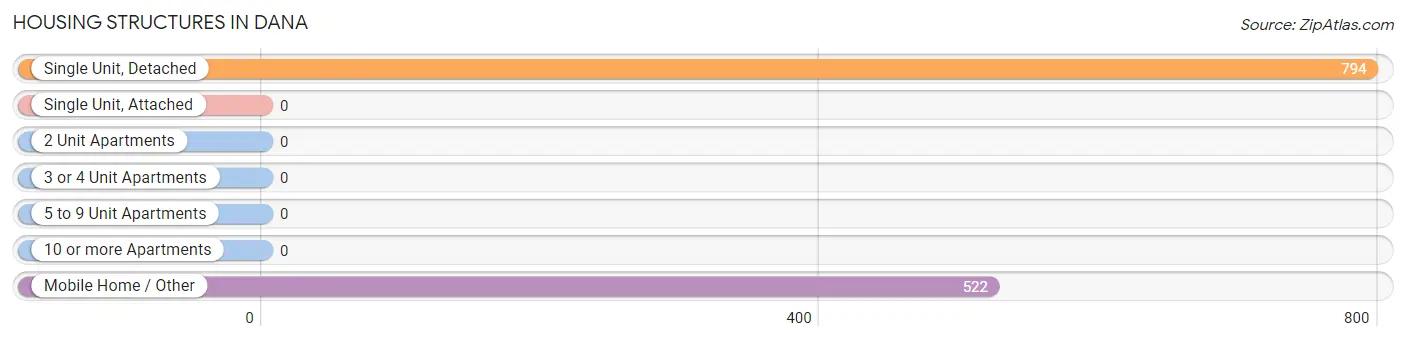
| Structure Type | # Housing Units | % Housing Units |
| Single Unit, Detached | 794 | 60.3% |
| Single Unit, Attached | 0 | 0.0% |
| 2 Unit Apartments | 0 | 0.0% |
| 3 or 4 Unit Apartments | 0 | 0.0% |
| 5 to 9 Unit Apartments | 0 | 0.0% |
| 10 or more Apartments | 0 | 0.0% |
| Mobile Home / Other | 522 | 39.7% |
| Total | 1,316 | 100.0% |
Housing Structures by Occupancy in Dana
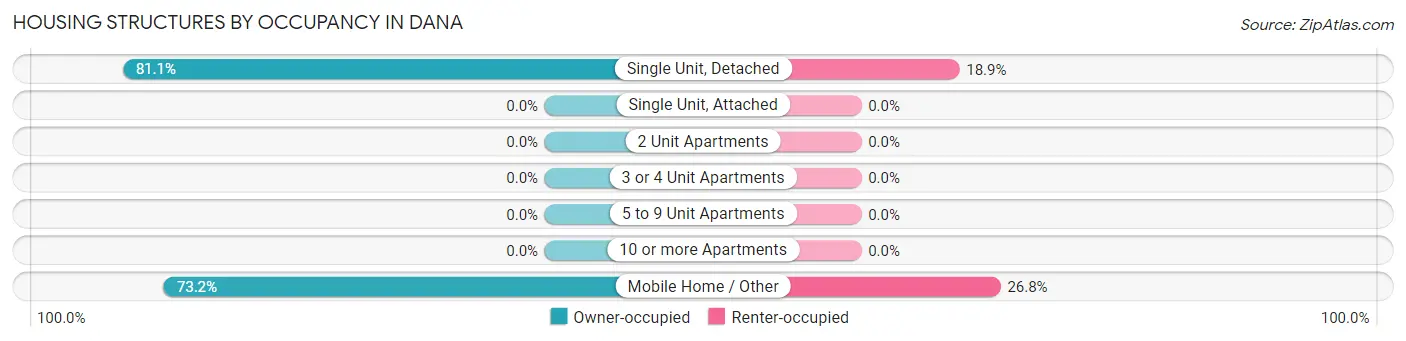
| Structure Type | Owner-occupied | Renter-occupied |
| Single Unit, Detached | 644 (81.1%) | 150 (18.9%) |
| Single Unit, Attached | 0 (0.0%) | 0 (0.0%) |
| 2 Unit Apartments | 0 (0.0%) | 0 (0.0%) |
| 3 or 4 Unit Apartments | 0 (0.0%) | 0 (0.0%) |
| 5 to 9 Unit Apartments | 0 (0.0%) | 0 (0.0%) |
| 10 or more Apartments | 0 (0.0%) | 0 (0.0%) |
| Mobile Home / Other | 382 (73.2%) | 140 (26.8%) |
| Total | 1,026 (78.0%) | 290 (22.0%) |
Housing Structures by Number of Rooms in Dana
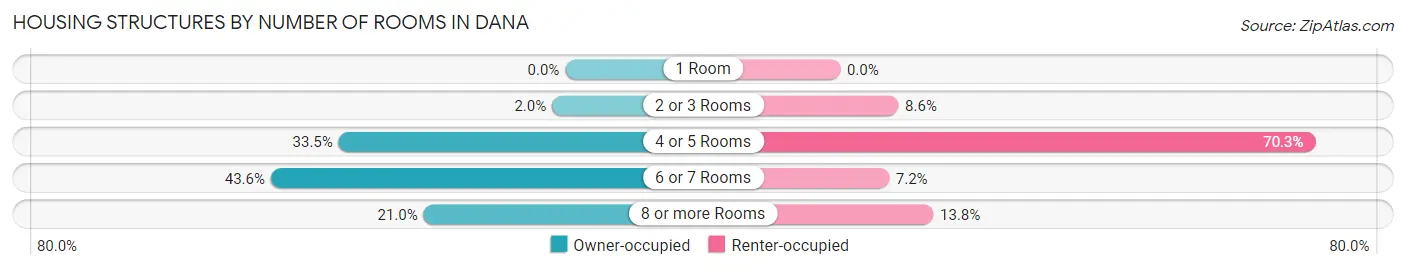
| Number of Rooms | Owner-occupied | Renter-occupied |
| 1 Room | 0 (0.0%) | 0 (0.0%) |
| 2 or 3 Rooms | 20 (1.9%) | 25 (8.6%) |
| 4 or 5 Rooms | 344 (33.5%) | 204 (70.3%) |
| 6 or 7 Rooms | 447 (43.6%) | 21 (7.2%) |
| 8 or more Rooms | 215 (21.0%) | 40 (13.8%) |
| Total | 1,026 (100.0%) | 290 (100.0%) |
Housing Structure by Heating Type in Dana
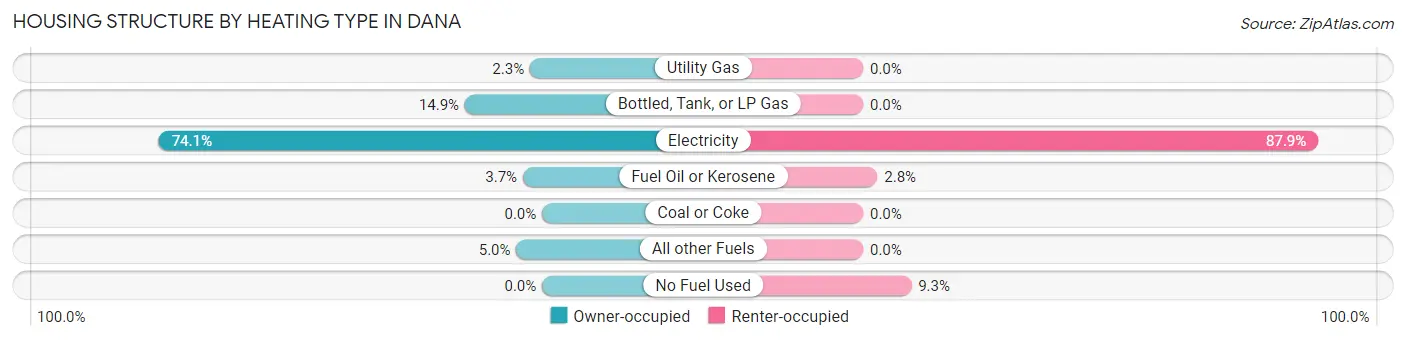
| Heating Type | Owner-occupied | Renter-occupied |
| Utility Gas | 24 (2.3%) | 0 (0.0%) |
| Bottled, Tank, or LP Gas | 153 (14.9%) | 0 (0.0%) |
| Electricity | 760 (74.1%) | 255 (87.9%) |
| Fuel Oil or Kerosene | 38 (3.7%) | 8 (2.8%) |
| Coal or Coke | 0 (0.0%) | 0 (0.0%) |
| All other Fuels | 51 (5.0%) | 0 (0.0%) |
| No Fuel Used | 0 (0.0%) | 27 (9.3%) |
| Total | 1,026 (100.0%) | 290 (100.0%) |
Household Vehicle Usage in Dana
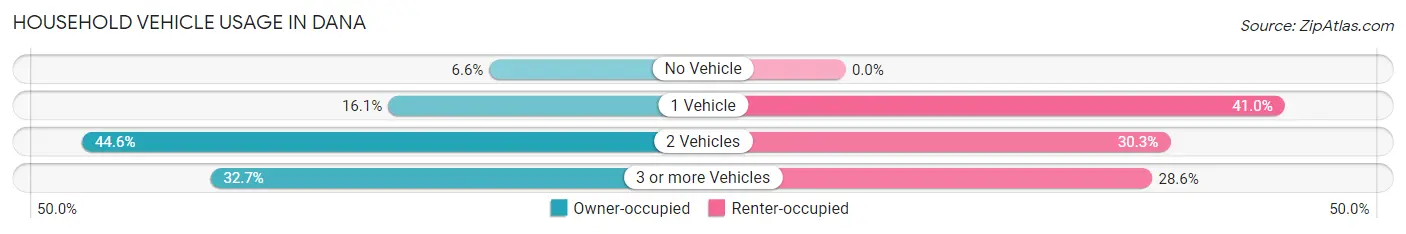
| Vehicles per Household | Owner-occupied | Renter-occupied |
| No Vehicle | 68 (6.6%) | 0 (0.0%) |
| 1 Vehicle | 165 (16.1%) | 119 (41.0%) |
| 2 Vehicles | 458 (44.6%) | 88 (30.3%) |
| 3 or more Vehicles | 335 (32.7%) | 83 (28.6%) |
| Total | 1,026 (100.0%) | 290 (100.0%) |
Real Estate & Mortgages in Dana
Real Estate and Mortgage Overview in Dana
| Characteristic | Without Mortgage | With Mortgage |
| Housing Units | 491 | 535 |
| Median Property Value | $153,500 | $243,600 |
| Median Household Income | $46,492 | $42 |
| Monthly Housing Costs | $406 | $16 |
| Real Estate Taxes | $929 | $0 |
Property Value by Mortgage Status in Dana
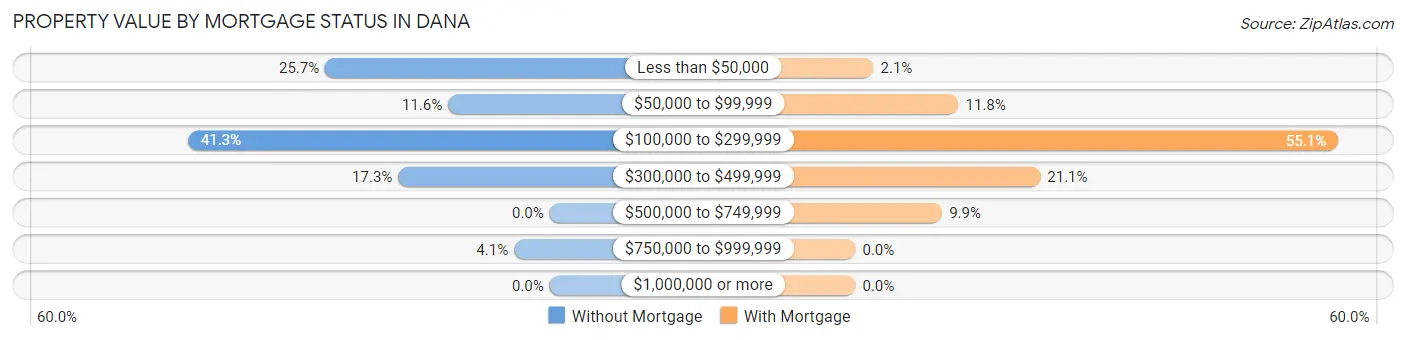
| Property Value | Without Mortgage | With Mortgage |
| Less than $50,000 | 126 (25.7%) | 11 (2.1%) |
| $50,000 to $99,999 | 57 (11.6%) | 63 (11.8%) |
| $100,000 to $299,999 | 203 (41.3%) | 295 (55.1%) |
| $300,000 to $499,999 | 85 (17.3%) | 113 (21.1%) |
| $500,000 to $749,999 | 0 (0.0%) | 53 (9.9%) |
| $750,000 to $999,999 | 20 (4.1%) | 0 (0.0%) |
| $1,000,000 or more | 0 (0.0%) | 0 (0.0%) |
| Total | 491 (100.0%) | 535 (100.0%) |
Household Income by Mortgage Status in Dana
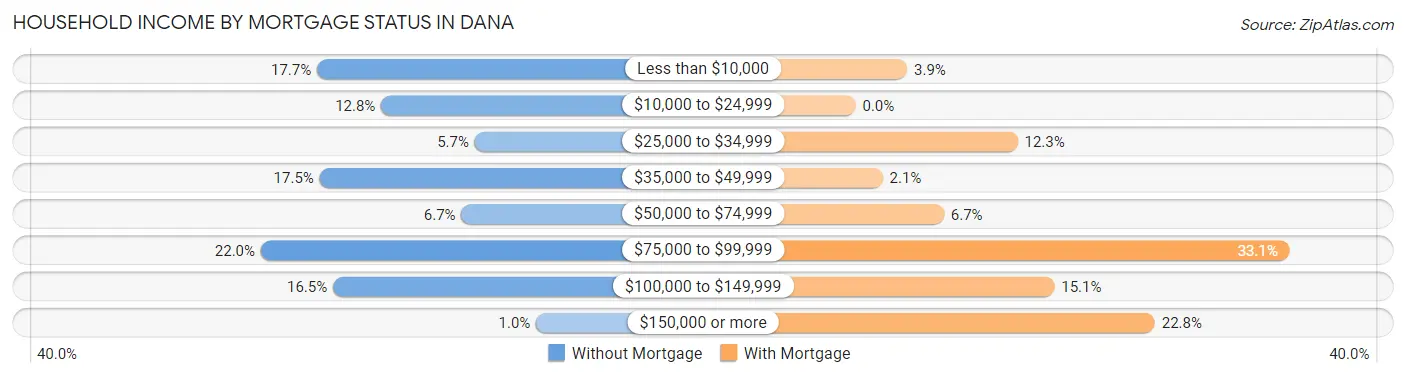
| Household Income | Without Mortgage | With Mortgage |
| Less than $10,000 | 87 (17.7%) | 21 (3.9%) |
| $10,000 to $24,999 | 63 (12.8%) | 0 (0.0%) |
| $25,000 to $34,999 | 28 (5.7%) | 66 (12.3%) |
| $35,000 to $49,999 | 86 (17.5%) | 11 (2.1%) |
| $50,000 to $74,999 | 33 (6.7%) | 36 (6.7%) |
| $75,000 to $99,999 | 108 (22.0%) | 177 (33.1%) |
| $100,000 to $149,999 | 81 (16.5%) | 81 (15.1%) |
| $150,000 or more | 5 (1.0%) | 122 (22.8%) |
| Total | 491 (100.0%) | 535 (100.0%) |
Property Value to Household Income Ratio in Dana
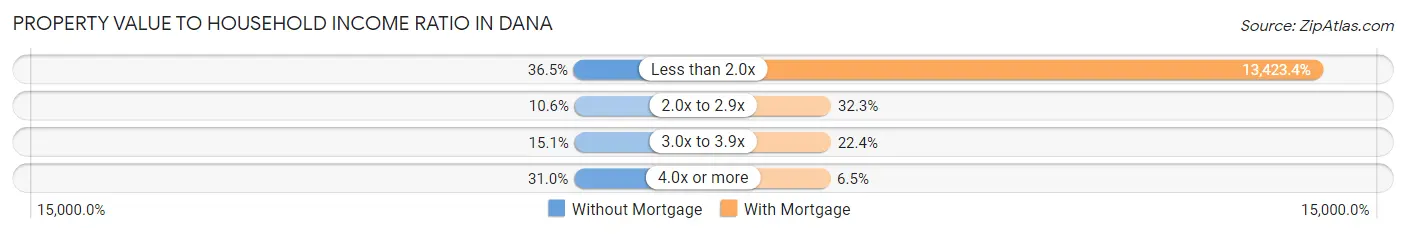
| Value-to-Income Ratio | Without Mortgage | With Mortgage |
| Less than 2.0x | 179 (36.5%) | 71,815 (13,423.4%) |
| 2.0x to 2.9x | 52 (10.6%) | 173 (32.3%) |
| 3.0x to 3.9x | 74 (15.1%) | 120 (22.4%) |
| 4.0x or more | 152 (31.0%) | 35 (6.5%) |
| Total | 491 (100.0%) | 535 (100.0%) |
Real Estate Taxes by Mortgage Status in Dana
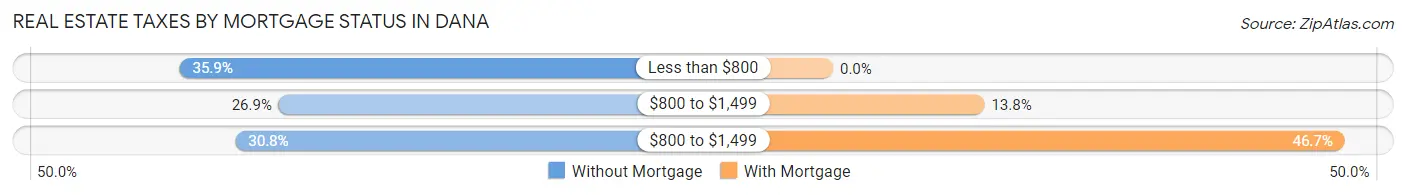
| Property Taxes | Without Mortgage | With Mortgage |
| Less than $800 | 176 (35.8%) | 0 (0.0%) |
| $800 to $1,499 | 132 (26.9%) | 74 (13.8%) |
| $800 to $1,499 | 151 (30.7%) | 250 (46.7%) |
| Total | 491 (100.0%) | 535 (100.0%) |
Health & Disability in Dana
Health Insurance Coverage by Age in Dana
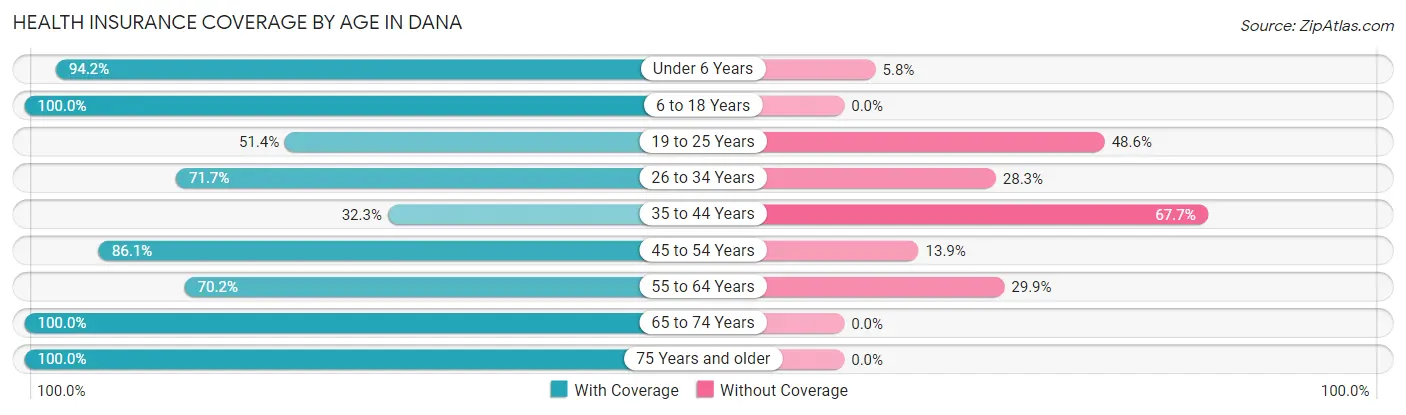
| Age Bracket | With Coverage | Without Coverage |
| Under 6 Years | 242 (94.2%) | 15 (5.8%) |
| 6 to 18 Years | 815 (100.0%) | 0 (0.0%) |
| 19 to 25 Years | 54 (51.4%) | 51 (48.6%) |
| 26 to 34 Years | 165 (71.7%) | 65 (28.3%) |
| 35 to 44 Years | 225 (32.3%) | 472 (67.7%) |
| 45 to 54 Years | 491 (86.1%) | 79 (13.9%) |
| 55 to 64 Years | 188 (70.2%) | 80 (29.8%) |
| 65 to 74 Years | 476 (100.0%) | 0 (0.0%) |
| 75 Years and older | 211 (100.0%) | 0 (0.0%) |
| Total | 2,867 (79.0%) | 762 (21.0%) |
Health Insurance Coverage by Citizenship Status in Dana
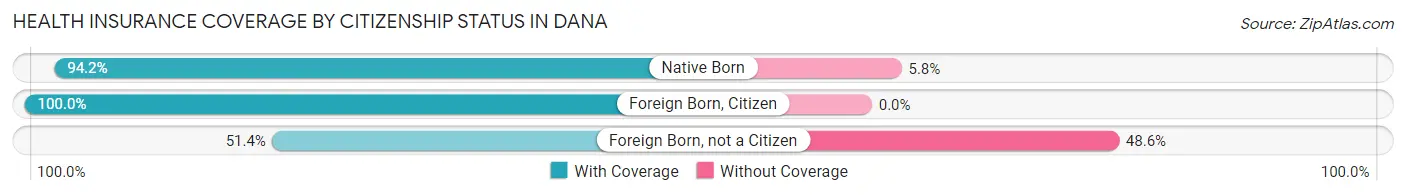
| Citizenship Status | With Coverage | Without Coverage |
| Native Born | 242 (94.2%) | 15 (5.8%) |
| Foreign Born, Citizen | 815 (100.0%) | 0 (0.0%) |
| Foreign Born, not a Citizen | 54 (51.4%) | 51 (48.6%) |
Health Insurance Coverage by Household Income in Dana
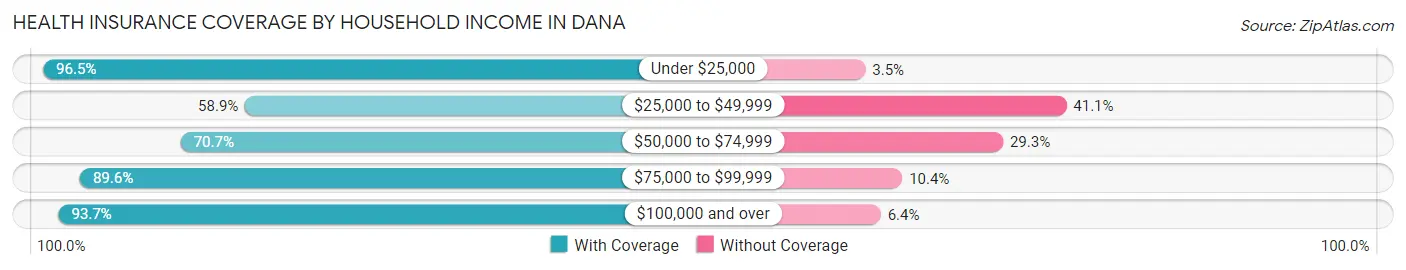
| Household Income | With Coverage | Without Coverage |
| Under $25,000 | 527 (96.5%) | 19 (3.5%) |
| $25,000 to $49,999 | 594 (58.9%) | 415 (41.1%) |
| $50,000 to $74,999 | 527 (70.7%) | 218 (29.3%) |
| $75,000 to $99,999 | 570 (89.6%) | 66 (10.4%) |
| $100,000 and over | 649 (93.6%) | 44 (6.4%) |
Public vs Private Health Insurance Coverage by Age in Dana
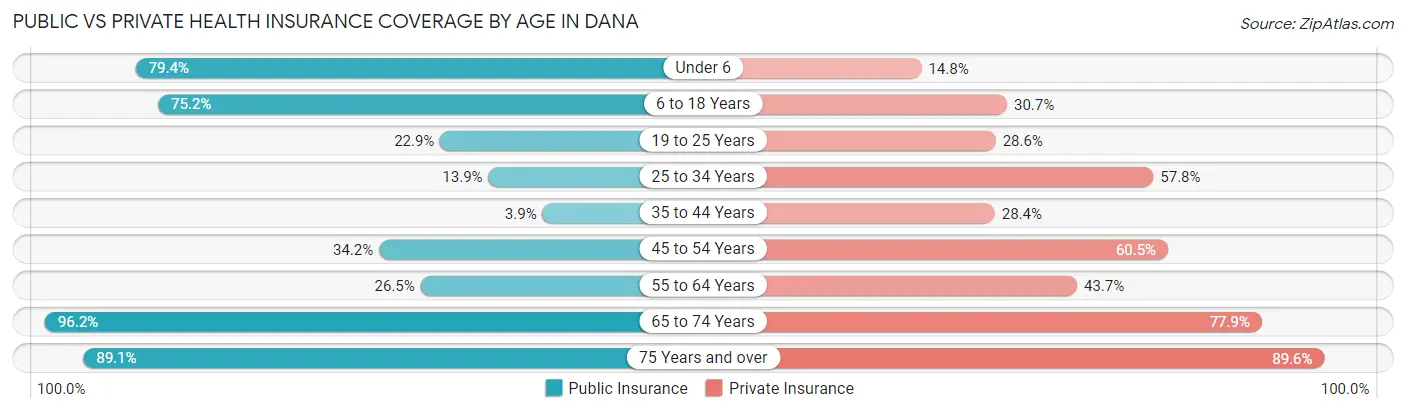
| Age Bracket | Public Insurance | Private Insurance |
| Under 6 | 204 (79.4%) | 38 (14.8%) |
| 6 to 18 Years | 613 (75.2%) | 250 (30.7%) |
| 19 to 25 Years | 24 (22.9%) | 30 (28.6%) |
| 25 to 34 Years | 32 (13.9%) | 133 (57.8%) |
| 35 to 44 Years | 27 (3.9%) | 198 (28.4%) |
| 45 to 54 Years | 195 (34.2%) | 345 (60.5%) |
| 55 to 64 Years | 71 (26.5%) | 117 (43.7%) |
| 65 to 74 Years | 458 (96.2%) | 371 (77.9%) |
| 75 Years and over | 188 (89.1%) | 189 (89.6%) |
| Total | 1,812 (49.9%) | 1,671 (46.1%) |
Disability Status by Sex by Age in Dana
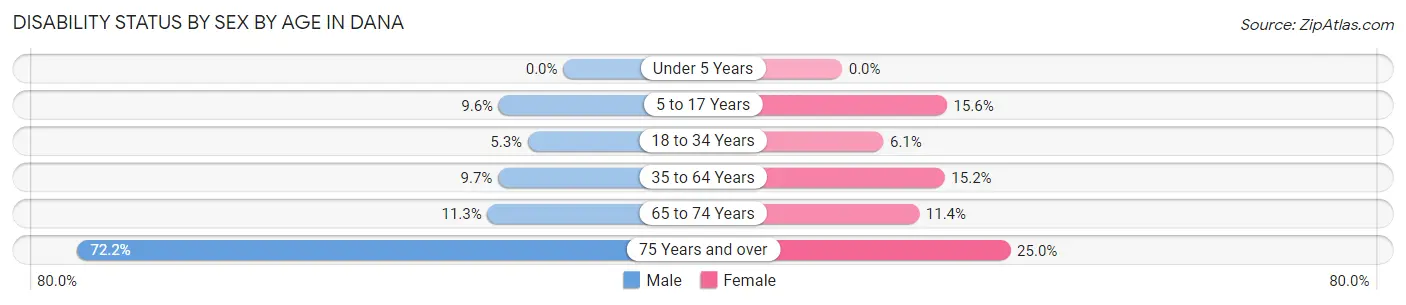
| Age Bracket | Male | Female |
| Under 5 Years | 0 (0.0%) | 0 (0.0%) |
| 5 to 17 Years | 45 (9.6%) | 58 (15.5%) |
| 18 to 34 Years | 9 (5.3%) | 12 (6.1%) |
| 35 to 64 Years | 73 (9.7%) | 119 (15.2%) |
| 65 to 74 Years | 27 (11.3%) | 27 (11.4%) |
| 75 Years and over | 57 (72.2%) | 33 (25.0%) |
Disability Class by Sex by Age in Dana
Disability Class: Hearing Difficulty
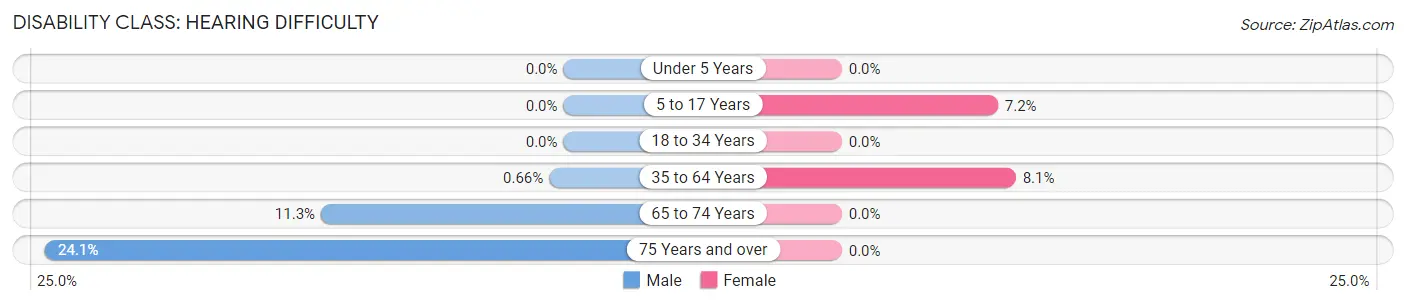
| Age Bracket | Male | Female |
| Under 5 Years | 0 (0.0%) | 0 (0.0%) |
| 5 to 17 Years | 0 (0.0%) | 27 (7.2%) |
| 18 to 34 Years | 0 (0.0%) | 0 (0.0%) |
| 35 to 64 Years | 5 (0.7%) | 63 (8.1%) |
| 65 to 74 Years | 27 (11.3%) | 0 (0.0%) |
| 75 Years and over | 19 (24.0%) | 0 (0.0%) |
Disability Class: Vision Difficulty
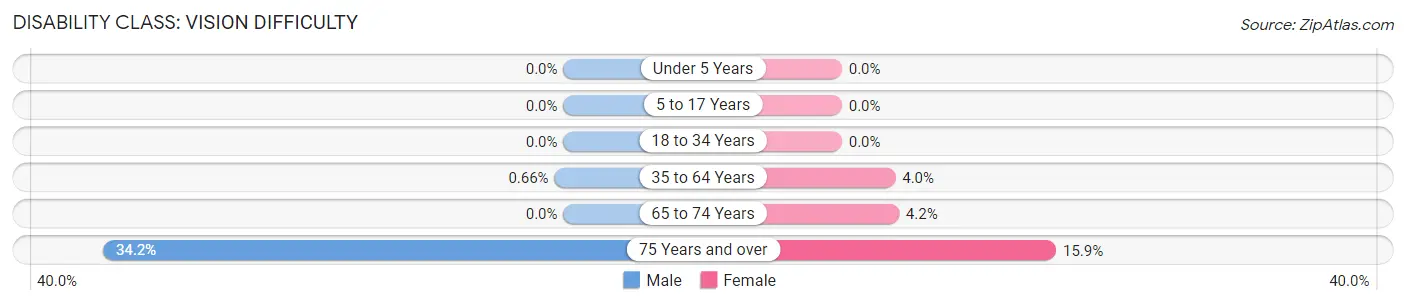
| Age Bracket | Male | Female |
| Under 5 Years | 0 (0.0%) | 0 (0.0%) |
| 5 to 17 Years | 0 (0.0%) | 0 (0.0%) |
| 18 to 34 Years | 0 (0.0%) | 0 (0.0%) |
| 35 to 64 Years | 5 (0.7%) | 31 (4.0%) |
| 65 to 74 Years | 0 (0.0%) | 10 (4.2%) |
| 75 Years and over | 27 (34.2%) | 21 (15.9%) |
Disability Class: Cognitive Difficulty
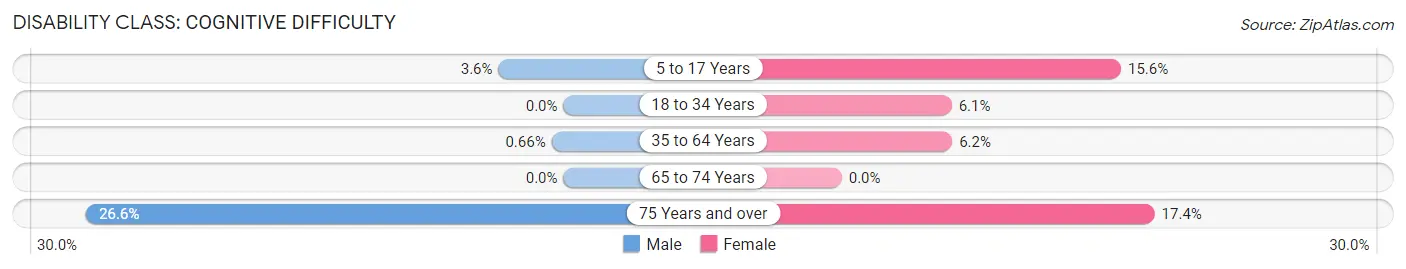
| Age Bracket | Male | Female |
| 5 to 17 Years | 17 (3.6%) | 58 (15.5%) |
| 18 to 34 Years | 0 (0.0%) | 12 (6.1%) |
| 35 to 64 Years | 5 (0.7%) | 48 (6.1%) |
| 65 to 74 Years | 0 (0.0%) | 0 (0.0%) |
| 75 Years and over | 21 (26.6%) | 23 (17.4%) |
Disability Class: Ambulatory Difficulty
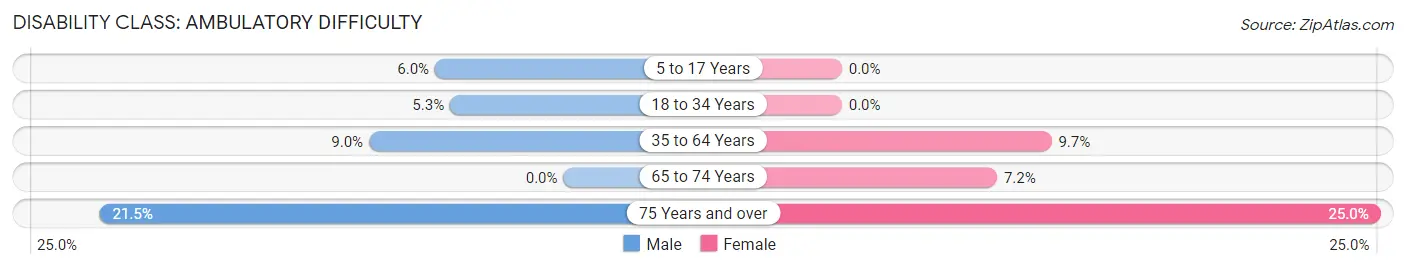
| Age Bracket | Male | Female |
| 5 to 17 Years | 28 (6.0%) | 0 (0.0%) |
| 18 to 34 Years | 9 (5.3%) | 0 (0.0%) |
| 35 to 64 Years | 68 (9.0%) | 76 (9.7%) |
| 65 to 74 Years | 0 (0.0%) | 17 (7.2%) |
| 75 Years and over | 17 (21.5%) | 33 (25.0%) |
Disability Class: Self-Care Difficulty
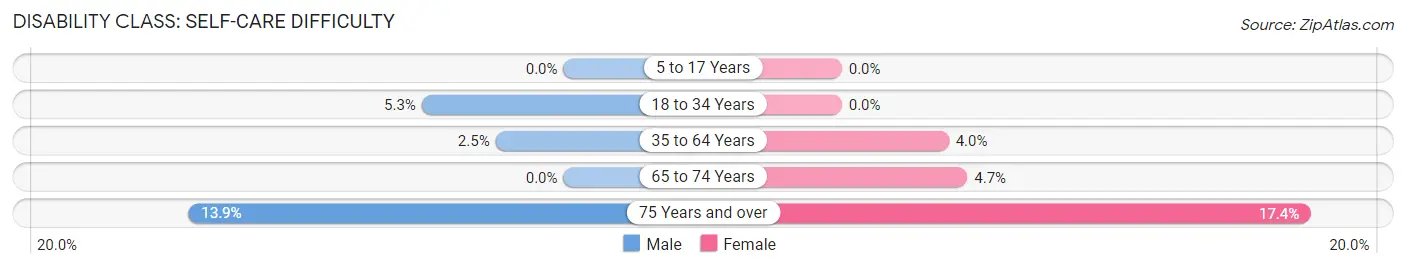
| Age Bracket | Male | Female |
| 5 to 17 Years | 0 (0.0%) | 0 (0.0%) |
| 18 to 34 Years | 9 (5.3%) | 0 (0.0%) |
| 35 to 64 Years | 19 (2.5%) | 31 (4.0%) |
| 65 to 74 Years | 0 (0.0%) | 11 (4.7%) |
| 75 Years and over | 11 (13.9%) | 23 (17.4%) |
Technology Access in Dana
Computing Device Access in Dana
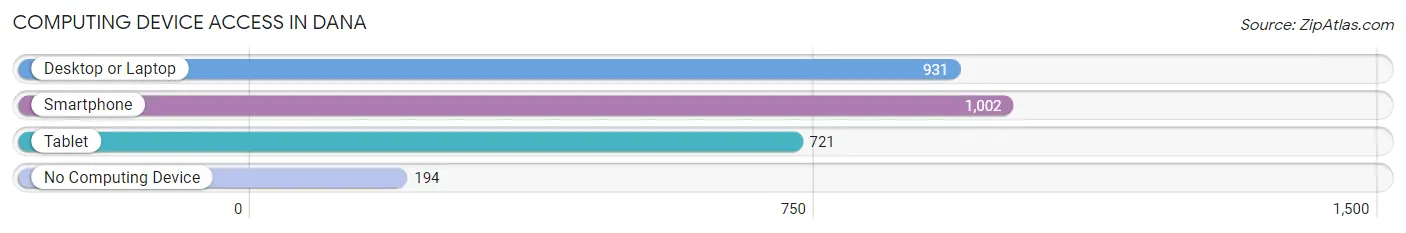
| Device Type | # Households | % Households |
| Desktop or Laptop | 931 | 70.7% |
| Smartphone | 1,002 | 76.1% |
| Tablet | 721 | 54.8% |
| No Computing Device | 194 | 14.7% |
| Total | 1,316 | 100.0% |
Internet Access in Dana
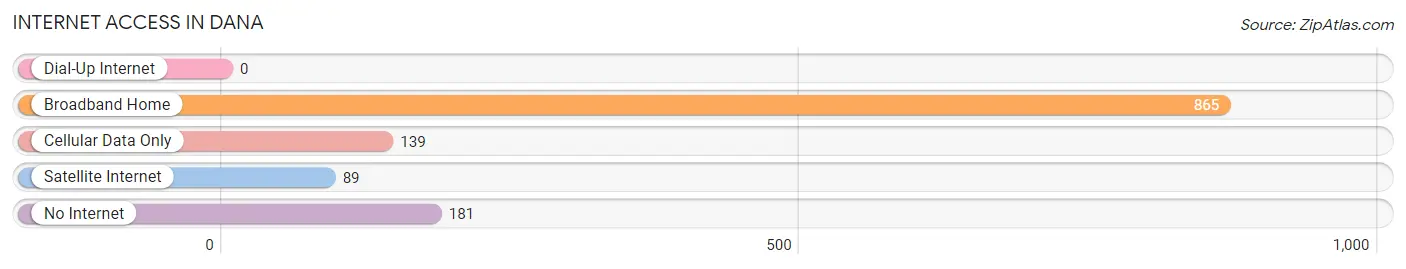
| Internet Type | # Households | % Households |
| Dial-Up Internet | 0 | 0.0% |
| Broadband Home | 865 | 65.7% |
| Cellular Data Only | 139 | 10.6% |
| Satellite Internet | 89 | 6.8% |
| No Internet | 181 | 13.8% |
| Total | 1,316 | 100.0% |
Dana Summary
Dana, North Carolina is a small town located in the foothills of the Blue Ridge Mountains in McDowell County. It is situated in the western part of the state, about 25 miles east of Asheville. The town was founded in 1891 and named after the daughter of the first postmaster, William H. Dana.
Geography
Dana is located in the foothills of the Blue Ridge Mountains, at an elevation of 1,890 feet. The town is situated in a valley between two mountain ridges, the Catawba and the Little Pisgah. The Catawba River runs through the town, providing a source of water for the local population. The town is surrounded by forests and rolling hills, and is home to a variety of wildlife, including deer, wild turkeys, and black bears.
Economy
Dana’s economy is largely based on agriculture and tourism. The town is home to several farms, which produce a variety of crops, including corn, soybeans, and hay. The town is also home to several small businesses, including a grocery store, a hardware store, and a restaurant. Tourism is an important part of the local economy, as the town is located near several popular attractions, including the Blue Ridge Parkway, the Pisgah National Forest, and the Great Smoky Mountains National Park.
Demographics
As of the 2010 census, Dana had a population of 1,093. The racial makeup of the town was 95.3% White, 1.2% African American, 0.7% Native American, 0.3% Asian, and 2.5% from two or more races. The median household income was $30,938, and the median family income was $37,813. The per capita income was $17,845.
Conclusion
Dana, North Carolina is a small town located in the foothills of the Blue Ridge Mountains in McDowell County. It is situated in the western part of the state, about 25 miles east of Asheville. The town was founded in 1891 and named after the daughter of the first postmaster, William H. Dana. The town’s economy is largely based on agriculture and tourism, and the population is predominantly White. Dana is a peaceful and picturesque town, and is a popular destination for tourists looking to explore the beauty of the Blue Ridge Mountains.
Common Questions
What is Per Capita Income in Dana?
Per Capita income in Dana is $23,524.
What is the Median Family Income in Dana?
Median Family Income in Dana is $67,584.
What is the Median Household income in Dana?
Median Household Income in Dana is $53,256.
What is Income or Wage Gap in Dana?
Income or Wage Gap in Dana is 41.6%.
Women in Dana earn 58.4 cents for every dollar earned by a man.
What is Family Income Deficit in Dana?
Family Income Deficit in Dana is $14,664.
Families that are below poverty line in Dana earn $14,664 less on average than the poverty threshold level.
What is Inequality or Gini Index in Dana?
Inequality or Gini Index in Dana is 0.41.
What is the Total Population of Dana?
Total Population of Dana is 3,629.
What is the Total Male Population of Dana?
Total Male Population of Dana is 1,737.
What is the Total Female Population of Dana?
Total Female Population of Dana is 1,892.
What is the Ratio of Males per 100 Females in Dana?
There are 91.81 Males per 100 Females in Dana.
What is the Ratio of Females per 100 Males in Dana?
There are 108.92 Females per 100 Males in Dana.
What is the Median Population Age in Dana?
Median Population Age in Dana is 40.2 Years.
What is the Average Family Size in Dana
Average Family Size in Dana is 3.0 People.
What is the Average Household Size in Dana
Average Household Size in Dana is 2.8 People.
How Large is the Labor Force in Dana?
There are 1,592 People in the Labor Forcein in Dana.
What is the Percentage of People in the Labor Force in Dana?
58.9% of People are in the Labor Force in Dana.
What is the Unemployment Rate in Dana?
Unemployment Rate in Dana is 6.5%.