Snow Hill, NC Map & Demographics
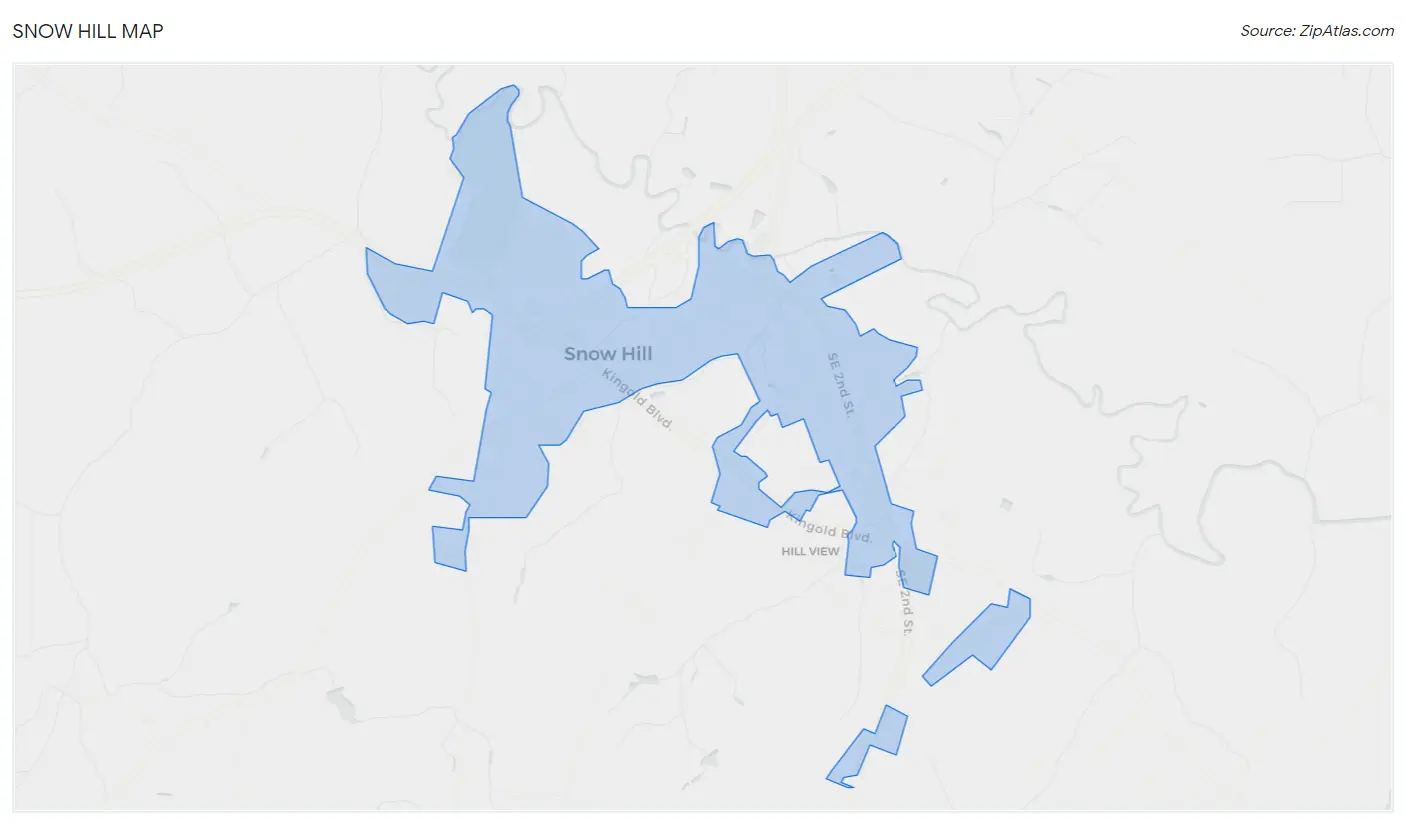
Snow Hill Map
Snow Hill Overview
$19,587
PER CAPITA INCOME
$51,979
AVG FAMILY INCOME
$34,583
AVG HOUSEHOLD INCOME
22.1%
WAGE / INCOME GAP [ % ]
77.9¢/ $1
WAGE / INCOME GAP [ $ ]
0.47
INEQUALITY / GINI INDEX
2,092
TOTAL POPULATION
1,108
MALE POPULATION
984
FEMALE POPULATION
112.60
MALES / 100 FEMALES
88.81
FEMALES / 100 MALES
37.2
MEDIAN AGE
3.5
AVG FAMILY SIZE
2.8
AVG HOUSEHOLD SIZE
776
LABOR FORCE [ PEOPLE ]
50.7%
PERCENT IN LABOR FORCE
5.5%
UNEMPLOYMENT RATE
Snow Hill Zip Codes
Snow Hill Area Codes
Income in Snow Hill
Income Overview in Snow Hill
Per Capita Income in Snow Hill is $19,587, while median incomes of families and households are $51,979 and $34,583 respectively.
| Characteristic | Number | Measure |
| Per Capita Income | 2,092 | $19,587 |
| Median Family Income | 490 | $51,979 |
| Mean Family Income | 490 | $64,568 |
| Median Household Income | 737 | $34,583 |
| Mean Household Income | 737 | $54,477 |
| Income Deficit | 490 | $0 |
| Wage / Income Gap (%) | 2,092 | 22.13% |
| Wage / Income Gap ($) | 2,092 | 77.87¢ per $1 |
| Gini / Inequality Index | 2,092 | 0.47 |
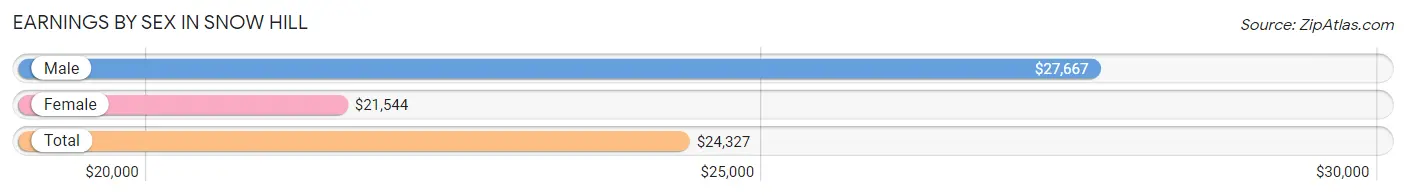
Earnings by Sex in Snow Hill
Average Earnings in Snow Hill are $24,327, $27,667 for men and $21,544 for women, a difference of 22.1%.
| Sex | Number | Average Earnings |
| Male | 456 (54.6%) | $27,667 |
| Female | 379 (45.4%) | $21,544 |
| Total | 835 (100.0%) | $24,327 |
Earnings by Sex by Income Bracket in Snow Hill
The most common earnings brackets in Snow Hill are $25,000 to $29,999 for men (73 | 16.0%) and $12,500 to $14,999 for women (43 | 11.4%).
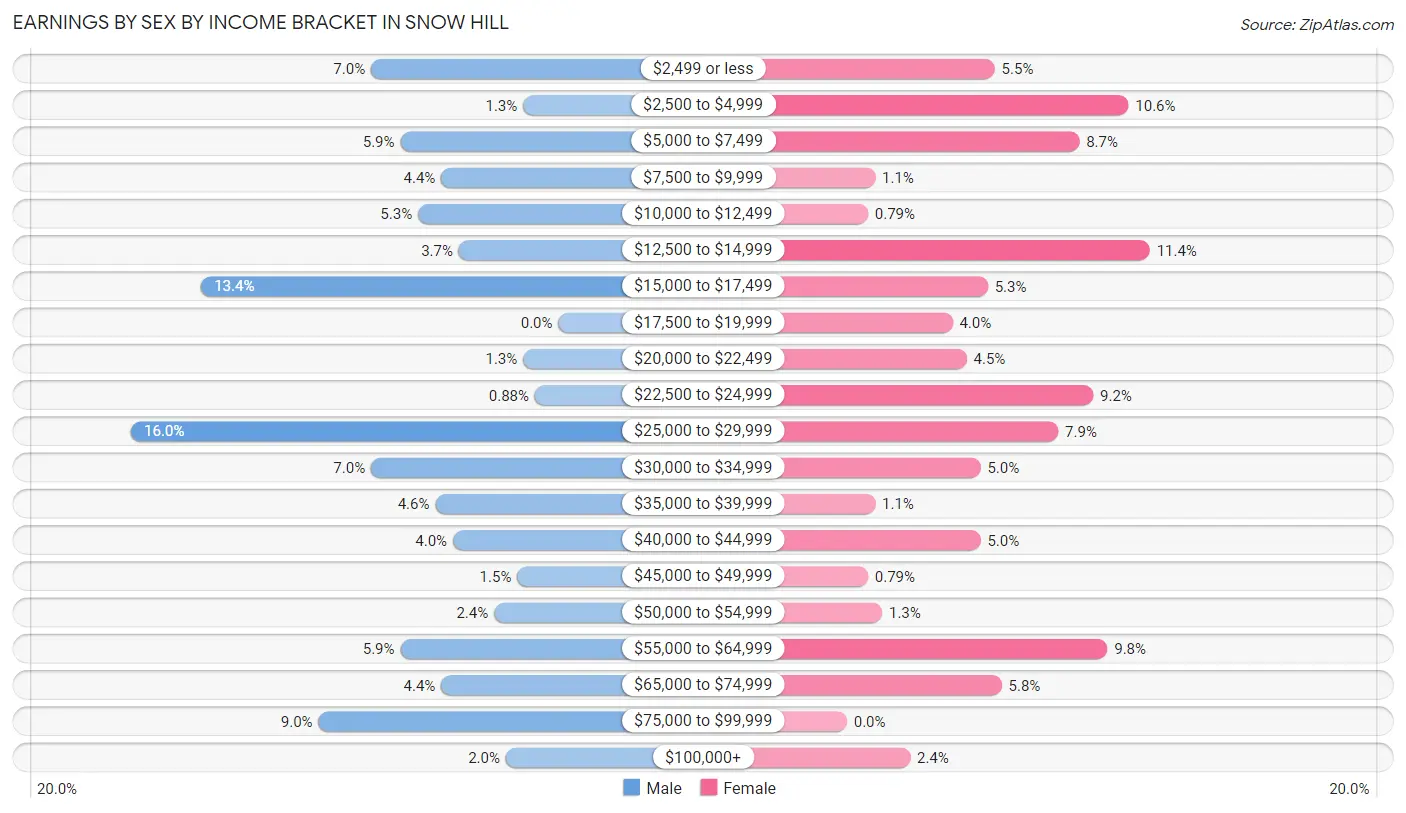
| Income | Male | Female |
| $2,499 or less | 32 (7.0%) | 21 (5.5%) |
| $2,500 to $4,999 | 6 (1.3%) | 40 (10.5%) |
| $5,000 to $7,499 | 27 (5.9%) | 33 (8.7%) |
| $7,500 to $9,999 | 20 (4.4%) | 4 (1.1%) |
| $10,000 to $12,499 | 24 (5.3%) | 3 (0.8%) |
| $12,500 to $14,999 | 17 (3.7%) | 43 (11.4%) |
| $15,000 to $17,499 | 61 (13.4%) | 20 (5.3%) |
| $17,500 to $19,999 | 0 (0.0%) | 15 (4.0%) |
| $20,000 to $22,499 | 6 (1.3%) | 17 (4.5%) |
| $22,500 to $24,999 | 4 (0.9%) | 35 (9.2%) |
| $25,000 to $29,999 | 73 (16.0%) | 30 (7.9%) |
| $30,000 to $34,999 | 32 (7.0%) | 19 (5.0%) |
| $35,000 to $39,999 | 21 (4.6%) | 4 (1.1%) |
| $40,000 to $44,999 | 18 (4.0%) | 19 (5.0%) |
| $45,000 to $49,999 | 7 (1.5%) | 3 (0.8%) |
| $50,000 to $54,999 | 11 (2.4%) | 5 (1.3%) |
| $55,000 to $64,999 | 27 (5.9%) | 37 (9.8%) |
| $65,000 to $74,999 | 20 (4.4%) | 22 (5.8%) |
| $75,000 to $99,999 | 41 (9.0%) | 0 (0.0%) |
| $100,000+ | 9 (2.0%) | 9 (2.4%) |
| Total | 456 (100.0%) | 379 (100.0%) |
Earnings by Sex by Educational Attainment in Snow Hill
Average earnings in Snow Hill are $29,583 for men and $23,831 for women, a difference of 19.4%. Men with an educational attainment of graduate degree enjoy the highest average annual earnings of $75,694, while those with college or associate's degree education earn the least with $37,917. Women with an educational attainment of graduate degree earn the most with the average annual earnings of $50,417, while those with less than high school education have the smallest earnings of $5,455.
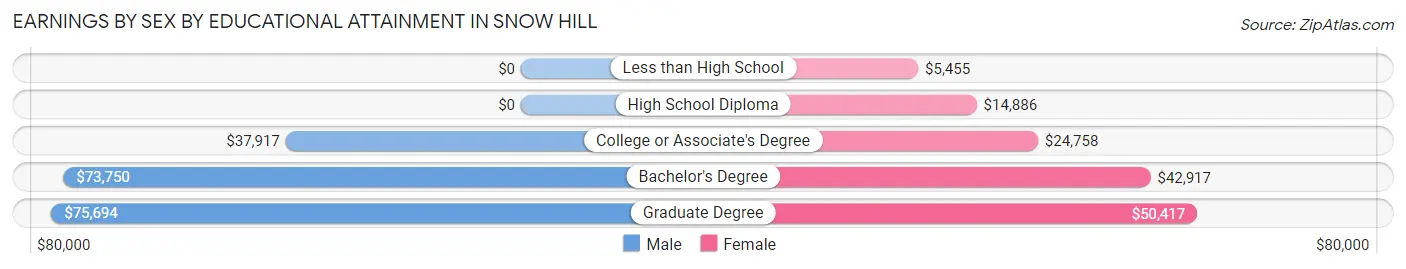
| Educational Attainment | Male Income | Female Income |
| Less than High School | - | - |
| High School Diploma | - | - |
| College or Associate's Degree | $37,917 | $24,758 |
| Bachelor's Degree | $73,750 | $42,917 |
| Graduate Degree | $75,694 | $50,417 |
| Total | $29,583 | $23,831 |
Family Income in Snow Hill
Family Income Brackets in Snow Hill
According to the Snow Hill family income data, there are 101 families falling into the $15,000 to $24,999 income range, which is the most common income bracket and makes up 20.6% of all families. Conversely, the $200,000+ income bracket is the least frequent group with only 10 families (2.0%) belonging to this category.
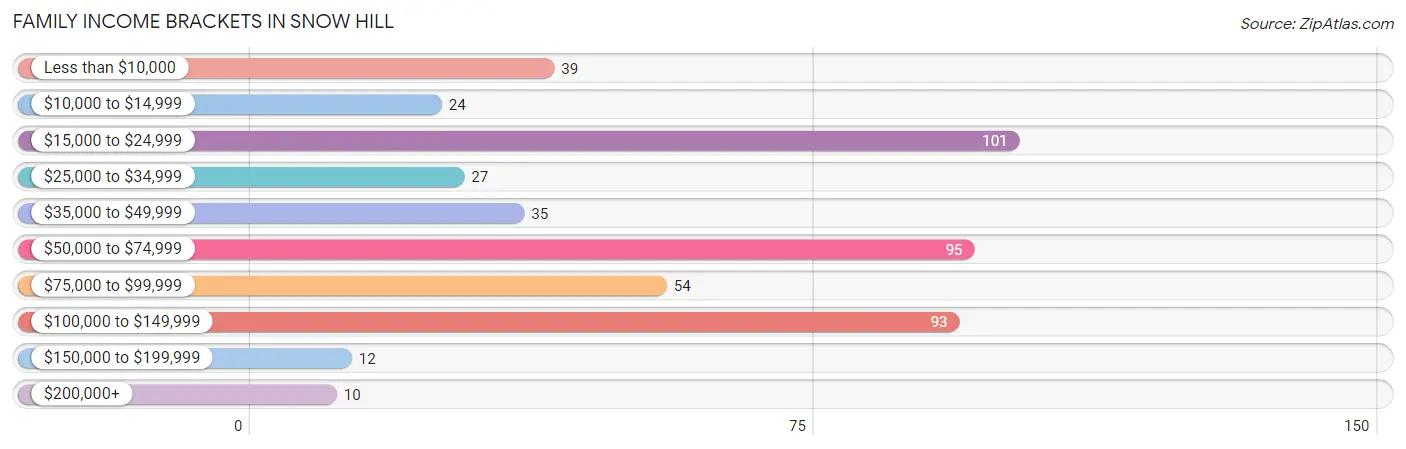
| Income Bracket | # Families | % Families |
| Less than $10,000 | 39 | 8.0% |
| $10,000 to $14,999 | 24 | 4.9% |
| $15,000 to $24,999 | 101 | 20.6% |
| $25,000 to $34,999 | 27 | 5.5% |
| $35,000 to $49,999 | 35 | 7.1% |
| $50,000 to $74,999 | 95 | 19.4% |
| $75,000 to $99,999 | 54 | 11.0% |
| $100,000 to $149,999 | 93 | 19.0% |
| $150,000 to $199,999 | 12 | 2.4% |
| $200,000+ | 10 | 2.0% |
Family Income by Famaliy Size in Snow Hill
2-person families (236 | 48.2%) account for the highest median family income in Snow Hill with $62,750 per family, while 2-person families (236 | 48.2%) have the highest median income of $31,375 per family member.
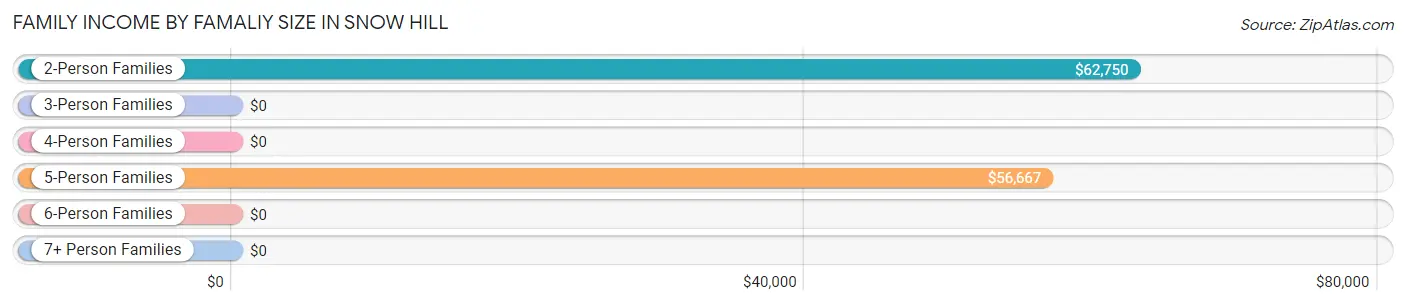
| Income Bracket | # Families | Median Income |
| 2-Person Families | 236 (48.2%) | $62,750 |
| 3-Person Families | 115 (23.5%) | $0 |
| 4-Person Families | 81 (16.5%) | $0 |
| 5-Person Families | 22 (4.5%) | $56,667 |
| 6-Person Families | 20 (4.1%) | $0 |
| 7+ Person Families | 16 (3.3%) | $0 |
| Total | 490 (100.0%) | $51,979 |
Family Income by Number of Earners in Snow Hill
The median family income in Snow Hill is $51,979, with families comprising 3+ earners (51) having the highest median family income of $97,361, while families with no earners (89) have the lowest median family income of $19,398, accounting for 10.4% and 18.2% of families, respectively.
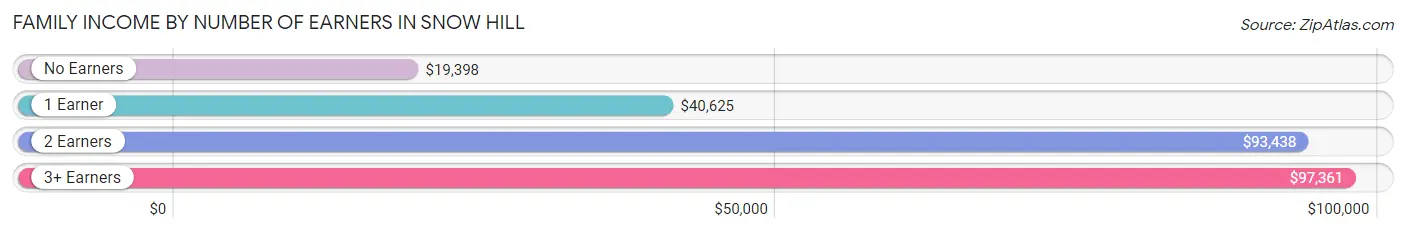
| Number of Earners | # Families | Median Income |
| No Earners | 89 (18.2%) | $19,398 |
| 1 Earner | 207 (42.2%) | $40,625 |
| 2 Earners | 143 (29.2%) | $93,438 |
| 3+ Earners | 51 (10.4%) | $97,361 |
| Total | 490 (100.0%) | $51,979 |
Household Income in Snow Hill
Household Income Brackets in Snow Hill
With 156 households falling in the category, the $15,000 to $24,999 income range is the most frequent in Snow Hill, accounting for 21.2% of all households. In contrast, only 10 households (1.4%) fall into the $200,000+ income bracket, making it the least populous group.
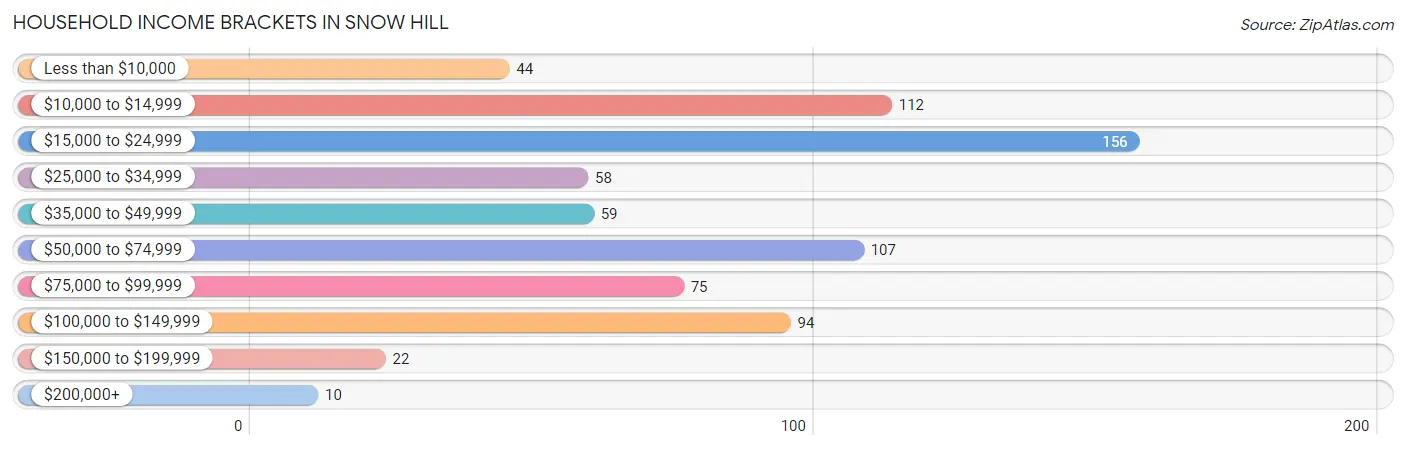
| Income Bracket | # Households | % Households |
| Less than $10,000 | 44 | 6.0% |
| $10,000 to $14,999 | 112 | 15.2% |
| $15,000 to $24,999 | 156 | 21.2% |
| $25,000 to $34,999 | 58 | 7.9% |
| $35,000 to $49,999 | 59 | 8.0% |
| $50,000 to $74,999 | 107 | 14.5% |
| $75,000 to $99,999 | 75 | 10.2% |
| $100,000 to $149,999 | 94 | 12.8% |
| $150,000 to $199,999 | 22 | 3.0% |
| $200,000+ | 10 | 1.4% |
Household Income by Householder Age in Snow Hill
The median household income in Snow Hill is $34,583, with the highest median household income of $37,727 found in the 25 to 44 years age bracket for the primary householder. A total of 256 households (34.7%) fall into this category. Meanwhile, the 15 to 24 years age bracket for the primary householder has the lowest median household income of $0, with 13 households (1.8%) in this group.
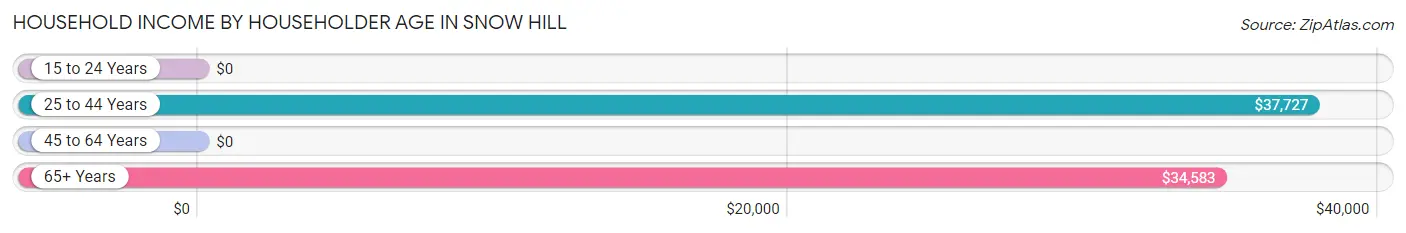
| Income Bracket | # Households | Median Income |
| 15 to 24 Years | 13 (1.8%) | $0 |
| 25 to 44 Years | 256 (34.7%) | $37,727 |
| 45 to 64 Years | 211 (28.6%) | $0 |
| 65+ Years | 257 (34.9%) | $34,583 |
| Total | 737 (100.0%) | $34,583 |
Poverty in Snow Hill
Income Below Poverty by Sex and Age in Snow Hill
With 29.5% poverty level for males and 42.4% for females among the residents of Snow Hill, under 5 year old males and 5 year old females are the most vulnerable to poverty, with 34 males (52.3%) and 15 females (100.0%) in their respective age groups living below the poverty level.
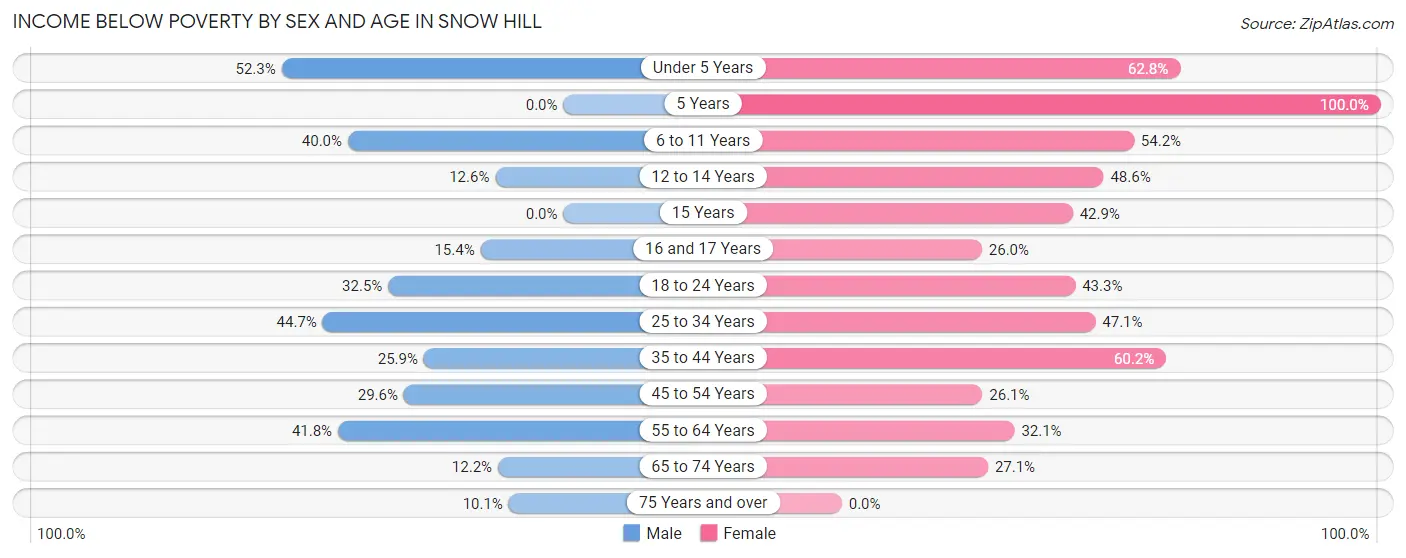
| Age Bracket | Male | Female |
| Under 5 Years | 34 (52.3%) | 54 (62.8%) |
| 5 Years | 0 (0.0%) | 15 (100.0%) |
| 6 to 11 Years | 56 (40.0%) | 45 (54.2%) |
| 12 to 14 Years | 11 (12.6%) | 17 (48.6%) |
| 15 Years | 0 (0.0%) | 12 (42.9%) |
| 16 and 17 Years | 2 (15.4%) | 13 (26.0%) |
| 18 to 24 Years | 40 (32.5%) | 26 (43.3%) |
| 25 to 34 Years | 42 (44.7%) | 32 (47.1%) |
| 35 to 44 Years | 36 (25.9%) | 118 (60.2%) |
| 45 to 54 Years | 45 (29.6%) | 24 (26.1%) |
| 55 to 64 Years | 41 (41.8%) | 25 (32.1%) |
| 65 to 74 Years | 13 (12.1%) | 35 (27.1%) |
| 75 Years and over | 7 (10.1%) | 0 (0.0%) |
| Total | 327 (29.5%) | 416 (42.4%) |
Income Above Poverty by Sex and Age in Snow Hill
According to the poverty statistics in Snow Hill, males aged 5 years and females aged 75 years and over are the age groups that are most secure financially, with 100.0% of males and 100.0% of females in these age groups living above the poverty line.
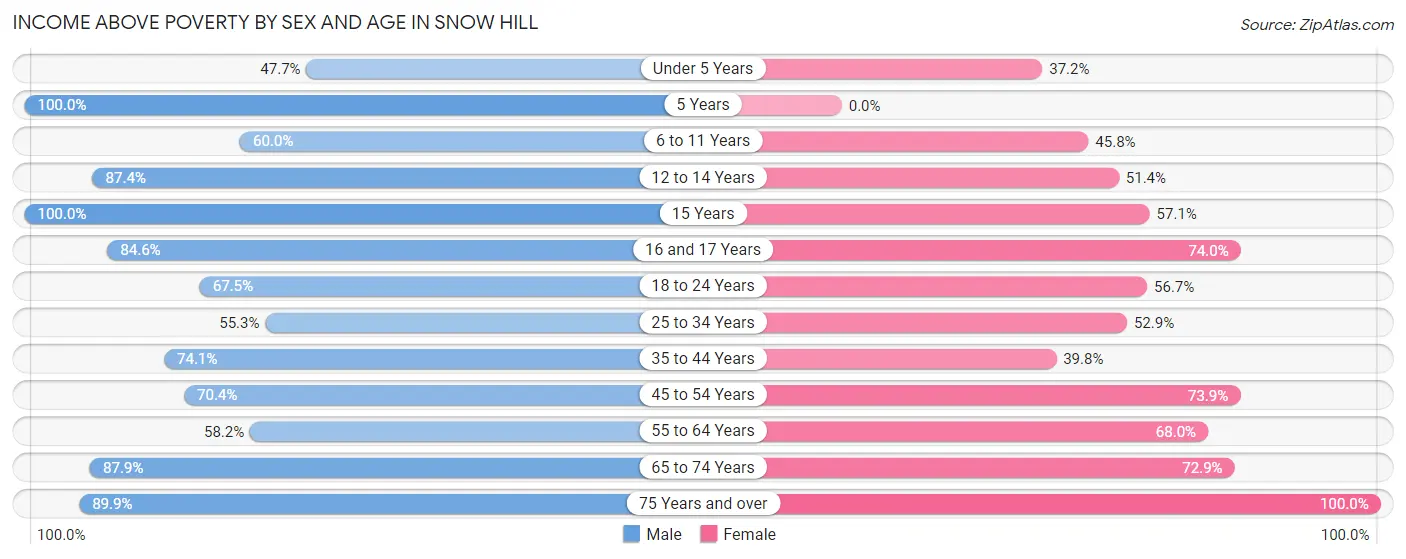
| Age Bracket | Male | Female |
| Under 5 Years | 31 (47.7%) | 32 (37.2%) |
| 5 Years | 17 (100.0%) | 0 (0.0%) |
| 6 to 11 Years | 84 (60.0%) | 38 (45.8%) |
| 12 to 14 Years | 76 (87.4%) | 18 (51.4%) |
| 15 Years | 4 (100.0%) | 16 (57.1%) |
| 16 and 17 Years | 11 (84.6%) | 37 (74.0%) |
| 18 to 24 Years | 83 (67.5%) | 34 (56.7%) |
| 25 to 34 Years | 52 (55.3%) | 36 (52.9%) |
| 35 to 44 Years | 103 (74.1%) | 78 (39.8%) |
| 45 to 54 Years | 107 (70.4%) | 68 (73.9%) |
| 55 to 64 Years | 57 (58.2%) | 53 (67.9%) |
| 65 to 74 Years | 94 (87.8%) | 94 (72.9%) |
| 75 Years and over | 62 (89.9%) | 62 (100.0%) |
| Total | 781 (70.5%) | 566 (57.6%) |
Income Below Poverty Among Married-Couple Families in Snow Hill
The poverty statistics for married-couple families in Snow Hill show that 4.1% or 11 of the total 267 families live below the poverty line. Families with 1 or 2 children have the highest poverty rate of 9.8%, comprising of 6 families. On the other hand, families with 3 or 4 children have the lowest poverty rate of 0.0%, which includes 0 families.
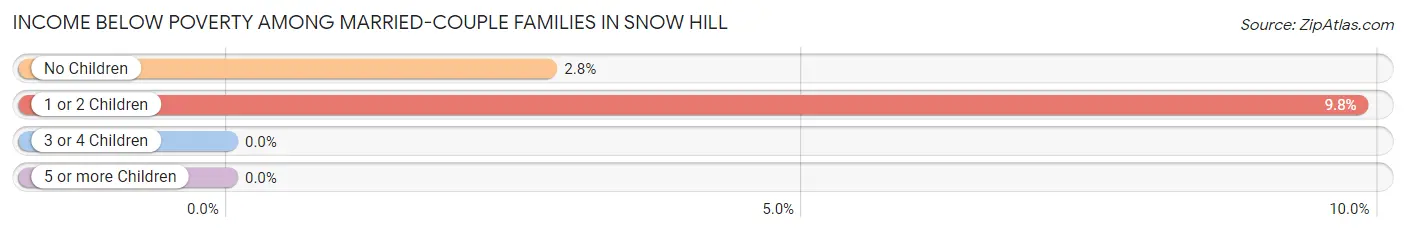
| Children | Above Poverty | Below Poverty |
| No Children | 175 (97.2%) | 5 (2.8%) |
| 1 or 2 Children | 55 (90.2%) | 6 (9.8%) |
| 3 or 4 Children | 26 (100.0%) | 0 (0.0%) |
| 5 or more Children | 0 (0.0%) | 0 (0.0%) |
| Total | 256 (95.9%) | 11 (4.1%) |
Income Below Poverty Among Single-Parent Households in Snow Hill
According to the poverty data in Snow Hill, 18.3% or 13 single-father households and 62.5% or 95 single-mother households are living below the poverty line. Among single-father households, those with 3 or 4 children have the highest poverty rate, with 13 households (37.1%) experiencing poverty. Likewise, among single-mother households, those with 3 or 4 children have the highest poverty rate, with 12 households (100.0%) falling below the poverty line.
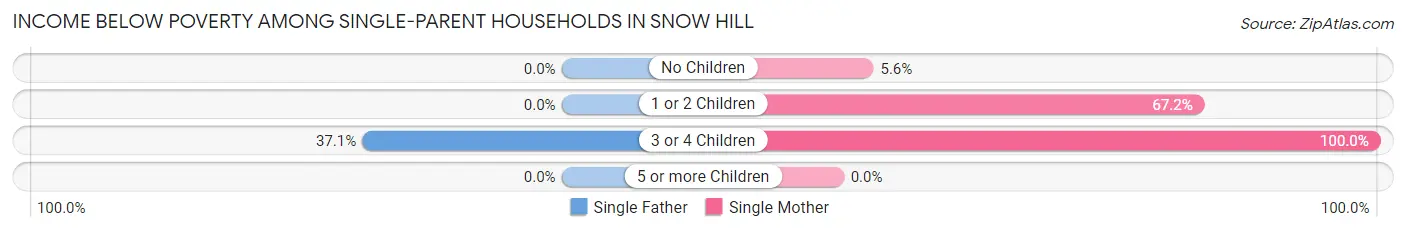
| Children | Single Father | Single Mother |
| No Children | 0 (0.0%) | 1 (5.6%) |
| 1 or 2 Children | 0 (0.0%) | 82 (67.2%) |
| 3 or 4 Children | 13 (37.1%) | 12 (100.0%) |
| 5 or more Children | 0 (0.0%) | 0 (0.0%) |
| Total | 13 (18.3%) | 95 (62.5%) |
Income Below Poverty Among Married-Couple vs Single-Parent Households in Snow Hill
The poverty data for Snow Hill shows that 11 of the married-couple family households (4.1%) and 108 of the single-parent households (48.4%) are living below the poverty level. Within the married-couple family households, those with 1 or 2 children have the highest poverty rate, with 6 households (9.8%) falling below the poverty line. Among the single-parent households, those with 1 or 2 children have the highest poverty rate, with 82 household (62.1%) living below poverty.
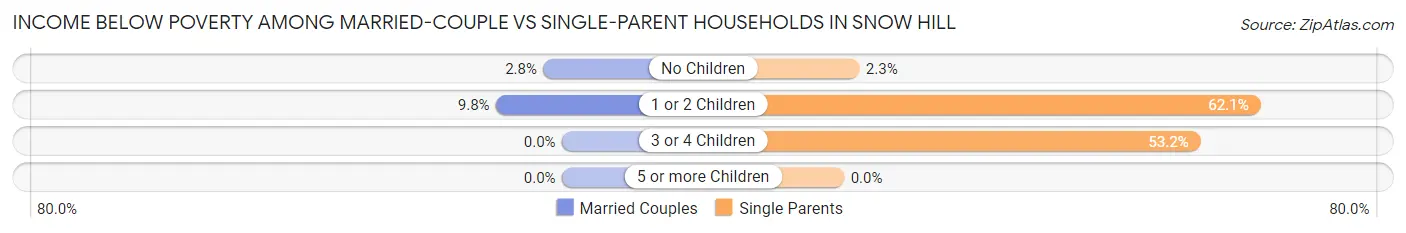
| Children | Married-Couple Families | Single-Parent Households |
| No Children | 5 (2.8%) | 1 (2.3%) |
| 1 or 2 Children | 6 (9.8%) | 82 (62.1%) |
| 3 or 4 Children | 0 (0.0%) | 25 (53.2%) |
| 5 or more Children | 0 (0.0%) | 0 (0.0%) |
| Total | 11 (4.1%) | 108 (48.4%) |
Race in Snow Hill
The most populous races in Snow Hill are Black / African American (878 | 42.0%), White / Caucasian (797 | 38.1%), and Two or more Races (356 | 17.0%).
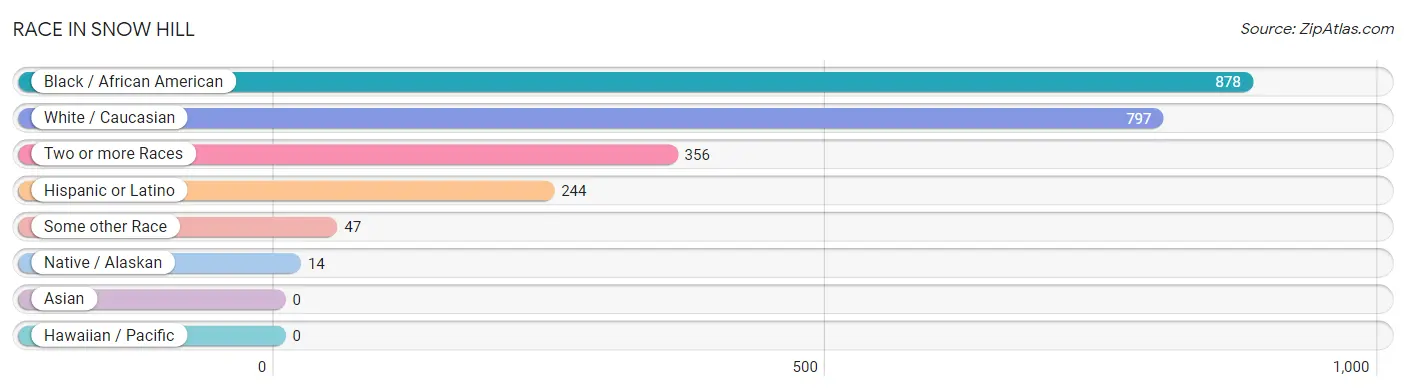
| Race | # Population | % Population |
| Asian | 0 | 0.0% |
| Black / African American | 878 | 42.0% |
| Hawaiian / Pacific | 0 | 0.0% |
| Hispanic or Latino | 244 | 11.7% |
| Native / Alaskan | 14 | 0.7% |
| White / Caucasian | 797 | 38.1% |
| Two or more Races | 356 | 17.0% |
| Some other Race | 47 | 2.2% |
| Total | 2,092 | 100.0% |
Ancestry in Snow Hill
The most populous ancestries reported in Snow Hill are English (173 | 8.3%), Mexican (156 | 7.5%), German (144 | 6.9%), American (113 | 5.4%), and Subsaharan African (97 | 4.6%), together accounting for 32.7% of all Snow Hill residents.
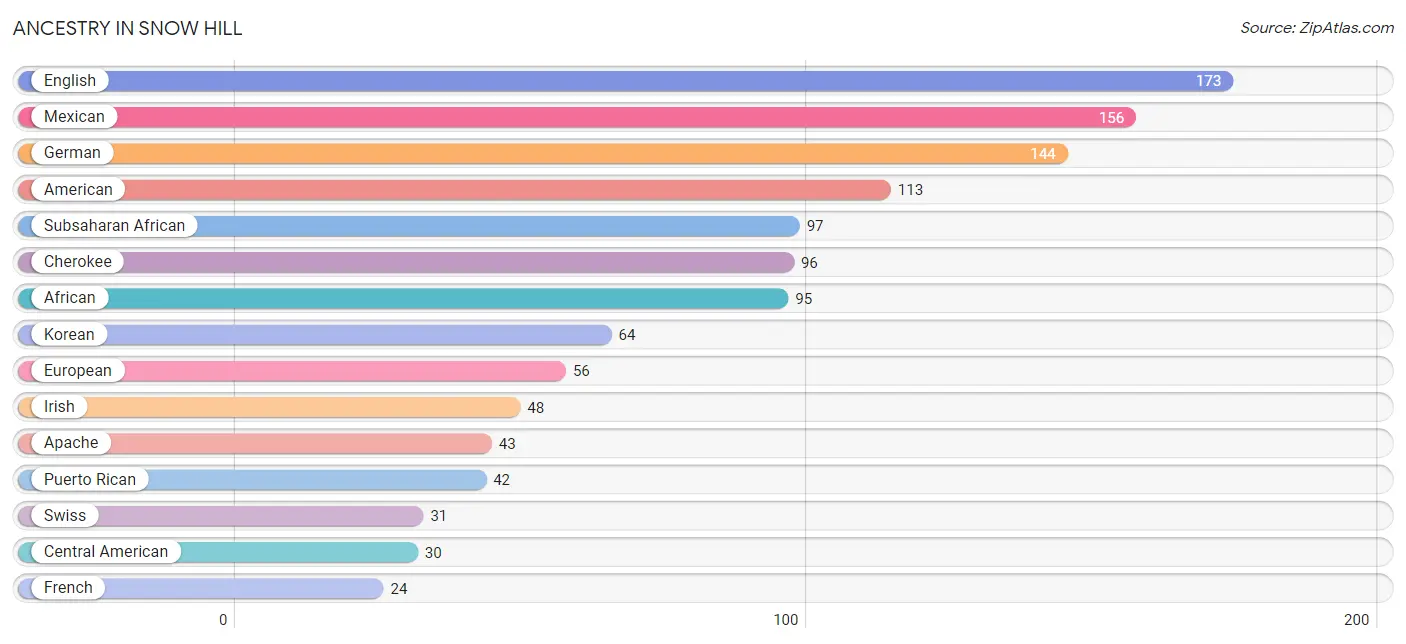
| Ancestry | # Population | % Population |
| African | 95 | 4.5% |
| American | 113 | 5.4% |
| Apache | 43 | 2.1% |
| Bhutanese | 2 | 0.1% |
| Central American | 30 | 1.4% |
| Cherokee | 96 | 4.6% |
| Dutch | 7 | 0.3% |
| English | 173 | 8.3% |
| European | 56 | 2.7% |
| French | 24 | 1.1% |
| French Canadian | 2 | 0.1% |
| German | 144 | 6.9% |
| Guatemalan | 19 | 0.9% |
| Honduran | 11 | 0.5% |
| Irish | 48 | 2.3% |
| Italian | 23 | 1.1% |
| Jamaican | 4 | 0.2% |
| Korean | 64 | 3.1% |
| Mexican | 156 | 7.5% |
| Pakistani | 18 | 0.9% |
| Puerto Rican | 42 | 2.0% |
| Russian | 3 | 0.1% |
| Scotch-Irish | 14 | 0.7% |
| Scottish | 19 | 0.9% |
| South African | 2 | 0.1% |
| South American | 11 | 0.5% |
| Subsaharan African | 97 | 4.6% |
| Swedish | 17 | 0.8% |
| Swiss | 31 | 1.5% |
| Venezuelan | 11 | 0.5% | View All 30 Rows |
Immigrants in Snow Hill
The most numerous immigrant groups reported in Snow Hill came from Latin America (95 | 4.5%), Central America (80 | 3.8%), Mexico (55 | 2.6%), Guatemala (14 | 0.7%), and Honduras (11 | 0.5%), together accounting for 12.2% of all Snow Hill residents.
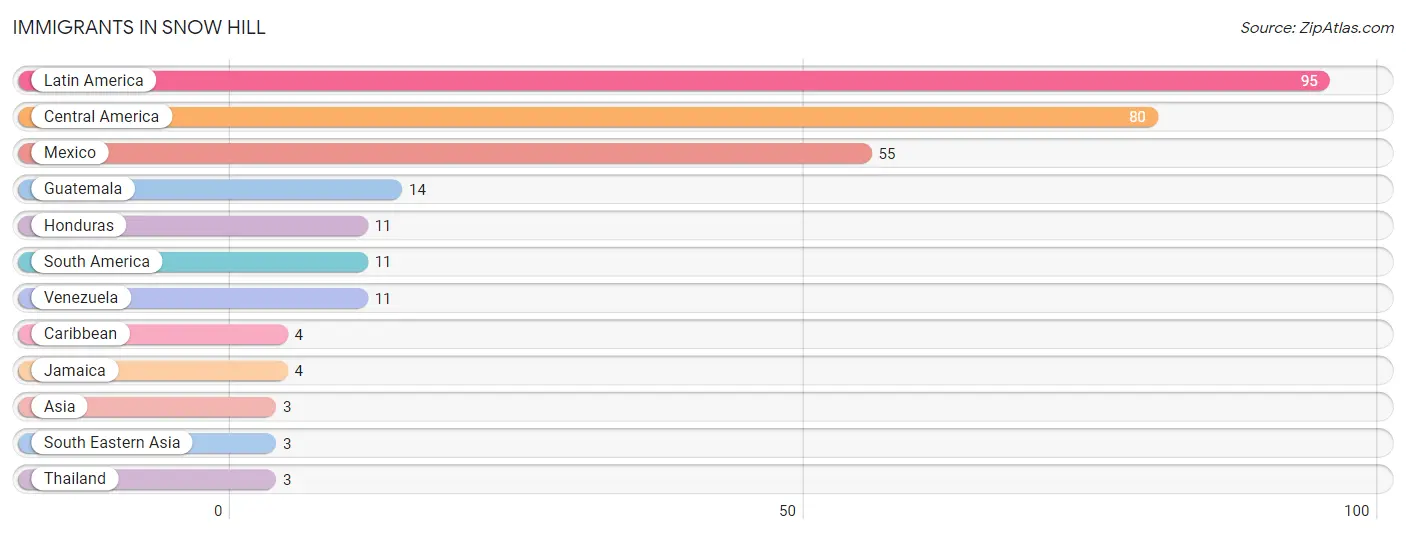
| Immigration Origin | # Population | % Population |
| Asia | 3 | 0.1% |
| Caribbean | 4 | 0.2% |
| Central America | 80 | 3.8% |
| Guatemala | 14 | 0.7% |
| Honduras | 11 | 0.5% |
| Jamaica | 4 | 0.2% |
| Latin America | 95 | 4.5% |
| Mexico | 55 | 2.6% |
| South America | 11 | 0.5% |
| South Eastern Asia | 3 | 0.1% |
| Thailand | 3 | 0.1% |
| Venezuela | 11 | 0.5% | View All 12 Rows |
Sex and Age in Snow Hill
Sex and Age in Snow Hill
The most populous age groups in Snow Hill are 5 to 9 Years (128 | 11.6%) for men and 40 to 44 Years (104 | 10.6%) for women.
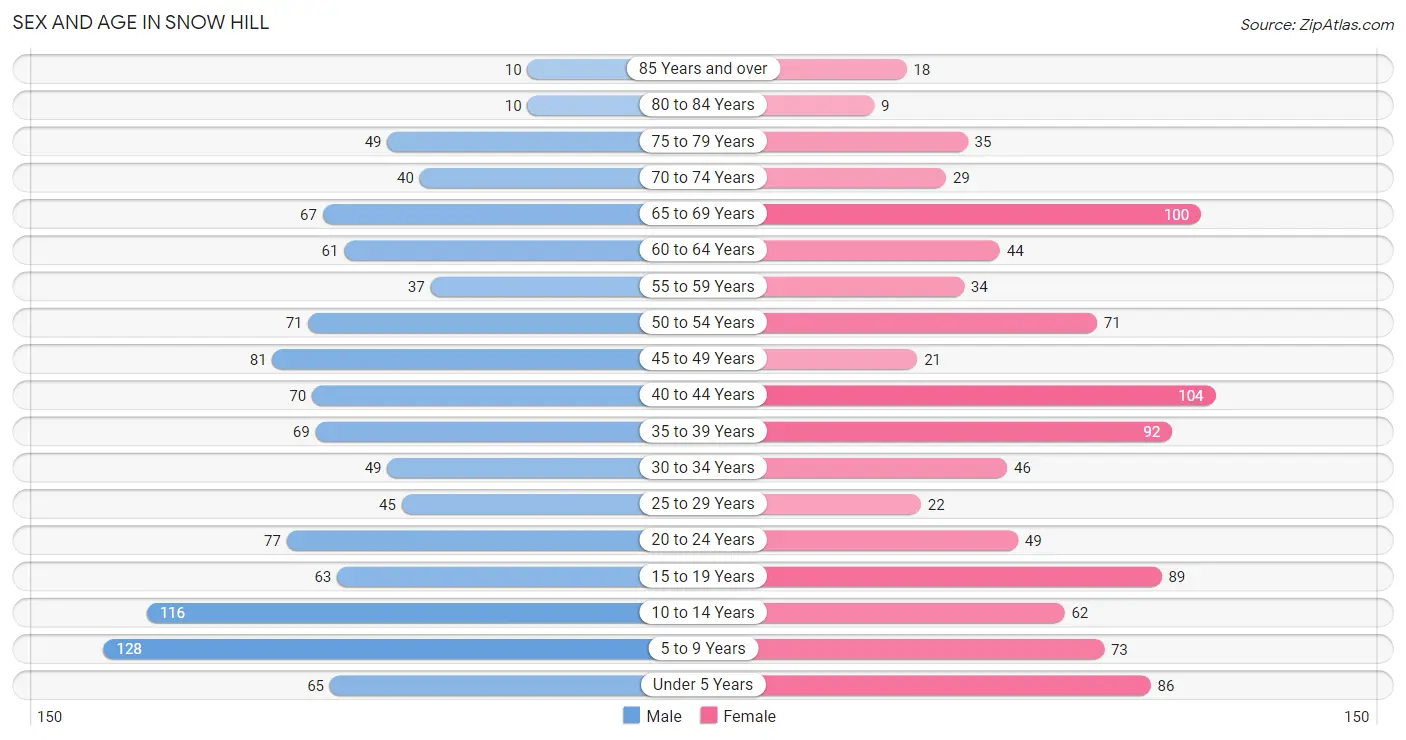
| Age Bracket | Male | Female |
| Under 5 Years | 65 (5.9%) | 86 (8.7%) |
| 5 to 9 Years | 128 (11.6%) | 73 (7.4%) |
| 10 to 14 Years | 116 (10.5%) | 62 (6.3%) |
| 15 to 19 Years | 63 (5.7%) | 89 (9.0%) |
| 20 to 24 Years | 77 (7.0%) | 49 (5.0%) |
| 25 to 29 Years | 45 (4.1%) | 22 (2.2%) |
| 30 to 34 Years | 49 (4.4%) | 46 (4.7%) |
| 35 to 39 Years | 69 (6.2%) | 92 (9.3%) |
| 40 to 44 Years | 70 (6.3%) | 104 (10.6%) |
| 45 to 49 Years | 81 (7.3%) | 21 (2.1%) |
| 50 to 54 Years | 71 (6.4%) | 71 (7.2%) |
| 55 to 59 Years | 37 (3.3%) | 34 (3.5%) |
| 60 to 64 Years | 61 (5.5%) | 44 (4.5%) |
| 65 to 69 Years | 67 (6.0%) | 100 (10.2%) |
| 70 to 74 Years | 40 (3.6%) | 29 (2.9%) |
| 75 to 79 Years | 49 (4.4%) | 35 (3.6%) |
| 80 to 84 Years | 10 (0.9%) | 9 (0.9%) |
| 85 Years and over | 10 (0.9%) | 18 (1.8%) |
| Total | 1,108 (100.0%) | 984 (100.0%) |
Families and Households in Snow Hill
Median Family Size in Snow Hill
The median family size in Snow Hill is 3.48 persons per family, with single female/mother families (152 | 31.0%) accounting for the largest median family size of 4.72 persons per family. On the other hand, married-couple families (267 | 54.5%) represent the smallest median family size with 2.90 persons per family.
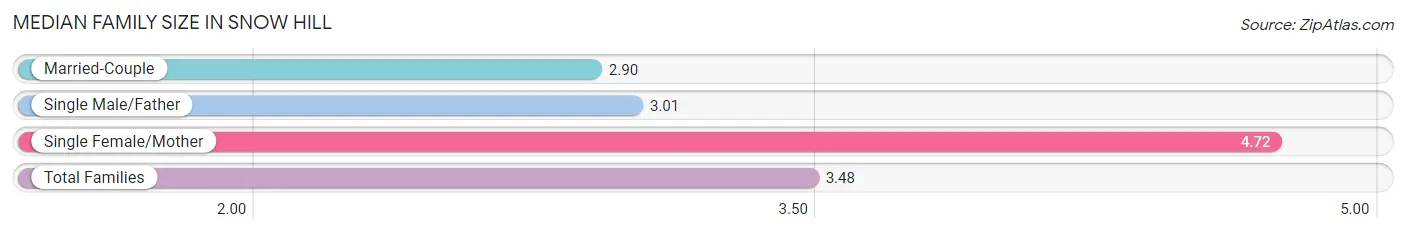
| Family Type | # Families | Family Size |
| Married-Couple | 267 (54.5%) | 2.90 |
| Single Male/Father | 71 (14.5%) | 3.01 |
| Single Female/Mother | 152 (31.0%) | 4.72 |
| Total Families | 490 (100.0%) | 3.48 |
Median Household Size in Snow Hill
The median household size in Snow Hill is 2.79 persons per household, with single female/mother households (152 | 20.6%) accounting for the largest median household size of 4.77 persons per household. non-family households (247 | 33.5%) represent the smallest median household size with 1.26 persons per household.
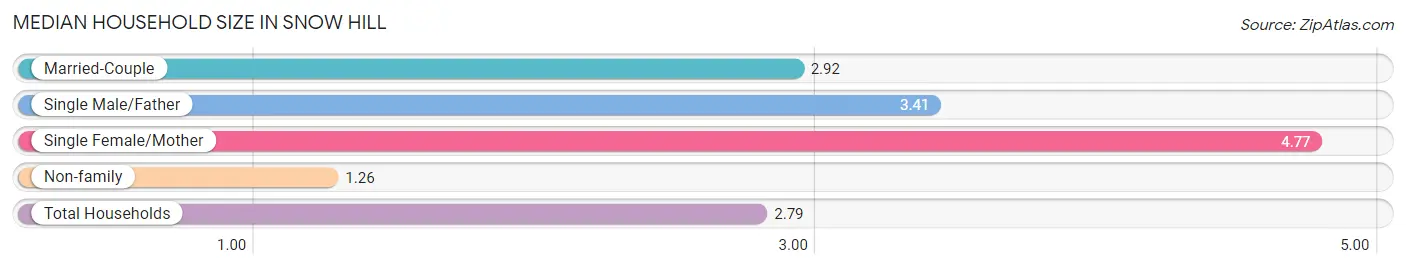
| Household Type | # Households | Household Size |
| Married-Couple | 267 (36.2%) | 2.92 |
| Single Male/Father | 71 (9.6%) | 3.41 |
| Single Female/Mother | 152 (20.6%) | 4.77 |
| Non-family | 247 (33.5%) | 1.26 |
| Total Households | 737 (100.0%) | 2.79 |
Household Size by Marriage Status in Snow Hill
Out of a total of 737 households in Snow Hill, 490 (66.5%) are family households, while 247 (33.5%) are nonfamily households. The most numerous type of family households are 2-person households, comprising 226, and the most common type of nonfamily households are 1-person households, comprising 221.
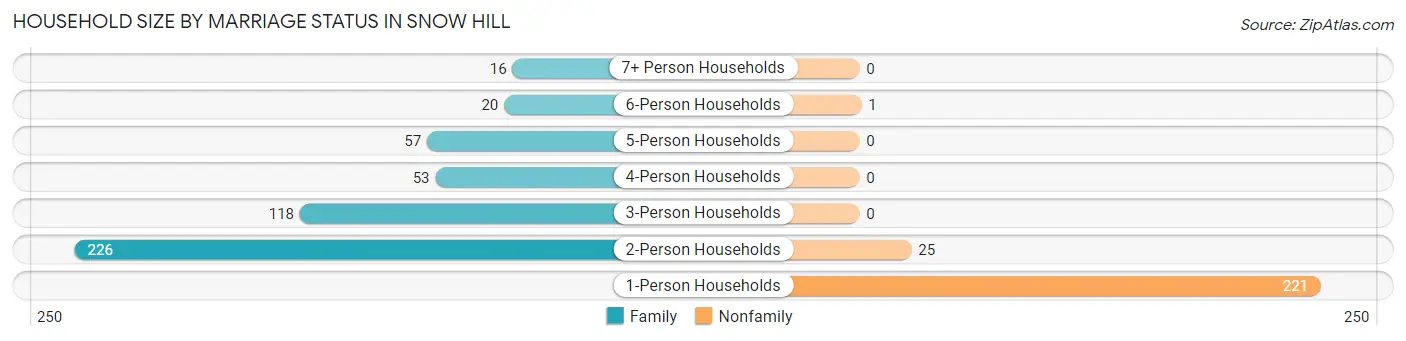
| Household Size | Family Households | Nonfamily Households |
| 1-Person Households | - | 221 (30.0%) |
| 2-Person Households | 226 (30.7%) | 25 (3.4%) |
| 3-Person Households | 118 (16.0%) | 0 (0.0%) |
| 4-Person Households | 53 (7.2%) | 0 (0.0%) |
| 5-Person Households | 57 (7.7%) | 0 (0.0%) |
| 6-Person Households | 20 (2.7%) | 1 (0.1%) |
| 7+ Person Households | 16 (2.2%) | 0 (0.0%) |
| Total | 490 (66.5%) | 247 (33.5%) |
Female Fertility in Snow Hill
Fertility by Age in Snow Hill
Average fertility rate in Snow Hill is 2.0 births per 1,000 women. Women in the age bracket of 20 to 34 years have the highest fertility rate with 9.0 births per 1,000 women. Women in the age bracket of 20 to 34 years acount for 100.0% of all women with births.
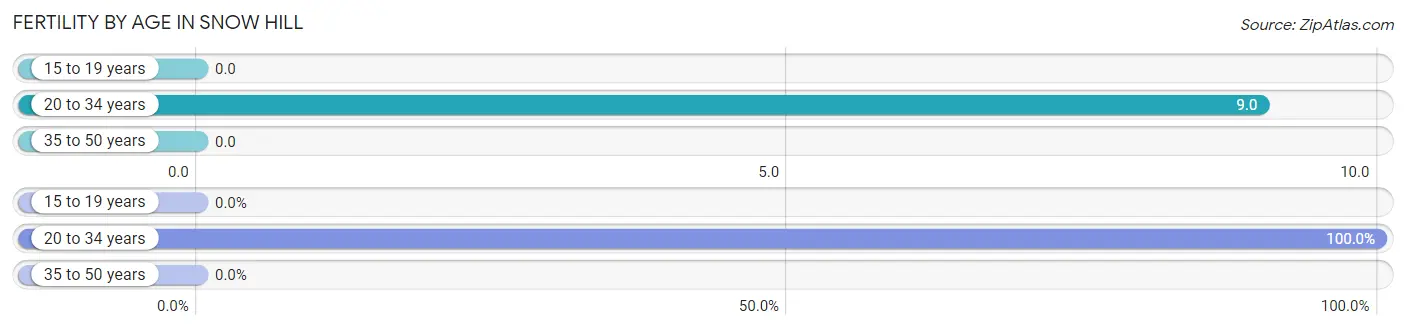
| Age Bracket | Women with Births | Births / 1,000 Women |
| 15 to 19 years | 0 (0.0%) | 0.0 |
| 20 to 34 years | 1 (100.0%) | 9.0 |
| 35 to 50 years | 0 (0.0%) | 0.0 |
| Total | 1 (100.0%) | 2.0 |
Fertility by Age by Marriage Status in Snow Hill
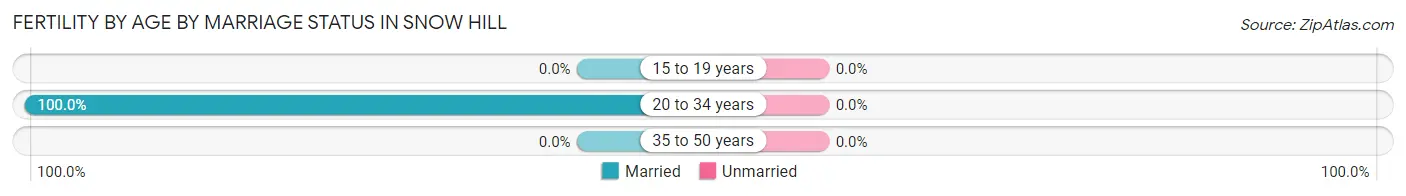
| Age Bracket | Married | Unmarried |
| 15 to 19 years | 0 (0.0%) | 0 (0.0%) |
| 20 to 34 years | 1 (100.0%) | 0 (0.0%) |
| 35 to 50 years | 0 (0.0%) | 0 (0.0%) |
| Total | 1 (100.0%) | 0 (0.0%) |
Fertility by Education in Snow Hill
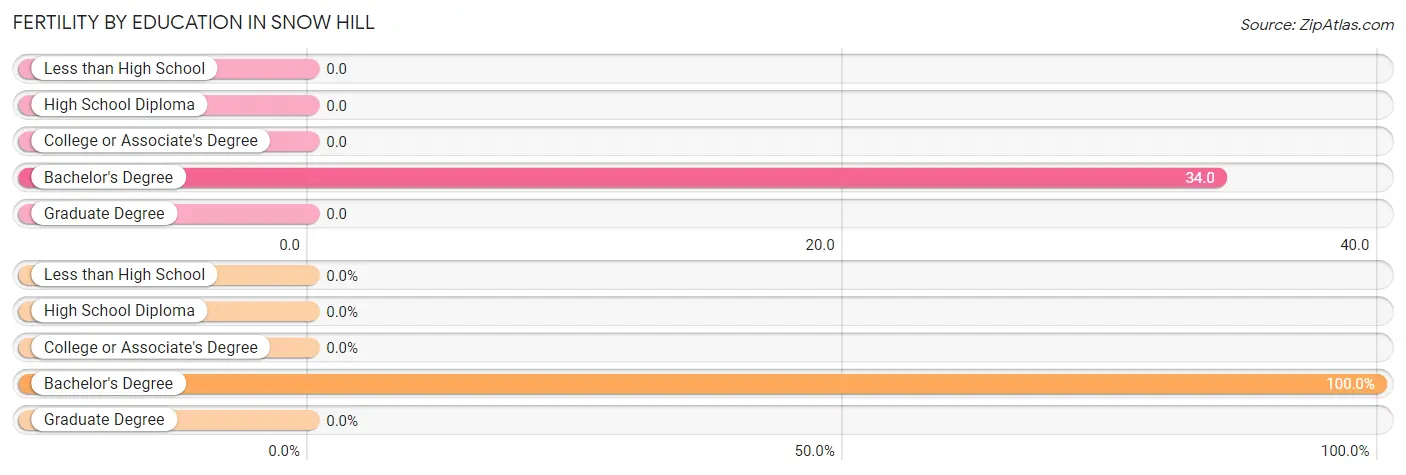
| Educational Attainment | Women with Births | Births / 1,000 Women |
| Less than High School | 0 (0.0%) | 0.0 |
| High School Diploma | 0 (0.0%) | 0.0 |
| College or Associate's Degree | 0 (0.0%) | 0.0 |
| Bachelor's Degree | 1 (100.0%) | 34.0 |
| Graduate Degree | 0 (0.0%) | 0.0 |
| Total | 1 (100.0%) | 2.0 |
Fertility by Education by Marriage Status in Snow Hill
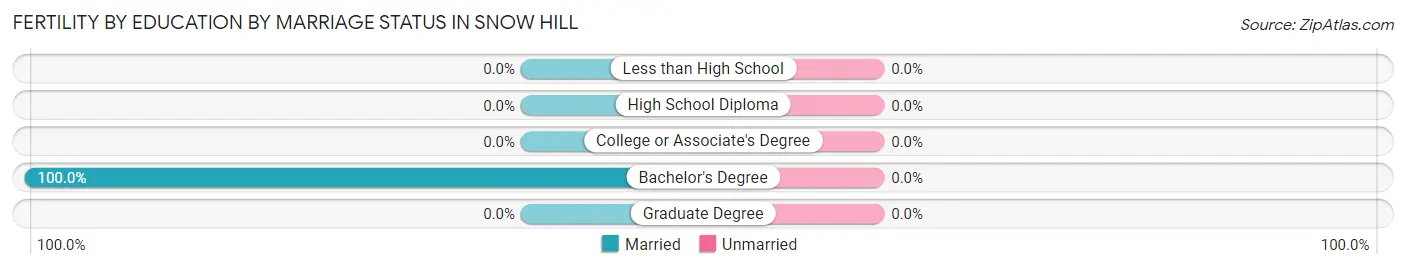
| Educational Attainment | Married | Unmarried |
| Less than High School | 0 (0.0%) | 0 (0.0%) |
| High School Diploma | 0 (0.0%) | 0 (0.0%) |
| College or Associate's Degree | 0 (0.0%) | 0 (0.0%) |
| Bachelor's Degree | 1 (100.0%) | 0 (0.0%) |
| Graduate Degree | 0 (0.0%) | 0 (0.0%) |
| Total | 1 (100.0%) | 0 (0.0%) |
Employment Characteristics in Snow Hill
Employment by Class of Employer in Snow Hill
Among the 709 employed individuals in Snow Hill, private company employees (435 | 61.4%), state government employees (121 | 17.1%), and local government employees (53 | 7.5%) make up the most common classes of employment.
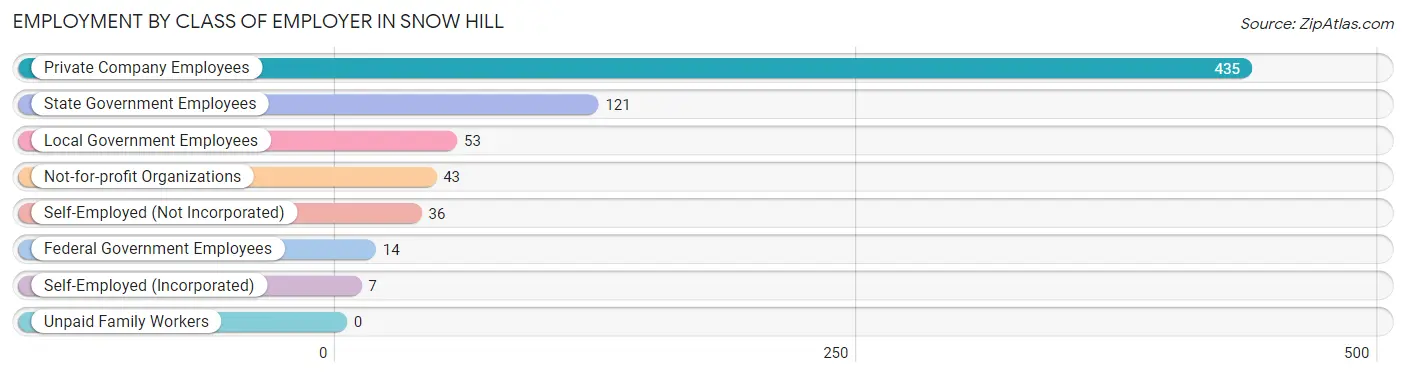
| Employer Class | # Employees | % Employees |
| Private Company Employees | 435 | 61.4% |
| Self-Employed (Incorporated) | 7 | 1.0% |
| Self-Employed (Not Incorporated) | 36 | 5.1% |
| Not-for-profit Organizations | 43 | 6.1% |
| Local Government Employees | 53 | 7.5% |
| State Government Employees | 121 | 17.1% |
| Federal Government Employees | 14 | 2.0% |
| Unpaid Family Workers | 0 | 0.0% |
| Total | 709 | 100.0% |
Employment Status by Age in Snow Hill
According to the labor force statistics for Snow Hill, out of the total population over 16 years of age (1,530), 50.7% or 776 individuals are in the labor force, with 5.5% or 43 of them unemployed. The age group with the highest labor force participation rate is 20 to 24 years, with 95.2% or 120 individuals in the labor force. Within the labor force, the 30 to 34 years age range has the highest percentage of unemployed individuals, with 19.4% or 14 of them being unemployed.
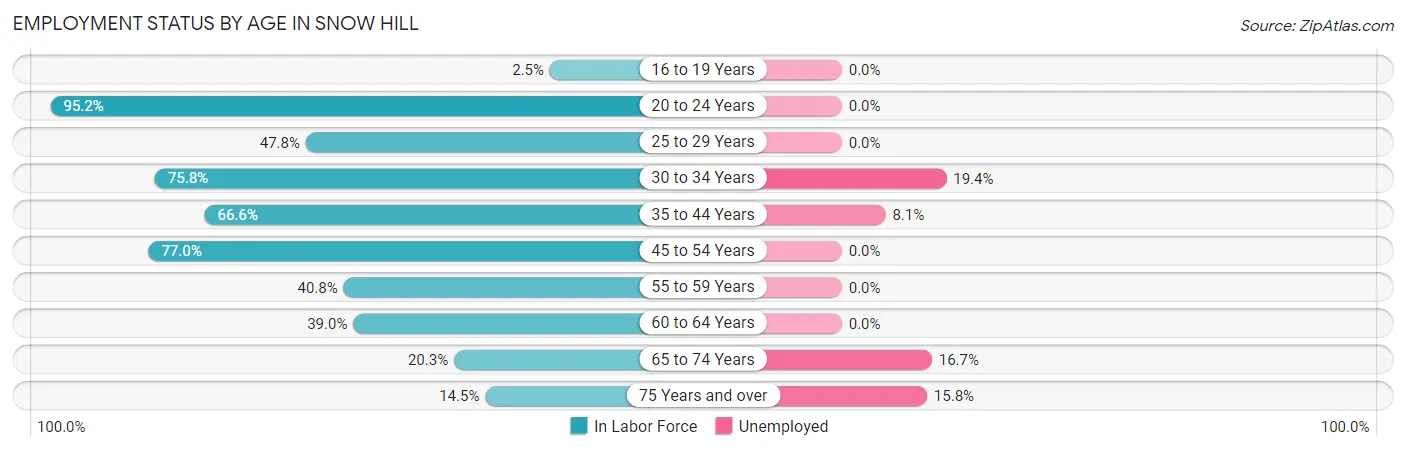
| Age Bracket | In Labor Force | Unemployed |
| 16 to 19 Years | 3 (2.5%) | 0 (0.0%) |
| 20 to 24 Years | 120 (95.2%) | 0 (0.0%) |
| 25 to 29 Years | 32 (47.8%) | 0 (0.0%) |
| 30 to 34 Years | 72 (75.8%) | 14 (19.4%) |
| 35 to 44 Years | 223 (66.6%) | 18 (8.1%) |
| 45 to 54 Years | 188 (77.0%) | 0 (0.0%) |
| 55 to 59 Years | 29 (40.8%) | 0 (0.0%) |
| 60 to 64 Years | 41 (39.0%) | 0 (0.0%) |
| 65 to 74 Years | 48 (20.3%) | 8 (16.7%) |
| 75 Years and over | 19 (14.5%) | 3 (15.8%) |
| Total | 776 (50.7%) | 43 (5.5%) |
Employment Status by Educational Attainment in Snow Hill
According to labor force statistics for Snow Hill, 63.8% of individuals (585) out of the total population between 25 and 64 years of age (917) are in the labor force, with 5.5% or 32 of them being unemployed. The group with the highest labor force participation rate are those with the educational attainment of college / associate degree, with 86.1% or 278 individuals in the labor force. Within the labor force, individuals with high school diploma education have the highest percentage of unemployment, with 10.0% or 18 of them being unemployed.
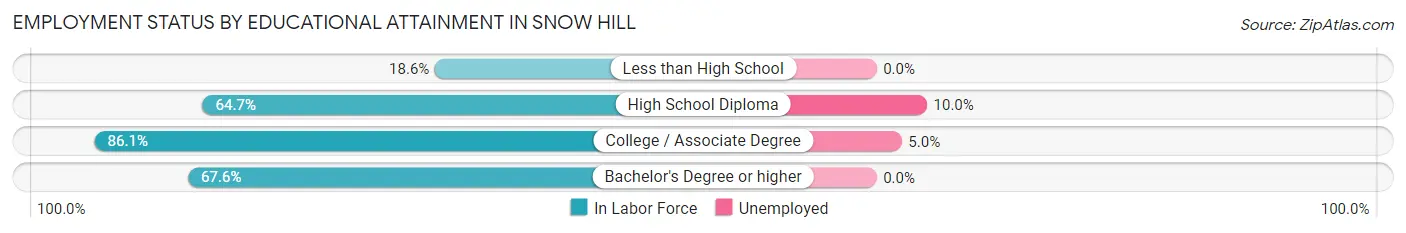
| Educational Attainment | In Labor Force | Unemployed |
| Less than High School | 33 (18.6%) | 0 (0.0%) |
| High School Diploma | 180 (64.7%) | 28 (10.0%) |
| College / Associate Degree | 278 (86.1%) | 16 (5.0%) |
| Bachelor's Degree or higher | 94 (67.6%) | 0 (0.0%) |
| Total | 585 (63.8%) | 50 (5.5%) |
Employment Occupations by Sex in Snow Hill
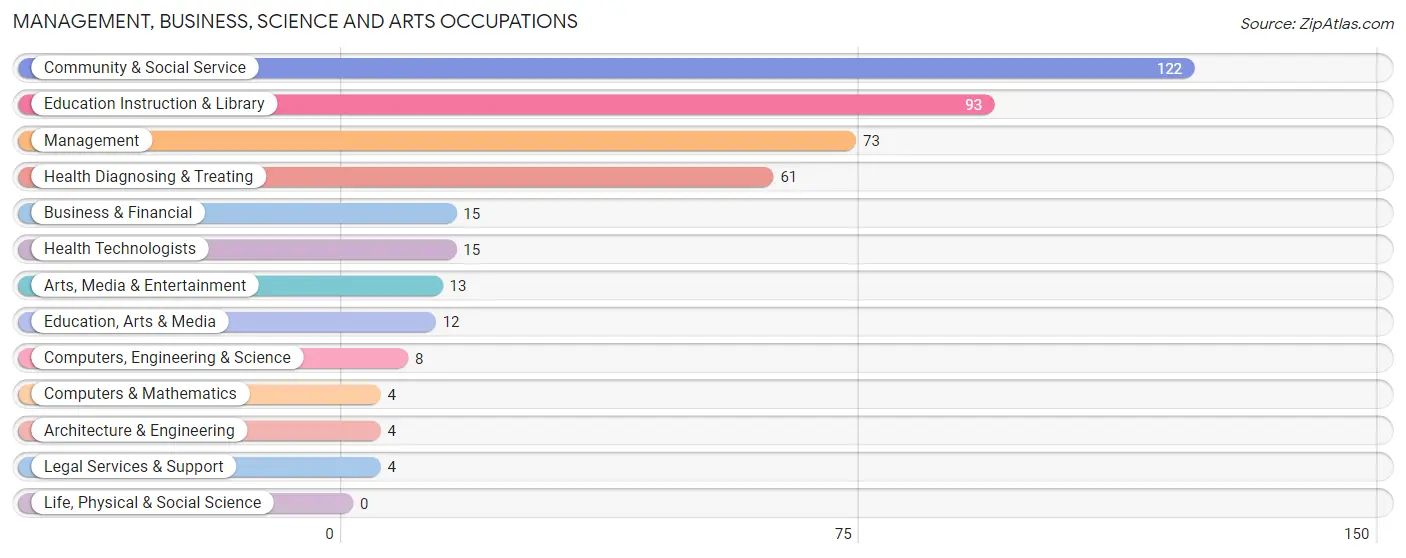
Management, Business, Science and Arts Occupations
The most common Management, Business, Science and Arts occupations in Snow Hill are Community & Social Service (122 | 16.7%), Education Instruction & Library (93 | 12.7%), Management (73 | 10.0%), Health Diagnosing & Treating (61 | 8.3%), and Business & Financial (15 | 2.1%).
Management, Business, Science and Arts Occupations by Sex
Within the Management, Business, Science and Arts occupations in Snow Hill, the most male-oriented occupations are Architecture & Engineering (100.0%), Legal Services & Support (100.0%), and Management (78.1%), while the most female-oriented occupations are Computers & Mathematics (100.0%), Arts, Media & Entertainment (100.0%), and Health Technologists (80.0%).
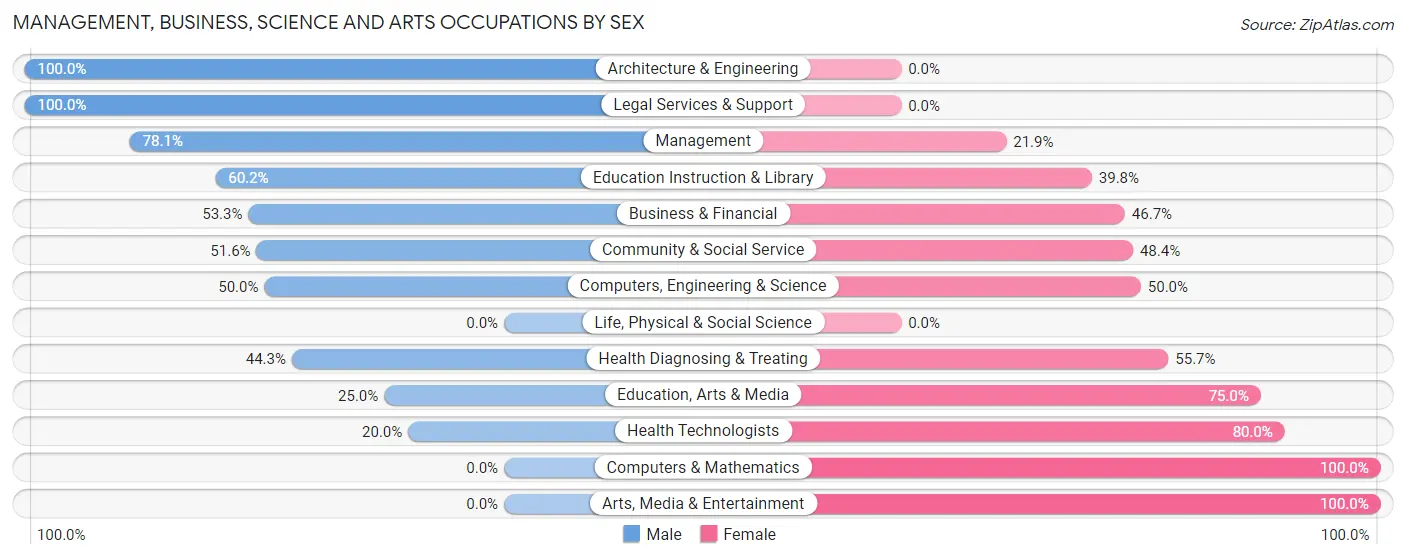
| Occupation | Male | Female |
| Management | 57 (78.1%) | 16 (21.9%) |
| Business & Financial | 8 (53.3%) | 7 (46.7%) |
| Computers, Engineering & Science | 4 (50.0%) | 4 (50.0%) |
| Computers & Mathematics | 0 (0.0%) | 4 (100.0%) |
| Architecture & Engineering | 4 (100.0%) | 0 (0.0%) |
| Life, Physical & Social Science | 0 (0.0%) | 0 (0.0%) |
| Community & Social Service | 63 (51.6%) | 59 (48.4%) |
| Education, Arts & Media | 3 (25.0%) | 9 (75.0%) |
| Legal Services & Support | 4 (100.0%) | 0 (0.0%) |
| Education Instruction & Library | 56 (60.2%) | 37 (39.8%) |
| Arts, Media & Entertainment | 0 (0.0%) | 13 (100.0%) |
| Health Diagnosing & Treating | 27 (44.3%) | 34 (55.7%) |
| Health Technologists | 3 (20.0%) | 12 (80.0%) |
| Total (Category) | 159 (57.0%) | 120 (43.0%) |
| Total (Overall) | 411 (56.1%) | 321 (43.9%) |
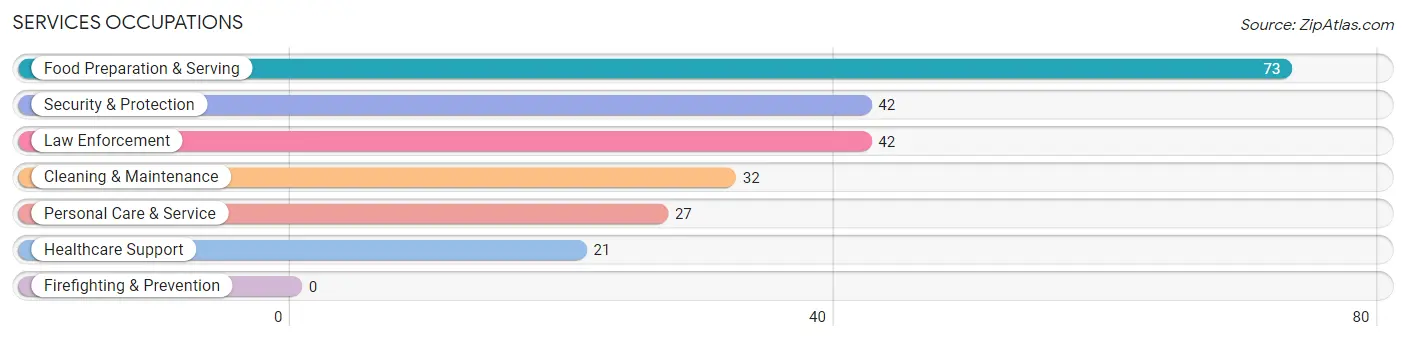
Services Occupations
The most common Services occupations in Snow Hill are Food Preparation & Serving (73 | 10.0%), Security & Protection (42 | 5.7%), Law Enforcement (42 | 5.7%), Cleaning & Maintenance (32 | 4.4%), and Personal Care & Service (27 | 3.7%).
Services Occupations by Sex
Within the Services occupations in Snow Hill, the most male-oriented occupations are Security & Protection (97.6%), Law Enforcement (97.6%), and Cleaning & Maintenance (84.4%), while the most female-oriented occupations are Healthcare Support (100.0%), Personal Care & Service (100.0%), and Food Preparation & Serving (49.3%).
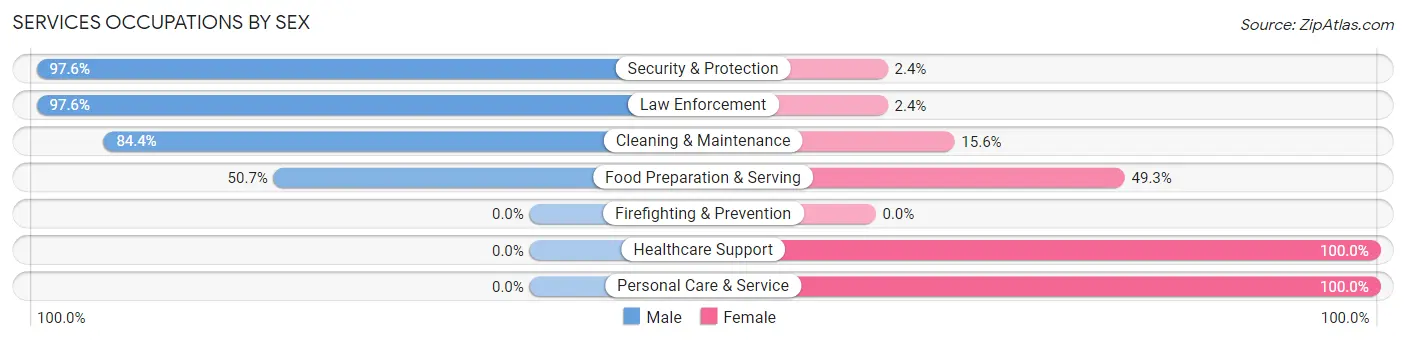
| Occupation | Male | Female |
| Healthcare Support | 0 (0.0%) | 21 (100.0%) |
| Security & Protection | 41 (97.6%) | 1 (2.4%) |
| Firefighting & Prevention | 0 (0.0%) | 0 (0.0%) |
| Law Enforcement | 41 (97.6%) | 1 (2.4%) |
| Food Preparation & Serving | 37 (50.7%) | 36 (49.3%) |
| Cleaning & Maintenance | 27 (84.4%) | 5 (15.6%) |
| Personal Care & Service | 0 (0.0%) | 27 (100.0%) |
| Total (Category) | 105 (53.8%) | 90 (46.2%) |
| Total (Overall) | 411 (56.1%) | 321 (43.9%) |
Sales and Office Occupations
The most common Sales and Office occupations in Snow Hill are Sales & Related (71 | 9.7%), and Office & Administration (45 | 6.1%).

Sales and Office Occupations by Sex
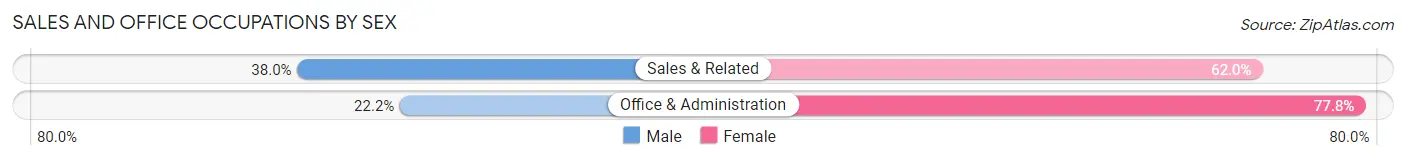
| Occupation | Male | Female |
| Sales & Related | 27 (38.0%) | 44 (62.0%) |
| Office & Administration | 10 (22.2%) | 35 (77.8%) |
| Total (Category) | 37 (31.9%) | 79 (68.1%) |
| Total (Overall) | 411 (56.1%) | 321 (43.9%) |
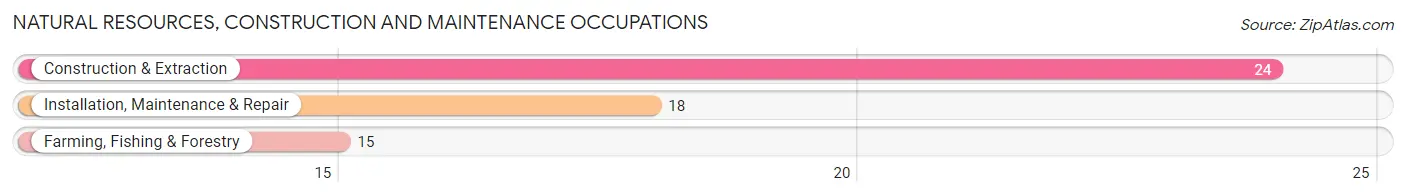
Natural Resources, Construction and Maintenance Occupations
The most common Natural Resources, Construction and Maintenance occupations in Snow Hill are Construction & Extraction (24 | 3.3%), Installation, Maintenance & Repair (18 | 2.5%), and Farming, Fishing & Forestry (15 | 2.1%).
Natural Resources, Construction and Maintenance Occupations by Sex
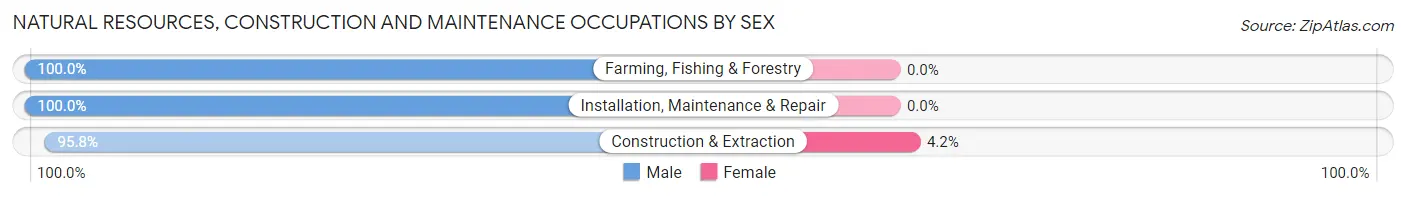
| Occupation | Male | Female |
| Farming, Fishing & Forestry | 15 (100.0%) | 0 (0.0%) |
| Construction & Extraction | 23 (95.8%) | 1 (4.2%) |
| Installation, Maintenance & Repair | 18 (100.0%) | 0 (0.0%) |
| Total (Category) | 56 (98.3%) | 1 (1.8%) |
| Total (Overall) | 411 (56.1%) | 321 (43.9%) |
Production, Transportation and Moving Occupations
The most common Production, Transportation and Moving occupations in Snow Hill are Transportation (39 | 5.3%), Production (37 | 5.1%), and Material Moving (9 | 1.2%).
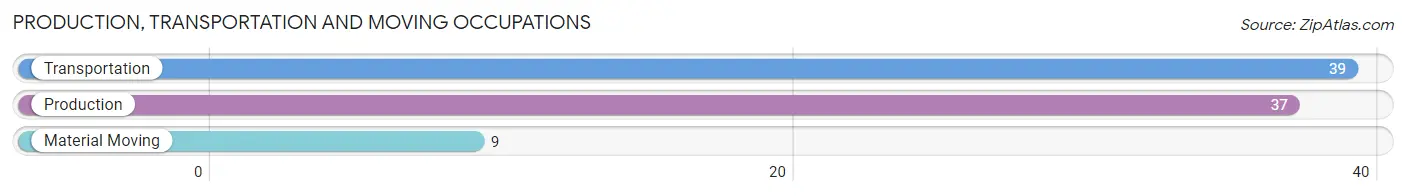
Production, Transportation and Moving Occupations by Sex
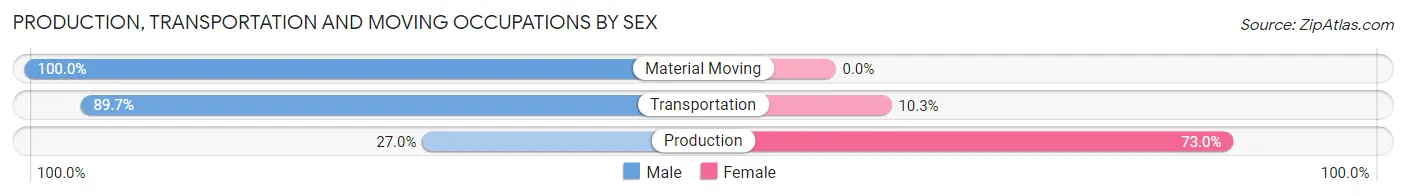
| Occupation | Male | Female |
| Production | 10 (27.0%) | 27 (73.0%) |
| Transportation | 35 (89.7%) | 4 (10.3%) |
| Material Moving | 9 (100.0%) | 0 (0.0%) |
| Total (Category) | 54 (63.5%) | 31 (36.5%) |
| Total (Overall) | 411 (56.1%) | 321 (43.9%) |
Employment Industries by Sex in Snow Hill
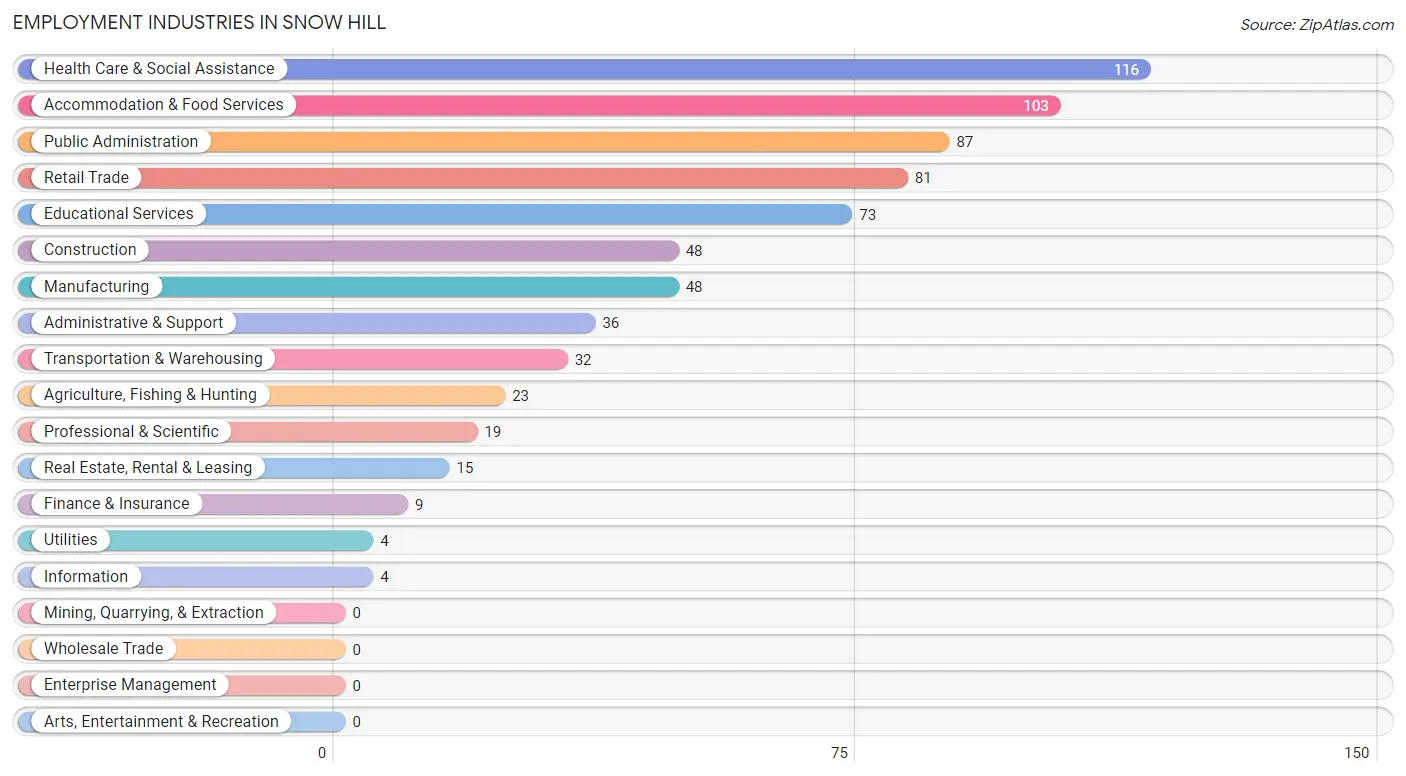
Employment Industries in Snow Hill
The major employment industries in Snow Hill include Health Care & Social Assistance (116 | 15.9%), Accommodation & Food Services (103 | 14.1%), Public Administration (87 | 11.9%), Retail Trade (81 | 11.1%), and Educational Services (73 | 10.0%).
Employment Industries by Sex in Snow Hill
The Snow Hill industries that see more men than women are Agriculture, Fishing & Hunting (100.0%), Transportation & Warehousing (100.0%), and Utilities (100.0%), whereas the industries that tend to have a higher number of women are Information (100.0%), Professional & Scientific (78.9%), and Health Care & Social Assistance (73.3%).
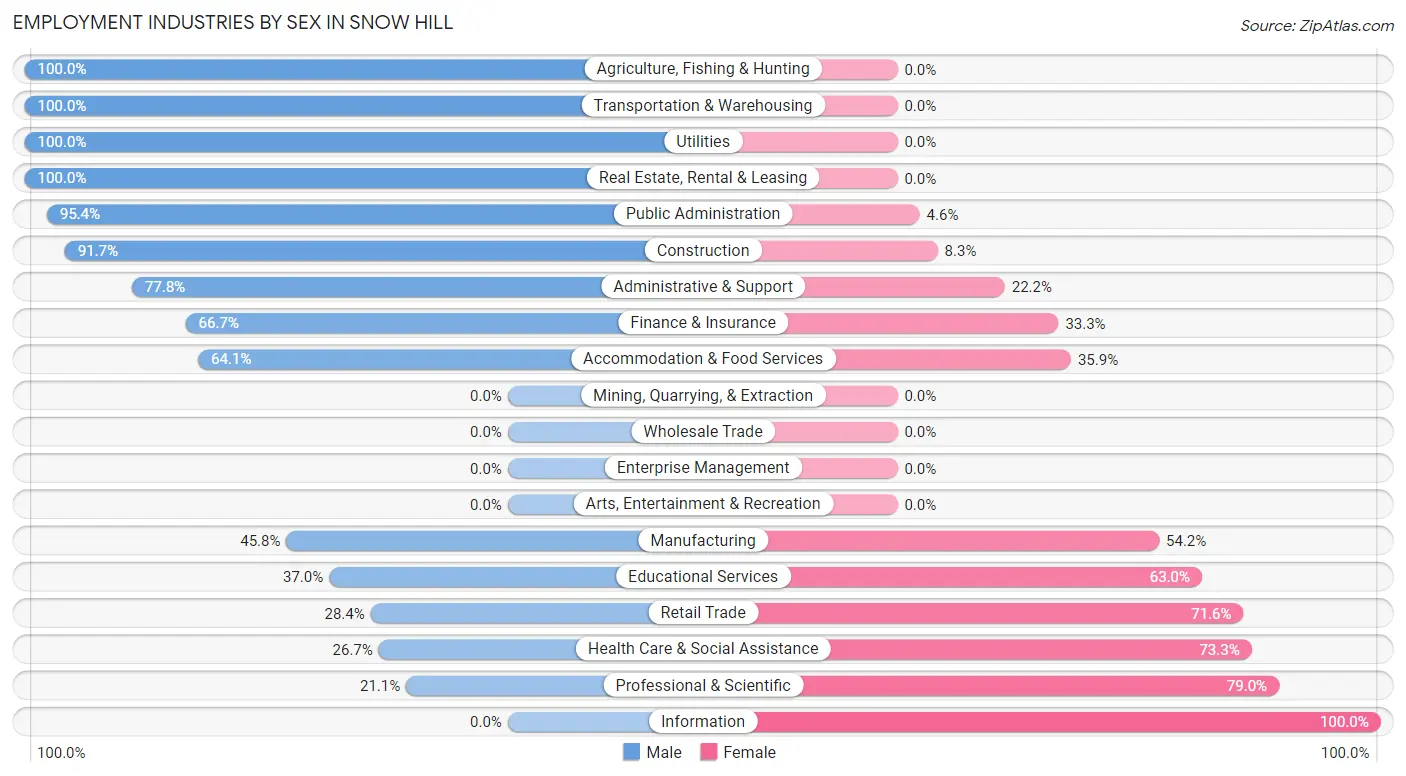
| Industry | Male | Female |
| Agriculture, Fishing & Hunting | 23 (100.0%) | 0 (0.0%) |
| Mining, Quarrying, & Extraction | 0 (0.0%) | 0 (0.0%) |
| Construction | 44 (91.7%) | 4 (8.3%) |
| Manufacturing | 22 (45.8%) | 26 (54.2%) |
| Wholesale Trade | 0 (0.0%) | 0 (0.0%) |
| Retail Trade | 23 (28.4%) | 58 (71.6%) |
| Transportation & Warehousing | 32 (100.0%) | 0 (0.0%) |
| Utilities | 4 (100.0%) | 0 (0.0%) |
| Information | 0 (0.0%) | 4 (100.0%) |
| Finance & Insurance | 6 (66.7%) | 3 (33.3%) |
| Real Estate, Rental & Leasing | 15 (100.0%) | 0 (0.0%) |
| Professional & Scientific | 4 (21.0%) | 15 (78.9%) |
| Enterprise Management | 0 (0.0%) | 0 (0.0%) |
| Administrative & Support | 28 (77.8%) | 8 (22.2%) |
| Educational Services | 27 (37.0%) | 46 (63.0%) |
| Health Care & Social Assistance | 31 (26.7%) | 85 (73.3%) |
| Arts, Entertainment & Recreation | 0 (0.0%) | 0 (0.0%) |
| Accommodation & Food Services | 66 (64.1%) | 37 (35.9%) |
| Public Administration | 83 (95.4%) | 4 (4.6%) |
| Total | 411 (56.1%) | 321 (43.9%) |
Education in Snow Hill
School Enrollment in Snow Hill
The most common levels of schooling among the 608 students in Snow Hill are elementary school (182 | 29.9%), high school (170 | 28.0%), and middle school (93 | 15.3%).
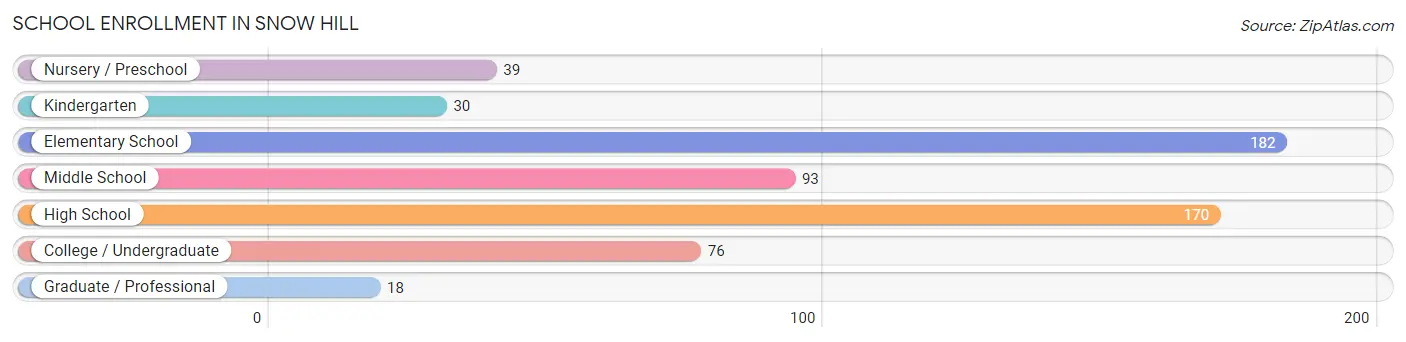
| School Level | # Students | % Students |
| Nursery / Preschool | 39 | 6.4% |
| Kindergarten | 30 | 4.9% |
| Elementary School | 182 | 29.9% |
| Middle School | 93 | 15.3% |
| High School | 170 | 28.0% |
| College / Undergraduate | 76 | 12.5% |
| Graduate / Professional | 18 | 3.0% |
| Total | 608 | 100.0% |
School Enrollment by Age by Funding Source in Snow Hill
Out of a total of 608 students who are enrolled in schools in Snow Hill, 26 (4.3%) attend a private institution, while the remaining 582 (95.7%) are enrolled in public schools. The age group of 35 years and over has the highest likelihood of being enrolled in private schools, with 3 (11.5% in the age bracket) enrolled. Conversely, the age group of 3 to 4 year olds has the lowest likelihood of being enrolled in a private school, with 15 (100.0% in the age bracket) attending a public institution.
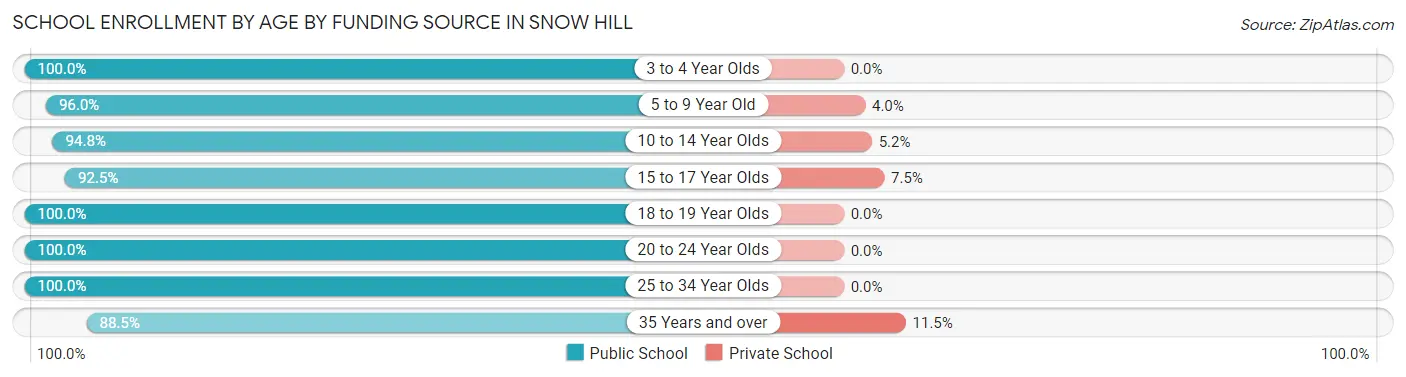
| Age Bracket | Public School | Private School |
| 3 to 4 Year Olds | 15 (100.0%) | 0 (0.0%) |
| 5 to 9 Year Old | 193 (96.0%) | 8 (4.0%) |
| 10 to 14 Year Olds | 145 (94.8%) | 8 (5.2%) |
| 15 to 17 Year Olds | 86 (92.5%) | 7 (7.5%) |
| 18 to 19 Year Olds | 22 (100.0%) | 0 (0.0%) |
| 20 to 24 Year Olds | 68 (100.0%) | 0 (0.0%) |
| 25 to 34 Year Olds | 30 (100.0%) | 0 (0.0%) |
| 35 Years and over | 23 (88.5%) | 3 (11.5%) |
| Total | 582 (95.7%) | 26 (4.3%) |
Educational Attainment by Field of Study in Snow Hill
Arts & humanities (46 | 20.5%), education (37 | 16.5%), liberal arts & history (31 | 13.8%), business (29 | 13.0%), and science & technology (25 | 11.2%) are the most common fields of study among 224 individuals in Snow Hill who have obtained a bachelor's degree or higher.
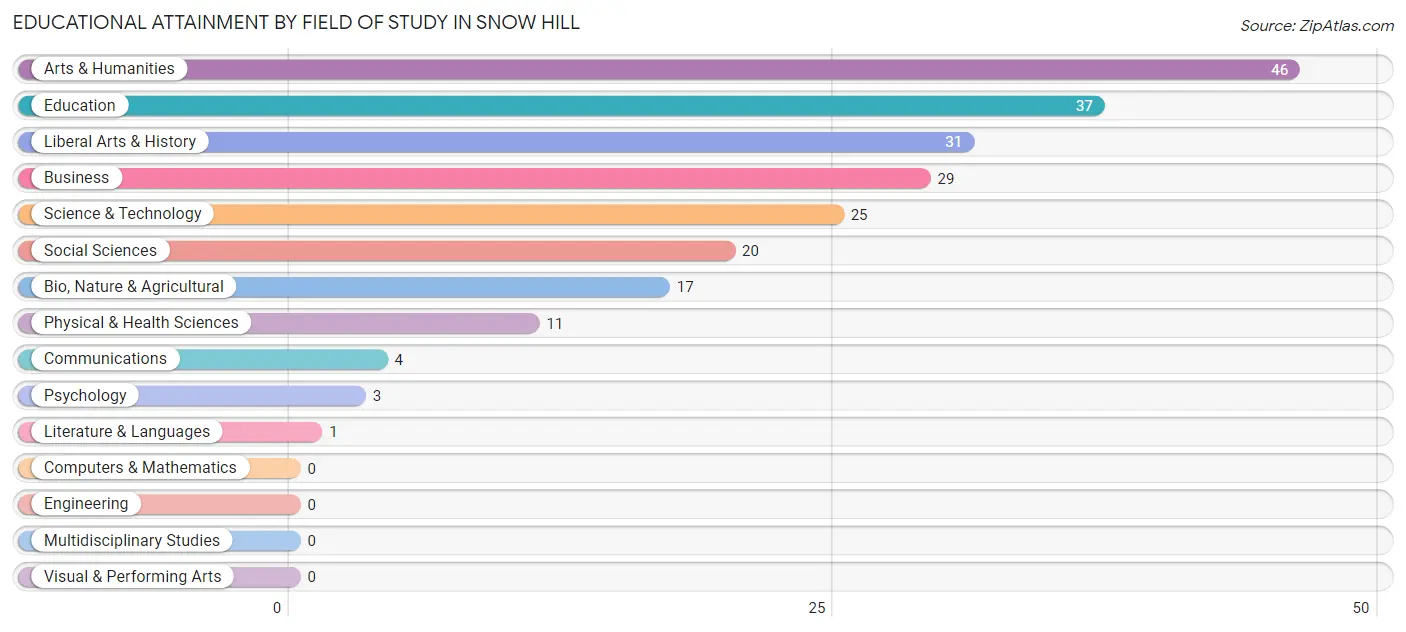
| Field of Study | # Graduates | % Graduates |
| Computers & Mathematics | 0 | 0.0% |
| Bio, Nature & Agricultural | 17 | 7.6% |
| Physical & Health Sciences | 11 | 4.9% |
| Psychology | 3 | 1.3% |
| Social Sciences | 20 | 8.9% |
| Engineering | 0 | 0.0% |
| Multidisciplinary Studies | 0 | 0.0% |
| Science & Technology | 25 | 11.2% |
| Business | 29 | 13.0% |
| Education | 37 | 16.5% |
| Literature & Languages | 1 | 0.4% |
| Liberal Arts & History | 31 | 13.8% |
| Visual & Performing Arts | 0 | 0.0% |
| Communications | 4 | 1.8% |
| Arts & Humanities | 46 | 20.5% |
| Total | 224 | 100.0% |
Transportation & Commute in Snow Hill
Vehicle Availability by Sex in Snow Hill
The most prevalent vehicle ownership categories in Snow Hill are males with 2 vehicles (153, accounting for 38.9%) and females with 2 vehicles (106, making up 50.8%).
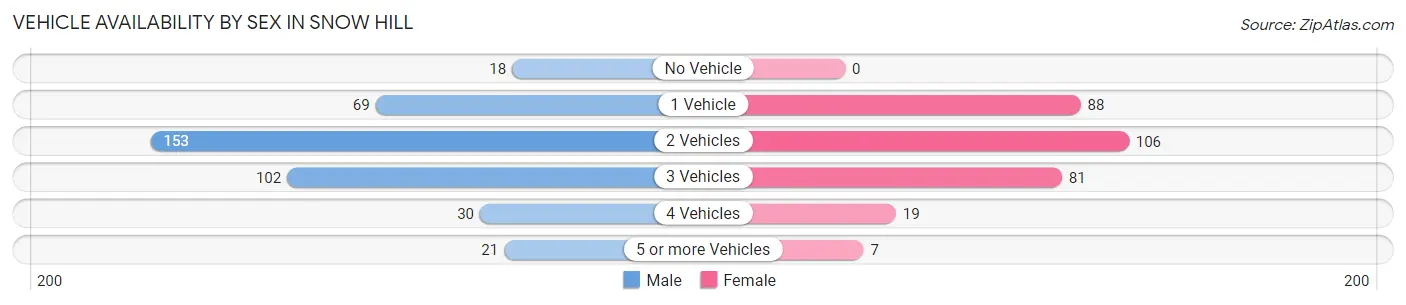
| Vehicles Available | Male | Female |
| No Vehicle | 18 (4.6%) | 0 (0.0%) |
| 1 Vehicle | 69 (17.6%) | 88 (29.2%) |
| 2 Vehicles | 153 (38.9%) | 106 (35.2%) |
| 3 Vehicles | 102 (26.0%) | 81 (26.9%) |
| 4 Vehicles | 30 (7.6%) | 19 (6.3%) |
| 5 or more Vehicles | 21 (5.3%) | 7 (2.3%) |
| Total | 393 (100.0%) | 301 (100.0%) |
Commute Time in Snow Hill
The most frequently occuring commute durations in Snow Hill are 5 to 9 minutes (155 commuters, 23.8%), 20 to 24 minutes (110 commuters, 16.9%), and less than 5 minutes (107 commuters, 16.4%).
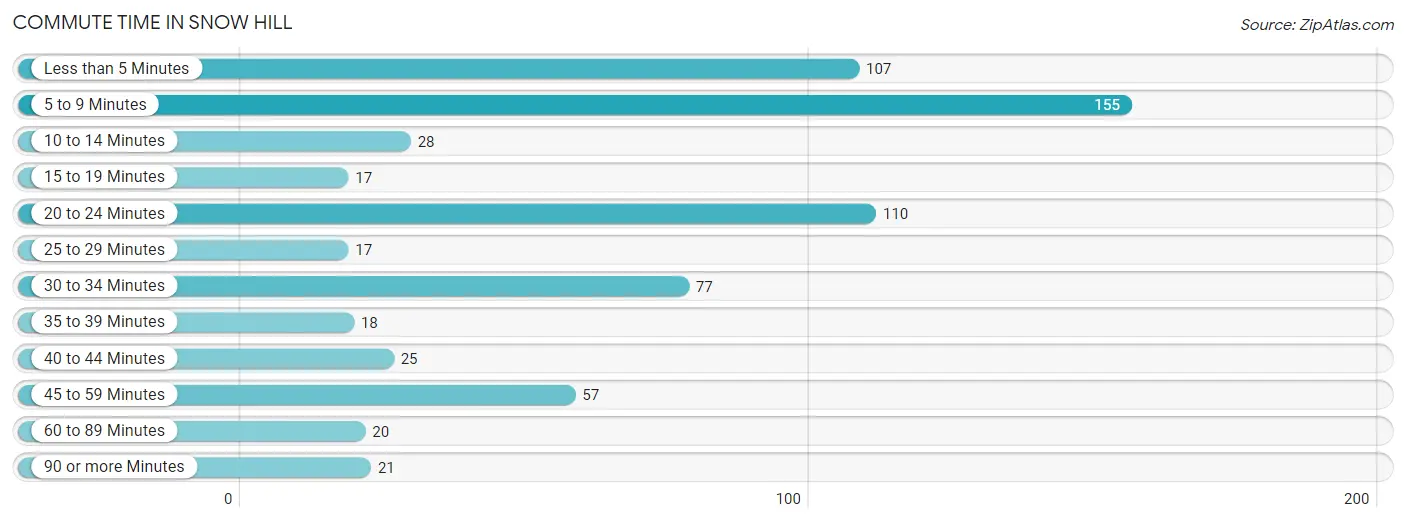
| Commute Time | # Commuters | % Commuters |
| Less than 5 Minutes | 107 | 16.4% |
| 5 to 9 Minutes | 155 | 23.8% |
| 10 to 14 Minutes | 28 | 4.3% |
| 15 to 19 Minutes | 17 | 2.6% |
| 20 to 24 Minutes | 110 | 16.9% |
| 25 to 29 Minutes | 17 | 2.6% |
| 30 to 34 Minutes | 77 | 11.8% |
| 35 to 39 Minutes | 18 | 2.8% |
| 40 to 44 Minutes | 25 | 3.8% |
| 45 to 59 Minutes | 57 | 8.7% |
| 60 to 89 Minutes | 20 | 3.1% |
| 90 or more Minutes | 21 | 3.2% |
Commute Time by Sex in Snow Hill
The most common commute times in Snow Hill are 5 to 9 minutes (95 commuters, 25.8%) for males and less than 5 minutes (70 commuters, 24.6%) for females.
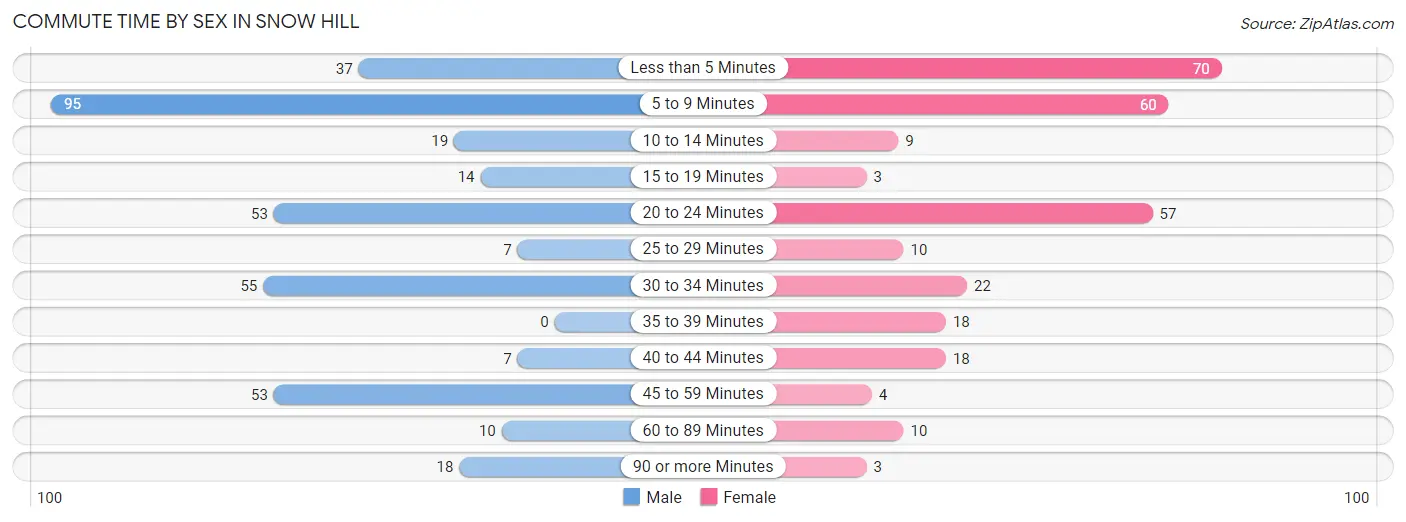
| Commute Time | Male | Female |
| Less than 5 Minutes | 37 (10.1%) | 70 (24.6%) |
| 5 to 9 Minutes | 95 (25.8%) | 60 (21.1%) |
| 10 to 14 Minutes | 19 (5.2%) | 9 (3.2%) |
| 15 to 19 Minutes | 14 (3.8%) | 3 (1.1%) |
| 20 to 24 Minutes | 53 (14.4%) | 57 (20.1%) |
| 25 to 29 Minutes | 7 (1.9%) | 10 (3.5%) |
| 30 to 34 Minutes | 55 (14.9%) | 22 (7.7%) |
| 35 to 39 Minutes | 0 (0.0%) | 18 (6.3%) |
| 40 to 44 Minutes | 7 (1.9%) | 18 (6.3%) |
| 45 to 59 Minutes | 53 (14.4%) | 4 (1.4%) |
| 60 to 89 Minutes | 10 (2.7%) | 10 (3.5%) |
| 90 or more Minutes | 18 (4.9%) | 3 (1.1%) |
Time of Departure to Work by Sex in Snow Hill
The most frequent times of departure to work in Snow Hill are 8:00 AM to 8:29 AM (72, 19.6%) for males and 6:30 AM to 6:59 AM (66, 23.2%) for females.
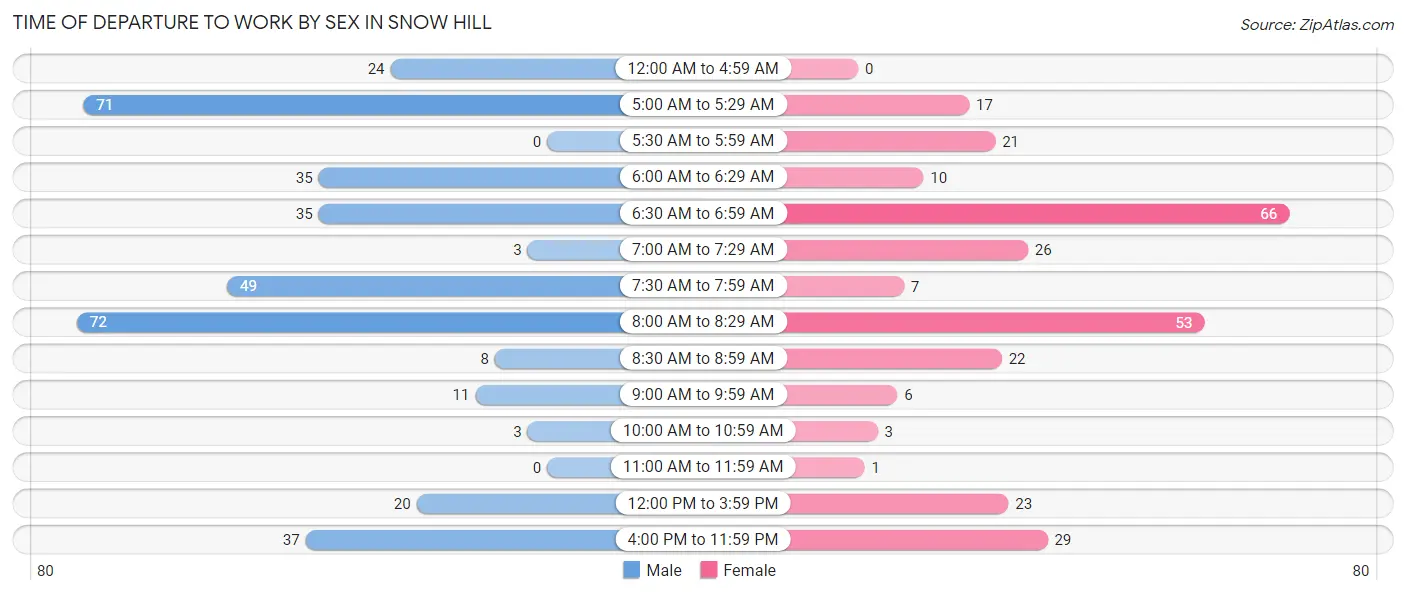
| Time of Departure | Male | Female |
| 12:00 AM to 4:59 AM | 24 (6.5%) | 0 (0.0%) |
| 5:00 AM to 5:29 AM | 71 (19.3%) | 17 (6.0%) |
| 5:30 AM to 5:59 AM | 0 (0.0%) | 21 (7.4%) |
| 6:00 AM to 6:29 AM | 35 (9.5%) | 10 (3.5%) |
| 6:30 AM to 6:59 AM | 35 (9.5%) | 66 (23.2%) |
| 7:00 AM to 7:29 AM | 3 (0.8%) | 26 (9.1%) |
| 7:30 AM to 7:59 AM | 49 (13.3%) | 7 (2.5%) |
| 8:00 AM to 8:29 AM | 72 (19.6%) | 53 (18.7%) |
| 8:30 AM to 8:59 AM | 8 (2.2%) | 22 (7.7%) |
| 9:00 AM to 9:59 AM | 11 (3.0%) | 6 (2.1%) |
| 10:00 AM to 10:59 AM | 3 (0.8%) | 3 (1.1%) |
| 11:00 AM to 11:59 AM | 0 (0.0%) | 1 (0.4%) |
| 12:00 PM to 3:59 PM | 20 (5.4%) | 23 (8.1%) |
| 4:00 PM to 11:59 PM | 37 (10.1%) | 29 (10.2%) |
| Total | 368 (100.0%) | 284 (100.0%) |
Housing Occupancy in Snow Hill
Occupancy by Ownership in Snow Hill
Of the total 737 dwellings in Snow Hill, owner-occupied units account for 341 (46.3%), while renter-occupied units make up 396 (53.7%).
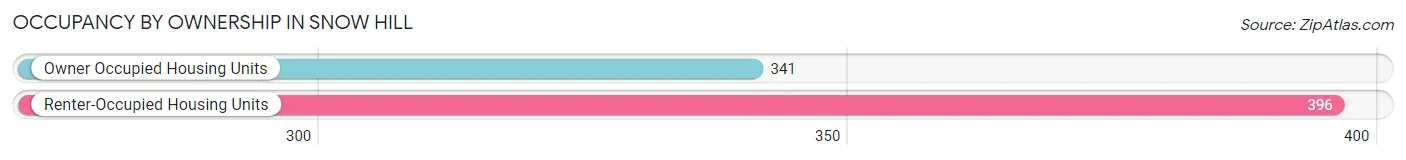
| Occupancy | # Housing Units | % Housing Units |
| Owner Occupied Housing Units | 341 | 46.3% |
| Renter-Occupied Housing Units | 396 | 53.7% |
| Total Occupied Housing Units | 737 | 100.0% |
Occupancy by Household Size in Snow Hill
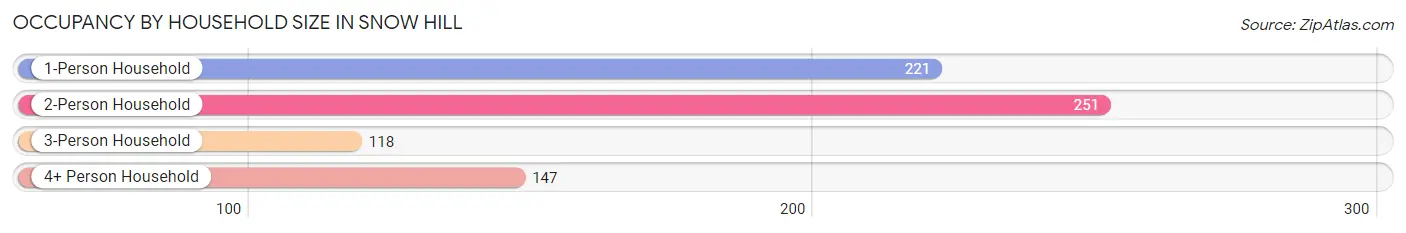
| Household Size | # Housing Units | % Housing Units |
| 1-Person Household | 221 | 30.0% |
| 2-Person Household | 251 | 34.1% |
| 3-Person Household | 118 | 16.0% |
| 4+ Person Household | 147 | 20.0% |
| Total Housing Units | 737 | 100.0% |
Occupancy by Ownership by Household Size in Snow Hill
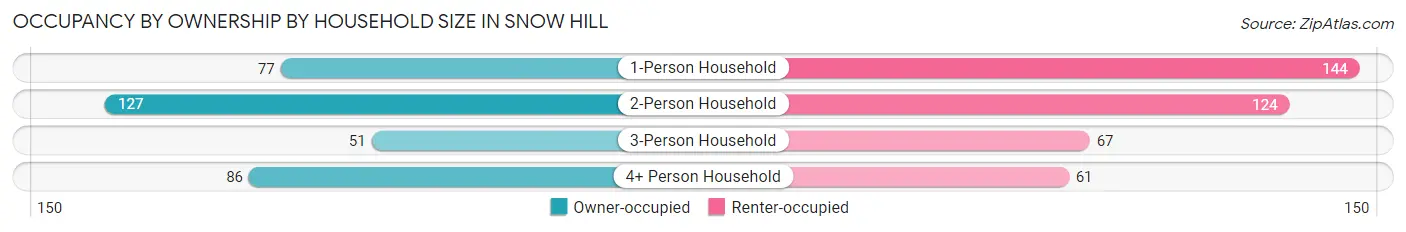
| Household Size | Owner-occupied | Renter-occupied |
| 1-Person Household | 77 (34.8%) | 144 (65.2%) |
| 2-Person Household | 127 (50.6%) | 124 (49.4%) |
| 3-Person Household | 51 (43.2%) | 67 (56.8%) |
| 4+ Person Household | 86 (58.5%) | 61 (41.5%) |
| Total Housing Units | 341 (46.3%) | 396 (53.7%) |
Occupancy by Educational Attainment in Snow Hill
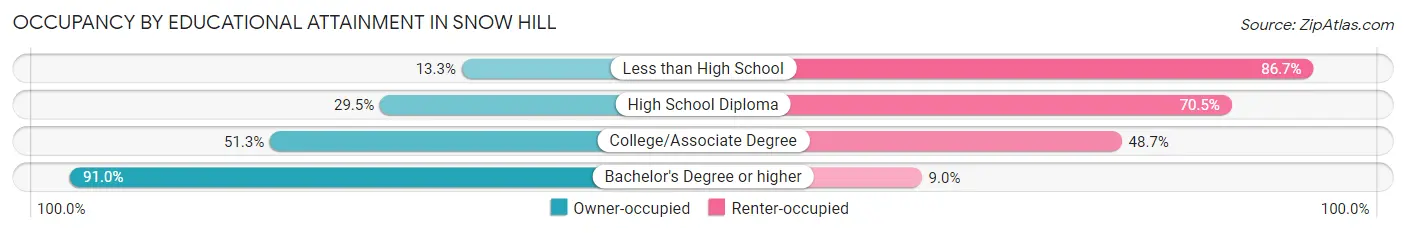
| Household Size | Owner-occupied | Renter-occupied |
| Less than High School | 14 (13.3%) | 91 (86.7%) |
| High School Diploma | 62 (29.5%) | 148 (70.5%) |
| College/Associate Degree | 154 (51.3%) | 146 (48.7%) |
| Bachelor's Degree or higher | 111 (91.0%) | 11 (9.0%) |
Occupancy by Age of Householder in Snow Hill
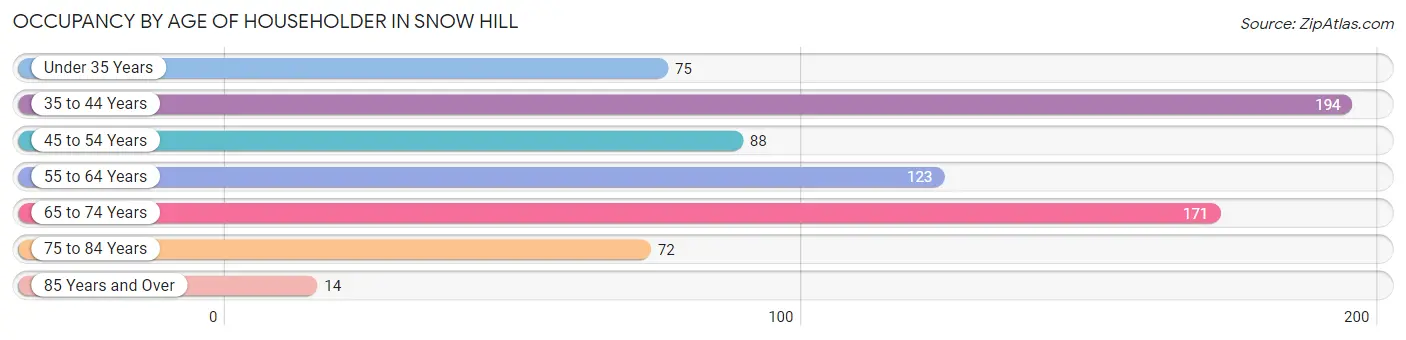
| Age Bracket | # Households | % Households |
| Under 35 Years | 75 | 10.2% |
| 35 to 44 Years | 194 | 26.3% |
| 45 to 54 Years | 88 | 11.9% |
| 55 to 64 Years | 123 | 16.7% |
| 65 to 74 Years | 171 | 23.2% |
| 75 to 84 Years | 72 | 9.8% |
| 85 Years and Over | 14 | 1.9% |
| Total | 737 | 100.0% |
Housing Finances in Snow Hill
Median Income by Occupancy in Snow Hill
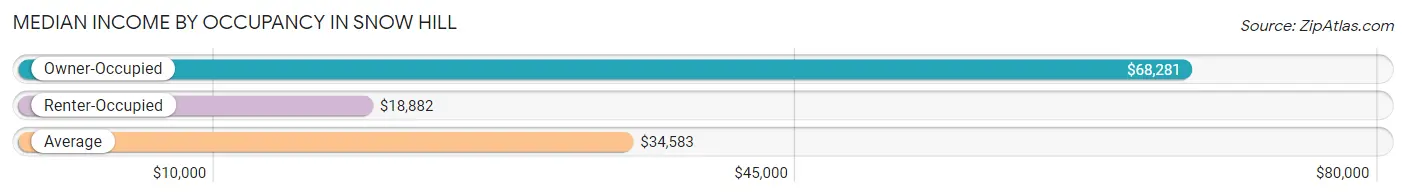
| Occupancy Type | # Households | Median Income |
| Owner-Occupied | 341 (46.3%) | $68,281 |
| Renter-Occupied | 396 (53.7%) | $18,882 |
| Average | 737 (100.0%) | $34,583 |
Occupancy by Householder Income Bracket in Snow Hill
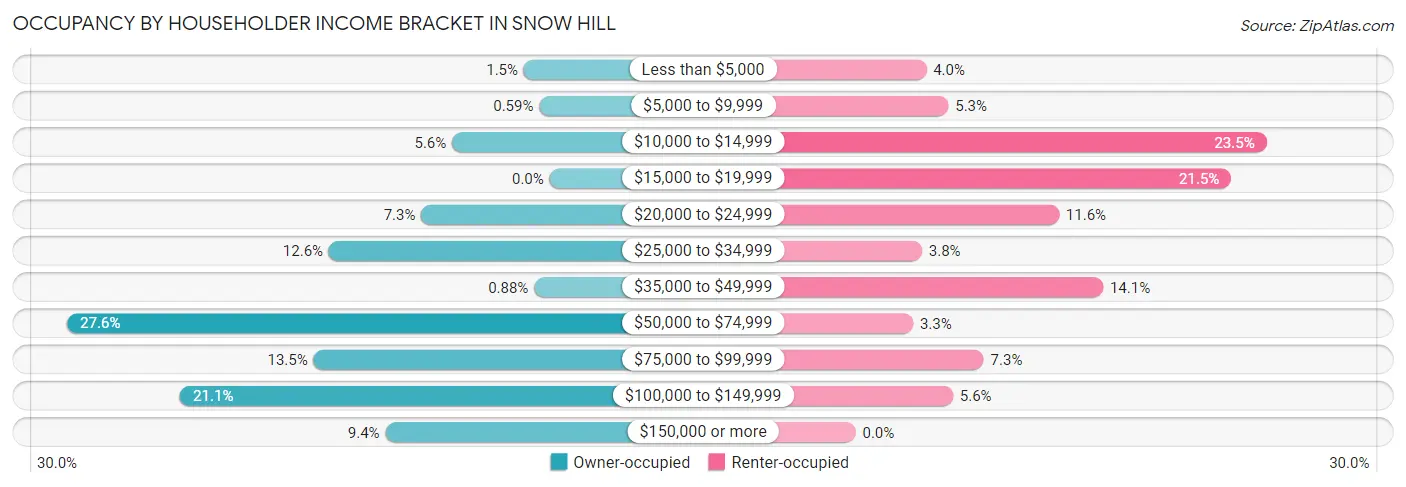
| Income Bracket | Owner-occupied | Renter-occupied |
| Less than $5,000 | 5 (1.5%) | 16 (4.0%) |
| $5,000 to $9,999 | 2 (0.6%) | 21 (5.3%) |
| $10,000 to $14,999 | 19 (5.6%) | 93 (23.5%) |
| $15,000 to $19,999 | 0 (0.0%) | 85 (21.5%) |
| $20,000 to $24,999 | 25 (7.3%) | 46 (11.6%) |
| $25,000 to $34,999 | 43 (12.6%) | 15 (3.8%) |
| $35,000 to $49,999 | 3 (0.9%) | 56 (14.1%) |
| $50,000 to $74,999 | 94 (27.6%) | 13 (3.3%) |
| $75,000 to $99,999 | 46 (13.5%) | 29 (7.3%) |
| $100,000 to $149,999 | 72 (21.1%) | 22 (5.6%) |
| $150,000 or more | 32 (9.4%) | 0 (0.0%) |
| Total | 341 (100.0%) | 396 (100.0%) |
Monthly Housing Cost Tiers in Snow Hill
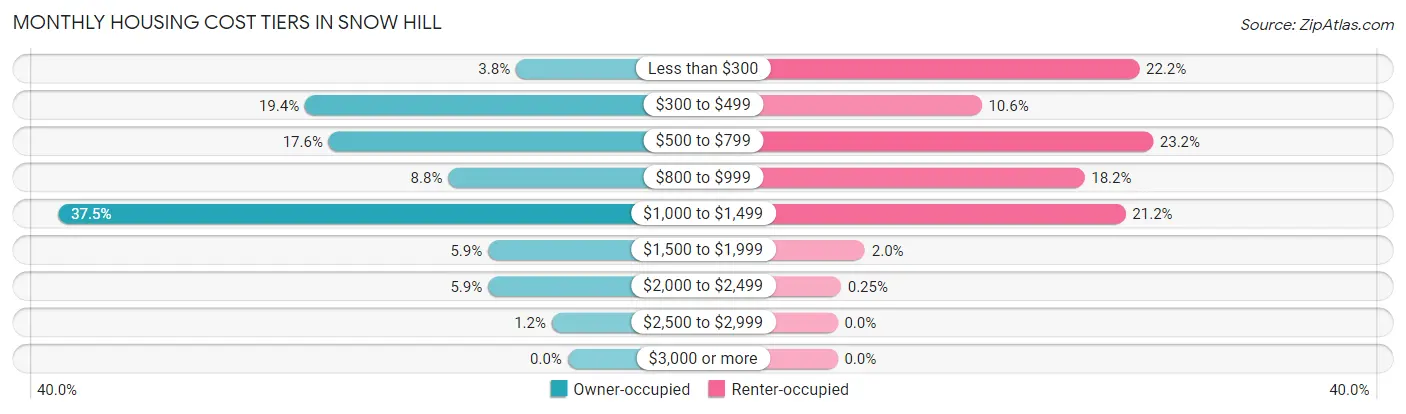
| Monthly Cost | Owner-occupied | Renter-occupied |
| Less than $300 | 13 (3.8%) | 88 (22.2%) |
| $300 to $499 | 66 (19.4%) | 42 (10.6%) |
| $500 to $799 | 60 (17.6%) | 92 (23.2%) |
| $800 to $999 | 30 (8.8%) | 72 (18.2%) |
| $1,000 to $1,499 | 128 (37.5%) | 84 (21.2%) |
| $1,500 to $1,999 | 20 (5.9%) | 8 (2.0%) |
| $2,000 to $2,499 | 20 (5.9%) | 1 (0.3%) |
| $2,500 to $2,999 | 4 (1.2%) | 0 (0.0%) |
| $3,000 or more | 0 (0.0%) | 0 (0.0%) |
| Total | 341 (100.0%) | 396 (100.0%) |
Physical Housing Characteristics in Snow Hill
Housing Structures in Snow Hill
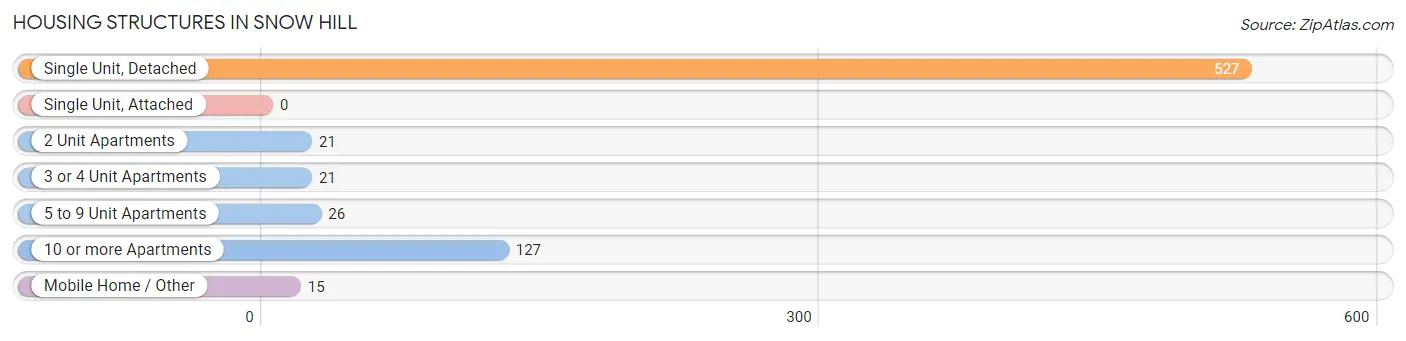
| Structure Type | # Housing Units | % Housing Units |
| Single Unit, Detached | 527 | 71.5% |
| Single Unit, Attached | 0 | 0.0% |
| 2 Unit Apartments | 21 | 2.9% |
| 3 or 4 Unit Apartments | 21 | 2.9% |
| 5 to 9 Unit Apartments | 26 | 3.5% |
| 10 or more Apartments | 127 | 17.2% |
| Mobile Home / Other | 15 | 2.0% |
| Total | 737 | 100.0% |
Housing Structures by Occupancy in Snow Hill
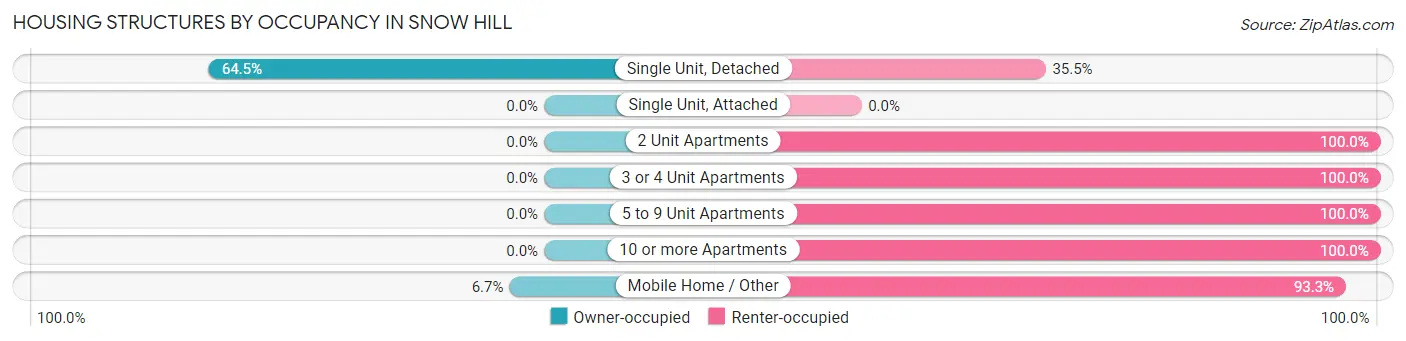
| Structure Type | Owner-occupied | Renter-occupied |
| Single Unit, Detached | 340 (64.5%) | 187 (35.5%) |
| Single Unit, Attached | 0 (0.0%) | 0 (0.0%) |
| 2 Unit Apartments | 0 (0.0%) | 21 (100.0%) |
| 3 or 4 Unit Apartments | 0 (0.0%) | 21 (100.0%) |
| 5 to 9 Unit Apartments | 0 (0.0%) | 26 (100.0%) |
| 10 or more Apartments | 0 (0.0%) | 127 (100.0%) |
| Mobile Home / Other | 1 (6.7%) | 14 (93.3%) |
| Total | 341 (46.3%) | 396 (53.7%) |
Housing Structures by Number of Rooms in Snow Hill
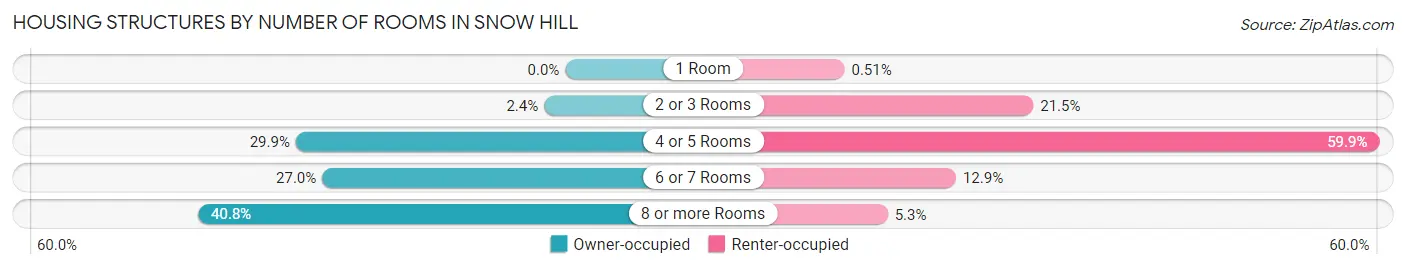
| Number of Rooms | Owner-occupied | Renter-occupied |
| 1 Room | 0 (0.0%) | 2 (0.5%) |
| 2 or 3 Rooms | 8 (2.4%) | 85 (21.5%) |
| 4 or 5 Rooms | 102 (29.9%) | 237 (59.9%) |
| 6 or 7 Rooms | 92 (27.0%) | 51 (12.9%) |
| 8 or more Rooms | 139 (40.8%) | 21 (5.3%) |
| Total | 341 (100.0%) | 396 (100.0%) |
Housing Structure by Heating Type in Snow Hill
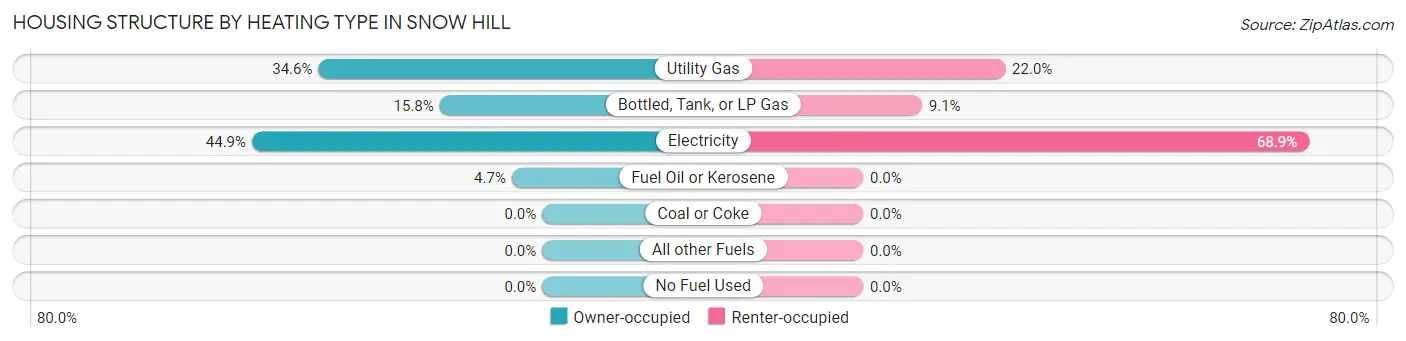
| Heating Type | Owner-occupied | Renter-occupied |
| Utility Gas | 118 (34.6%) | 87 (22.0%) |
| Bottled, Tank, or LP Gas | 54 (15.8%) | 36 (9.1%) |
| Electricity | 153 (44.9%) | 273 (68.9%) |
| Fuel Oil or Kerosene | 16 (4.7%) | 0 (0.0%) |
| Coal or Coke | 0 (0.0%) | 0 (0.0%) |
| All other Fuels | 0 (0.0%) | 0 (0.0%) |
| No Fuel Used | 0 (0.0%) | 0 (0.0%) |
| Total | 341 (100.0%) | 396 (100.0%) |
Household Vehicle Usage in Snow Hill
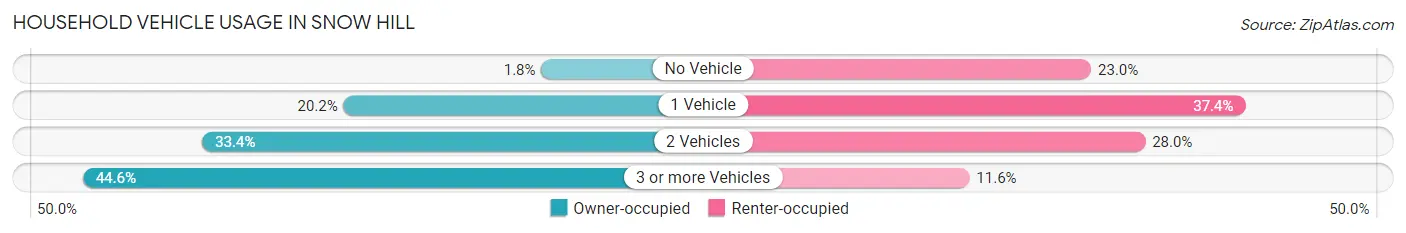
| Vehicles per Household | Owner-occupied | Renter-occupied |
| No Vehicle | 6 (1.8%) | 91 (23.0%) |
| 1 Vehicle | 69 (20.2%) | 148 (37.4%) |
| 2 Vehicles | 114 (33.4%) | 111 (28.0%) |
| 3 or more Vehicles | 152 (44.6%) | 46 (11.6%) |
| Total | 341 (100.0%) | 396 (100.0%) |
Real Estate & Mortgages in Snow Hill
Real Estate and Mortgage Overview in Snow Hill
| Characteristic | Without Mortgage | With Mortgage |
| Housing Units | 130 | 211 |
| Median Property Value | $109,500 | $139,700 |
| Median Household Income | $50,278 | $21 |
| Monthly Housing Costs | $472 | $0 |
| Real Estate Taxes | $1,088 | $0 |
Property Value by Mortgage Status in Snow Hill
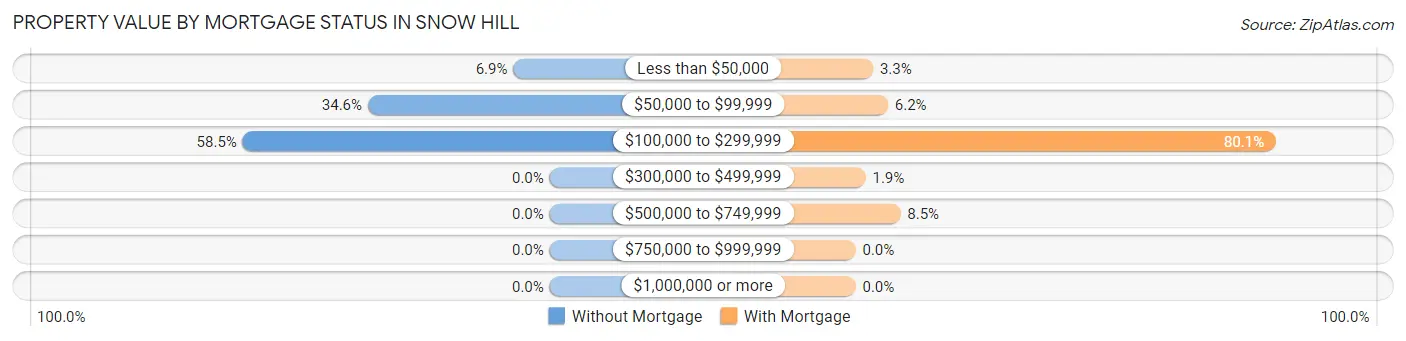
| Property Value | Without Mortgage | With Mortgage |
| Less than $50,000 | 9 (6.9%) | 7 (3.3%) |
| $50,000 to $99,999 | 45 (34.6%) | 13 (6.2%) |
| $100,000 to $299,999 | 76 (58.5%) | 169 (80.1%) |
| $300,000 to $499,999 | 0 (0.0%) | 4 (1.9%) |
| $500,000 to $749,999 | 0 (0.0%) | 18 (8.5%) |
| $750,000 to $999,999 | 0 (0.0%) | 0 (0.0%) |
| $1,000,000 or more | 0 (0.0%) | 0 (0.0%) |
| Total | 130 (100.0%) | 211 (100.0%) |
Household Income by Mortgage Status in Snow Hill
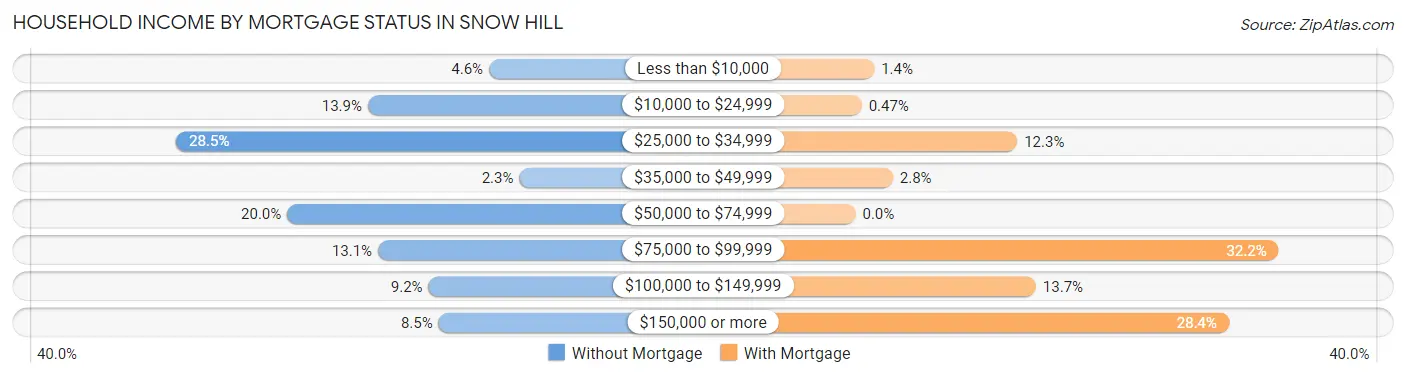
| Household Income | Without Mortgage | With Mortgage |
| Less than $10,000 | 6 (4.6%) | 3 (1.4%) |
| $10,000 to $24,999 | 18 (13.9%) | 1 (0.5%) |
| $25,000 to $34,999 | 37 (28.5%) | 26 (12.3%) |
| $35,000 to $49,999 | 3 (2.3%) | 6 (2.8%) |
| $50,000 to $74,999 | 26 (20.0%) | 0 (0.0%) |
| $75,000 to $99,999 | 17 (13.1%) | 68 (32.2%) |
| $100,000 to $149,999 | 12 (9.2%) | 29 (13.7%) |
| $150,000 or more | 11 (8.5%) | 60 (28.4%) |
| Total | 130 (100.0%) | 211 (100.0%) |
Property Value to Household Income Ratio in Snow Hill
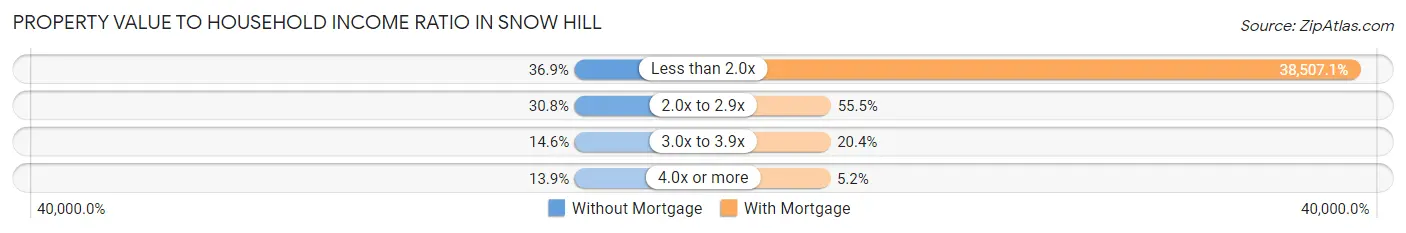
| Value-to-Income Ratio | Without Mortgage | With Mortgage |
| Less than 2.0x | 48 (36.9%) | 81,250 (38,507.1%) |
| 2.0x to 2.9x | 40 (30.8%) | 117 (55.4%) |
| 3.0x to 3.9x | 19 (14.6%) | 43 (20.4%) |
| 4.0x or more | 18 (13.9%) | 11 (5.2%) |
| Total | 130 (100.0%) | 211 (100.0%) |
Real Estate Taxes by Mortgage Status in Snow Hill
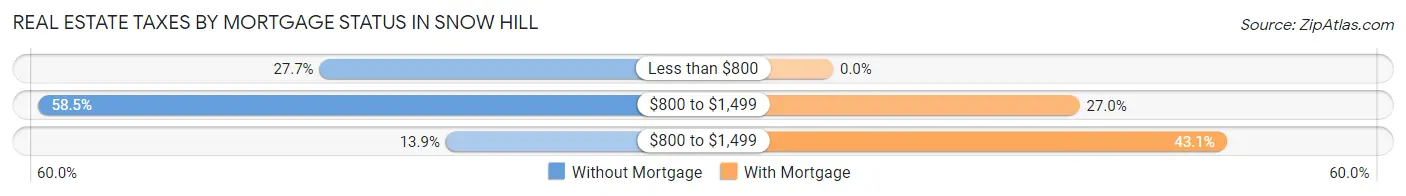
| Property Taxes | Without Mortgage | With Mortgage |
| Less than $800 | 36 (27.7%) | 0 (0.0%) |
| $800 to $1,499 | 76 (58.5%) | 57 (27.0%) |
| $800 to $1,499 | 18 (13.9%) | 91 (43.1%) |
| Total | 130 (100.0%) | 211 (100.0%) |
Health & Disability in Snow Hill
Health Insurance Coverage by Age in Snow Hill
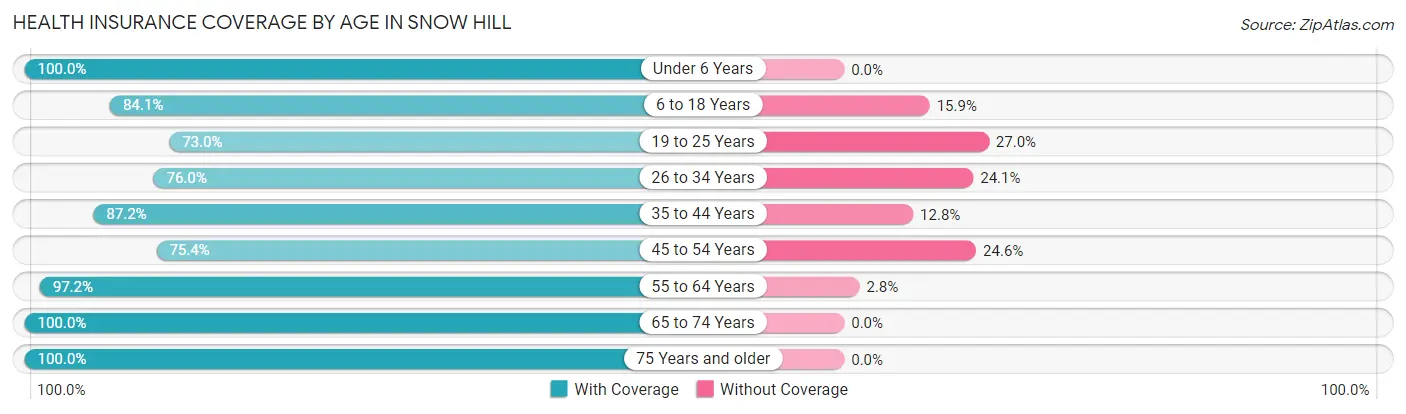
| Age Bracket | With Coverage | Without Coverage |
| Under 6 Years | 183 (100.0%) | 0 (0.0%) |
| 6 to 18 Years | 401 (84.1%) | 76 (15.9%) |
| 19 to 25 Years | 111 (73.0%) | 41 (27.0%) |
| 26 to 34 Years | 120 (75.9%) | 38 (24.0%) |
| 35 to 44 Years | 292 (87.2%) | 43 (12.8%) |
| 45 to 54 Years | 184 (75.4%) | 60 (24.6%) |
| 55 to 64 Years | 171 (97.2%) | 5 (2.8%) |
| 65 to 74 Years | 236 (100.0%) | 0 (0.0%) |
| 75 Years and older | 131 (100.0%) | 0 (0.0%) |
| Total | 1,829 (87.4%) | 263 (12.6%) |
Health Insurance Coverage by Citizenship Status in Snow Hill
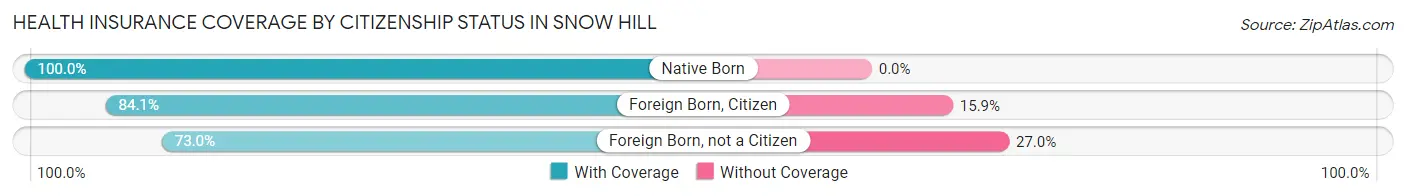
| Citizenship Status | With Coverage | Without Coverage |
| Native Born | 183 (100.0%) | 0 (0.0%) |
| Foreign Born, Citizen | 401 (84.1%) | 76 (15.9%) |
| Foreign Born, not a Citizen | 111 (73.0%) | 41 (27.0%) |
Health Insurance Coverage by Household Income in Snow Hill
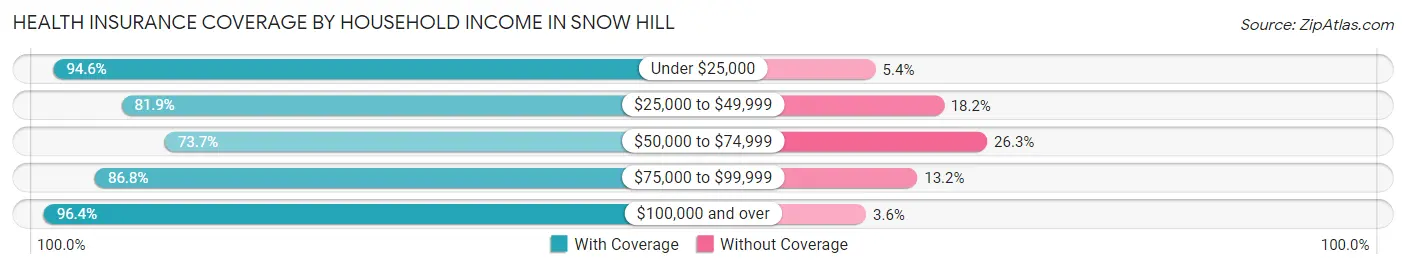
| Household Income | With Coverage | Without Coverage |
| Under $25,000 | 700 (94.6%) | 40 (5.4%) |
| $25,000 to $49,999 | 230 (81.9%) | 51 (18.1%) |
| $50,000 to $74,999 | 339 (73.7%) | 121 (26.3%) |
| $75,000 to $99,999 | 138 (86.8%) | 21 (13.2%) |
| $100,000 and over | 401 (96.4%) | 15 (3.6%) |
Public vs Private Health Insurance Coverage by Age in Snow Hill
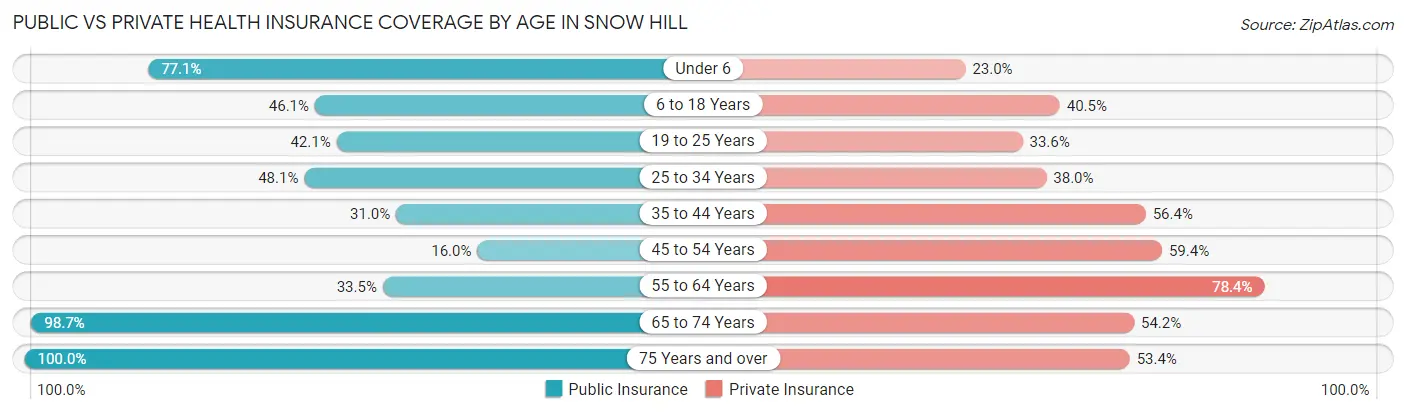
| Age Bracket | Public Insurance | Private Insurance |
| Under 6 | 141 (77.0%) | 42 (23.0%) |
| 6 to 18 Years | 220 (46.1%) | 193 (40.5%) |
| 19 to 25 Years | 64 (42.1%) | 51 (33.6%) |
| 25 to 34 Years | 76 (48.1%) | 60 (38.0%) |
| 35 to 44 Years | 104 (31.0%) | 189 (56.4%) |
| 45 to 54 Years | 39 (16.0%) | 145 (59.4%) |
| 55 to 64 Years | 59 (33.5%) | 138 (78.4%) |
| 65 to 74 Years | 233 (98.7%) | 128 (54.2%) |
| 75 Years and over | 131 (100.0%) | 70 (53.4%) |
| Total | 1,067 (51.0%) | 1,016 (48.6%) |
Disability Status by Sex by Age in Snow Hill
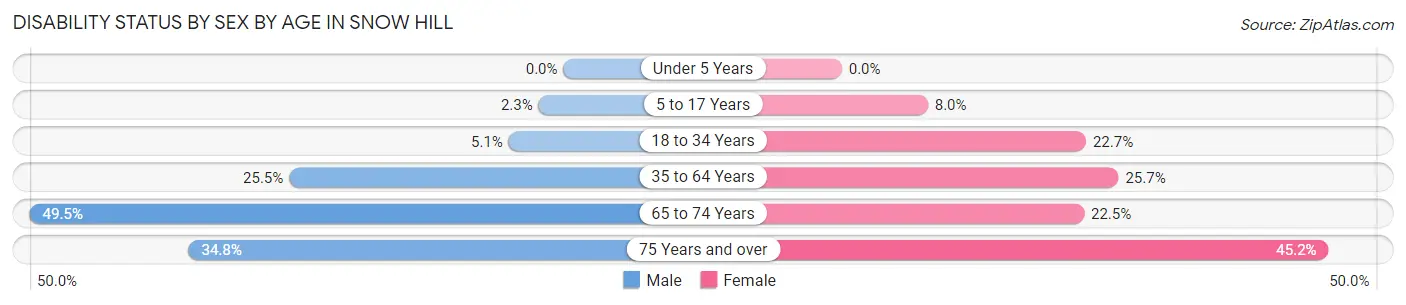
| Age Bracket | Male | Female |
| Under 5 Years | 0 (0.0%) | 0 (0.0%) |
| 5 to 17 Years | 6 (2.3%) | 17 (8.0%) |
| 18 to 34 Years | 11 (5.1%) | 29 (22.7%) |
| 35 to 64 Years | 99 (25.5%) | 94 (25.7%) |
| 65 to 74 Years | 53 (49.5%) | 29 (22.5%) |
| 75 Years and over | 24 (34.8%) | 28 (45.2%) |
Disability Class by Sex by Age in Snow Hill
Disability Class: Hearing Difficulty
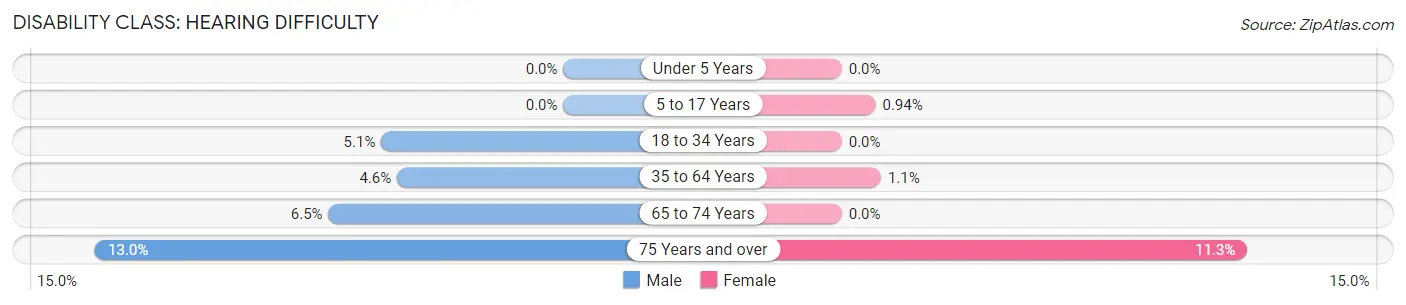
| Age Bracket | Male | Female |
| Under 5 Years | 0 (0.0%) | 0 (0.0%) |
| 5 to 17 Years | 0 (0.0%) | 2 (0.9%) |
| 18 to 34 Years | 11 (5.1%) | 0 (0.0%) |
| 35 to 64 Years | 18 (4.6%) | 4 (1.1%) |
| 65 to 74 Years | 7 (6.5%) | 0 (0.0%) |
| 75 Years and over | 9 (13.0%) | 7 (11.3%) |
Disability Class: Vision Difficulty
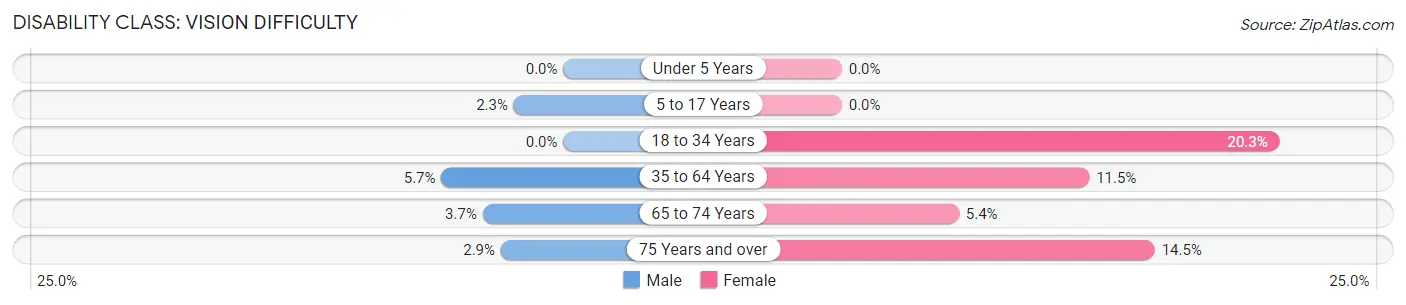
| Age Bracket | Male | Female |
| Under 5 Years | 0 (0.0%) | 0 (0.0%) |
| 5 to 17 Years | 6 (2.3%) | 0 (0.0%) |
| 18 to 34 Years | 0 (0.0%) | 26 (20.3%) |
| 35 to 64 Years | 22 (5.7%) | 42 (11.5%) |
| 65 to 74 Years | 4 (3.7%) | 7 (5.4%) |
| 75 Years and over | 2 (2.9%) | 9 (14.5%) |
Disability Class: Cognitive Difficulty
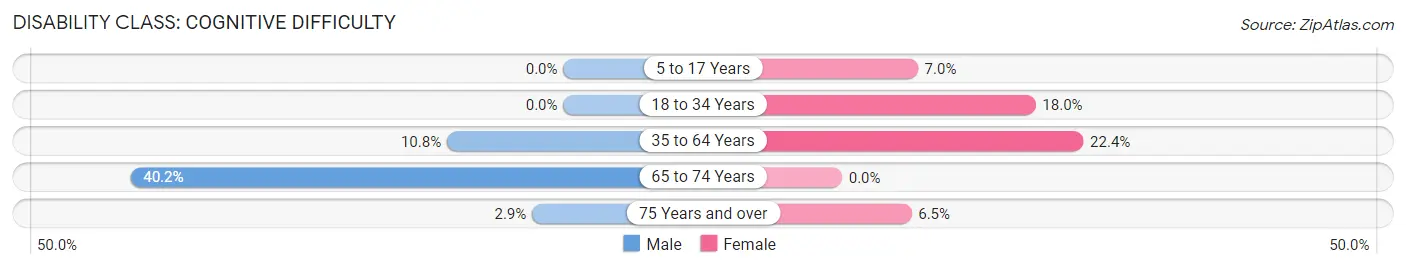
| Age Bracket | Male | Female |
| 5 to 17 Years | 0 (0.0%) | 15 (7.0%) |
| 18 to 34 Years | 0 (0.0%) | 23 (18.0%) |
| 35 to 64 Years | 42 (10.8%) | 82 (22.4%) |
| 65 to 74 Years | 43 (40.2%) | 0 (0.0%) |
| 75 Years and over | 2 (2.9%) | 4 (6.5%) |
Disability Class: Ambulatory Difficulty
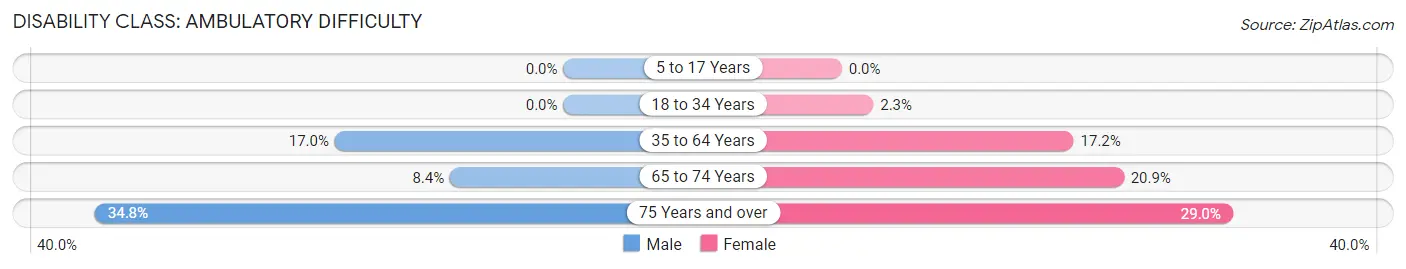
| Age Bracket | Male | Female |
| 5 to 17 Years | 0 (0.0%) | 0 (0.0%) |
| 18 to 34 Years | 0 (0.0%) | 3 (2.3%) |
| 35 to 64 Years | 66 (17.0%) | 63 (17.2%) |
| 65 to 74 Years | 9 (8.4%) | 27 (20.9%) |
| 75 Years and over | 24 (34.8%) | 18 (29.0%) |
Disability Class: Self-Care Difficulty
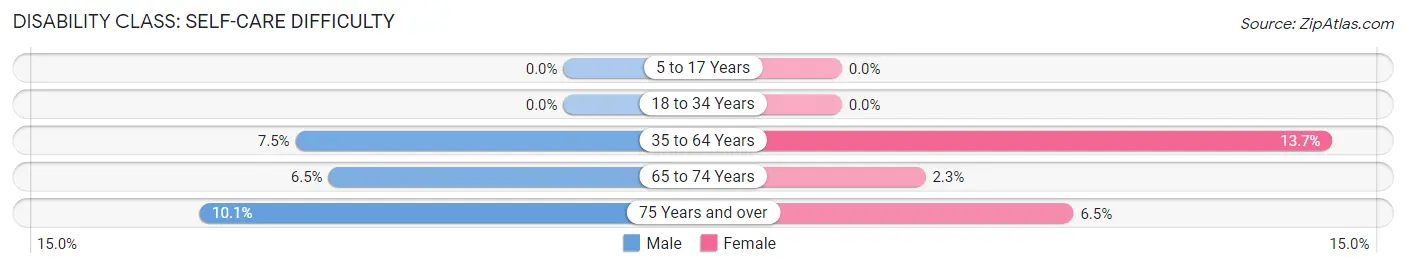
| Age Bracket | Male | Female |
| 5 to 17 Years | 0 (0.0%) | 0 (0.0%) |
| 18 to 34 Years | 0 (0.0%) | 0 (0.0%) |
| 35 to 64 Years | 29 (7.5%) | 50 (13.7%) |
| 65 to 74 Years | 7 (6.5%) | 3 (2.3%) |
| 75 Years and over | 7 (10.1%) | 4 (6.5%) |
Technology Access in Snow Hill
Computing Device Access in Snow Hill
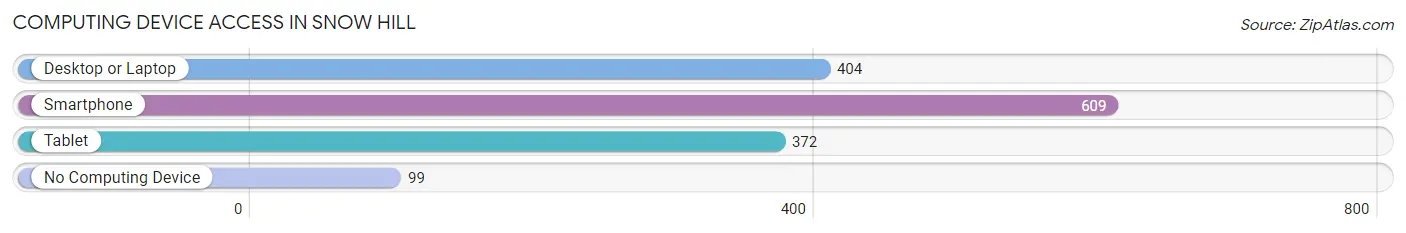
| Device Type | # Households | % Households |
| Desktop or Laptop | 404 | 54.8% |
| Smartphone | 609 | 82.6% |
| Tablet | 372 | 50.5% |
| No Computing Device | 99 | 13.4% |
| Total | 737 | 100.0% |
Internet Access in Snow Hill
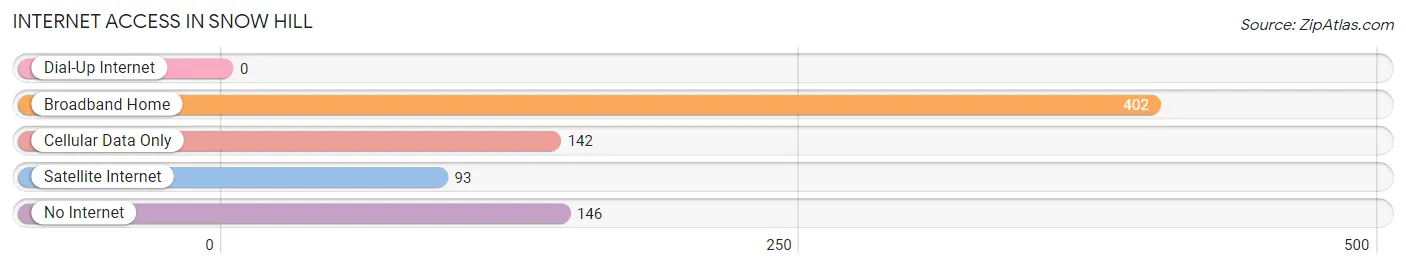
| Internet Type | # Households | % Households |
| Dial-Up Internet | 0 | 0.0% |
| Broadband Home | 402 | 54.5% |
| Cellular Data Only | 142 | 19.3% |
| Satellite Internet | 93 | 12.6% |
| No Internet | 146 | 19.8% |
| Total | 737 | 100.0% |
Snow Hill Summary
Snow Hill is a small town located in Greene County, North Carolina. It is situated in the eastern part of the state, approximately 40 miles east of Raleigh. The town has a population of approximately 2,500 people and is the county seat of Greene County.
History
Snow Hill was founded in 1783 by a group of settlers from Virginia. The town was named after a nearby hill that was covered in snow during the winter months. The town was incorporated in 1837 and has remained a small, rural community ever since.
The town was an important stop on the Wilmington and Weldon Railroad, which was built in the 1840s. This railroad connected the town to other parts of the state and allowed for the growth of the local economy.
The town was also home to a number of prominent figures in the Civil War. Confederate General Robert F. Hoke was born in Snow Hill and Confederate General James Johnston Pettigrew was buried in the town.
Geography
Snow Hill is located in the eastern part of North Carolina, approximately 40 miles east of Raleigh. The town is situated in the Coastal Plain region of the state and is surrounded by rolling hills and farmland. The town is located near the Neuse River, which provides a source of water for the town.
The climate in Snow Hill is mild and humid, with temperatures ranging from the mid-30s in the winter to the mid-80s in the summer. The town receives an average of 48 inches of rain per year.
Economy
The economy of Snow Hill is largely based on agriculture. The town is home to a number of farms that produce a variety of crops, including corn, soybeans, cotton, and tobacco. The town is also home to a number of small businesses, including restaurants, retail stores, and service providers.
The town is also home to a number of manufacturing companies, including a furniture factory and a textile mill. The town is also home to a number of government offices, including the Greene County Courthouse and the Greene County Sheriff’s Office.
Demographics
As of the 2010 census, the population of Snow Hill was 2,500. The racial makeup of the town was 79.2% White, 17.2% African American, 0.8% Native American, 0.4% Asian, and 2.4% from other races. The median household income in the town was $31,250, and the median age was 39.
Conclusion
Snow Hill is a small town located in Greene County, North Carolina. It is situated in the eastern part of the state, approximately 40 miles east of Raleigh. The town has a population of approximately 2,500 people and is the county seat of Greene County. The town was founded in 1783 and has remained a small, rural community ever since. The economy of Snow Hill is largely based on agriculture, with a number of farms producing a variety of crops. The town is also home to a number of small businesses, manufacturing companies, and government offices. The population of Snow Hill is predominantly White, with a median household income of $31,250 and a median age of 39.
Common Questions
What is Per Capita Income in Snow Hill?
Per Capita income in Snow Hill is $19,587.
What is the Median Family Income in Snow Hill?
Median Family Income in Snow Hill is $51,979.
What is the Median Household income in Snow Hill?
Median Household Income in Snow Hill is $34,583.
What is Income or Wage Gap in Snow Hill?
Income or Wage Gap in Snow Hill is 22.1%.
Women in Snow Hill earn 77.9 cents for every dollar earned by a man.
What is Inequality or Gini Index in Snow Hill?
Inequality or Gini Index in Snow Hill is 0.47.
What is the Total Population of Snow Hill?
Total Population of Snow Hill is 2,092.
What is the Total Male Population of Snow Hill?
Total Male Population of Snow Hill is 1,108.
What is the Total Female Population of Snow Hill?
Total Female Population of Snow Hill is 984.
What is the Ratio of Males per 100 Females in Snow Hill?
There are 112.60 Males per 100 Females in Snow Hill.
What is the Ratio of Females per 100 Males in Snow Hill?
There are 88.81 Females per 100 Males in Snow Hill.
What is the Median Population Age in Snow Hill?
Median Population Age in Snow Hill is 37.2 Years.
What is the Average Family Size in Snow Hill
Average Family Size in Snow Hill is 3.5 People.
What is the Average Household Size in Snow Hill
Average Household Size in Snow Hill is 2.8 People.
How Large is the Labor Force in Snow Hill?
There are 776 People in the Labor Forcein in Snow Hill.
What is the Percentage of People in the Labor Force in Snow Hill?
50.7% of People are in the Labor Force in Snow Hill.
What is the Unemployment Rate in Snow Hill?
Unemployment Rate in Snow Hill is 5.5%.