Zip Codes with the Highest Poverty Level Among Children Under the Age of 5 in North Carolina
RELATED REPORTS & OPTIONS
Highest Poverty | Child 0-5
North Carolina
Compare Zip Codes
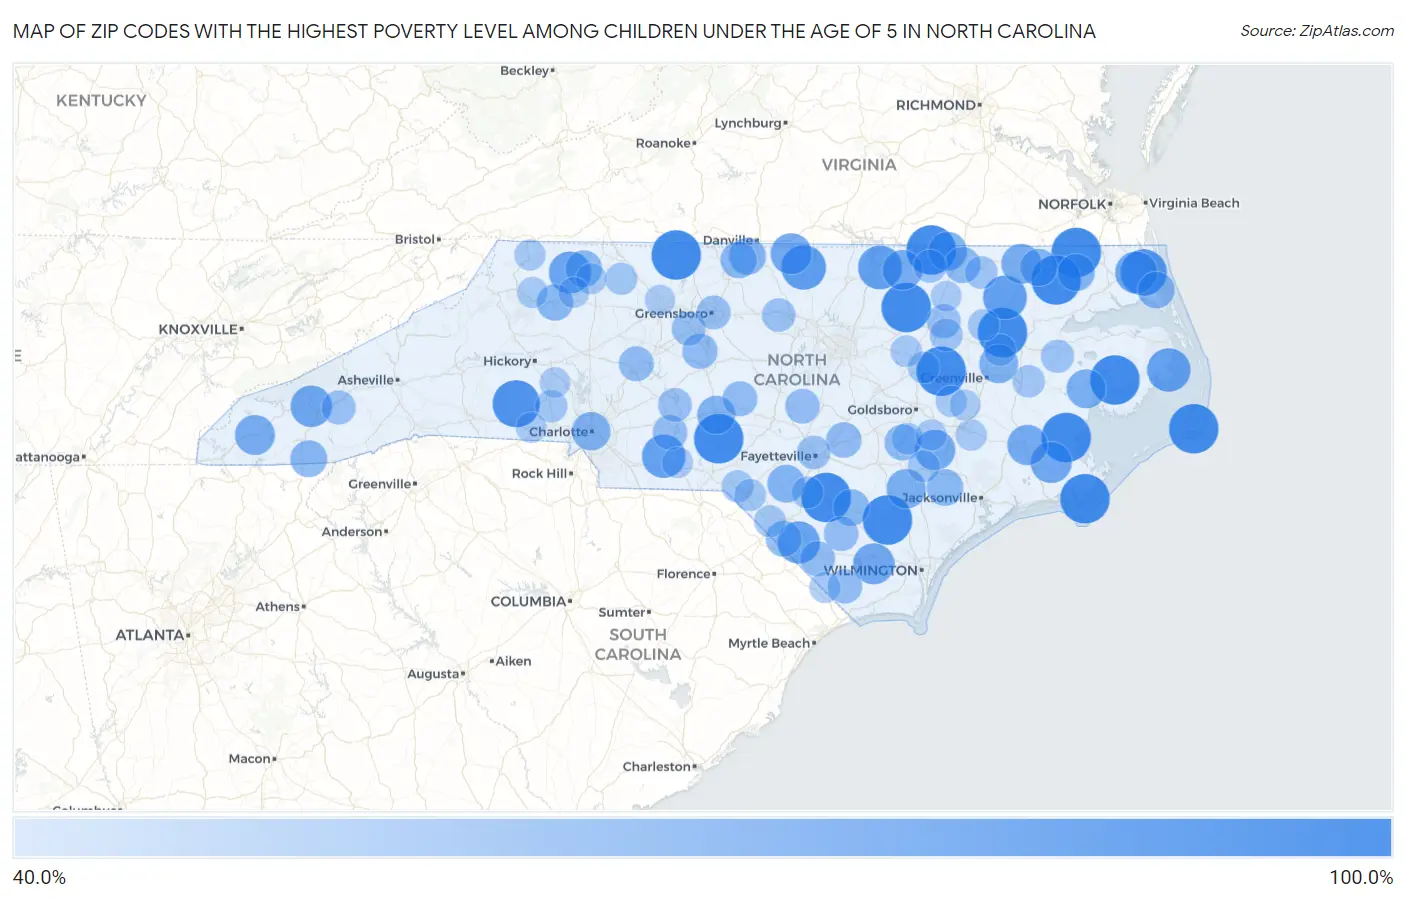
Map of Zip Codes with the Highest Poverty Level Among Children Under the Age of 5 in North Carolina
40.0%
100.0%
Zip Codes with the Highest Poverty Level Among Children Under the Age of 5 in North Carolina
| Zip Code | Child Poverty | vs State | vs National | |
| 1. | 27816 | 100.0% | 20.3%(+79.7)#1 | 18.1%(+81.9)#12 |
| 2. | 27046 | 100.0% | 20.3%(+79.7)#2 | 18.1%(+81.9)#18 |
| 3. | 27926 | 100.0% | 20.3%(+79.7)#3 | 18.1%(+81.9)#25 |
| 4. | 28392 | 100.0% | 20.3%(+79.7)#4 | 18.1%(+81.9)#31 |
| 5. | 27842 | 100.0% | 20.3%(+79.7)#5 | 18.1%(+81.9)#43 |
| 6. | 27920 | 100.0% | 20.3%(+79.7)#6 | 18.1%(+81.9)#44 |
| 7. | 28447 | 100.0% | 20.3%(+79.7)#7 | 18.1%(+81.9)#55 |
| 8. | 27826 | 100.0% | 20.3%(+79.7)#8 | 18.1%(+81.9)#76 |
| 9. | 27942 | 100.0% | 20.3%(+79.7)#9 | 18.1%(+81.9)#164 |
| 10. | 28553 | 100.0% | 20.3%(+79.7)#10 | 18.1%(+81.9)#259 |
| 11. | 27873 | 100.0% | 20.3%(+79.7)#11 | 18.1%(+81.9)#353 |
| 12. | 27840 | 100.0% | 20.3%(+79.7)#12 | 18.1%(+81.9)#385 |
| 13. | 28587 | 100.0% | 20.3%(+79.7)#13 | 18.1%(+81.9)#398 |
| 14. | 28367 | 100.0% | 20.3%(+79.7)#14 | 18.1%(+81.9)#443 |
| 15. | 28042 | 93.4% | 20.3%(+73.1)#15 | 18.1%(+75.3)#597 |
| 16. | 27917 | 90.6% | 20.3%(+70.3)#16 | 18.1%(+72.5)#633 |
| 17. | 27573 | 85.4% | 20.3%(+65.1)#17 | 18.1%(+67.3)#699 |
| 18. | 27556 | 83.7% | 20.3%(+63.4)#18 | 18.1%(+65.7)#734 |
| 19. | 27847 | 83.3% | 20.3%(+63.1)#19 | 18.1%(+65.3)#742 |
| 20. | 27978 | 82.6% | 20.3%(+62.3)#20 | 18.1%(+64.5)#755 |
| 21. | 28135 | 82.5% | 20.3%(+62.2)#21 | 18.1%(+64.4)#757 |
| 22. | 28369 | 79.2% | 20.3%(+58.9)#22 | 18.1%(+61.1)#841 |
| 23. | 28685 | 78.8% | 20.3%(+58.5)#23 | 18.1%(+60.7)#847 |
| 24. | 27973 | 78.4% | 20.3%(+58.2)#24 | 18.1%(+60.4)#858 |
| 25. | 28789 | 76.8% | 20.3%(+56.5)#25 | 18.1%(+58.7)#906 |
| 26. | 27343 | 75.9% | 20.3%(+55.6)#26 | 18.1%(+57.8)#930 |
| 27. | 28510 | 75.8% | 20.3%(+55.5)#27 | 18.1%(+57.7)#937 |
| 28. | 28423 | 75.7% | 20.3%(+55.4)#28 | 18.1%(+57.6)#939 |
| 29. | 28508 | 74.2% | 20.3%(+53.9)#29 | 18.1%(+56.1)#998 |
| 30. | 28519 | 73.4% | 20.3%(+53.2)#30 | 18.1%(+55.4)#1,032 |
| 31. | 28901 | 72.5% | 20.3%(+52.3)#31 | 18.1%(+54.5)#1,066 |
| 32. | 27589 | 72.4% | 20.3%(+52.2)#32 | 18.1%(+54.4)#1,068 |
| 33. | 27855 | 72.0% | 20.3%(+51.7)#33 | 18.1%(+53.9)#1,088 |
| 34. | 28458 | 70.9% | 20.3%(+50.6)#34 | 18.1%(+52.8)#1,116 |
| 35. | 27810 | 69.9% | 20.3%(+49.6)#35 | 18.1%(+51.8)#1,154 |
| 36. | 27832 | 69.2% | 20.3%(+49.0)#36 | 18.1%(+51.2)#1,179 |
| 37. | 27884 | 69.2% | 20.3%(+49.0)#37 | 18.1%(+51.2)#1,180 |
| 38. | 28202 | 68.5% | 20.3%(+48.2)#38 | 18.1%(+50.5)#1,210 |
| 39. | 27209 | 67.2% | 20.3%(+46.9)#39 | 18.1%(+49.1)#1,265 |
| 40. | 28386 | 66.1% | 20.3%(+45.8)#40 | 18.1%(+48.1)#1,337 |
| 41. | 27986 | 64.5% | 20.3%(+44.2)#41 | 18.1%(+46.5)#1,409 |
| 42. | 27946 | 64.4% | 20.3%(+44.2)#42 | 18.1%(+46.4)#1,413 |
| 43. | 27311 | 64.0% | 20.3%(+43.7)#43 | 18.1%(+45.9)#1,447 |
| 44. | 28775 | 63.4% | 20.3%(+43.1)#44 | 18.1%(+45.3)#1,479 |
| 45. | 27939 | 63.3% | 20.3%(+43.1)#45 | 18.1%(+45.3)#1,482 |
| 46. | 28683 | 63.2% | 20.3%(+42.9)#46 | 18.1%(+45.1)#1,488 |
| 47. | 28521 | 62.7% | 20.3%(+42.5)#47 | 18.1%(+44.7)#1,509 |
| 48. | 27326 | 62.6% | 20.3%(+42.4)#48 | 18.1%(+44.6)#1,518 |
| 49. | 28337 | 62.4% | 20.3%(+42.1)#49 | 18.1%(+44.3)#1,543 |
| 50. | 28697 | 62.3% | 20.3%(+42.0)#50 | 18.1%(+44.2)#1,546 |
| 51. | 27890 | 61.6% | 20.3%(+41.3)#51 | 18.1%(+43.5)#1,582 |
| 52. | 28340 | 61.3% | 20.3%(+41.0)#52 | 18.1%(+43.2)#1,611 |
| 53. | 28325 | 61.1% | 20.3%(+40.8)#53 | 18.1%(+43.0)#1,622 |
| 54. | 28344 | 59.5% | 20.3%(+39.2)#54 | 18.1%(+41.4)#1,730 |
| 55. | 27350 | 58.9% | 20.3%(+38.6)#55 | 18.1%(+40.8)#1,774 |
| 56. | 28431 | 58.5% | 20.3%(+38.2)#56 | 18.1%(+40.4)#1,795 |
| 57. | 27325 | 57.9% | 20.3%(+37.7)#57 | 18.1%(+39.9)#1,833 |
| 58. | 28144 | 57.9% | 20.3%(+37.6)#58 | 18.1%(+39.8)#1,841 |
| 59. | 28128 | 57.6% | 20.3%(+37.4)#59 | 18.1%(+39.6)#1,856 |
| 60. | 27505 | 57.1% | 20.3%(+36.9)#60 | 18.1%(+39.1)#1,881 |
| 61. | 28433 | 57.1% | 20.3%(+36.8)#61 | 18.1%(+39.0)#1,903 |
| 62. | 28455 | 56.9% | 20.3%(+36.6)#62 | 18.1%(+38.8)#1,918 |
| 63. | 27260 | 55.6% | 20.3%(+35.3)#63 | 18.1%(+37.6)#2,016 |
| 64. | 28707 | 55.6% | 20.3%(+35.3)#64 | 18.1%(+37.5)#2,035 |
| 65. | 27809 | 55.4% | 20.3%(+35.1)#65 | 18.1%(+37.3)#2,050 |
| 66. | 27401 | 55.2% | 20.3%(+34.9)#66 | 18.1%(+37.1)#2,059 |
| 67. | 28009 | 55.0% | 20.3%(+34.7)#67 | 18.1%(+36.9)#2,068 |
| 68. | 28301 | 54.4% | 20.3%(+34.2)#68 | 18.1%(+36.4)#2,109 |
| 69. | 27243 | 54.0% | 20.3%(+33.7)#69 | 18.1%(+35.9)#2,142 |
| 70. | 27962 | 53.3% | 20.3%(+33.1)#70 | 18.1%(+35.3)#2,212 |
| 71. | 27850 | 52.6% | 20.3%(+32.4)#71 | 18.1%(+34.6)#2,284 |
| 72. | 27801 | 52.4% | 20.3%(+32.2)#72 | 18.1%(+34.4)#2,305 |
| 73. | 27845 | 51.7% | 20.3%(+31.4)#73 | 18.1%(+33.7)#2,362 |
| 74. | 27889 | 51.0% | 20.3%(+30.7)#74 | 18.1%(+32.9)#2,431 |
| 75. | 28077 | 50.9% | 20.3%(+30.6)#75 | 18.1%(+32.8)#2,436 |
| 76. | 28351 | 50.0% | 20.3%(+29.7)#76 | 18.1%(+31.9)#2,521 |
| 77. | 27871 | 50.0% | 20.3%(+29.7)#77 | 18.1%(+31.9)#2,522 |
| 78. | 27047 | 50.0% | 20.3%(+29.7)#78 | 18.1%(+31.9)#2,541 |
| 79. | 28349 | 49.8% | 20.3%(+29.5)#79 | 18.1%(+31.7)#2,624 |
| 80. | 28384 | 49.7% | 20.3%(+29.4)#80 | 18.1%(+31.7)#2,629 |
| 81. | 28352 | 49.2% | 20.3%(+28.9)#81 | 18.1%(+31.1)#2,672 |
| 82. | 28365 | 49.2% | 20.3%(+28.9)#82 | 18.1%(+31.1)#2,674 |
| 83. | 27893 | 49.1% | 20.3%(+28.8)#83 | 18.1%(+31.0)#2,684 |
| 84. | 28383 | 49.1% | 20.3%(+28.8)#84 | 18.1%(+31.0)#2,688 |
| 85. | 27843 | 49.0% | 20.3%(+28.7)#85 | 18.1%(+31.0)#2,691 |
| 86. | 27807 | 48.5% | 20.3%(+28.2)#86 | 18.1%(+30.5)#2,751 |
| 87. | 28501 | 47.9% | 20.3%(+27.6)#87 | 18.1%(+29.8)#2,817 |
| 88. | 28580 | 47.6% | 20.3%(+27.4)#88 | 18.1%(+29.6)#2,852 |
| 89. | 28617 | 47.2% | 20.3%(+26.9)#89 | 18.1%(+29.1)#2,895 |
| 90. | 28463 | 47.2% | 20.3%(+26.9)#90 | 18.1%(+29.1)#2,896 |
| 91. | 28578 | 47.1% | 20.3%(+26.9)#91 | 18.1%(+29.1)#2,907 |
| 92. | 28665 | 47.0% | 20.3%(+26.7)#92 | 18.1%(+28.9)#2,925 |
| 93. | 28170 | 46.9% | 20.3%(+26.6)#93 | 18.1%(+28.9)#2,927 |
| 94. | 28621 | 46.9% | 20.3%(+26.6)#94 | 18.1%(+28.8)#2,930 |
| 95. | 28669 | 46.4% | 20.3%(+26.1)#95 | 18.1%(+28.4)#2,986 |
| 96. | 28538 | 46.4% | 20.3%(+26.1)#96 | 18.1%(+28.3)#2,996 |
| 97. | 28086 | 46.2% | 20.3%(+25.9)#97 | 18.1%(+28.2)#3,015 |
| 98. | 27823 | 46.1% | 20.3%(+25.8)#98 | 18.1%(+28.1)#3,042 |
| 99. | 28650 | 45.9% | 20.3%(+25.6)#99 | 18.1%(+27.8)#3,069 |
| 100. | 27105 | 45.2% | 20.3%(+24.9)#100 | 18.1%(+27.1)#3,155 |
Common Questions
What are the Top 10 Zip Codes with the Highest Poverty Level Among Children Under the Age of 5 in North Carolina?
Top 10 Zip Codes with the Highest Poverty Level Among Children Under the Age of 5 in North Carolina are:
What zip code has the Highest Poverty Level Among Children Under the Age of 5 in North Carolina?
27816 has the Highest Poverty Level Among Children Under the Age of 5 in North Carolina with 100.0%.
What is the Poverty Level Among Children Under the Age of 5 in the State of North Carolina?
Poverty Level Among Children Under the Age of 5 in North Carolina is 20.3%.
What is the Poverty Level Among Children Under the Age of 5 in the United States?
Poverty Level Among Children Under the Age of 5 in the United States is 18.1%.