Wilson s Mills, NC Map & Demographics
Wilson s Mills Map
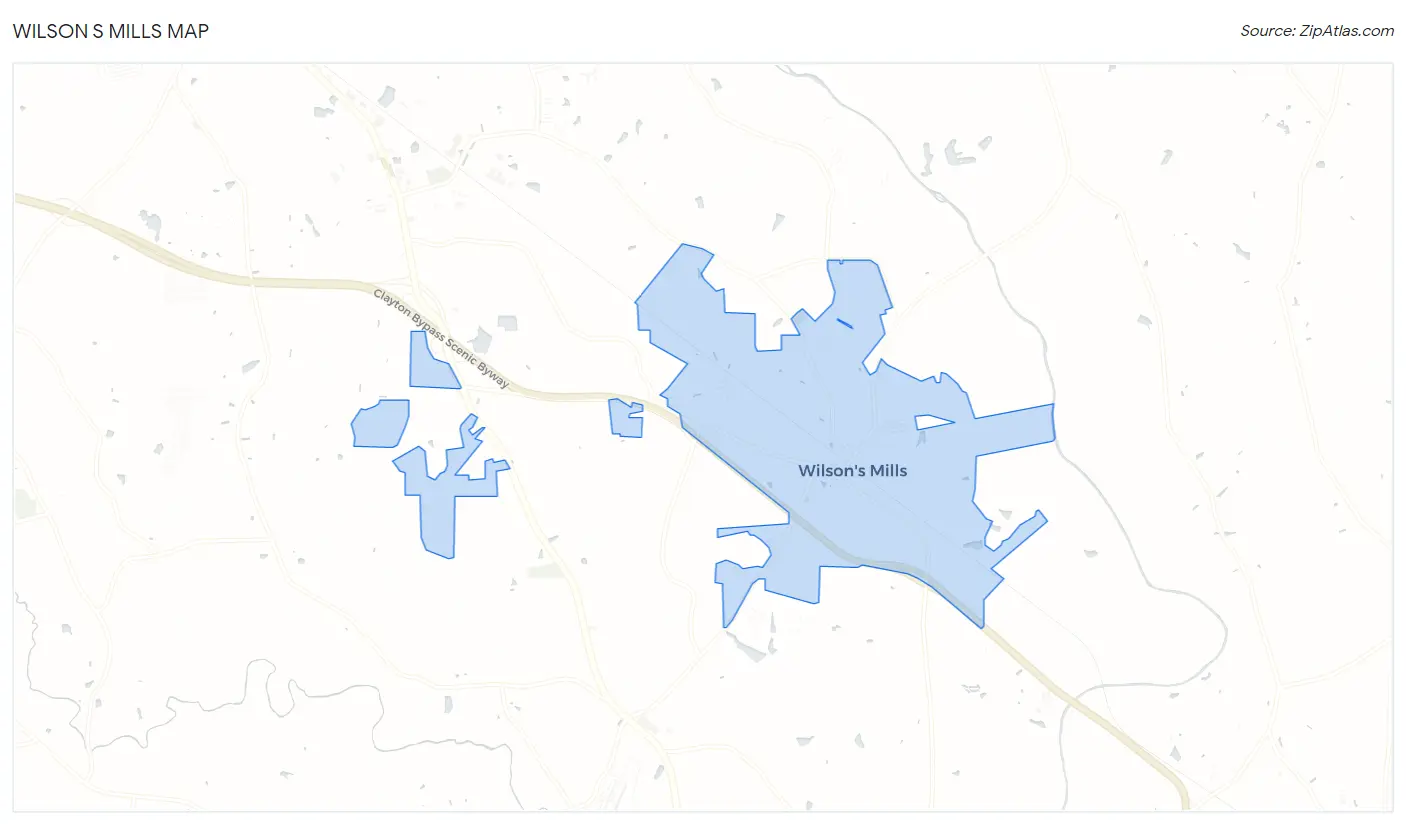
Wilson s Mills Overview
$22,503
PER CAPITA INCOME
$59,750
AVG FAMILY INCOME
$59,309
AVG HOUSEHOLD INCOME
14.8%
WAGE / INCOME GAP [ % ]
85.2¢/ $1
WAGE / INCOME GAP [ $ ]
0.34
INEQUALITY / GINI INDEX
2,581
TOTAL POPULATION
1,192
MALE POPULATION
1,389
FEMALE POPULATION
85.82
MALES / 100 FEMALES
116.53
FEMALES / 100 MALES
28.5
MEDIAN AGE
4.4
AVG FAMILY SIZE
3.4
AVG HOUSEHOLD SIZE
1,335
LABOR FORCE [ PEOPLE ]
72.9%
PERCENT IN LABOR FORCE
10.9%
UNEMPLOYMENT RATE
Income in Wilson s Mills
Income Overview in Wilson s Mills
Per Capita Income in Wilson s Mills is $22,503, while median incomes of families and households are $59,750 and $59,309 respectively.
| Characteristic | Number | Measure |
| Per Capita Income | 2,581 | $22,503 |
| Median Family Income | 476 | $59,750 |
| Mean Family Income | 476 | $73,117 |
| Median Household Income | 760 | $59,309 |
| Mean Household Income | 760 | $69,371 |
| Income Deficit | 476 | $0 |
| Wage / Income Gap (%) | 2,581 | 14.76% |
| Wage / Income Gap ($) | 2,581 | 85.24¢ per $1 |
| Gini / Inequality Index | 2,581 | 0.34 |
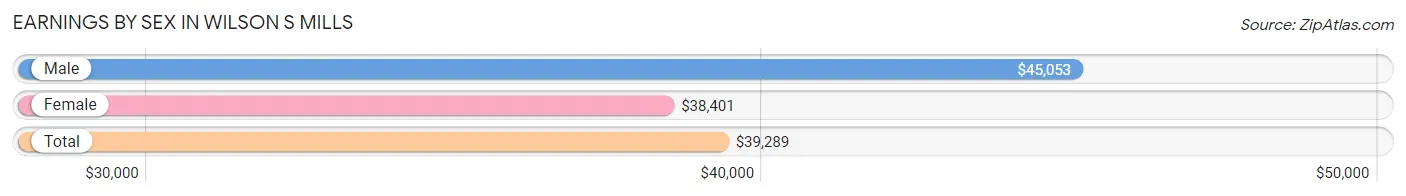
Earnings by Sex in Wilson s Mills
Average Earnings in Wilson s Mills are $39,289, $45,053 for men and $38,401 for women, a difference of 14.8%.
| Sex | Number | Average Earnings |
| Male | 764 (59.7%) | $45,053 |
| Female | 515 (40.3%) | $38,401 |
| Total | 1,279 (100.0%) | $39,289 |
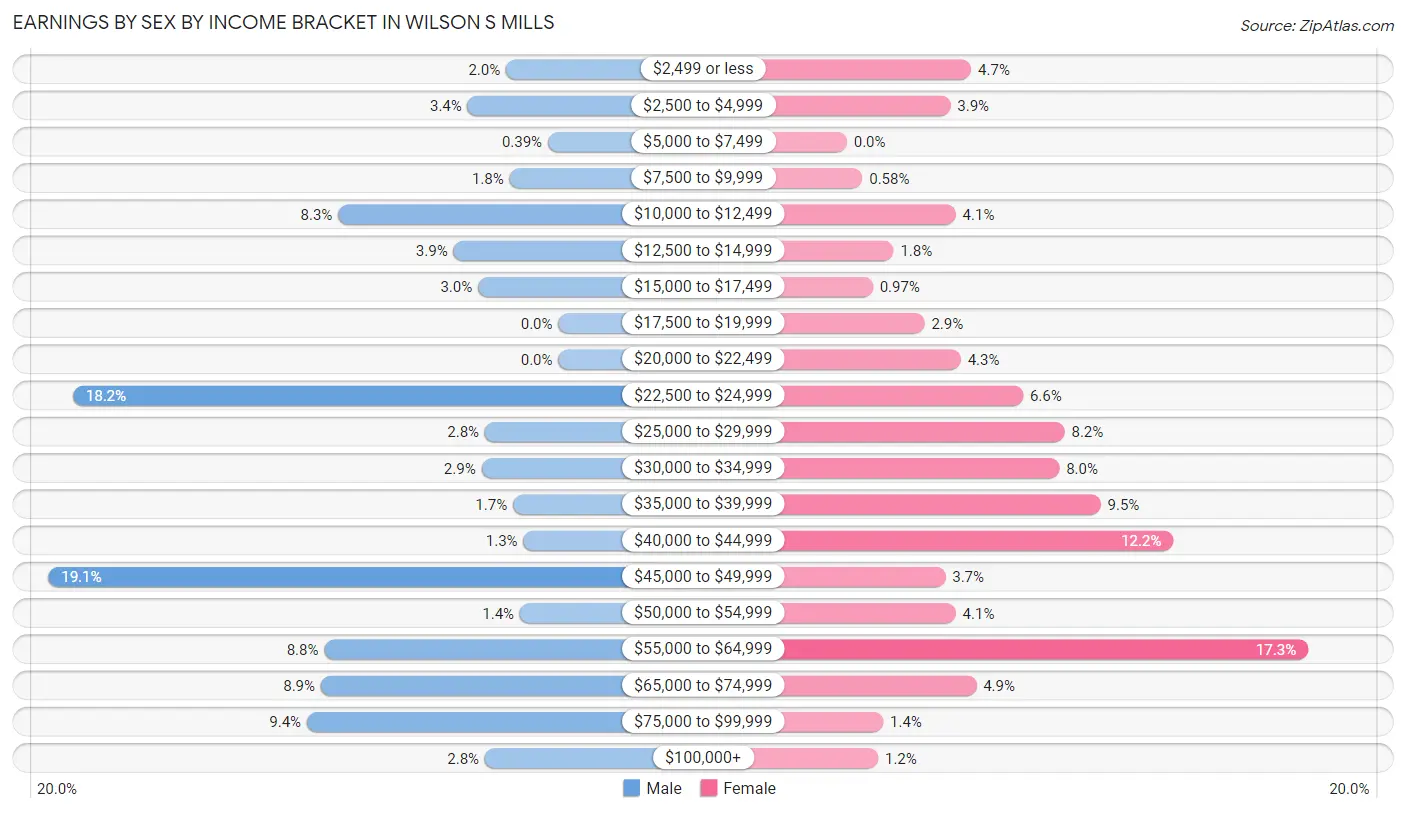
Earnings by Sex by Income Bracket in Wilson s Mills
The most common earnings brackets in Wilson s Mills are $45,000 to $49,999 for men (146 | 19.1%) and $55,000 to $64,999 for women (89 | 17.3%).
| Income | Male | Female |
| $2,499 or less | 15 (2.0%) | 24 (4.7%) |
| $2,500 to $4,999 | 26 (3.4%) | 20 (3.9%) |
| $5,000 to $7,499 | 3 (0.4%) | 0 (0.0%) |
| $7,500 to $9,999 | 14 (1.8%) | 3 (0.6%) |
| $10,000 to $12,499 | 63 (8.3%) | 21 (4.1%) |
| $12,500 to $14,999 | 30 (3.9%) | 9 (1.8%) |
| $15,000 to $17,499 | 23 (3.0%) | 5 (1.0%) |
| $17,500 to $19,999 | 0 (0.0%) | 15 (2.9%) |
| $20,000 to $22,499 | 0 (0.0%) | 22 (4.3%) |
| $22,500 to $24,999 | 139 (18.2%) | 34 (6.6%) |
| $25,000 to $29,999 | 21 (2.8%) | 42 (8.2%) |
| $30,000 to $34,999 | 22 (2.9%) | 41 (8.0%) |
| $35,000 to $39,999 | 13 (1.7%) | 49 (9.5%) |
| $40,000 to $44,999 | 10 (1.3%) | 63 (12.2%) |
| $45,000 to $49,999 | 146 (19.1%) | 19 (3.7%) |
| $50,000 to $54,999 | 11 (1.4%) | 21 (4.1%) |
| $55,000 to $64,999 | 67 (8.8%) | 89 (17.3%) |
| $65,000 to $74,999 | 68 (8.9%) | 25 (4.9%) |
| $75,000 to $99,999 | 72 (9.4%) | 7 (1.4%) |
| $100,000+ | 21 (2.8%) | 6 (1.2%) |
| Total | 764 (100.0%) | 515 (100.0%) |
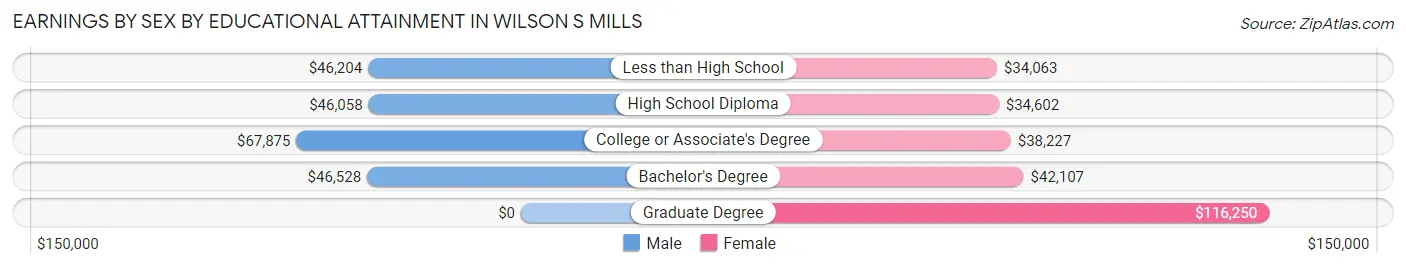
Earnings by Sex by Educational Attainment in Wilson s Mills
Average earnings in Wilson s Mills are $46,809 for men and $39,651 for women, a difference of 15.3%. Men with an educational attainment of college or associate's degree enjoy the highest average annual earnings of $67,875, while those with high school diploma education earn the least with $46,058. Women with an educational attainment of graduate degree earn the most with the average annual earnings of $116,250, while those with less than high school education have the smallest earnings of $34,063.
| Educational Attainment | Male Income | Female Income |
| Less than High School | $46,204 | $34,063 |
| High School Diploma | $46,058 | $34,602 |
| College or Associate's Degree | $67,875 | $38,227 |
| Bachelor's Degree | $46,528 | $42,107 |
| Graduate Degree | - | - |
| Total | $46,809 | $39,651 |
Family Income in Wilson s Mills
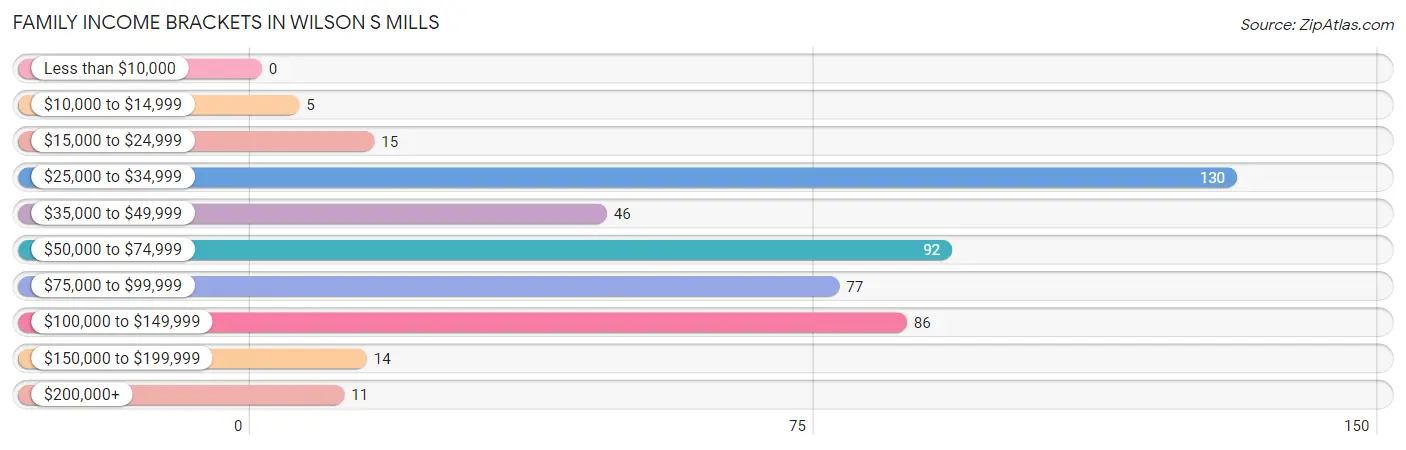
Family Income Brackets in Wilson s Mills
According to the Wilson s Mills family income data, there are 130 families falling into the $25,000 to $34,999 income range, which is the most common income bracket and makes up 27.3% of all families.
| Income Bracket | # Families | % Families |
| Less than $10,000 | 0 | 0.0% |
| $10,000 to $14,999 | 5 | 1.1% |
| $15,000 to $24,999 | 15 | 3.2% |
| $25,000 to $34,999 | 130 | 27.3% |
| $35,000 to $49,999 | 46 | 9.7% |
| $50,000 to $74,999 | 92 | 19.3% |
| $75,000 to $99,999 | 77 | 16.2% |
| $100,000 to $149,999 | 86 | 18.1% |
| $150,000 to $199,999 | 14 | 2.9% |
| $200,000+ | 11 | 2.3% |
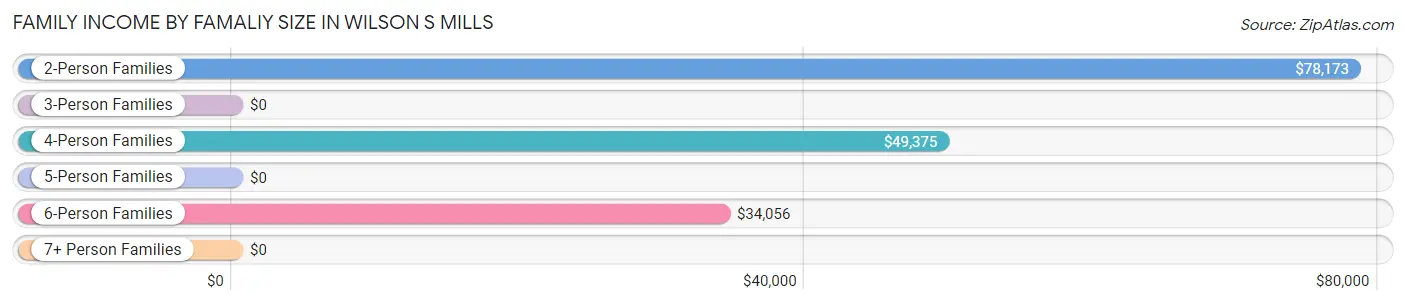
Family Income by Famaliy Size in Wilson s Mills
2-person families (149 | 31.3%) account for the highest median family income in Wilson s Mills with $78,173 per family, while 2-person families (149 | 31.3%) have the highest median income of $39,086 per family member.
| Income Bracket | # Families | Median Income |
| 2-Person Families | 149 (31.3%) | $78,173 |
| 3-Person Families | 76 (16.0%) | $0 |
| 4-Person Families | 139 (29.2%) | $49,375 |
| 5-Person Families | 46 (9.7%) | $0 |
| 6-Person Families | 66 (13.9%) | $34,056 |
| 7+ Person Families | 0 (0.0%) | $0 |
| Total | 476 (100.0%) | $59,750 |
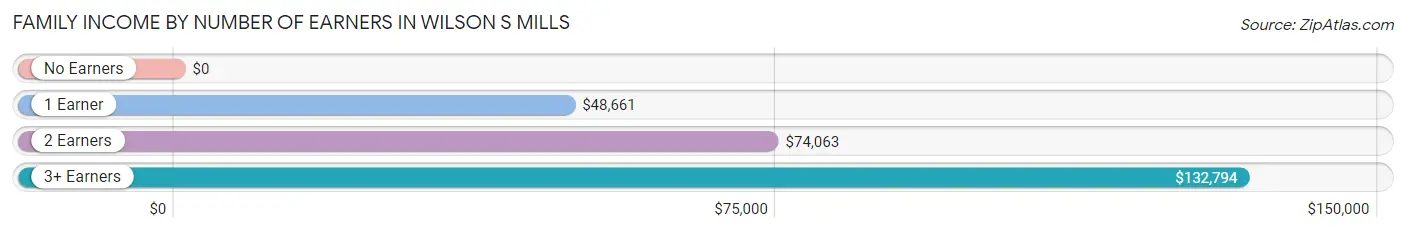
Family Income by Number of Earners in Wilson s Mills
| Number of Earners | # Families | Median Income |
| No Earners | 17 (3.6%) | $0 |
| 1 Earner | 191 (40.1%) | $48,661 |
| 2 Earners | 216 (45.4%) | $74,063 |
| 3+ Earners | 52 (10.9%) | $132,794 |
| Total | 476 (100.0%) | $59,750 |
Household Income in Wilson s Mills
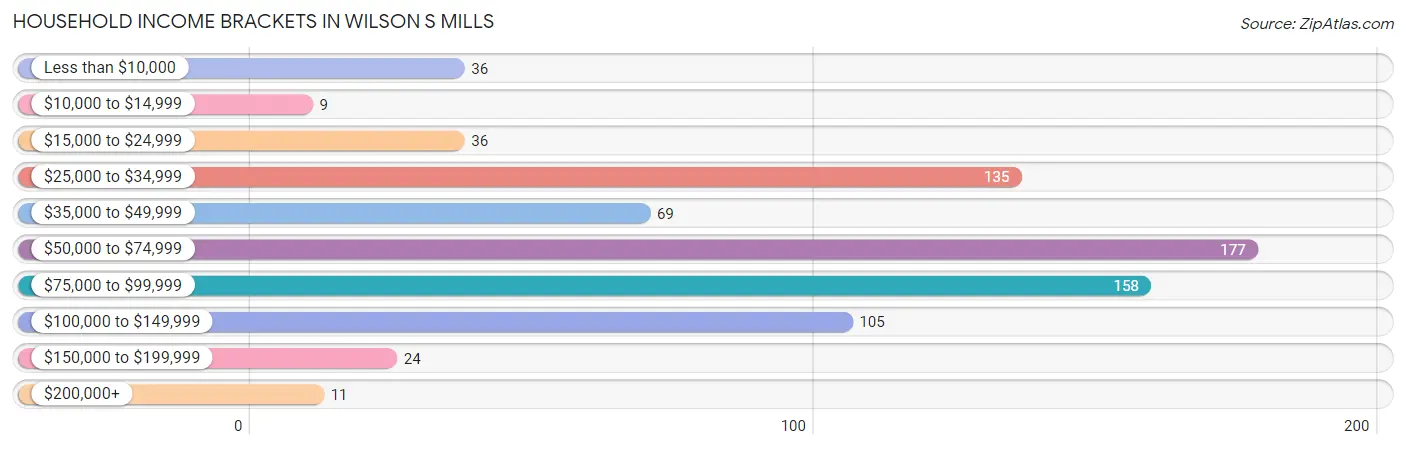
Household Income Brackets in Wilson s Mills
With 177 households falling in the category, the $50,000 to $74,999 income range is the most frequent in Wilson s Mills, accounting for 23.3% of all households. In contrast, only 9 households (1.2%) fall into the $10,000 to $14,999 income bracket, making it the least populous group.
| Income Bracket | # Households | % Households |
| Less than $10,000 | 36 | 4.7% |
| $10,000 to $14,999 | 9 | 1.2% |
| $15,000 to $24,999 | 36 | 4.7% |
| $25,000 to $34,999 | 135 | 17.8% |
| $35,000 to $49,999 | 69 | 9.1% |
| $50,000 to $74,999 | 177 | 23.3% |
| $75,000 to $99,999 | 158 | 20.8% |
| $100,000 to $149,999 | 105 | 13.8% |
| $150,000 to $199,999 | 24 | 3.2% |
| $200,000+ | 11 | 1.4% |
Household Income by Householder Age in Wilson s Mills
The median household income in Wilson s Mills is $59,309, with the highest median household income of $71,063 found in the 25 to 44 years age bracket for the primary householder. A total of 381 households (50.1%) fall into this category. Meanwhile, the 15 to 24 years age bracket for the primary householder has the lowest median household income of $0, with 8 households (1.1%) in this group.
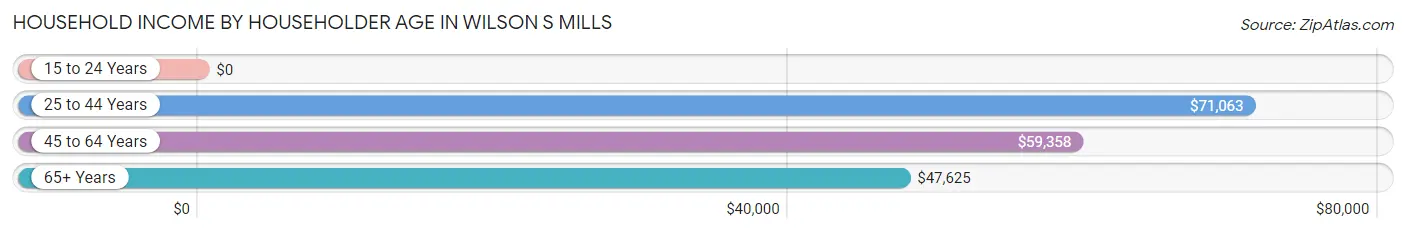
| Income Bracket | # Households | Median Income |
| 15 to 24 Years | 8 (1.1%) | $0 |
| 25 to 44 Years | 381 (50.1%) | $71,063 |
| 45 to 64 Years | 284 (37.4%) | $59,358 |
| 65+ Years | 87 (11.5%) | $47,625 |
| Total | 760 (100.0%) | $59,309 |
Poverty in Wilson s Mills
Income Below Poverty by Sex and Age in Wilson s Mills
With 33.8% poverty level for males and 37.4% for females among the residents of Wilson s Mills, 12 to 14 year old males and 5 year old females are the most vulnerable to poverty, with 169 males (93.4%) and 4 females (100.0%) in their respective age groups living below the poverty level.
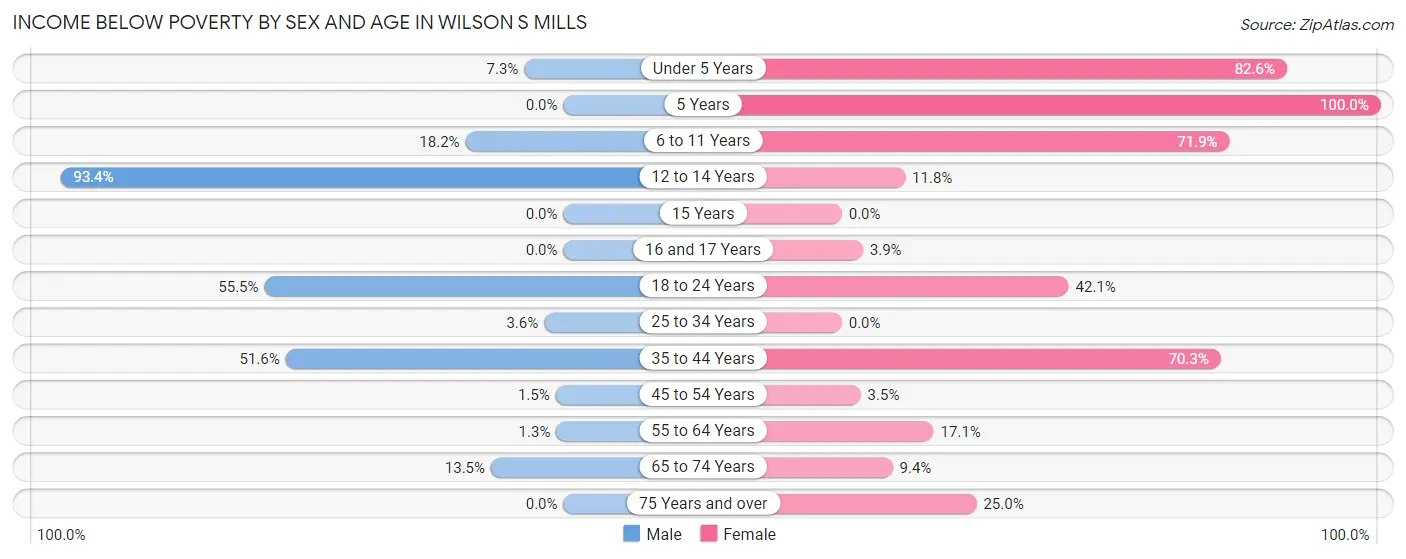
| Age Bracket | Male | Female |
| Under 5 Years | 4 (7.3%) | 218 (82.6%) |
| 5 Years | 0 (0.0%) | 4 (100.0%) |
| 6 to 11 Years | 6 (18.2%) | 100 (71.9%) |
| 12 to 14 Years | 169 (93.4%) | 6 (11.8%) |
| 15 Years | 0 (0.0%) | 0 (0.0%) |
| 16 and 17 Years | 0 (0.0%) | 5 (3.9%) |
| 18 to 24 Years | 121 (55.5%) | 24 (42.1%) |
| 25 to 34 Years | 10 (3.6%) | 0 (0.0%) |
| 35 to 44 Years | 82 (51.6%) | 128 (70.3%) |
| 45 to 54 Years | 1 (1.5%) | 7 (3.5%) |
| 55 to 64 Years | 1 (1.3%) | 15 (17.1%) |
| 65 to 74 Years | 7 (13.5%) | 5 (9.4%) |
| 75 Years and over | 0 (0.0%) | 7 (25.0%) |
| Total | 401 (33.8%) | 519 (37.4%) |
Income Above Poverty by Sex and Age in Wilson s Mills
According to the poverty statistics in Wilson s Mills, males aged 5 years and females aged 25 to 34 years are the age groups that are most secure financially, with 100.0% of males and 100.0% of females in these age groups living above the poverty line.
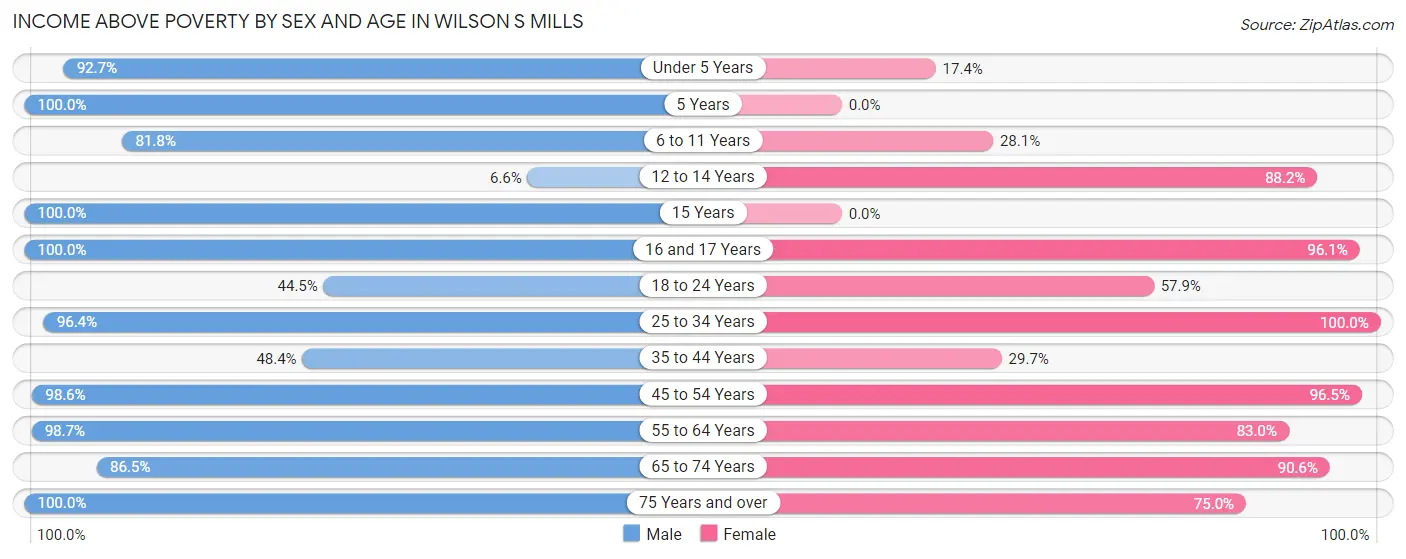
| Age Bracket | Male | Female |
| Under 5 Years | 51 (92.7%) | 46 (17.4%) |
| 5 Years | 14 (100.0%) | 0 (0.0%) |
| 6 to 11 Years | 27 (81.8%) | 39 (28.1%) |
| 12 to 14 Years | 12 (6.6%) | 45 (88.2%) |
| 15 Years | 4 (100.0%) | 0 (0.0%) |
| 16 and 17 Years | 41 (100.0%) | 123 (96.1%) |
| 18 to 24 Years | 97 (44.5%) | 33 (57.9%) |
| 25 to 34 Years | 269 (96.4%) | 195 (100.0%) |
| 35 to 44 Years | 77 (48.4%) | 54 (29.7%) |
| 45 to 54 Years | 68 (98.6%) | 193 (96.5%) |
| 55 to 64 Years | 75 (98.7%) | 73 (83.0%) |
| 65 to 74 Years | 45 (86.5%) | 48 (90.6%) |
| 75 Years and over | 6 (100.0%) | 21 (75.0%) |
| Total | 786 (66.2%) | 870 (62.6%) |
Income Below Poverty Among Married-Couple Families in Wilson s Mills
The poverty statistics for married-couple families in Wilson s Mills show that 30.4% or 85 of the total 280 families live below the poverty line. Families with 1 or 2 children have the highest poverty rate of 48.5%, comprising of 80 families. On the other hand, families with no children have the lowest poverty rate of 0.0%, which includes 0 families.
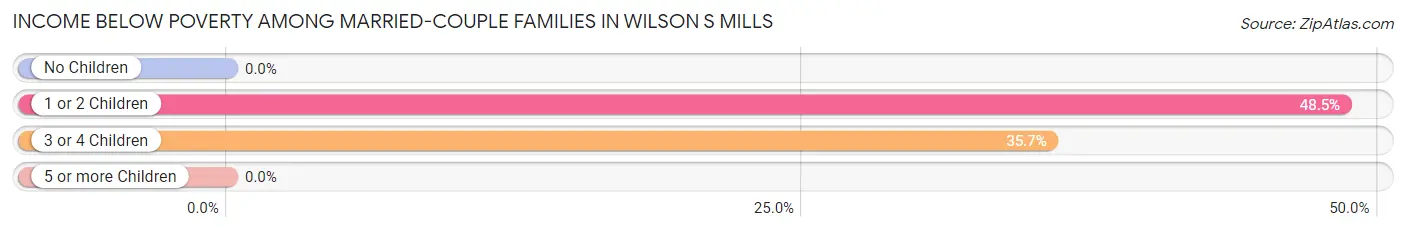
| Children | Above Poverty | Below Poverty |
| No Children | 101 (100.0%) | 0 (0.0%) |
| 1 or 2 Children | 85 (51.5%) | 80 (48.5%) |
| 3 or 4 Children | 9 (64.3%) | 5 (35.7%) |
| 5 or more Children | 0 (0.0%) | 0 (0.0%) |
| Total | 195 (69.6%) | 85 (30.4%) |
Income Below Poverty Among Single-Parent Households in Wilson s Mills
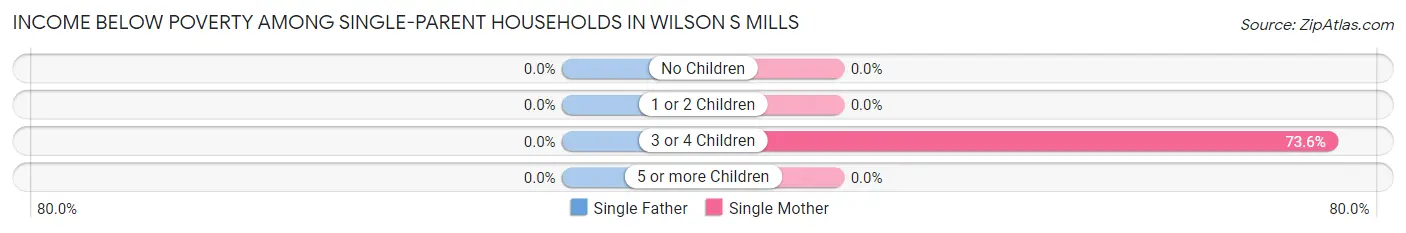
| Children | Single Father | Single Mother |
| No Children | 0 (0.0%) | 0 (0.0%) |
| 1 or 2 Children | 0 (0.0%) | 0 (0.0%) |
| 3 or 4 Children | 0 (0.0%) | 39 (73.6%) |
| 5 or more Children | 0 (0.0%) | 0 (0.0%) |
| Total | 0 (0.0%) | 39 (23.9%) |
Income Below Poverty Among Married-Couple vs Single-Parent Households in Wilson s Mills
The poverty data for Wilson s Mills shows that 85 of the married-couple family households (30.4%) and 39 of the single-parent households (19.9%) are living below the poverty level. Within the married-couple family households, those with 1 or 2 children have the highest poverty rate, with 80 households (48.5%) falling below the poverty line. Among the single-parent households, those with 3 or 4 children have the highest poverty rate, with 39 household (73.6%) living below poverty.
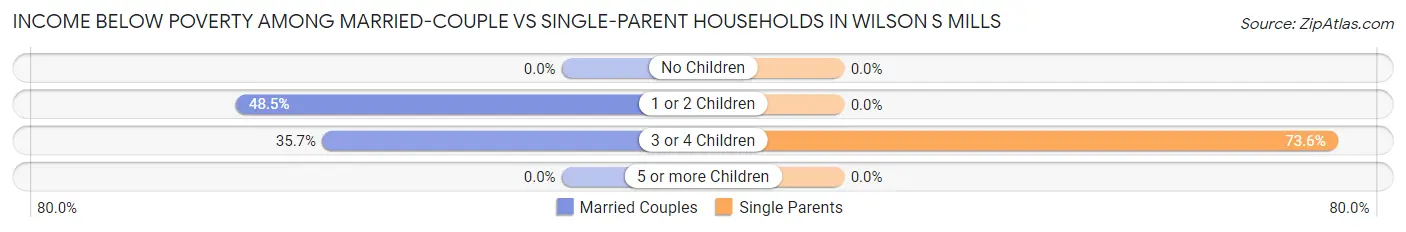
| Children | Married-Couple Families | Single-Parent Households |
| No Children | 0 (0.0%) | 0 (0.0%) |
| 1 or 2 Children | 80 (48.5%) | 0 (0.0%) |
| 3 or 4 Children | 5 (35.7%) | 39 (73.6%) |
| 5 or more Children | 0 (0.0%) | 0 (0.0%) |
| Total | 85 (30.4%) | 39 (19.9%) |
Race in Wilson s Mills
The most populous races in Wilson s Mills are White / Caucasian (1,160 | 44.9%), Hispanic or Latino (977 | 37.9%), and Black / African American (552 | 21.4%).
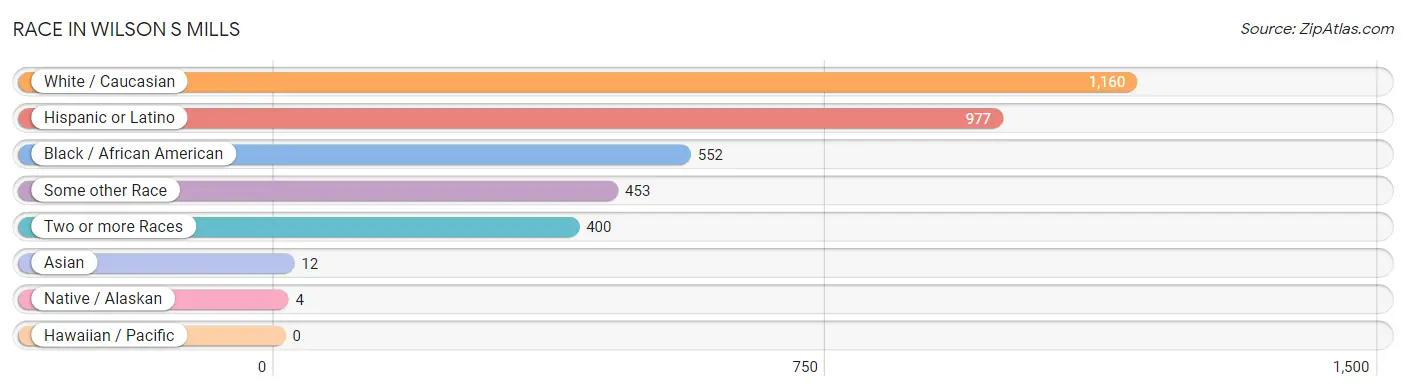
| Race | # Population | % Population |
| Asian | 12 | 0.5% |
| Black / African American | 552 | 21.4% |
| Hawaiian / Pacific | 0 | 0.0% |
| Hispanic or Latino | 977 | 37.9% |
| Native / Alaskan | 4 | 0.2% |
| White / Caucasian | 1,160 | 44.9% |
| Two or more Races | 400 | 15.5% |
| Some other Race | 453 | 17.5% |
| Total | 2,581 | 100.0% |
Ancestry in Wilson s Mills
The most populous ancestries reported in Wilson s Mills are Mexican (473 | 18.3%), Central American (418 | 16.2%), Honduran (411 | 15.9%), English (221 | 8.6%), and American (153 | 5.9%), together accounting for 64.9% of all Wilson s Mills residents.
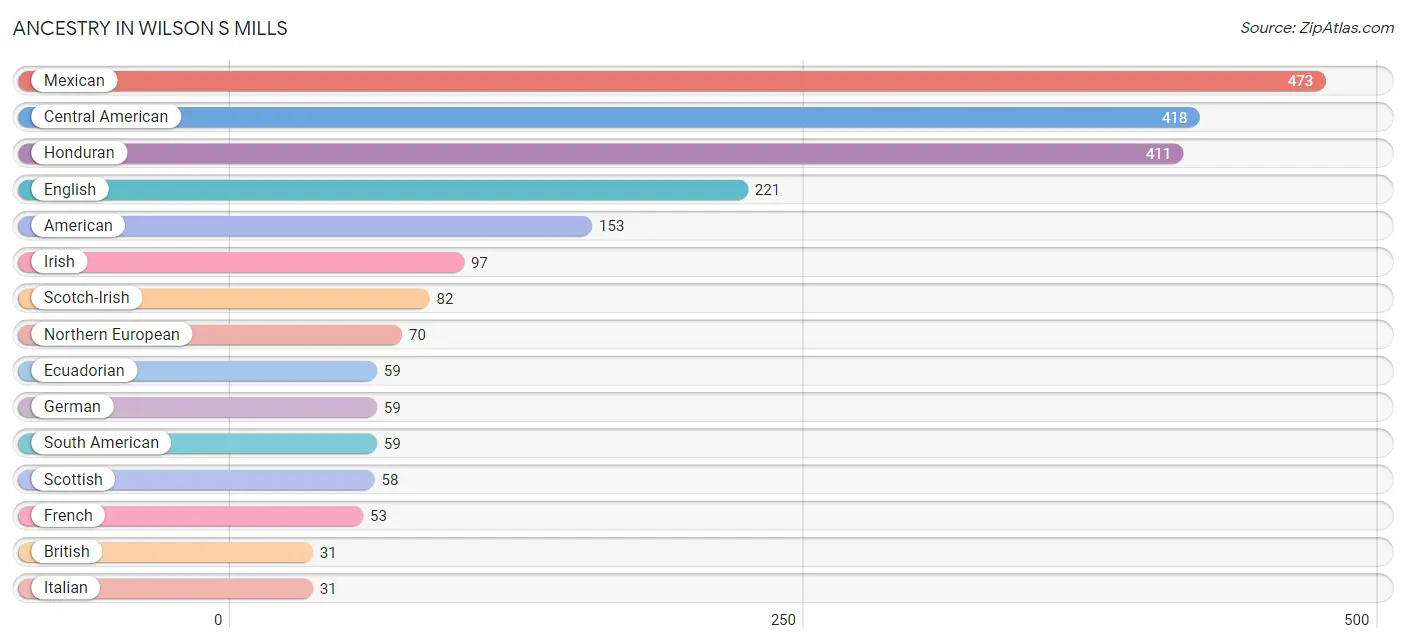
| Ancestry | # Population | % Population |
| American | 153 | 5.9% |
| Arab | 5 | 0.2% |
| British | 31 | 1.2% |
| Burmese | 7 | 0.3% |
| Central American | 418 | 16.2% |
| Ecuadorian | 59 | 2.3% |
| English | 221 | 8.6% |
| European | 8 | 0.3% |
| French | 53 | 2.1% |
| German | 59 | 2.3% |
| Greek | 2 | 0.1% |
| Honduran | 411 | 15.9% |
| Indian (Asian) | 3 | 0.1% |
| Irish | 97 | 3.8% |
| Italian | 31 | 1.2% |
| Korean | 12 | 0.5% |
| Lebanese | 5 | 0.2% |
| Lumbee | 6 | 0.2% |
| Mexican | 473 | 18.3% |
| Native Hawaiian | 3 | 0.1% |
| Northern European | 70 | 2.7% |
| Norwegian | 14 | 0.5% |
| Panamanian | 4 | 0.2% |
| Polish | 19 | 0.7% |
| Puerto Rican | 11 | 0.4% |
| Salvadoran | 3 | 0.1% |
| Scotch-Irish | 82 | 3.2% |
| Scottish | 58 | 2.2% |
| Serbian | 19 | 0.7% |
| South American | 59 | 2.3% |
| Spaniard | 16 | 0.6% |
| Swedish | 26 | 1.0% |
| Ukrainian | 4 | 0.2% | View All 33 Rows |
Immigrants in Wilson s Mills
The most numerous immigrant groups reported in Wilson s Mills came from Latin America (143 | 5.5%), Central America (99 | 3.8%), Mexico (82 | 3.2%), Ecuador (44 | 1.7%), and South America (44 | 1.7%), together accounting for 16.0% of all Wilson s Mills residents.
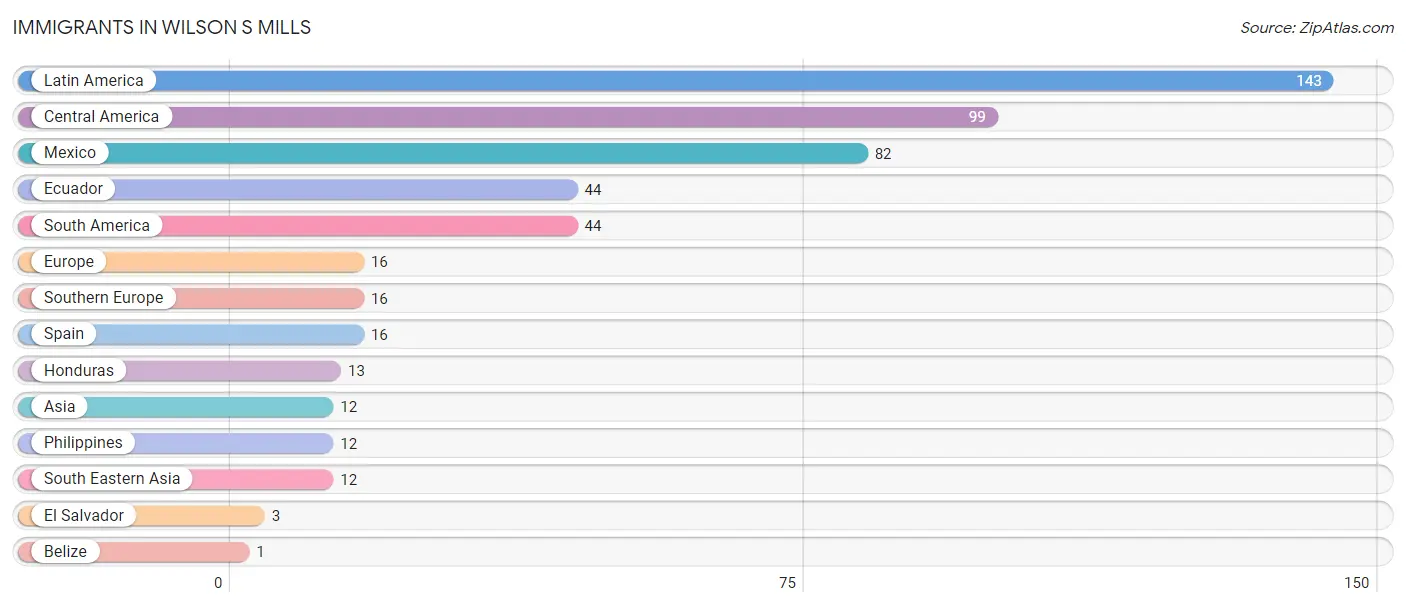
| Immigration Origin | # Population | % Population |
| Asia | 12 | 0.5% |
| Belize | 1 | 0.0% |
| Central America | 99 | 3.8% |
| Ecuador | 44 | 1.7% |
| El Salvador | 3 | 0.1% |
| Europe | 16 | 0.6% |
| Honduras | 13 | 0.5% |
| Latin America | 143 | 5.5% |
| Mexico | 82 | 3.2% |
| Philippines | 12 | 0.5% |
| South America | 44 | 1.7% |
| South Eastern Asia | 12 | 0.5% |
| Southern Europe | 16 | 0.6% |
| Spain | 16 | 0.6% | View All 14 Rows |
Sex and Age in Wilson s Mills
Sex and Age in Wilson s Mills
The most populous age groups in Wilson s Mills are 30 to 34 Years (206 | 17.3%) for men and Under 5 Years (264 | 19.0%) for women.
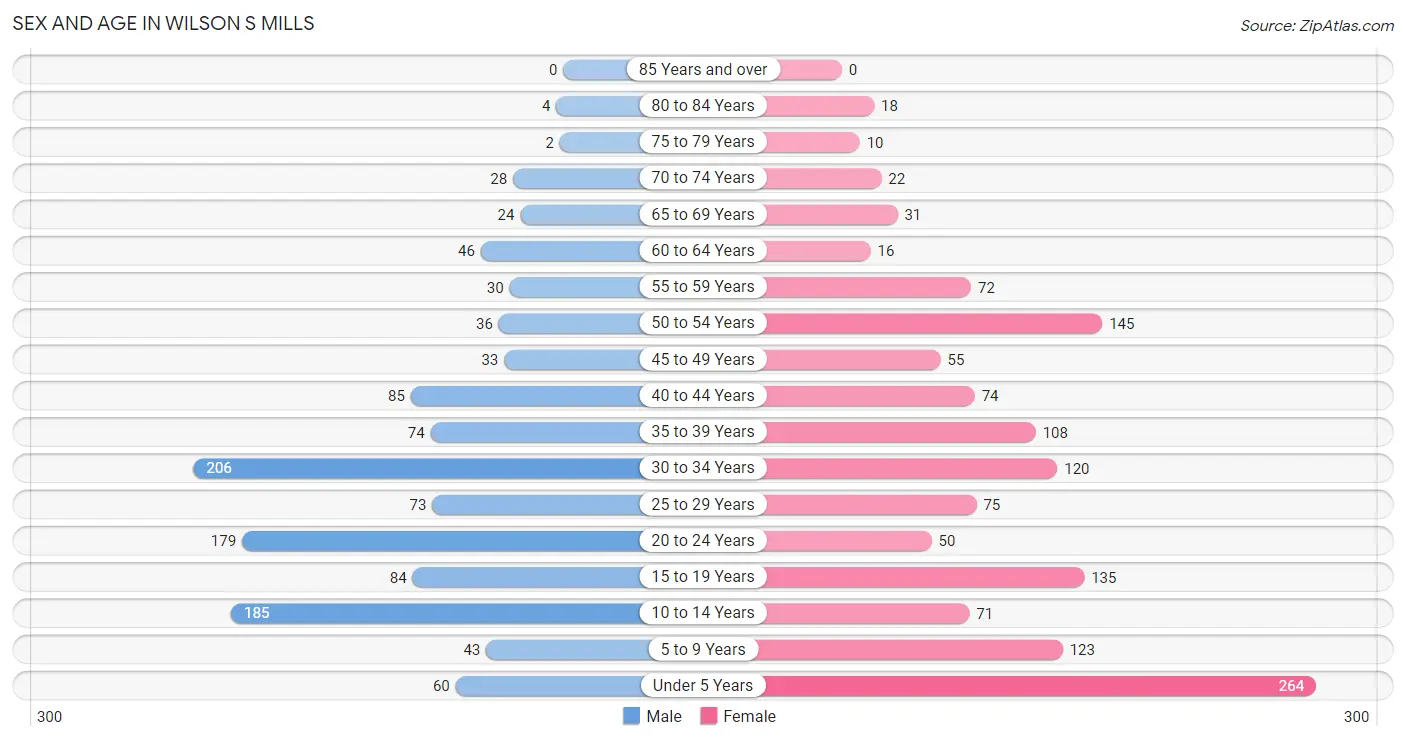
| Age Bracket | Male | Female |
| Under 5 Years | 60 (5.0%) | 264 (19.0%) |
| 5 to 9 Years | 43 (3.6%) | 123 (8.9%) |
| 10 to 14 Years | 185 (15.5%) | 71 (5.1%) |
| 15 to 19 Years | 84 (7.0%) | 135 (9.7%) |
| 20 to 24 Years | 179 (15.0%) | 50 (3.6%) |
| 25 to 29 Years | 73 (6.1%) | 75 (5.4%) |
| 30 to 34 Years | 206 (17.3%) | 120 (8.6%) |
| 35 to 39 Years | 74 (6.2%) | 108 (7.8%) |
| 40 to 44 Years | 85 (7.1%) | 74 (5.3%) |
| 45 to 49 Years | 33 (2.8%) | 55 (4.0%) |
| 50 to 54 Years | 36 (3.0%) | 145 (10.4%) |
| 55 to 59 Years | 30 (2.5%) | 72 (5.2%) |
| 60 to 64 Years | 46 (3.9%) | 16 (1.1%) |
| 65 to 69 Years | 24 (2.0%) | 31 (2.2%) |
| 70 to 74 Years | 28 (2.4%) | 22 (1.6%) |
| 75 to 79 Years | 2 (0.2%) | 10 (0.7%) |
| 80 to 84 Years | 4 (0.3%) | 18 (1.3%) |
| 85 Years and over | 0 (0.0%) | 0 (0.0%) |
| Total | 1,192 (100.0%) | 1,389 (100.0%) |
Families and Households in Wilson s Mills
Median Family Size in Wilson s Mills
The median family size in Wilson s Mills is 4.40 persons per family, with single female/mother families (163 | 34.2%) accounting for the largest median family size of 4.82 persons per family. On the other hand, single male/father families (33 | 6.9%) represent the smallest median family size with 3.30 persons per family.
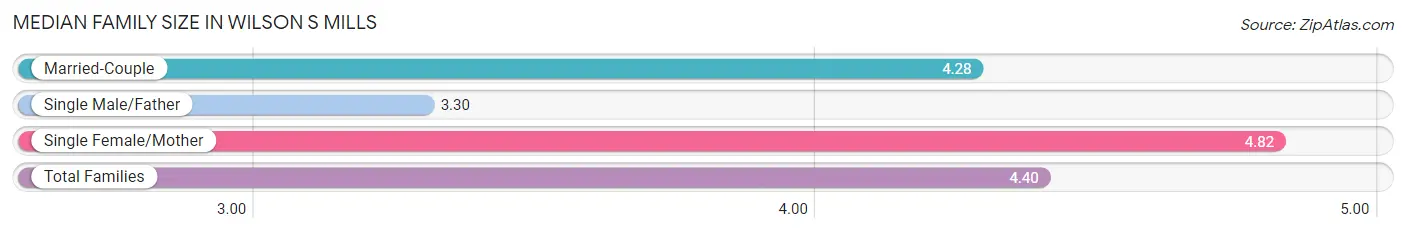
| Family Type | # Families | Family Size |
| Married-Couple | 280 (58.8%) | 4.28 |
| Single Male/Father | 33 (6.9%) | 3.30 |
| Single Female/Mother | 163 (34.2%) | 4.82 |
| Total Families | 476 (100.0%) | 4.40 |
Median Household Size in Wilson s Mills
The median household size in Wilson s Mills is 3.39 persons per household, with single female/mother households (163 | 21.4%) accounting for the largest median household size of 5.12 persons per household. non-family households (284 | 37.4%) represent the smallest median household size with 1.54 persons per household.
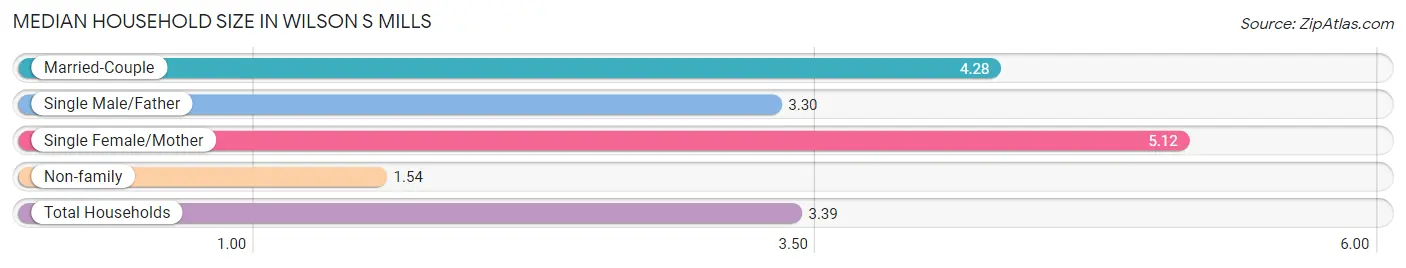
| Household Type | # Households | Household Size |
| Married-Couple | 280 (36.8%) | 4.28 |
| Single Male/Father | 33 (4.3%) | 3.30 |
| Single Female/Mother | 163 (21.4%) | 5.12 |
| Non-family | 284 (37.4%) | 1.54 |
| Total Households | 760 (100.0%) | 3.39 |
Household Size by Marriage Status in Wilson s Mills
Out of a total of 760 households in Wilson s Mills, 476 (62.6%) are family households, while 284 (37.4%) are nonfamily households. The most numerous type of family households are 4-person households, comprising 147, and the most common type of nonfamily households are 1-person households, comprising 202.
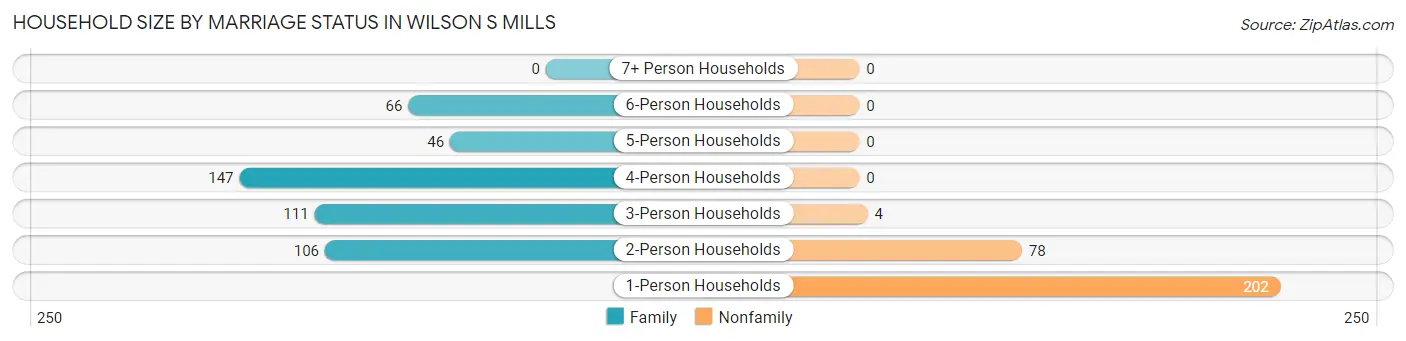
| Household Size | Family Households | Nonfamily Households |
| 1-Person Households | - | 202 (26.6%) |
| 2-Person Households | 106 (14.0%) | 78 (10.3%) |
| 3-Person Households | 111 (14.6%) | 4 (0.5%) |
| 4-Person Households | 147 (19.3%) | 0 (0.0%) |
| 5-Person Households | 46 (6.0%) | 0 (0.0%) |
| 6-Person Households | 66 (8.7%) | 0 (0.0%) |
| 7+ Person Households | 0 (0.0%) | 0 (0.0%) |
| Total | 476 (62.6%) | 284 (37.4%) |
Female Fertility in Wilson s Mills
Fertility by Age in Wilson s Mills
Average fertility rate in Wilson s Mills is 42.0 births per 1,000 women. Women in the age bracket of 20 to 34 years have the highest fertility rate with 69.0 births per 1,000 women. Women in the age bracket of 20 to 34 years acount for 65.4% of all women with births.
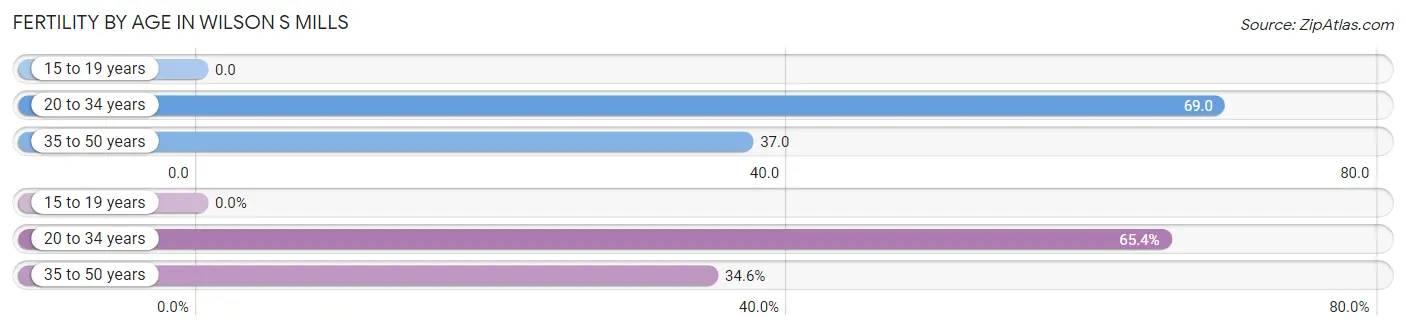
| Age Bracket | Women with Births | Births / 1,000 Women |
| 15 to 19 years | 0 (0.0%) | 0.0 |
| 20 to 34 years | 17 (65.4%) | 69.0 |
| 35 to 50 years | 9 (34.6%) | 37.0 |
| Total | 26 (100.0%) | 42.0 |
Fertility by Age by Marriage Status in Wilson s Mills
46.2% of women with births (26) in Wilson s Mills are married. The highest percentage of unmarried women with births falls into 20 to 34 years age bracket with 82.4% of them unmarried at the time of birth, while the lowest percentage of unmarried women with births belong to 35 to 50 years age bracket with 0.0% of them unmarried.
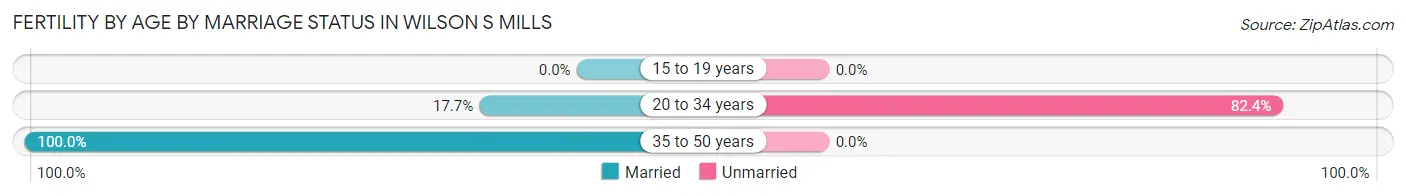
| Age Bracket | Married | Unmarried |
| 15 to 19 years | 0 (0.0%) | 0 (0.0%) |
| 20 to 34 years | 3 (17.6%) | 14 (82.4%) |
| 35 to 50 years | 9 (100.0%) | 0 (0.0%) |
| Total | 12 (46.2%) | 14 (53.8%) |
Fertility by Education in Wilson s Mills
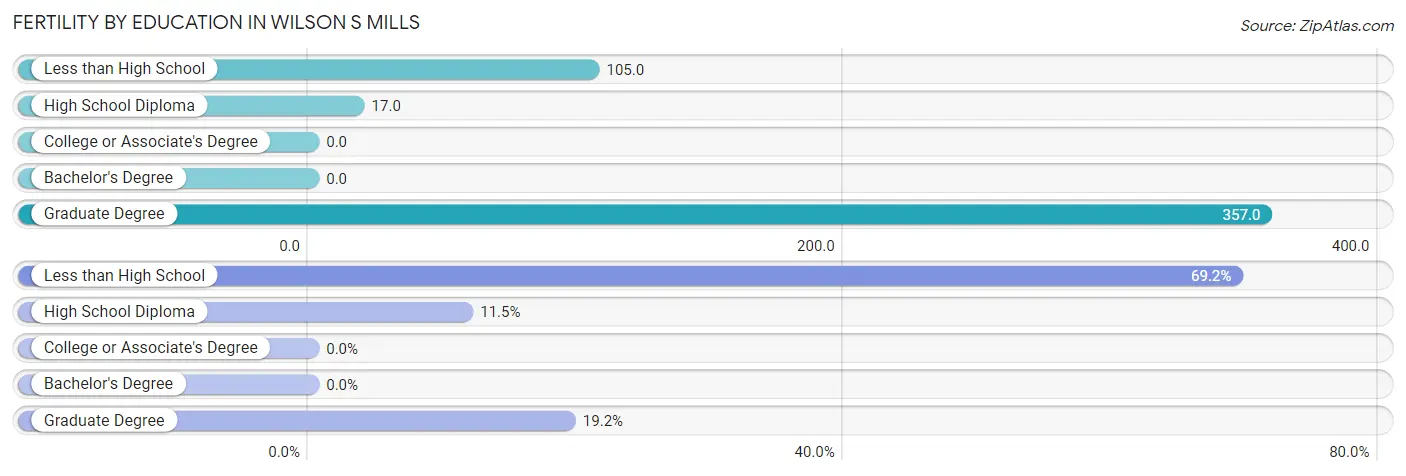
| Educational Attainment | Women with Births | Births / 1,000 Women |
| Less than High School | 18 (69.2%) | 105.0 |
| High School Diploma | 3 (11.5%) | 17.0 |
| College or Associate's Degree | 0 (0.0%) | 0.0 |
| Bachelor's Degree | 0 (0.0%) | 0.0 |
| Graduate Degree | 5 (19.2%) | 357.0 |
| Total | 26 (100.0%) | 42.0 |
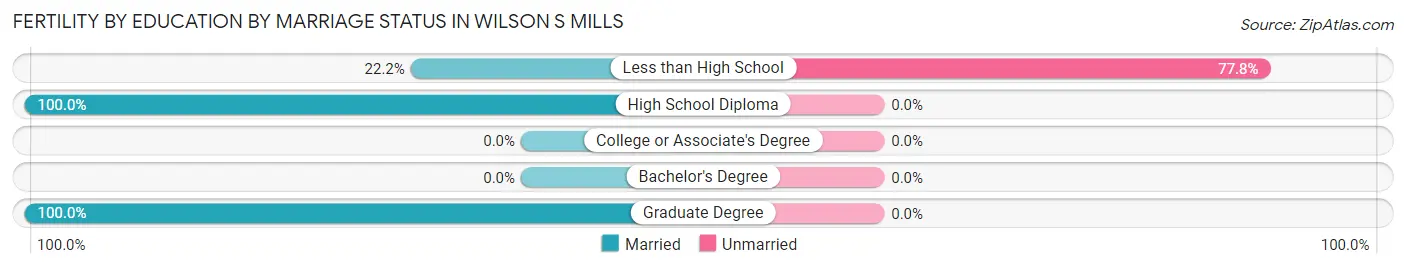
Fertility by Education by Marriage Status in Wilson s Mills
53.8% of women with births in Wilson s Mills are unmarried. Women with the educational attainment of high school diploma are most likely to be married with 100.0% of them married at childbirth, while women with the educational attainment of less than high school are least likely to be married with 77.8% of them unmarried at childbirth.
| Educational Attainment | Married | Unmarried |
| Less than High School | 4 (22.2%) | 14 (77.8%) |
| High School Diploma | 3 (100.0%) | 0 (0.0%) |
| College or Associate's Degree | 0 (0.0%) | 0 (0.0%) |
| Bachelor's Degree | 0 (0.0%) | 0 (0.0%) |
| Graduate Degree | 5 (100.0%) | 0 (0.0%) |
| Total | 12 (46.2%) | 14 (53.8%) |
Employment Characteristics in Wilson s Mills
Employment by Class of Employer in Wilson s Mills
Among the 1,159 employed individuals in Wilson s Mills, private company employees (693 | 59.8%), local government employees (153 | 13.2%), and self-employed (not incorporated) (128 | 11.0%) make up the most common classes of employment.
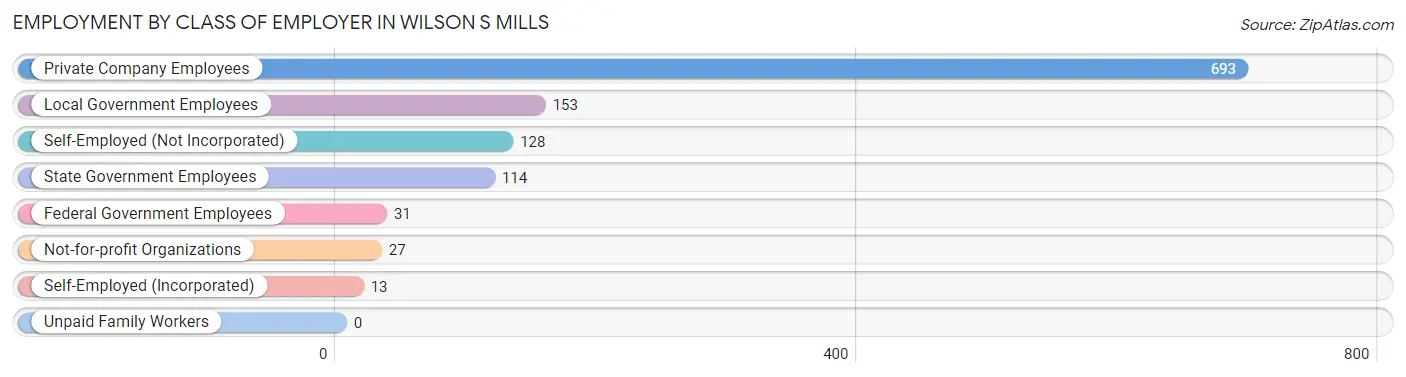
| Employer Class | # Employees | % Employees |
| Private Company Employees | 693 | 59.8% |
| Self-Employed (Incorporated) | 13 | 1.1% |
| Self-Employed (Not Incorporated) | 128 | 11.0% |
| Not-for-profit Organizations | 27 | 2.3% |
| Local Government Employees | 153 | 13.2% |
| State Government Employees | 114 | 9.8% |
| Federal Government Employees | 31 | 2.7% |
| Unpaid Family Workers | 0 | 0.0% |
| Total | 1,159 | 100.0% |
Employment Status by Age in Wilson s Mills
According to the labor force statistics for Wilson s Mills, out of the total population over 16 years of age (1,831), 72.9% or 1,335 individuals are in the labor force, with 10.9% or 146 of them unemployed. The age group with the highest labor force participation rate is 30 to 34 years, with 99.1% or 323 individuals in the labor force. Within the labor force, the 16 to 19 years age range has the highest percentage of unemployed individuals, with 73.9% or 116 of them being unemployed.
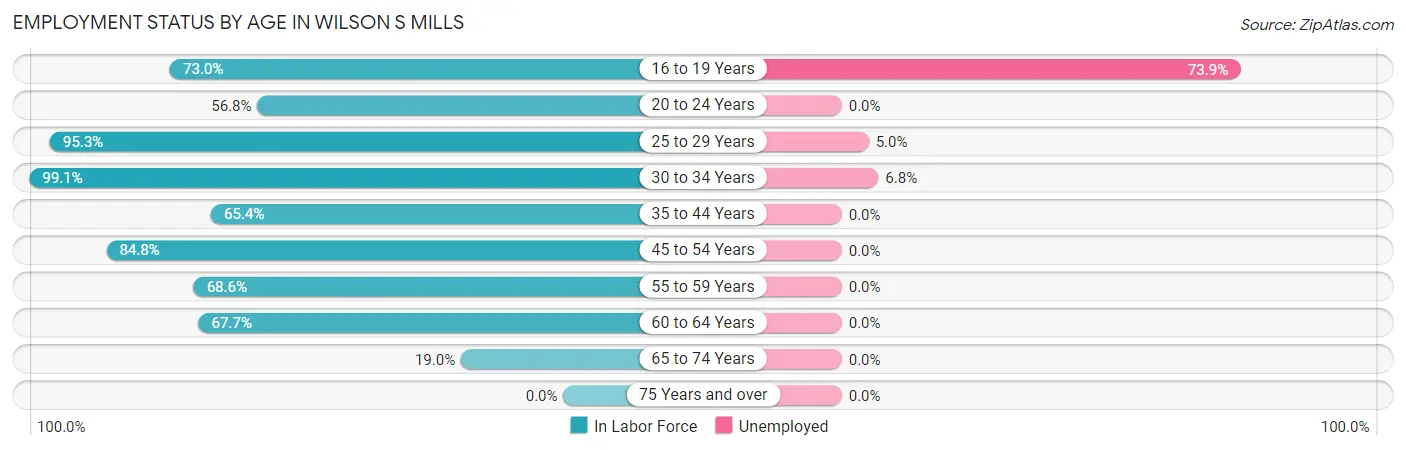
| Age Bracket | In Labor Force | Unemployed |
| 16 to 19 Years | 157 (73.0%) | 116 (73.9%) |
| 20 to 24 Years | 130 (56.8%) | 0 (0.0%) |
| 25 to 29 Years | 141 (95.3%) | 7 (5.0%) |
| 30 to 34 Years | 323 (99.1%) | 22 (6.8%) |
| 35 to 44 Years | 223 (65.4%) | 0 (0.0%) |
| 45 to 54 Years | 228 (84.8%) | 0 (0.0%) |
| 55 to 59 Years | 70 (68.6%) | 0 (0.0%) |
| 60 to 64 Years | 42 (67.7%) | 0 (0.0%) |
| 65 to 74 Years | 20 (19.0%) | 0 (0.0%) |
| 75 Years and over | 0 (0.0%) | 0 (0.0%) |
| Total | 1,335 (72.9%) | 146 (10.9%) |
Employment Status by Educational Attainment in Wilson s Mills
According to labor force statistics for Wilson s Mills, 82.3% of individuals (1,027) out of the total population between 25 and 64 years of age (1,248) are in the labor force, with 2.8% or 29 of them being unemployed. The group with the highest labor force participation rate are those with the educational attainment of bachelor's degree or higher, with 88.5% or 154 individuals in the labor force. Within the labor force, individuals with bachelor's degree or higher education have the highest percentage of unemployment, with 8.4% or 13 of them being unemployed.
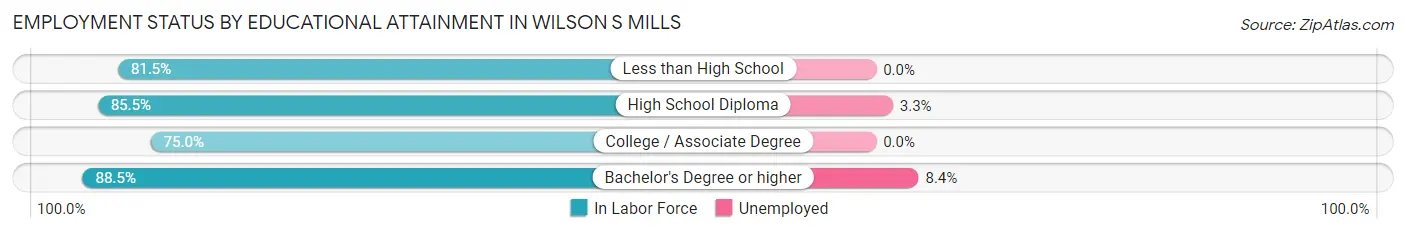
| Educational Attainment | In Labor Force | Unemployed |
| Less than High School | 106 (81.5%) | 0 (0.0%) |
| High School Diploma | 482 (85.5%) | 19 (3.3%) |
| College / Associate Degree | 285 (75.0%) | 0 (0.0%) |
| Bachelor's Degree or higher | 154 (88.5%) | 15 (8.4%) |
| Total | 1,027 (82.3%) | 35 (2.8%) |
Employment Occupations by Sex in Wilson s Mills
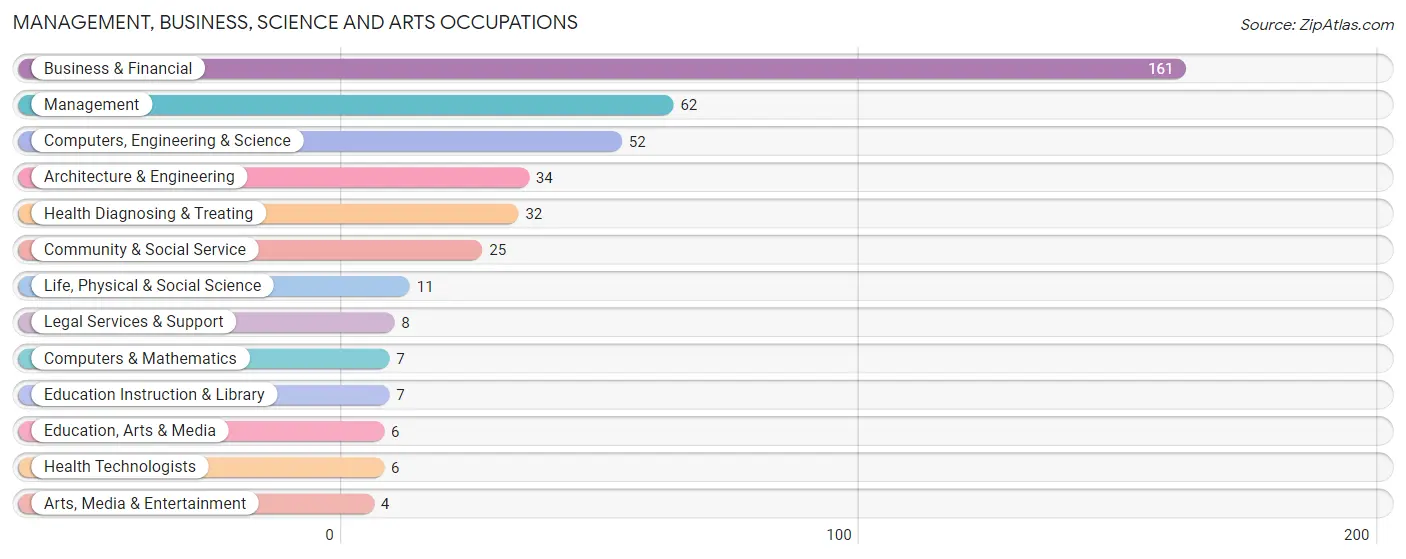
Management, Business, Science and Arts Occupations
The most common Management, Business, Science and Arts occupations in Wilson s Mills are Business & Financial (161 | 13.5%), Management (62 | 5.2%), Computers, Engineering & Science (52 | 4.4%), Architecture & Engineering (34 | 2.9%), and Health Diagnosing & Treating (32 | 2.7%).
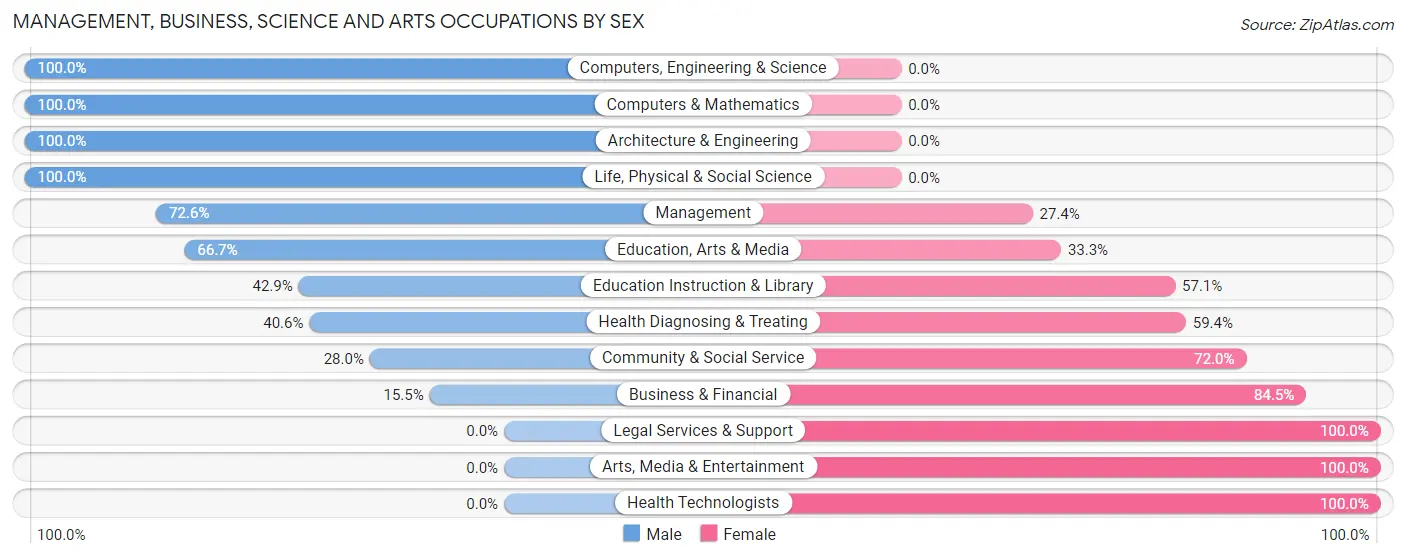
Management, Business, Science and Arts Occupations by Sex
Within the Management, Business, Science and Arts occupations in Wilson s Mills, the most male-oriented occupations are Computers, Engineering & Science (100.0%), Computers & Mathematics (100.0%), and Architecture & Engineering (100.0%), while the most female-oriented occupations are Legal Services & Support (100.0%), Arts, Media & Entertainment (100.0%), and Health Technologists (100.0%).
| Occupation | Male | Female |
| Management | 45 (72.6%) | 17 (27.4%) |
| Business & Financial | 25 (15.5%) | 136 (84.5%) |
| Computers, Engineering & Science | 52 (100.0%) | 0 (0.0%) |
| Computers & Mathematics | 7 (100.0%) | 0 (0.0%) |
| Architecture & Engineering | 34 (100.0%) | 0 (0.0%) |
| Life, Physical & Social Science | 11 (100.0%) | 0 (0.0%) |
| Community & Social Service | 7 (28.0%) | 18 (72.0%) |
| Education, Arts & Media | 4 (66.7%) | 2 (33.3%) |
| Legal Services & Support | 0 (0.0%) | 8 (100.0%) |
| Education Instruction & Library | 3 (42.9%) | 4 (57.1%) |
| Arts, Media & Entertainment | 0 (0.0%) | 4 (100.0%) |
| Health Diagnosing & Treating | 13 (40.6%) | 19 (59.4%) |
| Health Technologists | 0 (0.0%) | 6 (100.0%) |
| Total (Category) | 142 (42.8%) | 190 (57.2%) |
| Total (Overall) | 692 (58.2%) | 497 (41.8%) |
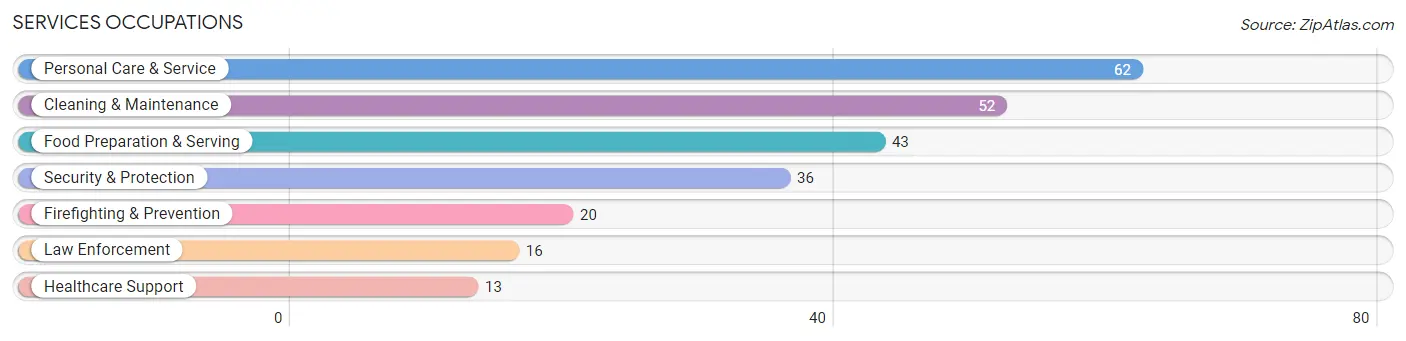
Services Occupations
The most common Services occupations in Wilson s Mills are Personal Care & Service (62 | 5.2%), Cleaning & Maintenance (52 | 4.4%), Food Preparation & Serving (43 | 3.6%), Security & Protection (36 | 3.0%), and Firefighting & Prevention (20 | 1.7%).
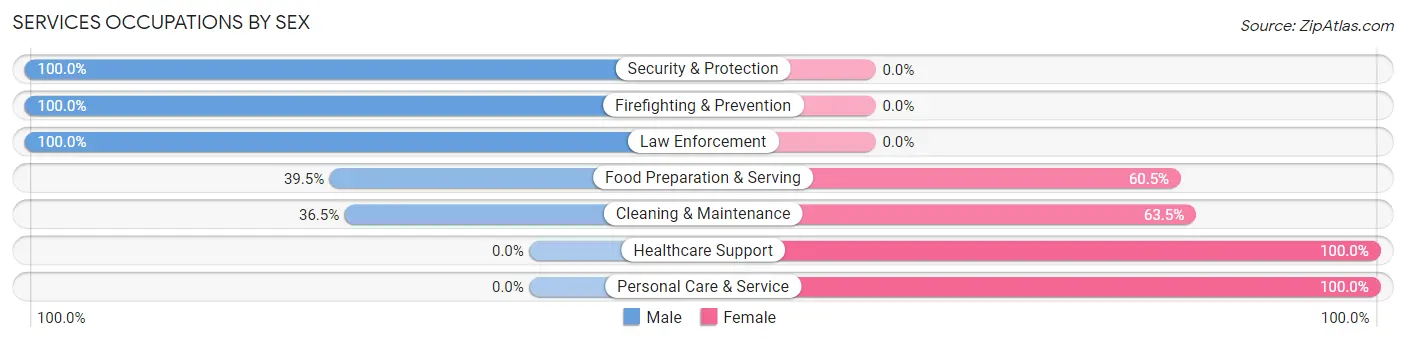
Services Occupations by Sex
Within the Services occupations in Wilson s Mills, the most male-oriented occupations are Security & Protection (100.0%), Firefighting & Prevention (100.0%), and Law Enforcement (100.0%), while the most female-oriented occupations are Healthcare Support (100.0%), Personal Care & Service (100.0%), and Cleaning & Maintenance (63.5%).
| Occupation | Male | Female |
| Healthcare Support | 0 (0.0%) | 13 (100.0%) |
| Security & Protection | 36 (100.0%) | 0 (0.0%) |
| Firefighting & Prevention | 20 (100.0%) | 0 (0.0%) |
| Law Enforcement | 16 (100.0%) | 0 (0.0%) |
| Food Preparation & Serving | 17 (39.5%) | 26 (60.5%) |
| Cleaning & Maintenance | 19 (36.5%) | 33 (63.5%) |
| Personal Care & Service | 0 (0.0%) | 62 (100.0%) |
| Total (Category) | 72 (34.9%) | 134 (65.0%) |
| Total (Overall) | 692 (58.2%) | 497 (41.8%) |
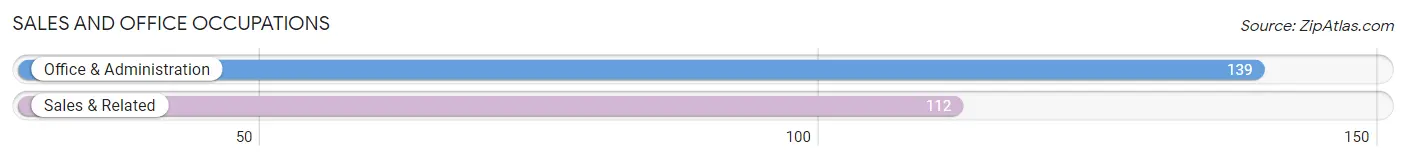
Sales and Office Occupations
The most common Sales and Office occupations in Wilson s Mills are Office & Administration (139 | 11.7%), and Sales & Related (112 | 9.4%).
Sales and Office Occupations by Sex
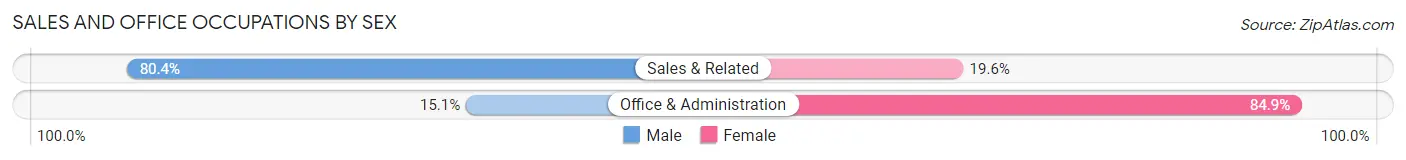
| Occupation | Male | Female |
| Sales & Related | 90 (80.4%) | 22 (19.6%) |
| Office & Administration | 21 (15.1%) | 118 (84.9%) |
| Total (Category) | 111 (44.2%) | 140 (55.8%) |
| Total (Overall) | 692 (58.2%) | 497 (41.8%) |
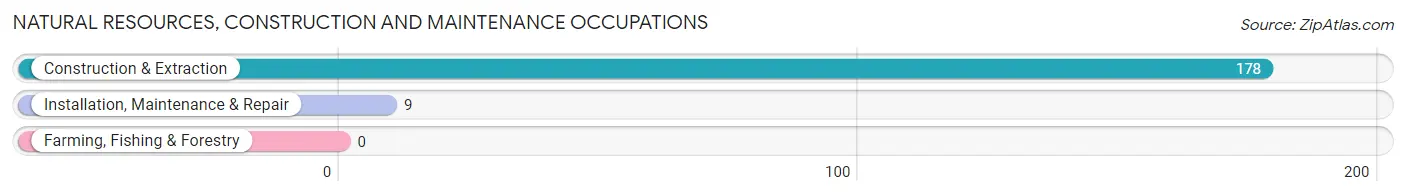
Natural Resources, Construction and Maintenance Occupations
The most common Natural Resources, Construction and Maintenance occupations in Wilson s Mills are Construction & Extraction (178 | 15.0%), and Installation, Maintenance & Repair (9 | 0.8%).
Natural Resources, Construction and Maintenance Occupations by Sex
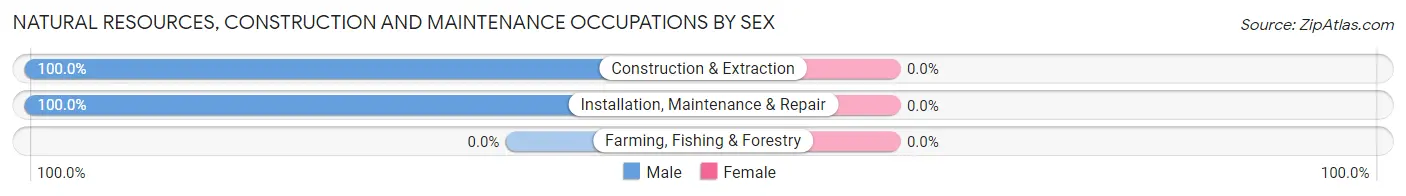
| Occupation | Male | Female |
| Farming, Fishing & Forestry | 0 (0.0%) | 0 (0.0%) |
| Construction & Extraction | 178 (100.0%) | 0 (0.0%) |
| Installation, Maintenance & Repair | 9 (100.0%) | 0 (0.0%) |
| Total (Category) | 187 (100.0%) | 0 (0.0%) |
| Total (Overall) | 692 (58.2%) | 497 (41.8%) |
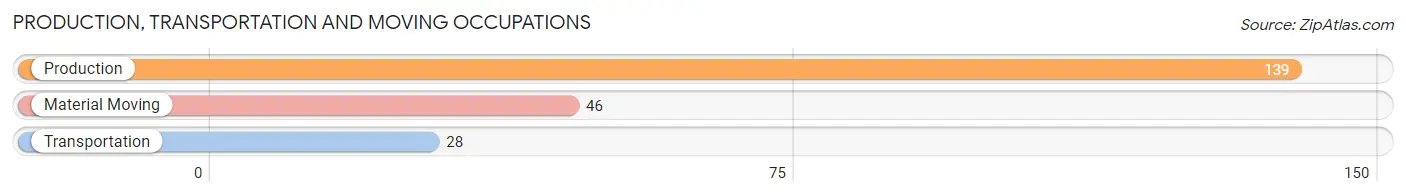
Production, Transportation and Moving Occupations
The most common Production, Transportation and Moving occupations in Wilson s Mills are Production (139 | 11.7%), Material Moving (46 | 3.9%), and Transportation (28 | 2.4%).
Production, Transportation and Moving Occupations by Sex
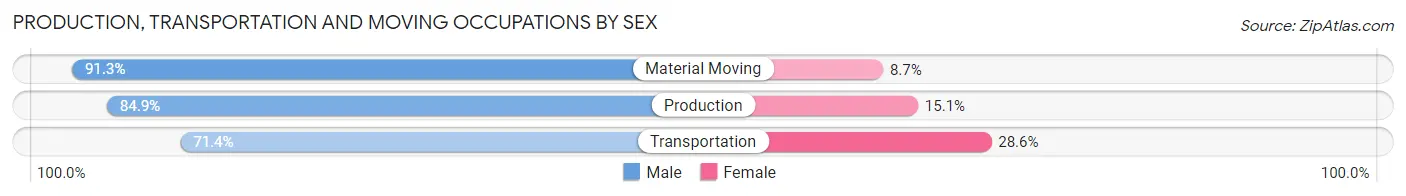
| Occupation | Male | Female |
| Production | 118 (84.9%) | 21 (15.1%) |
| Transportation | 20 (71.4%) | 8 (28.6%) |
| Material Moving | 42 (91.3%) | 4 (8.7%) |
| Total (Category) | 180 (84.5%) | 33 (15.5%) |
| Total (Overall) | 692 (58.2%) | 497 (41.8%) |
Employment Industries by Sex in Wilson s Mills
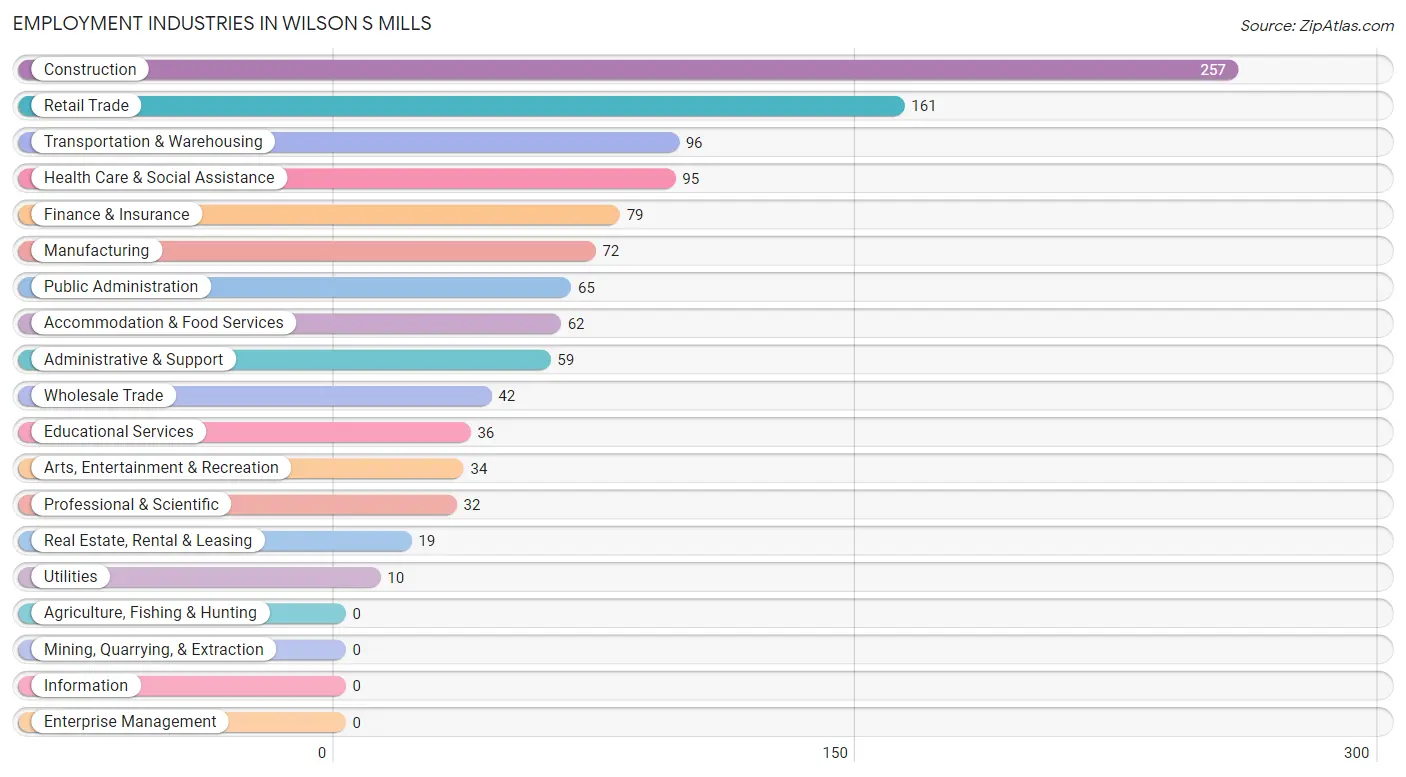
Employment Industries in Wilson s Mills
The major employment industries in Wilson s Mills include Construction (257 | 21.6%), Retail Trade (161 | 13.5%), Transportation & Warehousing (96 | 8.1%), Health Care & Social Assistance (95 | 8.0%), and Finance & Insurance (79 | 6.6%).
Employment Industries by Sex in Wilson s Mills
The Wilson s Mills industries that see more men than women are Wholesale Trade (100.0%), Administrative & Support (94.9%), and Construction (88.3%), whereas the industries that tend to have a higher number of women are Health Care & Social Assistance (88.4%), Transportation & Warehousing (77.1%), and Finance & Insurance (75.9%).
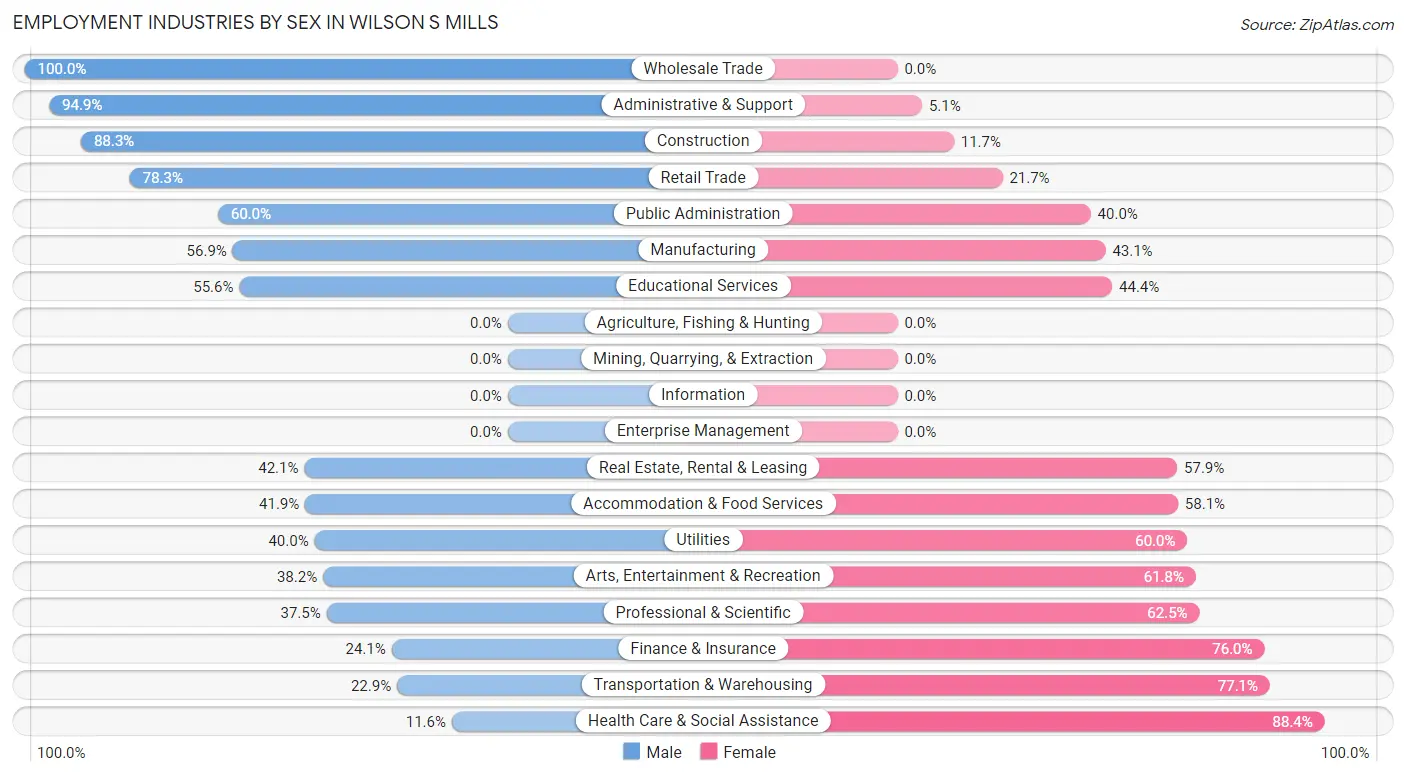
| Industry | Male | Female |
| Agriculture, Fishing & Hunting | 0 (0.0%) | 0 (0.0%) |
| Mining, Quarrying, & Extraction | 0 (0.0%) | 0 (0.0%) |
| Construction | 227 (88.3%) | 30 (11.7%) |
| Manufacturing | 41 (56.9%) | 31 (43.1%) |
| Wholesale Trade | 42 (100.0%) | 0 (0.0%) |
| Retail Trade | 126 (78.3%) | 35 (21.7%) |
| Transportation & Warehousing | 22 (22.9%) | 74 (77.1%) |
| Utilities | 4 (40.0%) | 6 (60.0%) |
| Information | 0 (0.0%) | 0 (0.0%) |
| Finance & Insurance | 19 (24.0%) | 60 (75.9%) |
| Real Estate, Rental & Leasing | 8 (42.1%) | 11 (57.9%) |
| Professional & Scientific | 12 (37.5%) | 20 (62.5%) |
| Enterprise Management | 0 (0.0%) | 0 (0.0%) |
| Administrative & Support | 56 (94.9%) | 3 (5.1%) |
| Educational Services | 20 (55.6%) | 16 (44.4%) |
| Health Care & Social Assistance | 11 (11.6%) | 84 (88.4%) |
| Arts, Entertainment & Recreation | 13 (38.2%) | 21 (61.8%) |
| Accommodation & Food Services | 26 (41.9%) | 36 (58.1%) |
| Public Administration | 39 (60.0%) | 26 (40.0%) |
| Total | 692 (58.2%) | 497 (41.8%) |
Education in Wilson s Mills
School Enrollment in Wilson s Mills
The most common levels of schooling among the 723 students in Wilson s Mills are middle school (266 | 36.8%), high school (199 | 27.5%), and elementary school (132 | 18.3%).
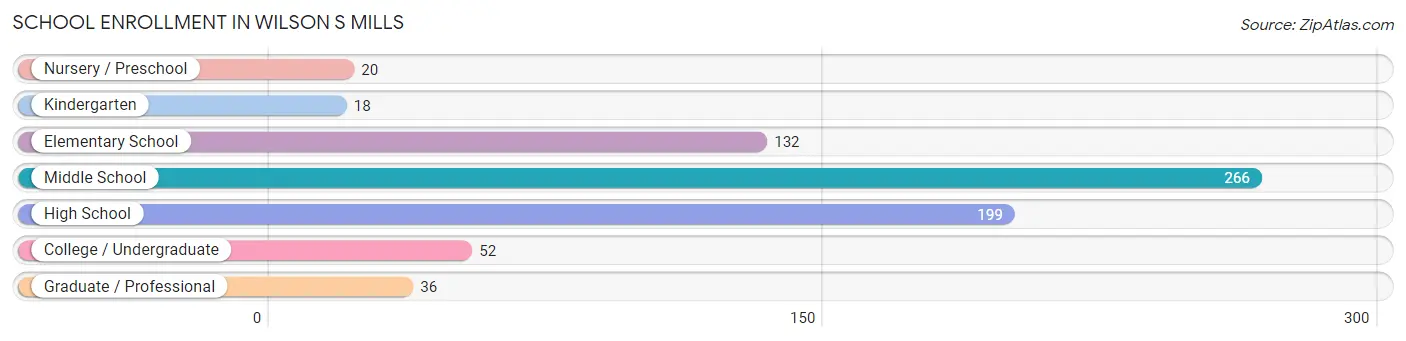
| School Level | # Students | % Students |
| Nursery / Preschool | 20 | 2.8% |
| Kindergarten | 18 | 2.5% |
| Elementary School | 132 | 18.3% |
| Middle School | 266 | 36.8% |
| High School | 199 | 27.5% |
| College / Undergraduate | 52 | 7.2% |
| Graduate / Professional | 36 | 5.0% |
| Total | 723 | 100.0% |
School Enrollment by Age by Funding Source in Wilson s Mills
Out of a total of 723 students who are enrolled in schools in Wilson s Mills, 63 (8.7%) attend a private institution, while the remaining 660 (91.3%) are enrolled in public schools. The age group of 3 to 4 year olds has the highest likelihood of being enrolled in private schools, with 20 (100.0% in the age bracket) enrolled. Conversely, the age group of 18 to 19 year olds has the lowest likelihood of being enrolled in a private school, with 20 (100.0% in the age bracket) attending a public institution.
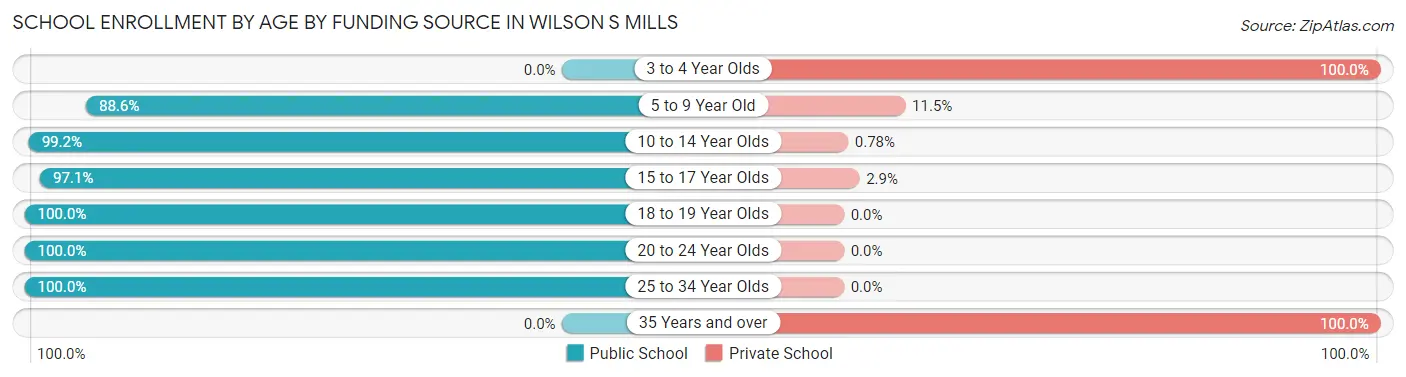
| Age Bracket | Public School | Private School |
| 3 to 4 Year Olds | 0 (0.0%) | 20 (100.0%) |
| 5 to 9 Year Old | 147 (88.5%) | 19 (11.5%) |
| 10 to 14 Year Olds | 254 (99.2%) | 2 (0.8%) |
| 15 to 17 Year Olds | 168 (97.1%) | 5 (2.9%) |
| 18 to 19 Year Olds | 20 (100.0%) | 0 (0.0%) |
| 20 to 24 Year Olds | 58 (100.0%) | 0 (0.0%) |
| 25 to 34 Year Olds | 13 (100.0%) | 0 (0.0%) |
| 35 Years and over | 0 (0.0%) | 17 (100.0%) |
| Total | 660 (91.3%) | 63 (8.7%) |
Educational Attainment by Field of Study in Wilson s Mills
Business (69 | 30.4%), social sciences (24 | 10.6%), visual & performing arts (24 | 10.6%), arts & humanities (22 | 9.7%), and science & technology (21 | 9.2%) are the most common fields of study among 227 individuals in Wilson s Mills who have obtained a bachelor's degree or higher.
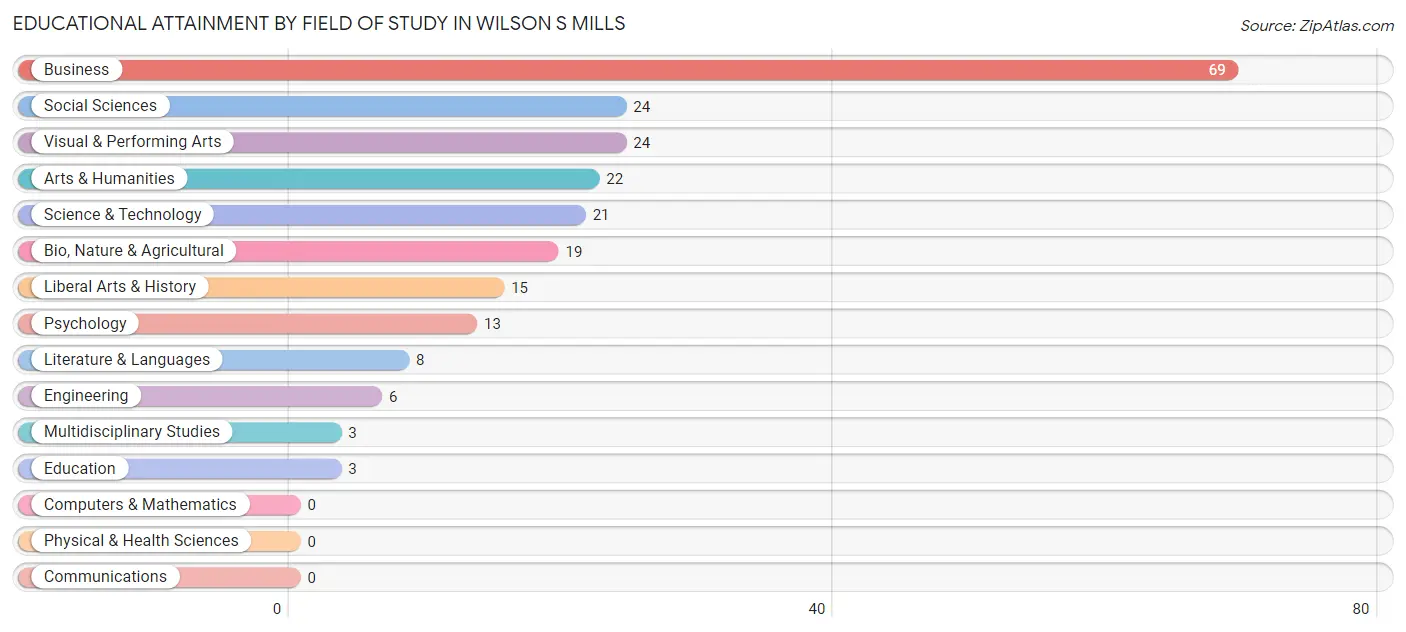
| Field of Study | # Graduates | % Graduates |
| Computers & Mathematics | 0 | 0.0% |
| Bio, Nature & Agricultural | 19 | 8.4% |
| Physical & Health Sciences | 0 | 0.0% |
| Psychology | 13 | 5.7% |
| Social Sciences | 24 | 10.6% |
| Engineering | 6 | 2.6% |
| Multidisciplinary Studies | 3 | 1.3% |
| Science & Technology | 21 | 9.2% |
| Business | 69 | 30.4% |
| Education | 3 | 1.3% |
| Literature & Languages | 8 | 3.5% |
| Liberal Arts & History | 15 | 6.6% |
| Visual & Performing Arts | 24 | 10.6% |
| Communications | 0 | 0.0% |
| Arts & Humanities | 22 | 9.7% |
| Total | 227 | 100.0% |
Transportation & Commute in Wilson s Mills
Vehicle Availability by Sex in Wilson s Mills
The most prevalent vehicle ownership categories in Wilson s Mills are males with 2 vehicles (305, accounting for 44.4%) and females with 2 vehicles (138, making up 64.6%).
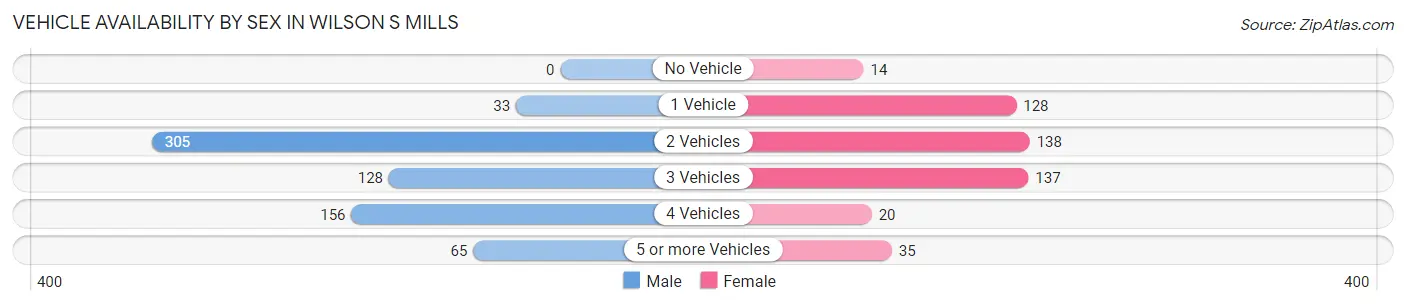
| Vehicles Available | Male | Female |
| No Vehicle | 0 (0.0%) | 14 (3.0%) |
| 1 Vehicle | 33 (4.8%) | 128 (27.1%) |
| 2 Vehicles | 305 (44.4%) | 138 (29.2%) |
| 3 Vehicles | 128 (18.6%) | 137 (29.0%) |
| 4 Vehicles | 156 (22.7%) | 20 (4.2%) |
| 5 or more Vehicles | 65 (9.5%) | 35 (7.4%) |
| Total | 687 (100.0%) | 472 (100.0%) |
Commute Time in Wilson s Mills
The most frequently occuring commute durations in Wilson s Mills are 45 to 59 minutes (279 commuters, 25.8%), 10 to 14 minutes (189 commuters, 17.5%), and 15 to 19 minutes (141 commuters, 13.0%).
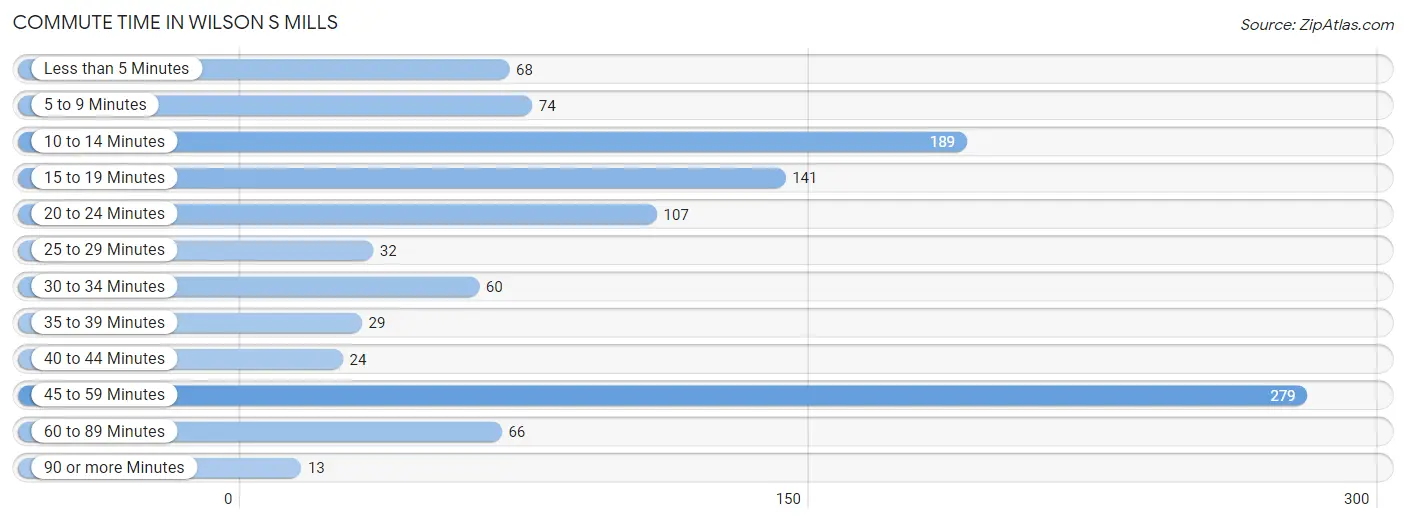
| Commute Time | # Commuters | % Commuters |
| Less than 5 Minutes | 68 | 6.3% |
| 5 to 9 Minutes | 74 | 6.8% |
| 10 to 14 Minutes | 189 | 17.5% |
| 15 to 19 Minutes | 141 | 13.0% |
| 20 to 24 Minutes | 107 | 9.9% |
| 25 to 29 Minutes | 32 | 3.0% |
| 30 to 34 Minutes | 60 | 5.6% |
| 35 to 39 Minutes | 29 | 2.7% |
| 40 to 44 Minutes | 24 | 2.2% |
| 45 to 59 Minutes | 279 | 25.8% |
| 60 to 89 Minutes | 66 | 6.1% |
| 90 or more Minutes | 13 | 1.2% |
Commute Time by Sex in Wilson s Mills
The most common commute times in Wilson s Mills are 45 to 59 minutes (140 commuters, 22.1%) for males and 45 to 59 minutes (139 commuters, 31.0%) for females.
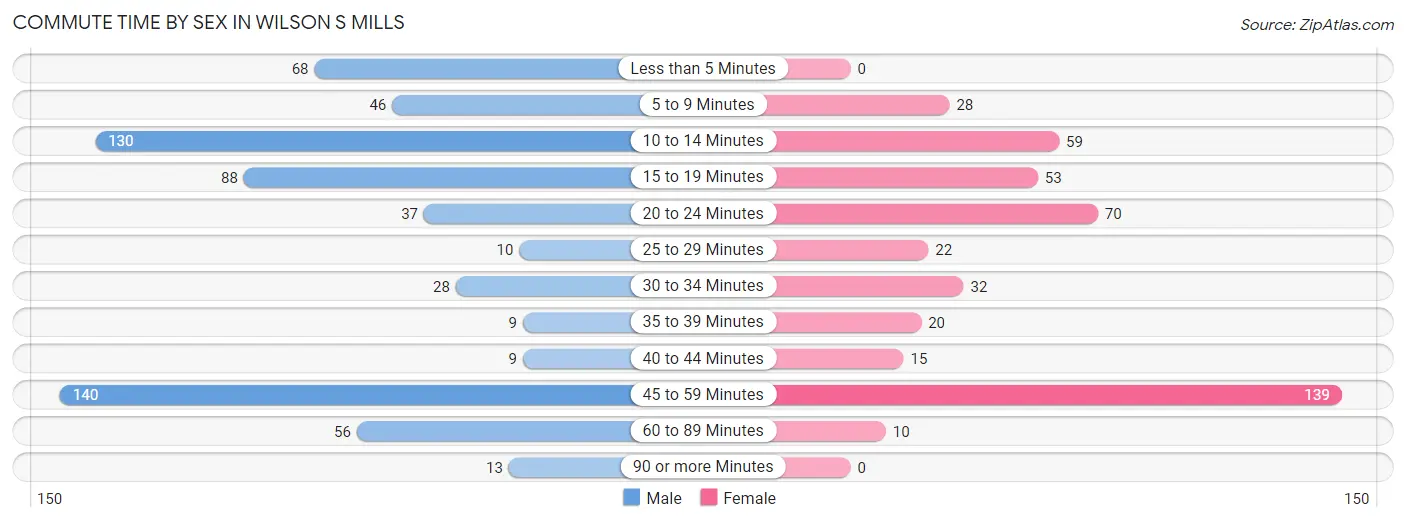
| Commute Time | Male | Female |
| Less than 5 Minutes | 68 (10.7%) | 0 (0.0%) |
| 5 to 9 Minutes | 46 (7.3%) | 28 (6.2%) |
| 10 to 14 Minutes | 130 (20.5%) | 59 (13.2%) |
| 15 to 19 Minutes | 88 (13.9%) | 53 (11.8%) |
| 20 to 24 Minutes | 37 (5.8%) | 70 (15.6%) |
| 25 to 29 Minutes | 10 (1.6%) | 22 (4.9%) |
| 30 to 34 Minutes | 28 (4.4%) | 32 (7.1%) |
| 35 to 39 Minutes | 9 (1.4%) | 20 (4.5%) |
| 40 to 44 Minutes | 9 (1.4%) | 15 (3.4%) |
| 45 to 59 Minutes | 140 (22.1%) | 139 (31.0%) |
| 60 to 89 Minutes | 56 (8.8%) | 10 (2.2%) |
| 90 or more Minutes | 13 (2.1%) | 0 (0.0%) |
Time of Departure to Work by Sex in Wilson s Mills
The most frequent times of departure to work in Wilson s Mills are 7:00 AM to 7:29 AM (127, 20.0%) for males and 6:30 AM to 6:59 AM (122, 27.2%) for females.
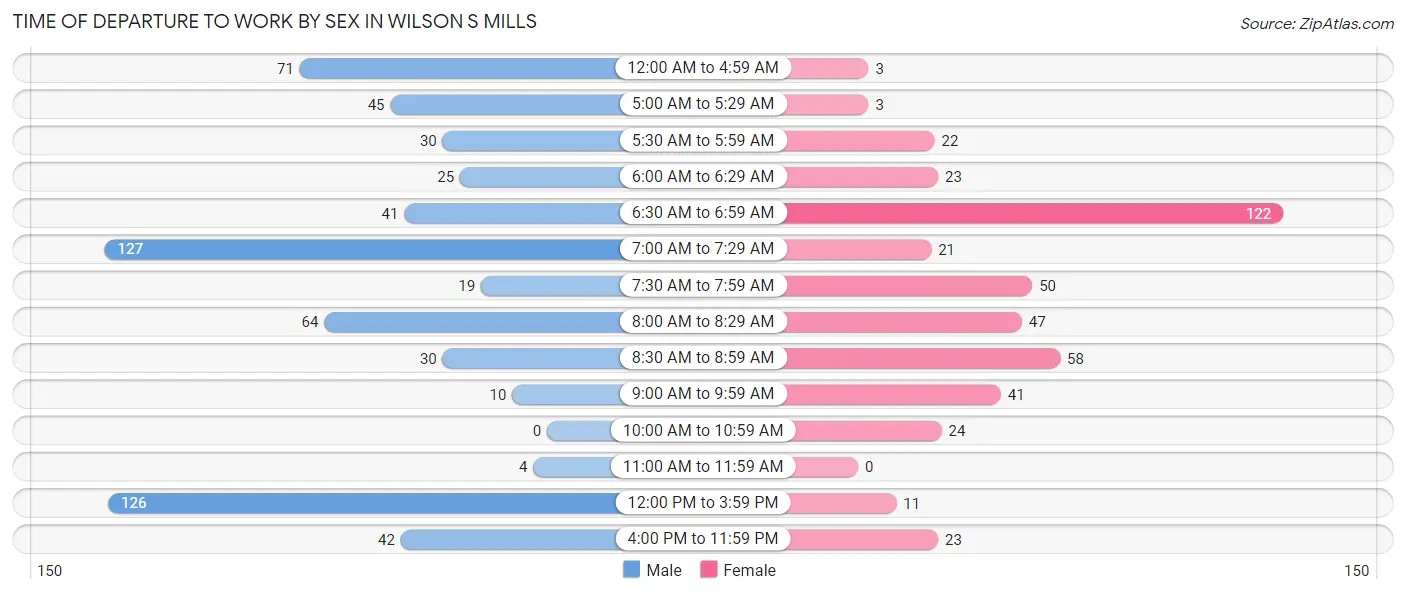
| Time of Departure | Male | Female |
| 12:00 AM to 4:59 AM | 71 (11.2%) | 3 (0.7%) |
| 5:00 AM to 5:29 AM | 45 (7.1%) | 3 (0.7%) |
| 5:30 AM to 5:59 AM | 30 (4.7%) | 22 (4.9%) |
| 6:00 AM to 6:29 AM | 25 (3.9%) | 23 (5.1%) |
| 6:30 AM to 6:59 AM | 41 (6.5%) | 122 (27.2%) |
| 7:00 AM to 7:29 AM | 127 (20.0%) | 21 (4.7%) |
| 7:30 AM to 7:59 AM | 19 (3.0%) | 50 (11.2%) |
| 8:00 AM to 8:29 AM | 64 (10.1%) | 47 (10.5%) |
| 8:30 AM to 8:59 AM | 30 (4.7%) | 58 (13.0%) |
| 9:00 AM to 9:59 AM | 10 (1.6%) | 41 (9.1%) |
| 10:00 AM to 10:59 AM | 0 (0.0%) | 24 (5.4%) |
| 11:00 AM to 11:59 AM | 4 (0.6%) | 0 (0.0%) |
| 12:00 PM to 3:59 PM | 126 (19.9%) | 11 (2.5%) |
| 4:00 PM to 11:59 PM | 42 (6.6%) | 23 (5.1%) |
| Total | 634 (100.0%) | 448 (100.0%) |
Housing Occupancy in Wilson s Mills
Occupancy by Ownership in Wilson s Mills
Of the total 760 dwellings in Wilson s Mills, owner-occupied units account for 640 (84.2%), while renter-occupied units make up 120 (15.8%).
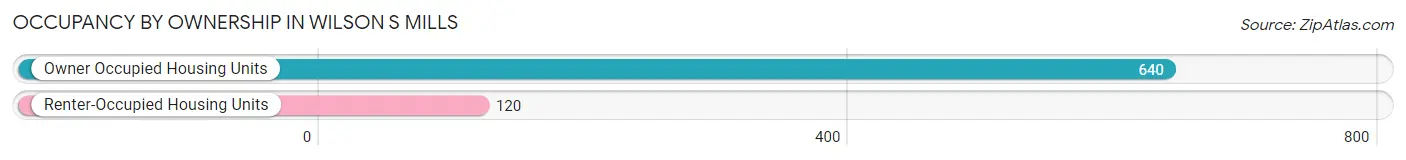
| Occupancy | # Housing Units | % Housing Units |
| Owner Occupied Housing Units | 640 | 84.2% |
| Renter-Occupied Housing Units | 120 | 15.8% |
| Total Occupied Housing Units | 760 | 100.0% |
Occupancy by Household Size in Wilson s Mills
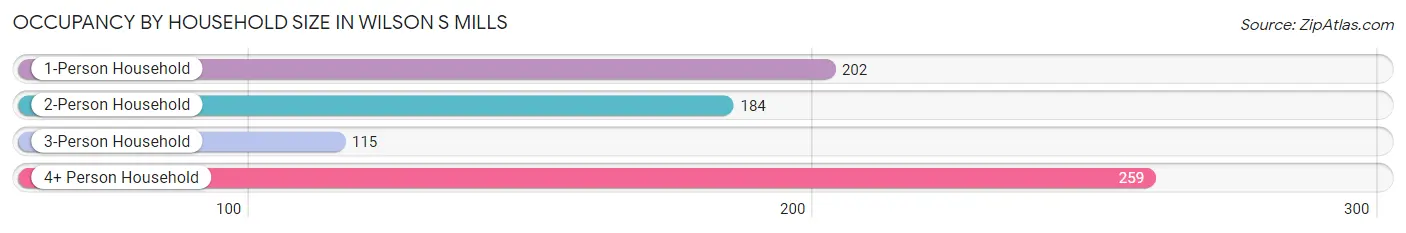
| Household Size | # Housing Units | % Housing Units |
| 1-Person Household | 202 | 26.6% |
| 2-Person Household | 184 | 24.2% |
| 3-Person Household | 115 | 15.1% |
| 4+ Person Household | 259 | 34.1% |
| Total Housing Units | 760 | 100.0% |
Occupancy by Ownership by Household Size in Wilson s Mills
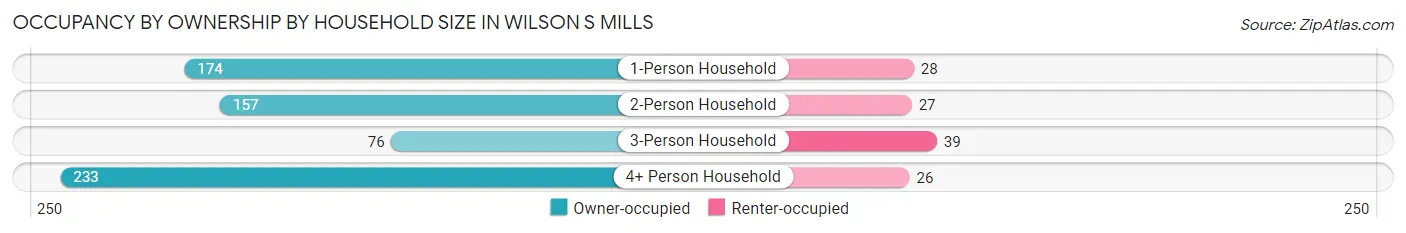
| Household Size | Owner-occupied | Renter-occupied |
| 1-Person Household | 174 (86.1%) | 28 (13.9%) |
| 2-Person Household | 157 (85.3%) | 27 (14.7%) |
| 3-Person Household | 76 (66.1%) | 39 (33.9%) |
| 4+ Person Household | 233 (90.0%) | 26 (10.0%) |
| Total Housing Units | 640 (84.2%) | 120 (15.8%) |
Occupancy by Educational Attainment in Wilson s Mills
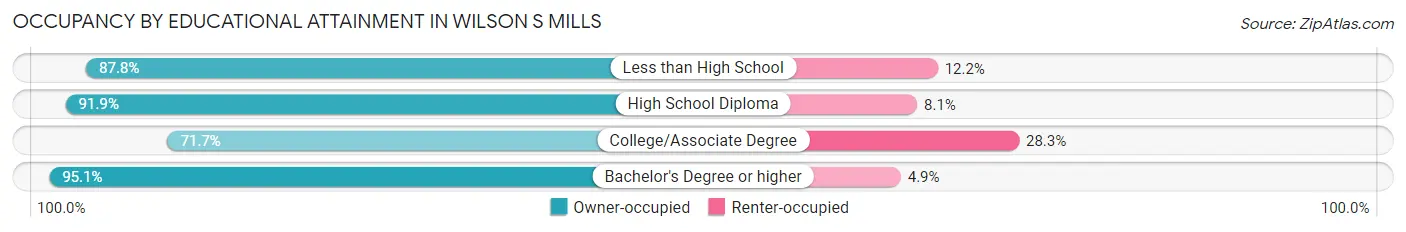
| Household Size | Owner-occupied | Renter-occupied |
| Less than High School | 36 (87.8%) | 5 (12.2%) |
| High School Diploma | 272 (91.9%) | 24 (8.1%) |
| College/Associate Degree | 215 (71.7%) | 85 (28.3%) |
| Bachelor's Degree or higher | 117 (95.1%) | 6 (4.9%) |
Occupancy by Age of Householder in Wilson s Mills
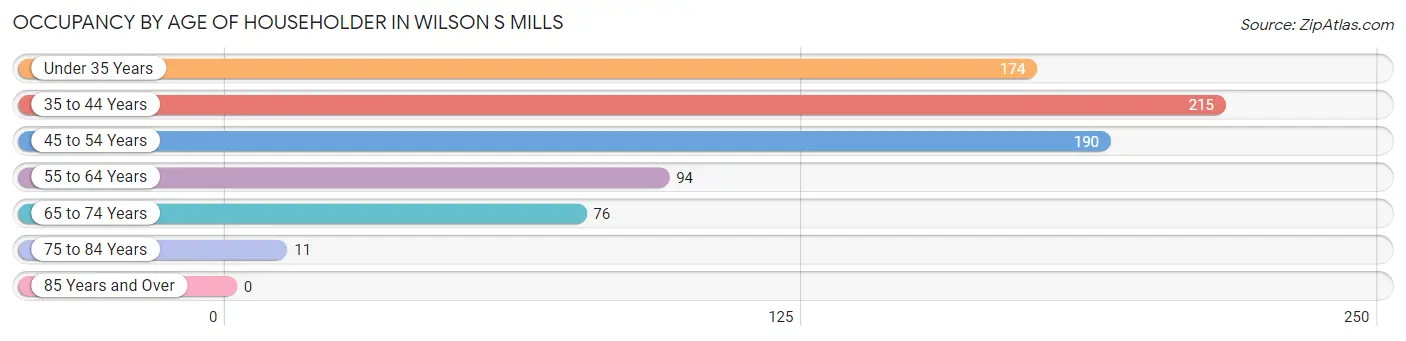
| Age Bracket | # Households | % Households |
| Under 35 Years | 174 | 22.9% |
| 35 to 44 Years | 215 | 28.3% |
| 45 to 54 Years | 190 | 25.0% |
| 55 to 64 Years | 94 | 12.4% |
| 65 to 74 Years | 76 | 10.0% |
| 75 to 84 Years | 11 | 1.5% |
| 85 Years and Over | 0 | 0.0% |
| Total | 760 | 100.0% |
Housing Finances in Wilson s Mills
Median Income by Occupancy in Wilson s Mills
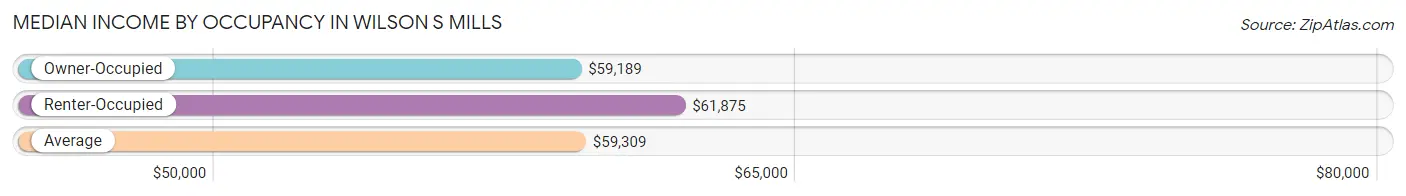
| Occupancy Type | # Households | Median Income |
| Owner-Occupied | 640 (84.2%) | $59,189 |
| Renter-Occupied | 120 (15.8%) | $61,875 |
| Average | 760 (100.0%) | $59,309 |
Occupancy by Householder Income Bracket in Wilson s Mills
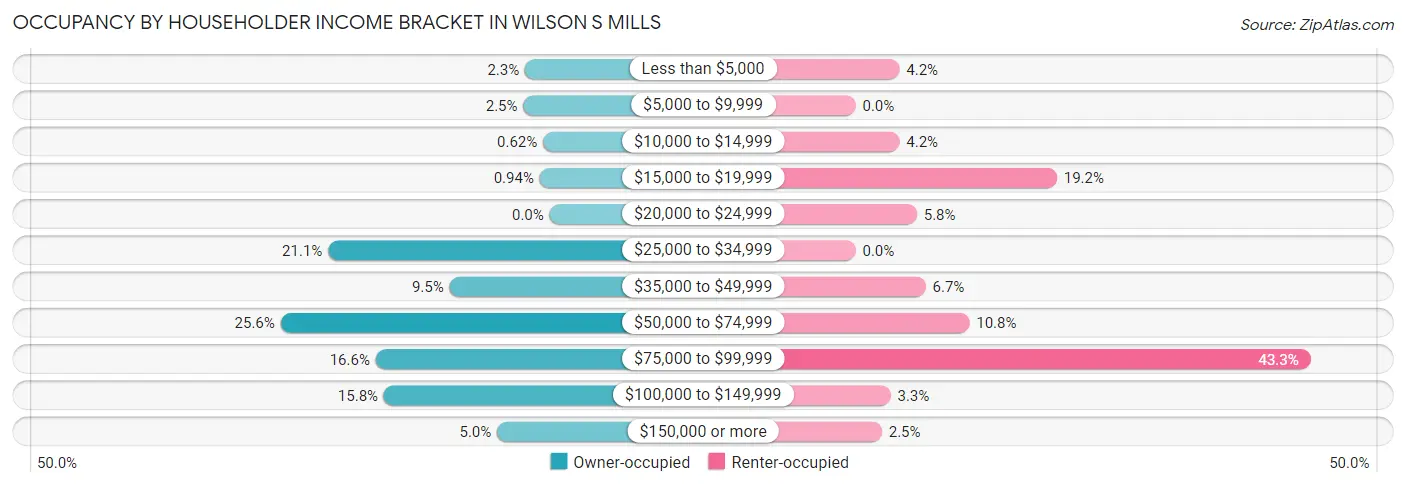
| Income Bracket | Owner-occupied | Renter-occupied |
| Less than $5,000 | 15 (2.3%) | 5 (4.2%) |
| $5,000 to $9,999 | 16 (2.5%) | 0 (0.0%) |
| $10,000 to $14,999 | 4 (0.6%) | 5 (4.2%) |
| $15,000 to $19,999 | 6 (0.9%) | 23 (19.2%) |
| $20,000 to $24,999 | 0 (0.0%) | 7 (5.8%) |
| $25,000 to $34,999 | 135 (21.1%) | 0 (0.0%) |
| $35,000 to $49,999 | 61 (9.5%) | 8 (6.7%) |
| $50,000 to $74,999 | 164 (25.6%) | 13 (10.8%) |
| $75,000 to $99,999 | 106 (16.6%) | 52 (43.3%) |
| $100,000 to $149,999 | 101 (15.8%) | 4 (3.3%) |
| $150,000 or more | 32 (5.0%) | 3 (2.5%) |
| Total | 640 (100.0%) | 120 (100.0%) |
Monthly Housing Cost Tiers in Wilson s Mills

| Monthly Cost | Owner-occupied | Renter-occupied |
| Less than $300 | 10 (1.6%) | 0 (0.0%) |
| $300 to $499 | 59 (9.2%) | 0 (0.0%) |
| $500 to $799 | 39 (6.1%) | 21 (17.5%) |
| $800 to $999 | 83 (13.0%) | 46 (38.3%) |
| $1,000 to $1,499 | 294 (45.9%) | 33 (27.5%) |
| $1,500 to $1,999 | 117 (18.3%) | 12 (10.0%) |
| $2,000 to $2,499 | 10 (1.6%) | 0 (0.0%) |
| $2,500 to $2,999 | 17 (2.7%) | 0 (0.0%) |
| $3,000 or more | 11 (1.7%) | 0 (0.0%) |
| Total | 640 (100.0%) | 120 (100.0%) |
Physical Housing Characteristics in Wilson s Mills
Housing Structures in Wilson s Mills
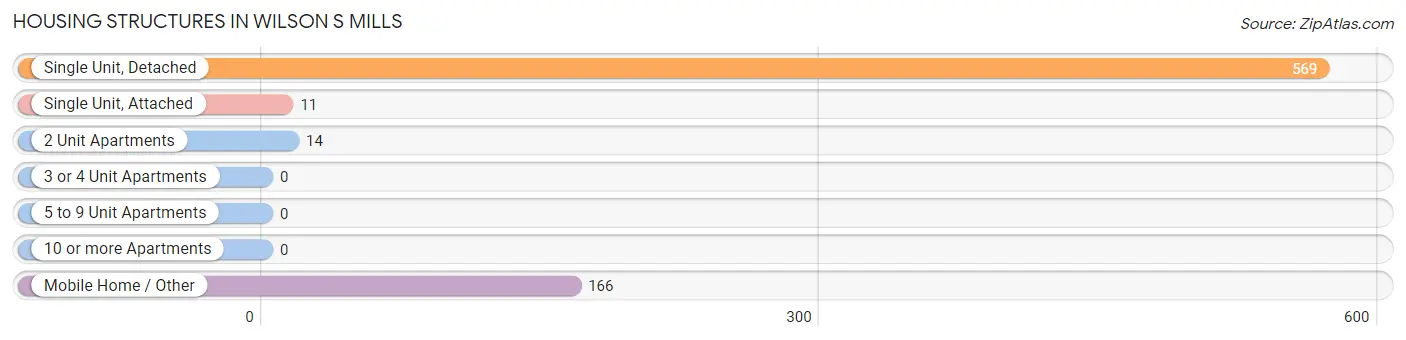
| Structure Type | # Housing Units | % Housing Units |
| Single Unit, Detached | 569 | 74.9% |
| Single Unit, Attached | 11 | 1.5% |
| 2 Unit Apartments | 14 | 1.8% |
| 3 or 4 Unit Apartments | 0 | 0.0% |
| 5 to 9 Unit Apartments | 0 | 0.0% |
| 10 or more Apartments | 0 | 0.0% |
| Mobile Home / Other | 166 | 21.8% |
| Total | 760 | 100.0% |
Housing Structures by Occupancy in Wilson s Mills
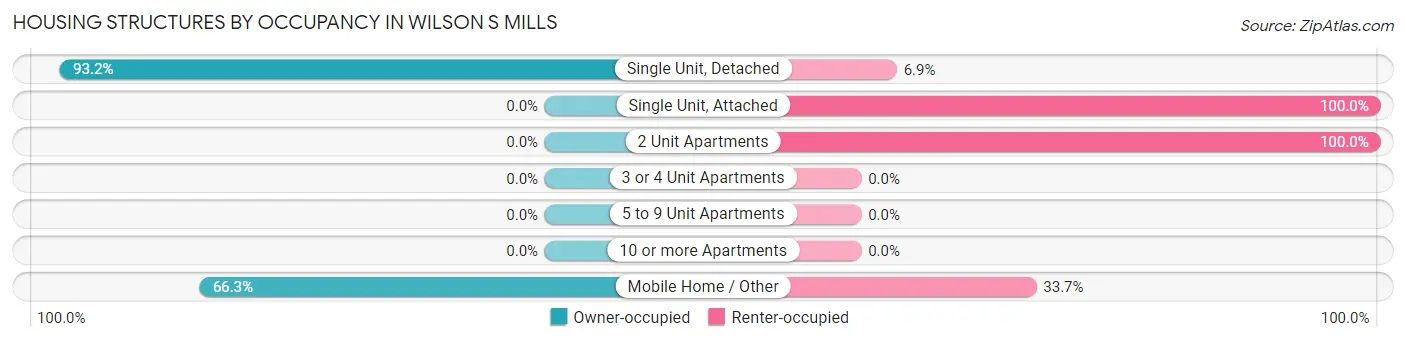
| Structure Type | Owner-occupied | Renter-occupied |
| Single Unit, Detached | 530 (93.1%) | 39 (6.9%) |
| Single Unit, Attached | 0 (0.0%) | 11 (100.0%) |
| 2 Unit Apartments | 0 (0.0%) | 14 (100.0%) |
| 3 or 4 Unit Apartments | 0 (0.0%) | 0 (0.0%) |
| 5 to 9 Unit Apartments | 0 (0.0%) | 0 (0.0%) |
| 10 or more Apartments | 0 (0.0%) | 0 (0.0%) |
| Mobile Home / Other | 110 (66.3%) | 56 (33.7%) |
| Total | 640 (84.2%) | 120 (15.8%) |
Housing Structures by Number of Rooms in Wilson s Mills
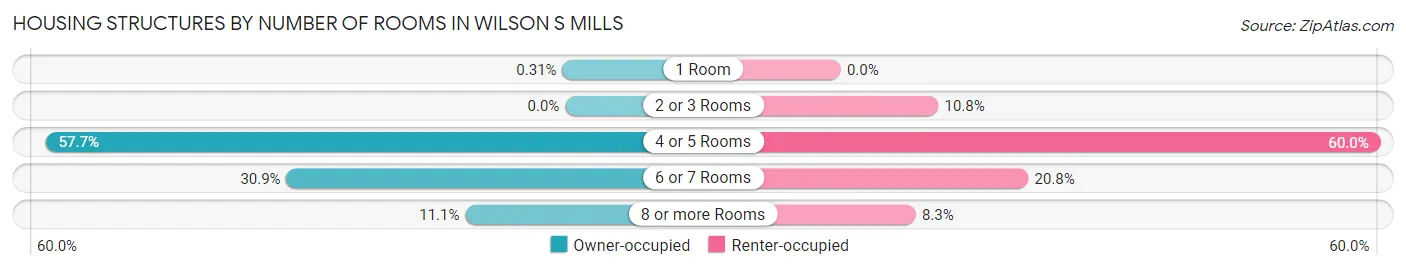
| Number of Rooms | Owner-occupied | Renter-occupied |
| 1 Room | 2 (0.3%) | 0 (0.0%) |
| 2 or 3 Rooms | 0 (0.0%) | 13 (10.8%) |
| 4 or 5 Rooms | 369 (57.7%) | 72 (60.0%) |
| 6 or 7 Rooms | 198 (30.9%) | 25 (20.8%) |
| 8 or more Rooms | 71 (11.1%) | 10 (8.3%) |
| Total | 640 (100.0%) | 120 (100.0%) |
Housing Structure by Heating Type in Wilson s Mills
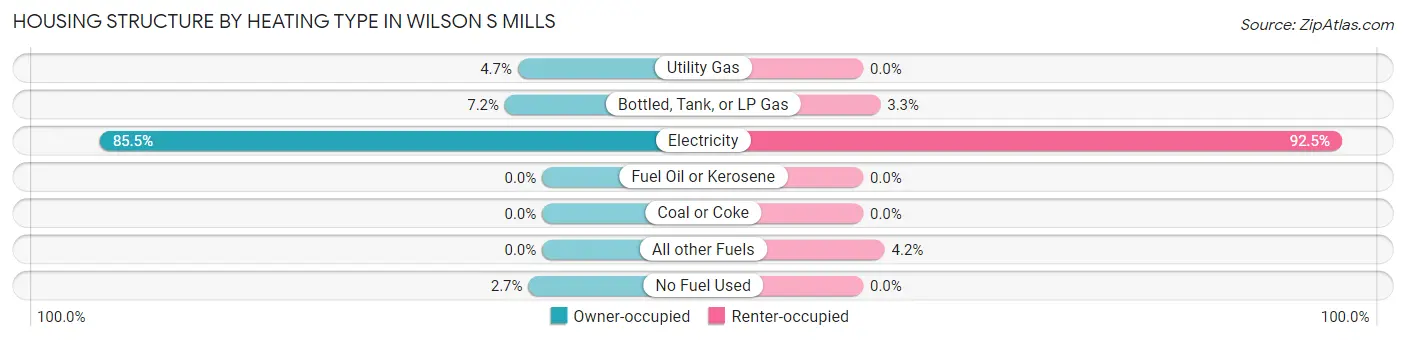
| Heating Type | Owner-occupied | Renter-occupied |
| Utility Gas | 30 (4.7%) | 0 (0.0%) |
| Bottled, Tank, or LP Gas | 46 (7.2%) | 4 (3.3%) |
| Electricity | 547 (85.5%) | 111 (92.5%) |
| Fuel Oil or Kerosene | 0 (0.0%) | 0 (0.0%) |
| Coal or Coke | 0 (0.0%) | 0 (0.0%) |
| All other Fuels | 0 (0.0%) | 5 (4.2%) |
| No Fuel Used | 17 (2.7%) | 0 (0.0%) |
| Total | 640 (100.0%) | 120 (100.0%) |
Household Vehicle Usage in Wilson s Mills
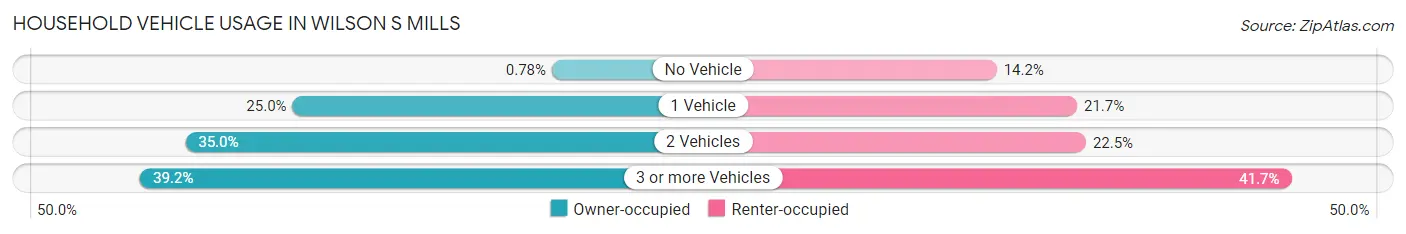
| Vehicles per Household | Owner-occupied | Renter-occupied |
| No Vehicle | 5 (0.8%) | 17 (14.2%) |
| 1 Vehicle | 160 (25.0%) | 26 (21.7%) |
| 2 Vehicles | 224 (35.0%) | 27 (22.5%) |
| 3 or more Vehicles | 251 (39.2%) | 50 (41.7%) |
| Total | 640 (100.0%) | 120 (100.0%) |
Real Estate & Mortgages in Wilson s Mills
Real Estate and Mortgage Overview in Wilson s Mills
| Characteristic | Without Mortgage | With Mortgage |
| Housing Units | 146 | 494 |
| Median Property Value | $181,000 | $206,400 |
| Median Household Income | $36,875 | $27 |
| Monthly Housing Costs | $557 | $11 |
| Real Estate Taxes | $1,639 | $6 |
Property Value by Mortgage Status in Wilson s Mills
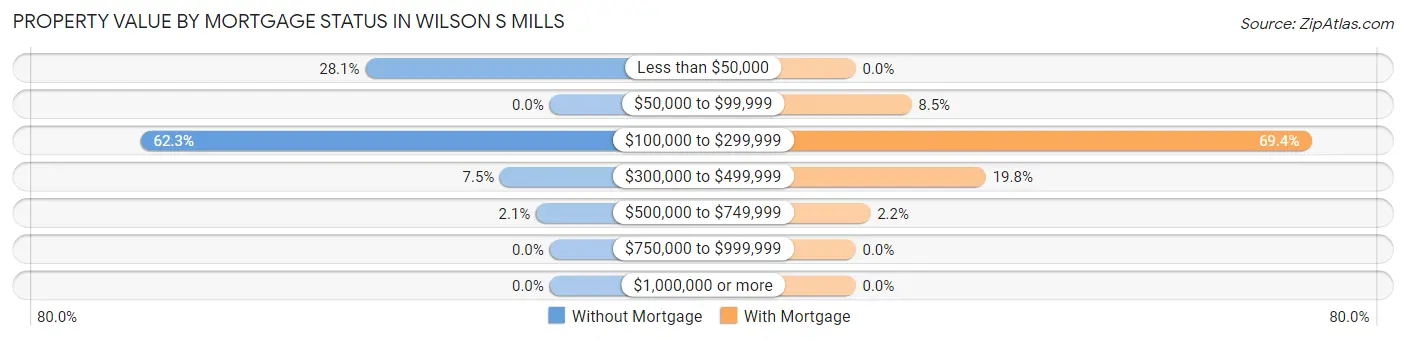
| Property Value | Without Mortgage | With Mortgage |
| Less than $50,000 | 41 (28.1%) | 0 (0.0%) |
| $50,000 to $99,999 | 0 (0.0%) | 42 (8.5%) |
| $100,000 to $299,999 | 91 (62.3%) | 343 (69.4%) |
| $300,000 to $499,999 | 11 (7.5%) | 98 (19.8%) |
| $500,000 to $749,999 | 3 (2.1%) | 11 (2.2%) |
| $750,000 to $999,999 | 0 (0.0%) | 0 (0.0%) |
| $1,000,000 or more | 0 (0.0%) | 0 (0.0%) |
| Total | 146 (100.0%) | 494 (100.0%) |
Household Income by Mortgage Status in Wilson s Mills
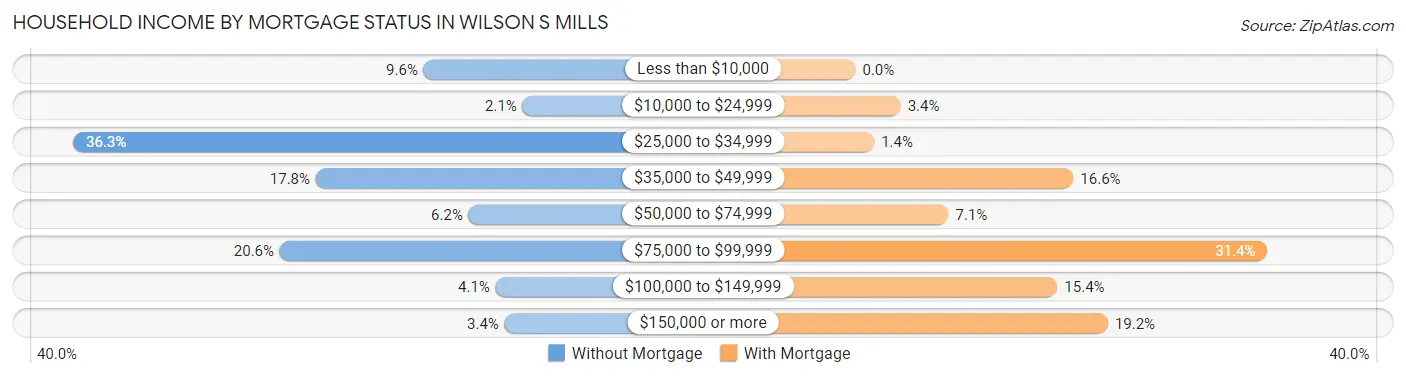
| Household Income | Without Mortgage | With Mortgage |
| Less than $10,000 | 14 (9.6%) | 0 (0.0%) |
| $10,000 to $24,999 | 3 (2.1%) | 17 (3.4%) |
| $25,000 to $34,999 | 53 (36.3%) | 7 (1.4%) |
| $35,000 to $49,999 | 26 (17.8%) | 82 (16.6%) |
| $50,000 to $74,999 | 9 (6.2%) | 35 (7.1%) |
| $75,000 to $99,999 | 30 (20.5%) | 155 (31.4%) |
| $100,000 to $149,999 | 6 (4.1%) | 76 (15.4%) |
| $150,000 or more | 5 (3.4%) | 95 (19.2%) |
| Total | 146 (100.0%) | 494 (100.0%) |
Property Value to Household Income Ratio in Wilson s Mills
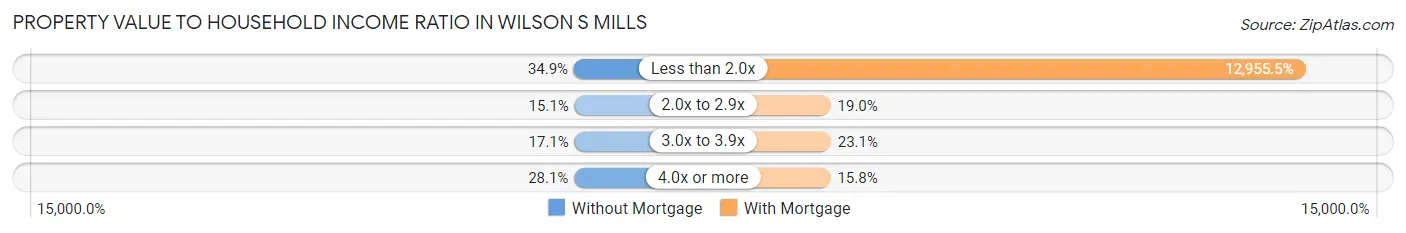
| Value-to-Income Ratio | Without Mortgage | With Mortgage |
| Less than 2.0x | 51 (34.9%) | 64,000 (12,955.5%) |
| 2.0x to 2.9x | 22 (15.1%) | 94 (19.0%) |
| 3.0x to 3.9x | 25 (17.1%) | 114 (23.1%) |
| 4.0x or more | 41 (28.1%) | 78 (15.8%) |
| Total | 146 (100.0%) | 494 (100.0%) |
Real Estate Taxes by Mortgage Status in Wilson s Mills
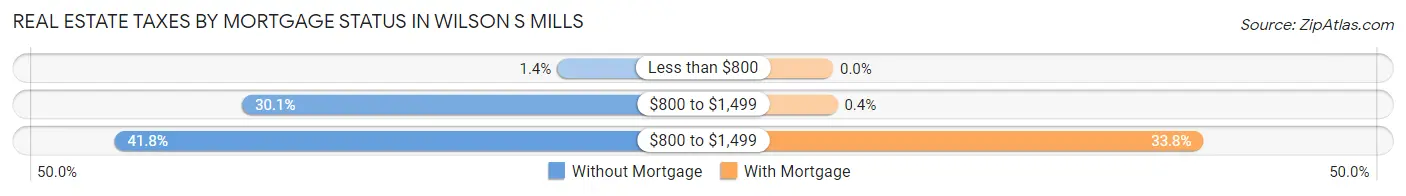
| Property Taxes | Without Mortgage | With Mortgage |
| Less than $800 | 2 (1.4%) | 0 (0.0%) |
| $800 to $1,499 | 44 (30.1%) | 2 (0.4%) |
| $800 to $1,499 | 61 (41.8%) | 167 (33.8%) |
| Total | 146 (100.0%) | 494 (100.0%) |
Health & Disability in Wilson s Mills
Health Insurance Coverage by Age in Wilson s Mills
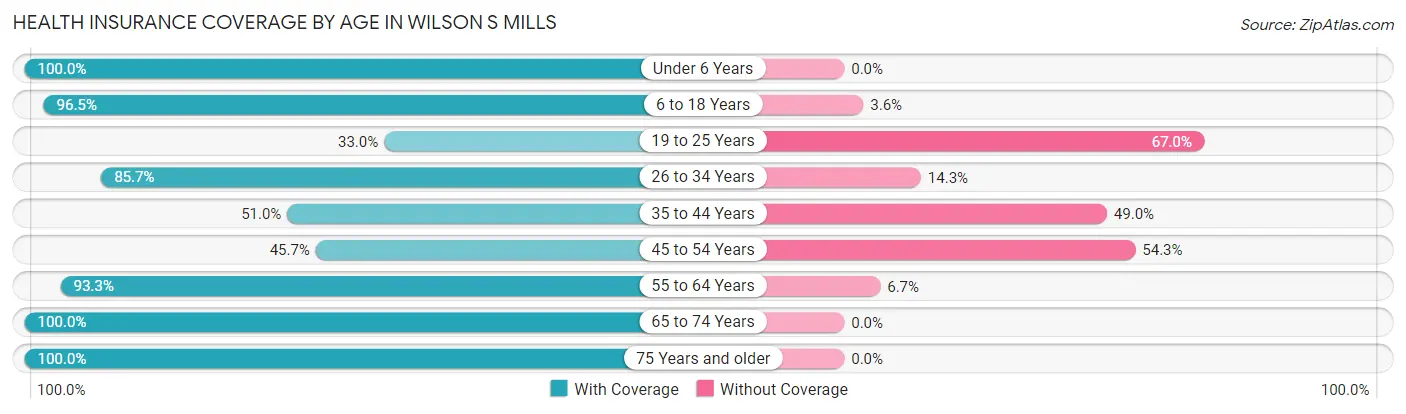
| Age Bracket | With Coverage | Without Coverage |
| Under 6 Years | 342 (100.0%) | 0 (0.0%) |
| 6 to 18 Years | 571 (96.5%) | 21 (3.5%) |
| 19 to 25 Years | 92 (33.0%) | 187 (67.0%) |
| 26 to 34 Years | 390 (85.7%) | 65 (14.3%) |
| 35 to 44 Years | 174 (51.0%) | 167 (49.0%) |
| 45 to 54 Years | 123 (45.7%) | 146 (54.3%) |
| 55 to 64 Years | 153 (93.3%) | 11 (6.7%) |
| 65 to 74 Years | 105 (100.0%) | 0 (0.0%) |
| 75 Years and older | 34 (100.0%) | 0 (0.0%) |
| Total | 1,984 (76.9%) | 597 (23.1%) |
Health Insurance Coverage by Citizenship Status in Wilson s Mills
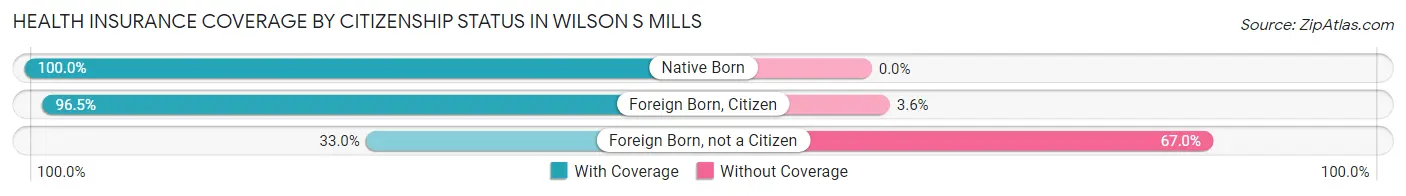
| Citizenship Status | With Coverage | Without Coverage |
| Native Born | 342 (100.0%) | 0 (0.0%) |
| Foreign Born, Citizen | 571 (96.5%) | 21 (3.5%) |
| Foreign Born, not a Citizen | 92 (33.0%) | 187 (67.0%) |
Health Insurance Coverage by Household Income in Wilson s Mills
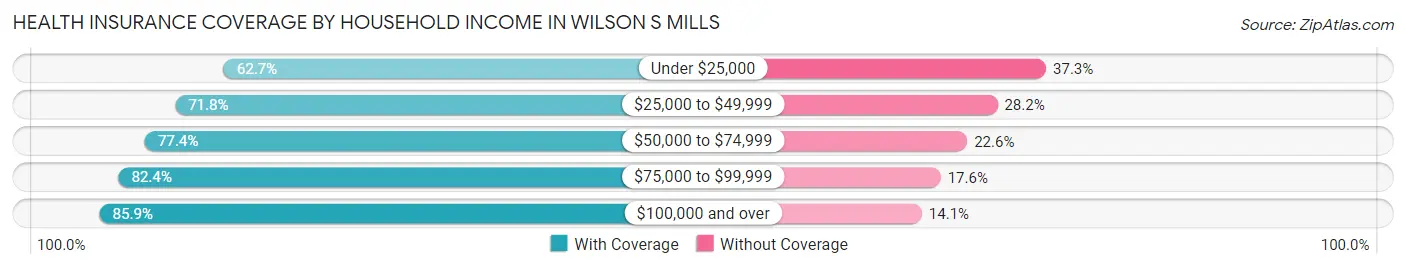
| Household Income | With Coverage | Without Coverage |
| Under $25,000 | 99 (62.7%) | 59 (37.3%) |
| $25,000 to $49,999 | 699 (71.8%) | 275 (28.2%) |
| $50,000 to $74,999 | 381 (77.4%) | 111 (22.6%) |
| $75,000 to $99,999 | 412 (82.4%) | 88 (17.6%) |
| $100,000 and over | 391 (85.9%) | 64 (14.1%) |
Public vs Private Health Insurance Coverage by Age in Wilson s Mills
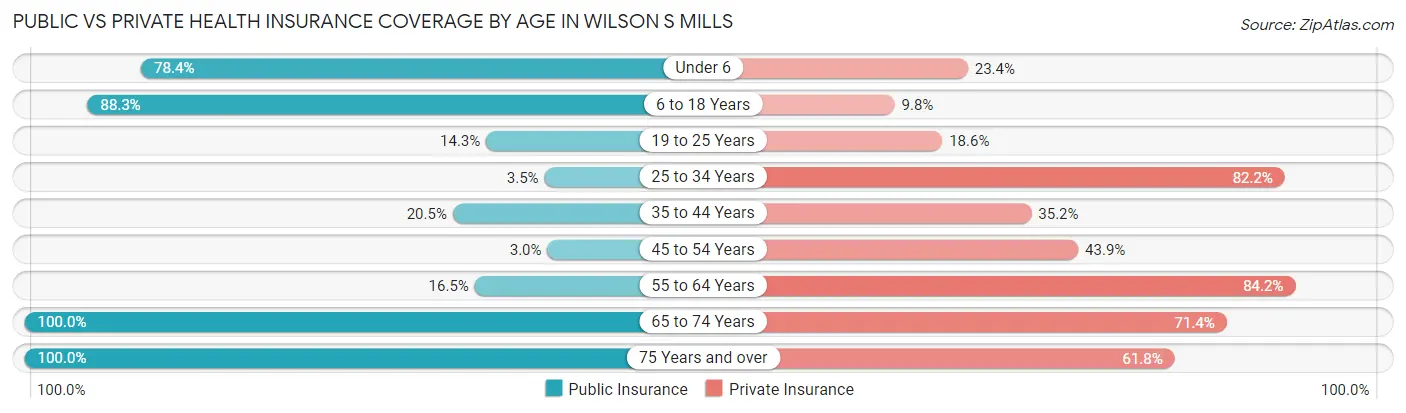
| Age Bracket | Public Insurance | Private Insurance |
| Under 6 | 268 (78.4%) | 80 (23.4%) |
| 6 to 18 Years | 523 (88.3%) | 58 (9.8%) |
| 19 to 25 Years | 40 (14.3%) | 52 (18.6%) |
| 25 to 34 Years | 16 (3.5%) | 374 (82.2%) |
| 35 to 44 Years | 70 (20.5%) | 120 (35.2%) |
| 45 to 54 Years | 8 (3.0%) | 118 (43.9%) |
| 55 to 64 Years | 27 (16.5%) | 138 (84.2%) |
| 65 to 74 Years | 105 (100.0%) | 75 (71.4%) |
| 75 Years and over | 34 (100.0%) | 21 (61.8%) |
| Total | 1,091 (42.3%) | 1,036 (40.1%) |
Disability Status by Sex by Age in Wilson s Mills
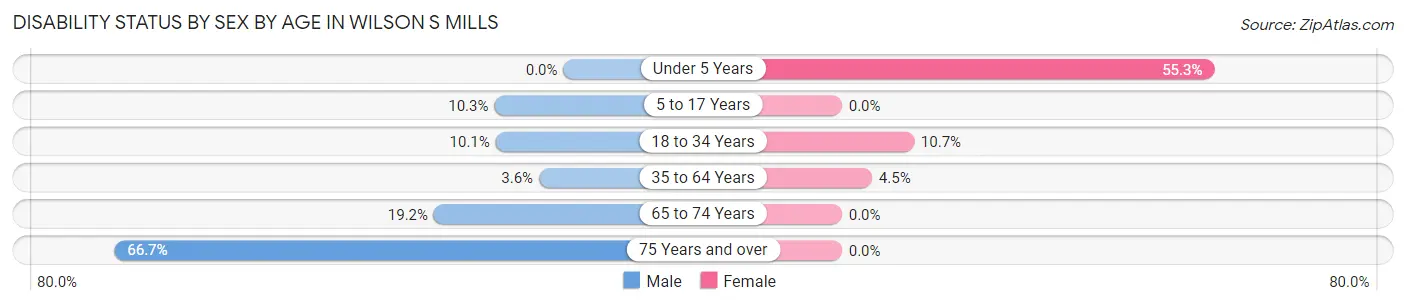
| Age Bracket | Male | Female |
| Under 5 Years | 0 (0.0%) | 146 (55.3%) |
| 5 to 17 Years | 28 (10.3%) | 0 (0.0%) |
| 18 to 34 Years | 50 (10.1%) | 27 (10.7%) |
| 35 to 64 Years | 11 (3.6%) | 21 (4.5%) |
| 65 to 74 Years | 10 (19.2%) | 0 (0.0%) |
| 75 Years and over | 4 (66.7%) | 0 (0.0%) |
Disability Class by Sex by Age in Wilson s Mills
Disability Class: Hearing Difficulty
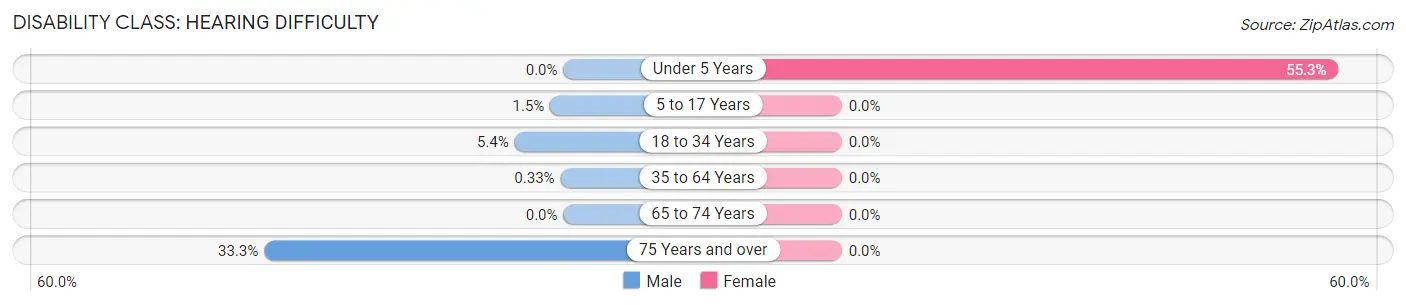
| Age Bracket | Male | Female |
| Under 5 Years | 0 (0.0%) | 146 (55.3%) |
| 5 to 17 Years | 4 (1.5%) | 0 (0.0%) |
| 18 to 34 Years | 27 (5.4%) | 0 (0.0%) |
| 35 to 64 Years | 1 (0.3%) | 0 (0.0%) |
| 65 to 74 Years | 0 (0.0%) | 0 (0.0%) |
| 75 Years and over | 2 (33.3%) | 0 (0.0%) |
Disability Class: Vision Difficulty
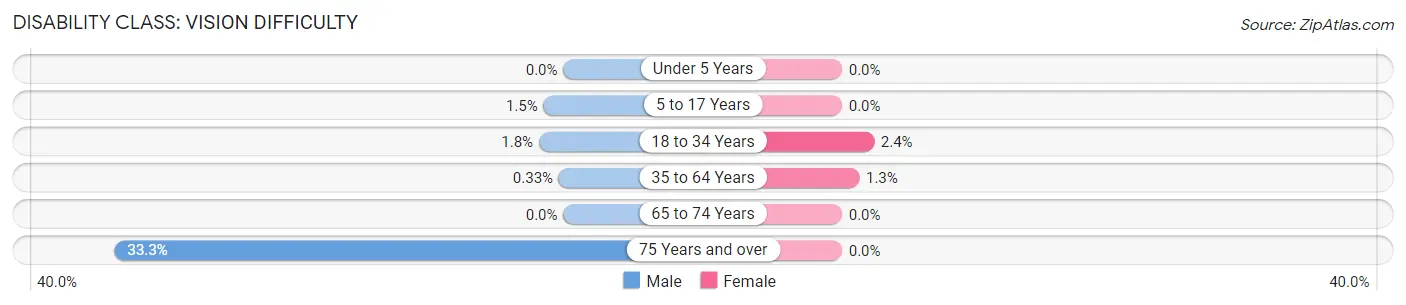
| Age Bracket | Male | Female |
| Under 5 Years | 0 (0.0%) | 0 (0.0%) |
| 5 to 17 Years | 4 (1.5%) | 0 (0.0%) |
| 18 to 34 Years | 9 (1.8%) | 6 (2.4%) |
| 35 to 64 Years | 1 (0.3%) | 6 (1.3%) |
| 65 to 74 Years | 0 (0.0%) | 0 (0.0%) |
| 75 Years and over | 2 (33.3%) | 0 (0.0%) |
Disability Class: Cognitive Difficulty
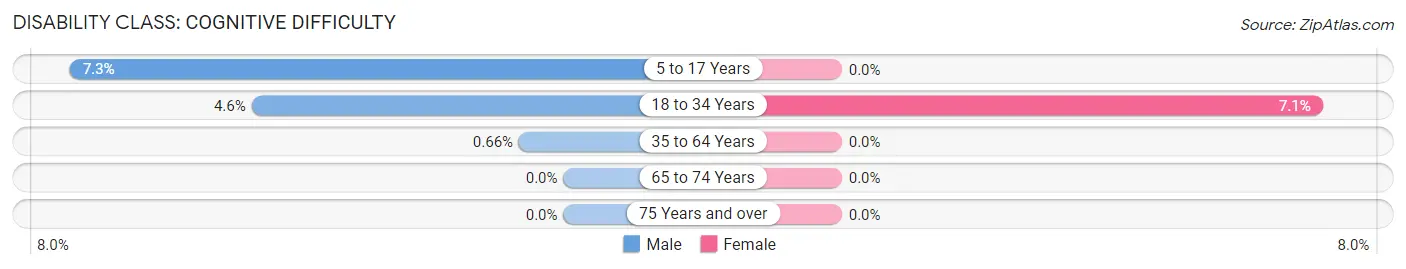
| Age Bracket | Male | Female |
| 5 to 17 Years | 20 (7.3%) | 0 (0.0%) |
| 18 to 34 Years | 23 (4.6%) | 18 (7.1%) |
| 35 to 64 Years | 2 (0.7%) | 0 (0.0%) |
| 65 to 74 Years | 0 (0.0%) | 0 (0.0%) |
| 75 Years and over | 0 (0.0%) | 0 (0.0%) |
Disability Class: Ambulatory Difficulty
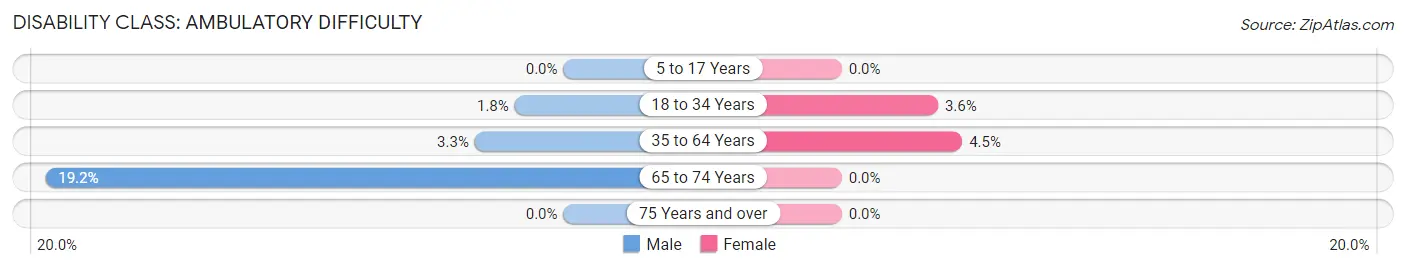
| Age Bracket | Male | Female |
| 5 to 17 Years | 0 (0.0%) | 0 (0.0%) |
| 18 to 34 Years | 9 (1.8%) | 9 (3.6%) |
| 35 to 64 Years | 10 (3.3%) | 21 (4.5%) |
| 65 to 74 Years | 10 (19.2%) | 0 (0.0%) |
| 75 Years and over | 0 (0.0%) | 0 (0.0%) |
Disability Class: Self-Care Difficulty
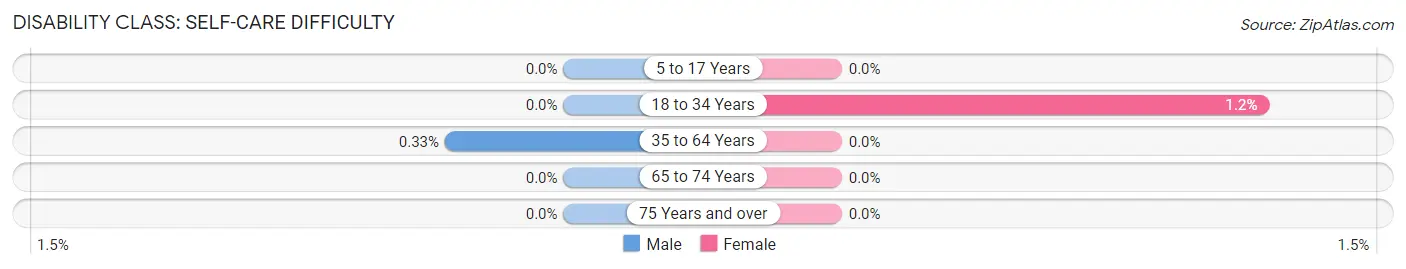
| Age Bracket | Male | Female |
| 5 to 17 Years | 0 (0.0%) | 0 (0.0%) |
| 18 to 34 Years | 0 (0.0%) | 3 (1.2%) |
| 35 to 64 Years | 1 (0.3%) | 0 (0.0%) |
| 65 to 74 Years | 0 (0.0%) | 0 (0.0%) |
| 75 Years and over | 0 (0.0%) | 0 (0.0%) |
Technology Access in Wilson s Mills
Computing Device Access in Wilson s Mills
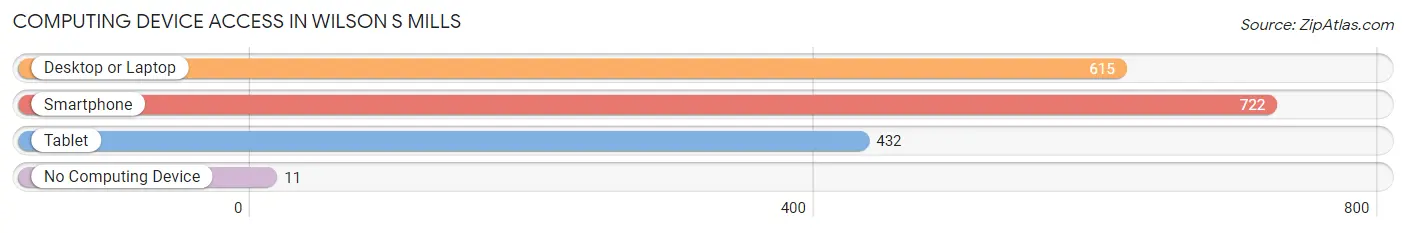
| Device Type | # Households | % Households |
| Desktop or Laptop | 615 | 80.9% |
| Smartphone | 722 | 95.0% |
| Tablet | 432 | 56.8% |
| No Computing Device | 11 | 1.5% |
| Total | 760 | 100.0% |
Internet Access in Wilson s Mills
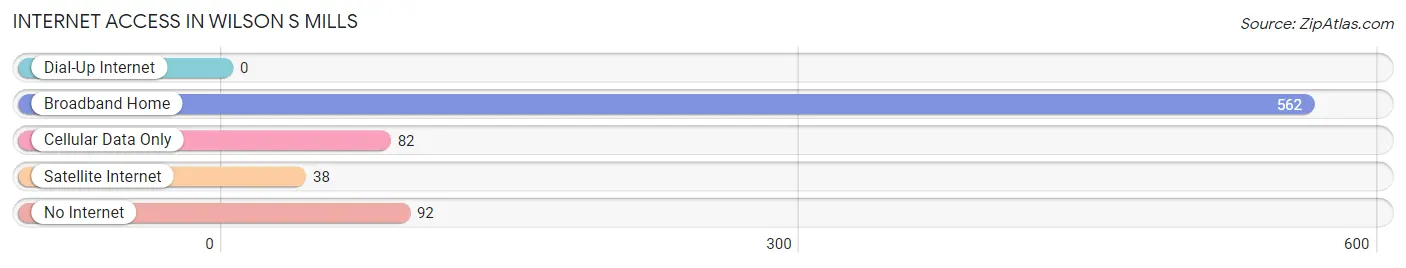
| Internet Type | # Households | % Households |
| Dial-Up Internet | 0 | 0.0% |
| Broadband Home | 562 | 74.0% |
| Cellular Data Only | 82 | 10.8% |
| Satellite Internet | 38 | 5.0% |
| No Internet | 92 | 12.1% |
| Total | 760 | 100.0% |
Wilson s Mills Summary
Wilson's Mills is a small town located in Johnston County, North Carolina. It is situated in the eastern part of the state, approximately 30 miles east of Raleigh. The town was founded in 1872 and named after the local mill owner, Wilson Mills. The population of Wilson's Mills was 1,845 as of the 2010 census.
Geography
Wilson's Mills is located in the eastern part of Johnston County, North Carolina. It is situated at an elevation of approximately 200 feet above sea level. The town is located on the Neuse River, which is a major tributary of the Pamlico Sound. The town is bordered by the towns of Clayton, Smithfield, and Selma. The town is located approximately 30 miles east of Raleigh, the state capital.
Climate
Wilson's Mills has a humid subtropical climate, with hot, humid summers and mild winters. The average annual temperature is around 70 degrees Fahrenheit. The average annual precipitation is around 45 inches.
Demographics
As of the 2010 census, the population of Wilson's Mills was 1,845. The racial makeup of the town was 79.3% White, 16.2% African American, 0.3% Native American, 0.7% Asian, 0.1% Pacific Islander, and 3.4% from other races. The median household income was $37,917, and the median family income was $45,917.
Economy
Wilson's Mills is a small town with a limited economy. The town is home to several small businesses, including a grocery store, a hardware store, and a few restaurants. The town is also home to a few manufacturing companies, including a furniture manufacturer and a plastics manufacturer. The town is also home to a few farms, which produce corn, soybeans, and other crops.
Education
Wilson's Mills is served by the Johnston County School System. The town is home to two elementary schools, one middle school, and one high school. The town is also home to a few private schools, including a Christian school and a Montessori school.
Conclusion
Wilson's Mills is a small town located in Johnston County, North Carolina. It is situated in the eastern part of the state, approximately 30 miles east of Raleigh. The town was founded in 1872 and named after the local mill owner, Wilson Mills. The population of Wilson's Mills was 1,845 as of the 2010 census. The town has a humid subtropical climate, with hot, humid summers and mild winters. The racial makeup of the town was 79.3% White, 16.2% African American, 0.3% Native American, 0.7% Asian, 0.1% Pacific Islander, and 3.4% from other races. The median household income was $37,917, and the median family income was $45,917. Wilson's Mills is a small town with a limited economy. The town is home to several small businesses, including a grocery store, a hardware store, and a few restaurants. The town is also home to a few manufacturing companies, including a furniture manufacturer and a plastics manufacturer. The town is also home to a few farms, which produce corn, soybeans, and other crops. Wilson's Mills is served by the Johnston County School System. The town is home to two elementary schools, one middle school, and one high school. The town is also home to a few private schools, including a Christian school and a Montessori school.
Common Questions
What is Per Capita Income in Wilson s Mills?
Per Capita income in Wilson s Mills is $22,503.
What is the Median Family Income in Wilson s Mills?
Median Family Income in Wilson s Mills is $59,750.
What is the Median Household income in Wilson s Mills?
Median Household Income in Wilson s Mills is $59,309.
What is Income or Wage Gap in Wilson s Mills?
Income or Wage Gap in Wilson s Mills is 14.8%.
Women in Wilson s Mills earn 85.2 cents for every dollar earned by a man.
What is Inequality or Gini Index in Wilson s Mills?
Inequality or Gini Index in Wilson s Mills is 0.34.
What is the Total Population of Wilson s Mills?
Total Population of Wilson s Mills is 2,581.
What is the Total Male Population of Wilson s Mills?
Total Male Population of Wilson s Mills is 1,192.
What is the Total Female Population of Wilson s Mills?
Total Female Population of Wilson s Mills is 1,389.
What is the Ratio of Males per 100 Females in Wilson s Mills?
There are 85.82 Males per 100 Females in Wilson s Mills.
What is the Ratio of Females per 100 Males in Wilson s Mills?
There are 116.53 Females per 100 Males in Wilson s Mills.
What is the Median Population Age in Wilson s Mills?
Median Population Age in Wilson s Mills is 28.5 Years.
What is the Average Family Size in Wilson s Mills
Average Family Size in Wilson s Mills is 4.4 People.
What is the Average Household Size in Wilson s Mills
Average Household Size in Wilson s Mills is 3.4 People.
How Large is the Labor Force in Wilson s Mills?
There are 1,335 People in the Labor Forcein in Wilson s Mills.
What is the Percentage of People in the Labor Force in Wilson s Mills?
72.9% of People are in the Labor Force in Wilson s Mills.
What is the Unemployment Rate in Wilson s Mills?
Unemployment Rate in Wilson s Mills is 10.9%.