Zip Codes with the Highest Percentage of Self-Employed / Incorporated in Indiana
RELATED REPORTS & OPTIONS
Self-Employed / Incorporated
Indiana
Compare Zip Codes
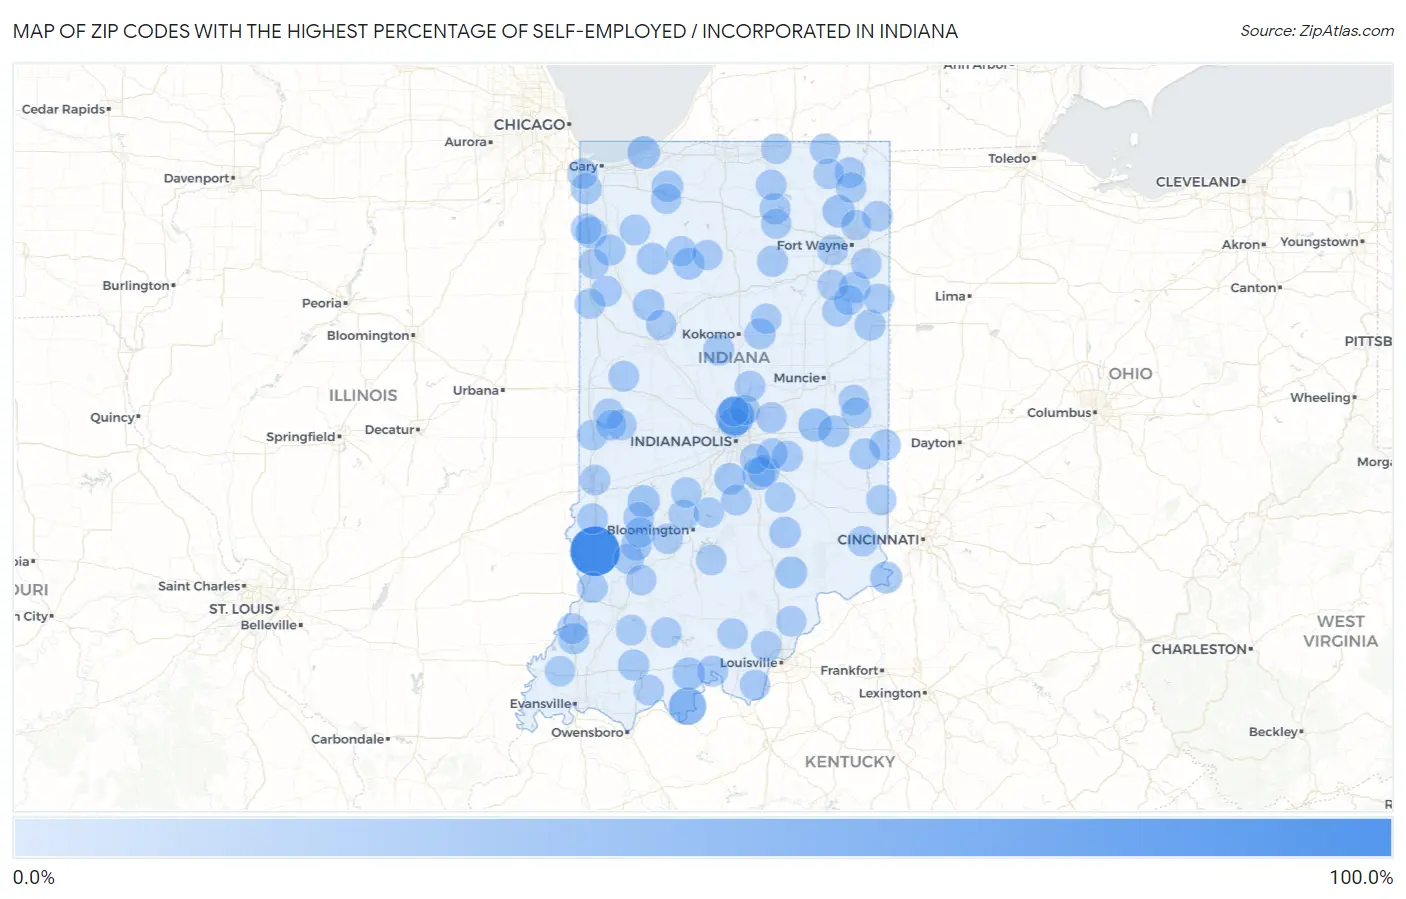
Map of Zip Codes with the Highest Percentage of Self-Employed / Incorporated in Indiana
0.0%
100.0%
Zip Codes with the Highest Percentage of Self-Employed / Incorporated in Indiana
| Zip Code | % Self-Employed / Incorporated | vs State | vs National | |
| 1. | 47865 | 100.0% | 3.2%(+96.8)#1 | 3.8%(+96.2)#26 |
| 2. | 46290 | 44.8% | 3.2%(+41.6)#2 | 3.8%(+41.0)#109 |
| 3. | 47574 | 39.8% | 3.2%(+36.5)#3 | 3.8%(+35.9)#133 |
| 4. | 47344 | 19.2% | 3.2%(+16.0)#4 | 3.8%(+15.4)#547 |
| 5. | 46162 | 17.3% | 3.2%(+14.1)#5 | 3.8%(+13.5)#678 |
| 6. | 46301 | 17.0% | 3.2%(+13.8)#6 | 3.8%(+13.2)#709 |
| 7. | 46763 | 16.5% | 3.2%(+13.3)#7 | 3.8%(+12.7)#760 |
| 8. | 47576 | 16.1% | 3.2%(+12.9)#8 | 3.8%(+12.3)#798 |
| 9. | 47833 | 14.9% | 3.2%(+11.7)#9 | 3.8%(+11.1)#965 |
| 10. | 47038 | 13.1% | 3.2%(+9.93)#10 | 3.8%(+9.33)#1,289 |
| 11. | 47227 | 13.0% | 3.2%(+9.75)#11 | 3.8%(+9.16)#1,325 |
| 12. | 46110 | 12.5% | 3.2%(+9.28)#12 | 3.8%(+8.68)#1,439 |
| 13. | 47236 | 12.5% | 3.2%(+9.28)#13 | 3.8%(+8.68)#1,444 |
| 14. | 47946 | 12.4% | 3.2%(+9.16)#14 | 3.8%(+8.56)#1,477 |
| 15. | 46985 | 12.2% | 3.2%(+8.97)#15 | 3.8%(+8.37)#1,522 |
| 16. | 47929 | 12.2% | 3.2%(+8.96)#16 | 3.8%(+8.36)#1,524 |
| 17. | 47387 | 12.0% | 3.2%(+8.81)#17 | 3.8%(+8.21)#1,558 |
| 18. | 46106 | 11.7% | 3.2%(+8.50)#18 | 3.8%(+7.90)#1,651 |
| 19. | 46379 | 11.6% | 3.2%(+8.34)#19 | 3.8%(+7.75)#1,703 |
| 20. | 47324 | 11.2% | 3.2%(+8.00)#20 | 3.8%(+7.41)#1,799 |
| 21. | 46382 | 11.2% | 3.2%(+8.00)#21 | 3.8%(+7.40)#1,800 |
| 22. | 46731 | 11.0% | 3.2%(+7.78)#22 | 3.8%(+7.18)#1,903 |
| 23. | 47137 | 10.3% | 3.2%(+7.06)#23 | 3.8%(+6.46)#2,185 |
| 24. | 46943 | 10.2% | 3.2%(+6.98)#24 | 3.8%(+6.39)#2,221 |
| 25. | 46039 | 10.0% | 3.2%(+6.74)#25 | 3.8%(+6.14)#2,350 |
| 26. | 47541 | 9.9% | 3.2%(+6.72)#26 | 3.8%(+6.12)#2,356 |
| 27. | 46373 | 9.7% | 3.2%(+6.46)#27 | 3.8%(+5.86)#2,481 |
| 28. | 47326 | 9.7% | 3.2%(+6.44)#28 | 3.8%(+5.84)#2,487 |
| 29. | 46538 | 9.3% | 3.2%(+6.06)#29 | 3.8%(+5.47)#2,703 |
| 30. | 47943 | 9.3% | 3.2%(+6.03)#30 | 3.8%(+5.44)#2,725 |
| 31. | 46936 | 9.2% | 3.2%(+5.99)#31 | 3.8%(+5.40)#2,746 |
| 32. | 47666 | 9.0% | 3.2%(+5.81)#32 | 3.8%(+5.22)#2,864 |
| 33. | 47325 | 8.7% | 3.2%(+5.50)#33 | 3.8%(+4.90)#3,069 |
| 34. | 46376 | 8.6% | 3.2%(+5.35)#34 | 3.8%(+4.75)#3,180 |
| 35. | 46161 | 8.6% | 3.2%(+5.33)#35 | 3.8%(+4.74)#3,191 |
| 36. | 47948 | 8.5% | 3.2%(+5.30)#36 | 3.8%(+4.71)#3,207 |
| 37. | 46130 | 8.5% | 3.2%(+5.26)#37 | 3.8%(+4.66)#3,244 |
| 38. | 47465 | 8.4% | 3.2%(+5.19)#38 | 3.8%(+4.59)#3,310 |
| 39. | 47427 | 8.3% | 3.2%(+5.10)#39 | 3.8%(+4.50)#3,384 |
| 40. | 46553 | 8.2% | 3.2%(+5.02)#40 | 3.8%(+4.42)#3,448 |
| 41. | 47969 | 8.1% | 3.2%(+4.89)#41 | 3.8%(+4.29)#3,567 |
| 42. | 46181 | 8.1% | 3.2%(+4.85)#42 | 3.8%(+4.25)#3,606 |
| 43. | 47850 | 8.0% | 3.2%(+4.78)#43 | 3.8%(+4.19)#3,657 |
| 44. | 46392 | 8.0% | 3.2%(+4.78)#44 | 3.8%(+4.18)#3,659 |
| 45. | 47859 | 7.9% | 3.2%(+4.71)#45 | 3.8%(+4.11)#3,735 |
| 46. | 46034 | 7.7% | 3.2%(+4.51)#46 | 3.8%(+3.91)#3,938 |
| 47. | 46745 | 7.6% | 3.2%(+4.43)#47 | 3.8%(+3.83)#4,024 |
| 48. | 46040 | 7.6% | 3.2%(+4.43)#48 | 3.8%(+3.83)#4,028 |
| 49. | 47443 | 7.6% | 3.2%(+4.42)#49 | 3.8%(+3.82)#4,037 |
| 50. | 47524 | 7.6% | 3.2%(+4.37)#50 | 3.8%(+3.78)#4,072 |
| 51. | 47516 | 7.6% | 3.2%(+4.36)#51 | 3.8%(+3.77)#4,081 |
| 52. | 47854 | 7.5% | 3.2%(+4.25)#52 | 3.8%(+3.65)#4,195 |
| 53. | 47920 | 7.4% | 3.2%(+4.22)#53 | 3.8%(+3.62)#4,227 |
| 54. | 46781 | 7.3% | 3.2%(+4.08)#54 | 3.8%(+3.49)#4,392 |
| 55. | 46747 | 7.3% | 3.2%(+4.08)#55 | 3.8%(+3.48)#4,399 |
| 56. | 47120 | 7.2% | 3.2%(+3.99)#56 | 3.8%(+3.39)#4,504 |
| 57. | 46746 | 7.1% | 3.2%(+3.92)#57 | 3.8%(+3.32)#4,593 |
| 58. | 47804 | 7.1% | 3.2%(+3.91)#58 | 3.8%(+3.32)#4,595 |
| 59. | 47564 | 7.1% | 3.2%(+3.91)#59 | 3.8%(+3.31)#4,596 |
| 60. | 46340 | 7.1% | 3.2%(+3.91)#60 | 3.8%(+3.31)#4,599 |
| 61. | 47117 | 7.1% | 3.2%(+3.89)#61 | 3.8%(+3.30)#4,618 |
| 62. | 47358 | 7.0% | 3.2%(+3.79)#62 | 3.8%(+3.20)#4,752 |
| 63. | 46507 | 7.0% | 3.2%(+3.79)#63 | 3.8%(+3.19)#4,756 |
| 64. | 46795 | 7.0% | 3.2%(+3.78)#64 | 3.8%(+3.18)#4,770 |
| 65. | 46788 | 6.9% | 3.2%(+3.73)#65 | 3.8%(+3.13)#4,828 |
| 66. | 46730 | 6.9% | 3.2%(+3.73)#66 | 3.8%(+3.13)#4,830 |
| 67. | 47163 | 6.9% | 3.2%(+3.72)#67 | 3.8%(+3.12)#4,843 |
| 68. | 47952 | 6.9% | 3.2%(+3.72)#68 | 3.8%(+3.12)#4,844 |
| 69. | 47471 | 6.9% | 3.2%(+3.71)#69 | 3.8%(+3.11)#4,855 |
| 70. | 47942 | 6.9% | 3.2%(+3.66)#70 | 3.8%(+3.06)#4,920 |
| 71. | 47832 | 6.9% | 3.2%(+3.65)#71 | 3.8%(+3.05)#4,945 |
| 72. | 47562 | 6.9% | 3.2%(+3.64)#72 | 3.8%(+3.05)#4,946 |
| 73. | 47459 | 6.8% | 3.2%(+3.57)#73 | 3.8%(+2.98)#5,042 |
| 74. | 47527 | 6.8% | 3.2%(+3.54)#74 | 3.8%(+2.94)#5,094 |
| 75. | 46919 | 6.7% | 3.2%(+3.49)#75 | 3.8%(+2.89)#5,173 |
| 76. | 46814 | 6.7% | 3.2%(+3.48)#76 | 3.8%(+2.89)#5,178 |
| 77. | 47429 | 6.7% | 3.2%(+3.47)#77 | 3.8%(+2.87)#5,206 |
| 78. | 47550 | 6.7% | 3.2%(+3.45)#78 | 3.8%(+2.85)#5,243 |
| 79. | 47468 | 6.6% | 3.2%(+3.38)#79 | 3.8%(+2.78)#5,357 |
| 80. | 46996 | 6.6% | 3.2%(+3.37)#80 | 3.8%(+2.78)#5,361 |
| 81. | 47119 | 6.6% | 3.2%(+3.35)#81 | 3.8%(+2.75)#5,401 |
| 82. | 47016 | 6.5% | 3.2%(+3.29)#82 | 3.8%(+2.70)#5,459 |
| 83. | 46321 | 6.5% | 3.2%(+3.28)#83 | 3.8%(+2.68)#5,477 |
| 84. | 46260 | 6.4% | 3.2%(+3.21)#84 | 3.8%(+2.62)#5,583 |
| 85. | 47963 | 6.4% | 3.2%(+3.20)#85 | 3.8%(+2.60)#5,596 |
| 86. | 46939 | 6.4% | 3.2%(+3.20)#86 | 3.8%(+2.60)#5,599 |
| 87. | 46033 | 6.4% | 3.2%(+3.17)#87 | 3.8%(+2.57)#5,648 |
| 88. | 46259 | 6.4% | 3.2%(+3.14)#88 | 3.8%(+2.54)#5,703 |
| 89. | 47436 | 6.3% | 3.2%(+3.13)#89 | 3.8%(+2.53)#5,715 |
| 90. | 47032 | 6.3% | 3.2%(+3.10)#90 | 3.8%(+2.51)#5,761 |
| 91. | 47612 | 6.3% | 3.2%(+3.07)#91 | 3.8%(+2.47)#5,827 |
| 92. | 46770 | 6.3% | 3.2%(+3.05)#92 | 3.8%(+2.46)#5,852 |
| 93. | 47234 | 6.3% | 3.2%(+3.05)#93 | 3.8%(+2.45)#5,863 |
| 94. | 47339 | 6.2% | 3.2%(+3.03)#94 | 3.8%(+2.43)#5,891 |
| 95. | 46166 | 6.2% | 3.2%(+2.98)#95 | 3.8%(+2.39)#5,961 |
| 96. | 46032 | 6.1% | 3.2%(+2.93)#96 | 3.8%(+2.33)#6,063 |
| 97. | 46714 | 6.1% | 3.2%(+2.91)#97 | 3.8%(+2.31)#6,099 |
| 98. | 46590 | 6.1% | 3.2%(+2.89)#98 | 3.8%(+2.30)#6,126 |
| 99. | 46845 | 6.1% | 3.2%(+2.89)#99 | 3.8%(+2.30)#6,128 |
| 100. | 46772 | 6.1% | 3.2%(+2.86)#100 | 3.8%(+2.26)#6,188 |
Common Questions
What are the Top 10 Zip Codes with the Highest Percentage of Self-Employed / Incorporated in Indiana?
Top 10 Zip Codes with the Highest Percentage of Self-Employed / Incorporated in Indiana are:
What zip code has the Highest Percentage of Self-Employed / Incorporated in Indiana?
47865 has the Highest Percentage of Self-Employed / Incorporated in Indiana with 100.0%.
What is the Percentage of Self-Employed / Incorporated in the State of Indiana?
Percentage of Self-Employed / Incorporated in Indiana is 3.2%.
What is the Percentage of Self-Employed / Incorporated in the United States?
Percentage of Self-Employed / Incorporated in the United States is 3.8%.