Zip Codes with the Highest Percentage of Households Without a Vehicle in Indiana
RELATED REPORTS & OPTIONS
Households without a Cars
Indiana
Compare Zip Codes
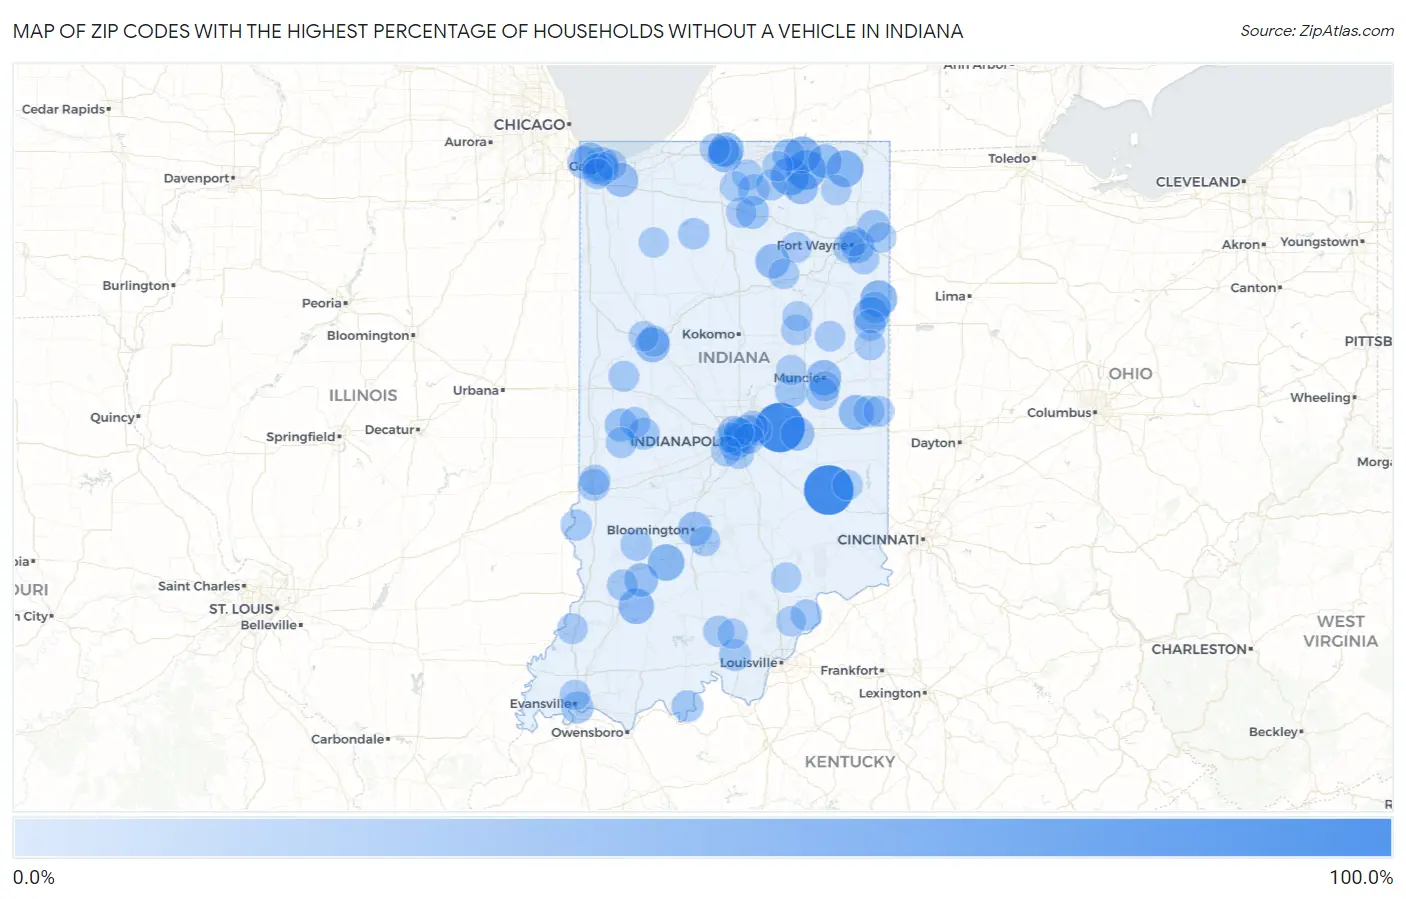
Map of Zip Codes with the Highest Percentage of Households Without a Vehicle in Indiana
0.0%
100.0%
Zip Codes with the Highest Percentage of Households Without a Vehicle in Indiana
| Zip Code | Housholds Without a Car | vs State | vs National | |
| 1. | 46154 | 100.0% | 6.2%(+93.8)#1 | 8.3%(+91.7)#26 |
| 2. | 47225 | 100.0% | 6.2%(+93.8)#2 | 8.3%(+91.7)#50 |
| 3. | 46571 | 51.2% | 6.2%(+45.0)#3 | 8.3%(+42.9)#336 |
| 4. | 46543 | 46.2% | 6.2%(+40.0)#4 | 8.3%(+37.9)#389 |
| 5. | 46565 | 40.1% | 6.2%(+33.9)#5 | 8.3%(+31.8)#511 |
| 6. | 46789 | 39.8% | 6.2%(+33.6)#6 | 8.3%(+31.5)#518 |
| 7. | 46772 | 39.2% | 6.2%(+33.0)#7 | 8.3%(+30.9)#530 |
| 8. | 47453 | 37.7% | 6.2%(+31.5)#8 | 8.3%(+29.4)#571 |
| 9. | 46740 | 34.7% | 6.2%(+28.5)#9 | 8.3%(+26.4)#643 |
| 10. | 47558 | 33.5% | 6.2%(+27.3)#10 | 8.3%(+25.2)#673 |
| 11. | 47339 | 31.6% | 6.2%(+25.4)#11 | 8.3%(+23.3)#741 |
| 12. | 46556 | 31.3% | 6.2%(+25.1)#12 | 8.3%(+23.0)#754 |
| 13. | 47305 | 30.7% | 6.2%(+24.5)#13 | 8.3%(+22.4)#775 |
| 14. | 46601 | 30.0% | 6.2%(+23.8)#14 | 8.3%(+21.7)#797 |
| 15. | 47901 | 29.7% | 6.2%(+23.5)#15 | 8.3%(+21.4)#817 |
| 16. | 46943 | 28.6% | 6.2%(+22.4)#16 | 8.3%(+20.3)#869 |
| 17. | 47406 | 26.7% | 6.2%(+20.5)#17 | 8.3%(+18.4)#963 |
| 18. | 46761 | 26.1% | 6.2%(+19.9)#18 | 8.3%(+17.8)#989 |
| 19. | 46117 | 25.9% | 6.2%(+19.7)#19 | 8.3%(+17.6)#1,012 |
| 20. | 46393 | 25.6% | 6.2%(+19.4)#20 | 8.3%(+17.3)#1,034 |
| 21. | 46402 | 25.3% | 6.2%(+19.1)#21 | 8.3%(+17.0)#1,049 |
| 22. | 47562 | 25.2% | 6.2%(+19.0)#22 | 8.3%(+16.9)#1,054 |
| 23. | 46803 | 24.7% | 6.2%(+18.5)#23 | 8.3%(+16.4)#1,090 |
| 24. | 46407 | 24.7% | 6.2%(+18.5)#24 | 8.3%(+16.4)#1,091 |
| 25. | 46767 | 23.3% | 6.2%(+17.1)#25 | 8.3%(+15.0)#1,189 |
| 26. | 47859 | 22.4% | 6.2%(+16.2)#26 | 8.3%(+14.1)#1,270 |
| 27. | 46524 | 21.8% | 6.2%(+15.6)#27 | 8.3%(+13.5)#1,317 |
| 28. | 46320 | 20.7% | 6.2%(+14.5)#28 | 8.3%(+12.4)#1,418 |
| 29. | 46741 | 19.8% | 6.2%(+13.6)#29 | 8.3%(+11.5)#1,528 |
| 30. | 46312 | 19.6% | 6.2%(+13.4)#30 | 8.3%(+11.3)#1,552 |
| 31. | 46201 | 19.2% | 6.2%(+13.0)#31 | 8.3%(+10.9)#1,606 |
| 32. | 46016 | 18.7% | 6.2%(+12.5)#32 | 8.3%(+10.4)#1,680 |
| 33. | 47367 | 18.6% | 6.2%(+12.4)#33 | 8.3%(+10.3)#1,705 |
| 34. | 46218 | 18.3% | 6.2%(+12.1)#34 | 8.3%(+10.00)#1,734 |
| 35. | 46540 | 18.2% | 6.2%(+12.0)#35 | 8.3%(+9.90)#1,752 |
| 36. | 47713 | 18.1% | 6.2%(+11.9)#36 | 8.3%(+9.80)#1,769 |
| 37. | 46711 | 17.6% | 6.2%(+11.4)#37 | 8.3%(+9.30)#1,849 |
| 38. | 46175 | 17.5% | 6.2%(+11.3)#38 | 8.3%(+9.20)#1,868 |
| 39. | 47166 | 17.1% | 6.2%(+10.9)#39 | 8.3%(+8.80)#1,945 |
| 40. | 47574 | 16.9% | 6.2%(+10.7)#40 | 8.3%(+8.60)#1,990 |
| 41. | 47807 | 15.9% | 6.2%(+9.70)#41 | 8.3%(+7.60)#2,180 |
| 42. | 47465 | 15.5% | 6.2%(+9.30)#42 | 8.3%(+7.20)#2,266 |
| 43. | 46550 | 15.1% | 6.2%(+8.90)#43 | 8.3%(+6.80)#2,360 |
| 44. | 47326 | 15.1% | 6.2%(+8.90)#44 | 8.3%(+6.80)#2,369 |
| 45. | 46802 | 15.0% | 6.2%(+8.80)#45 | 8.3%(+6.70)#2,388 |
| 46. | 46225 | 14.8% | 6.2%(+8.60)#46 | 8.3%(+6.50)#2,447 |
| 47. | 47147 | 14.4% | 6.2%(+8.20)#47 | 8.3%(+6.10)#2,571 |
| 48. | 46960 | 14.4% | 6.2%(+8.20)#48 | 8.3%(+6.10)#2,572 |
| 49. | 46202 | 14.2% | 6.2%(+8.00)#49 | 8.3%(+5.90)#2,629 |
| 50. | 47904 | 14.2% | 6.2%(+8.00)#50 | 8.3%(+5.90)#2,633 |
| 51. | 47849 | 14.1% | 6.2%(+7.90)#51 | 8.3%(+5.80)#2,687 |
| 52. | 47393 | 14.0% | 6.2%(+7.80)#52 | 8.3%(+5.70)#2,714 |
| 53. | 46204 | 13.9% | 6.2%(+7.70)#53 | 8.3%(+5.60)#2,734 |
| 54. | 46616 | 13.9% | 6.2%(+7.70)#54 | 8.3%(+5.60)#2,738 |
| 55. | 47125 | 13.8% | 6.2%(+7.60)#55 | 8.3%(+5.50)#2,784 |
| 56. | 47568 | 13.6% | 6.2%(+7.40)#56 | 8.3%(+5.30)#2,862 |
| 57. | 46816 | 13.3% | 6.2%(+7.10)#57 | 8.3%(+5.00)#2,969 |
| 58. | 46404 | 12.8% | 6.2%(+6.60)#58 | 8.3%(+4.50)#3,186 |
| 59. | 47989 | 12.8% | 6.2%(+6.60)#59 | 8.3%(+4.50)#3,208 |
| 60. | 47969 | 12.6% | 6.2%(+6.40)#60 | 8.3%(+4.30)#3,306 |
| 61. | 47872 | 12.4% | 6.2%(+6.20)#61 | 8.3%(+4.10)#3,375 |
| 62. | 46235 | 12.3% | 6.2%(+6.10)#62 | 8.3%(+4.00)#3,410 |
| 63. | 46787 | 12.3% | 6.2%(+6.10)#63 | 8.3%(+4.00)#3,435 |
| 64. | 46403 | 12.2% | 6.2%(+6.00)#64 | 8.3%(+3.90)#3,460 |
| 65. | 46573 | 12.2% | 6.2%(+6.00)#65 | 8.3%(+3.90)#3,471 |
| 66. | 46553 | 12.1% | 6.2%(+5.90)#66 | 8.3%(+3.80)#3,525 |
| 67. | 47341 | 12.1% | 6.2%(+5.90)#67 | 8.3%(+3.80)#3,529 |
| 68. | 46216 | 12.1% | 6.2%(+5.90)#68 | 8.3%(+3.80)#3,531 |
| 69. | 46208 | 11.8% | 6.2%(+5.60)#69 | 8.3%(+3.50)#3,667 |
| 70. | 46226 | 11.6% | 6.2%(+5.40)#70 | 8.3%(+3.30)#3,752 |
| 71. | 46628 | 11.4% | 6.2%(+5.20)#71 | 8.3%(+3.10)#3,891 |
| 72. | 47524 | 11.4% | 6.2%(+5.20)#72 | 8.3%(+3.10)#3,923 |
| 73. | 47302 | 11.3% | 6.2%(+5.10)#73 | 8.3%(+3.00)#3,941 |
| 74. | 47024 | 11.2% | 6.2%(+5.00)#74 | 8.3%(+2.90)#4,039 |
| 75. | 46990 | 11.2% | 6.2%(+5.00)#75 | 8.3%(+2.90)#4,058 |
| 76. | 46953 | 11.0% | 6.2%(+4.80)#76 | 8.3%(+2.70)#4,133 |
| 77. | 47371 | 11.0% | 6.2%(+4.80)#77 | 8.3%(+2.70)#4,141 |
| 78. | 46408 | 10.9% | 6.2%(+4.70)#78 | 8.3%(+2.60)#4,197 |
| 79. | 46504 | 10.9% | 6.2%(+4.70)#79 | 8.3%(+2.60)#4,217 |
| 80. | 47710 | 10.8% | 6.2%(+4.60)#80 | 8.3%(+2.50)#4,254 |
| 81. | 47348 | 10.8% | 6.2%(+4.60)#81 | 8.3%(+2.50)#4,266 |
| 82. | 46227 | 10.7% | 6.2%(+4.50)#82 | 8.3%(+2.40)#4,297 |
| 83. | 47804 | 10.7% | 6.2%(+4.50)#83 | 8.3%(+2.40)#4,328 |
| 84. | 46755 | 10.5% | 6.2%(+4.30)#84 | 8.3%(+2.20)#4,466 |
| 85. | 47163 | 10.5% | 6.2%(+4.30)#85 | 8.3%(+2.20)#4,502 |
| 86. | 46222 | 10.4% | 6.2%(+4.20)#86 | 8.3%(+2.10)#4,522 |
| 87. | 46805 | 10.4% | 6.2%(+4.20)#87 | 8.3%(+2.10)#4,541 |
| 88. | 47906 | 10.3% | 6.2%(+4.10)#88 | 8.3%(+2.00)#4,615 |
| 89. | 47120 | 10.3% | 6.2%(+4.10)#89 | 8.3%(+2.00)#4,678 |
| 90. | 46219 | 10.0% | 6.2%(+3.80)#90 | 8.3%(+1.70)#4,844 |
| 91. | 46205 | 9.9% | 6.2%(+3.70)#91 | 8.3%(+1.60)#4,936 |
| 92. | 46528 | 9.9% | 6.2%(+3.70)#92 | 8.3%(+1.60)#4,938 |
| 93. | 46952 | 9.9% | 6.2%(+3.70)#93 | 8.3%(+1.60)#4,948 |
| 94. | 46506 | 9.8% | 6.2%(+3.60)#94 | 8.3%(+1.50)#5,041 |
| 95. | 46001 | 9.8% | 6.2%(+3.60)#95 | 8.3%(+1.50)#5,044 |
| 96. | 47957 | 9.8% | 6.2%(+3.60)#96 | 8.3%(+1.50)#5,068 |
| 97. | 46221 | 9.7% | 6.2%(+3.50)#97 | 8.3%(+1.40)#5,104 |
| 98. | 46797 | 9.7% | 6.2%(+3.50)#98 | 8.3%(+1.40)#5,131 |
| 99. | 47401 | 9.6% | 6.2%(+3.40)#99 | 8.3%(+1.30)#5,181 |
| 100. | 47270 | 9.6% | 6.2%(+3.40)#100 | 8.3%(+1.30)#5,244 |
Common Questions
What are the Top 10 Zip Codes with the Highest Percentage of Households Without a Vehicle in Indiana?
Top 10 Zip Codes with the Highest Percentage of Households Without a Vehicle in Indiana are:
What zip code has the Highest Percentage of Households Without a Vehicle in Indiana?
46154 has the Highest Percentage of Households Without a Vehicle in Indiana with 100.0%.
What is the Percentage of Households Without a Vehicle in the State of Indiana?
Percentage of Households Without a Vehicle in Indiana is 6.2%.
What is the Percentage of Households Without a Vehicle in the United States?
Percentage of Households Without a Vehicle in the United States is 8.3%.