Zip Codes with the Highest Percentage of Households Without a Vehicle in Indianapolis, IN
RELATED REPORTS & OPTIONS
Households without a Cars
Indianapolis
Compare Zip Codes
Map of Zip Codes with the Highest Percentage of Households Without a Vehicle in Indianapolis
0.50%
19.2%
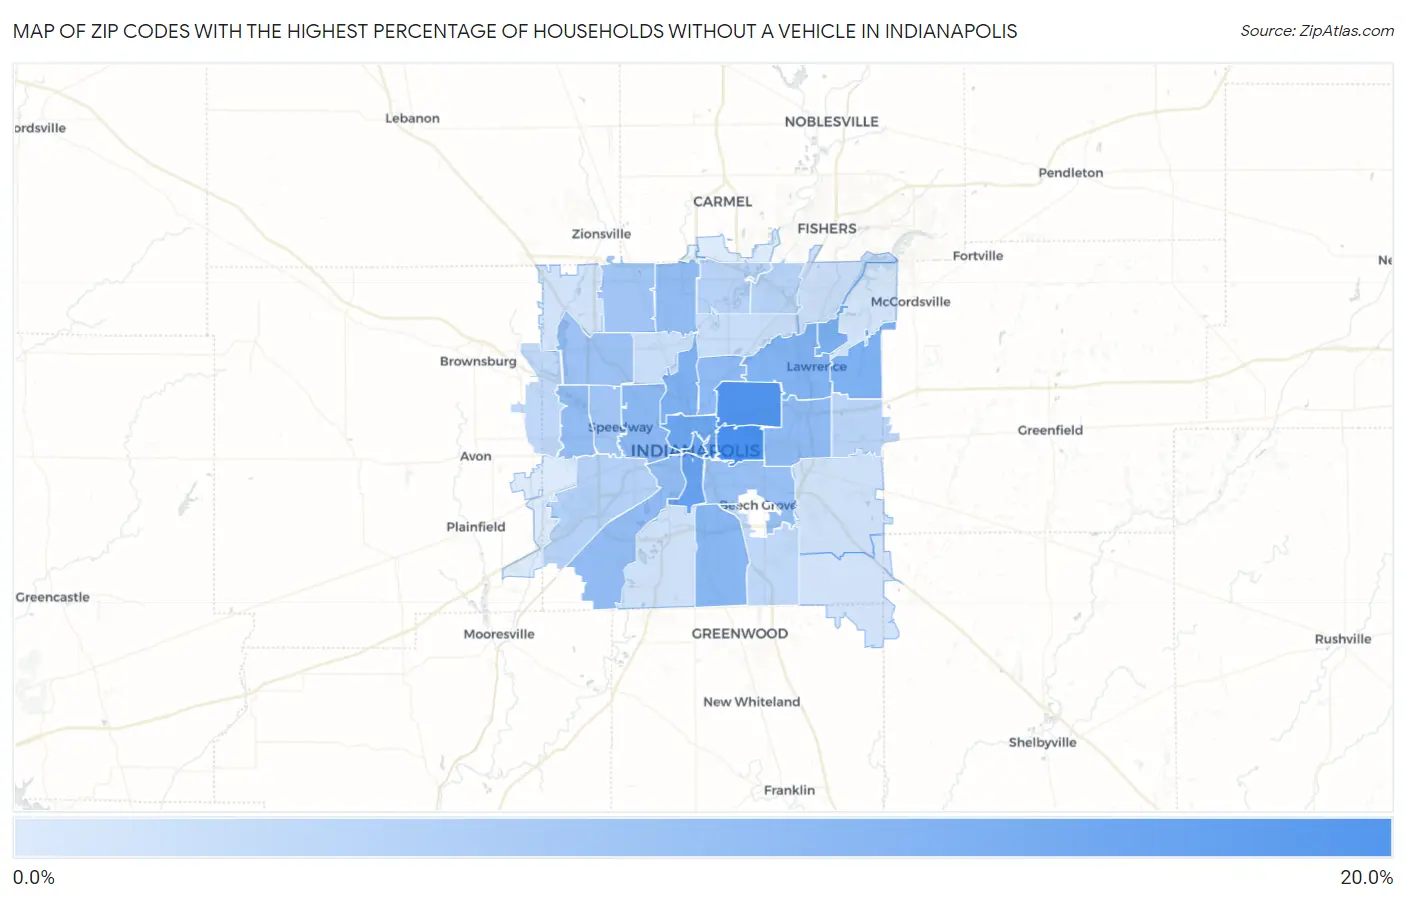
Zip Codes with the Highest Percentage of Households Without a Vehicle in Indianapolis, IN
| Zip Code | Housholds Without a Car | vs State | vs National | |
| 1. | 46201 | 19.2% | 6.2%(+13.0)#31 | 8.3%(+10.9)#1,606 |
| 2. | 46218 | 18.3% | 6.2%(+12.1)#34 | 8.3%(+10.00)#1,734 |
| 3. | 46225 | 14.8% | 6.2%(+8.60)#46 | 8.3%(+6.50)#2,447 |
| 4. | 46202 | 14.2% | 6.2%(+8.00)#49 | 8.3%(+5.90)#2,629 |
| 5. | 46204 | 13.9% | 6.2%(+7.70)#53 | 8.3%(+5.60)#2,734 |
| 6. | 46235 | 12.3% | 6.2%(+6.10)#62 | 8.3%(+4.00)#3,410 |
| 7. | 46216 | 12.1% | 6.2%(+5.90)#68 | 8.3%(+3.80)#3,531 |
| 8. | 46208 | 11.8% | 6.2%(+5.60)#69 | 8.3%(+3.50)#3,667 |
| 9. | 46226 | 11.6% | 6.2%(+5.40)#70 | 8.3%(+3.30)#3,752 |
| 10. | 46227 | 10.7% | 6.2%(+4.50)#82 | 8.3%(+2.40)#4,297 |
| 11. | 46222 | 10.4% | 6.2%(+4.20)#86 | 8.3%(+2.10)#4,522 |
| 12. | 46219 | 10.0% | 6.2%(+3.80)#90 | 8.3%(+1.70)#4,844 |
| 13. | 46205 | 9.9% | 6.2%(+3.70)#91 | 8.3%(+1.60)#4,936 |
| 14. | 46221 | 9.7% | 6.2%(+3.50)#97 | 8.3%(+1.40)#5,104 |
| 15. | 46260 | 9.5% | 6.2%(+3.30)#101 | 8.3%(+1.20)#5,255 |
| 16. | 46214 | 9.5% | 6.2%(+3.30)#104 | 8.3%(+1.20)#5,267 |
| 17. | 46203 | 8.7% | 6.2%(+2.50)#124 | 8.3%(+0.400)#6,060 |
| 18. | 46254 | 8.5% | 6.2%(+2.30)#129 | 8.3%(+0.200)#6,305 |
| 19. | 46268 | 7.7% | 6.2%(+1.50)#151 | 8.3%(-0.600)#7,388 |
| 20. | 46224 | 7.5% | 6.2%(+1.30)#155 | 8.3%(-0.800)#7,686 |
| 21. | 46241 | 5.3% | 6.2%(-0.900)#254 | 8.3%(-3.00)#12,083 |
| 22. | 46250 | 5.0% | 6.2%(-1.20)#271 | 8.3%(-3.30)#12,895 |
| 23. | 46240 | 4.9% | 6.2%(-1.30)#274 | 8.3%(-3.40)#13,134 |
| 24. | 46229 | 4.8% | 6.2%(-1.40)#279 | 8.3%(-3.50)#13,363 |
| 25. | 46234 | 4.1% | 6.2%(-2.10)#336 | 8.3%(-4.20)#15,402 |
| 26. | 46237 | 4.0% | 6.2%(-2.20)#342 | 8.3%(-4.30)#15,691 |
| 27. | 46220 | 2.9% | 6.2%(-3.30)#442 | 8.3%(-5.40)#19,388 |
| 28. | 46228 | 2.8% | 6.2%(-3.40)#454 | 8.3%(-5.50)#19,790 |
| 29. | 46256 | 2.7% | 6.2%(-3.50)#466 | 8.3%(-5.60)#20,116 |
| 30. | 46217 | 2.2% | 6.2%(-4.00)#501 | 8.3%(-6.10)#21,719 |
| 31. | 46239 | 2.1% | 6.2%(-4.10)#508 | 8.3%(-6.20)#22,054 |
| 32. | 46278 | 1.9% | 6.2%(-4.30)#528 | 8.3%(-6.40)#22,840 |
| 33. | 46259 | 1.7% | 6.2%(-4.50)#552 | 8.3%(-6.60)#23,482 |
| 34. | 46236 | 1.5% | 6.2%(-4.70)#567 | 8.3%(-6.80)#24,106 |
| 35. | 46280 | 0.60% | 6.2%(-5.60)#629 | 8.3%(-7.70)#26,599 |
| 36. | 46231 | 0.50% | 6.2%(-5.70)#638 | 8.3%(-7.80)#26,810 |
1
Common Questions
What are the Top 10 Zip Codes with the Highest Percentage of Households Without a Vehicle in Indianapolis, IN?
Top 10 Zip Codes with the Highest Percentage of Households Without a Vehicle in Indianapolis, IN are:
What zip code has the Highest Percentage of Households Without a Vehicle in Indianapolis, IN?
46201 has the Highest Percentage of Households Without a Vehicle in Indianapolis, IN with 19.2%.
What is the Percentage of Households Without a Vehicle in Indianapolis, IN?
Percentage of Households Without a Vehicle in Indianapolis is 8.5%.
What is the Percentage of Households Without a Vehicle in Indiana?
Percentage of Households Without a Vehicle in Indiana is 6.2%.
What is the Percentage of Households Without a Vehicle in the United States?
Percentage of Households Without a Vehicle in the United States is 8.3%.