Zip Codes with the Highest Percentage of Population Employed in Computer & Mathematics in Georgia
RELATED REPORTS & OPTIONS
Computer & Mathematics
Georgia
Compare Zip Codes
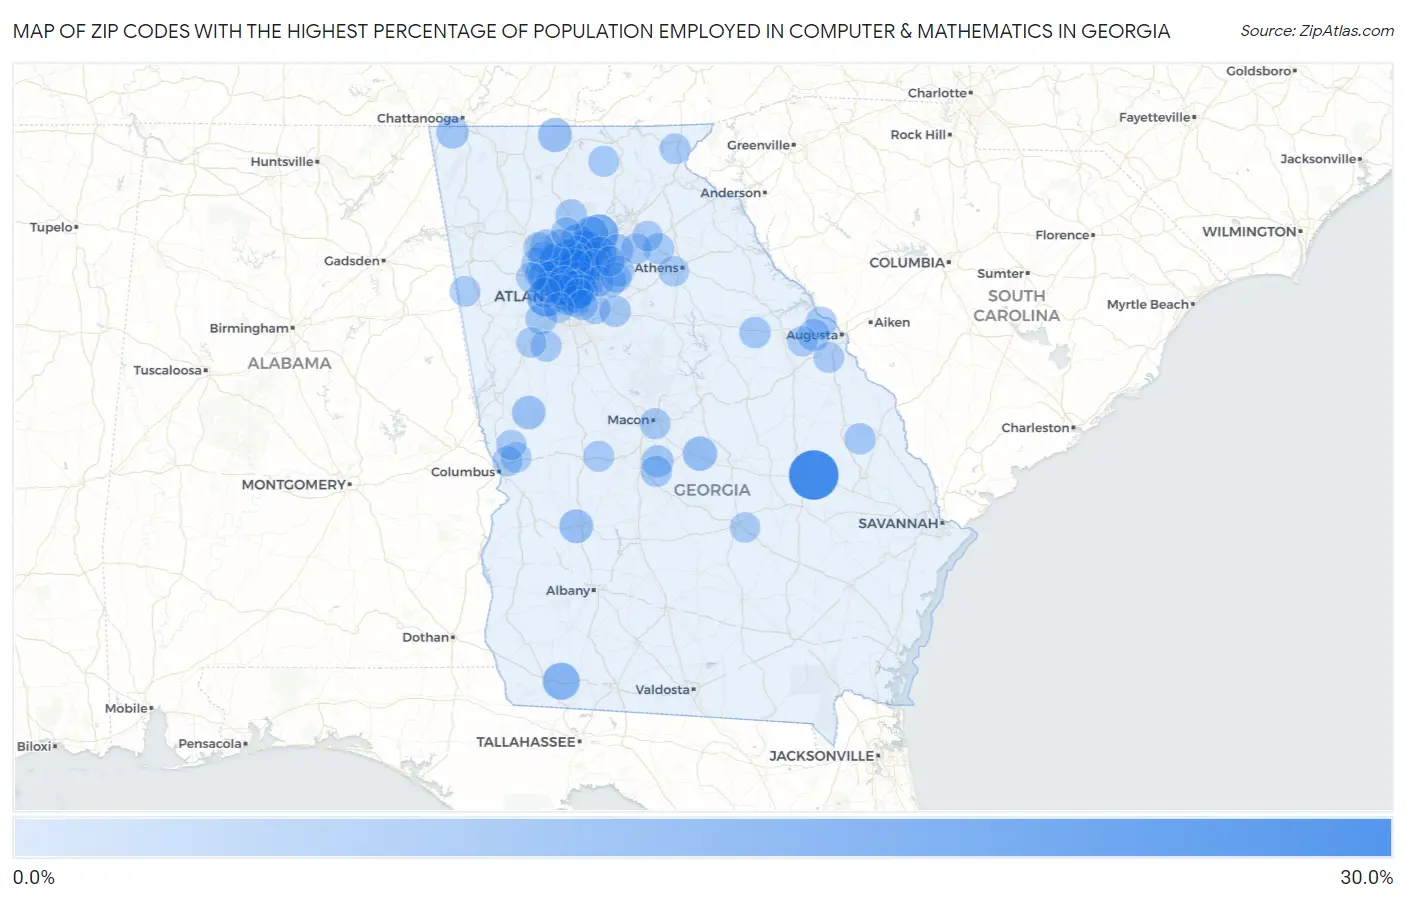
Map of Zip Codes with the Highest Percentage of Population Employed in Computer & Mathematics in Georgia
0.0%
30.0%
Zip Codes with the Highest Percentage of Population Employed in Computer & Mathematics in Georgia
| Zip Code | % Employed | vs State | vs National | |
| 1. | 30464 | 28.7% | 3.7%(+25.1)#1 | 3.5%(+25.2)#59 |
| 2. | 30041 | 15.3% | 3.7%(+11.6)#2 | 3.5%(+11.7)#243 |
| 3. | 30005 | 14.8% | 3.7%(+11.2)#3 | 3.5%(+11.3)#262 |
| 4. | 30346 | 14.3% | 3.7%(+10.6)#4 | 3.5%(+10.7)#290 |
| 5. | 30336 | 14.2% | 3.7%(+10.5)#5 | 3.5%(+10.6)#294 |
| 6. | 39834 | 12.6% | 3.7%(+8.95)#6 | 3.5%(+9.08)#390 |
| 7. | 30022 | 12.2% | 3.7%(+8.59)#7 | 3.5%(+8.72)#417 |
| 8. | 30338 | 12.0% | 3.7%(+8.37)#8 | 3.5%(+8.50)#436 |
| 9. | 30004 | 11.7% | 3.7%(+8.09)#9 | 3.5%(+8.23)#475 |
| 10. | 30328 | 10.9% | 3.7%(+7.29)#10 | 3.5%(+7.42)#563 |
| 11. | 30097 | 10.5% | 3.7%(+6.83)#11 | 3.5%(+6.96)#633 |
| 12. | 30324 | 10.3% | 3.7%(+6.67)#12 | 3.5%(+6.80)#659 |
| 13. | 30040 | 9.5% | 3.7%(+5.82)#13 | 3.5%(+5.95)#807 |
| 14. | 30024 | 9.2% | 3.7%(+5.58)#14 | 3.5%(+5.71)#845 |
| 15. | 30339 | 9.1% | 3.7%(+5.44)#15 | 3.5%(+5.58)#883 |
| 16. | 30308 | 9.1% | 3.7%(+5.44)#16 | 3.5%(+5.58)#885 |
| 17. | 31003 | 9.1% | 3.7%(+5.43)#17 | 3.5%(+5.57)#888 |
| 18. | 30309 | 9.0% | 3.7%(+5.37)#18 | 3.5%(+5.50)#897 |
| 19. | 30080 | 9.0% | 3.7%(+5.30)#19 | 3.5%(+5.43)#912 |
| 20. | 30068 | 8.8% | 3.7%(+5.19)#20 | 3.5%(+5.32)#941 |
| 21. | 30326 | 8.8% | 3.7%(+5.16)#21 | 3.5%(+5.29)#949 |
| 22. | 30312 | 8.7% | 3.7%(+5.04)#22 | 3.5%(+5.17)#996 |
| 23. | 30541 | 8.6% | 3.7%(+4.99)#23 | 3.5%(+5.12)#1,010 |
| 24. | 31719 | 8.5% | 3.7%(+4.81)#24 | 3.5%(+4.94)#1,063 |
| 25. | 30009 | 8.3% | 3.7%(+4.69)#25 | 3.5%(+4.82)#1,096 |
| 26. | 30332 | 8.1% | 3.7%(+4.49)#26 | 3.5%(+4.62)#1,166 |
| 27. | 31830 | 8.0% | 3.7%(+4.39)#27 | 3.5%(+4.52)#1,195 |
| 28. | 30033 | 7.8% | 3.7%(+4.18)#28 | 3.5%(+4.32)#1,265 |
| 29. | 30319 | 7.6% | 3.7%(+3.90)#29 | 3.5%(+4.03)#1,372 |
| 30. | 30313 | 7.4% | 3.7%(+3.74)#30 | 3.5%(+3.87)#1,433 |
| 31. | 30307 | 7.3% | 3.7%(+3.69)#31 | 3.5%(+3.82)#1,444 |
| 32. | 30317 | 7.3% | 3.7%(+3.66)#32 | 3.5%(+3.79)#1,458 |
| 33. | 30092 | 7.1% | 3.7%(+3.48)#33 | 3.5%(+3.61)#1,554 |
| 34. | 30306 | 7.0% | 3.7%(+3.31)#34 | 3.5%(+3.45)#1,640 |
| 35. | 30062 | 6.9% | 3.7%(+3.26)#35 | 3.5%(+3.40)#1,668 |
| 36. | 30067 | 6.8% | 3.7%(+3.12)#36 | 3.5%(+3.26)#1,744 |
| 37. | 30345 | 6.7% | 3.7%(+3.05)#37 | 3.5%(+3.18)#1,796 |
| 38. | 30750 | 6.7% | 3.7%(+3.03)#38 | 3.5%(+3.16)#1,802 |
| 39. | 30076 | 6.5% | 3.7%(+2.88)#39 | 3.5%(+3.01)#1,905 |
| 40. | 30078 | 6.5% | 3.7%(+2.80)#40 | 3.5%(+2.94)#1,963 |
| 41. | 30084 | 6.4% | 3.7%(+2.78)#41 | 3.5%(+2.91)#1,975 |
| 42. | 30341 | 6.4% | 3.7%(+2.76)#42 | 3.5%(+2.90)#1,989 |
| 43. | 30152 | 6.4% | 3.7%(+2.76)#43 | 3.5%(+2.89)#1,993 |
| 44. | 30363 | 6.4% | 3.7%(+2.74)#44 | 3.5%(+2.87)#2,003 |
| 45. | 30064 | 6.4% | 3.7%(+2.70)#45 | 3.5%(+2.83)#2,040 |
| 46. | 31005 | 6.3% | 3.7%(+2.63)#46 | 3.5%(+2.76)#2,092 |
| 47. | 30519 | 6.1% | 3.7%(+2.49)#47 | 3.5%(+2.62)#2,190 |
| 48. | 30082 | 6.1% | 3.7%(+2.47)#48 | 3.5%(+2.60)#2,202 |
| 49. | 30813 | 6.1% | 3.7%(+2.46)#49 | 3.5%(+2.59)#2,210 |
| 50. | 30075 | 6.1% | 3.7%(+2.42)#50 | 3.5%(+2.55)#2,245 |
| 51. | 30096 | 6.0% | 3.7%(+2.38)#51 | 3.5%(+2.51)#2,285 |
| 52. | 30144 | 5.9% | 3.7%(+2.23)#52 | 3.5%(+2.37)#2,415 |
| 53. | 30350 | 5.9% | 3.7%(+2.22)#53 | 3.5%(+2.35)#2,432 |
| 54. | 30188 | 5.8% | 3.7%(+2.13)#54 | 3.5%(+2.27)#2,504 |
| 55. | 30305 | 5.8% | 3.7%(+2.12)#55 | 3.5%(+2.25)#2,514 |
| 56. | 30329 | 5.8% | 3.7%(+2.11)#56 | 3.5%(+2.24)#2,526 |
| 57. | 30107 | 5.7% | 3.7%(+2.07)#57 | 3.5%(+2.21)#2,556 |
| 58. | 30079 | 5.7% | 3.7%(+2.04)#58 | 3.5%(+2.18)#2,590 |
| 59. | 31047 | 5.7% | 3.7%(+2.00)#59 | 3.5%(+2.13)#2,630 |
| 60. | 30821 | 5.6% | 3.7%(+1.98)#60 | 3.5%(+2.11)#2,647 |
| 61. | 30213 | 5.6% | 3.7%(+1.94)#61 | 3.5%(+2.07)#2,682 |
| 62. | 30008 | 5.5% | 3.7%(+1.88)#62 | 3.5%(+2.01)#2,747 |
| 63. | 30455 | 5.4% | 3.7%(+1.78)#63 | 3.5%(+1.91)#2,855 |
| 64. | 30013 | 5.4% | 3.7%(+1.74)#64 | 3.5%(+1.87)#2,902 |
| 65. | 30066 | 5.4% | 3.7%(+1.72)#65 | 3.5%(+1.86)#2,912 |
| 66. | 30126 | 5.3% | 3.7%(+1.60)#66 | 3.5%(+1.73)#3,069 |
| 67. | 30316 | 5.2% | 3.7%(+1.55)#67 | 3.5%(+1.69)#3,113 |
| 68. | 30809 | 5.2% | 3.7%(+1.54)#68 | 3.5%(+1.68)#3,124 |
| 69. | 30318 | 5.1% | 3.7%(+1.47)#69 | 3.5%(+1.60)#3,203 |
| 70. | 30189 | 5.1% | 3.7%(+1.45)#70 | 3.5%(+1.59)#3,217 |
| 71. | 30549 | 5.1% | 3.7%(+1.44)#71 | 3.5%(+1.57)#3,235 |
| 72. | 31201 | 5.0% | 3.7%(+1.35)#72 | 3.5%(+1.48)#3,344 |
| 73. | 30572 | 4.9% | 3.7%(+1.29)#73 | 3.5%(+1.42)#3,427 |
| 74. | 30045 | 4.9% | 3.7%(+1.27)#74 | 3.5%(+1.40)#3,465 |
| 75. | 31076 | 4.9% | 3.7%(+1.25)#75 | 3.5%(+1.38)#3,493 |
| 76. | 30327 | 4.9% | 3.7%(+1.24)#76 | 3.5%(+1.37)#3,511 |
| 77. | 30269 | 4.8% | 3.7%(+1.10)#77 | 3.5%(+1.23)#3,705 |
| 78. | 30548 | 4.7% | 3.7%(+1.07)#78 | 3.5%(+1.20)#3,755 |
| 79. | 30038 | 4.7% | 3.7%(+1.03)#79 | 3.5%(+1.16)#3,809 |
| 80. | 30567 | 4.6% | 3.7%(+0.984)#80 | 3.5%(+1.12)#3,880 |
| 81. | 30815 | 4.6% | 3.7%(+0.968)#81 | 3.5%(+1.10)#3,909 |
| 82. | 30576 | 4.6% | 3.7%(+0.955)#82 | 3.5%(+1.09)#3,927 |
| 83. | 30168 | 4.6% | 3.7%(+0.938)#83 | 3.5%(+1.07)#3,954 |
| 84. | 30047 | 4.6% | 3.7%(+0.928)#84 | 3.5%(+1.06)#3,968 |
| 85. | 30102 | 4.4% | 3.7%(+0.778)#85 | 3.5%(+0.910)#4,215 |
| 86. | 30017 | 4.4% | 3.7%(+0.773)#86 | 3.5%(+0.904)#4,220 |
| 87. | 30606 | 4.4% | 3.7%(+0.766)#87 | 3.5%(+0.898)#4,234 |
| 88. | 30814 | 4.4% | 3.7%(+0.758)#88 | 3.5%(+0.890)#4,246 |
| 89. | 30176 | 4.3% | 3.7%(+0.693)#89 | 3.5%(+0.825)#4,344 |
| 90. | 31083 | 4.3% | 3.7%(+0.691)#90 | 3.5%(+0.823)#4,349 |
| 91. | 30030 | 4.3% | 3.7%(+0.683)#91 | 3.5%(+0.814)#4,365 |
| 92. | 31820 | 4.3% | 3.7%(+0.658)#92 | 3.5%(+0.789)#4,406 |
| 93. | 30034 | 4.3% | 3.7%(+0.645)#93 | 3.5%(+0.777)#4,430 |
| 94. | 30043 | 4.3% | 3.7%(+0.639)#94 | 3.5%(+0.771)#4,442 |
| 95. | 31909 | 4.3% | 3.7%(+0.637)#95 | 3.5%(+0.768)#4,446 |
| 96. | 30344 | 4.3% | 3.7%(+0.636)#96 | 3.5%(+0.767)#4,449 |
| 97. | 30115 | 4.3% | 3.7%(+0.618)#97 | 3.5%(+0.749)#4,475 |
| 98. | 30127 | 4.2% | 3.7%(+0.582)#98 | 3.5%(+0.714)#4,539 |
| 99. | 30265 | 4.2% | 3.7%(+0.531)#99 | 3.5%(+0.663)#4,632 |
| 100. | 31804 | 4.2% | 3.7%(+0.514)#100 | 3.5%(+0.646)#4,669 |
Common Questions
What are the Top 10 Zip Codes with the Highest Percentage of Population Employed in Computer & Mathematics in Georgia?
Top 10 Zip Codes with the Highest Percentage of Population Employed in Computer & Mathematics in Georgia are:
What zip code has the Highest Percentage of Population Employed in Computer & Mathematics in Georgia?
30464 has the Highest Percentage of Population Employed in Computer & Mathematics in Georgia with 28.7%.
What is the Percentage of Population Employed in Computer & Mathematics in the State of Georgia?
Percentage of Population Employed in Computer & Mathematics in Georgia is 3.7%.
What is the Percentage of Population Employed in Computer & Mathematics in the United States?
Percentage of Population Employed in Computer & Mathematics in the United States is 3.5%.