Epworth, GA Map & Demographics
Epworth Map
Epworth Overview
$38,766
PER CAPITA INCOME
$88,780
AVG FAMILY INCOME
$69,329
AVG HOUSEHOLD INCOME
0.17
INEQUALITY / GINI INDEX
575
TOTAL POPULATION
336
MALE POPULATION
239
FEMALE POPULATION
140.59
MALES / 100 FEMALES
71.13
FEMALES / 100 MALES
27.6
MEDIAN AGE
3.4
AVG FAMILY SIZE
1.8
AVG HOUSEHOLD SIZE
374
LABOR FORCE [ PEOPLE ]
79.7%
PERCENT IN LABOR FORCE
Epworth Zip Codes
Epworth Area Codes
Income in Epworth
Income Overview in Epworth
Per Capita Income in Epworth is $38,766, while median incomes of families and households are $88,780 and $69,329 respectively.
| Characteristic | Number | Measure |
| Per Capita Income | 575 | $38,766 |
| Median Family Income | 107 | $88,780 |
| Mean Family Income | 107 | $83,544 |
| Median Household Income | 317 | $69,329 |
| Mean Household Income | 317 | $70,202 |
| Income Deficit | 107 | $0 |
| Wage / Income Gap (%) | 575 | 0.00% |
| Wage / Income Gap ($) | 575 | 100.00¢ per $1 |
| Gini / Inequality Index | 575 | 0.17 |
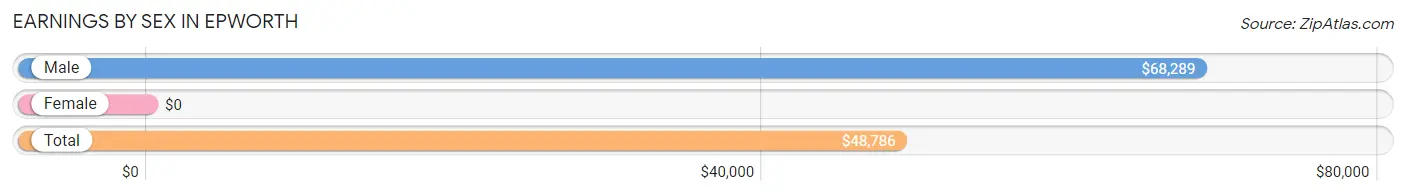
Earnings by Sex in Epworth
| Sex | Number | Average Earnings |
| Male | 214 (57.2%) | $68,289 |
| Female | 160 (42.8%) | $0 |
| Total | 374 (100.0%) | $48,786 |
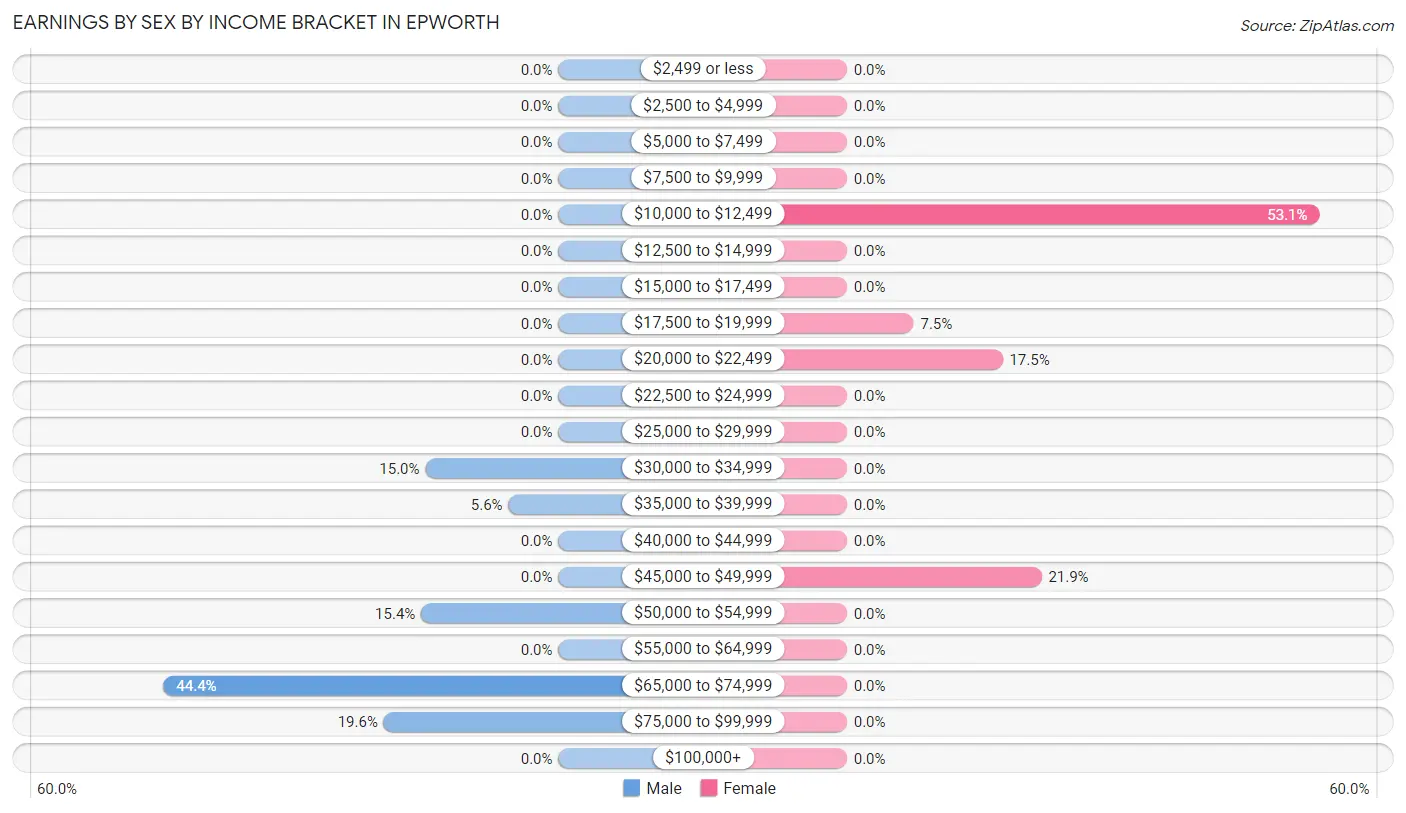
Earnings by Sex by Income Bracket in Epworth
The most common earnings brackets in Epworth are $65,000 to $74,999 for men (95 | 44.4%) and $10,000 to $12,499 for women (85 | 53.1%).
| Income | Male | Female |
| $2,499 or less | 0 (0.0%) | 0 (0.0%) |
| $2,500 to $4,999 | 0 (0.0%) | 0 (0.0%) |
| $5,000 to $7,499 | 0 (0.0%) | 0 (0.0%) |
| $7,500 to $9,999 | 0 (0.0%) | 0 (0.0%) |
| $10,000 to $12,499 | 0 (0.0%) | 85 (53.1%) |
| $12,500 to $14,999 | 0 (0.0%) | 0 (0.0%) |
| $15,000 to $17,499 | 0 (0.0%) | 0 (0.0%) |
| $17,500 to $19,999 | 0 (0.0%) | 12 (7.5%) |
| $20,000 to $22,499 | 0 (0.0%) | 28 (17.5%) |
| $22,500 to $24,999 | 0 (0.0%) | 0 (0.0%) |
| $25,000 to $29,999 | 0 (0.0%) | 0 (0.0%) |
| $30,000 to $34,999 | 32 (14.9%) | 0 (0.0%) |
| $35,000 to $39,999 | 12 (5.6%) | 0 (0.0%) |
| $40,000 to $44,999 | 0 (0.0%) | 0 (0.0%) |
| $45,000 to $49,999 | 0 (0.0%) | 35 (21.9%) |
| $50,000 to $54,999 | 33 (15.4%) | 0 (0.0%) |
| $55,000 to $64,999 | 0 (0.0%) | 0 (0.0%) |
| $65,000 to $74,999 | 95 (44.4%) | 0 (0.0%) |
| $75,000 to $99,999 | 42 (19.6%) | 0 (0.0%) |
| $100,000+ | 0 (0.0%) | 0 (0.0%) |
| Total | 214 (100.0%) | 160 (100.0%) |
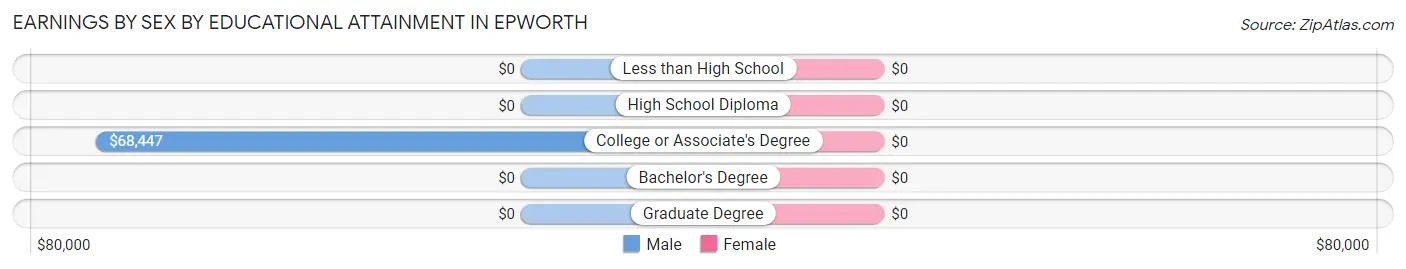
Earnings by Sex by Educational Attainment in Epworth
| Educational Attainment | Male Income | Female Income |
| Less than High School | - | - |
| High School Diploma | - | - |
| College or Associate's Degree | $68,447 | $0 |
| Bachelor's Degree | - | - |
| Graduate Degree | - | - |
| Total | $68,289 | $0 |
Family Income in Epworth
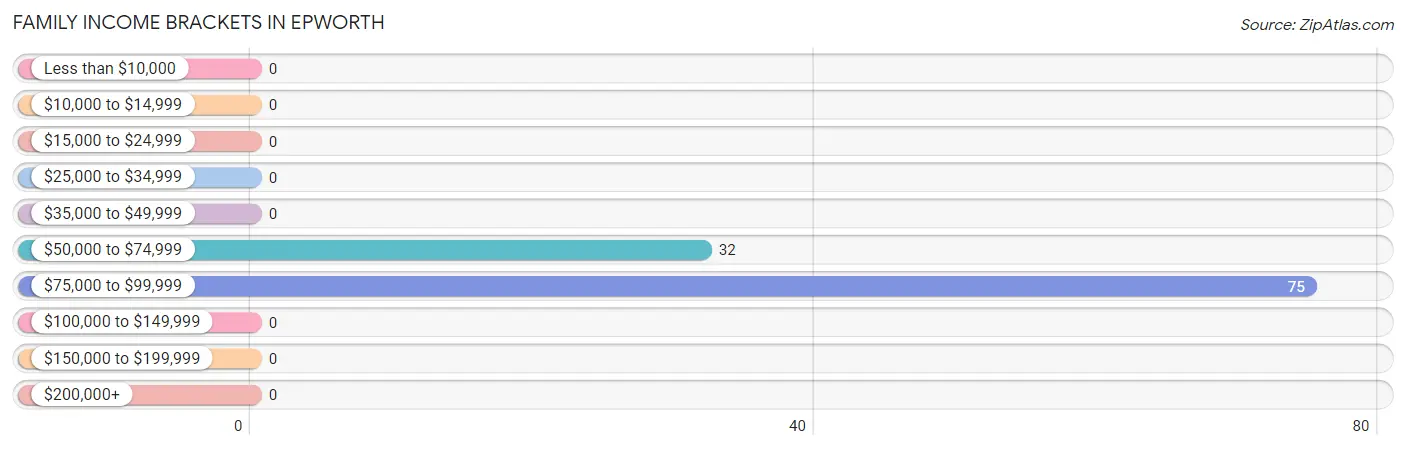
Family Income Brackets in Epworth
According to the Epworth family income data, there are 75 families falling into the $75,000 to $99,999 income range, which is the most common income bracket and makes up 70.1% of all families.
| Income Bracket | # Families | % Families |
| Less than $10,000 | 0 | 0.0% |
| $10,000 to $14,999 | 0 | 0.0% |
| $15,000 to $24,999 | 0 | 0.0% |
| $25,000 to $34,999 | 0 | 0.0% |
| $35,000 to $49,999 | 0 | 0.0% |
| $50,000 to $74,999 | 32 | 29.9% |
| $75,000 to $99,999 | 75 | 70.1% |
| $100,000 to $149,999 | 0 | 0.0% |
| $150,000 to $199,999 | 0 | 0.0% |
| $200,000+ | 0 | 0.0% |
Family Income by Famaliy Size in Epworth
| Income Bracket | # Families | Median Income |
| 2-Person Families | 33 (30.8%) | $0 |
| 3-Person Families | 32 (29.9%) | $0 |
| 4-Person Families | 42 (39.3%) | $0 |
| 5-Person Families | 0 (0.0%) | $0 |
| 6-Person Families | 0 (0.0%) | $0 |
| 7+ Person Families | 0 (0.0%) | $0 |
| Total | 107 (100.0%) | $88,780 |
Family Income by Number of Earners in Epworth
| Number of Earners | # Families | Median Income |
| No Earners | 0 (0.0%) | $0 |
| 1 Earner | 0 (0.0%) | $0 |
| 2 Earners | 75 (70.1%) | $0 |
| 3+ Earners | 32 (29.9%) | $0 |
| Total | 107 (100.0%) | $88,780 |
Household Income in Epworth
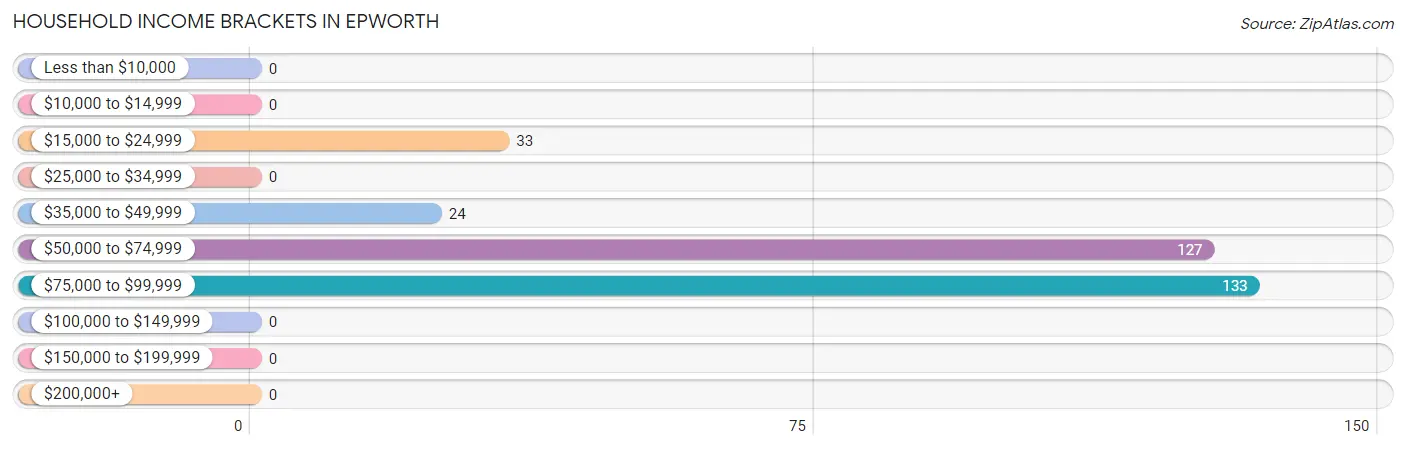
Household Income Brackets in Epworth
With 133 households falling in the category, the $75,000 to $99,999 income range is the most frequent in Epworth, accounting for 42.0% of all households.
| Income Bracket | # Households | % Households |
| Less than $10,000 | 0 | 0.0% |
| $10,000 to $14,999 | 0 | 0.0% |
| $15,000 to $24,999 | 33 | 10.4% |
| $25,000 to $34,999 | 0 | 0.0% |
| $35,000 to $49,999 | 24 | 7.6% |
| $50,000 to $74,999 | 127 | 40.1% |
| $75,000 to $99,999 | 133 | 42.0% |
| $100,000 to $149,999 | 0 | 0.0% |
| $150,000 to $199,999 | 0 | 0.0% |
| $200,000+ | 0 | 0.0% |
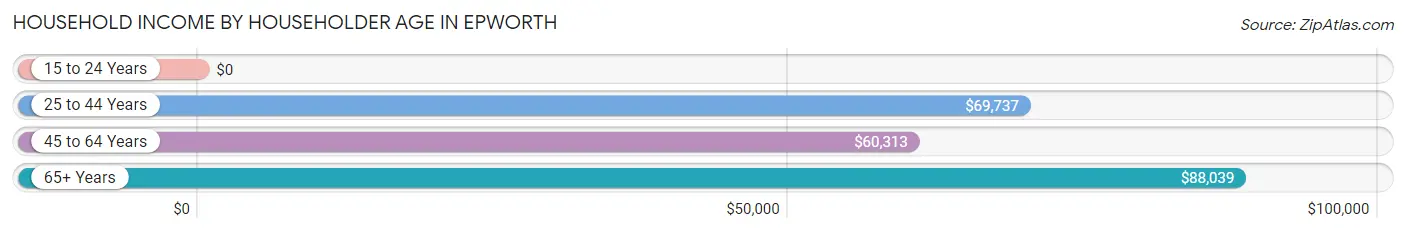
Household Income by Householder Age in Epworth
The median household income in Epworth is $69,329, with the highest median household income of $88,039 found in the 65+ years age bracket for the primary householder. A total of 91 households (28.7%) fall into this category.
| Income Bracket | # Households | Median Income |
| 15 to 24 Years | 0 (0.0%) | $0 |
| 25 to 44 Years | 170 (53.6%) | $69,737 |
| 45 to 64 Years | 56 (17.7%) | $60,313 |
| 65+ Years | 91 (28.7%) | $88,039 |
| Total | 317 (100.0%) | $69,329 |
Poverty in Epworth
Income Below Poverty by Sex and Age in Epworth
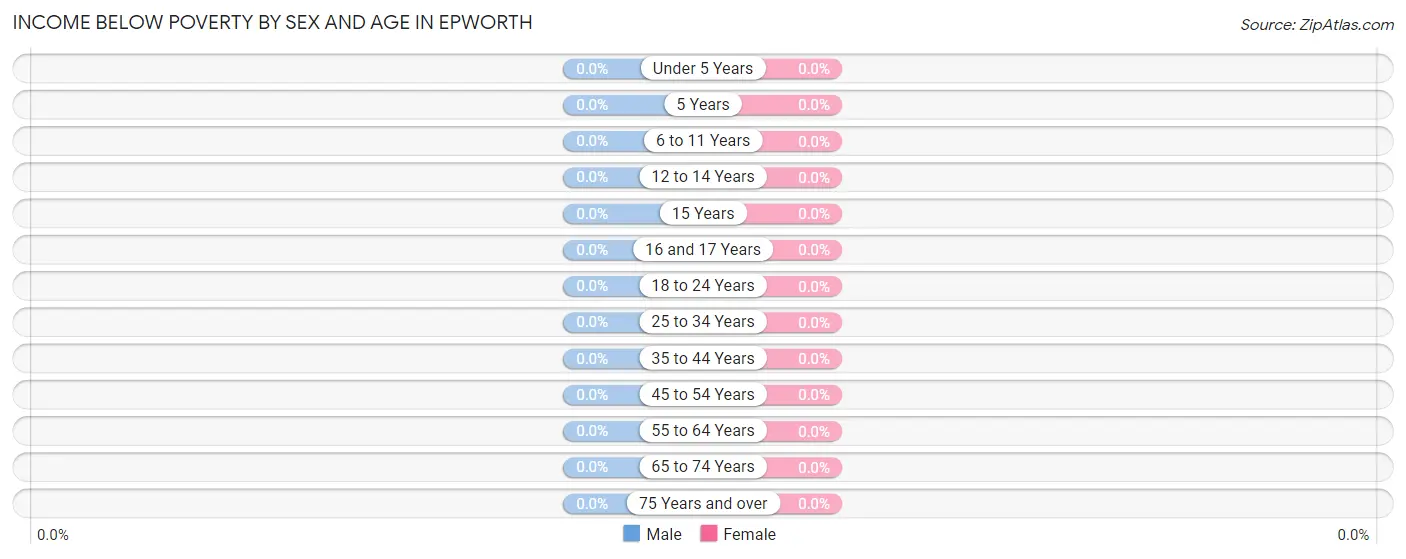
| Age Bracket | Male | Female |
| Under 5 Years | 0 (0.0%) | 0 (0.0%) |
| 5 Years | 0 (0.0%) | 0 (0.0%) |
| 6 to 11 Years | 0 (0.0%) | 0 (0.0%) |
| 12 to 14 Years | 0 (0.0%) | 0 (0.0%) |
| 15 Years | 0 (0.0%) | 0 (0.0%) |
| 16 and 17 Years | 0 (0.0%) | 0 (0.0%) |
| 18 to 24 Years | 0 (0.0%) | 0 (0.0%) |
| 25 to 34 Years | 0 (0.0%) | 0 (0.0%) |
| 35 to 44 Years | 0 (0.0%) | 0 (0.0%) |
| 45 to 54 Years | 0 (0.0%) | 0 (0.0%) |
| 55 to 64 Years | 0 (0.0%) | 0 (0.0%) |
| 65 to 74 Years | 0 (0.0%) | 0 (0.0%) |
| 75 Years and over | 0 (0.0%) | 0 (0.0%) |
| Total | 0 (0.0%) | 0 (0.0%) |
Income Above Poverty by Sex and Age in Epworth
According to the poverty statistics in Epworth, males aged under 5 years and females aged under 5 years are the age groups that are most secure financially, with 100.0% of males and 100.0% of females in these age groups living above the poverty line.
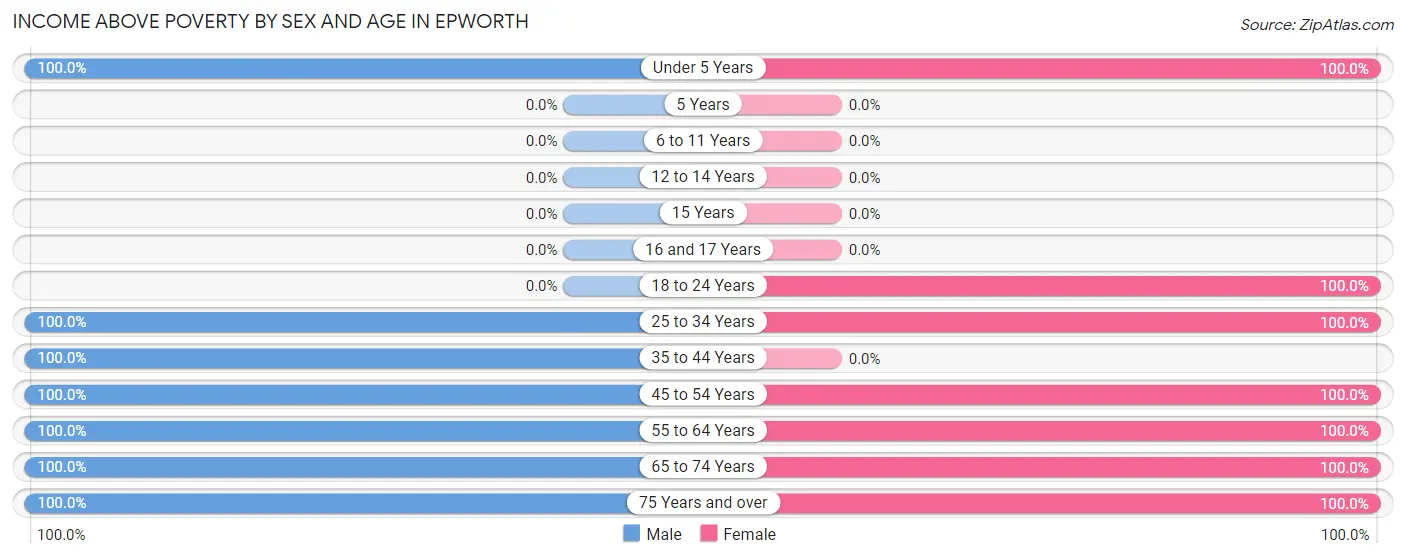
| Age Bracket | Male | Female |
| Under 5 Years | 53 (100.0%) | 53 (100.0%) |
| 5 Years | 0 (0.0%) | 0 (0.0%) |
| 6 to 11 Years | 0 (0.0%) | 0 (0.0%) |
| 12 to 14 Years | 0 (0.0%) | 0 (0.0%) |
| 15 Years | 0 (0.0%) | 0 (0.0%) |
| 16 and 17 Years | 0 (0.0%) | 0 (0.0%) |
| 18 to 24 Years | 0 (0.0%) | 85 (100.0%) |
| 25 to 34 Years | 137 (100.0%) | 35 (100.0%) |
| 35 to 44 Years | 33 (100.0%) | 0 (0.0%) |
| 45 to 54 Years | 32 (100.0%) | 28 (100.0%) |
| 55 to 64 Years | 12 (100.0%) | 12 (100.0%) |
| 65 to 74 Years | 11 (100.0%) | 4 (100.0%) |
| 75 Years and over | 58 (100.0%) | 22 (100.0%) |
| Total | 336 (100.0%) | 239 (100.0%) |
Income Below Poverty Among Married-Couple Families in Epworth
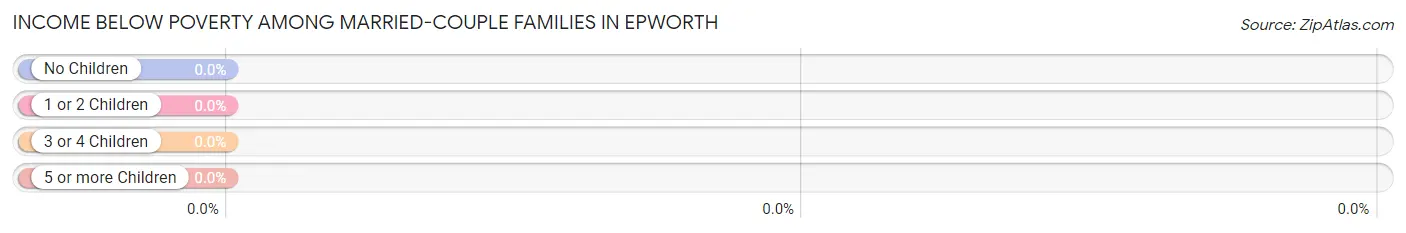
| Children | Above Poverty | Below Poverty |
| No Children | 65 (100.0%) | 0 (0.0%) |
| 1 or 2 Children | 42 (100.0%) | 0 (0.0%) |
| 3 or 4 Children | 0 (0.0%) | 0 (0.0%) |
| 5 or more Children | 0 (0.0%) | 0 (0.0%) |
| Total | 107 (100.0%) | 0 (0.0%) |
Income Below Poverty Among Single-Parent Households in Epworth
| Children | Single Father | Single Mother |
| No Children | 0 (0.0%) | 0 (0.0%) |
| 1 or 2 Children | 0 (0.0%) | 0 (0.0%) |
| 3 or 4 Children | 0 (0.0%) | 0 (0.0%) |
| 5 or more Children | 0 (0.0%) | 0 (0.0%) |
| Total | 0 (0.0%) | 0 (0.0%) |
Income Below Poverty Among Married-Couple vs Single-Parent Households in Epworth
| Children | Married-Couple Families | Single-Parent Households |
| No Children | 0 (0.0%) | 0 (0.0%) |
| 1 or 2 Children | 0 (0.0%) | 0 (0.0%) |
| 3 or 4 Children | 0 (0.0%) | 0 (0.0%) |
| 5 or more Children | 0 (0.0%) | 0 (0.0%) |
| Total | 0 (0.0%) | 0 (0.0%) |
Race in Epworth
The most populous races in Epworth are White / Caucasian (562 | 97.7%), Hispanic or Latino (152 | 26.4%), and Two or more Races (13 | 2.3%).
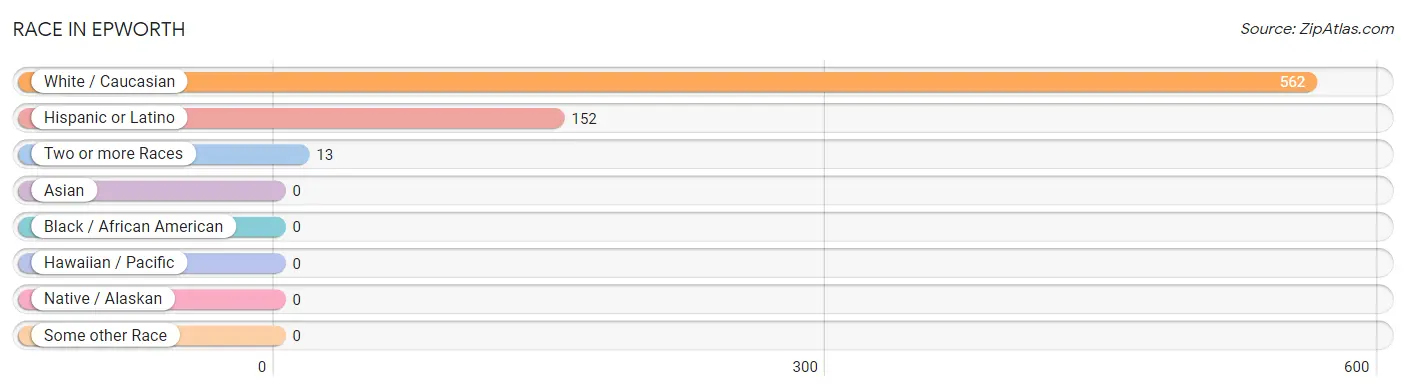
| Race | # Population | % Population |
| Asian | 0 | 0.0% |
| Black / African American | 0 | 0.0% |
| Hawaiian / Pacific | 0 | 0.0% |
| Hispanic or Latino | 152 | 26.4% |
| Native / Alaskan | 0 | 0.0% |
| White / Caucasian | 562 | 97.7% |
| Two or more Races | 13 | 2.3% |
| Some other Race | 0 | 0.0% |
| Total | 575 | 100.0% |
Ancestry in Epworth
The most populous ancestries reported in Epworth are English (232 | 40.4%), Mexican (152 | 26.4%), Scandinavian (56 | 9.7%), Irish (33 | 5.7%), and Eastern European (12 | 2.1%), together accounting for 84.4% of all Epworth residents.
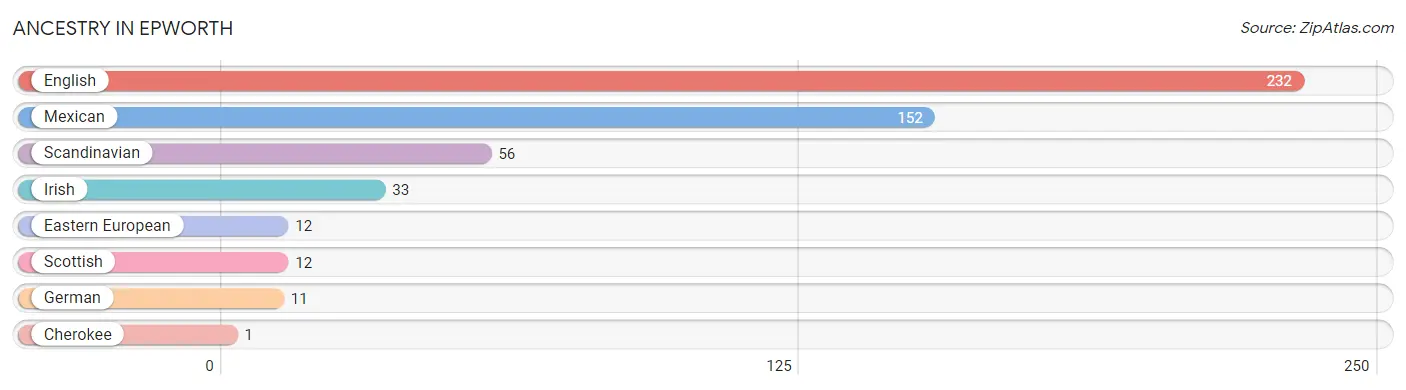
| Ancestry | # Population | % Population |
| Cherokee | 1 | 0.2% |
| Eastern European | 12 | 2.1% |
| English | 232 | 40.4% |
| German | 11 | 1.9% |
| Irish | 33 | 5.7% |
| Mexican | 152 | 26.4% |
| Scandinavian | 56 | 9.7% |
| Scottish | 12 | 2.1% | View All 8 Rows |
Immigrants in Epworth

| Immigration Origin | # Population | % Population | View All 0 Rows |
Sex and Age in Epworth
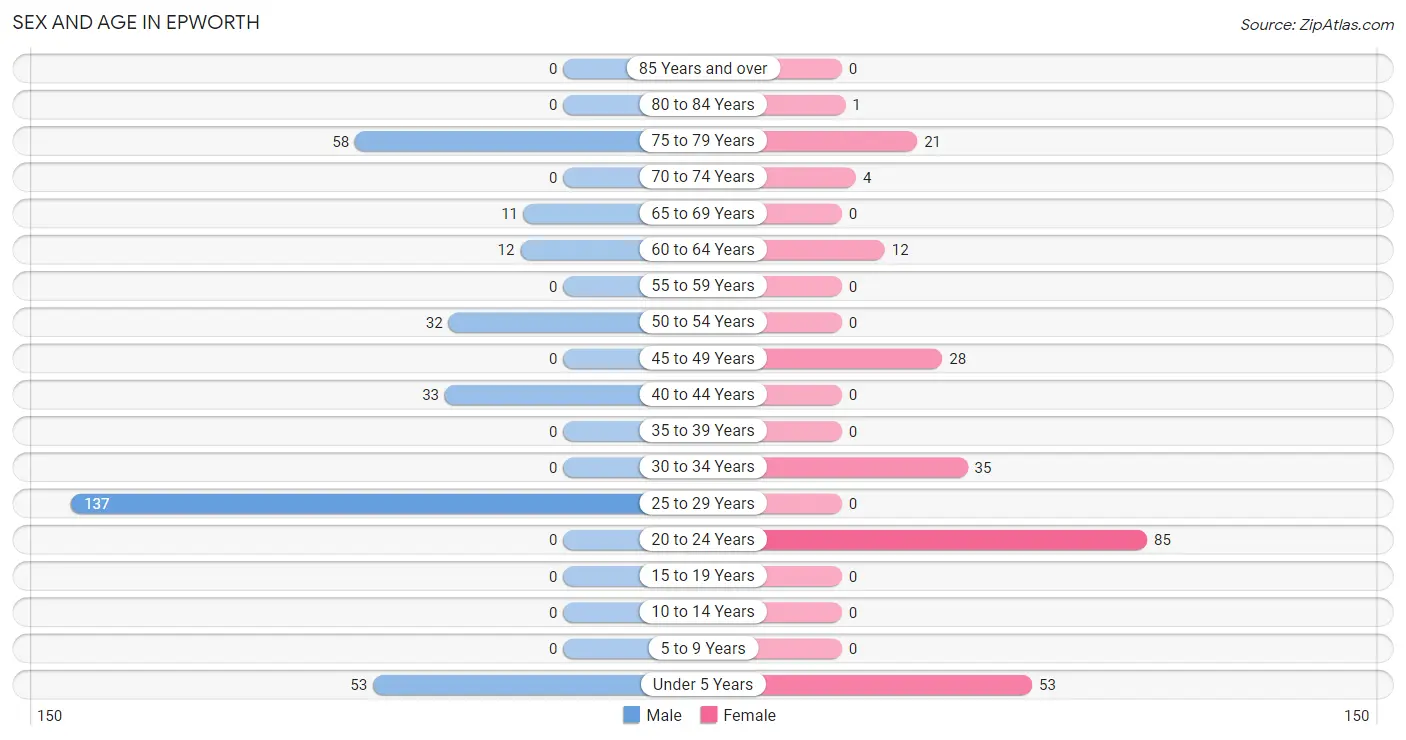
Sex and Age in Epworth
The most populous age groups in Epworth are 25 to 29 Years (137 | 40.8%) for men and 20 to 24 Years (85 | 35.6%) for women.
| Age Bracket | Male | Female |
| Under 5 Years | 53 (15.8%) | 53 (22.2%) |
| 5 to 9 Years | 0 (0.0%) | 0 (0.0%) |
| 10 to 14 Years | 0 (0.0%) | 0 (0.0%) |
| 15 to 19 Years | 0 (0.0%) | 0 (0.0%) |
| 20 to 24 Years | 0 (0.0%) | 85 (35.6%) |
| 25 to 29 Years | 137 (40.8%) | 0 (0.0%) |
| 30 to 34 Years | 0 (0.0%) | 35 (14.6%) |
| 35 to 39 Years | 0 (0.0%) | 0 (0.0%) |
| 40 to 44 Years | 33 (9.8%) | 0 (0.0%) |
| 45 to 49 Years | 0 (0.0%) | 28 (11.7%) |
| 50 to 54 Years | 32 (9.5%) | 0 (0.0%) |
| 55 to 59 Years | 0 (0.0%) | 0 (0.0%) |
| 60 to 64 Years | 12 (3.6%) | 12 (5.0%) |
| 65 to 69 Years | 11 (3.3%) | 0 (0.0%) |
| 70 to 74 Years | 0 (0.0%) | 4 (1.7%) |
| 75 to 79 Years | 58 (17.3%) | 21 (8.8%) |
| 80 to 84 Years | 0 (0.0%) | 1 (0.4%) |
| 85 Years and over | 0 (0.0%) | 0 (0.0%) |
| Total | 336 (100.0%) | 239 (100.0%) |
Families and Households in Epworth
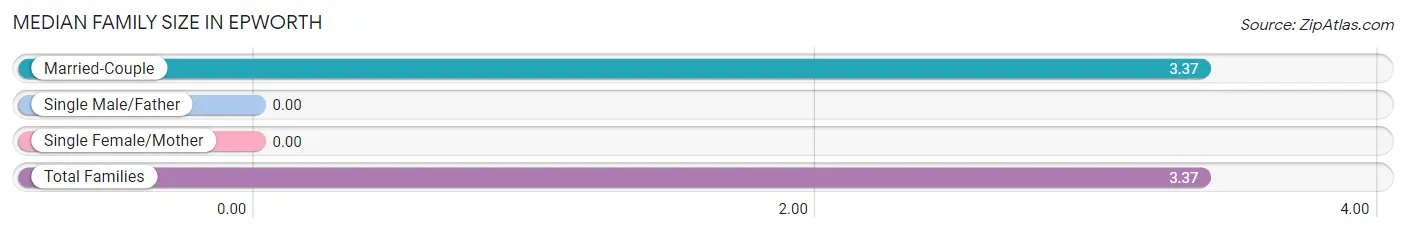
Median Family Size in Epworth
| Family Type | # Families | Family Size |
| Married-Couple | 107 (100.0%) | 3.37 |
| Single Male/Father | 0 (0.0%) | - |
| Single Female/Mother | 0 (0.0%) | - |
| Total Families | 107 (100.0%) | 3.37 |
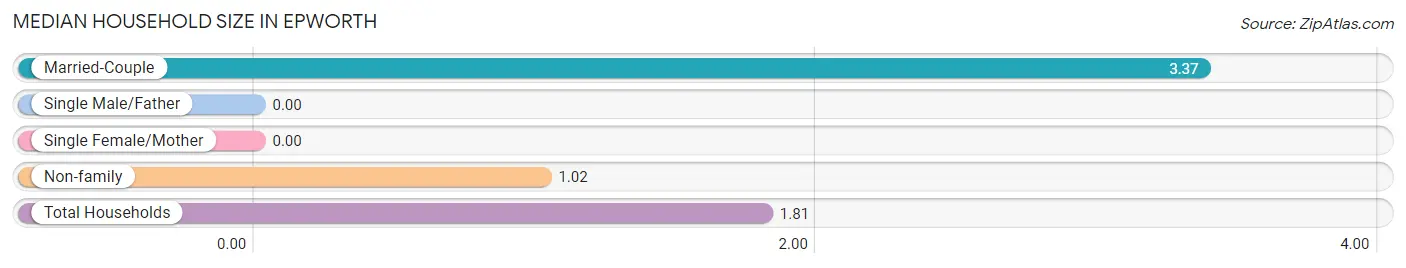
Median Household Size in Epworth
| Household Type | # Households | Household Size |
| Married-Couple | 107 (33.8%) | 3.37 |
| Single Male/Father | 0 (0.0%) | - |
| Single Female/Mother | 0 (0.0%) | - |
| Non-family | 210 (66.2%) | 1.02 |
| Total Households | 317 (100.0%) | 1.81 |
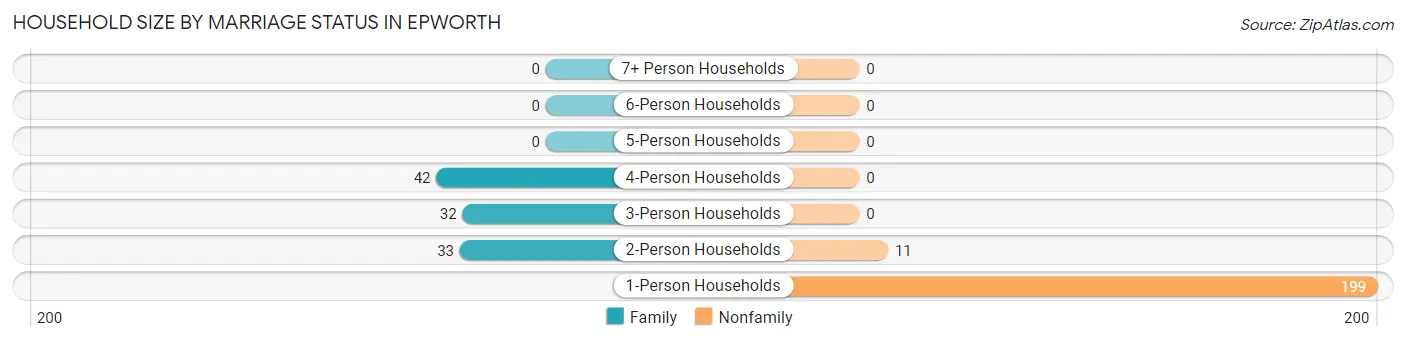
Household Size by Marriage Status in Epworth
Out of a total of 317 households in Epworth, 107 (33.8%) are family households, while 210 (66.2%) are nonfamily households. The most numerous type of family households are 4-person households, comprising 42, and the most common type of nonfamily households are 1-person households, comprising 199.
| Household Size | Family Households | Nonfamily Households |
| 1-Person Households | - | 199 (62.8%) |
| 2-Person Households | 33 (10.4%) | 11 (3.5%) |
| 3-Person Households | 32 (10.1%) | 0 (0.0%) |
| 4-Person Households | 42 (13.3%) | 0 (0.0%) |
| 5-Person Households | 0 (0.0%) | 0 (0.0%) |
| 6-Person Households | 0 (0.0%) | 0 (0.0%) |
| 7+ Person Households | 0 (0.0%) | 0 (0.0%) |
| Total | 107 (33.8%) | 210 (66.2%) |
Female Fertility in Epworth
Fertility by Age in Epworth
Average fertility rate in Epworth is 378.0 births per 1,000 women. Women in the age bracket of 20 to 34 years have the highest fertility rate with 467.0 births per 1,000 women. Women in the age bracket of 20 to 34 years acount for 100.0% of all women with births.
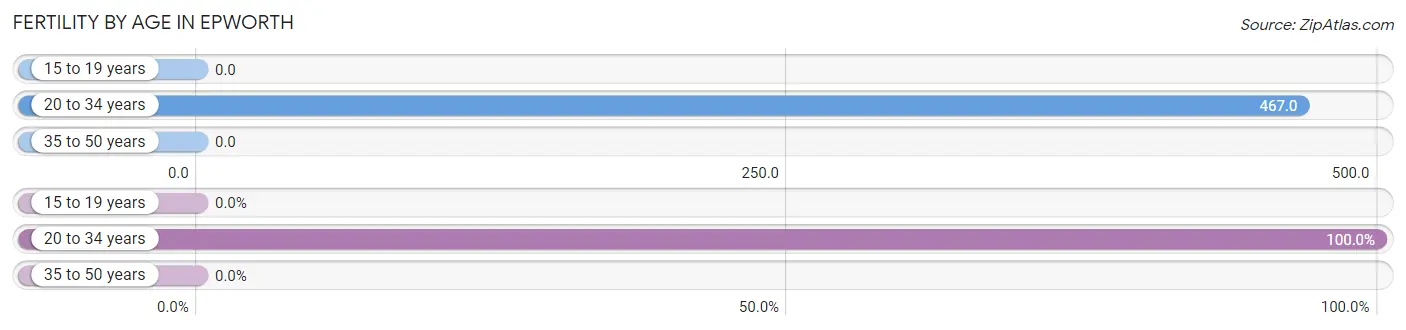
| Age Bracket | Women with Births | Births / 1,000 Women |
| 15 to 19 years | 0 (0.0%) | 0.0 |
| 20 to 34 years | 56 (100.0%) | 467.0 |
| 35 to 50 years | 0 (0.0%) | 0.0 |
| Total | 56 (100.0%) | 378.0 |
Fertility by Age by Marriage Status in Epworth
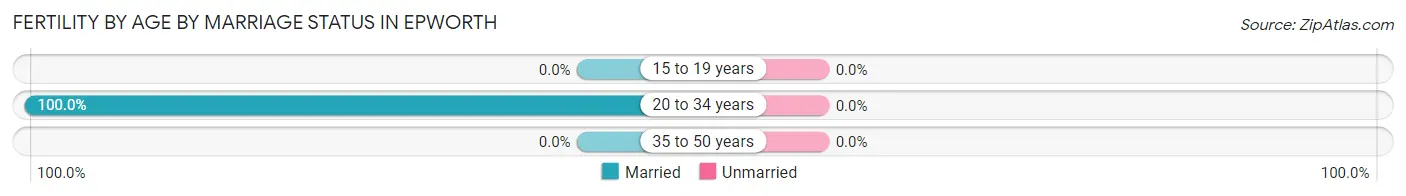
| Age Bracket | Married | Unmarried |
| 15 to 19 years | 0 (0.0%) | 0 (0.0%) |
| 20 to 34 years | 56 (100.0%) | 0 (0.0%) |
| 35 to 50 years | 0 (0.0%) | 0 (0.0%) |
| Total | 56 (100.0%) | 0 (0.0%) |
Fertility by Education in Epworth
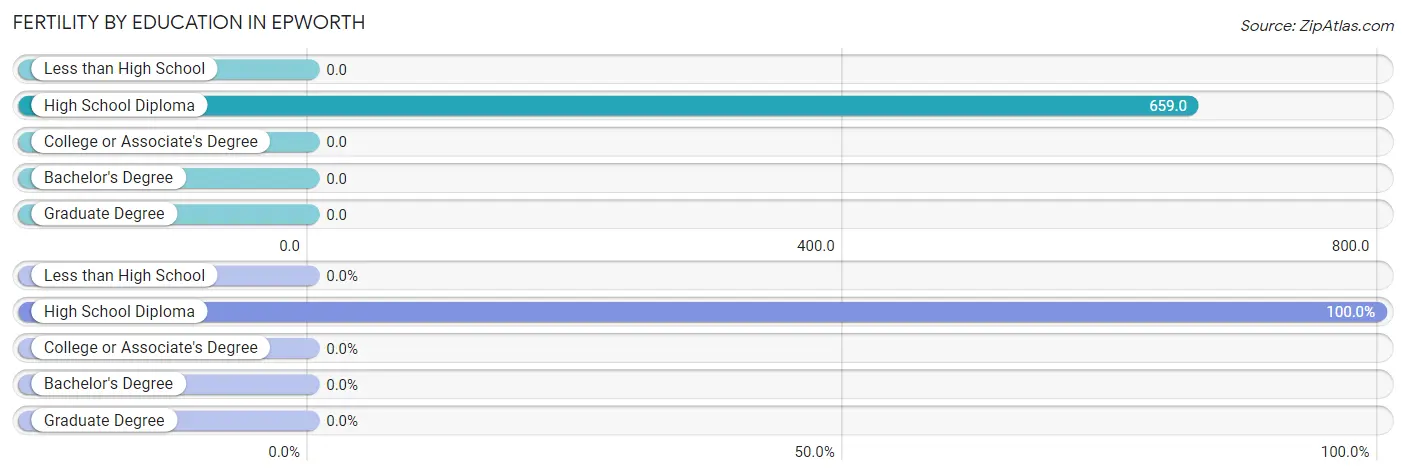
| Educational Attainment | Women with Births | Births / 1,000 Women |
| Less than High School | 0 (0.0%) | 0.0 |
| High School Diploma | 56 (100.0%) | 659.0 |
| College or Associate's Degree | 0 (0.0%) | 0.0 |
| Bachelor's Degree | 0 (0.0%) | 0.0 |
| Graduate Degree | 0 (0.0%) | 0.0 |
| Total | 56 (100.0%) | 378.0 |
Fertility by Education by Marriage Status in Epworth
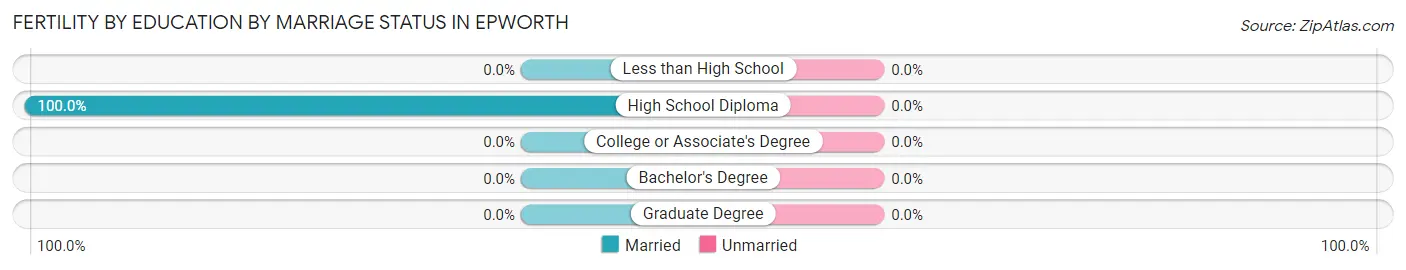
| Educational Attainment | Married | Unmarried |
| Less than High School | 0 (0.0%) | 0 (0.0%) |
| High School Diploma | 56 (100.0%) | 0 (0.0%) |
| College or Associate's Degree | 0 (0.0%) | 0 (0.0%) |
| Bachelor's Degree | 0 (0.0%) | 0 (0.0%) |
| Graduate Degree | 0 (0.0%) | 0 (0.0%) |
| Total | 56 (100.0%) | 0 (0.0%) |
Employment Characteristics in Epworth
Employment by Class of Employer in Epworth
Among the 374 employed individuals in Epworth, private company employees (318 | 85.0%), self-employed (not incorporated) (44 | 11.8%), and not-for-profit organizations (12 | 3.2%) make up the most common classes of employment.
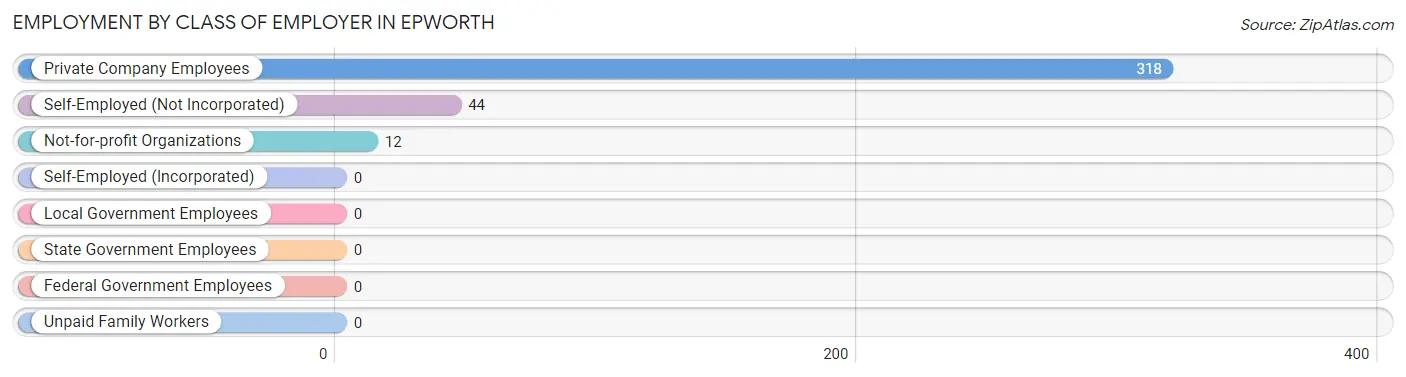
| Employer Class | # Employees | % Employees |
| Private Company Employees | 318 | 85.0% |
| Self-Employed (Incorporated) | 0 | 0.0% |
| Self-Employed (Not Incorporated) | 44 | 11.8% |
| Not-for-profit Organizations | 12 | 3.2% |
| Local Government Employees | 0 | 0.0% |
| State Government Employees | 0 | 0.0% |
| Federal Government Employees | 0 | 0.0% |
| Unpaid Family Workers | 0 | 0.0% |
| Total | 374 | 100.0% |
Employment Status by Age in Epworth
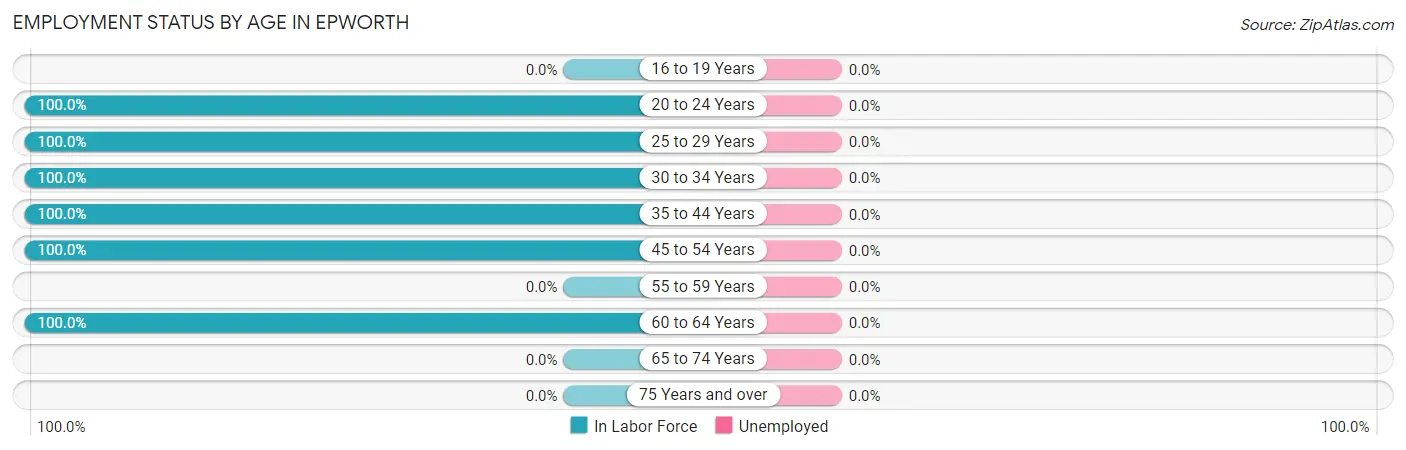
| Age Bracket | In Labor Force | Unemployed |
| 16 to 19 Years | 0 (0.0%) | 0 (0.0%) |
| 20 to 24 Years | 85 (100.0%) | 0 (0.0%) |
| 25 to 29 Years | 137 (100.0%) | 0 (0.0%) |
| 30 to 34 Years | 35 (100.0%) | 0 (0.0%) |
| 35 to 44 Years | 33 (100.0%) | 0 (0.0%) |
| 45 to 54 Years | 60 (100.0%) | 0 (0.0%) |
| 55 to 59 Years | 0 (0.0%) | 0 (0.0%) |
| 60 to 64 Years | 24 (100.0%) | 0 (0.0%) |
| 65 to 74 Years | 0 (0.0%) | 0 (0.0%) |
| 75 Years and over | 0 (0.0%) | 0 (0.0%) |
| Total | 374 (79.7%) | 0 (0.0%) |
Employment Status by Educational Attainment in Epworth
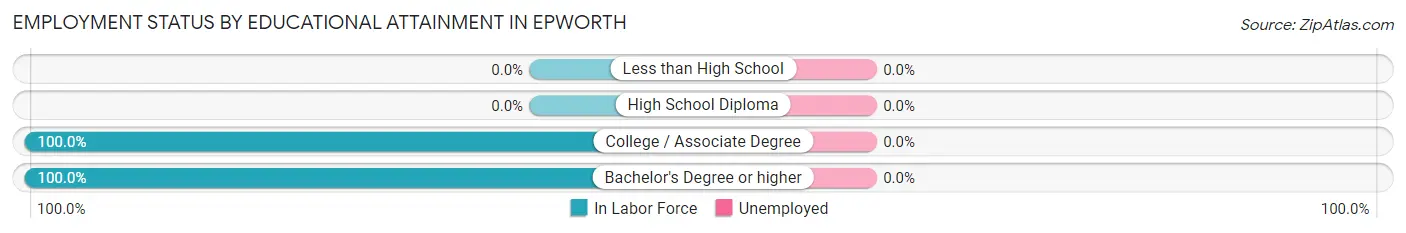
| Educational Attainment | In Labor Force | Unemployed |
| Less than High School | 0 (0.0%) | 0 (0.0%) |
| High School Diploma | 0 (0.0%) | 0 (0.0%) |
| College / Associate Degree | 265 (100.0%) | 0 (0.0%) |
| Bachelor's Degree or higher | 24 (100.0%) | 0 (0.0%) |
| Total | 289 (100.0%) | 0 (0.0%) |
Employment Occupations by Sex in Epworth
Management, Business, Science and Arts Occupations
The most common Management, Business, Science and Arts occupations in Epworth are Computers, Engineering & Science (35 | 9.4%), Computers & Mathematics (35 | 9.4%), Community & Social Service (33 | 8.8%), Arts, Media & Entertainment (33 | 8.8%), and Management (12 | 3.2%).
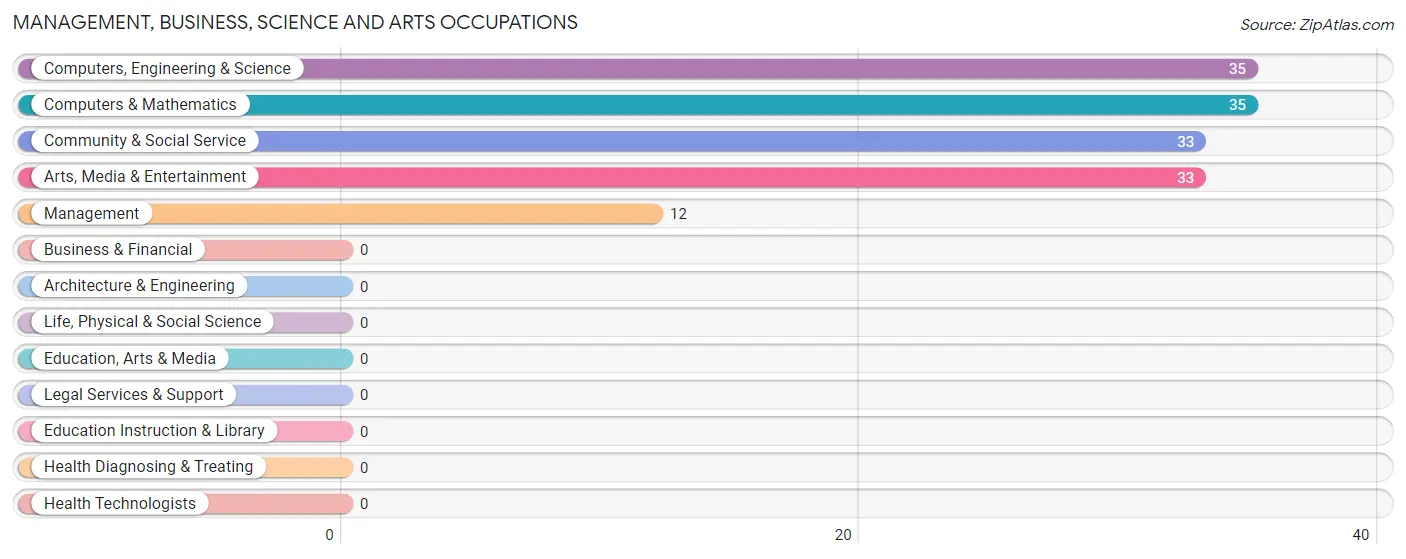
Management, Business, Science and Arts Occupations by Sex
Within the Management, Business, Science and Arts occupations in Epworth, the most male-oriented occupations are Management (100.0%), Community & Social Service (100.0%), and Arts, Media & Entertainment (100.0%), while the most female-oriented occupations are Computers, Engineering & Science (100.0%), and Computers & Mathematics (100.0%).
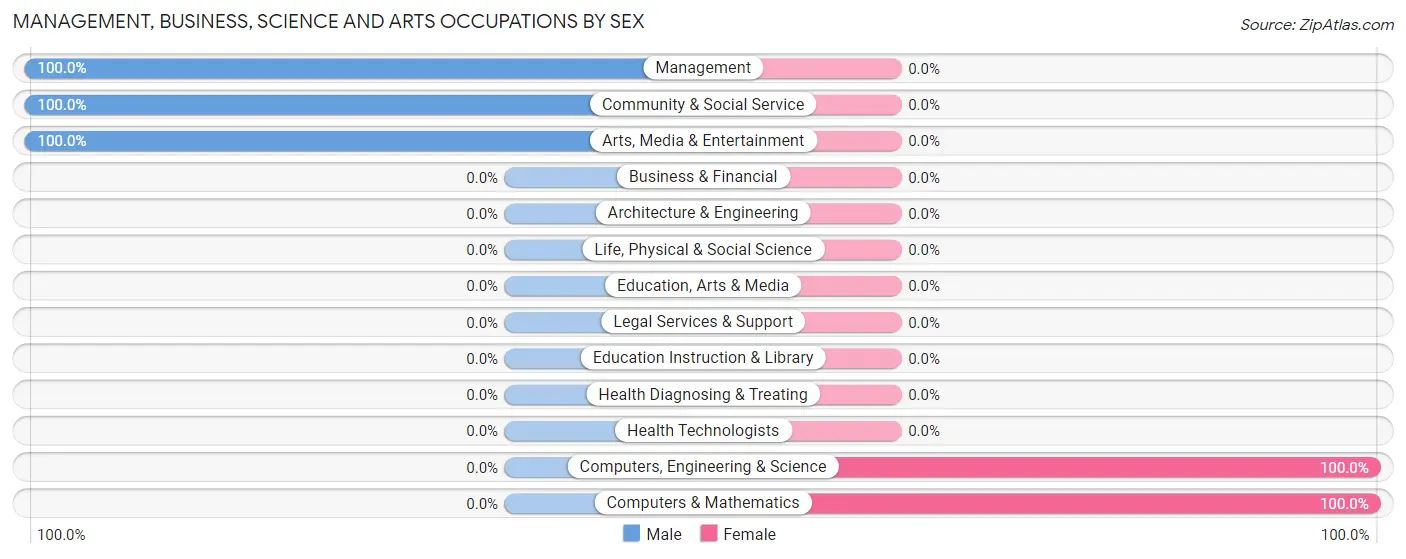
| Occupation | Male | Female |
| Management | 12 (100.0%) | 0 (0.0%) |
| Business & Financial | 0 (0.0%) | 0 (0.0%) |
| Computers, Engineering & Science | 0 (0.0%) | 35 (100.0%) |
| Computers & Mathematics | 0 (0.0%) | 35 (100.0%) |
| Architecture & Engineering | 0 (0.0%) | 0 (0.0%) |
| Life, Physical & Social Science | 0 (0.0%) | 0 (0.0%) |
| Community & Social Service | 33 (100.0%) | 0 (0.0%) |
| Education, Arts & Media | 0 (0.0%) | 0 (0.0%) |
| Legal Services & Support | 0 (0.0%) | 0 (0.0%) |
| Education Instruction & Library | 0 (0.0%) | 0 (0.0%) |
| Arts, Media & Entertainment | 33 (100.0%) | 0 (0.0%) |
| Health Diagnosing & Treating | 0 (0.0%) | 0 (0.0%) |
| Health Technologists | 0 (0.0%) | 0 (0.0%) |
| Total (Category) | 45 (56.2%) | 35 (43.8%) |
| Total (Overall) | 214 (57.2%) | 160 (42.8%) |
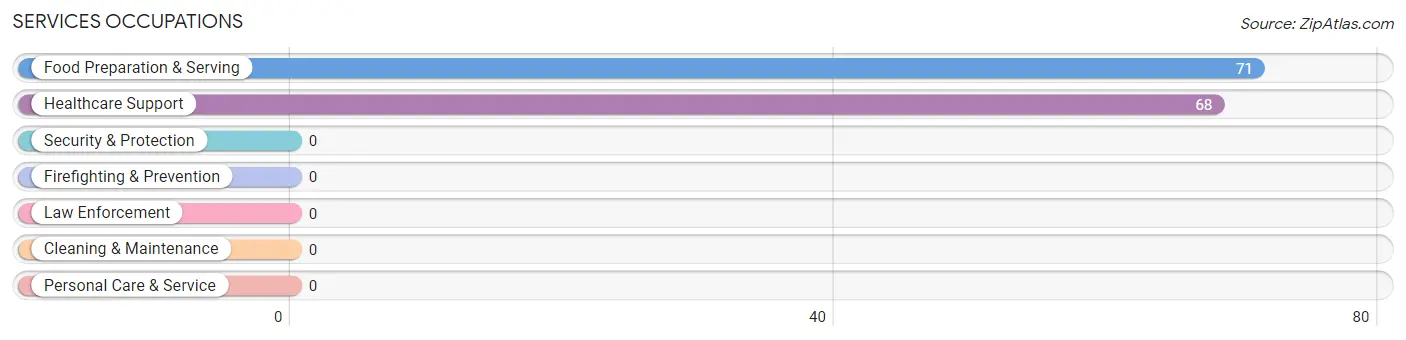
Services Occupations
The most common Services occupations in Epworth are Food Preparation & Serving (71 | 19.0%), and Healthcare Support (68 | 18.2%).
Services Occupations by Sex
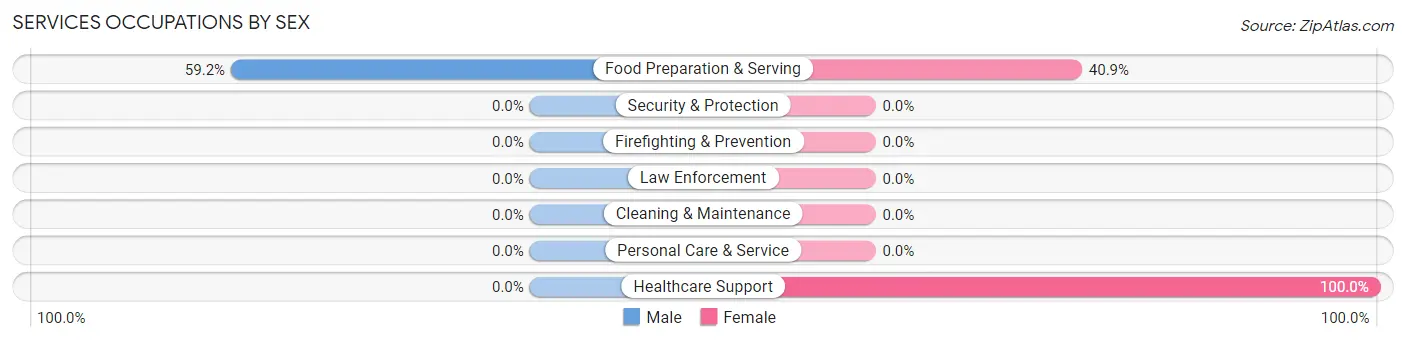
| Occupation | Male | Female |
| Healthcare Support | 0 (0.0%) | 68 (100.0%) |
| Security & Protection | 0 (0.0%) | 0 (0.0%) |
| Firefighting & Prevention | 0 (0.0%) | 0 (0.0%) |
| Law Enforcement | 0 (0.0%) | 0 (0.0%) |
| Food Preparation & Serving | 42 (59.2%) | 29 (40.8%) |
| Cleaning & Maintenance | 0 (0.0%) | 0 (0.0%) |
| Personal Care & Service | 0 (0.0%) | 0 (0.0%) |
| Total (Category) | 42 (30.2%) | 97 (69.8%) |
| Total (Overall) | 214 (57.2%) | 160 (42.8%) |
Sales and Office Occupations
The most common Sales and Office occupations in Epworth are , and Office & Administration (28 | 7.5%).
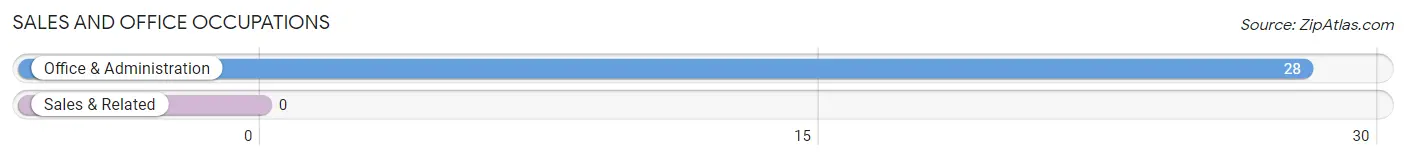
Sales and Office Occupations by Sex
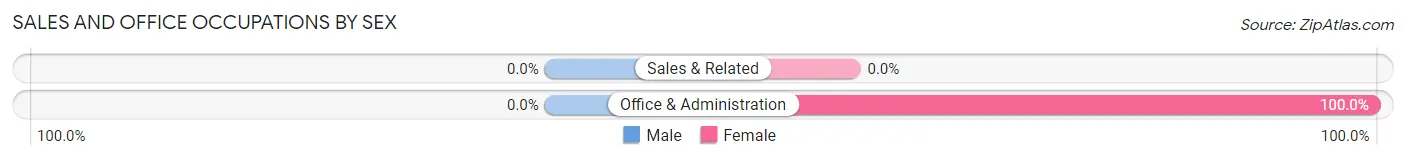
| Occupation | Male | Female |
| Sales & Related | 0 (0.0%) | 0 (0.0%) |
| Office & Administration | 0 (0.0%) | 28 (100.0%) |
| Total (Category) | 0 (0.0%) | 28 (100.0%) |
| Total (Overall) | 214 (57.2%) | 160 (42.8%) |
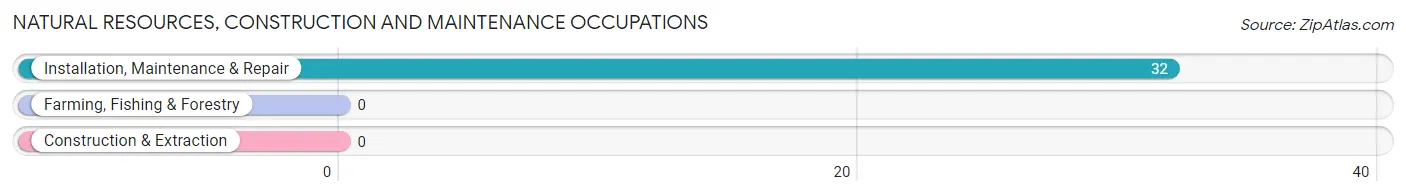
Natural Resources, Construction and Maintenance Occupations
The most common Natural Resources, Construction and Maintenance occupations in Epworth are , and Installation, Maintenance & Repair (32 | 8.6%).
Natural Resources, Construction and Maintenance Occupations by Sex
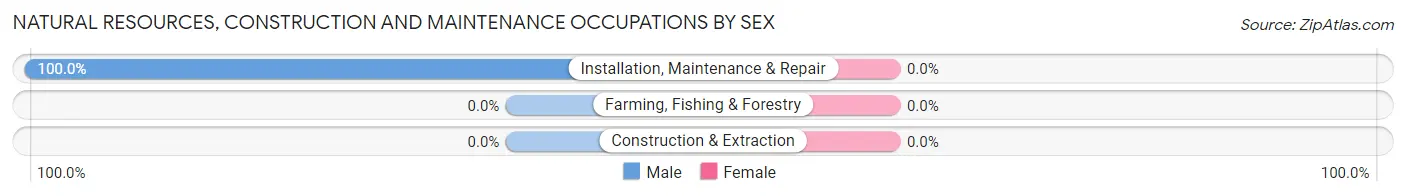
| Occupation | Male | Female |
| Farming, Fishing & Forestry | 0 (0.0%) | 0 (0.0%) |
| Construction & Extraction | 0 (0.0%) | 0 (0.0%) |
| Installation, Maintenance & Repair | 32 (100.0%) | 0 (0.0%) |
| Total (Category) | 32 (100.0%) | 0 (0.0%) |
| Total (Overall) | 214 (57.2%) | 160 (42.8%) |
Production, Transportation and Moving Occupations
The most common Production, Transportation and Moving occupations in Epworth are , and Production (95 | 25.4%).
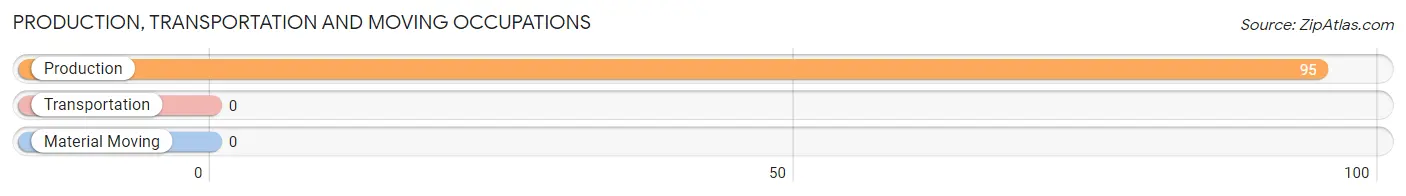
Production, Transportation and Moving Occupations by Sex
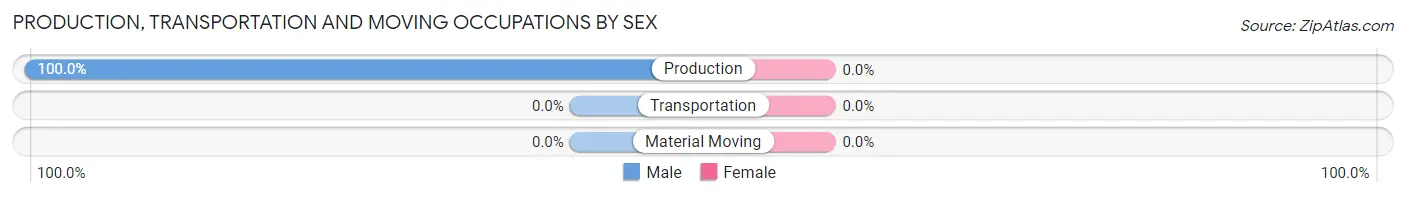
| Occupation | Male | Female |
| Production | 95 (100.0%) | 0 (0.0%) |
| Transportation | 0 (0.0%) | 0 (0.0%) |
| Material Moving | 0 (0.0%) | 0 (0.0%) |
| Total (Category) | 95 (100.0%) | 0 (0.0%) |
| Total (Overall) | 214 (57.2%) | 160 (42.8%) |
Employment Industries by Sex in Epworth
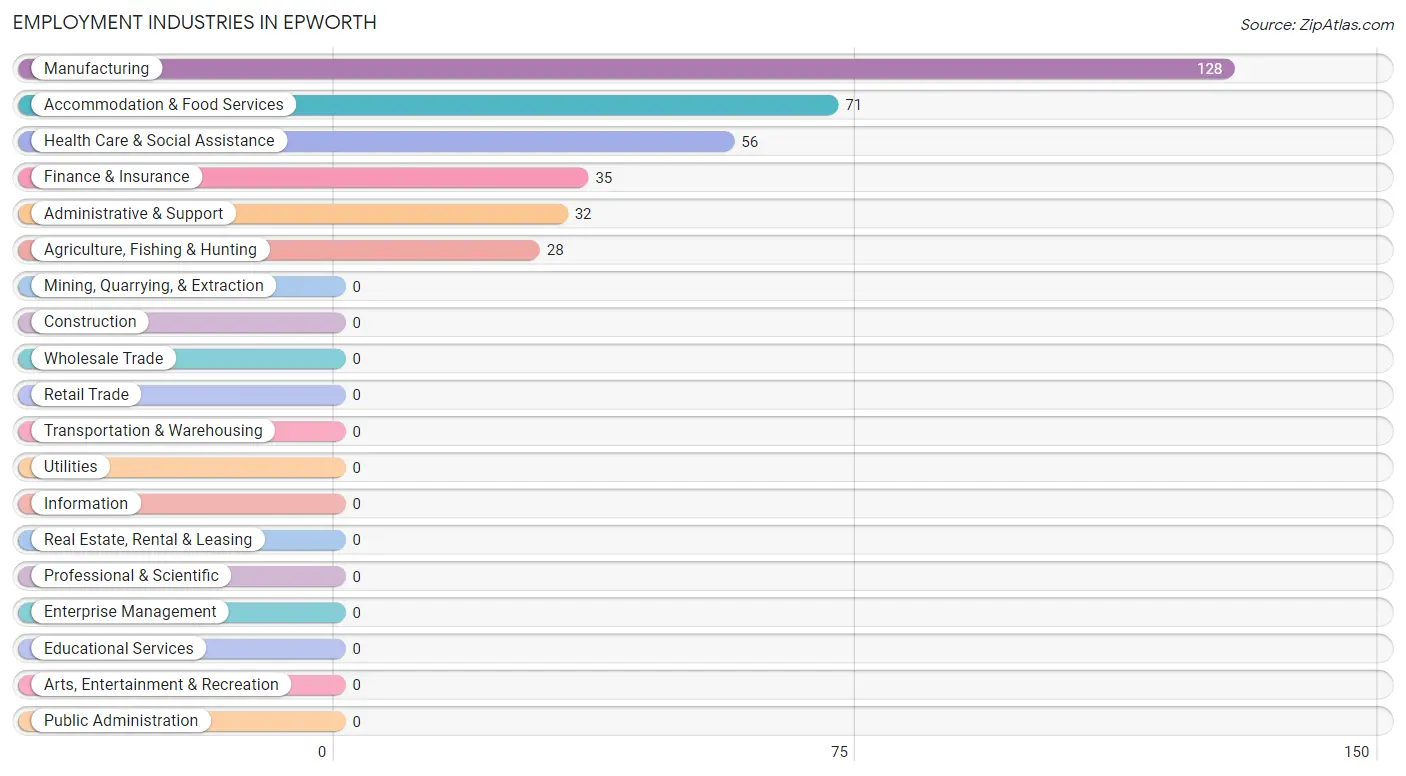
Employment Industries in Epworth
The major employment industries in Epworth include Manufacturing (128 | 34.2%), Accommodation & Food Services (71 | 19.0%), Health Care & Social Assistance (56 | 15.0%), Finance & Insurance (35 | 9.4%), and Administrative & Support (32 | 8.6%).
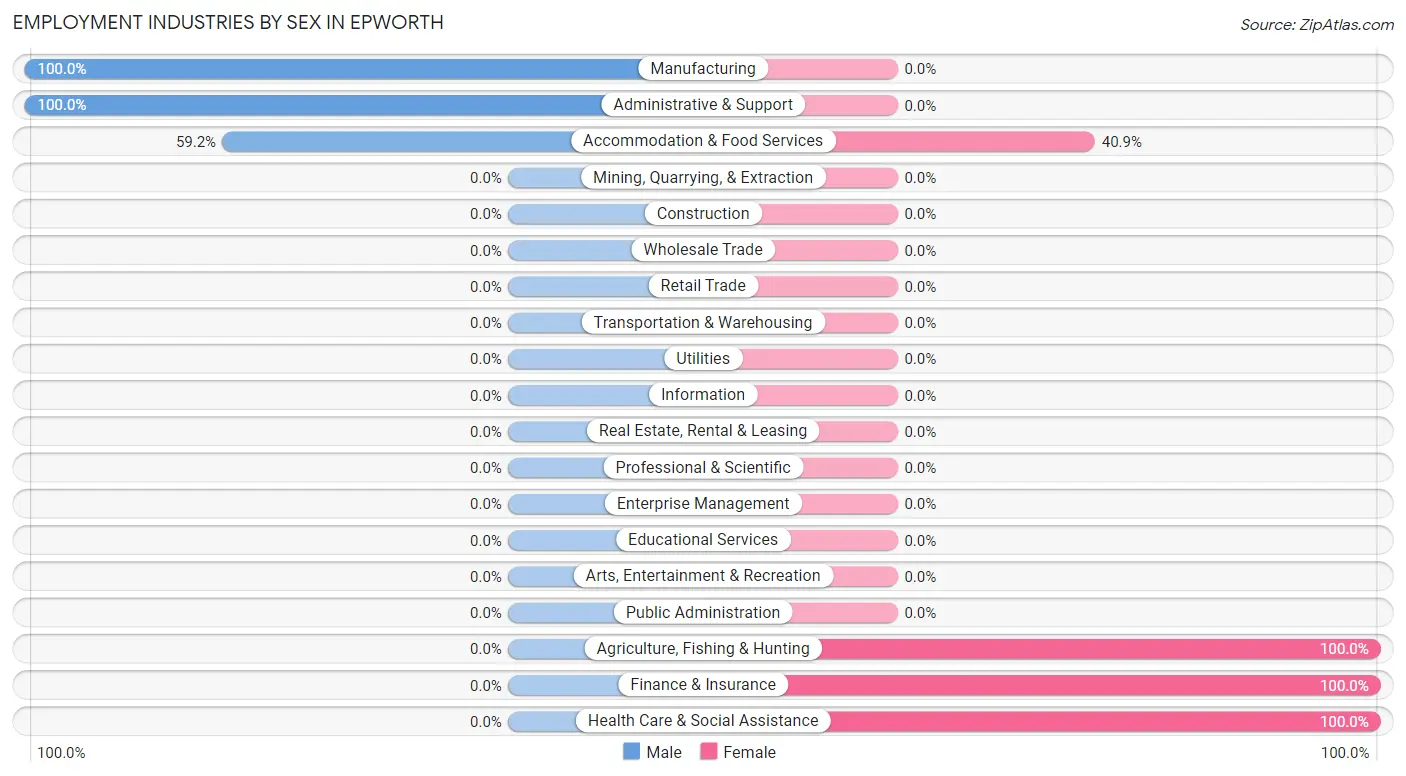
Employment Industries by Sex in Epworth
The Epworth industries that see more men than women are Manufacturing (100.0%), Administrative & Support (100.0%), and Accommodation & Food Services (59.2%), whereas the industries that tend to have a higher number of women are Agriculture, Fishing & Hunting (100.0%), Finance & Insurance (100.0%), and Health Care & Social Assistance (100.0%).
| Industry | Male | Female |
| Agriculture, Fishing & Hunting | 0 (0.0%) | 28 (100.0%) |
| Mining, Quarrying, & Extraction | 0 (0.0%) | 0 (0.0%) |
| Construction | 0 (0.0%) | 0 (0.0%) |
| Manufacturing | 128 (100.0%) | 0 (0.0%) |
| Wholesale Trade | 0 (0.0%) | 0 (0.0%) |
| Retail Trade | 0 (0.0%) | 0 (0.0%) |
| Transportation & Warehousing | 0 (0.0%) | 0 (0.0%) |
| Utilities | 0 (0.0%) | 0 (0.0%) |
| Information | 0 (0.0%) | 0 (0.0%) |
| Finance & Insurance | 0 (0.0%) | 35 (100.0%) |
| Real Estate, Rental & Leasing | 0 (0.0%) | 0 (0.0%) |
| Professional & Scientific | 0 (0.0%) | 0 (0.0%) |
| Enterprise Management | 0 (0.0%) | 0 (0.0%) |
| Administrative & Support | 32 (100.0%) | 0 (0.0%) |
| Educational Services | 0 (0.0%) | 0 (0.0%) |
| Health Care & Social Assistance | 0 (0.0%) | 56 (100.0%) |
| Arts, Entertainment & Recreation | 0 (0.0%) | 0 (0.0%) |
| Accommodation & Food Services | 42 (59.2%) | 29 (40.8%) |
| Public Administration | 0 (0.0%) | 0 (0.0%) |
| Total | 214 (57.2%) | 160 (42.8%) |
Education in Epworth
School Enrollment in Epworth
| School Level | # Students | % Students |
| Nursery / Preschool | 0 | 0.0% |
| Kindergarten | 0 | 0.0% |
| Elementary School | 0 | 0.0% |
| Middle School | 0 | 0.0% |
| High School | 0 | 0.0% |
| College / Undergraduate | 0 | 0.0% |
| Graduate / Professional | 0 | 0.0% |
| Total | 0 | 0.0% |
School Enrollment by Age by Funding Source in Epworth
| Age Bracket | Public School | Private School |
| 3 to 4 Year Olds | 0 (0.0%) | 0 (0.0%) |
| 5 to 9 Year Old | 0 (0.0%) | 0 (0.0%) |
| 10 to 14 Year Olds | 0 (0.0%) | 0 (0.0%) |
| 15 to 17 Year Olds | 0 (0.0%) | 0 (0.0%) |
| 18 to 19 Year Olds | 0 (0.0%) | 0 (0.0%) |
| 20 to 24 Year Olds | 0 (0.0%) | 0 (0.0%) |
| 25 to 34 Year Olds | 0 (0.0%) | 0 (0.0%) |
| 35 Years and over | 0 (0.0%) | 0 (0.0%) |
| Total | 0 (0.0%) | 0 (0.0%) |
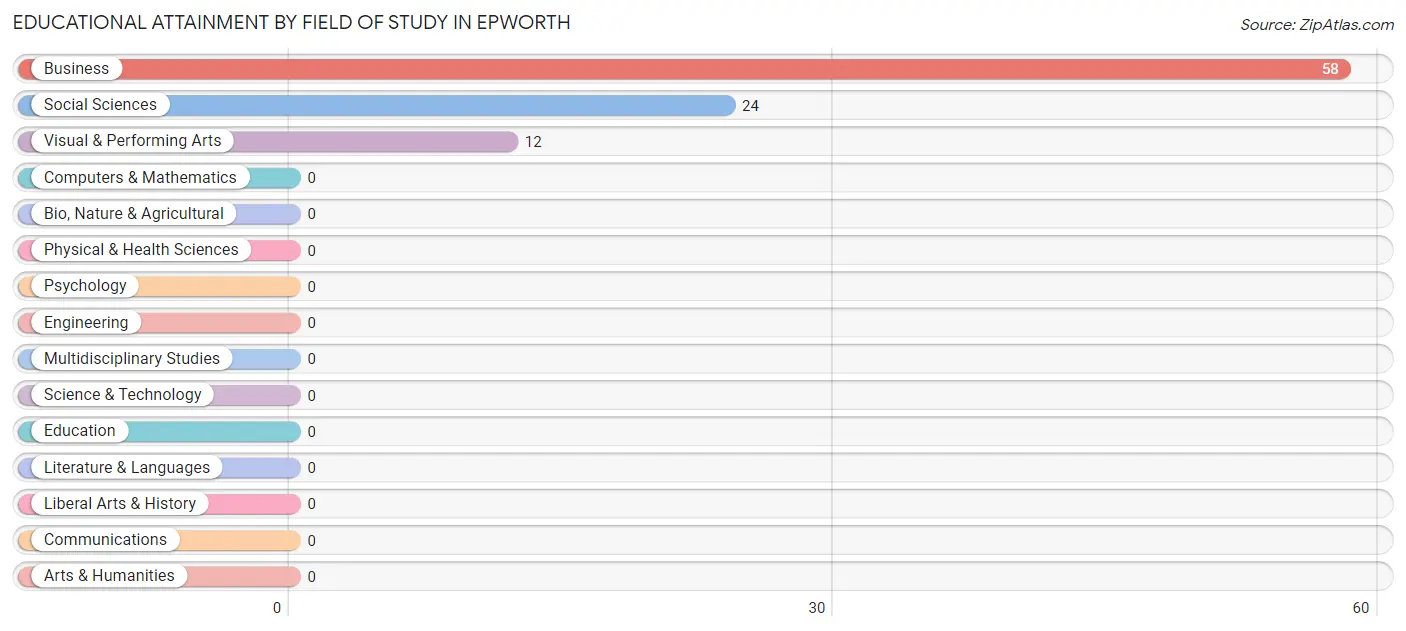
Educational Attainment by Field of Study in Epworth
Business (58 | 61.7%), social sciences (24 | 25.5%), and visual & performing arts (12 | 12.8%) are the most common fields of study among 94 individuals in Epworth who have obtained a bachelor's degree or higher.
| Field of Study | # Graduates | % Graduates |
| Computers & Mathematics | 0 | 0.0% |
| Bio, Nature & Agricultural | 0 | 0.0% |
| Physical & Health Sciences | 0 | 0.0% |
| Psychology | 0 | 0.0% |
| Social Sciences | 24 | 25.5% |
| Engineering | 0 | 0.0% |
| Multidisciplinary Studies | 0 | 0.0% |
| Science & Technology | 0 | 0.0% |
| Business | 58 | 61.7% |
| Education | 0 | 0.0% |
| Literature & Languages | 0 | 0.0% |
| Liberal Arts & History | 0 | 0.0% |
| Visual & Performing Arts | 12 | 12.8% |
| Communications | 0 | 0.0% |
| Arts & Humanities | 0 | 0.0% |
| Total | 94 | 100.0% |
Transportation & Commute in Epworth
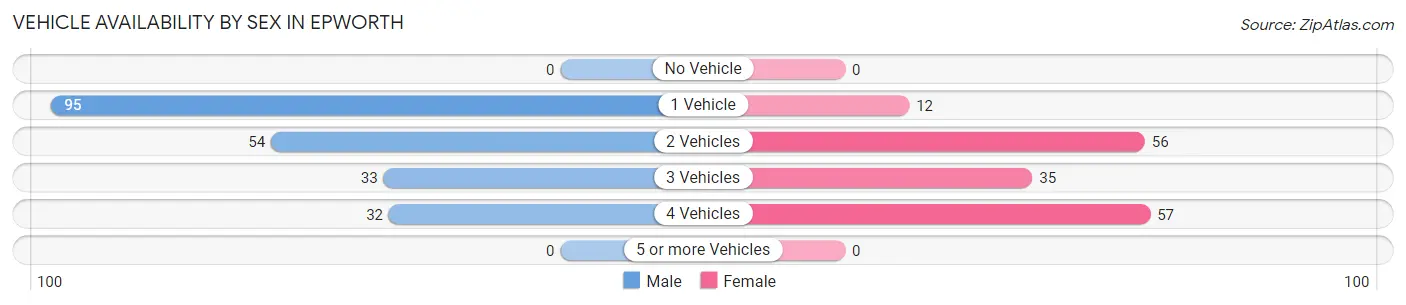
Vehicle Availability by Sex in Epworth
The most prevalent vehicle ownership categories in Epworth are males with 1 vehicle (95, accounting for 44.4%) and females with 1 vehicle (12, making up 59.4%).
| Vehicles Available | Male | Female |
| No Vehicle | 0 (0.0%) | 0 (0.0%) |
| 1 Vehicle | 95 (44.4%) | 12 (7.5%) |
| 2 Vehicles | 54 (25.2%) | 56 (35.0%) |
| 3 Vehicles | 33 (15.4%) | 35 (21.9%) |
| 4 Vehicles | 32 (14.9%) | 57 (35.6%) |
| 5 or more Vehicles | 0 (0.0%) | 0 (0.0%) |
| Total | 214 (100.0%) | 160 (100.0%) |
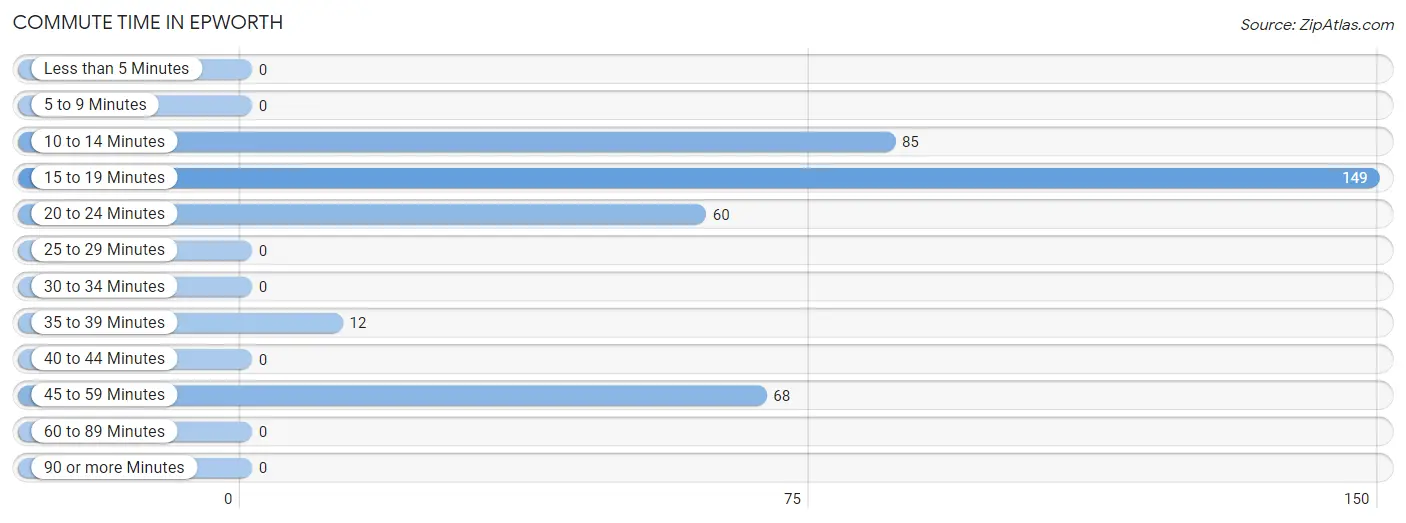
Commute Time in Epworth
The most frequently occuring commute durations in Epworth are 15 to 19 minutes (149 commuters, 39.8%), 10 to 14 minutes (85 commuters, 22.7%), and 45 to 59 minutes (68 commuters, 18.2%).
| Commute Time | # Commuters | % Commuters |
| Less than 5 Minutes | 0 | 0.0% |
| 5 to 9 Minutes | 0 | 0.0% |
| 10 to 14 Minutes | 85 | 22.7% |
| 15 to 19 Minutes | 149 | 39.8% |
| 20 to 24 Minutes | 60 | 16.0% |
| 25 to 29 Minutes | 0 | 0.0% |
| 30 to 34 Minutes | 0 | 0.0% |
| 35 to 39 Minutes | 12 | 3.2% |
| 40 to 44 Minutes | 0 | 0.0% |
| 45 to 59 Minutes | 68 | 18.2% |
| 60 to 89 Minutes | 0 | 0.0% |
| 90 or more Minutes | 0 | 0.0% |
Commute Time by Sex in Epworth
The most common commute times in Epworth are 15 to 19 minutes (137 commuters, 64.0%) for males and 10 to 14 minutes (85 commuters, 53.1%) for females.
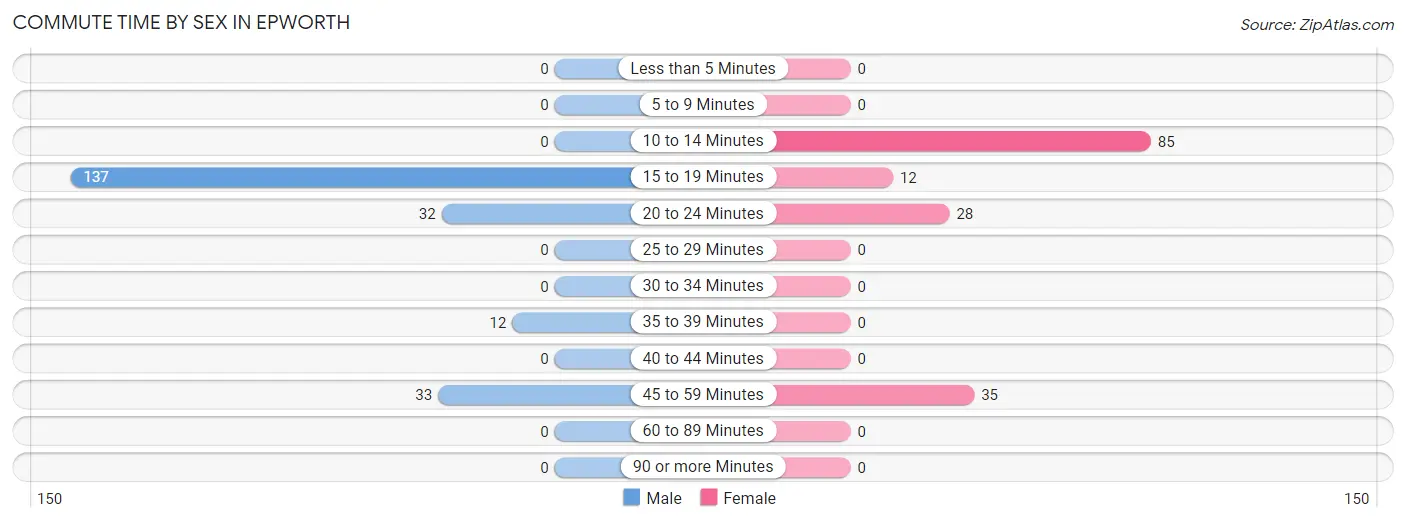
| Commute Time | Male | Female |
| Less than 5 Minutes | 0 (0.0%) | 0 (0.0%) |
| 5 to 9 Minutes | 0 (0.0%) | 0 (0.0%) |
| 10 to 14 Minutes | 0 (0.0%) | 85 (53.1%) |
| 15 to 19 Minutes | 137 (64.0%) | 12 (7.5%) |
| 20 to 24 Minutes | 32 (14.9%) | 28 (17.5%) |
| 25 to 29 Minutes | 0 (0.0%) | 0 (0.0%) |
| 30 to 34 Minutes | 0 (0.0%) | 0 (0.0%) |
| 35 to 39 Minutes | 12 (5.6%) | 0 (0.0%) |
| 40 to 44 Minutes | 0 (0.0%) | 0 (0.0%) |
| 45 to 59 Minutes | 33 (15.4%) | 35 (21.9%) |
| 60 to 89 Minutes | 0 (0.0%) | 0 (0.0%) |
| 90 or more Minutes | 0 (0.0%) | 0 (0.0%) |
Time of Departure to Work by Sex in Epworth
The most frequent times of departure to work in Epworth are 12:00 AM to 4:59 AM (95, 44.4%) for males and 8:00 AM to 8:29 AM (64, 40.0%) for females.
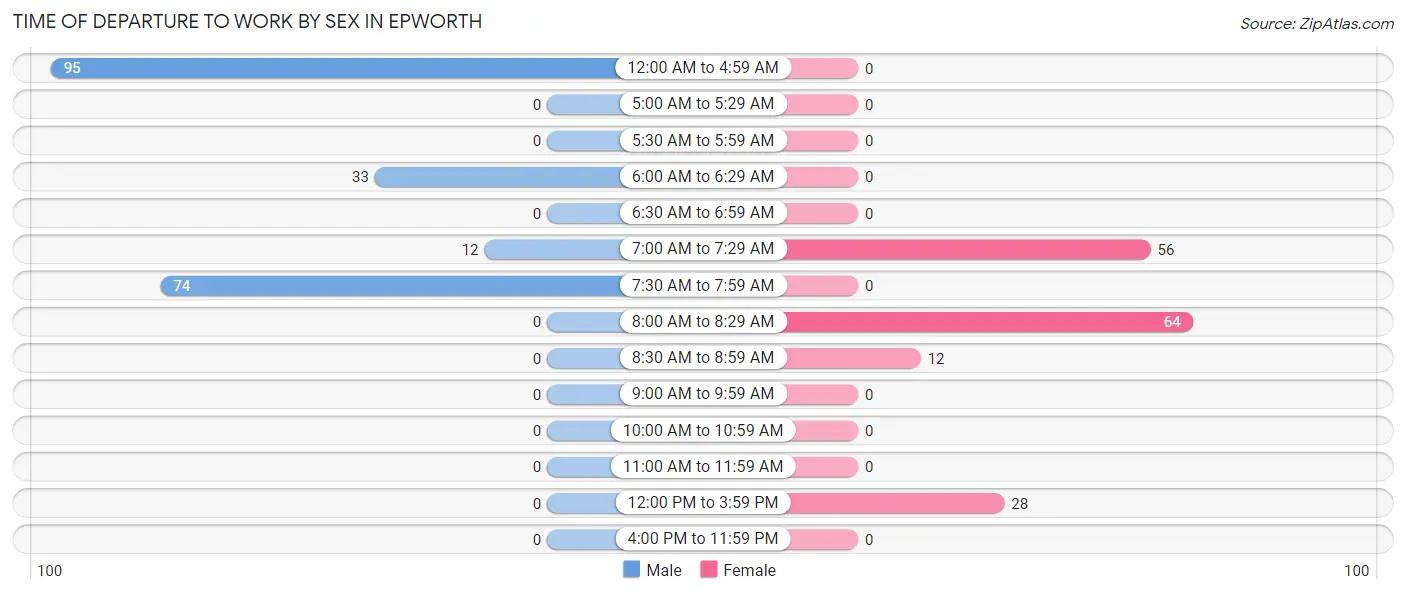
| Time of Departure | Male | Female |
| 12:00 AM to 4:59 AM | 95 (44.4%) | 0 (0.0%) |
| 5:00 AM to 5:29 AM | 0 (0.0%) | 0 (0.0%) |
| 5:30 AM to 5:59 AM | 0 (0.0%) | 0 (0.0%) |
| 6:00 AM to 6:29 AM | 33 (15.4%) | 0 (0.0%) |
| 6:30 AM to 6:59 AM | 0 (0.0%) | 0 (0.0%) |
| 7:00 AM to 7:29 AM | 12 (5.6%) | 56 (35.0%) |
| 7:30 AM to 7:59 AM | 74 (34.6%) | 0 (0.0%) |
| 8:00 AM to 8:29 AM | 0 (0.0%) | 64 (40.0%) |
| 8:30 AM to 8:59 AM | 0 (0.0%) | 12 (7.5%) |
| 9:00 AM to 9:59 AM | 0 (0.0%) | 0 (0.0%) |
| 10:00 AM to 10:59 AM | 0 (0.0%) | 0 (0.0%) |
| 11:00 AM to 11:59 AM | 0 (0.0%) | 0 (0.0%) |
| 12:00 PM to 3:59 PM | 0 (0.0%) | 28 (17.5%) |
| 4:00 PM to 11:59 PM | 0 (0.0%) | 0 (0.0%) |
| Total | 214 (100.0%) | 160 (100.0%) |
Housing Occupancy in Epworth
Occupancy by Ownership in Epworth
Of the total 317 dwellings in Epworth, owner-occupied units account for 157 (49.5%), while renter-occupied units make up 160 (50.5%).
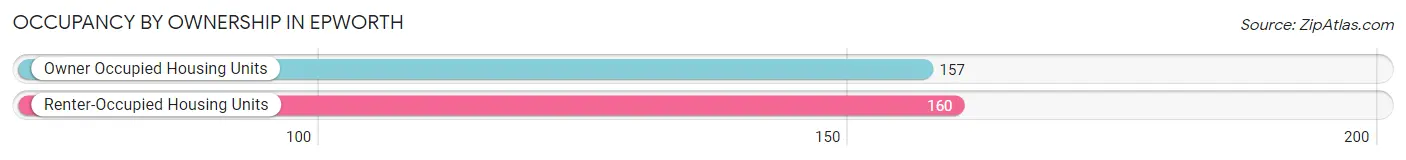
| Occupancy | # Housing Units | % Housing Units |
| Owner Occupied Housing Units | 157 | 49.5% |
| Renter-Occupied Housing Units | 160 | 50.5% |
| Total Occupied Housing Units | 317 | 100.0% |
Occupancy by Household Size in Epworth
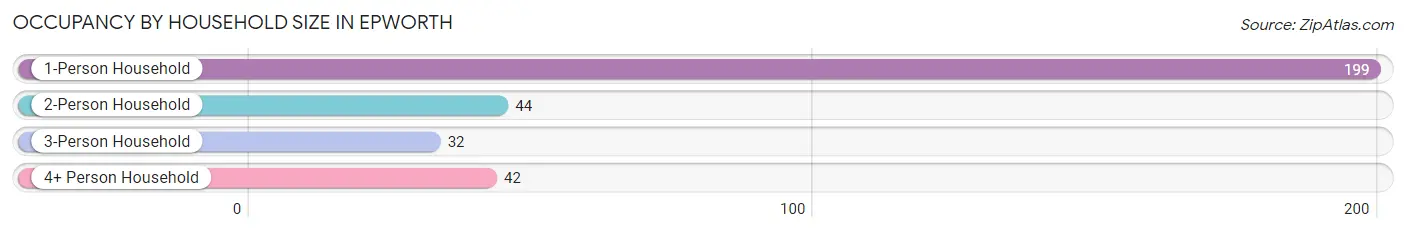
| Household Size | # Housing Units | % Housing Units |
| 1-Person Household | 199 | 62.8% |
| 2-Person Household | 44 | 13.9% |
| 3-Person Household | 32 | 10.1% |
| 4+ Person Household | 42 | 13.3% |
| Total Housing Units | 317 | 100.0% |
Occupancy by Ownership by Household Size in Epworth
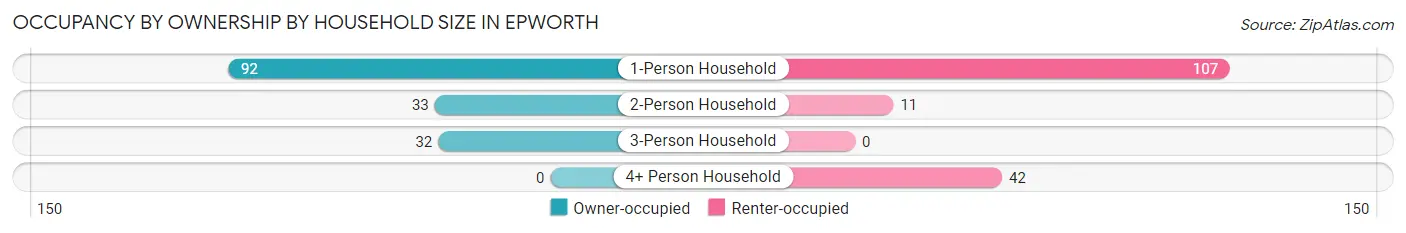
| Household Size | Owner-occupied | Renter-occupied |
| 1-Person Household | 92 (46.2%) | 107 (53.8%) |
| 2-Person Household | 33 (75.0%) | 11 (25.0%) |
| 3-Person Household | 32 (100.0%) | 0 (0.0%) |
| 4+ Person Household | 0 (0.0%) | 42 (100.0%) |
| Total Housing Units | 157 (49.5%) | 160 (50.5%) |
Occupancy by Educational Attainment in Epworth
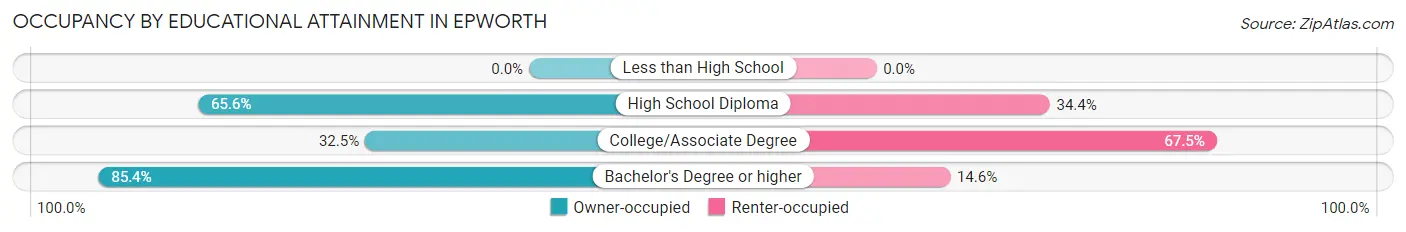
| Household Size | Owner-occupied | Renter-occupied |
| Less than High School | 0 (0.0%) | 0 (0.0%) |
| High School Diploma | 21 (65.6%) | 11 (34.4%) |
| College/Associate Degree | 66 (32.5%) | 137 (67.5%) |
| Bachelor's Degree or higher | 70 (85.4%) | 12 (14.6%) |
Occupancy by Age of Householder in Epworth
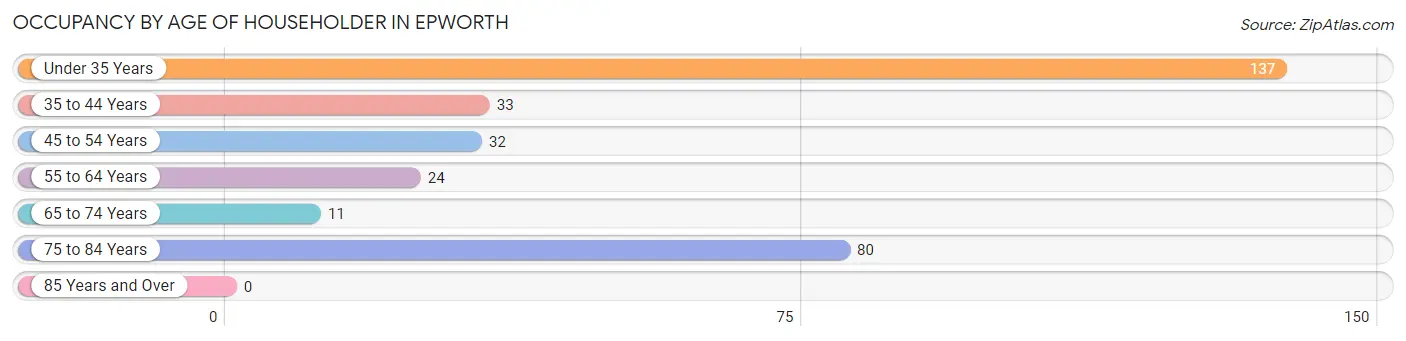
| Age Bracket | # Households | % Households |
| Under 35 Years | 137 | 43.2% |
| 35 to 44 Years | 33 | 10.4% |
| 45 to 54 Years | 32 | 10.1% |
| 55 to 64 Years | 24 | 7.6% |
| 65 to 74 Years | 11 | 3.5% |
| 75 to 84 Years | 80 | 25.2% |
| 85 Years and Over | 0 | 0.0% |
| Total | 317 | 100.0% |
Housing Finances in Epworth
Median Income by Occupancy in Epworth
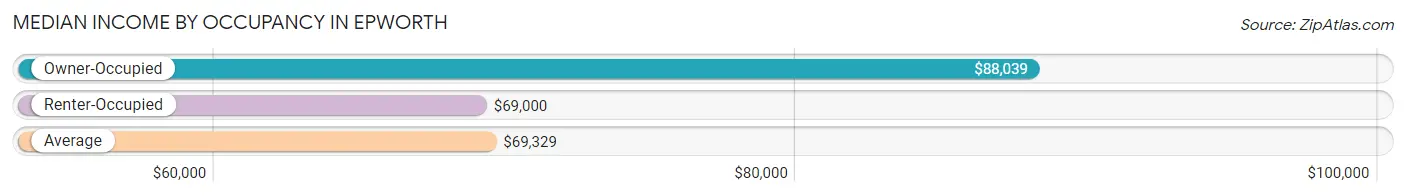
| Occupancy Type | # Households | Median Income |
| Owner-Occupied | 157 (49.5%) | $88,039 |
| Renter-Occupied | 160 (50.5%) | $69,000 |
| Average | 317 (100.0%) | $69,329 |
Occupancy by Householder Income Bracket in Epworth
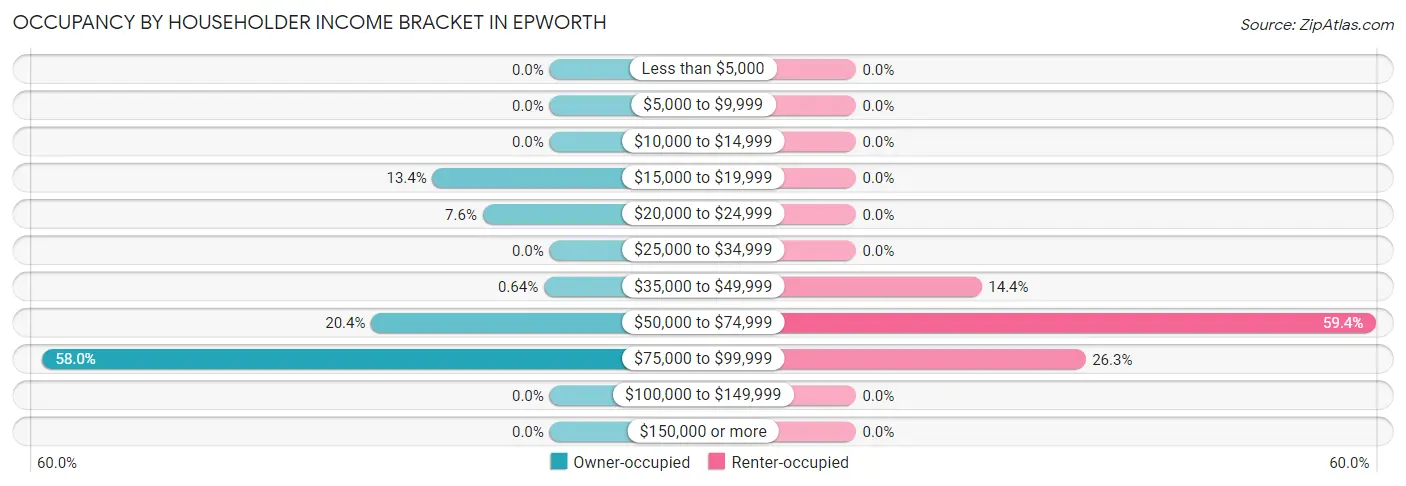
| Income Bracket | Owner-occupied | Renter-occupied |
| Less than $5,000 | 0 (0.0%) | 0 (0.0%) |
| $5,000 to $9,999 | 0 (0.0%) | 0 (0.0%) |
| $10,000 to $14,999 | 0 (0.0%) | 0 (0.0%) |
| $15,000 to $19,999 | 21 (13.4%) | 0 (0.0%) |
| $20,000 to $24,999 | 12 (7.6%) | 0 (0.0%) |
| $25,000 to $34,999 | 0 (0.0%) | 0 (0.0%) |
| $35,000 to $49,999 | 1 (0.6%) | 23 (14.4%) |
| $50,000 to $74,999 | 32 (20.4%) | 95 (59.4%) |
| $75,000 to $99,999 | 91 (58.0%) | 42 (26.3%) |
| $100,000 to $149,999 | 0 (0.0%) | 0 (0.0%) |
| $150,000 or more | 0 (0.0%) | 0 (0.0%) |
| Total | 157 (100.0%) | 160 (100.0%) |
Monthly Housing Cost Tiers in Epworth
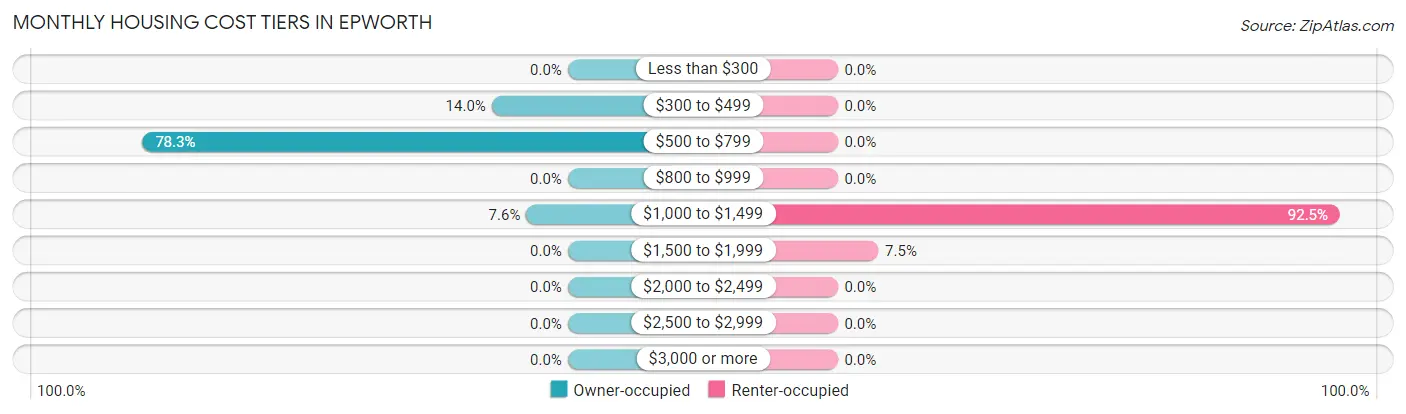
| Monthly Cost | Owner-occupied | Renter-occupied |
| Less than $300 | 0 (0.0%) | 0 (0.0%) |
| $300 to $499 | 22 (14.0%) | 0 (0.0%) |
| $500 to $799 | 123 (78.3%) | 0 (0.0%) |
| $800 to $999 | 0 (0.0%) | 0 (0.0%) |
| $1,000 to $1,499 | 12 (7.6%) | 148 (92.5%) |
| $1,500 to $1,999 | 0 (0.0%) | 12 (7.5%) |
| $2,000 to $2,499 | 0 (0.0%) | 0 (0.0%) |
| $2,500 to $2,999 | 0 (0.0%) | 0 (0.0%) |
| $3,000 or more | 0 (0.0%) | 0 (0.0%) |
| Total | 157 (100.0%) | 160 (100.0%) |
Physical Housing Characteristics in Epworth
Housing Structures in Epworth
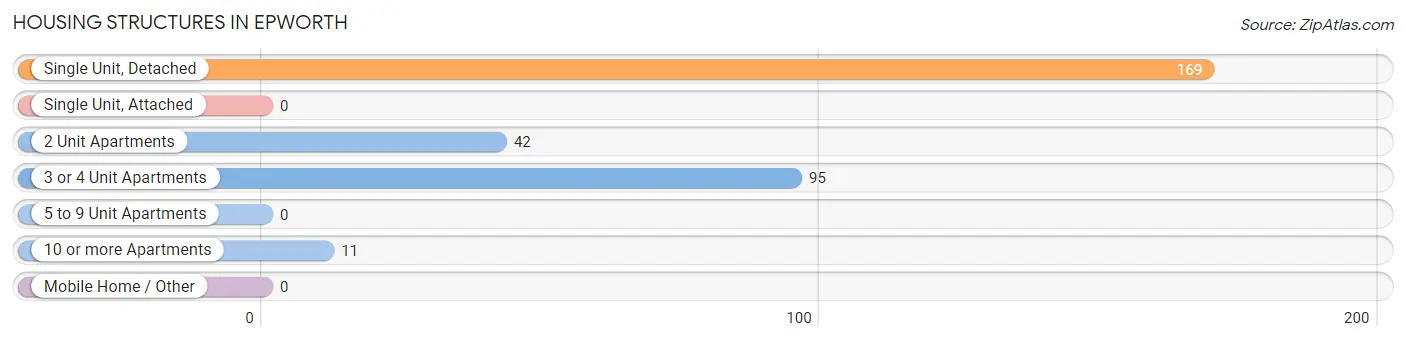
| Structure Type | # Housing Units | % Housing Units |
| Single Unit, Detached | 169 | 53.3% |
| Single Unit, Attached | 0 | 0.0% |
| 2 Unit Apartments | 42 | 13.3% |
| 3 or 4 Unit Apartments | 95 | 30.0% |
| 5 to 9 Unit Apartments | 0 | 0.0% |
| 10 or more Apartments | 11 | 3.5% |
| Mobile Home / Other | 0 | 0.0% |
| Total | 317 | 100.0% |
Housing Structures by Occupancy in Epworth
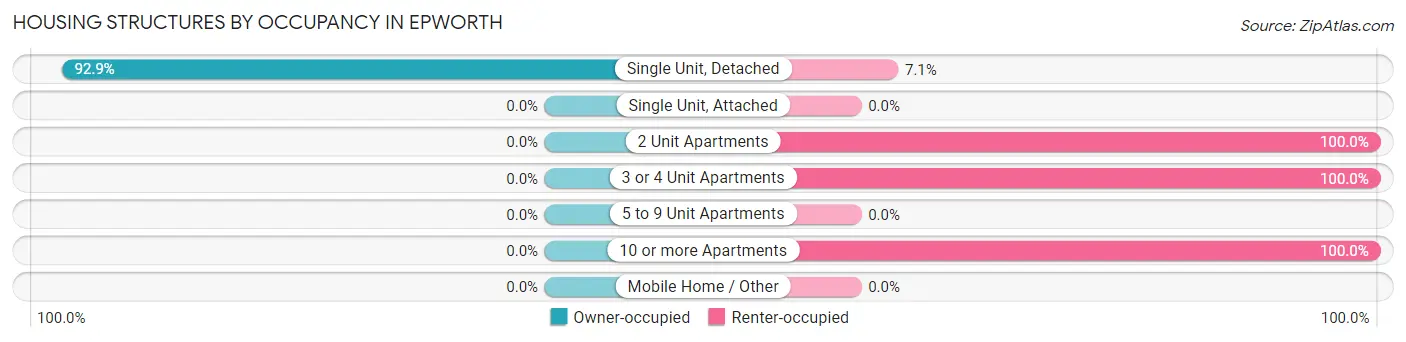
| Structure Type | Owner-occupied | Renter-occupied |
| Single Unit, Detached | 157 (92.9%) | 12 (7.1%) |
| Single Unit, Attached | 0 (0.0%) | 0 (0.0%) |
| 2 Unit Apartments | 0 (0.0%) | 42 (100.0%) |
| 3 or 4 Unit Apartments | 0 (0.0%) | 95 (100.0%) |
| 5 to 9 Unit Apartments | 0 (0.0%) | 0 (0.0%) |
| 10 or more Apartments | 0 (0.0%) | 11 (100.0%) |
| Mobile Home / Other | 0 (0.0%) | 0 (0.0%) |
| Total | 157 (49.5%) | 160 (50.5%) |
Housing Structures by Number of Rooms in Epworth
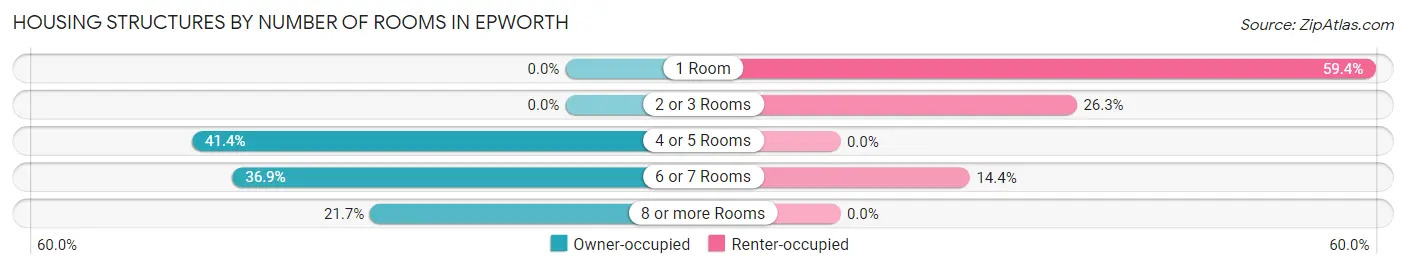
| Number of Rooms | Owner-occupied | Renter-occupied |
| 1 Room | 0 (0.0%) | 95 (59.4%) |
| 2 or 3 Rooms | 0 (0.0%) | 42 (26.3%) |
| 4 or 5 Rooms | 65 (41.4%) | 0 (0.0%) |
| 6 or 7 Rooms | 58 (36.9%) | 23 (14.4%) |
| 8 or more Rooms | 34 (21.7%) | 0 (0.0%) |
| Total | 157 (100.0%) | 160 (100.0%) |
Housing Structure by Heating Type in Epworth
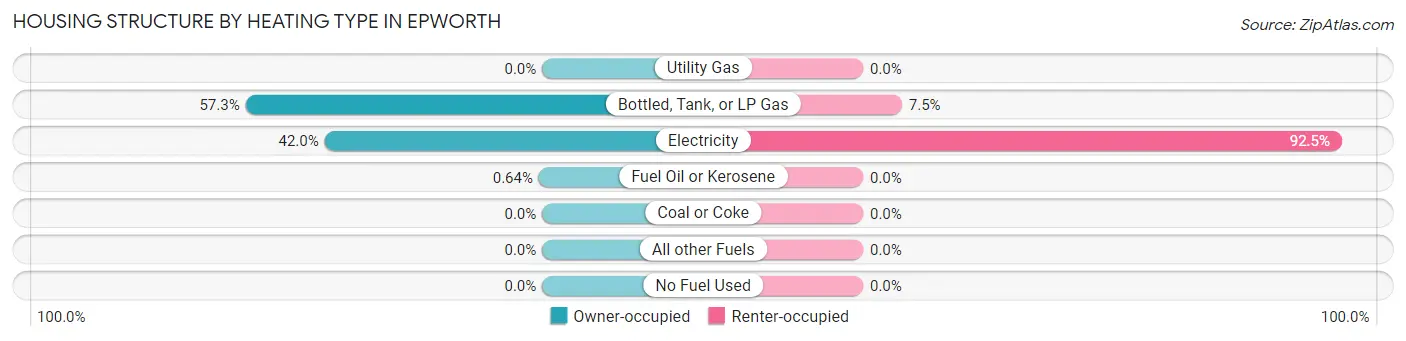
| Heating Type | Owner-occupied | Renter-occupied |
| Utility Gas | 0 (0.0%) | 0 (0.0%) |
| Bottled, Tank, or LP Gas | 90 (57.3%) | 12 (7.5%) |
| Electricity | 66 (42.0%) | 148 (92.5%) |
| Fuel Oil or Kerosene | 1 (0.6%) | 0 (0.0%) |
| Coal or Coke | 0 (0.0%) | 0 (0.0%) |
| All other Fuels | 0 (0.0%) | 0 (0.0%) |
| No Fuel Used | 0 (0.0%) | 0 (0.0%) |
| Total | 157 (100.0%) | 160 (100.0%) |
Household Vehicle Usage in Epworth
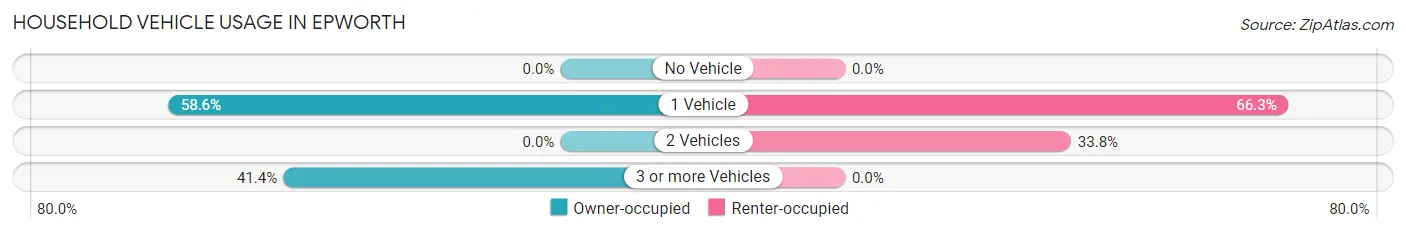
| Vehicles per Household | Owner-occupied | Renter-occupied |
| No Vehicle | 0 (0.0%) | 0 (0.0%) |
| 1 Vehicle | 92 (58.6%) | 106 (66.2%) |
| 2 Vehicles | 0 (0.0%) | 54 (33.8%) |
| 3 or more Vehicles | 65 (41.4%) | 0 (0.0%) |
| Total | 157 (100.0%) | 160 (100.0%) |
Real Estate & Mortgages in Epworth
Real Estate and Mortgage Overview in Epworth
| Characteristic | Without Mortgage | With Mortgage |
| Housing Units | 145 | 12 |
| Median Property Value | $158,900 | $0 |
| Median Household Income | $88,297 | $0 |
| Monthly Housing Costs | $587 | $0 |
| Real Estate Taxes | $199 | $0 |
Property Value by Mortgage Status in Epworth
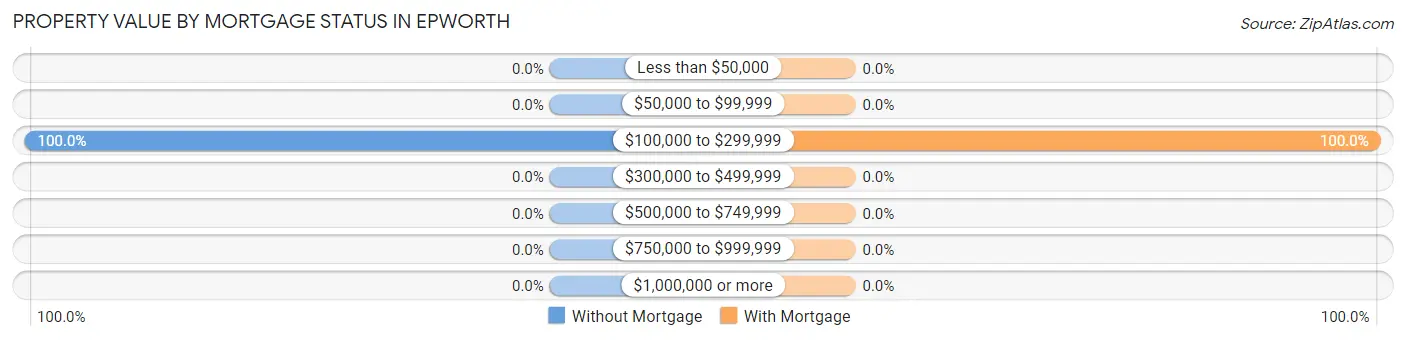
| Property Value | Without Mortgage | With Mortgage |
| Less than $50,000 | 0 (0.0%) | 0 (0.0%) |
| $50,000 to $99,999 | 0 (0.0%) | 0 (0.0%) |
| $100,000 to $299,999 | 145 (100.0%) | 12 (100.0%) |
| $300,000 to $499,999 | 0 (0.0%) | 0 (0.0%) |
| $500,000 to $749,999 | 0 (0.0%) | 0 (0.0%) |
| $750,000 to $999,999 | 0 (0.0%) | 0 (0.0%) |
| $1,000,000 or more | 0 (0.0%) | 0 (0.0%) |
| Total | 145 (100.0%) | 12 (100.0%) |
Household Income by Mortgage Status in Epworth
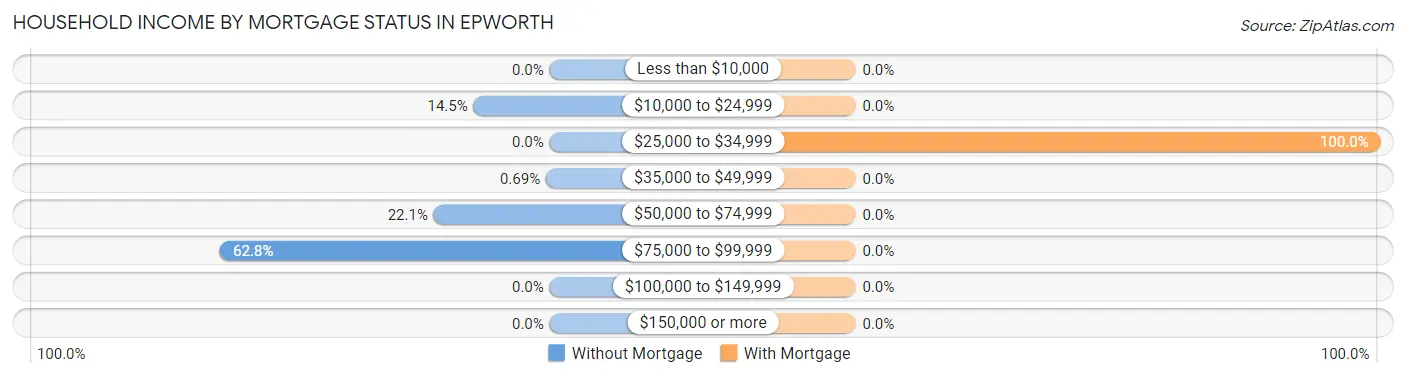
| Household Income | Without Mortgage | With Mortgage |
| Less than $10,000 | 0 (0.0%) | 0 (0.0%) |
| $10,000 to $24,999 | 21 (14.5%) | 0 (0.0%) |
| $25,000 to $34,999 | 0 (0.0%) | 12 (100.0%) |
| $35,000 to $49,999 | 1 (0.7%) | 0 (0.0%) |
| $50,000 to $74,999 | 32 (22.1%) | 0 (0.0%) |
| $75,000 to $99,999 | 91 (62.8%) | 0 (0.0%) |
| $100,000 to $149,999 | 0 (0.0%) | 0 (0.0%) |
| $150,000 or more | 0 (0.0%) | 0 (0.0%) |
| Total | 145 (100.0%) | 12 (100.0%) |
Property Value to Household Income Ratio in Epworth
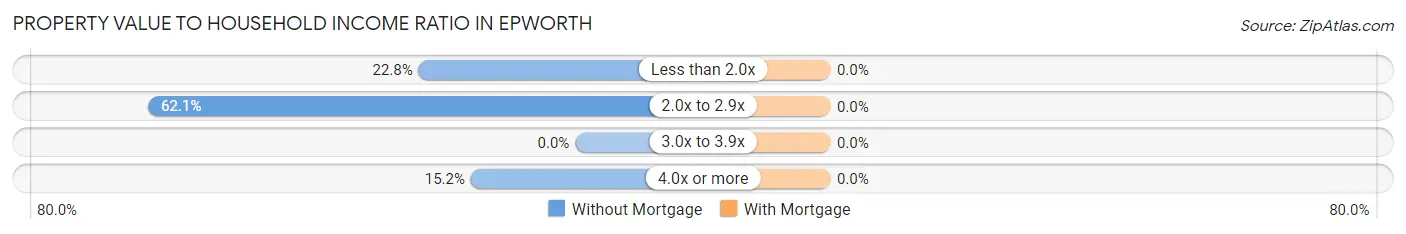
| Value-to-Income Ratio | Without Mortgage | With Mortgage |
| Less than 2.0x | 33 (22.8%) | 0 (0.0%) |
| 2.0x to 2.9x | 90 (62.1%) | 0 (0.0%) |
| 3.0x to 3.9x | 0 (0.0%) | 0 (0.0%) |
| 4.0x or more | 22 (15.2%) | 0 (0.0%) |
| Total | 145 (100.0%) | 12 (100.0%) |
Real Estate Taxes by Mortgage Status in Epworth
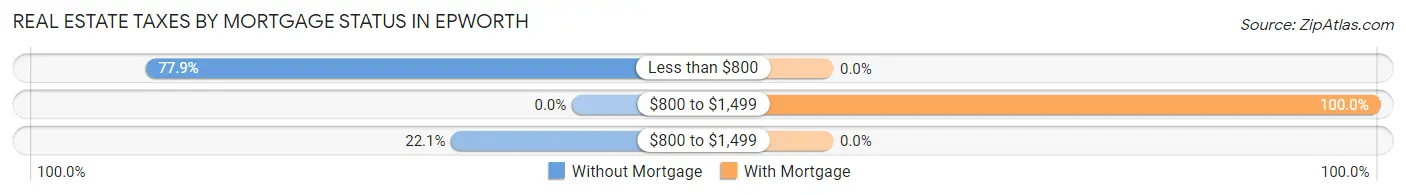
| Property Taxes | Without Mortgage | With Mortgage |
| Less than $800 | 113 (77.9%) | 0 (0.0%) |
| $800 to $1,499 | 0 (0.0%) | 12 (100.0%) |
| $800 to $1,499 | 32 (22.1%) | 0 (0.0%) |
| Total | 145 (100.0%) | 12 (100.0%) |
Health & Disability in Epworth
Health Insurance Coverage by Age in Epworth
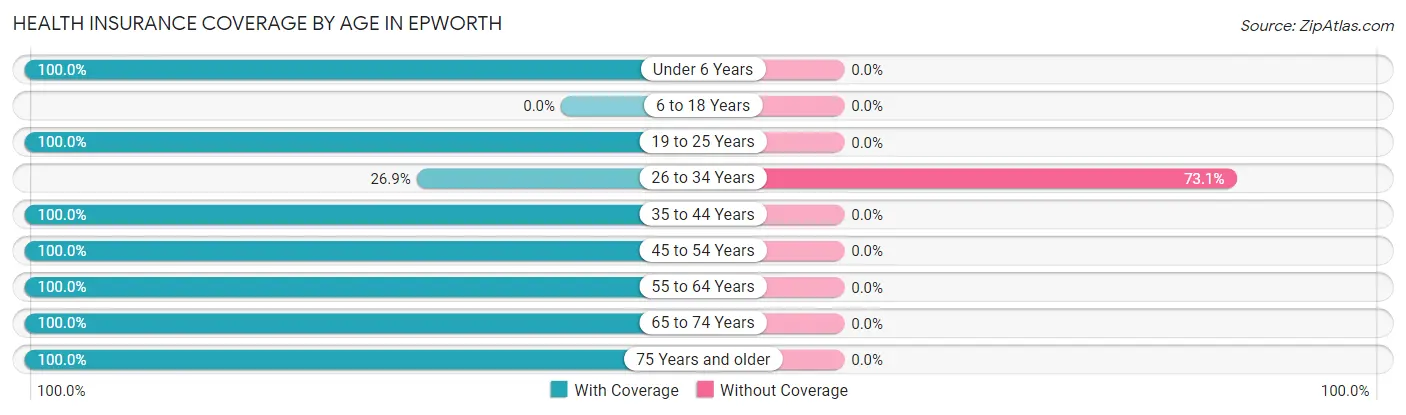
| Age Bracket | With Coverage | Without Coverage |
| Under 6 Years | 106 (100.0%) | 0 (0.0%) |
| 6 to 18 Years | 0 (0.0%) | 0 (0.0%) |
| 19 to 25 Years | 127 (100.0%) | 0 (0.0%) |
| 26 to 34 Years | 35 (26.9%) | 95 (73.1%) |
| 35 to 44 Years | 33 (100.0%) | 0 (0.0%) |
| 45 to 54 Years | 60 (100.0%) | 0 (0.0%) |
| 55 to 64 Years | 24 (100.0%) | 0 (0.0%) |
| 65 to 74 Years | 15 (100.0%) | 0 (0.0%) |
| 75 Years and older | 80 (100.0%) | 0 (0.0%) |
| Total | 480 (83.5%) | 95 (16.5%) |
Health Insurance Coverage by Citizenship Status in Epworth
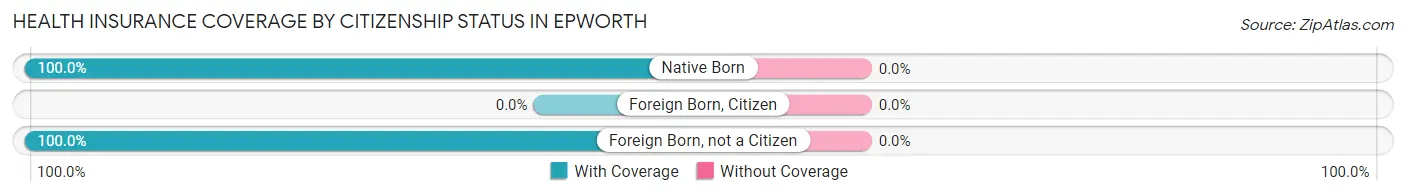
| Citizenship Status | With Coverage | Without Coverage |
| Native Born | 106 (100.0%) | 0 (0.0%) |
| Foreign Born, Citizen | 0 (0.0%) | 0 (0.0%) |
| Foreign Born, not a Citizen | 127 (100.0%) | 0 (0.0%) |
Health Insurance Coverage by Household Income in Epworth
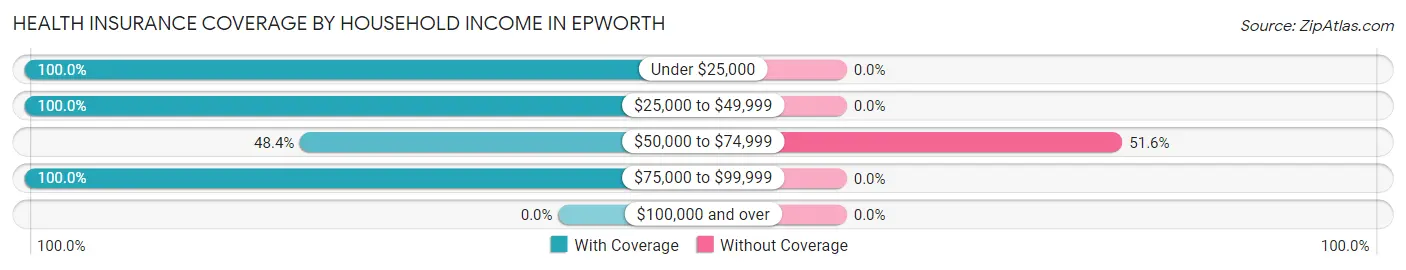
| Household Income | With Coverage | Without Coverage |
| Under $25,000 | 33 (100.0%) | 0 (0.0%) |
| $25,000 to $49,999 | 28 (100.0%) | 0 (0.0%) |
| $50,000 to $74,999 | 89 (48.4%) | 95 (51.6%) |
| $75,000 to $99,999 | 330 (100.0%) | 0 (0.0%) |
| $100,000 and over | 0 (0.0%) | 0 (0.0%) |
Public vs Private Health Insurance Coverage by Age in Epworth
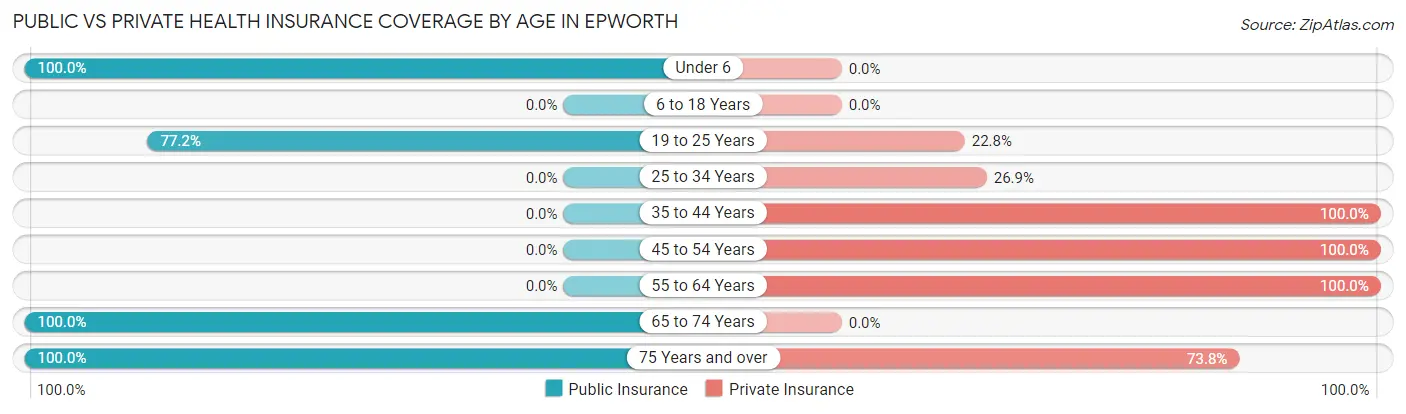
| Age Bracket | Public Insurance | Private Insurance |
| Under 6 | 106 (100.0%) | 0 (0.0%) |
| 6 to 18 Years | 0 (0.0%) | 0 (0.0%) |
| 19 to 25 Years | 98 (77.2%) | 29 (22.8%) |
| 25 to 34 Years | 0 (0.0%) | 35 (26.9%) |
| 35 to 44 Years | 0 (0.0%) | 33 (100.0%) |
| 45 to 54 Years | 0 (0.0%) | 60 (100.0%) |
| 55 to 64 Years | 0 (0.0%) | 24 (100.0%) |
| 65 to 74 Years | 15 (100.0%) | 0 (0.0%) |
| 75 Years and over | 80 (100.0%) | 59 (73.8%) |
| Total | 299 (52.0%) | 240 (41.7%) |
Disability Status by Sex by Age in Epworth
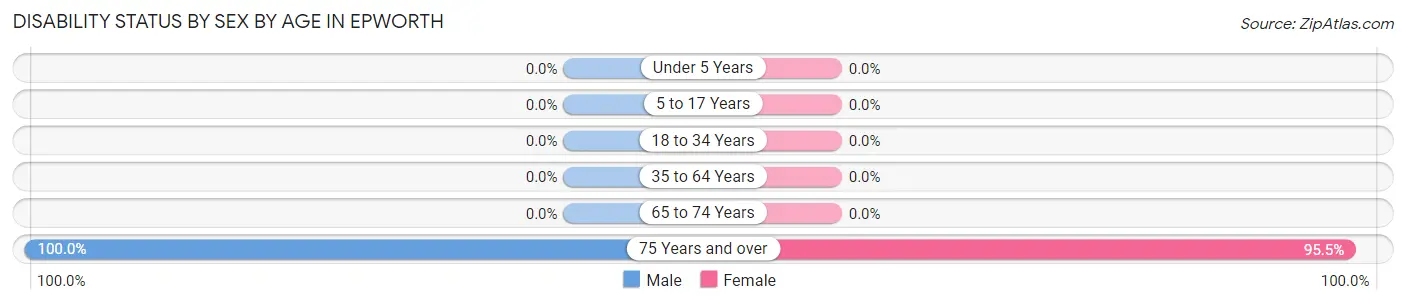
| Age Bracket | Male | Female |
| Under 5 Years | 0 (0.0%) | 0 (0.0%) |
| 5 to 17 Years | 0 (0.0%) | 0 (0.0%) |
| 18 to 34 Years | 0 (0.0%) | 0 (0.0%) |
| 35 to 64 Years | 0 (0.0%) | 0 (0.0%) |
| 65 to 74 Years | 0 (0.0%) | 0 (0.0%) |
| 75 Years and over | 58 (100.0%) | 21 (95.5%) |
Disability Class by Sex by Age in Epworth
Disability Class: Hearing Difficulty
| Age Bracket | Male | Female |
| Under 5 Years | 0 (0.0%) | 0 (0.0%) |
| 5 to 17 Years | 0 (0.0%) | 0 (0.0%) |
| 18 to 34 Years | 0 (0.0%) | 0 (0.0%) |
| 35 to 64 Years | 0 (0.0%) | 0 (0.0%) |
| 65 to 74 Years | 0 (0.0%) | 0 (0.0%) |
| 75 Years and over | 0 (0.0%) | 0 (0.0%) |
Disability Class: Vision Difficulty
| Age Bracket | Male | Female |
| Under 5 Years | 0 (0.0%) | 0 (0.0%) |
| 5 to 17 Years | 0 (0.0%) | 0 (0.0%) |
| 18 to 34 Years | 0 (0.0%) | 0 (0.0%) |
| 35 to 64 Years | 0 (0.0%) | 0 (0.0%) |
| 65 to 74 Years | 0 (0.0%) | 0 (0.0%) |
| 75 Years and over | 58 (100.0%) | 0 (0.0%) |
Disability Class: Cognitive Difficulty

| Age Bracket | Male | Female |
| 5 to 17 Years | 0 (0.0%) | 0 (0.0%) |
| 18 to 34 Years | 0 (0.0%) | 0 (0.0%) |
| 35 to 64 Years | 0 (0.0%) | 0 (0.0%) |
| 65 to 74 Years | 0 (0.0%) | 0 (0.0%) |
| 75 Years and over | 0 (0.0%) | 0 (0.0%) |
Disability Class: Ambulatory Difficulty
| Age Bracket | Male | Female |
| 5 to 17 Years | 0 (0.0%) | 0 (0.0%) |
| 18 to 34 Years | 0 (0.0%) | 0 (0.0%) |
| 35 to 64 Years | 0 (0.0%) | 0 (0.0%) |
| 65 to 74 Years | 0 (0.0%) | 0 (0.0%) |
| 75 Years and over | 0 (0.0%) | 21 (95.5%) |
Disability Class: Self-Care Difficulty
| Age Bracket | Male | Female |
| 5 to 17 Years | 0 (0.0%) | 0 (0.0%) |
| 18 to 34 Years | 0 (0.0%) | 0 (0.0%) |
| 35 to 64 Years | 0 (0.0%) | 0 (0.0%) |
| 65 to 74 Years | 0 (0.0%) | 0 (0.0%) |
| 75 Years and over | 0 (0.0%) | 0 (0.0%) |
Technology Access in Epworth
Computing Device Access in Epworth
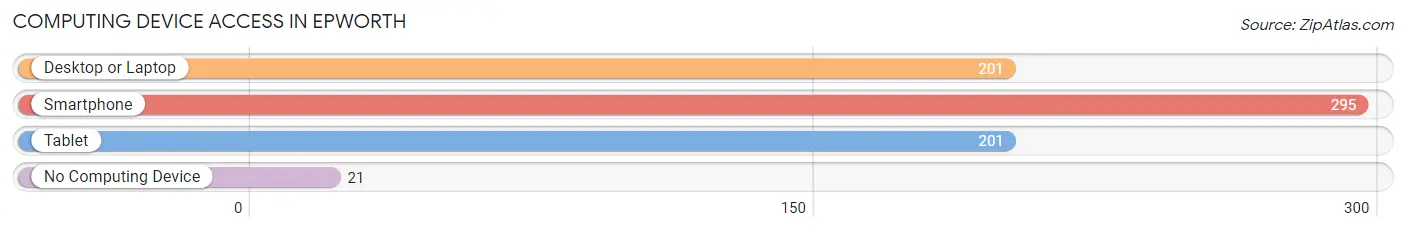
| Device Type | # Households | % Households |
| Desktop or Laptop | 201 | 63.4% |
| Smartphone | 295 | 93.1% |
| Tablet | 201 | 63.4% |
| No Computing Device | 21 | 6.6% |
| Total | 317 | 100.0% |
Internet Access in Epworth
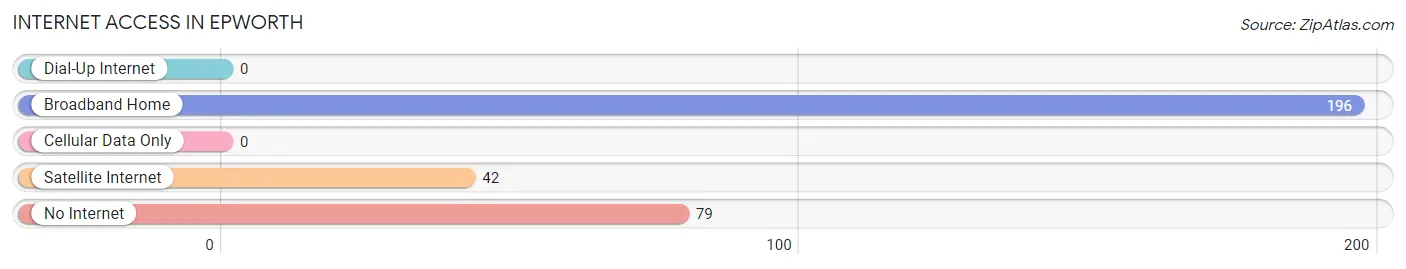
| Internet Type | # Households | % Households |
| Dial-Up Internet | 0 | 0.0% |
| Broadband Home | 196 | 61.8% |
| Cellular Data Only | 0 | 0.0% |
| Satellite Internet | 42 | 13.3% |
| No Internet | 79 | 24.9% |
| Total | 317 | 100.0% |
Epworth Summary
Epworth, Georgia is a small town located in the northwest corner of the state, just south of the Tennessee border. It is part of the Chattanooga, Tennessee-Georgia metropolitan area and is situated in the foothills of the Appalachian Mountains. The town was founded in 1887 and has a population of approximately 1,500 people.
Geography
Epworth is located in the northwest corner of Georgia, just south of the Tennessee border. It is part of the Chattanooga, Tennessee-Georgia metropolitan area and is situated in the foothills of the Appalachian Mountains. The town is located in the Lookout Valley, which is a narrow valley that runs along the Tennessee-Georgia border. The town is surrounded by the Lookout Mountain range, which is part of the Appalachian Mountains. The town is located at an elevation of 1,000 feet above sea level.
The town is located in the eastern time zone and is in the Central Standard Time zone. The town is located in the Eastern Daylight Time zone during the summer months. The town is located in the Eastern Standard Time zone during the winter months.
The town is located in the humid subtropical climate zone, which is characterized by hot, humid summers and mild winters. The average annual temperature is around 60 degrees Fahrenheit. The average annual precipitation is around 50 inches.
Economy
Epworth’s economy is largely based on agriculture and tourism. The town is home to several farms, which produce a variety of crops, including corn, soybeans, wheat, and hay. The town is also home to several small businesses, including restaurants, retail stores, and service providers.
The town is also home to several tourist attractions, including the Lookout Mountain Flight Park, which offers hang gliding and paragliding, and the Lookout Mountain Nature Center, which offers educational programs and nature trails. The town is also home to several historic sites, including the Lookout Mountain Battlefield, which was the site of a major Civil War battle.
Demographics
As of the 2010 census, the population of Epworth was 1,500 people. The racial makeup of the town was 97.3% White, 0.7% African American, 0.3% Native American, 0.3% Asian, 0.3% from other races, and 1.3% from two or more races. Hispanic or Latino of any race were 1.3% of the population.
The median household income in Epworth was $37,500, and the median family income was $45,000. The per capita income in Epworth was $18,000. About 11.3% of families and 14.3% of the population were below the poverty line, including 18.3% of those under age 18 and 8.3% of those age 65 or over.
Conclusion
Epworth, Georgia is a small town located in the northwest corner of the state, just south of the Tennessee border. It is part of the Chattanooga, Tennessee-Georgia metropolitan area and is situated in the foothills of the Appalachian Mountains. The town was founded in 1887 and has a population of approximately 1,500 people. The town’s economy is largely based on agriculture and tourism, and the town is home to several tourist attractions, including the Lookout Mountain Flight Park and the Lookout Mountain Nature Center. The town’s population is predominantly white, with a small percentage of African Americans, Native Americans, Asians, and people from other races. The median household income in Epworth is $37,500, and the median family income is $45,000.
Common Questions
What is Per Capita Income in Epworth?
Per Capita income in Epworth is $38,766.
What is the Median Family Income in Epworth?
Median Family Income in Epworth is $88,780.
What is the Median Household income in Epworth?
Median Household Income in Epworth is $69,329.
What is Inequality or Gini Index in Epworth?
Inequality or Gini Index in Epworth is 0.17.
What is the Total Population of Epworth?
Total Population of Epworth is 575.
What is the Total Male Population of Epworth?
Total Male Population of Epworth is 336.
What is the Total Female Population of Epworth?
Total Female Population of Epworth is 239.
What is the Ratio of Males per 100 Females in Epworth?
There are 140.59 Males per 100 Females in Epworth.
What is the Ratio of Females per 100 Males in Epworth?
There are 71.13 Females per 100 Males in Epworth.
What is the Median Population Age in Epworth?
Median Population Age in Epworth is 27.6 Years.
What is the Average Family Size in Epworth
Average Family Size in Epworth is 3.4 People.
What is the Average Household Size in Epworth
Average Household Size in Epworth is 1.8 People.
How Large is the Labor Force in Epworth?
There are 374 People in the Labor Forcein in Epworth.
What is the Percentage of People in the Labor Force in Epworth?
79.7% of People are in the Labor Force in Epworth.